
the Creative Commons Attribution 4.0 License.
the Creative Commons Attribution 4.0 License.
 | 28 Oct 2026
Mobility of dry granular flows over contrasting erodible bed materials in laboratory experiments
Katharina Wetterauer

Sebastian Müller
Michael Krautblatter
Shiva P. Pudasaini
Ivo Baselt
Erosion and entrainment exchange mass and momentum across the flow–bed interface and can strongly modify mass-flow mobility. However, the material properties that control whether erosive flows accelerate, decelerate, or maintain their mobility remain insufficiently understood. Here, we conducted dry granular flow experiments to investigate erosion, flow evolution, and deposition across systematically imposed flow–bed contrasts, using surface measurements of the evolving flow and final deposit. A quartz slide of constant solid particle density was released over beds with lower, equal, and higher solid particle densities and compared with a reference case without erosion. Each scenario was repeated using finer sand-sized particles and coarser sand-to-gravel-sized particles. The low-density beds produced deeper erosion, higher average flow-front velocities, and longer runout. By contrast, the equal- and high-density beds produced nearly identical results, with shallower erosion depths, lower average flow-front velocities, and more compact deposits, despite their substantially different solid particle densities. The same relative patterns were observed for both particle-size fractions, although coarse-particle flows generally formed longer and flatter deposits. This asymmetric response shows that mobility cannot be explained by solid particle density alone. Instead, the enhanced mobility over the low-density beds is more consistently explained by coupled effects of lower internal friction, rounded particle shape, greater bed deformation, and more efficient entrainment. The similar response of the equal- and high-density beds reflects their comparable and higher frictional resistance and angular particle shape, which appear to outweigh the contrast in solid particle density under the tested conditions. Yet, surface-based measurements alone cannot resolve whether more subtle differences persist in basal slip, shear localization, and the incorporation of mobilized bed material. Depth-resolved observations at the flow–bed interface are therefore needed to directly relate erosion and entrainment to mass and momentum exchange.
- Article
(9603 KB) - Full-text XML
-
Supplement
(34969 KB) - BibTeX
- EndNote


Gravity-driven mass movements in steep terrain, including dry granular flows, rock avalanches, and debris flows, shape mountain landscapes through erosion, entrainment, transport, and deposition. By entraining bed sediment, especially on metastable slopes (Mangeney et al., 2010; Mangeney, 2011; Aaron and McDougall, 2019), such flows can rapidly increase in volume and mobility (Hungr and Evans, 2004). Understanding flow–bed interactions is therefore essential for predicting mass-flow dynamics and hazards under changing climatic conditions and for reconstructing long-term landscape evolution (e.g., Rickenmann, 1999; Reid et al., 2011; Roelofs et al., 2023). Despite their importance, the physical mechanisms governing mobility in erosive flows remain incompletely understood (e.g., de Haas and Van Woerkom, 2016; Pudasaini and Fischer, 2020; Jiang et al., 2023). In general, entrainment alters mobility through mass and momentum transfer, changes in basal resistance, and bed weakening (e.g., Hungr et al., 2005; Mangeney et al., 2007b; Santi et al., 2008; Iverson et al., 2011). Yet, mobility responses are not uniform. Some erosive flows become more mobile as bed material is entrained, whereas others decelerate locally during erosion without necessarily exhibiting lower overall mobility (e.g., Hungr et al., 2005; Mangeney et al., 2007b; Farin et al., 2014; Zhang et al., 2026).
Erosion and entrainment are increasingly incorporated into mechanical mass-flow models. Their representation in depth-averaged models is mechanically challenging because mass exchange across the flow–bed interface requires a consistent treatment of momentum exchange. Early mass-change models and the subsequent debate showed that inconsistent treatment of entrained mass and its momentum can lead to rocket-equation-type effects and unrealistic flow acceleration (Cannon and Savage, 1988; Hungr, 1990; Erlichson, 1991; Iverson, 1997). Conversely, mass exchange does not necessarily cause acceleration or deceleration. For example, Gray (2001) derived steady solutions for surface avalanches with erosion and deposition at constant downslope velocity. Existing depth-averaged approaches represent erosion, entrainment, and deposition in different ways. Many models prescribe erosion through entrainment laws based on basal shear stress and account for flow-volume growth and associated changes in the momentum balance (e.g., Takahashi, 1991; McDougall and Hungr, 2005; Medina et al., 2008; Iverson, 2012; Takahashi, 2014; Frank et al., 2015; Iverson and Ouyang, 2015; Pudasaini and Fischer, 2020). Other formulations consider slope-normal or tangential momentum jumps and frontal ploughing (Issler, 2014, 2020). Alternatively, hysteretic basal friction laws, such as that of Pouliquen and Forterre (2002), have been incorporated into depth-averaged avalanche models. These models describe erosion and deposition through transitions between static and flowing states without explicit basal erosion–deposition source terms. Material is locally assumed to be either moving or static through its entire depth (Mangeney et al., 2007a; Edwards and Gray, 2015; Edwards et al., 2017; Rocha et al., 2019; Russell et al., 2019). This approach has been used to model erosion–deposition waves, self-channelization and levee formation, and retrogressive failures. By contrast, non-depth-averaged continuum models resolve internal deformation and velocity fields using constitutive rheologies. Erosion and entrainment can therefore emerge from the evolving stress and deformation fields rather than from separate closure assumptions for entrainment fluxes and boundary stresses (e.g., Crosta et al., 2009). Such approaches have been applied to granular flows in rotating drums, heaps, and granular collapse (Barker et al., 2021; Maguire et al., 2024; Blatny et al., 2024; Lloyd et al., 2025). Related material-point simulations using an elastoplastic constitutive model have reproduced erosion–deposition waves and their transitions in snow avalanches (Li et al., 2024). However, these approaches require rheological descriptions that capture the transition between flowing and apparently static material. Experiments show that slow creep may persist beneath the rapidly flowing surface layer, with velocity decreasing approximately exponentially with depth (Komatsu et al., 2001). A sharp flow–bed interface, and consequently an unambiguous definition of flow thickness, may therefore be difficult to establish. Fully three-dimensional depth-resolved simulations have become increasingly feasible at slope scale (Cicoira et al., 2022; Kyburz et al., 2025; Zhu et al., 2025). Across these modeling approaches, there is a growing need for controlled experimental datasets against which predictions of erosion, entrainment, and mobility can be evaluated (Iverson et al., 2011; de Haas et al., 2020).
Controlled flume experiments have identified both flow-related and bed-related controls on erosion and entrainment. Dry granular flow experiments using broadly similar flow and bed materials show that erodible layers can either enhance or reduce mobility depending on boundary conditions (Crosta et al., 2009; Mangeney et al., 2010). More specifically, erosion–deposition waves can propagate over static erodible layers through continuous exchange of material between the flow and the bed (Edwards and Gray, 2015; Rocha et al., 2019). For discrete releases, the resulting avalanche may grow, propagate steadily, or decay depending on slope inclination, erodible-layer thickness, and released volume (Edwards et al., 2017; Kokelaar et al., 2017; Viroulet et al., 2019). Colour-tracer experiments further show that steady propagation can occur through balanced erosion and deposition, while the initially released material is progressively replaced by material entrained from the bed (Edwards et al., 2021). Other experiments demonstrate retrogressive failures propagating upslope through static granular layers (Russell et al., 2019). At higher continuous mass fluxes, granular flows can self-channelize through the formation of static lateral levees, which restrict lateral spreading and can enhance runout (Mangeney et al., 2007a; Kokelaar et al., 2014; Rocha et al., 2019). Related erosion–deposition wave dynamics have recently also been observed in natural debris flows (Aaron et al., 2025; Wetter et al., 2026). Beyond these distinct erosion–deposition regimes, experiments have identified several flow-related controls on erosion and mobility. Greater released mass intensifies bed erosion and entrainment (Lu et al., 2016) and enlarges the eroded zone, with associated increases in mobility and runout (Liu et al., 2023). Two-phase debris-flow experiments further indicate that water- or gravel-rich flows are more erosive than clay-rich flows (de Haas and Van Woerkom, 2016; Roelofs et al., 2022). In these experiments, erosion has been related to both basal shear stress (de Haas and Van Woerkom, 2016) and collisional stresses (de Haas et al., 2022; Zheng et al., 2025). Increasing the water content of the moving material may additionally increase entrainment volumes and produce flatter, wider, and longer deposits (Pandey and Satyam, 2025). Among the investigated bed-related controls, erosion rates decrease with increasing bed grain size (Egashira et al., 2001; Papa et al., 2004). Increasing bed water content, by contrast, facilitates entrainment through elevated pore-water pressures and reduced internal friction, as observed in both small-scale (Roelofs et al., 2023) and large-scale experiments (Reid et al., 2011; Iverson et al., 2011). Field observations support the experimentally observed role of bed saturation. High bed pore-water pressures coincide with phases of sediment entrainment (Berger et al., 2011), and flows over saturated beds grow faster and attain larger volumes than those over drier beds (McCoy et al., 2012). Besides, recent experiments further indicate that dry granular flow–bed interactions may also vary spatially along the erodible bed (Zhang et al., 2026). Whereas impact-induced ploughing and compression dominate the proximal bed, shear-dominated entrainment prevails farther downslope. These findings imply that erosion may either dissipate flow momentum or enhance mobility, depending on the efficiency of bed entrainment.
Among the experimentally investigated flow and bed properties, the role of contrasts in solid particle density between the moving flow and the erodible bed remains poorly constrained. Such contrasts may arise from lithological differences and can be particularly pronounced during interactions between rock-rich masses and snow or glacier ice (Mergili et al., 2020; Feng et al., 2023; Munch et al., 2024; Yang et al., 2026; Peng et al., 2025). In many natural settings, however, contrasts in solid particle density may be modest. They also commonly coincide with differences in particle-size distribution, particle shape, porosity, packing, water or ice content, bed strength, and frictional resistance. This covariance makes the isolated mechanical contribution of solid particle density difficult to determine. Still, solid particle density is mechanically relevant because it determines bulk density together with porosity or solid volume fraction. Bulk density, in turn, governs mass and momentum balances, normal and shear stresses, and flow–bed momentum exchange in mechanical models (e.g., Takahashi, 1991; Iverson, 2012; Takahashi, 2014; Iverson and Ouyang, 2015). Previous flume experiments show that bed bulk density can influence erosion and mobility when altered through compaction and porosity (Farin et al., 2014). Yet, these experiments did not isolate the contribution of solid particle density itself. The theoretical mobility model of Pudasaini and Krautblatter (2021) considered flow–bed density contrasts as a potential control and provided the theoretical motivation for the present experimental design. The momentum formulation underlying the proposed density-dependent mobility response was subsequently criticized by Issler et al. (2024) with respect to momentum and energy conservation. The present study does not aim to resolve this theoretical debate but experimentally examines how contrasting bed materials affect erosion, entrainment, and mobility, with particular attention to the role of solid particle density alongside other material properties.
Against this background, our central experimental question is whether systematically imposed flow–bed contrasts in solid particle density are associated with measurable differences in erosion, entrainment, flow evolution, and mobility. To address this question, we designed a series of dry granular flow experiments in which a constant quartz slide was released over erodible beds with lower, equal, and higher solid particle density relative to the slide. These three erosive scenarios were compared to a non-erosive reference scenario with rigid bed and investigated for both finer (sand-sized) and coarser (sand-to-gravel-sized) particles. Within each particle-size fraction, particle-size distributions were kept comparable across scenarios to minimize accompanying variations in porosity. Although solid-particle-density contrast was the primary design variable, accompanying sediment properties such as particle shape and frictional resistance could not be controlled fully independently in all cases. We therefore treat the experiments as systematically imposed density-contrast scenarios rather than as an isolation of solid particle density, and explicitly consider accompanying material properties in their interpretation. By combining high-resolution measurements of flow surface and deposit topography with qualitative analyses of the internal deposit structure, we assess differences in erosion, average flow-front velocity, deposit morphology, and internal sorting among the contrasting bed materials. These experiments provide benchmark data for testing whether numerical models can reproduce material-dependent erosion, mobility, and deposition of dry granular flows.
2.1 Targeted density contrast scenarios and materials
The experiments were designed as systematically imposed density-contrast scenarios between a dry granular slide and a dry granular erodible bed. Unconsolidated quartz grains were used as the released slide material in all experiments, whereas the erosive bed material had systematically lower, equal, or higher solid particle density. Particle-size distribution, initial bed geometry, and packing were kept comparable across experiments to minimize systematic differences in porosity. Consequently, differences in dry bulk density primarily reflect differences in solid particle density rather than intentionally varied bed structure. The experiments were performed at a consistent laboratory scale and were not intended as dynamically scaled reproductions of natural flows. Accordingly, the imposed solid-particle-density contrasts were deliberately larger than those typically expected in natural torrent or hillslope materials in order to produce measurable differences in flow response.
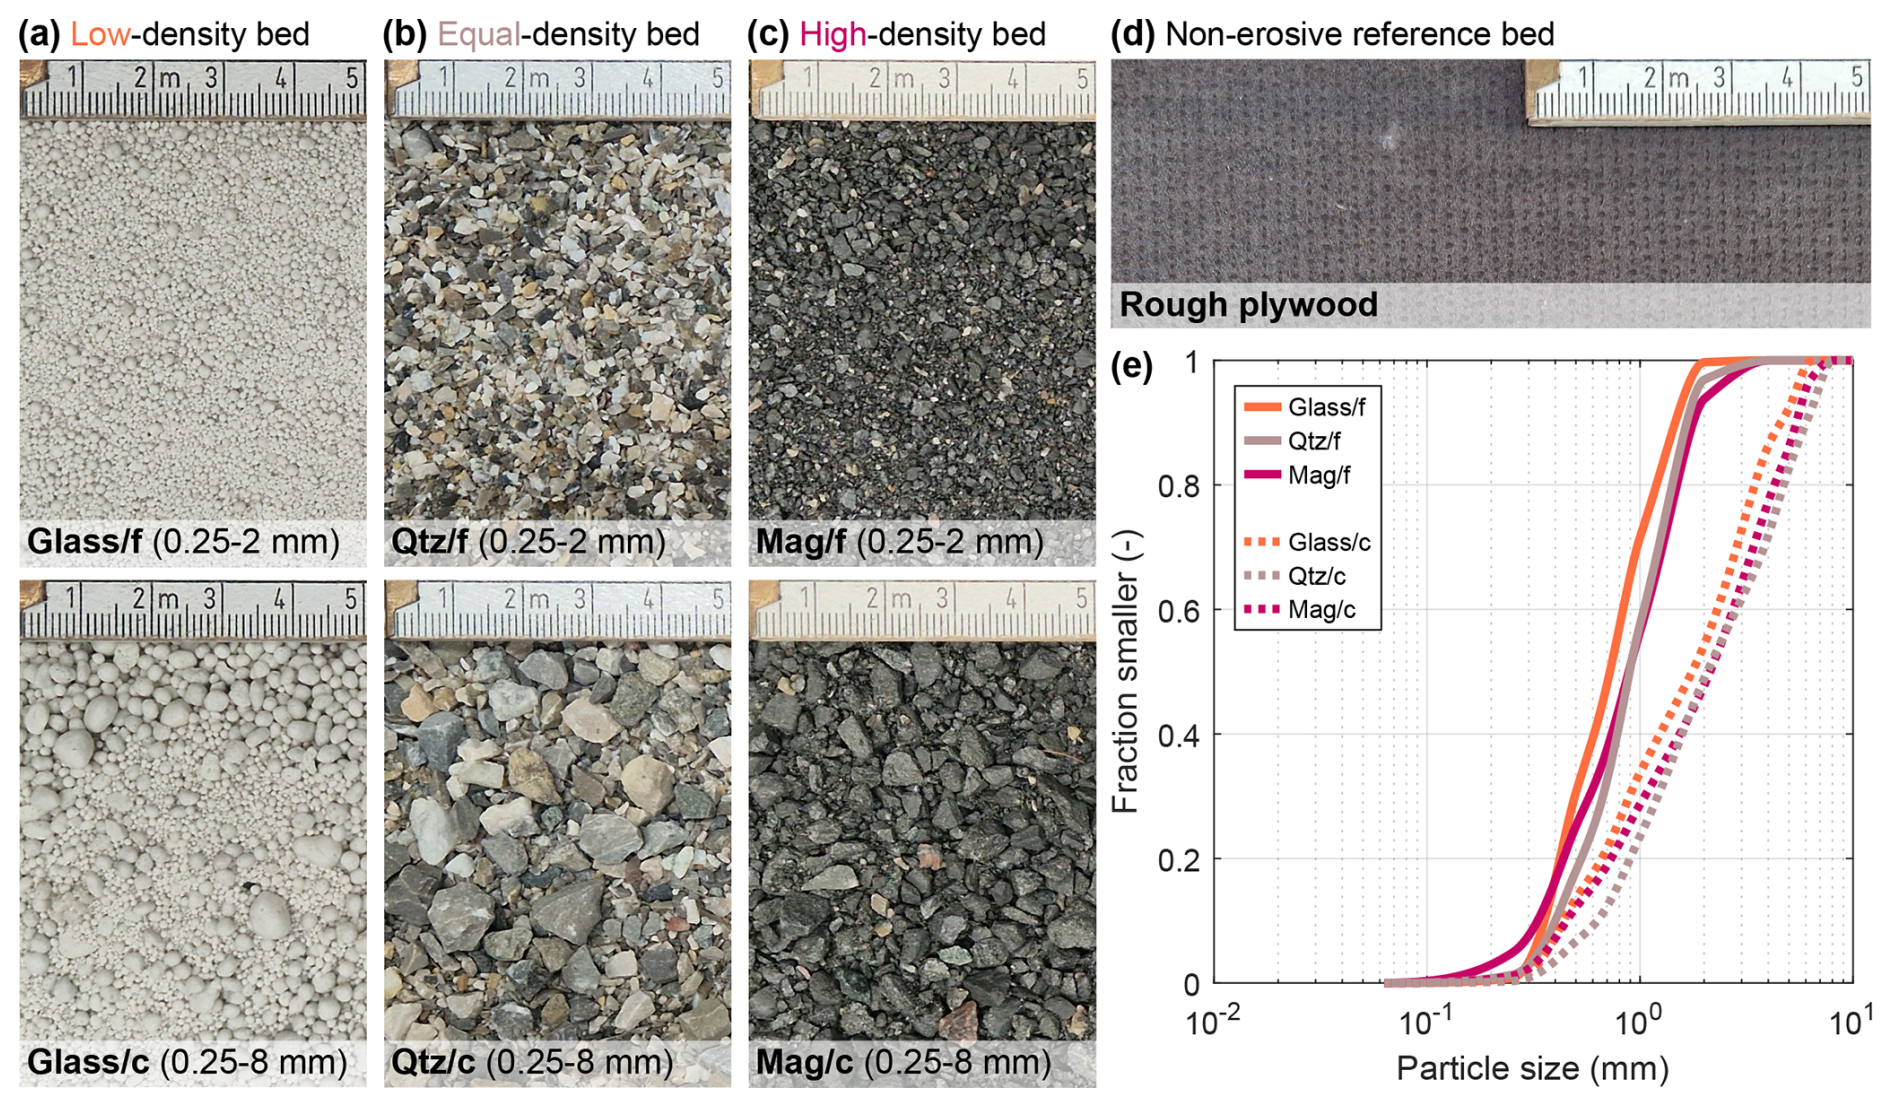
Figure 1Materials used to establish the systematically imposed solid-particle-density contrast scenarios in the dry granular flow experiments. (a–c) Erodible bed materials with (a) expanded glass (Glass) for the low-density scenario, (b) quartz (Qtz) for the equal-density scenario, and (c) magnetite (Mag) for the high-density scenario. (d) Rough plywood used as rigid bed for a non-erosive reference. (e) Cumulative particle-size distributions. Note that Qtz/f and Qtz/c shown in (b) were also used as initial sliding material in the corresponding fine- or coarse-particle experiments. /f: fine particles; /c: coarse particles.
Four slide–bed configurations, hereafter referred to as scenarios, were tested: (i) a low-density scenario, where a quartz slide overrode a bed made of expanded glass with a lower solid particle density (ρGlass ≈ 400–600 kg m−3; Fig. 1a); (ii) an equal-density scenario, where both slide and bed consisted of quartz with equal solid particle density (ρQtz = 2700 kg m−3; Fig. 1b); (iii) a high-density scenario, where a quartz slide overrode a bed made of magnetite with a higher solid particle density (ρMag = 4800 kg m−3; Fig. 1c); and (iv) a non-erosive reference scenario, where the quartz slide moved over a rigid, rough plywood plate (phenolic-resin-coated plywood with a rough, slip-resistant screen-printed surface, equivalent sand roughness ks ≈ 0.27 mm; Fig. 1d). In the three erosive scenarios (i–iii), quartz thus served as solid-particle-density reference relative to the erodible bed material (Table 1). Its initially released mass was identical in all experiments and consisted of 130 kg dry quartz (Fig. 1b).
Table 1Characteristics of the materials used to simulate the different density contrast scenarios. /f: fine particles; /c: coarse particles.
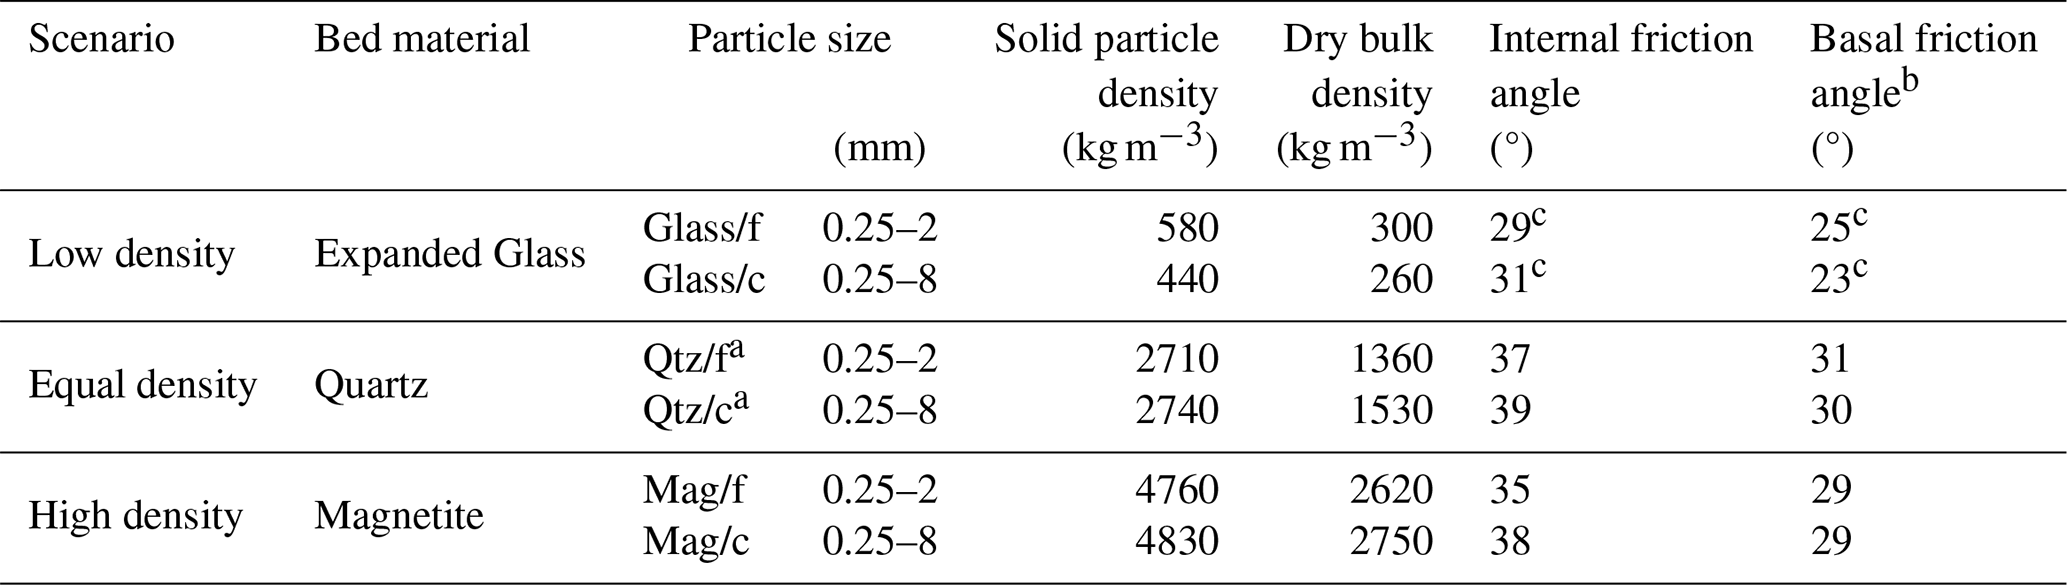
a Qtz/f and Qtz/c were also used as initial sliding material in the corresponding fine- or coarse-particle experiments.
b Angle with respect to the rough plywood plates used as rigid bed surface in the flume setup.
c Due to the low friction angles, Glass was mixed with 4 %–5 % water by mass to prevent self-induced failure on the 37° inclined flume.
Each of the four scenarios was conducted in two experimental series differing in particle size (Fig. 1). In a fine series (“/f”), both the initially released slide and the erodible bed consisted of a finer 0.25–2 mm fraction, comprising 100 % sand-sized particles. In a coarse series (“/c”), slide and bed consisted of a coarser 0.25–8 mm fraction, comprising 50 % sand-sized and 50 % gravel-sized particles. To ensure comparable particle-size distributions, quartz, glass, and magnetite were each sieved into the corresponding fine- and coarse-particle fractions (Fig. 1e).
From here on, we refer to the materials as “Glass”, “Qtz”, and “Mag”. In the fine series, “Glass/f”, “Qtz/f”, “Mag/f” denote the erosive scenarios and “reference” the non-erosive scenario. In the coarse series, the corresponding experiments are denoted as “Glass/c”, “Qtz/c”, “Mag/c”, and “reference”. Moreover, we use the term “slide” to refer specifically to the initially released Qtz–slide before its interaction with the erodible bed or to distinguish the overrunning from the erodible material.
The selection of materials was based on two main considerations. The materials had to show particle characteristics relevant to natural dry granular flows, and the slide–bed mixtures had to be efficiently separable after the experiments to enable complete material reuse. Qtz and Mag were chosen as natural sediments with angular particles and significantly contrasting solid particle densities. Their similar particle shape and frictional properties made them suitable for comparing equal- and high-density scenarios while minimizing differences in other particle characteristics (Table 1, Fig. 1b, c). In addition, the deposited mixtures of Qtz and the ferromagnetic Mag could be efficiently separated magnetically after each experiment. The Glass (PORAVER®), in contrast, is an artificial material composed of nearly spherical particles (Table 1, Fig. 1a). It was selected because no natural sediment with a distinctly lower solid particle density relative to Qtz was available that could be efficiently separated for reuse. The buoyancy of the light Glass enabled complete separation of Qtz–Glass mixtures by their density contrast in a water bath. Accordingly, the low-density scenario provides the intended solid-particle-density contrast relative to the equal-density scenario. However, the two scenarios also differ in particle shape and frictional properties. These material properties are quantified in Table 1 and are explicitly considered in the interpretation of the experimental results.
2.2 Experimental flume
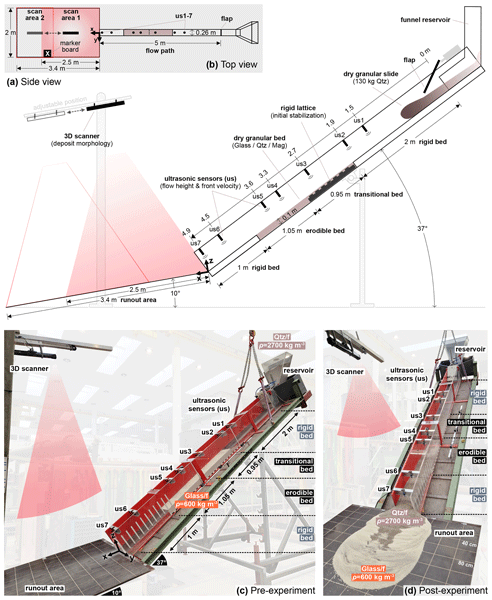
Dry granular flow experiments were conducted at the Hydraulic Laboratory of the University of the Bundeswehr Munich, Germany, in a newly designed experimental flume (Fig. 2). This flume consisted of a 5 m long and 0.26 m wide straight channel with 0.5 m high vertical sidewalls, forming a rectangular cross-section. Upstream of the channel, a funnel-shaped reservoir stored the 130 kg initial sliding material. This mass corresponded to a calculated release volume of ∼ 96 L for the fine- and ∼ 85 L for the coarse-particle experiments. The reservoir was filled by releasing Qtz vertically from a bag into the reservoir avoiding pre-mixing to preserve natural variability and internal sorting. A flap operated by a pneumatic cylinder opened instantaneously, releasing the initial Qtz–slide into the channel. The 5 m long channel was divided into four distinct sections: (i) an upper rigid bed (2 m) made of rough plywood, to allow the slide to develop and accelerate; (ii) a transitional bed (∼ 1 m) containing a rigid lattice shaped like a LEGO® brick, which was overfilled with erodible bed material to gradually adapt the slide to the erodible bed and prevent immediate scouring at its upstream edge (e.g., de Haas and Van Woerkom, 2016); (iii) an erodible bed (∼ 1 m) with a thickness of 0.1 m; and (iv) a lower rigid bed (1 m) made of rough plywood, to avoid extensive head erosion and sudden failure of the erodible bed section. Downstream of the channel, the slide–bed mixture entered a 3.4 m long and 2 m wide runout area. This area was inclined by 10° to facilitate material outflow and reduce in-channel deposition caused by the abrupt slope break and associated reduction in flow momentum. Except for the channel beds, all flume elements in contact with the flow were made of smooth materials with similarly low roughness to minimize frictional resistance. Acrylic glass (ks ≤ 0.01 mm) was used for the reservoir and transparent front sidewall, PVC (ks ≤ 0.01 mm) for the back sidewall, and smooth plywood (smooth phenolic-resin film surface, ks ≈ 0.04 mm) for the runout area. In contrast, the rigid bed sections were made of phenolic-resin-coated plywood with a rough, slip-resistant screen-printed surface (ks ≈ 0.27 mm; Fig. 1d). Surface roughness was measured using a Keyence VK-X3000 3D laser scanning microscope based on focus variation (< 3 µm accuracy). The peak-to-valley roughness Rz was determined along a circle on the respective surface and is reported here because it closely approximates the equivalent sand roughness ks (Adams et al., 2012).

Figure 2Experimental flume setup. (a) Side- and (b) top-view schematic. (c) Flume with planar erodible bed and filled reservoir before the experiment. (d) Deposit after the experiment. Flume sections and measurement positions are indicated. Photographs are from Exp5 (Glass/f).
A flume inclination of 37° was used for all dry granular flow experiments to ensure sufficiently high sliding velocities and erosive potential (e.g., de Haas and Van Woerkom, 2016; Lanzoni et al., 2017b). This inclination was required to mobilize the dry material solely by gravity and to prevent early deposition before or on the erodible bed. The chosen angle was close to the internal friction angle of the Qtz and Mag beds (Table 1), representing the steepest angle at which these beds remained stable without spontaneous failure. However, due to the comparatively low internal friction angle of Glass, the Glass beds were stabilized with 4–5 % water by mass and surficially compacted to increase particle cohesion (Table 1). The selected angle therefore represents a compromise between ensuring sufficient mobility and erosion, initially stable and reproducible bed conditions, and save flume operation. After each experiment, the flume was returned to a horizontal position for post-experimental measurements.
2.3 Instrumentation, measurements, and data processing
Flow height and average flow-front velocity were derived from seven ultrasonic sensors (WayCon UFP-400; 30–400 mm range, 60 ms sampling interval, ±1 mm accuracy) installed normal to the bed along the channel centerline (us1–us7; Fig. 2). The sensors were positioned in systematic intervals to capture both the temporal evolution of the flow at specific locations and its spatial development downslope. Most sensors were installed in pairs: us1–us2 at the end of the upper rigid bed, us3 above the transitional bed, us4–us5 above the erodible bed, and us6–us7 at the end of the lower rigid bed. Data recording was synchronized with the reservoir opening, as the sensor trigger was coupled to the flap-release mechanism. Postprocessing of the records was performed in MATLAB®v2023b. For each sensor, flow height was derived by subtracting the mean value of the first-second measurements (representing the initial bed level at flow height 0 cm) from every subsequent data point in the time series. The signals were then smoothed using a moving-average filter over 0.1 s intervals. At the rigid bed sections, the resulting flow height corresponds directly to the actual slide thickness, as the bed surface remained fixed at 0 cm. At the erodible bed, ongoing erosion lowered the bed surface. The records from us4–us5 therefore represent an apparent flow height that combines temporal variations in slide thickness and bed-level change. Flow-height values can thus even become negative when erosion becomes deeper than slide thickness. Flow-front arrival was defined as the moment when the flow height first exceeded a 1 mm threshold. Flow-tail passage was defined as the first time after flow-front arrival that the decreasing flow height crossed the mean height calculated over the last 1.5 s of the ultrasonic record, after the flow had completely passed the sensor. Average flow-front velocity was calculated from the traveled distance from reservoir flap to each sensor (Fig. 2a) divided by the corresponding flow-front arrival time. Cumulative average velocities were preferred over section-wise velocities between adjacent sensors. Over the short inter-sensor distances, small uncertainties in detecting flow-front arrival would strongly affect the calculated section-wise velocities, particularly when individual particles saltated ahead of the flow front.
We also derived an apparent mean erosion rate at sensor us4. It was calculated as the ratio between the final slope-normal erosion depth inferred from the flow-height record and the duration of flow passage at us4. We refer to this rate as “apparent” because it does not capture the temporal variability of the erosion process but represents an average over the entire flow duration at this single location. In reality, however, the flow tail likely exerts insufficient shear stress to sustain erosion and instead promotes material deposition onto the erodible bed (e.g., de Haas et al., 2015). This leads to an underestimation of the final erosion depth that reflects the bed surface after complete flow-tail passage.
Deposit morphology was mapped using a 3D-surface scanner (MotionCam-3D L Blue LC3R; 2.5 × 2.1 m scan area, 2 MP resolution, < 1.25 mm accuracy) mounted above the runout area with perpendicular view to the 10°-inclined surface (Fig. 2). The scanner was positioned along the centerline, and x, y, z coordinates were referenced with a marker board fixed to one lateral rim of the scan area. For deposits extending beyond the scan area, the scanner was repositioned downstream by a guide rail system to capture the whole runout area. A second scan overlapping the first at the marker board position was acquired and merged with the first by exact alignment at the marker board, establishing a shared coordinate system (Fig. 2a, b). Scans were performed with the flume in a horizontal position to prevent signal reflection from the channel outlet, which protruded into the scan cone when the flume was inclined (Fig. 2a). Therefore, the morphologies presented below represent only material deposited on the runout area but do not account for in-channel deposition. Postprocessing of the obtained 3D point clouds was carried out in MATLAB®v2023b. Deposits were first isolated by subtracting a reference scan of the planar, empty runout area. Only the coherent deposit bodies were retained and disconnected particles were excluded, using a cluster analysis based on a minimum Euclidean distance of 5 mm. Finally, the remaining point clouds were converted into 3D-volume models using triangulation-based natural neighbor interpolation with a grid resolution of 3 mm. From the 3D-volume models, geometric and volumetric parameters of the mixed slide–bed deposits on the runout area were determined, including the deposit's length (L), width (W), maximum height, extent ratio (), covered area, volume, center of volume, as well as the travel angle, which is defined here as the inclination between the deposit's center of volume and the lower edge of the reservoir outlet (Fig. 2a). Note that the center of volume should not be interpreted as the center of mass, since the mixed slide–bed deposits can contain materials of varying densities.
The internal structure of the Qtz–Glass and Qtz–Mag deposits on the runout area was examined qualitatively by slicing the deposits laterally into regular cross sections. Each profile was created by inserting a 2 mm thin glass plate vertically into the deposit and capturing the exposed section with a camera, after the material in front of the glass plate had been removed. This qualitative approach was not applied to Qtz–Qtz deposits, as the Qtz bed was not colored to preserve its natural surface properties and ensure identical conditions and material reusability, making particles from slide and bed indistinguishable.
2.4 Experimental reproducibility
To evaluate reproducibility, a total of 24 dry granular flow experiments (Exp1–Exp24) were performed, 12 for each particle-size fraction. Both fine- and coarse-particle experiments comprised all four scenarios (low density, equal density, high density, or reference), with every scenario repeated three times. To maintain consistent conditions, all experiments followed the same sequence of preparation and operation steps. The full set of dry granular flow experiments is summarized in Table 2 and frontal photographs of all experiments are provided in Figs. S1 and S2 in the Supplement.
Table 2Conducted dry granular flow experiments as well as measures of the respective deposit on the runout area.
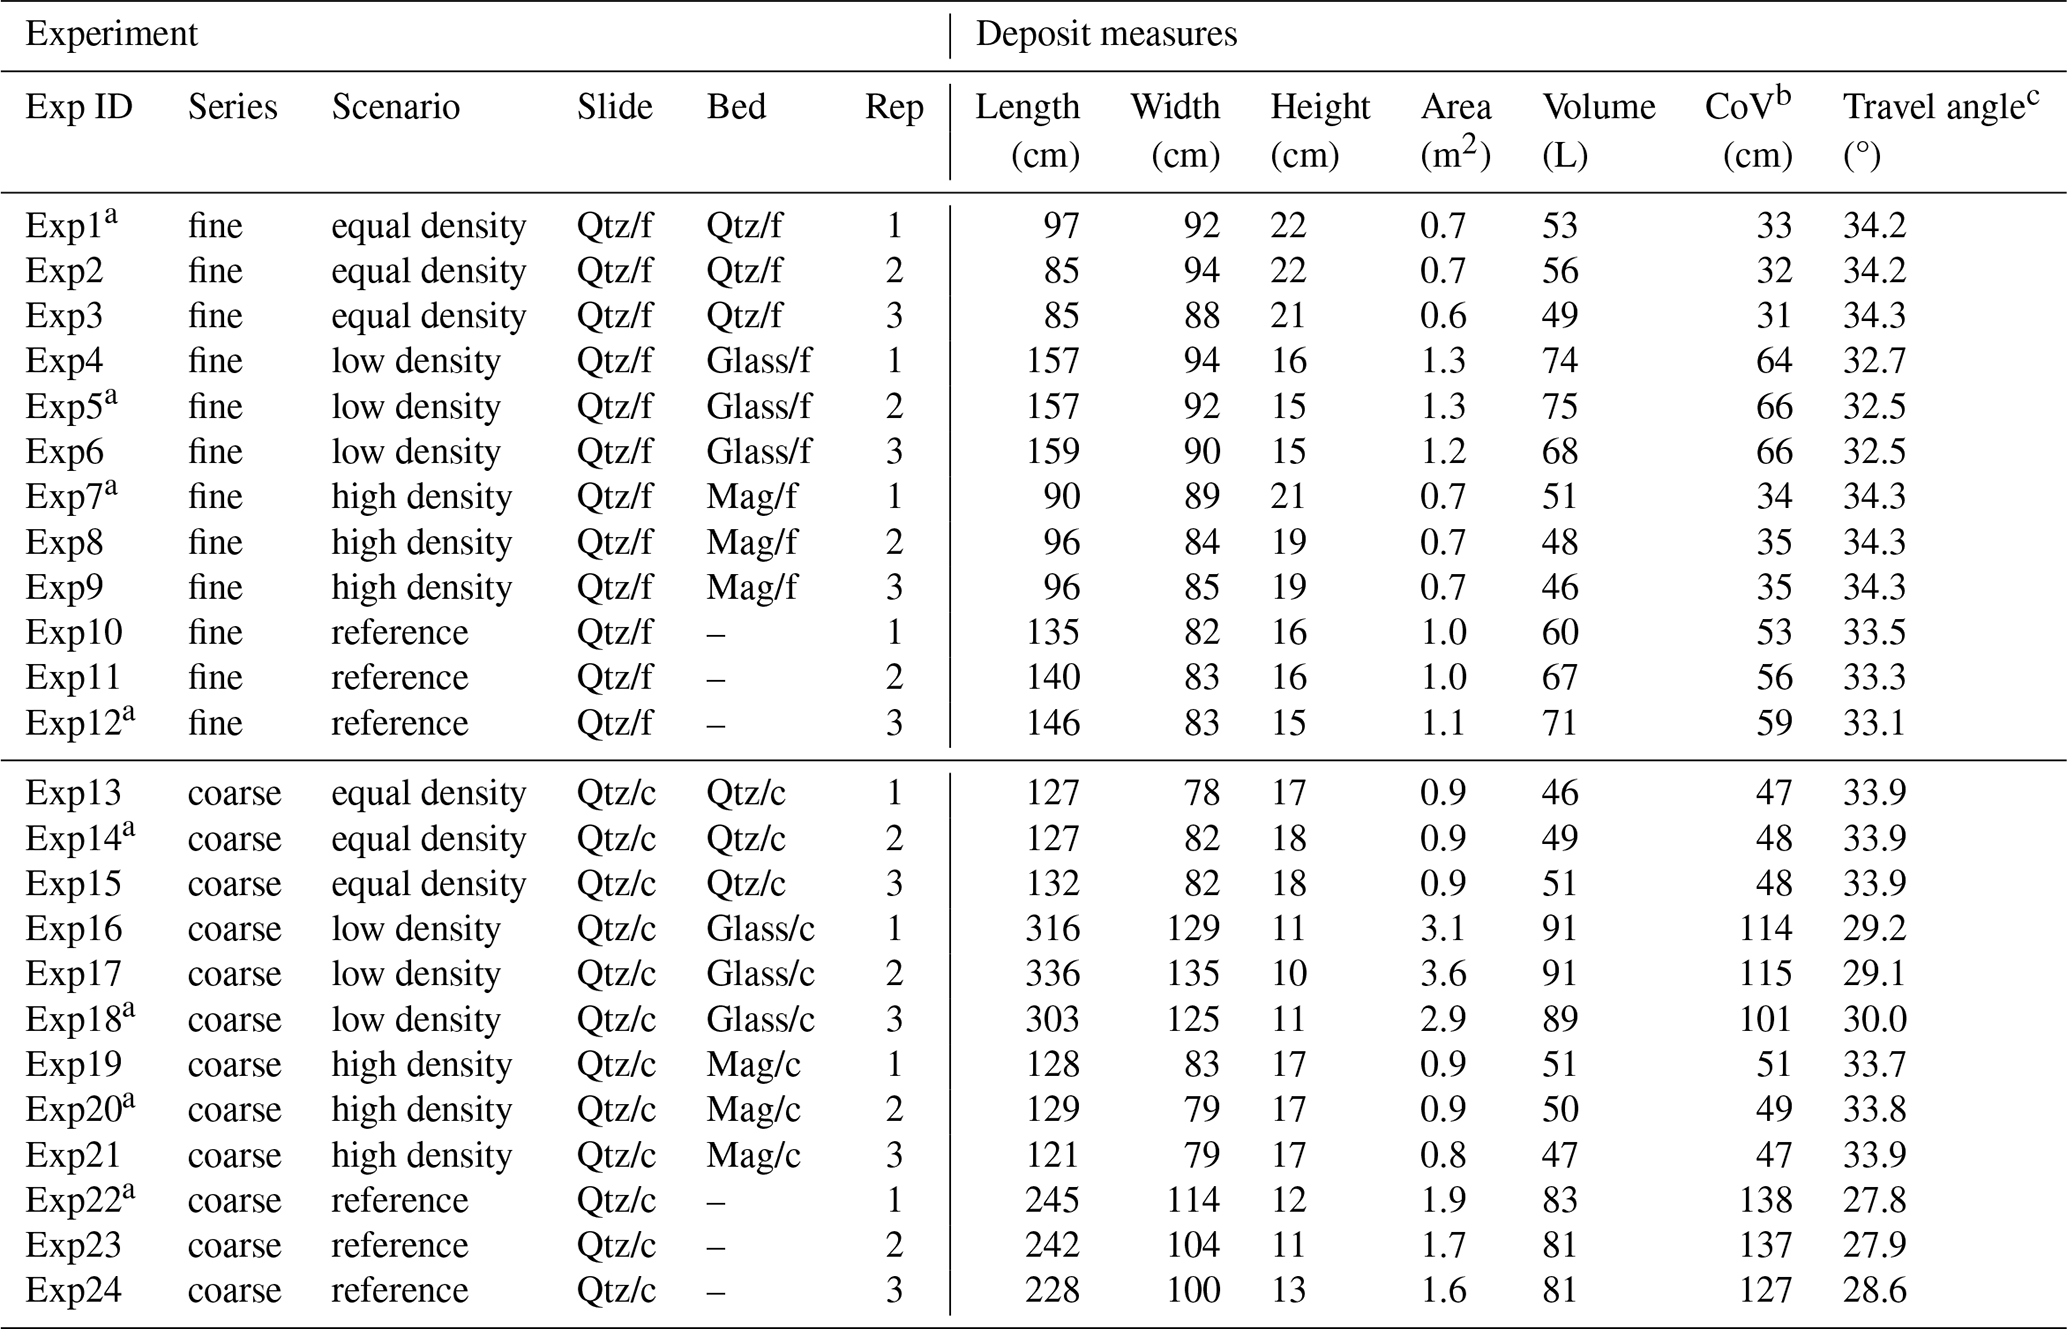
a Runs selected for detailed presentation and illustration in this study (see Sect. 2.4).
b Center of volume as longitudinal (downslope) distance.
c Inclination between the deposit’s center of volume and the lower edge of the reservoir outlet.
From the three repetitions per scenario, one representative run was selected for detailed presentation and illustration: fine-particle experiments – Glass/f (Exp5), Qtz/f (Exp1), Mag/f (Exp7), reference (Exp12); coarse-particle experiments – Glass/c (Exp18), Qtz/c (Exp14), Mag/c (Exp20), reference (Exp22). The selection is based on the best overall agreement in flow-front arrival time and early-stage flow-height evolution across the four scenarios recorded at sensor us2 (see Sect. 3.1.1). This sensor served as a control for consistent initial flow behavior, as the flow at this location consisted solely of the released Qtz–slide, which was identical in all runs within a particle-size fraction. Unless stated otherwise, the data presented hereafter refer to these representative runs.
The results are presented in two parts. The first part describes the spatiotemporal evolution of the dry granular flows in the channel, including flow height, bed erosion, and average flow-front velocity. The second part analyses the resulting deposits on the runout area, including deposit morphology, and the internal structure of selected mixed slide–bed deposits. Within each subsection, the observations are followed by a brief mechanistic interpretation of the key findings. The discussion then integrates these individual mechanistic interpretations into a broader process-based framework.
3.1 Spatiotemporal flow evolution and bed erosion
The flow-height hydrographs from the ultrasonic sensors illustrate the spatiotemporal evolution of the dry granular flows along the channel (Fig. 3). We present below the data from us2, us4, and us6, which capture the key stages of flow progression: pre, during, and post erosion. The remaining sensors recorded equivalent trends and are shown in Figs. S3 and S4, along with the repeated experiments that demonstrate high reproducibility of the flow-height signals.

Figure 3Spatiotemporal flow evolution of (a) fine- and (b) coarse-particle experiments. From top to bottom: evolution of flow height over time at us2 (before the erodible bed), us4 (on the erodible bed), and us6 (before the runout area), as well as average flow-front velocity from reservoir flap to sensor over downslope distance, and over time. Representative runs are shown (see Sect. 2.4). Note that in panel (b), no data point is shown at us3 for the Glass/c experiment in the two lower panels due to a brief ultrasonic signal loss during flow-front passage. /f: fine particles; /c: coarse particles; us: ultrasonic sensor.
3.1.1 Flow heights upstream the erodible bed
Before reaching the erodible bed (us2 in Fig. 3), flow heights show a nearly identical temporal evolution across all scenarios. The early Qtz–slides are characterized by a rapid rise and a more gradual subsequent decay in flow height with well-defined and consistent flow-front arrival and flow-tail passage. The fine-particle flow fronts reach us2 about 1.3 s after slide release and the slides pass within 5 s. They thicken up to 5 cm, with peak height occurring near the flow head. The coarse-particle flow fronts arrive at the same time but the slides pass within 4 s. Peak heights remain thinner at 3.5 cm and the association between peak height and flow front is less distinct.
The close agreement among all scenarios within each particle-size fraction at us2 thus confirms comparable initial flow conditions at the entrance to the erodible bed. Differences observed farther downslope can therefore be attributed primarily to subsequent flow–bed interactions rather than to systematic differences in release time or upstream flow conditions.
3.1.2 Flow heights on the erodible bed and local bed erosion
At the erodible bed (us4 in Fig. 3), flow fronts still arrive almost simultaneously across all scenarios, but subsequent flow evolution differs markedly. In the non-erosive reference scenarios, flow evolution at us4 resembles that observed at us2 but with a flatter and more elongated passage. The fine-particle flow passes within 5.0 s at a maximum thickness of 4 cm, while the coarse-particle flow passes within 4.5 s and reaches a peak height of 3 cm. In the erosive scenarios, by contrast, flow fronts steepen immediately upon arrival, and the duration of flow passage increases compared to us2. Fine-particle flows pass the sensor in about 7 s, whereas coarse-particle flows pass within 6 s and develop slightly steeper fronts.
The non-erosive reference scenarios provide the baseline for interpreting the changes observed in the erosive scenarios at us4. Their evolution is consistent with continuous acceleration downslope and longitudinal stretching of the slide over the rigid bed. Over the erodible beds instead, the steeper flow fronts and longer passage durations are consistent with an abrupt increase in basal resistance and with momentum transfer from the moving slide to the initially resting bed. The resulting reduction in average flow-front velocity may cause following material to accumulate behind the flow front and produce local flow-front steepening and thickening. Ongoing entrainment of bed material further prolongs the passage of the mixed flow. The slightly longer passage of the fine-particle flows suggests higher dispersive stresses in a more compact flow body, whereas the coarse-particle flows appear to move in a lower dispersed state with a sharper, faster passing front.
After flow-front passage, the flow heights reveal different erosion behavior among the erosive scenarios at us4. In the Glass experiments, flow-height evolution follows a stepwise pattern. A steep flow front coincides with peak flow height, followed by an abrupt first decline around 2 s after slide release, during which the flow surface drops below the original bed level. A second, more pronounced decline occurs toward the end of the event, around 6.5 s after slide release. After flow passage, the entire 10 cm thick bed is eroded. In the fine-particle experiment (Glass/f), the successive drops reach −2.5 and −8.7 cm below the original bed surface, corresponding to an apparent mean erosion rate of about 1.2 cm s−1. In the coarse-particle experiment (Glass/c), the two successive drops reach about −1.0 and −8.9 cm, corresponding to an apparent mean erosion rate of about 1.5 cm s−1. In the Qtz and Mag experiments, flow heights evolve more gradually and remain nearly identical for both materials. The flows thicken initially toward peak flow and then decrease continuously, falling only slightly below the original bed level. In the fine-particle experiments (Qtz/f and Mag/f), flow heights reach an early peak before declining to final erosion depths of approximately −2.9 and −3.1 cm, corresponding to apparent mean erosion rates of 0.4 and 0.5 cm s−1, respectively. In the coarse-particle experiments (Qtz/c and Mag/c), peak height occurs earlier and the subsequent decline begins sooner. Final erosion depths are slightly larger with about −3.6 and −3.7 cm, corresponding to apparent mean erosion rates of 0.6 cm s−1.
The contrasting erosion patterns reflect fundamentally different flow–bed interactions at us4. In the Glass experiments, the initial drop in flow height suggests rapid erosion of the upper Glass bed. For a given eroded bed volume, the lower solid particle density of Glass implies less mass to be accelerated than for a denser bed, potentially reducing the associated momentum transfer from the moving flow. In addition, the rounded particle shape reduces grain interlocking and internal frictional resistance, providing only limited resistance against the erosive shear exerted by the denser Qtz-slide. The stepwise lowering may reflect localized impact-induced ploughing (Zhang et al., 2026), although the underlying mechanism cannot be resolved from the present measurements. By contrast, the gradual and nearly identical lowering of the Qtz and Mag beds indicates higher resistance against erosion and entrainment. For a given eroded bed volume, the Qtz-slide has to transfer more momentum to accelerate the denser Qtz or Mag. This effect is likely reinforced by their angular particle shape, which promotes grain interlocking and internal frictional resistance. Yet, the close agreement between the lighter Qtz and heavier Mag indicates that the higher solid particle density of Mag did not produce a distinct erosion signal at us4.
3.1.3 Flow heights downstream the erodible bed
After erosion and before depositing on the runout area (us6 in Fig. 3), the timing of flow-front arrival differs among the four scenarios by a few tenths of a second. The non-erosive reference flows arrive first at, followed by Glass, while Qtz and Mag reach us6 last and simultaneously. The fine-particle flows arrive a few milliseconds later than the coarse-particle flows.
The morphologic changes that developed on the erodible bed were thus propagated downstream and are reflected in the flow-front arrival times at us6 and before the runout area. In the erosive scenarios, flow heights show a distinct late rise that is absent in the non-erosive reference scenarios. This late rise results from the flow backing up into the channel instead of being fully released onto the runout area, leading to in-channel deposition. This backlog obscures the timing of the flow tail and is more pronounced for fine-particle flows, which develop an earlier and stronger material accumulation than coarse-particle flows.
3.1.4 Average flow-front velocities
Average flow-front velocities from reservoir flap to each sensor overall increase downslope in both fine- and coarse-particle experiments (Fig. 3). As expected for gravity-driven acceleration from rest, velocities increase steeply along the upper rigid bed, reaching about 1.5 m s−1 at us2. On the erodible bed at us4, velocity trends begin to diverge among the four scenarios. In the non-erosive reference scenarios, flow fronts continue to accelerate nearly constantly, reaching the highest final velocities of about 2.4 m s−1 in the fine- and 2.6 m s−1 in the coarse-particle flows. In the erosive scenarios, acceleration begins to decrease once the Qtz–slides encounter the erodible bed. In the Glass experiments, flow fronts continue to accelerate along the erodible bed, although with a slightly reduced gradient. Both fine- and coarse-particle flows reach about 2.2 m s−1 at us7, shortly before deposition. In the Qtz and Mag experiments, the flows no longer accelerate once encountering the erodible bed and the velocities of both fine- and coarse-particle flows remain nearly constantly at 2.0 m s−1 until reaching the runout area.
The evolution of average flow-front velocities is consistent with the erosion behavior observed in the flow-height records at us4 (see Sect. 3.1.2). The continued, although reduced, acceleration over the Glass beds is the minor consequence of enhanced erosion and basal friction. By contrast, the velocity plateau over the Qtz and Mag beds is consistent with the more gradual bed lowering observed at us4, where the larger momentum transfer required to erode and accelerate denser bed material counteracts further downslope acceleration.
3.2 Runout characteristics
The 3D surface scans and lateral cross sections of the final deposits characterize deposition in the runout area and provide additional information on transport and entrainment processes in the channel. We first present the deposit geometry and runout metrics for all scenarios, and then describe the internal material distribution of the mixed Qtz–Glass and Qtz–Mag deposits.
3.2.1 Deposit morphology
The deposits are largely symmetric along the central downslope axis. Deposit geometries differ among the four scenarios and consistently in both particle-size fractions (Figs. 4 and 5). The repeated runs yielded highly consistent deposit morphologies, resulting in comparable metrics (Table 2) and near-congruent shapes (Table 5) across the three repetitions (see Figs. S6 and S7 for all deposit contour plots). Runout lengths vary by less than ±4 % from the mean of the three repeated runs for most scenarios and by a maximum of ∼ 8 % (Table S1 in the Supplement). Note, however that the deposit topographies show an artificial slope toward the channel outlet at (0|0). This drop in thickness results from lowering the flume into the horizontal position after the experiment (see Sect. 2.3 and Fig. S5). The rear part of the deposit adjusts then to the sediment-specific angle of repose, causing a small amount of material to slide backward out of the runout area before scanning. This artifact, however, does not affect the overall depositional pattern.
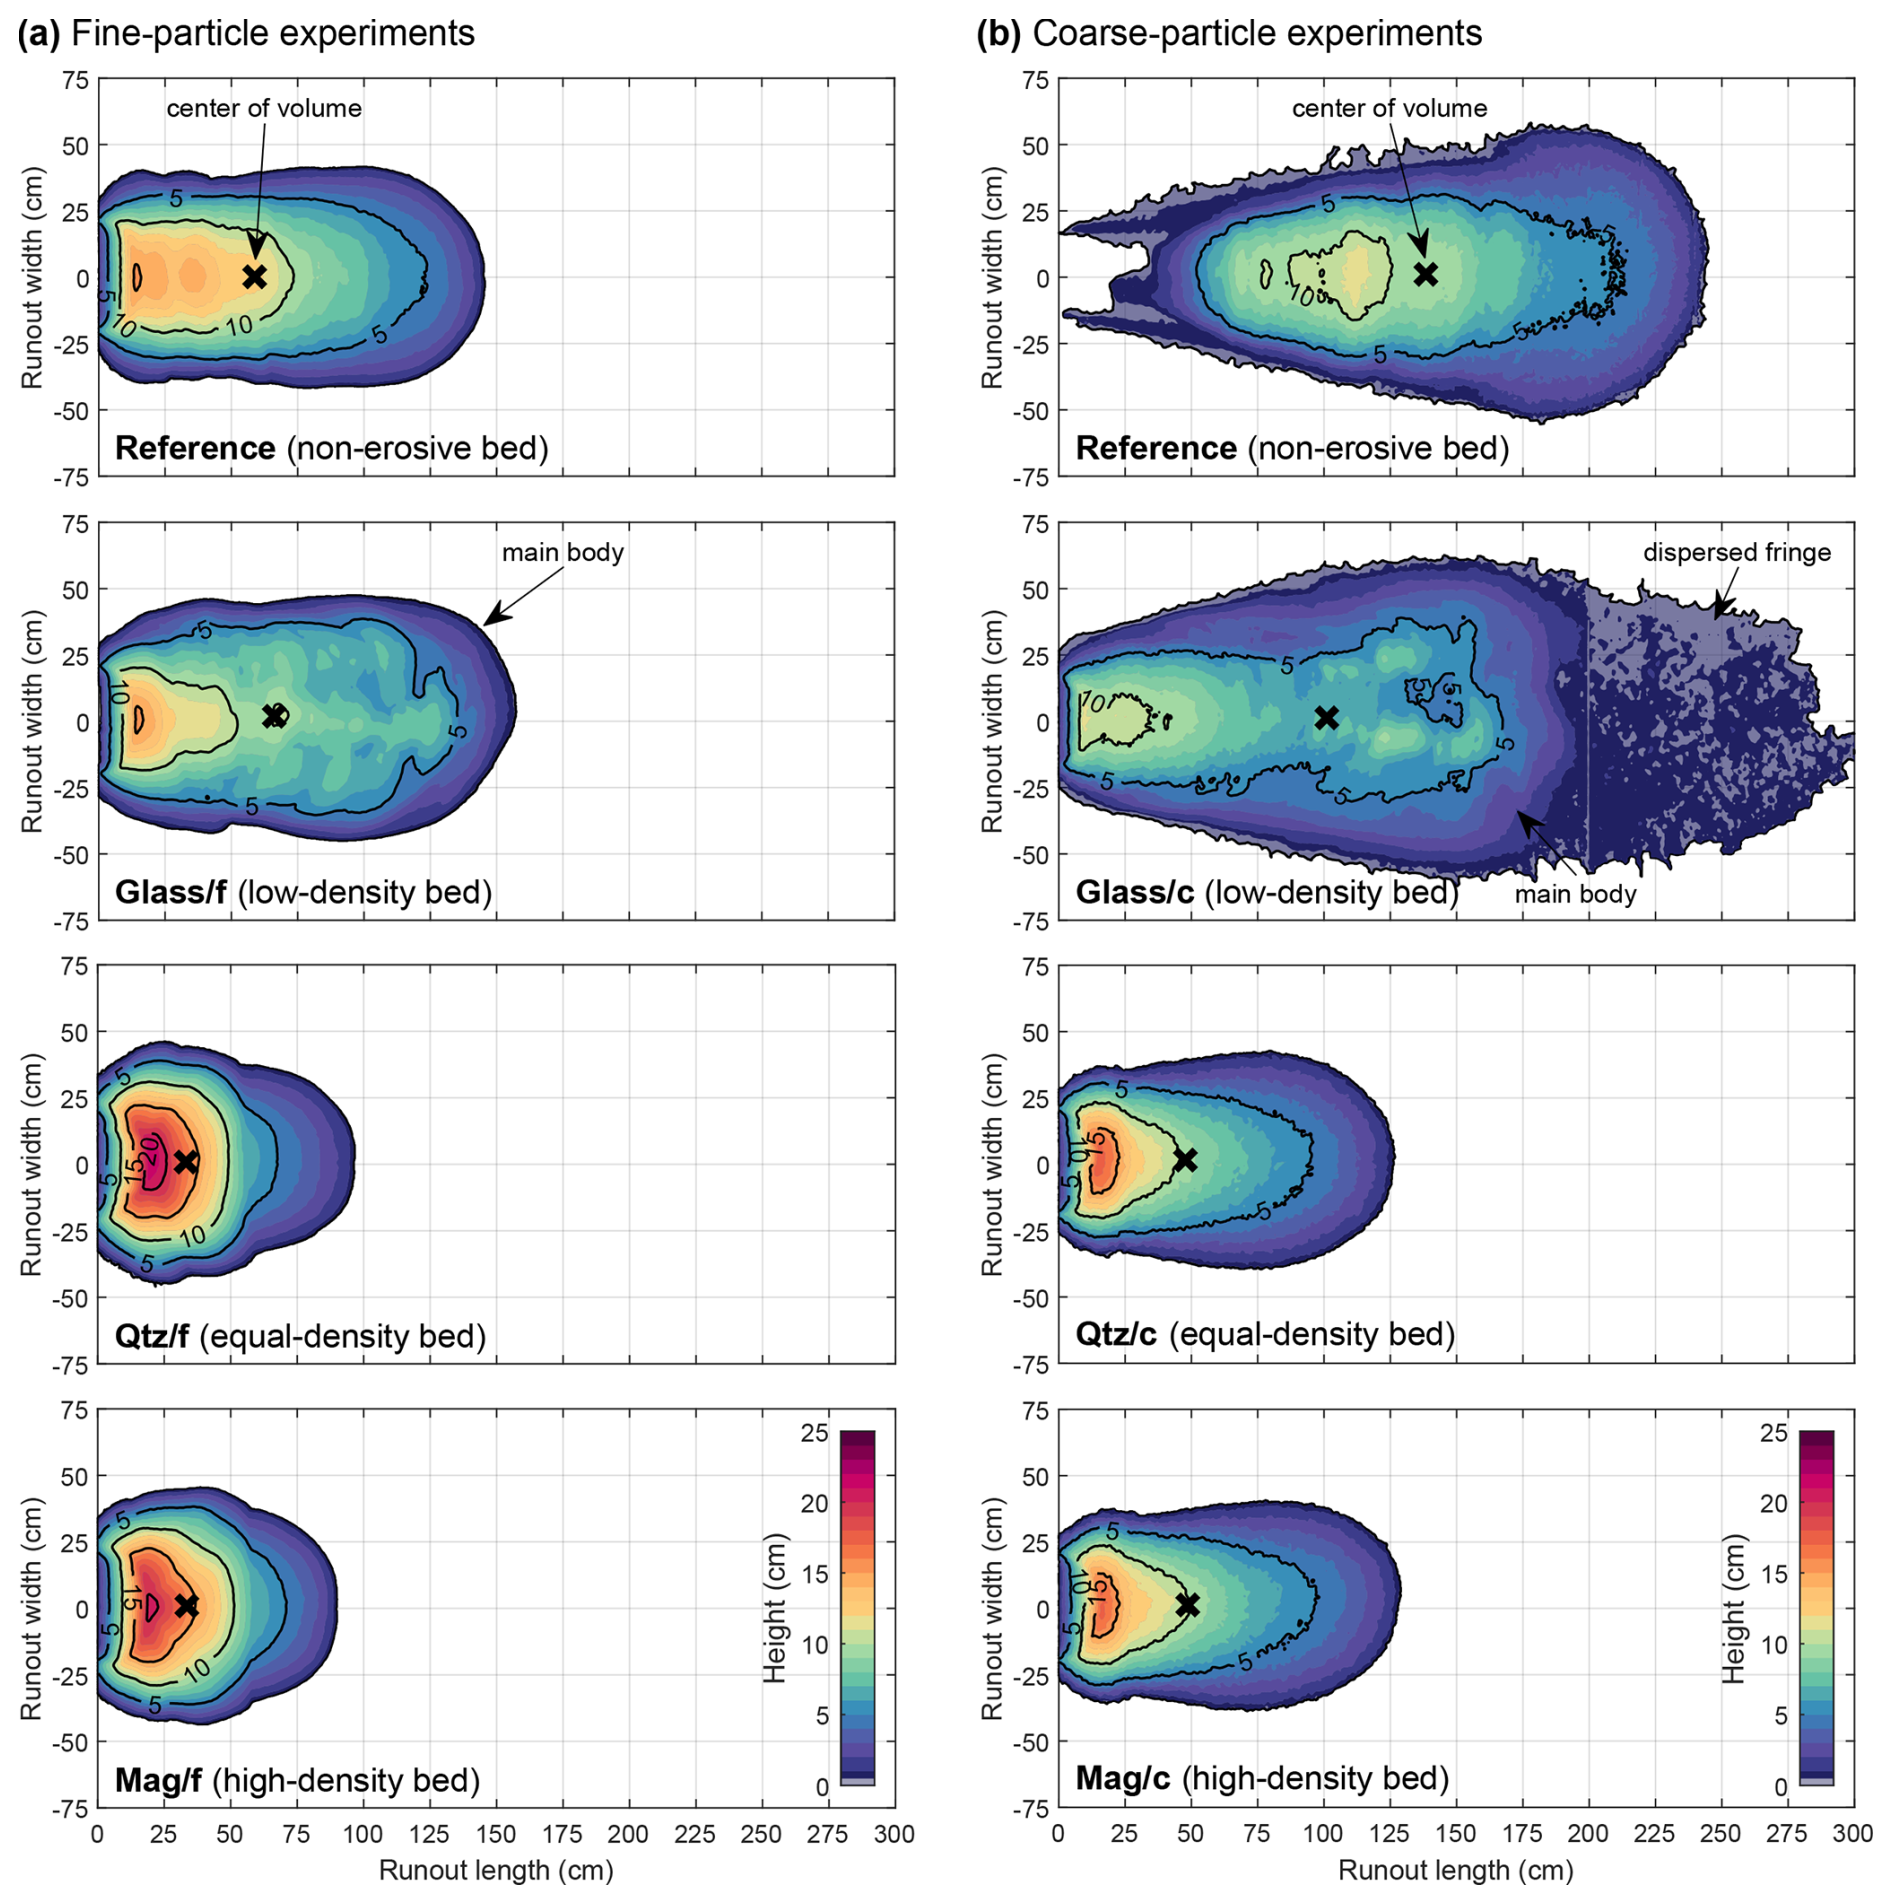
Figure 4Deposit morphology of (a) fine- and (b) coarse-particle experiments. From top to bottom: contours of deposit height for the non-erosive reference, the glass bed, the quartz bed, and the magnetite bed. Representative runs are shown (see Sect. 2.4). Note that the flume was repositioned to the horizontal before deposit scanning. Therefore, only material deposited beyond the flume outlet was analyzed, and the apparent thickness drop towards (0|0) is a systematic artifact (see Fig. S5). /f: fine particles; /c: coarse particles.

Figure 5Deposit geometry and experimental reproducibility for (a) fine- and (b) coarse-particle experiments. From top to bottom: deposit outlines, downslope runout height along the central deposit line, as well as travel angle and for all repetitions. Bold lines and filled symbols indicate the representative runs (see Sect. 2.4); thin lines or open symbols show their repetitions. /f: fine particles; /c: coarse particles; : length-to-width ratio.
The non-erosive reference deposits form elongated, well-confined lobes. The fine-particle deposit ( ≈ 1.7; Figs. 4a and 5a) tapers gradually downslope, reaching a runout length of 146 cm and covering an area of 1.1 m2 with a volume of 71 L. The coarse-particle deposit ( ≈ 2.2; Figs. 4b and 5b) is isolated on the runout area, as all material was released from the channel, extending to a maximum runout of 245 cm, an area of 1.9 m2, and a volume of 83 L. In both particle-size fractions, the centers of volume are located near the top-view midpoint of the deposit.
The Glass deposits form elongated lobes with undulating surfaces, but their shape differs markedly for the two particle-size fractions. The fine-particle deposit (Glass/f; Figs. 4a and 5a) forms a well-confined lobe ( ≈ 1.7) with clear lateral margins and decreases gradually in height downslope. Runout length of 157 cm, area of 1.3 m2, and volume of 75 L resemble the corresponding non-erosive reference deposit. The center of volume lies near the plan-view midpoint. The coarse-particle deposit (Glass/c; Figs. 4b and 5b) is distinctly more stretched ( ≈ 2.4) reaching with 303 cm almost twice the length and covering with 2.9 m2 an area roughly double in size. The volume of 89 L is only by < 20 % larger. The deposit consists of two parts: a compact main body extending over the first 2 m, gradually decreasing in height, and a 1 m long, flat (≤ 1 cm) frontal fringe composed of loosely dispersed particles. The center of volume is located approximately halfway along the main body.
The Qtz and Mag deposits show almost identical shapes and contour patterns within each particle-size fraction. The fine-particle deposits (Qtz/f and Mag/f; Figs. 4a and 5a) are compact and runout lengths and widths nearly equal ( ≈ 1.0). Along the centerline, runout height shows an initial steep decrease that transitions to a gentler gradient beyond a distinct break in slope (at ∼ 55 cm length). Runout lengths are short with 90–97 cm, and cover a small area of 0.7 m2 with volumes of ∼ 52 L. The coarse-particle deposits (Qtz/c and Mag/c; Figs. 4b and 5b) are more elongated ( ≈ 1.5) and show two breaks in slope in their downslope height profiles (at ∼ 25 and 75 cm length). Their runouts are both nearly 130 cm long, covering an area of 0.9 m2 and a volume of ∼ 50 L. In both particle-size fractions, the centers of volume remain close to the channel outlet.
The final runout morphology reflects the material-dependent flow and erosion patterns already observed in the channel. Whereas the non-erosive reference deposits reflect only the spreading and deceleration of the initially released Qtz-slide on the runout area, the mixed slide–bed deposits additionally record the effects of bed erosion and entrainment. The Glass deposits exhibit enhanced longitudinal spreading, with runout length and area increasing disproportionately relative to deposit volume, indicating more efficient spreading of the Qtz–Glass mixture across the runout area. In contrast, the Qtz and Mag deposits remain compact and proximal, mirroring their nearly identical erosion behavior and average flow-front velocities and indicating stronger deceleration during erosion and deposition. Despite its substantially higher solid particle density, Mag produces deposits that are nearly indistinguishable from those of Qtz, indicating that the higher solid particle density of Mag did not translate into a distinct deposit morphology under the tested conditions.
3.2.2 Internal deposit structure
Lateral cross sections through the mixed Qtz–Glass and Qtz–Mag deposits reveal distinct internal sorting and spatial patterns in both coarse- (Fig. 6) and fine-particle experiments (Fig. S8). The mixed slide–bed deposits show particle-size segregation, with a finer-grained core that coarsens toward the deposit surface (cross-checks of the Qtz–Qtz and reference deposits confirmed comparable sorting). This grain-size segregation is particularly evident in the coarse-particle experiments, which comprise the wider 0.25–8 mm particle-size distribution.
This vertical coarsening is consistent with well-known grain-size segregation in dense granular flows, where smaller particles percolate downward through voids while larger particles are displaced upward by kinetic sieving and squeeze expulsion (e.g., Savage and Lun, 1988; Gray and Thornton, 2005; Gray, 2018). In geophysical mass flows, such vertical segregation can be coupled to preferential transport of coarse particles toward the flow surface, front, and margins, thereby influencing deposit architecture and levee formation (e.g., Johnson et al., 2012; Woodhouse et al., 2012; Gray, 2018; Baselt et al., 2022; Edwards et al., 2023). The elongated and laterally confined morphology observed in several of our deposits may likewise indicate incipient self-channelization and levee formation (Johnson et al., 2012; Rocha et al., 2019).
Beyond this general grain-size segregation, the cross sections reveal a second type of sorting related to the contrasting particle densities and shapes of the bed materials. In the Qtz–Glass deposits (Figs. 6a and S8a), a sharp boundary occurs between the two materials. Qtz particles are concentrated in the interior of the main body, while Glass particles form the lateral edges. With increasing runout distance, the lateral Glass edges widen and the central Qtz core narrows. In the intermediate sections, Glass particles appear laterally shouldered onto a thin Qtz layer and the central Qtz core becomes disrupted by distinct Glass ridges. Toward the front, the deposits consist almost entirely of Glass. In the fine-particle deposit (Glass/f; Fig. S8a), Glass also appears centrally along the deposit base. In the coarse-particle deposit (Glass/c; Fig. 6a), the frontal meter consists of a fringe mainly composed of loosely dispersed coarse Glass with only few Qtz particles. In the Qtz–Mag deposits (Figs. 6b and S8b), material separation is less visible and distinct. The deposits appear to be dominated by Qtz particles, whereas Mag particles occur rather as localized clusters. In the fine-particle deposit (Mag/f; Fig. S8b), Mag particles are concentrated at the edges and within thin basal layers. In the coarse-particle deposit (Mag/c; Fig. 6b), Mag particles form lateral lenses and individual cluster along the deposit base and become largely absent toward the deposit front.
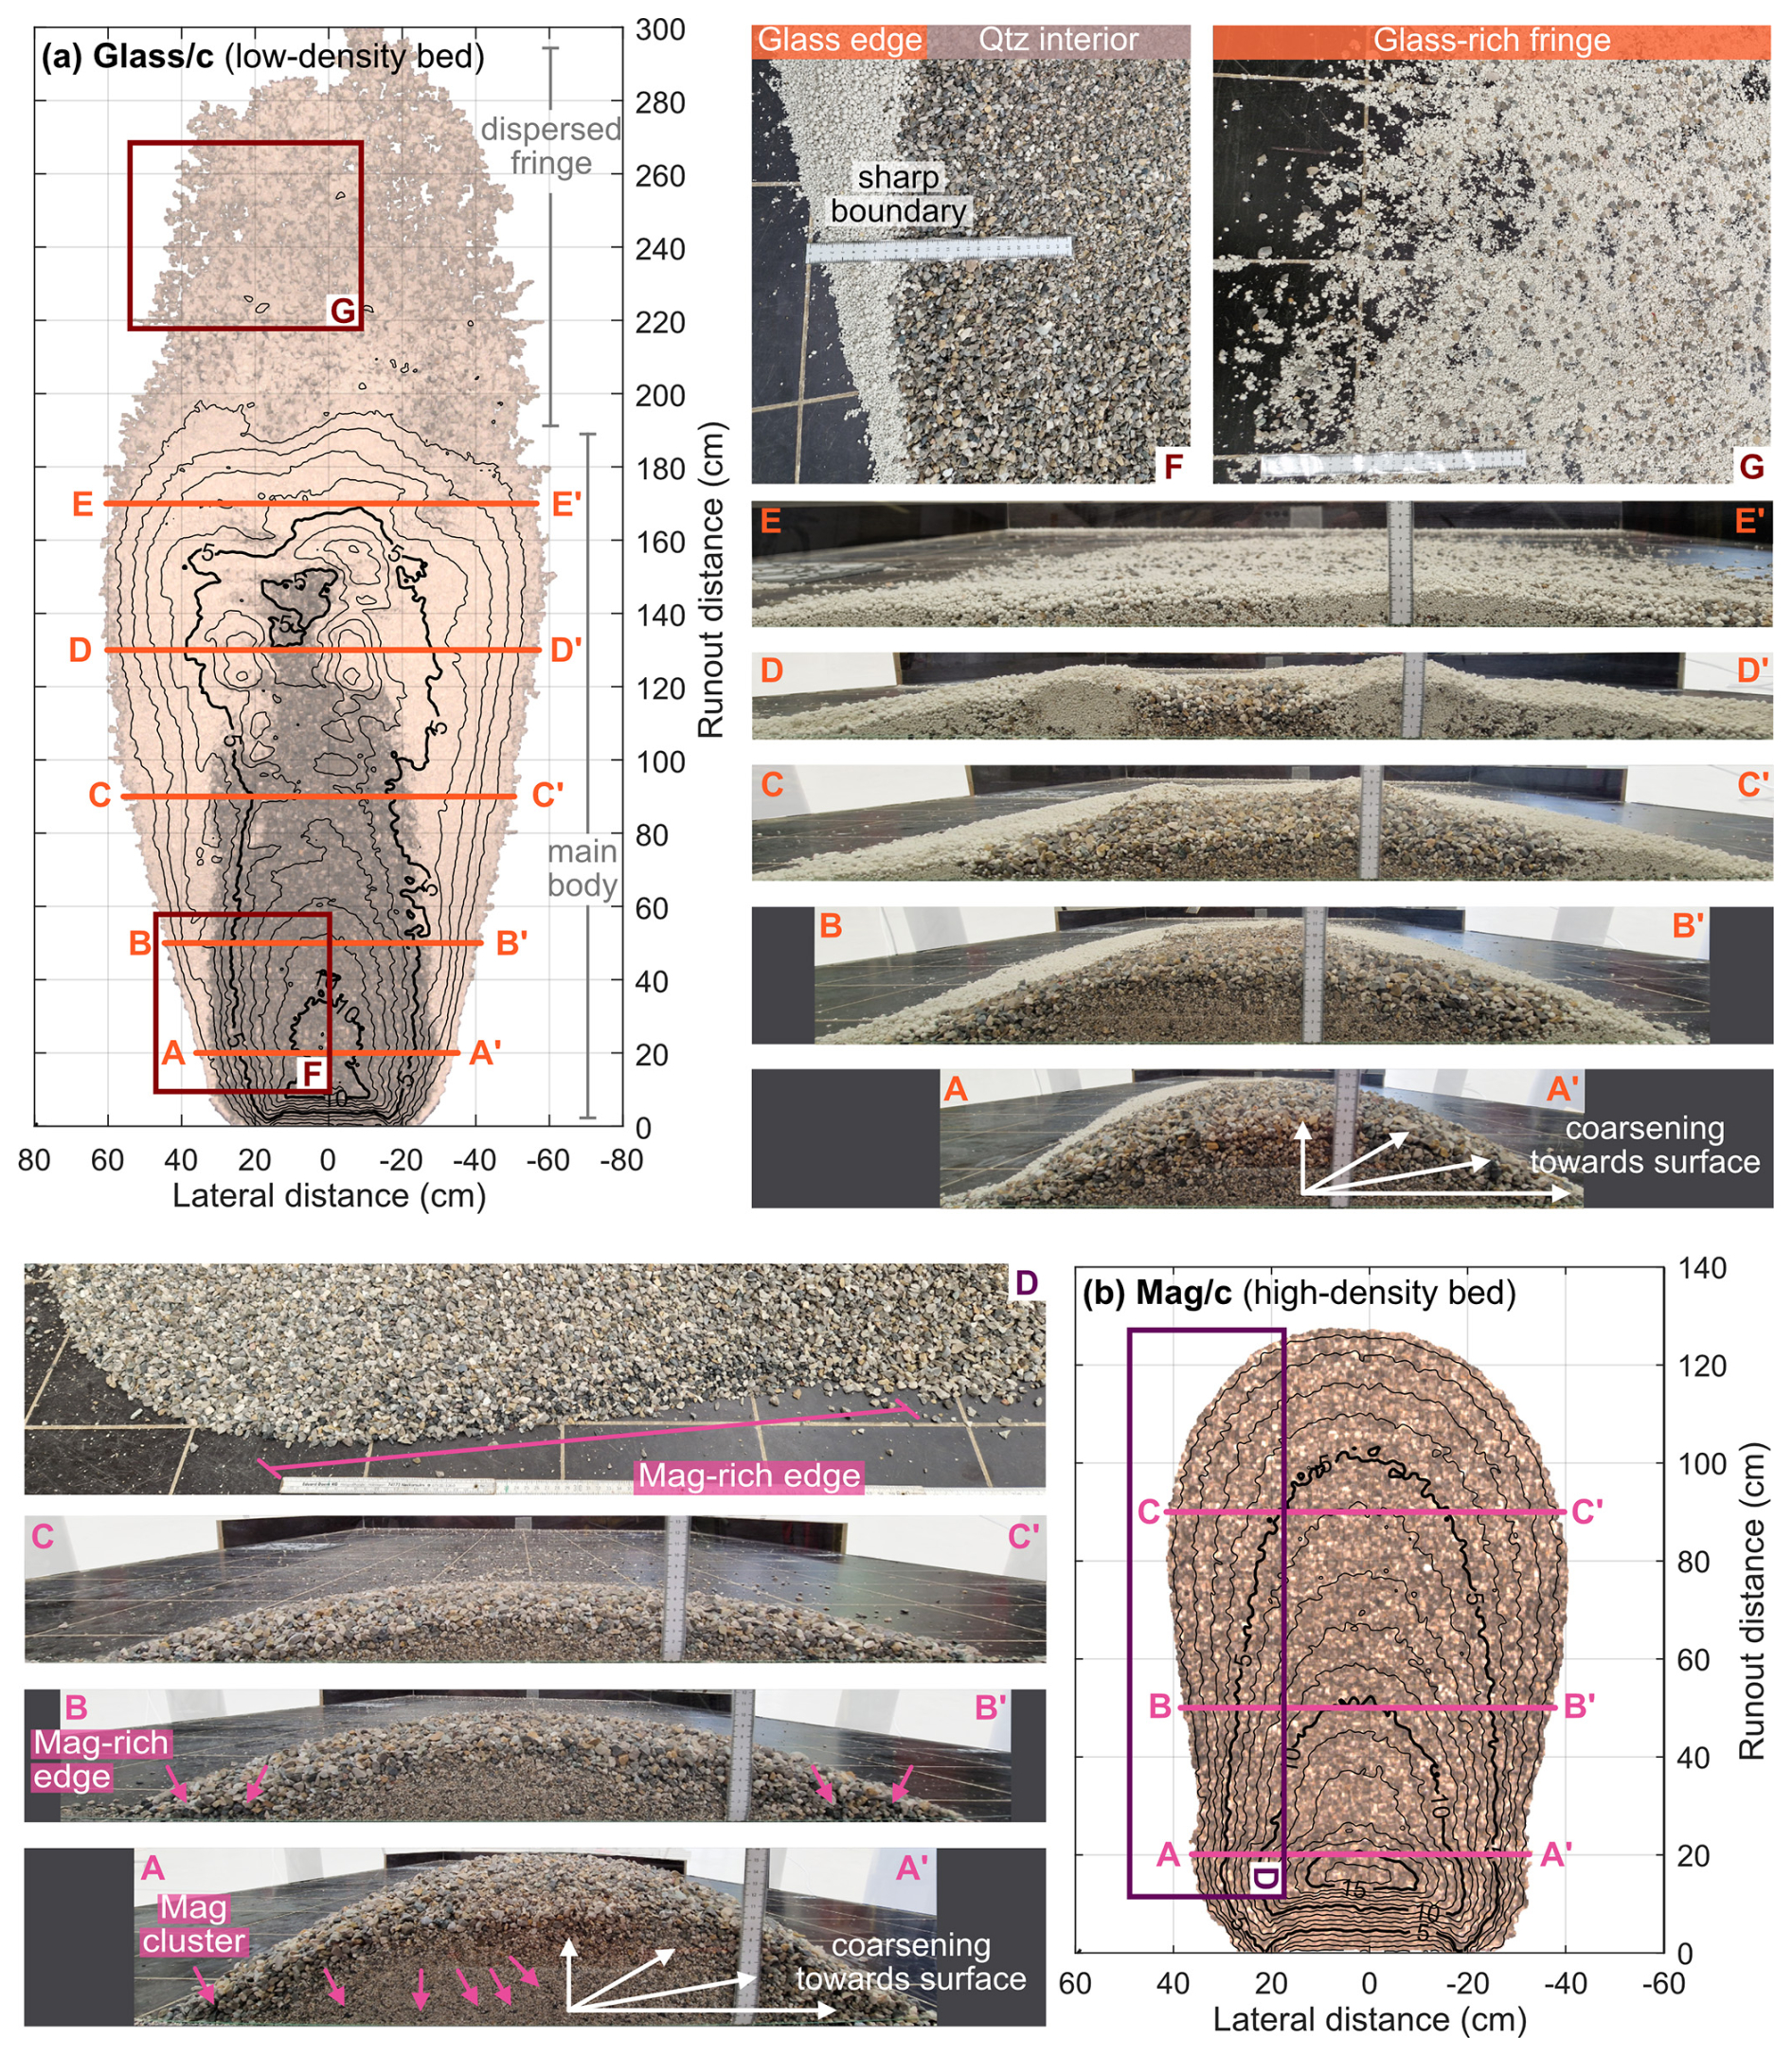
Figure 6Internal structure and spatial distribution of the (a) Qtz–Glass and (b) Qtz–Mag deposit from coarse-particle experiments. Positions of lateral cross sections and surface views are indicated on the contoured surface scan. Contour lines are spaced at 1 cm intervals. Note that thicknesses in the cross sections may appear slightly reduced compared to the corresponding contour-plot position, as inserting the glass plate for vertical cutting could drag material downward at the front. Photographs are from Exp18 (Glass/c) and Exp19 (Mag/c).
In contrast to the grain-size segregation described above, these material-specific distributions suggest density- and shape-controlled segregation during runout and deposition. In the Qtz–Glass deposits, the rounded Glass particles were more readily displaced within the mixture as they were less interlocked than the angular Qtz particles and required less momentum transfer to remain mobile. As a result, they could be lifted and transported laterally downslope, whereas the denser and angular Qtz particles came to rest earlier. In the Qtz–Mag deposits, Mag particles were entrained only locally and neither excavated nor transported as efficiently as the ligther Glass. The higher solid particle density required greater momentum transfer for acceleration, and the angular particle shape promoted interlocking and basal retention. Consequently, entrained Mag particles remained in proximal, small basal clusters.
Across the four scenarios (low density, equal density, high density, or reference), the dry granular flow experiments reveal distinct material-dependent patterns of erosion, flow evolution, and deposit geometry. The clearest contrast occurs between the Glass beds and the similarly behaving Qtz and Mag beds, and is consistent across both particle-size fractions. The close agreement between repeated runs (Figs. S1–S4, S6, S7) supports the use of a single representative run per scenario and demonstrates the reproducibility of the trends underlying the flow–bed interactions discussed below.
4.1 Material controls on erosion, entrainment, and mobility
The observed mobility and runout patterns reflect several coupled material and process controls. Because solid particle density was the primary design variable, we first evaluate its contribution before considering bed internal friction, particle shape, bed preparation, segregation, effective entrainment, and particle-size effects.
4.1.1 Solid particle density and flow-volume growth
The clearest experimental contrast occurs between the low- and equal-density scenarios and is reflected in both particle-size fractions. On the low-density Glass beds, deeper erosion and higher apparent mean erosion rates coincide with continued increases in average flow-front velocity, whereas erosion on the equal-density Qtz beds is shallower and average flow-front velocities remain nearly constant once erosion begins (Fig. 3). These observations indicate a more mobile response over the Glass beds and suggest more effective bed mobilization. The same contrast is expressed in deposit geometry. The main bodies of the Qtz–Glass deposits are approximately 1.6 times longer and cover nearly twice the area of the corresponding Qtz–Qtz deposits. Including the dispersed frontal fringe, Glass/c reaches even more than twice the runout of Qtz/c and covers more than three times the area (Fig. 4). The greater Glass runout may partly reflect the larger volume of mobilized bed material. The associated flow-volume growth may increase flow depth and modify longitudinal pressure gradients during spreading, contributing to runout independently of any direct density-related effect (e.g., Mangeney et al., 2007b, 2010). Within mass- and momentum-conserving entrainment frameworks, bed bulk density determines the mass added for a given eroded volume, while the resulting momentum exchange also depends on bed resistance and on how mobilized material is accelerated and incorporated into the flow (Iverson, 2012; Iverson and Ouyang, 2015). Solid particle density is thus mechanically relevant, but its expression in mobility cannot be isolated from the associated erosion volume and flow–bed interaction. By contrast, the equal- and high-density scenarios behave nearly identical. On the equal-density Qtz and high-density Mag beds, erosion, average flow-front velocities, and deposit geometries are comparable despite an almost twofold difference in solid particle density (Figs. 3–5; Table 1).
This asymmetric response only partly agrees with previous findings. The enhanced mobility, deeper erosion, and longer runout observed for the low-density Glass beds are consistent with the experiments of Farin et al. (2014). They found that dry granular flows became more mobile, traveled farther, and eroded more deeply as bed porosity increased and, consequently, bulk density decreased. Considered in isolation, the response of the low-density Glass scenarios appears qualitatively consistent with the enhanced mobility proposed by Pudasaini and Krautblatter (2021) for a lower-density erodible bed. However, this interpretation is not supported by the complete experimental dataset, because the influence of solid particle density cannot be separated from differences in friction, particle shape, and bed deformation. Moreover, the high-density Mag beds do not show a corresponding reduction in mobility relative to the equal-density Qtz beds. Instead, the results support a broader interpretation in which erosion-induced mobility reflects coupled effects of flow-volume growth, bed resistance, bed deformation, and entrainment efficiency (e.g., Iverson, 2012; Farin et al., 2014; Zhang et al., 2026). This interpretation is also consistent with dry granular flow experiments using identical flow and bed materials, in which mobility can increase or decrease depending on slope inclination, erodible-bed thickness, and released volume (Edwards et al., 2017; Kokelaar et al., 2017; Viroulet et al., 2019). These parameters were not systematically varied in the present experiments, where slope inclination, erodible-bed thickness, and initial released mass were kept constant.
4.1.2 Bed internal friction and stability
Among the material properties considered in this experimental study, bed internal friction provides the most plausible explanation for the contrasting erosion and entrainment patterns. The internal friction angles of Glass are 29–31° and substantially lower than the 37° flume inclination (Table 1). Glass beds consequently required stabilization with 4 %–5 % water by mass and slight surficial compaction to remain initially stable. Once disturbed by the overriding flow, their comparatively low frictional resistance facilitated bed deformation and particle mobilization. Also bed failure facilitated volume growth and mobility. By contrast, the internal friction angles of Qtz and Mag span 35–39° and are close to the flume inclination. Their similar and higher internal friction angles are consistent with their comparable resistance to erosion despite their contrasting solid particle densities. Previous granular-flow experiments likewise show that the influence of erosion on mobility depends strongly on bed friction and slope relative to the material's stability threshold (Mangeney et al., 2010).
The travel angles provide a complementary bulk measure of this contrasting resistance. They are systematically lower for the Glass beds than for Qtz and Mag beds (Table 2, Fig. 5). Particularly in the coarse-particle experiments, Glass/c yields values of 29–30° compared with approximately 34° for Qtz/c and Mag/c. Although the travel angle integrates several processes and should not be interpreted as a direct measurement of basal friction, the lower Glass values are consistent with lower apparent resistance and greater mobility during runout (e.g., Parez and Aharonov, 2015; Taylor-Noonan et al., 2022).
Compared to the non-erosive reference scenario, the erosive scenarios show reduced frontal acceleration and lower average flow-front velocities after entering the erodible bed (Fig. 3). Under the dry conditions considered in this study, this response is consistent with additional resistance associated with bed deformation and the acceleration of initially resting bed material (e.g., Tian et al., 2014; Li et al., 2022). However, erosion does not necessarily reduce mobility. Entrainment from mechanically weakened or saturated beds can instead promote flow acceleration and momentum growth (Iverson et al., 2011). In the present experiments, the additional resistance is reflected in the shorter Qtz and Mag deposits, whereas the main bodies of the Glass deposits attain lengths comparable to those of the non-erosive reference (Fig. 4).
Contrasting erosion and entrainment modes are evident from the temporal flow-height records. The stepwise lowering of the Glass beds is consistent with episodic bed failure, whereas the gradual Qtz and Mag signals are more consistent with progressive shear-driven erosion (Fig. 3). Similar contrasts between localized en-masse mobilization and progressive grain-by-grain entrainment have been reported in previous flume experiments (de Haas and Van Woerkom, 2016; Roelofs et al., 2023; Zhang et al., 2026). The Glass response therefore points to comparatively low effective bed resistance, arising primarily from low internal friction and, possibly, low solid particle density.
Apparent mean erosion rates span 0.4–1.5 cm s−1 (Table 2). These values overlap with the lower end of erosion rates reported from debris-flow flume experiments over partially saturated beds, including 0.3–1.8 cm s−1 reported by Zheng et al. (2021), but remain below the higher experimental ranges (e.g., 5–10 cm s−1 in Iverson et al., 2011; Reid et al., 2011; 1.9–4.3 cm s−1 in Li et al., 2018). They are also substantially lower than the average erosion rates of 42–54 cm s−1 observed in dry granular flow experiments (Barbolini et al., 2005). In comparison with field observations, our rate estimates fall within the range of average entrainment rates reported for natural debris-flow events at Chalk Cliffs, Colorado, USA, which are 0.2–0.5 cm s−1 over dry beds and 1.1–14 cm s−1 over saturated beds (McCoy et al., 2012). They are, however, well below the maximum local erosion rates of up to 80 cm s−1 measured during debris-flow events at Illgraben, Switzerland (Berger et al., 2011). Our apparent mean erosion rates should, however, be interpreted in the context of the contrasting stepwise and progressive mobilization modes identified above. Frontally concentrated mobilization, for example, can produce short-lived but pronounced increases in apparent erosion rate (Zhang et al., 2026). Consequently, our rate estimates represent temporal averages but do not represent a single, uniform entrainment mechanism.
4.1.3 Particle shape and collisional effects
Particle shape further modifies bed resistance and particle transport. Greater roundness facilitates particle rotation (Estrada et al., 2011), whereas angular particles exhibit stronger interlocking and higher shear resistance (Ali et al., 2023). The nearly spherical Glass particles therefore differ mechanically from the angular Qtz and Mag particles (Fig. 1). Their greater rolling mobility likely facilitates both initial mobilization from the bed and subsequent transport, contributing to the higher apparent mean erosion rates and average flow-front velocities observed for the Glass beds. This interpretation is consistent with previous experiments in which greater bed-particle roundness reduced flow resistance and enhanced entrainment (Li et al., 2022).
The influence of particle shape is particularly evident in Glass/c, where a dispersed frontal fringe composed predominantly of coarse spherical Glass particles forms ahead of the main deposit body (Figs. 4b and 6a). Glass/f, in contrast, forms a more confined lobe without a comparable fringe. This contrast suggests an additional interaction between particle shape and size. The more dispersed coarse-particle deposits may also reflect stronger collisional stresses and stress fluctuations generated as larger grains interact with the rigid runout surface, enhancing particle agitation and spreading (Choi and Goodwin, 2021).
4.1.4 Bed preparation and compaction
Bed preparation may exert an additional control. Compaction reduces bed porosity and generally increases resistance to deformation and erosion (Farin et al., 2014; Bahmanpouri et al., 2021). Whereas the Qtz and Mag beds were prepared by simple infilling, the Glass beds had to be mixed with 4 %–5 % water by mass and superficially compacted to maintain the imposed slope. Small spatial variations in this compaction or between repeated runs may have affected the onset and spatial pattern of erosion. The partly greater variation in runout length and symmetry among the Glass/c repetitions may reflect such differences (Fig. S7b). However, since bed compaction was not measured directly, its influence cannot be quantified.
4.1.5 Segregation and effective entrainment
Density segregation contributes to the contrasting internal deposit structures. Density differences can drive relative particle migration even when particle sizes are comparable (Tripathi and Khakhar, 2013; Gray and Ancey, 2015). In the Qtz–Glass deposits, the lighter Glass particles preferentially occur toward the deposit surface, front, and lateral margins, whereas the denser Qtz particles remain concentrated in the central deposit body (Fig. 6a). This pattern is consistent with density-driven segregation in a mixture initially formed by a denser Qtz-slide overriding a lighter Glass bed. The rounded shape and lower frictional resistance of Glass may further enhance its relative mobility and distal transport.
Material separation is less pronounced in the Qtz–Mag deposits. Mag occurs mainly in sparse basal clusters and lateral lenses and is largely absent from the deposit front (Fig. 6b). This distribution suggests that the denser Mag particles remained preferentially near the flow base after shear-driven erosion and only partly became effectively incorporated into the flow. This distinction between erosion and effective entrainment is important because mobilized bed material does not necessarily become fully integrated into the moving mass (Zhang et al., 2026). Consequently, less high-density material may be accelerated with the flow, potentially explaining why the Mag experiments show no systematic differences from the Qtz experiments.
The observed density segregation must be distinguished from the grain-size segregation that occurs simultaneously within each experiment. This particle sorting is characterized by coarsening toward the deposit surface and front, with a finer deposit core. It is also present in the non-erosive reference deposits (see Sect. 3.2.2) and thus independent of material-density contrasts.
4.1.6 Particle-size effects
Fine- and coarse-particle experiments preserve the same relative material-dependent patterns in erosion and flow evolution. Within each scenario, final erosion depths, apparent mean erosion rates, and flow-front velocities differ only slightly between the two particle-size fractions (Fig. 3). Within the investigated particle-size fractions, particle size therefore has only a limited influence on the relative response to the different bed materials.
By contrast, deposit morphology depends strongly on particle size. The coarse-particle flows form longer, flatter, and more elongated lobes, whereas the fine-particle flows produce shorter and thicker deposits (Figs. 4 and 5). The non-erosive references support the interpretation that this difference develops mainly during runout and deposition. Under identical basal conditions along the entire channel, the coarse-particle flows eventually accelerate more strongly on the rigid bed and attain higher final average flow-front velocities than the fine-particle flows. The greater coarse-particle runout suggests lower effective resistance during deposition, where enhanced collisional agitation may additionally lead to the partly more dispersed deposit geometry. Thus, particle size modifies the final expression of mobility more strongly than the relative erosion response does.
4.2 Collision- and friction-dominated flow regimes
The evaluation of flow regimes using dimensionless numbers facilitates the comparison of different processes across experimental and natural scales. Because our experiments involve dry granular material without an interstitial fluid phase, most dimensionless numbers commonly applied to particle–fluid mixtures are not applicable here. The Savage number (Savage and Hutter, 1989; Parsons et al., 2001)
provides a suitable measure for distinguishing between collision-dominated and Coulomb-frictional flow regimes. It represents the ratio of grain-collision stresses to gravitational grain-contact stresses (Iverson and Denlinger, 2001). Following Savage and Hutter (1989), grain collisions significantly affect flow dynamics at values above the threshold NSav = 0.1. Following Baselt et al. (2021), the shear rate is approximated assuming a linear velocity profile, = , the representative grain diameter dmean is used, and the Savage number is calculated for the flow front based on the mean velocity and maximum flow depth at each sensor position. For the present dry granular flows, ρwater = 0, reducing the density term to unity. Consequently, NSav is mainly controlled by particle size, flow velocity, basal friction angle, and, in particular, flow depth.
The calculated Savage numbers show that Coulomb friction dominates almost all experiments at every sensor position. All fine-particle experiments yield 0.0015 ≤ NSav ≤ 0.0269, whereas the erosive coarse-particle experiments remain within 0.0068 ≤ NSav ≤ 0.0575. The non-erosive coarse-particle reference yields values between 0.023 and 0.25. These values fall within the broad range reported for other laboratory experiments and field observations (e.g. Iverson and Denlinger, 2001; Zhou and Ng, 2010; de Haas et al., 2015; Sanvitale and Bowman, 2017; Lanzoni et al., 2017a; Baselt et al., 2021). Along the upper channel, the Savage number generally increases as the flow accelerates. Upon entering the erodible bed, however, NSav decreases because average flow-front velocity decreases, flow depth increases, and the basal friction angle becomes larger. After leaving the erodible bed, NSav generally increases again, but remains below the threshold of 0.1 in most experiments. Only the non-erosive coarse-particle reference transitions into the collision-influenced regime. Here, NSav increases progressively along the channel, crosses into the collision-influenced regime along the lower channel, and reaches a maximum of approximately 0.25. This increase results from the combination of the larger grain diameter, increasing average flow-front velocity, lower basal friction angle, and comparatively small flow depth. This predominantly frictional regime contrasts with the more energetic, coarse-grained experiments of Zhang et al. (2026), in which localized high shear rates and pronounced collisional fluctuations developed during flow–bed interaction. This difference is consistent with their substantially larger particles, higher flow velocities, and more impact-dominated experimental geometry. Accordingly, collisional dissipation appears to have played a minor role in the present experiments, where NSav remains below the collision-influenced threshold at nearly all sensor positions and Coulomb friction dominates the bulk flow response.
4.3 Deposit geometry and mobility scaling
Laboratory experiments are inherently affected by scale effects and complete geometric and dynamic similarity with natural events is generally unattainable (Iverson and LaHusen, 1993; Iverson, 2015). Cross-scale comparison nevertheless helps to place laboratory results within the broader spectrum of gravitational mass flows. Integral measures such as inundated area and the ratio of travel distance to elevation difference provide a useful basis for this cross-scale comparison (Baselt et al., 2022).
To complement the flow-regime classification (see Sect. 4.2), the deposit-scale mobility of the present experiments is compared with the compilation of laboratory experiments and natural events by Baselt et al. (2022), based on the above mentioned integral measures (Fig. 7). In this study, the inundated area A represents the sum of the planimetric channel area traversed by the flow and the planimetric deposit area on the runout surface. The total travel distance L is the projected horizontal distance from the reservoir outlet to the deposit's center of volume, while H denotes the corresponding elevation difference. The ratio expresses the bulk flow mobility and is inversely related to the travel angle, (Baselt et al., 2022).
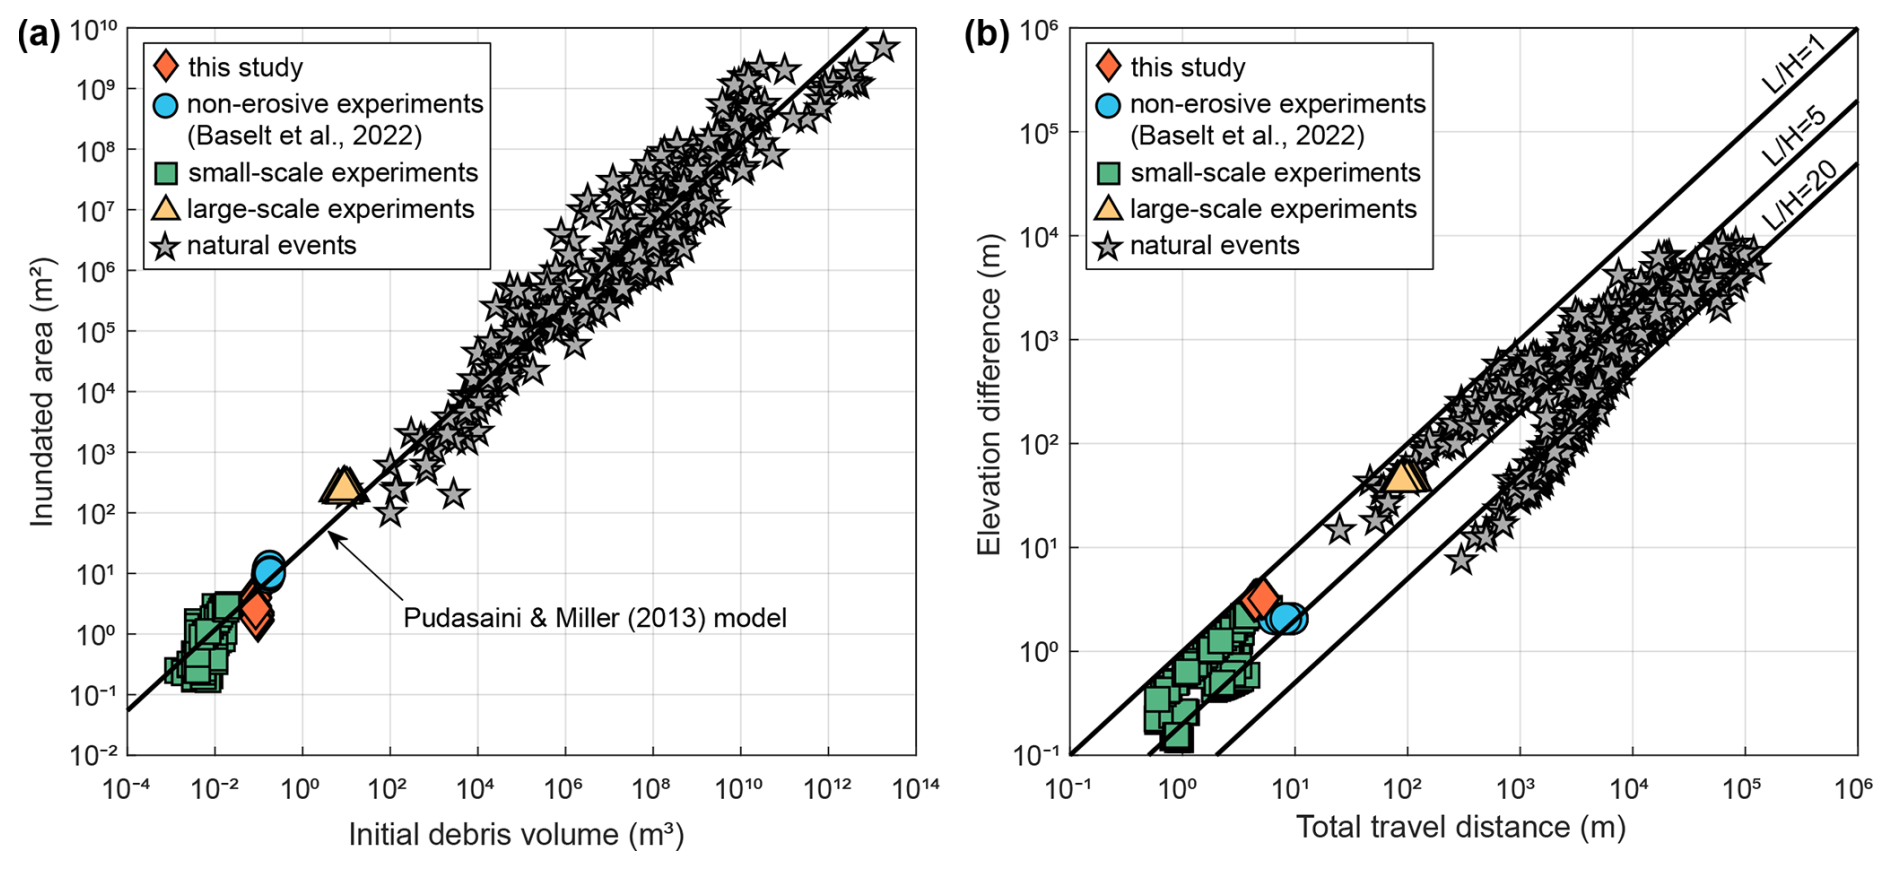
Figure 7Evaluation of deposit geometry and mobility in comparison with other experiments and natural events. (a) Inundated area as a function of the initial debris volume and in comparison with the volume-area model by Pudasaini and Miller (2013) (volume-area slope S = 25). (b) Mobility expressed as elevation difference over total travel distance. The mobility reference lines represent typical values for natural events (figure modified and extended from Baselt et al., 2022).
In the volume–area comparison (Fig. 7a), the present experiments occupy the upper end of the small-scale laboratory range and extend the existing compilation toward larger initial volumes and inundated areas. Although the initial release volume differ only slightly among the experiments, inundated areas vary to some extent. The Glass experiments occupy the uppermost positions within the present dataset because their larger erosion volumes and more extensive deposits increase the inundated area, whereas the Qtz and Mag experiments remain closely grouped. Because the abscissa represents only the initially released volume, the positions of the erosive experiments also reflect volume growth through entrainment, particularly for Glass. Nevertheless, the present data agree well with the volume–area relation of Pudasaini and Miller (2013) for a volume–area slope of S = 25. This relation provides a consistent trend linking small-scale with large-scale experiments and natural events (Baselt et al., 2022),.
In the comparison of elevation difference and total travel distance (Fig. 7b), the present experiments occupy the lower-mobility end of the compilation. Nevertheless, the values from this study range between 1 and 5 and therefore overlap with the mobility range of many large-scale experiments and natural events. Their comparatively low position within this range is consistent with the predominantly Coulomb-frictional flow regime identified from the Savage numbers and with the dry experimental conditions. Within the present dataset, the Glass experiments attain the largest values, whereas the Qtz and Mag experiments remain closely grouped. Their similar bulk mobility, despite their large solid-particle-density contrast, further indicates that density contrast alone does not determine runout.
4.4 Limitations and future steps
Our newly developed experimental flume produced highly reproducible flow and deposition signals and robust patterns across repeated runs (Fig. S1). This provides a solid basis for testing theoretical mass-flow models and for future experimental analyses of erosion and entrainment processes at the flow–bed interface. Yet, certain experimental boundary conditions need to be considered when interpreting the presented results and point toward directions for future refinement and research.
The selection of artificial expanded Glass as low-density material was constrained by the need for efficient post-experiment separation from Qtz and reusability. However, its lower internal frictional resistance and rounded particle shape relative to Qtz and Mag enhanced mobility beyond the intended density-related effects (see Sect. 4.1.2, 4.1.3). Future experiments could explore natural alternatives with an intermediate low density, such as limestone (∼ 1700 kg m−3), with comparable particle angularity and frictional behavior. Though, post-experiment separation remains challenging.
In-channel backlog and deposition may obscure subtle differences between the Qtz and Mag experiments, that might otherwise become apparent under full release onto the runout area. Both flows entered the runout area with similar average flow-front velocities (Fig. 3) dominantly composed of Qtz particles (Figs. 6b and S8b). They therefore experienced comparable frictional conditions and rapid deceleration on the 10° inclined runout surface, causing rapid and similar frontal deposition. This may limit the visibility of possible differences at later flow stages, as these may instead be expressed in the in-channel deposits, which were not analyzed by 3D surface scanning. Yet, the near-congruent flow-height evolution, similar excavation history and erosion depths (Fig. 3) suggest that entrainment in both scenarios was broadly comparable. Any remaining differences, if present at all, are therefore likely to be small and difficult to distinguish from the scattering that such large experimental setups naturally hold.
The derived erosion rates represent apparent mean estimates based on the final erosion depth at a single location. Therefore, they do not resolve temporal changes in erosion intensity (Fig. 3). Moreover, the ultrasonic measurements cannot distinguish changes in the elevation of the flow–bed interface from changes in the thickness of the overriding flow, as both contribute to the recorded flow height. Consequently, the Qtz and Mag experiments may have differed in their basal entrainment dynamics while still producing similar flow-height records, final erosion depths, and deposit morphologies. For example, one scenario may have undergone shorter but more intense erosion beneath a thicker slide, whereas the other eroded more gradually beneath a thinner slide. Similar surface responses resulting from different combinations of basal slip, shear localization, substrate deformation, and entrainment have recently been demonstrated by Zhang et al. (2026). Comparable final erosion depths therefore do not necessarily imply identical grain-scale dynamics. More generally, the transition from flowing to apparently static material may be gradual rather than sharp, as slow granular creep can persist beneath the rapidly flowing layer (Komatsu et al., 2001). Instead, differences in interface processes may compensate for each other and produce similar bulk mobility and deposit geometry, but remain inaccessible within this study.
To resolve grain-scale processes hidden beneath the measured surface responses, future experiments should directly quantify particle motion and deformation across the flow–bed interface. Depth-resolved imaging methods such as Particle Tracking Velocimetry and Particle Image Velocimetry can distinguish basal sliding, localized shear, plug-like motion, and deformation from vertical velocity profiles across the interface (e.g., Lanzoni et al., 2017b; Taylor-Noonan et al., 2022; Zhang et al., 2026). Applied to the present experimental design, these methods would directly resolve the kinematics of the flow–bed interface, allowing effective entrainment to be quantified. This is particularly relevant for the Qtz and Mag experiments, where similar surface evolution and deposit geometry may conceal different grain-scale mechanisms. Combining vertical velocity profiles with time-resolved bed lowering could clarify whether their comparable bulk response reflects similar entrainment dynamics or compensating interface processes. Such measurements would also directly relate entrainment rates to the velocity of mobilized particles entering the flow, providing a stronger basis for evaluating mass and momentum exchange across the flow–bed interface.
Finally, this study focused on dry single-phase experiments to investigate systematically imposed solid-particle-density contrasts between the moving mass and the erodible bed. The experimental design was motivated by Pudasaini and Krautblatter (2021), who considered density contrast as a potential control on erosion-induced mobility changes. Although their framework addresses landslide mobility more broadly, the present dry granular flow experiments represent its limiting case without a fluid phase and with solid volume fraction approaching unity. Natural debris flows, however, usually contain a fluid phase which can strongly influence erosion, momentum transfer, and mobility (e.g., Iverson et al., 2011; de Haas and Van Woerkom, 2016; Roelofs et al., 2023). Extending the present density-contrast scnearios to two-phase mixtures by systematically varying the water content of the moving mass and the erodible bed is therefore a logical next step. As previous studies commonly report higher erosion rates under wet or saturated conditions (Iverson et al., 2011; Reid et al., 2011; McCoy et al., 2012), such experiments could clarify whether the material-dependent trends observed here persist, weaken, or intensify in the presence of a fluid phase.
This study experimentally compared erosion, flow evolution, and deposition of a moving dry granular flow across systematically imposed solid-particle-density contrasts between the flow and erodible beds. A constant quartz slide was released over beds with lower, equal, and higher solid particle density. Accompanying differences in internal friction, particle shape, and bed preparation were explicitly considered when interpreting the results. Our analyses lead to the following main findings:
- i.
Solid particle density contributes to mass and momentum exchange across the flow–bed interface but does not control mobility in isolation. Low-density glass beds produced stronger erosion, larger flow-volume increase, higher average flow-front velocities, and longer runout. By contrast, equal-density quartz beds and high-density magnetite beds showed similarly low erosion, comparable flow evolution, and nearly identical deposit geometry despite the substantially higher solid particle density of magnetite.
- ii.
The observed patterns appear to be governed primarily by coupled material controls, particularly internal friction. Whereas the low internal friction and rounded particle shape of glass facilitated bed failure, particle mobilization, and incorporation into the moving flow, the similarly high internal friction and angular particle shape of quartz and magnetite promoted stronger interlocking and comparable resistance to erosion and entrainment.
- iii.
Density and grain-size segregation influence where entrained material is transported and deposited and thereby modify the apparent mobility of the mixed flow. The lighter glass particles were preferentially transported to the deposit front and lateral margins, whereas the heavier magnetite particles remained concentrated in sparse basal clusters. Grain-size segregation occurred within all materials, with coarser particles concentrated toward the surface and front.
- iv.
Repeating the experiments with finer sand-sized and coarser sand-to-gravel-sized particles did not change the relative patterns between the different bed materials. Particle size mainly affected basal resistance, collisional contributions, depositional spreading, and the internal structure of the deposits.
Overall, our experiments provide a reproducible dataset that reveals distinct material-dependent patterns of erosion, flow evolution, and deposition in dry granular flows over erodible beds. The model of Pudasaini and Krautblatter (2021) provided the theoretical motivation for systematically varying flow–bed solid-particle-density contrasts, and the resulting experiments offer benchmark data for evaluating erosion and entrainment formulations in future modelling studies. Based on the measured flow-surface evolution and final deposit characteristics, however, the influence of solid particle density cannot be separated from accompanying differences in friction, particle shape, bed deformation, and entrainment efficiency. The observed macroscopic response therefore does not provide direct experimental support for the density-dependent mobility response proposed by Pudasaini and Krautblatter (2021), while the underlying theoretical formulation cannot be conclusively evaluated from the present measurements. Instead, our observations show that bulk mobility emerges from the interaction of multiple material properties and flow processes that control both the amount of material mobilized and the efficiency with which it is incorporated into the moving flow. Surface-based measurements alone cannot resolve the underlying processes at the flow–bed interface. Depth-resolved velocity profiles and time-resolved bed deformation are therefore needed to distinguish basal slip, localized shear, slow creep, progressive entrainment, and deeper substrate failure, and to directly relate entrainment to mass and momentum exchange.
The experimental datasets of this study are available in the accompanying data publication at https://doi.org/10.60776/XRQ8K1 (Wetterauer, 2026). These data are freely available under the Creative Commons Attribution 4.0 International (CC BY 4.0) open-access license at Open Data UniBw M. When using these data please cite this article.
The supplement related to this article is available online at https://doi.org/10.5194/nhess-26-5315-2026-supplement.
IB conceived the project. KW and IB developed the conceptual design of the experimental flume. SM carried out the technical implementation of the flume. KW conducted the experiments, analyzed the data and prepared the initial draft, figures, and tables. KW and IB revised the manuscript based on the comments and edits of all co-authors.
The contact author has declared that none of the authors has any competing interests.
Publisher's note: Copernicus Publications remains neutral with regard to jurisdictional claims made in the text, published maps, institutional affiliations, or any other geographical representation in this paper. The authors bear the ultimate responsibility for providing appropriate place names. Views expressed in the text are those of the authors and do not necessarily reflect the views of the publisher.
We thank the staff of the Hydraulic Laboratory for their technical support in constructing the experimental set-up and for their assistance during the experiments. We also thank the editor, the three reviewers, and the community members for their constructive and detailed feedback on the paper.
This research was funded by the Deutsche Forschungsgemeinschaft (DFG, German Research Foundation; grant no. 522201978). Open access funding was enabled by the University of the Bundeswehr Munich.
This paper was edited by Andreas Günther and reviewed by Hervé Vicari and two anonymous referees.
Aaron, J. and McDougall, S.: Rock avalanche mobility: The role of path material, Eng. Geol., 257, 105126, https://doi.org/10.1016/j.enggeo.2019.05.003, 2019. a
Aaron, J., Langham, J., Spielmann, R., Hirschberg, J., McArdell, B., Boss, S., Johnson, C. G., and Gray, J. M. N. T.: Detailed observations reveal the genesis and dynamics of destructive debris-flow surges, Communications Earth & Environment, 6, 556, https://doi.org/10.1038/s43247-025-02488-7, 2025. a
Adams, T., Grant, C., and Watson, H.: A simple algorithm to relate measured surface roughness to equivalent sand-grain roughness, International Journal of Mechanical Engineering and Mechatronics, 1, 66–71, 2012. a
Ali, U., Kikumoto, M., Ciantia, M., Cui, Y., and Previtali, M.: Systematic effect of particle roundness/angularity on macro-and microscopic behavior of granular materials, Granul. Matter, 25, 51, https://doi.org/10.1007/s10035-023-01341-y, 2023. a
Bahmanpouri, F., Daliri, M., Khoshkonesh, A., Namin, M. M., and Buccino, M.: Bed compaction effect on dam break flow over erodible bed; experimental and numerical modeling, J. Hydrol., 594, 125645, https://doi.org/10.1016/j.jhydrol.2020.125645, 2021. a
Barbolini, M., Biancardi, A., Cappabianca, F., Natale, L., and Pagliardi, M.: Laboratory study of erosion processes in snow avalanches, Cold Reg. Sci. Technol., 43, 1–9, https://doi.org/10.1016/j.coldregions.2005.01.007, 2005. a
Barker, T., Rauter, M., Maguire, E. S. F., Johnson, C. G., and Gray, J. M. N. T.: Coupling rheology and segregation in granular flows, J. Fluid Mech., 909, A22, https://doi.org/10.1017/jfm.2020.973, 2021. a
Baselt, I., de Oliveira, G. Q., Fischer, J.-T., and Pudasaini, S. P.: Evolution of stony debris flows in laboratory experiments, Geomorphology, 372, 107431, https://doi.org/10.1016/j.geomorph.2020.107431, 2021. a, b
Baselt, I., de Oliveira, G. Q., Fischer, J.-T., and Pudasaini, S. P.: Deposition morphology in large-scale laboratory stony debris flows, Geomorphology, 396, 107992, https://doi.org/10.1016/j.geomorph.2021.107992, 2022. a, b, c, d, e, f
Berger, C., McArdell, B., and Schlunegger, F.: Direct measurement of channel erosion by debris flows, Illgraben, Switzerland, J. Geophys. Res.-Earth, 116, https://doi.org/10.1029/2010JF001722, 2011. a, b
Blatny, L., Gray, J. M. N. T., and Gaume, J.: A critical state μ(I)-rheology model for cohesive granular flows, J. Fluid Mech., 997, A67, https://doi.org/10.1017/jfm.2024.643, 2024. a
Cannon, S. H. and Savage, W. Z.: A Mass-Change Model for the Estimation of Debris-Flow Runout, J. Geol., 96, 221–227, https://doi.org/10.1086/629211, 1988. a
Choi, C. E. and Goodwin, S. R.: Effects of interactions between transient granular flows and macroscopically rough beds and their implications for bulk flow dynamics, Can. Geotech. J., 58, 1943–1960, https://doi.org/10.1139/cgj-2020-0160, 2021. a
Cicoira, A., Blatny, L., Li, X., Trottet, B., and Gaume, J.: Towards a predictive multi-phase model for alpine mass movements and process cascades, Eng. Geol., 310, 106866, https://doi.org/10.1016/j.enggeo.2022.106866, 2022. a
Crosta, G. B., Imposimato, S., and Roddeman, D.: Numerical modeling of 2-D granular step collapse on erodible and nonerodible surface, J. Geophys. Res., 114, https://doi.org/10.1029/2008JF001186, 2009. a, b
de Haas, T. and Van Woerkom, T.: Bed scour by debris flows: Experimental investigation of effects of debris-flow composition, Earth Surf. Proc. Land., 41, 1951–1966, https://doi.org/10.1002/esp.3963, 2016. a, b, c, d, e, f, g
de Haas, T., Braat, L., Leuven, J. R., Lokhorst, I. R., and Kleinhans, M. G.: Effects of debris flow composition on runout, depositional mechanisms, and deposit morphology in laboratory experiments, J. Geophys. Res.-Earth, 120, 1949–1972, https://doi.org/10.1002/2015JF003525, 2015. a, b
de Haas, T., Nijland, W., De Jong, S., and McArdell, B.: How memory effects, check dams, and channel geometry control erosion and deposition by debris flows, Scientific Reports, 10, 14024, https://doi.org//10.1038/s41598-020-71016-8, 2020. a
de Haas, T., McArdell, B. W., Nijland, W., Åberg, A. S., Hirschberg, J., and Huguenin, P.: Flow and Bed Conditions Jointly Control Debris–Flow Erosion and Bulking, Geophys. Res. Lett., 49, e2021GL097611, https://doi.org/10.1029/2021GL097611, 2022. a
Edwards, A., Rocha, F., Kokelaar, B., Johnson, C., and Gray, J.: Particle-size segregation in self-channelized granular flows, J. Fluid Mech., 955, A38, https://doi.org/10.1017/jfm.2022.1089, 2023. a
Edwards, A. N. and Gray, J. M. N. T.: Erosion–deposition waves in shallow granular free-surface flows, J. Fluid Mech., 762, 35–67, https://doi.org/10.1017/jfm.2014.643, 2015. a, b
Edwards, A. N., Viroulet, S., Kokelaar, B. P., and Gray, J. M. N. T.: Formation of levees, troughs and elevated channels by avalanches on erodible slopes, J. Fluid Mech., 823, 278–315, https://doi.org/10.1017/jfm.2017.309, 2017. a, b, c
Edwards, A. N., Viroulet, S., Johnson, C. G., and Gray, J. M. N. T.: Erosion-deposition dynamics and long distance propagation of granular avalanches, J. Fluid Mech., 915, A9, https://doi.org/10.1017/jfm.2021.34, 2021. a
Egashira, S., Honda, N., and Itoh, T.: Experimental study on the entrainment of bed material into debris flow, Phys. Chem. Earth Pt. C, 26, 645–650, https://doi.org/10.1016/S1464-1917(01)00062-9, 2001. a
Erlichson, H.: A Mass-Change Model for the Estimation of Debris-Flow Runout, a Second Discussion: Conditions for the Application of the Rocket Equation, J. Geol., 99, 633–634, https://doi.org/10.1086/629522, 1991. a
Estrada, N., Azéma, E., Radjai, F., and Taboada, A.: Identification of rolling resistance as a shape parameter in sheared granular media, Phys. Rev. E, 84, 011306, https://doi.org/10.1103/PhysRevE.84.011306, 2011. a
Farin, M., Mangeney, A., and Roche, O.: Fundamental changes of granular flow dynamics, deposition, and erosion processes at high slope angles: insights from laboratory experiments, J. Geophys. Res.-Earth, 119, 504–532, https://doi.org/10.1002/2013JF002750, 2014. a, b, c, d, e
Feng, Z., Fan, X., Ni, T., Deng, Y., Zou, C., Zhang, J., and Xu, Q.: How Ice Particles Increase Mobility of Rock–Ice Avalanches: Insights From Chute Flows Simulation of Granular Rock–Ice Mixtures by Discrete Element Method, J. Geophys. Res.-Earth, 128, https://doi.org/10.1029/2023JF007115, 2023. a
Frank, F., McArdell, B. W., Huggel, C., and Vieli, A.: The importance of entrainment and bulking on debris flow runout modeling: examples from the Swiss Alps, Nat. Hazards Earth Syst. Sci., 15, 2569–2583, https://doi.org/10.5194/nhess-15-2569-2015, 2015. a
Gray, J. and Ancey, C.: Particle-size and-density segregation in granular free-surface flows, J. Fluid Mech., 779, 622–668, https://doi.org/10.1017/jfm.2015.438, 2015. a
Gray, J. and Thornton, A.: A theory for particle size segregation in shallow granular free-surface flows, P. Roy. Soc. A, 461, 1447–1473, https://doi.org/10.1098/rspa.2004.1420, 2005. a
Gray, J. M. N. T.: Granular flow in partially filled slowly rotating drums, J. Fluid Mech., 441, 1–29, https://doi.org/10.1017/S0022112001004736, 2001. a
Gray, J. M. N. T.: Particle Segregation in Dense Granular Flows, Annu. Rev. Fluid Mech., 50, 407–433, https://doi.org/10.1146/annurev-fluid-122316-045201, 2018. a, b
Hungr, O.: A Mass Change Model for the Estimation of Debris Flow Runout: A Discussion, J. Geol., 98, 791, https://doi.org/10.1086/629442, 1990. a
Hungr, O. and Evans, S. G.: Entrainment of debris in rock avalanches: An analysis of a long run-out mechanism, Geol. Soc. Am. Bull., 116, 1240, https://doi.org/10.1130/B25362.1, 2004. a
Hungr, O., McDougall, S., and Bovis, M.: Entrainment of material by debris flows, in: Debris-flow hazards and related phenomena, Springer, 135–158, https://doi.org/10.1007/3-540-27129-5_7, 2005. a, b
Issler, D.: Dynamically consistent entrainment laws for depth-averaged avalanche models, J. Fluid Mech., 759, 701–738, https://doi.org/10.1017/jfm.2014.584, 2014. a
Issler, D.: Comments on “On a Continuum Model for Avalanche Flow and Its Simplified Variants” by S. S. Grigorian and A. V. Ostroumov, Geosciences, 10, 96, https://doi.org/10.3390/geosciences10030096, 2020. a
Issler, D., Gauer, P., Tregaskis, C., and Vicari, H.: Structure of equations for gravity mass flows with entrainment, Nat. Commun., 15, 4613, https://doi.org/10.1038/s41467-024-48605-6, 2024. a
Iverson, R. M.: The physics of debris flows, Rev. Geophys., 35, 245–296, https://doi.org/10.1029/97RG00426, 1997. a
Iverson, R. M.: Elementary theory of bed-sediment entrainment by debris flows and avalanches, J. Geophys. Res.-Earth, 117, https://doi.org/10.1029/2011JF002189, 2012. a, b, c, d
Iverson, R. M.: Scaling and design of landslide and debris-flow experiments, Geomorphology, 244, 9–20, https://doi.org/10.1016/j.geomorph.2015.02.033, 2015. a
Iverson, R. M. and Denlinger, R. P.: Flow of variably fluidized granular masses across three-dimensional terrain: 1. Coulomb mixture theory, J. Geophys. Res., 106, 537–552, https://doi.org/10.1029/2000JB900329, 2001. a, b
Iverson, R. M. and LaHusen, R.: Friction in Debris Flows: Inferences from Large-scale Flume Experiments, in: Hydraulic engineering '93, edited by: Shen, H. W., American Society of Civil Engineers, New York, NY, 1604–1609, ISBN 0872629201, 1993. a
Iverson, R. M. and Ouyang, C.: Entrainment of bed material by Earth–surface mass flows: Review and reformulation of depth–integrated theory, Rev. Geophys., 53, 27–58, https://doi.org/10.1002/2013RG000447, 2015. a, b, c
Iverson, R. M., Reid, M. E., Logan, M., LaHusen, R. G., Godt, J. W., and Griswold, J. P.: Positive feedback and momentum growth during debris-flow entrainment of wet bed sediment, Nat. Geosci., 4, 116–121, https://doi.org/10.1038/NGEO1040, 2011. a, b, c, d, e, f, g
Jiang, Y., Song, P., Choi, C. E., and Choo, J.: Erosion and Transport of Dry Soil Bed by Collisional Granular Flow: Insights From a Combined Experimental–Numerical Investigation, J. Geophys. Res.-Earth, 128, e2023JF007073, https://doi.org/10.1029/2023JF007073, 2023. a
Johnson, C., Kokelaar, B., Iverson, R. M., Logan, M., LaHusen, R., and Gray, J.: Grain-size segregation and levee formation in geophysical mass flows, J. Geophys. Res.-Earth, 117, https://doi.org/10.1029/2011JF002185, 2012. a, b
Kokelaar, B. P., Graham, R. L., Gray, J. M. N. T., and Vallance, J. W.: Fine-grained linings of leveed channels facilitate runout of granular flows, Earth Planet. Sc. Lett., 385, 172–180, https://doi.org/10.1016/j.epsl.2013.10.043, 2014. a
Kokelaar, B. P., Bahia, R. S., Joy, K. H., Viroulet, S., and Gray, J. M. N. T.: Granular avalanches on the Moon: Mass–wasting conditions, processes, and features, J. Geophys. Res.-Planet., 122, 1893–1925, https://doi.org/10.1002/2017JE005320, 2017. a, b
Komatsu, T. S., Inagaki, S., Nakagawa, N., and Nasuno, S.: Creep motion in a granular pile exhibiting steady surface flow, Phys. Rev. Lett., 86, 1757–1760, https://doi.org/10.1103/PhysRevLett.86.1757, 2001. a, b
Kyburz, M. L., Sovilla, B., Bühler, Y., and Gaume, J.: Potential and challenges of depth-resolved three-dimensional MPM simulations: a case study of the 2019 `Salezer' snow avalanche in Davos, Ann. Glaciol., 65, e19, https://doi.org/10.1017/aog.2024.14, 2025. a
Lanzoni, S., Gregoretti, C., and Stancanelli, L. M.: Coarse–grained debris flow dynamics on erodible beds, J. Geophys. Res.-Earth, 122, 592–614, https://doi.org/10.1002/2016JF004046, 2017a. a
Lanzoni, S., Gregoretti, C., and Stancanelli, L. M.: Coarse-grained debris flow dynamics on erodible beds, J. Geophys. Res.-Earth, 122, 592–614, https://doi.org/10.1002/2016JF004046, 2017b. a, b
Li, P., Hu, K., and Wang, X.: Debris flow entrainment rates in non-uniform channels with convex and concave slopes, J. Hydraul. Res., 56, 156–167, https://doi.org/10.1080/00221686.2017.1313321, 2018. a
Li, P., Wang, J.-d., Hu, K.-h., Qiu, H.-j., and Xie, J.-l.: Experimental investigation on debris flow resistance and entrainment characteristics: effects of the erodible bed with discontinuous grading, J. Mt. Sci., 19, 2397–2419, https://doi.org/10.1007/s11629-022-7365-y, 2022. a, b
Li, X., Sovilla, B., Gray, J. M. N. T., and Gaume, J.: Transient wave activity in snow avalanches is controlled by entrainment and topography, Communications Earth & Environment, 5, 77, https://doi.org/10.1038/s43247-023-01157-x, 2024. a
Liu, H., Zhao, X., Frattini, P., Crosta, G. B., De Blasio, F. V., Wan, Y., and Zhu, X.: Mobility and erosion of granular flows travelling on an erodible substrate: Insights from the small-scale flume experiments, Eng. Geol., 326, 107316, https://doi.org/10.1016/j.enggeo.2023.107316, 2023. a
Lloyd, H. A., Maguire, E., Mistry, D., Reynolds, G. K., Johnson, C. G., and Gray, J. M. N. T.: On the formation of super-stable granular heaps, J. Fluid Mech., 1002, A27, https://doi.org/10.1017/jfm.2024.1106, 2025. a
Lu, P.-y., Yang, X.-g., Xu, F.-g., Hou, T.-x., and Zhou, J.-w.: An analysis of the entrainment effect of dry debris avalanches on loose bed materials, SpringerPlus, 5, 1621, https://doi.org/10.1186/s40064-016-3272-4, 2016. a
Maguire, E., Barker, T., Rauter, M., Johnson, C. G., and Gray, J. M. N. T.: Particle-size segregation patterns in a partially filled triangular rotating drum, J. Fluid Mech., 979, A40, https://doi.org/10.1017/jfm.2023.1022, 2024. a
Mangeney, A.: Landslide boost from entrainment, Nat. Geosci., 4, 77–78, https://doi.org/10.1038/ngeo1077, 2011. a
Mangeney, A., Bouchut, F., Thomas, N., Vilotte, J. P., and Bristeau, M. O.: Numerical modeling of self–channeling granular flows and of their levee–channel deposits, J. Geophys. Res., 112, https://doi.org/10.1029/2006JF000469, 2007a. a, b
Mangeney, A., Tsimring, L., Volfson, D., Aranson, I. S., and Bouchut, F.: Avalanche mobility induced by the presence of an erodible bed and associated entrainment, Geophys. Res. Lett., 34, https://doi.org/10.1029/2007GL031348, 2007b. a, b, c
Mangeney, A., Roche, O., Hungr, O., Mangold, N., Faccanoni, G., and Lucas, A.: Erosion and mobility in granular collapse over sloping beds, J. Geophys. Res.-Earth, 115, https://doi.org/10.1029/2009JF001462, 2010. a, b, c, d
McCoy, S., Kean, J. W., Coe, J. A., Tucker, G., Staley, D. M., and Wasklewicz, T.: Sediment entrainment by debris flows: In situ measurements from the headwaters of a steep catchment, J. Geophys. Res.-Earth, 117, https://doi.org/10.1029/2011JF002278, 2012. a, b, c
McDougall, S. and Hungr, O.: Dynamic modelling of entrainment in rapid landslides, Can. Geotech. J., 42, 1437–1448, https://doi.org/10.1139/t05-064, 2005. a
Medina, V., Hürlimann, M., and Bateman, A.: Application of FLATModel, a 2D finite volume code, to debris flows in the northeastern part of the Iberian Peninsula, Landslides, 5, 127–142, https://doi.org/10.1007/s10346-007-0102-3, 2008. a
Mergili, M., Jaboyedoff, M., Pullarello, J., and Pudasaini, S. P.: Back calculation of the 2017 Piz Cengalo–Bondo landslide cascade with r.avaflow: what we can do and what we can learn, Nat. Hazards Earth Syst. Sci., 20, 505–520, https://doi.org/10.5194/nhess-20-505-2020, 2020. a
Munch, J., Zhuang, Y., Dash, R. K., and Bartelt, P.: Dynamic Thermomechanical Modeling of Rock–Ice Avalanches: Understanding Flow Transitions, Water Dynamics, and Uncertainties, J. Geophys. Res.-Earth, 129, e2024JF007805, https://doi.org/10.1029/2024JF007805, 2024. a
Pandey, N. K. and Satyam, N.: Entrainment-driven morphological changes in debris flow deposits by varying water content at laboratory scale, B. Eng. Geol. Environ., 84, 1–24, https://doi.org/10.1007/s10064-025-04241-y, 2025. a
Papa, M., Egashira, S., and Itoh, T.: Critical conditions of bed sediment entrainment due to debris flow, Nat. Hazards Earth Syst. Sci., 4, 469–474, https://doi.org/10.5194/nhess-4-469-2004, 2004. a
Parez, S. and Aharonov, E.: Long runout landslides: a solution from granular mechanics, Frontiers in Physics, 3, 80, https://doi.org/10.3389/fphy.2015.00080, 2015. a
Parsons, J. D., Whipple, K. X., and Simoni, A.: Experimental study of the grain-flow, fluid-mud transition in debris flows, J. Geol., 109, 427–447, 2001. a
Peng, C., Li, X., Yuan, C., and Huang, Y.: Insights Into the Dynamics of Rock–Ice Avalanches From Small–Scale Experiments With Erodible Beds, J. Geophys. Res.-Earth, 130, e2025JF008303, https://doi.org/10.1029/2025JF008303, 2025. a
Pouliquen, O. and Forterre, Y.: Friction law for dense granular flows: application to the motion of a mass down a rough inclined plane, J. Fluid Mech., 453, 133–151, https://doi.org/10.1017/S0022112001006796, 2002. a
Pudasaini, S. P. and Fischer, J.-T.: A mechanical erosion model for two-phase mass flows, Int. J. Multiphas. Flow, 132, 103416, https://doi.org/10.1016/j.ijmultiphaseflow.2020.103416, 2020. a, b
Pudasaini, S. P. and Krautblatter, M.: The mechanics of landslide mobility with erosion, Nat. Commun., 12, 6793, https://doi.org/10.1038/s41467-021-26959-5, 2021. a, b, c, d, e
Pudasaini, S. P. and Miller, S. A.: The hypermobility of huge landslides and avalanches, Eng. Geol., 157, 124–132, https://doi.org/10.1016/j.enggeo.2013.01.012, 2013. a, b
Reid, M. E., Iverson, R. M., Logan, M., Lahusen, R. G., Godt, J. W., and Griswold, J. P.: Entrainment of bed sediment by debris flows: results from large-scale experiments, In: 5th International Conference on Debris- Flow Hazards: Mitigation Mechanics, Prediction and Assessment, edited by: Genevois, R., Padua, Italy, 14–17 June 2011, Rome: Casa Editrice Università La Sapienza (Italian Journal of Engineering Geology and Environment), 367–374, 2011. a, b, c, d
Rickenmann, D.: Empirical relationships for debris flows, Nat. Hazards, 19, 47–77, 1999. a
Rocha, F. M., Johnson, C. G., and Gray, J. M. N. T.: Self-channelisation and levee formation in monodisperse granular flows, J. Fluid Mech., 876, 591–641, https://doi.org/10.1017/jfm.2019.518, 2019. a, b, c, d
Roelofs, L., Colucci, P., and de Haas, T.: How debris-flow composition affects bed erosion quantity and mechanisms: An experimental assessment, Earth Surf. Proc. Land., 47, 2151–2169, https://doi.org/10.1002/esp.5369, 2022. a
Roelofs, L., Nota, E. W., Flipsen, T. C., Colucci, P., and de Haas, T.: How bed composition affects erosion by debris flows – An experimental assessment, Geophys. Res. Lett., 50, e2023GL103294, https://doi.org/10.1029/2023GL103294, 2023. a, b, c, d
Russell, A. S., Johnson, C. G., Edwards, A. N., Viroulet, S., Rocha, F. M., and Gray, J. M. N. T.: Retrogressive failure of a static granular layer on an inclined plane, J. Fluid Mech., 869, 313–340, https://doi.org/10.1017/jfm.2019.215, 2019. a, b
Santi, P. M., DeWolfe, V. G., Higgins, J. D., Cannon, S. H., and Gartner, J. E.: Sources of debris flow material in burned areas, Geomorphology, 96, 310–321, https://doi.org/10.1016/j.geomorph.2007.02.022, 2008. a
Sanvitale, N. and Bowman, E. T.: Visualization of dominant stress-transfer mechanisms in experimental debris flows of different particle-size distribution, Can. Geotech. J., 54, 258–269, https://doi.org/10.1139/cgj-2015-0532, 2017. a
Savage, S. B. and Hutter, K.: The motion of a finite mass of granular material down a rough incline, J. Fluid Mech., 199, 177, https://doi.org/10.1017/S0022112089000340, 1989. a, b
Savage, S. B. and Lun, C. K. K.: Particle size segregation in inclined chute flow of dry cohesionless granular solids, J. Fluid Mech., 189, 311–335, https://doi.org/10.1017/S002211208800103X, 1988. a
Takahashi, T.: Debris flow, IAHR monograph series, Balkema, Rotterdam, ISBN 9054101040, 1991. a, b
Takahashi, T.: Debris flow: Mechanics, prediction, and countermeasures, CRC Press, Boca Raton, Florida, 2nd edn., ISBN 9781138000070, 2014. a, b
Taylor-Noonan, A. M., Bowman, E. T., McArdell, B. W., Kaitna, R., McElwaine, J. N., and Take, W. A.: Influence of pore fluid on grain-scale interactions and mobility of granular flows of differing volume, J. Geophys. Res.-Earth, 127, e2022JF006622, https://doi.org/10.1029/2022JF006622, 2022. a, b
Tian, M., Hu, K.-h., Ma, C., and Lei, F.-h.: Effect of bed sediment entrainment on debris-flow resistance, J. Hydraul. Eng., 140, 115–120, https://doi.org/10.1061/(ASCE)HY.1943-7900.0000805, 2014. a
Tripathi, A. and Khakhar, D.: Density difference-driven segregation in a dense granular flow, J. Fluid Mech., 717, 643–669, https://doi.org/10.1017/jfm.2012.603, 2013. a
Viroulet, S., Edwards, A. N., Johnson, C. G., Kokelaar, B. P., and Gray, J. M. N. T.: Shedding dynamics and mass exchange by dry granular waves flowing over erodible beds, Earth Planet. Sc. Lett., 523, 115700, https://doi.org/10.1016/j.epsl.2019.07.003, 2019. a, b
Wetter, C., Walter, F., McArdell, B. W., Blumenschein, F., Spielmann, R., Aaron, J., Gray, J. M. N. T., Obermann, A., and Fichtner, A.: Formation, propagation, and annihilation of surge waves in debris flows, Eng. Geol., 367, 108648, https://doi.org/10.1016/j.enggeo.2026.108648, 2026. a
Wetterauer, K.: Experimental data on the flow evolution and deposit morphology of dry granular flows over contrasting erodible bed materials, Open Data UniBw M [data set], https://doi.org/10.60776/XRQ8K1, 2026. a
Woodhouse, M. J., Thornton, A. R., Johnson, C. G., Kokelaar, B. P., and Gray, J. M. N. T.: Segregation-induced fingering instabilities in granular free-surface flows, J. Fluid Mech., 709, 543–580, https://doi.org/10.1017/jfm.2012.348, 2012. a
Yang, D., Qiu, H., Quevedo, R. P., Liu, Y., and Glade, T.: Birchgletscher rock-ice avalanche burying the village of Blatten on 28 May 2025, Valais, Switzerland, Landslides, 23, 283–291, https://doi.org/10.1007/s10346-025-02656-y, 2026. a
Zhang, S.-l., Gao, Y., Yin, Y.-p., Roelofs, L., Wang, W.-p., Hu, X.-w., and Li, B.: Erosion and entrainment in dry granular flows: Insights from large-scale experiments, Eng. Geol., 372, 108966, https://doi.org/10.1016/j.enggeo.2026.108966, 2026. a, b, c, d, e, f, g, h, i, j
Zheng, H., Shi, Z., Yu, S., Fan, X., Hanley, K. J., and Feng, S.: Erosion mechanisms of debris flow on the sediment bed, Water Resour. Res., 57, e2021WR030707, https://doi.org/10.1029/2021WR030707, 2021. a
Zheng, H., Hu, X., Shi, Z., McArdell, B. W., and de Haas, T.: Volumetric growth of debris flow on erodible bed by basal shear and collision: Theory and observations, Earth Planet. Sc. Lett., 662, 119404, https://doi.org/10.1016/j.epsl.2025.119404, 2025. a
Zhou, G. G. and Ng, C. W.: Dimensional analysis of natural debris flows, Can. Geotech. J., 47, 719–729, https://doi.org/10.1139/T09-134, 2010. a
Zhu, L., Tang, X., He, S., Yang, Z., Liang, H., Lei, X., Luo, Y., and Zhang, L.: Geomorphology and Sedimentology of the Nyixoi Chongco Rock Avalanche and Implications for Emplacement Mechanisms, J. Geophys. Res.-Earth, 130, e2024JF007666, https://doi.org/10.1029/2024JF007666, 2025. a