
the Creative Commons Attribution 4.0 License.
the Creative Commons Attribution 4.0 License.
 | 17 Sep 2026
Ballistic projectile hazard of major explosions and paroxysms at Stromboli (Italy) with uncertainty quantification – Part 2: Conditional and temporal probability maps
Andrea Bevilacqua

Patrizia Landi
Paola Del Carlo
Massimo Pompilio
Peter Baxter
This study presents the first probability hazard maps of the areas potentially affected by ballistic fallout from major explosions and paroxysms at Stromboli, based on mathematical analyses of the extensive historical and recent records of its explosive activity. This novel approach develops and integrates three statistical models that describe ballistic fallout patterns under different assumptions and considering the associated uncertainty. Model 1 mirrors the areas observed to be affected in the past, whereas Models 2 and 3 address data under-sampling and morphological/dynamics changes assuming independency between ballistic distance and dispersal direction. By combining these models, robust and conservative ballistic fallout hazard maps are produced for major explosions and paroxysms, and for the two categories combined together by assuming a relative proportion. The new combined maps highlight the most exposed areas of the island and quantify the probability of being affected in the case of a major explosion or paroxysm. For instance, the NE trails at 600 m would have ≈ 25 % probability of ballistic fallout, while the Labronzo trail ≈ 8 % and 5 % probability at 400 and 290 m, respectively; the entire village of Ginostra would be affected with ≈ 3 % probability. Combining such maps with a temporal model of occurrence of the events, first probability maps of ballistic fallout in the next 10 and 50 years are presented. Results are limitedly influenced by mapping uncertainties and by the assumed proportion between major explosions and paroxysms. These findings open the way to individual and societal risk assessments for this phenomenon at Stromboli.
- Article
(36620 KB) - Full-text XML
- Companion paper
-
Supplement
(5416 KB) - BibTeX
- EndNote


Ballistic projectiles are one of the main hazards associated with explosive volcanic activity (Wilson, 1972). In fact, ballistics are the most frequent cause of deadly incidents within a 5 km range of active volcanoes worldwide, particularly those popular with tourists, such as Galeras (Colombia), Popocatepetl (Mexico), Yasur (Vanuatu), Tongariro (New Zealand), Ontake and Shinmoedake (Japan) (Maeno et al., 2013; Brown et al., 2017; Fitzgerald et al., 2018). In addition, ballistic projectiles can damage buildings and infrastructures (Biass et al., 2016; Williams et al., 2017; Massaro et al., 2022), and ignite fires (Turchi et al., 2020; Guardo et al., 2024; Iacono et al., 2025).
Stromboli (Italy) is a 3 × 4 km volcanic island strongly affected by ballistic hazard (Barberi et al., 1993; Rosi et al., 2013). The volcano reaches a height of 924 m above sea level and is characterized by a distinctive horseshoe-shaped depression known as Sciara del Fuoco in the NW sector of the volcano, and another smaller depression to the SE, called Rina Grande (Fig. 1). For many centuries, at least since the early Middle Ages (e.g., Rosi et al., 2000, 2013; Re et al., 2025), the volcano has shown almost continuous explosive activity centered in several craters within a relatively leveled area, called Crater Terrace and situated at approximately 750 m elevation atop Sciara del Fuoco, as depicted in Fig. 1. Hazardous ballistics are mostly generated during major explosions and paroxysms that interrupt the persistent mild Strombolian activity of the volcano (Barberi et al., 1993; Bertagnini et al., 2011; Rosi et al., 2013; Bevilacqua et al., 2020a).
The hazardous area affected by large ballistic projectiles was originally considered the main distinguishing factor for differentiating between ordinary activity, major explosions, and paroxysms (Barberi et al., 1993; Pompilio et al., 2010; Rosi et al., 2013; Bevilacqua et al., 2020a). However, several studies utilized alternative definitions of major explosions and paroxysms based on geophysical monitoring signals (e.g., Genco and Ripepe, 2010; Calvari et al., 2021; Ripepe et al., 2021) or satellite observations (e.g., Corradino et al., 2021; Laiolo et al., 2026), which had the advantage of automatizing the classification process, but also neglect the actual extent of the hazardous phenomena. Several studies also correlated the plume height and the erupted volume/mass to the different types of explosions, and indicated the presence of low-porphyritic magma as an important marker of the major explosions and paroxysms (Pioli et al., 2014; Métrich et al., 2021; Voloschina et al., 2023 and references therein).
In this study we adopted the original classification based on the areas affected by ballistic fallout because it is naturally related to the associated hazard under consideration. This area is confined to the Crater Terrace and the upper Sciara del Fuoco during ordinary activity, extends to the summit area of the volcano and the Sciara del Fuoco during major explosions, and can reach down to lower elevations across much of the island, sometimes even extending beyond the shoreline, during paroxysms.
This phenomenon represents a direct peril not only for the hundreds of tourists climbing the volcano for short periods of time, but also for the volcanological guides and the scientists who are exposed to this hazard much longer, and the small communities living along the island coast that live full-time on the volcano.
Ballistic hazard has been mostly described by using two different approaches: (1) data analyses relying on field work and past observations such as the distribution of ballistics ejected in previous explosions (Bertagnini et al., 1999, 2008; Coltelli et al., 2000; Rosi et al., 2006; Andronico and Pistolesi, 2010; Pistolesi et al., 2011; Giordano and De Astis, 2021; Andronico et al., 2021); (2) numerical simulation of ballistic trajectories thus relying on the complex reconstruction of the explosion dynamics and the associated source conditions (Fitzgerald et al., 2014; Alatorre-Ibargüengoitia et al., 2016; Bertin, 2017; Bernard, 2018).
In the former approach, a limited dataset on the ballistic distribution would produce poor results with very large uncertainty. Impulsive volcanic explosions that eject ballistic bombs (as those occurring at Stromboli) are usually made of multiple oriented blasts and different events usually affect significantly different areas. Moreover, the lack of data in the less accessible sectors of the volcano (such as Sciara del Fuoco at Stromboli), or due to bad meteorological conditions, could be significant. In fact, the inhabited areas and the hiking paths shown in Fig. 1 represent the firstly accessible and most frequently observed parts of Stromboli Island. Then, some additional pathways were active in the past, for example a second hiking trail on the SW flank, over Ginostra village, and a trail that followed the coastline from Stromboli to Ginostra, opposite to Sciara del Fuoco. However, during field surveys the volcanologists can leave the hiking trails and inspect the steep unvegetated areas. Well-known viewpoints and occasional boat surveys allow the periodical observation of regions that are not directly accessible. Therefore, most of the island is relatively accessible to the field surveys, or it is at least occasionally observed, resulting in a great amount of information on ballistic distributions at Stromboli.
Vice versa, in the latter approach based on numerical models, the complex dynamics of the gas-particle interactions occurring in the explosion can have a major effect on the reconstruction of the input conditions and therefore on the trajectories of the ejecta (de' Michieli Vitturi et al., 2010; Konstantinou, 2015; Taddeucci et al., 2017; Rosi et al., 2018; Massaro et al., 2022). Moreover, in both approaches, the structures of the jet and the direction of the ballistics can be strongly affected by the ever-changing morphology of the active craters and shallow conduits, and by the variable explosive dynamics (Ogden et al., 2007; Esposti Ongaro et al., 2008; Vanderkluysen et al., 2012; Valentine et al., 2012; Carcano et al., 2013; Taddeucci et al., 2013; Tsunematsu et al., 2015; Graettinger et al., 2015). Neither one of these two approaches has ever been thoroughly applied to Stromboli in the construction of quantitative probabilistic hazard maps.
In this work, we aim at developing probabilistic hazard maps of this phenomenon at Stromboli that are entirely based on the statistical analysis of the large amount of information on the areas affected by ballistic fallout from past explosive activity of the volcano, and also consider the effect of some main sources of uncertainty. Notably, we did not perform numerical modeling of the ejecta, which would require the accurate knowledge of the flow conditions of the explosive mixture at the source. Input information is described in detail in a companion study (Bevilacqua et al., 2026) and briefly summarized in the following sections.
We rely on data analysis of the distance, direction and area affected by ballistic particles of a considerable number of major explosions (43 events) and paroxysms (24 events) occurred at Stromboli, in order to define first probability hazard maps of ballistic dispersal. In particular, the models we developed are doubly stochastic in the sense that they allow to carefully quantify the effects of the uncertain reconstruction of past ballistic projectiles distributions (Sparks and Aspinall, 2004; Marzocchi and Bebbington, 2012; Bevilacqua et al., 2015). In fact, the maps are represented using ill-constrained information, treated as a random array, and we separately estimate this epistemic uncertainty from the aleatoric probability model of future phenomena (Bebbington, 2013; Bevilacqua et al., 2016, 2018).
In Sect. 2 we briefly describe the input data and information from the companion study (Bevilacqua et al., 2026a). In Sect. 3 we describe the approach and models adopted to produce the hazard maps by Monte Carlo simulation, and to statistically combine the maps associated with major explosions and paroxysms. In Sect. 4 we present the ballistics probability maps of the two distinct categories of major explosions and paroxysms, the combined map of the two categories (major explosions plus paroxysms), as well as the probability curves at various distances from the craters and elevations above sea level for the most relevant cases investigated. Finally, in Sect. 5 we present examples of ballistic hazard assessments incorporating the hourly probability estimates of major explosions and paroxysms at Stromboli as computed by a temporal model of occurrence of these phenomena.
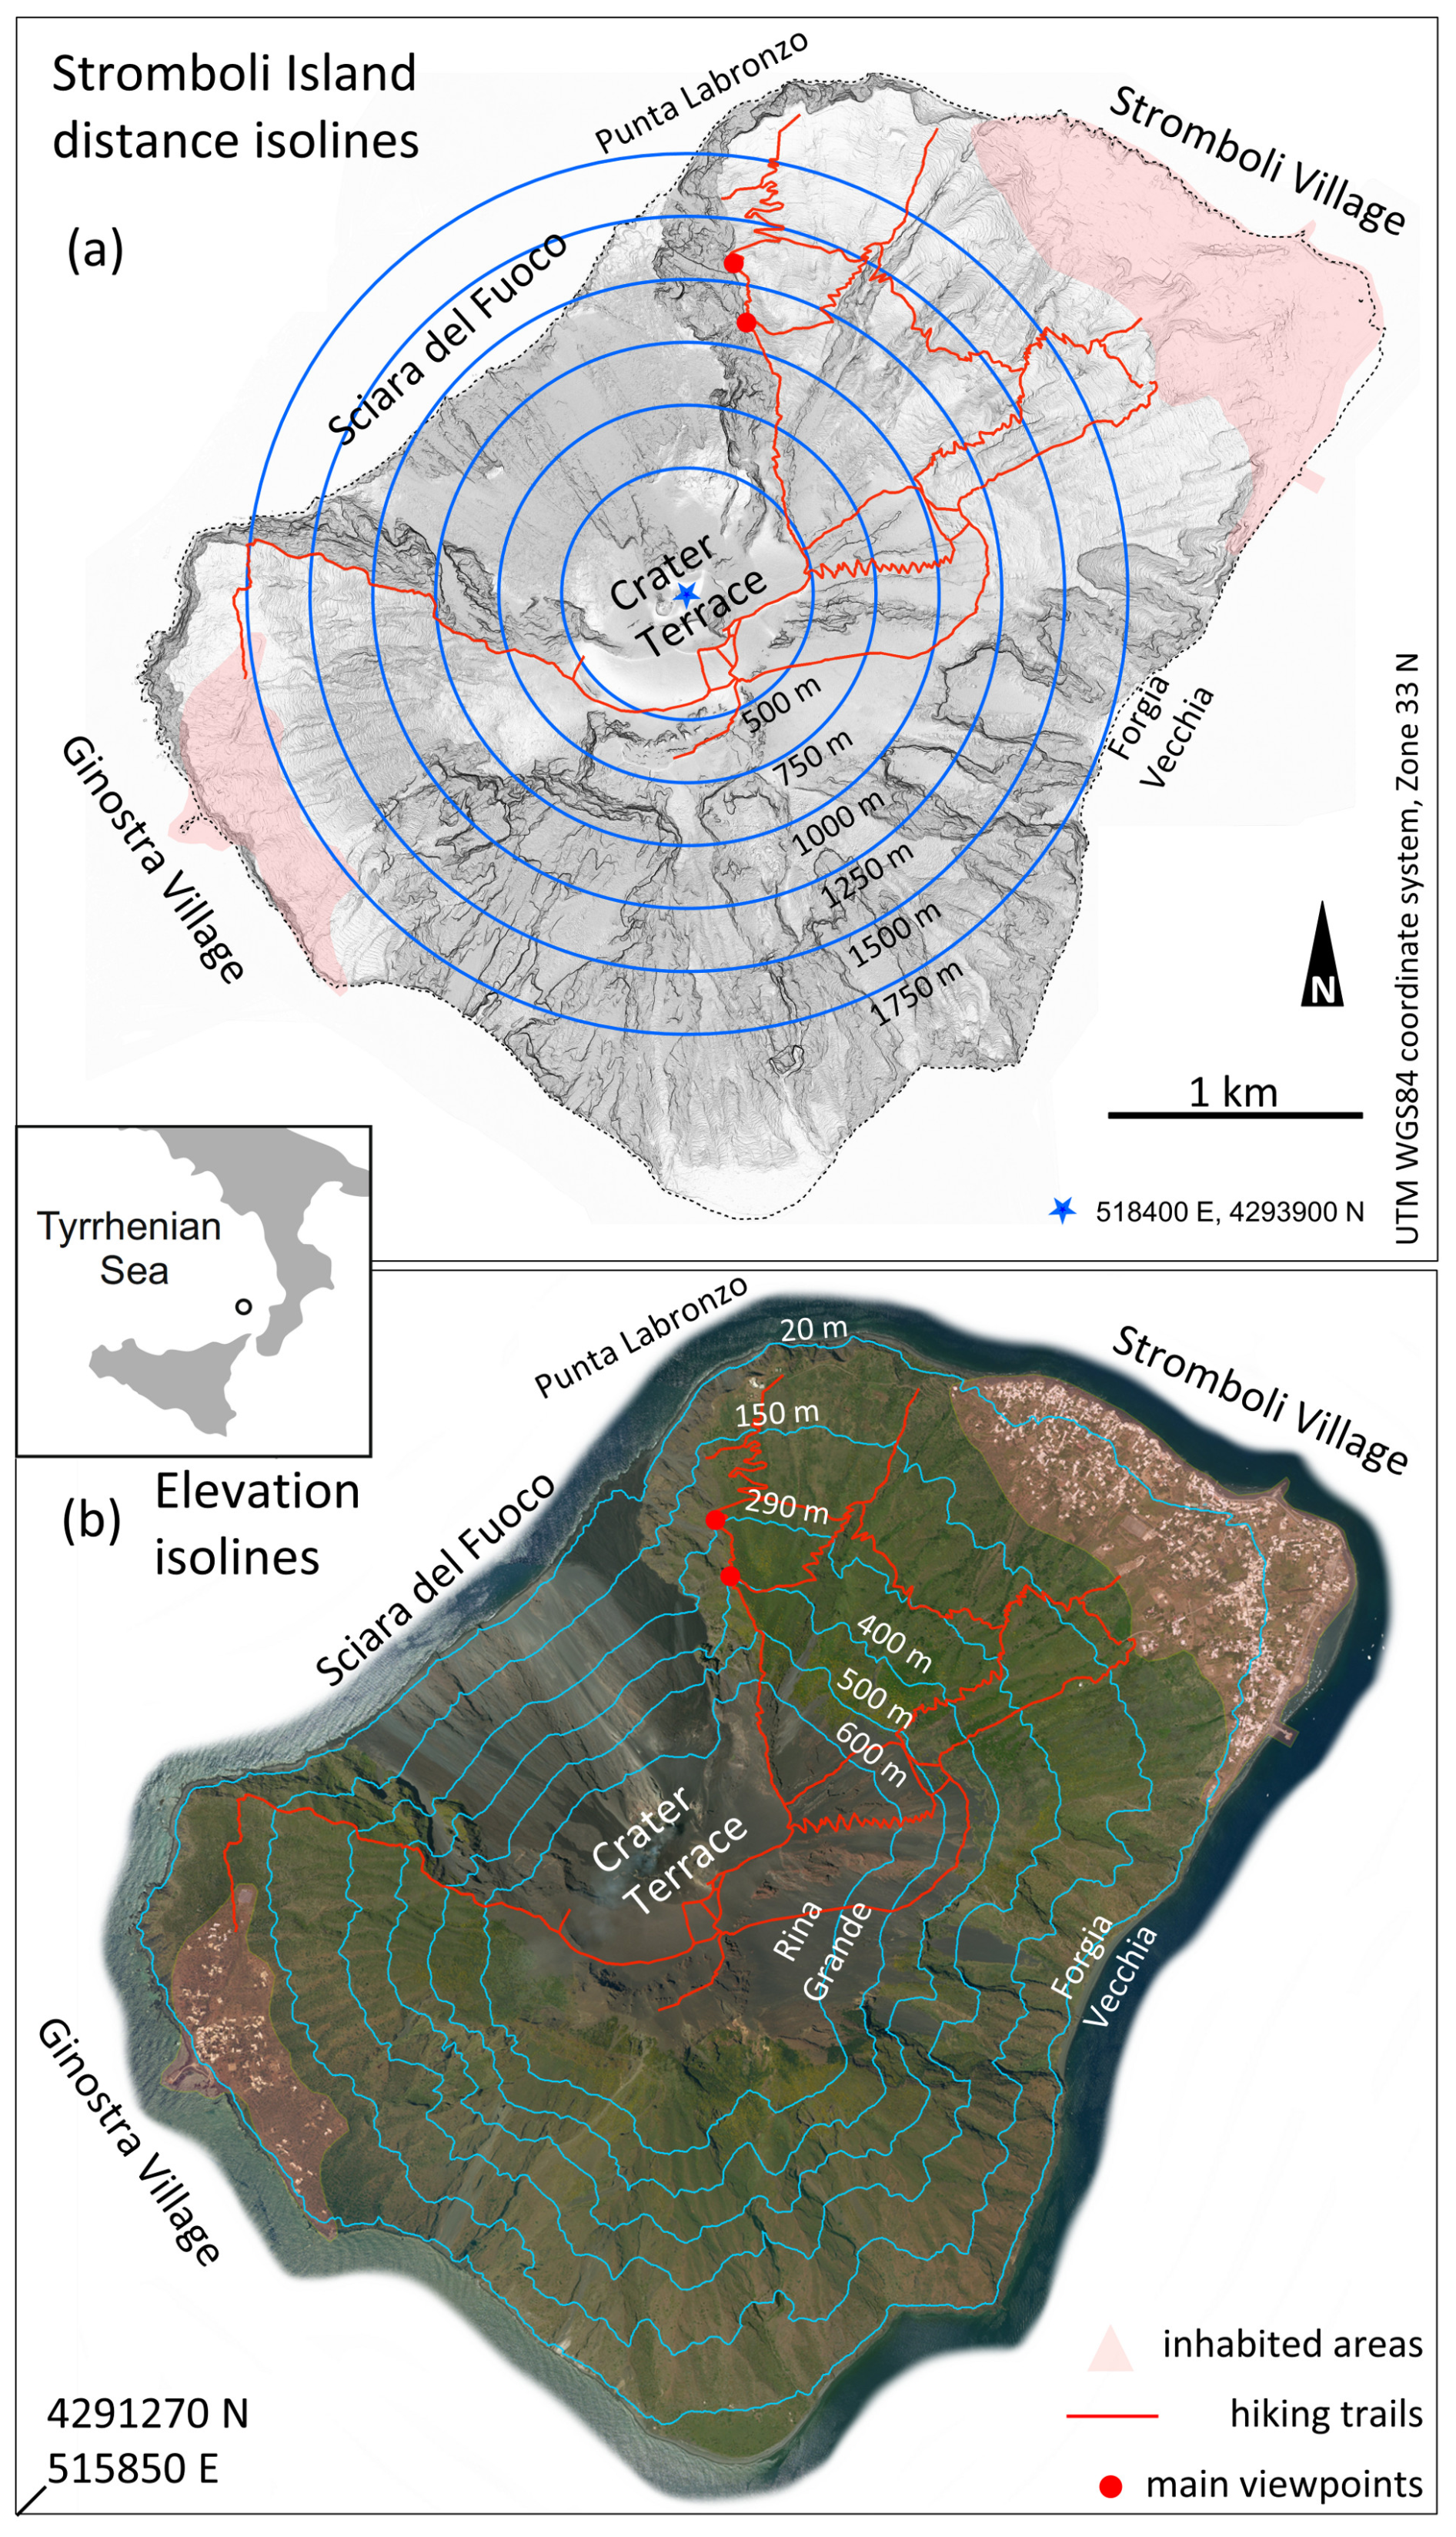
Figure 1Overview of the island of Stromboli. (a) shows a vertical shaded relief and distance isolines from 500 to 1750 m with respect to the center of the Crater Terrace (blue star). (b) shows a satellite/aerial photo orthomosaic and a selection of isohypses. Red dots mark the main viewpoints accessed by tourists and volcanological guides, climbing trails are reported in red, and inhabited areas are shaded in pink.
To construct the hazard maps illustrated in the Results section, we relied on the mapping method and data analysis described in companion study Bevilacqua et al. (2026a). The main assumptions and limitations of this study were: (i) we used all available ground and remote observations of past events, without any assumption on the conditions of the explosive mixture at the source or relying on descriptive models of projectile dynamics; (ii) the focus was on the description of the lithic and scoria clasts larger than 5–10 cm in diameter, a range related to the uncertainty affecting observations, while smaller clasts and pumice fallout were not considered due to their lower impact energies; (iii) the areal density of the projectiles on the ground, which can vary by up to 2 orders of magnitude mostly based on distance from the crater, was not considered in the analysis (Gurioli et al., 2013; Breard et al., 2014; Bisson et al., 2023; Bevilacqua et al., 2024a); as a consequence, our hazard maps refer to the probability to be in an area affected by ballistic fallout if a major explosion or a paroxysm occur.
Based on such assumptions, schematic maps of ballistic projectile fallout were constructed as described in Bevilacqua et al. (2026a). In each simplified map, a proximal axisymmetric part was defined, in addition to 1 to 3 circular sectors, with greater distance ranges, describing the fallout areas. Figure S1 in the Supplement reports a selection of twelve maps, six major explosions and six paroxysms, exemplifying different distances and directions reached by ballistic projectiles, and showing estimates of distances, directions, and of their uncertainties. In particular, the ith circular sector of the jth explosion is fully described by the radial distance Dij, the azimuth angle of the bisector αij, and the width angle Wij. In this representation, the width of the axisymmetric part is defined as the complementary to 360° of the union of the (1 to 3) directional sectors. Figure S2 shows the distributions of the distances and of the directions and widths of all the circular sectors of the major explosions and the paroxysms data. See Bevilacqua et al. (2026a) for more details on these circular sectors and their uncertainties.
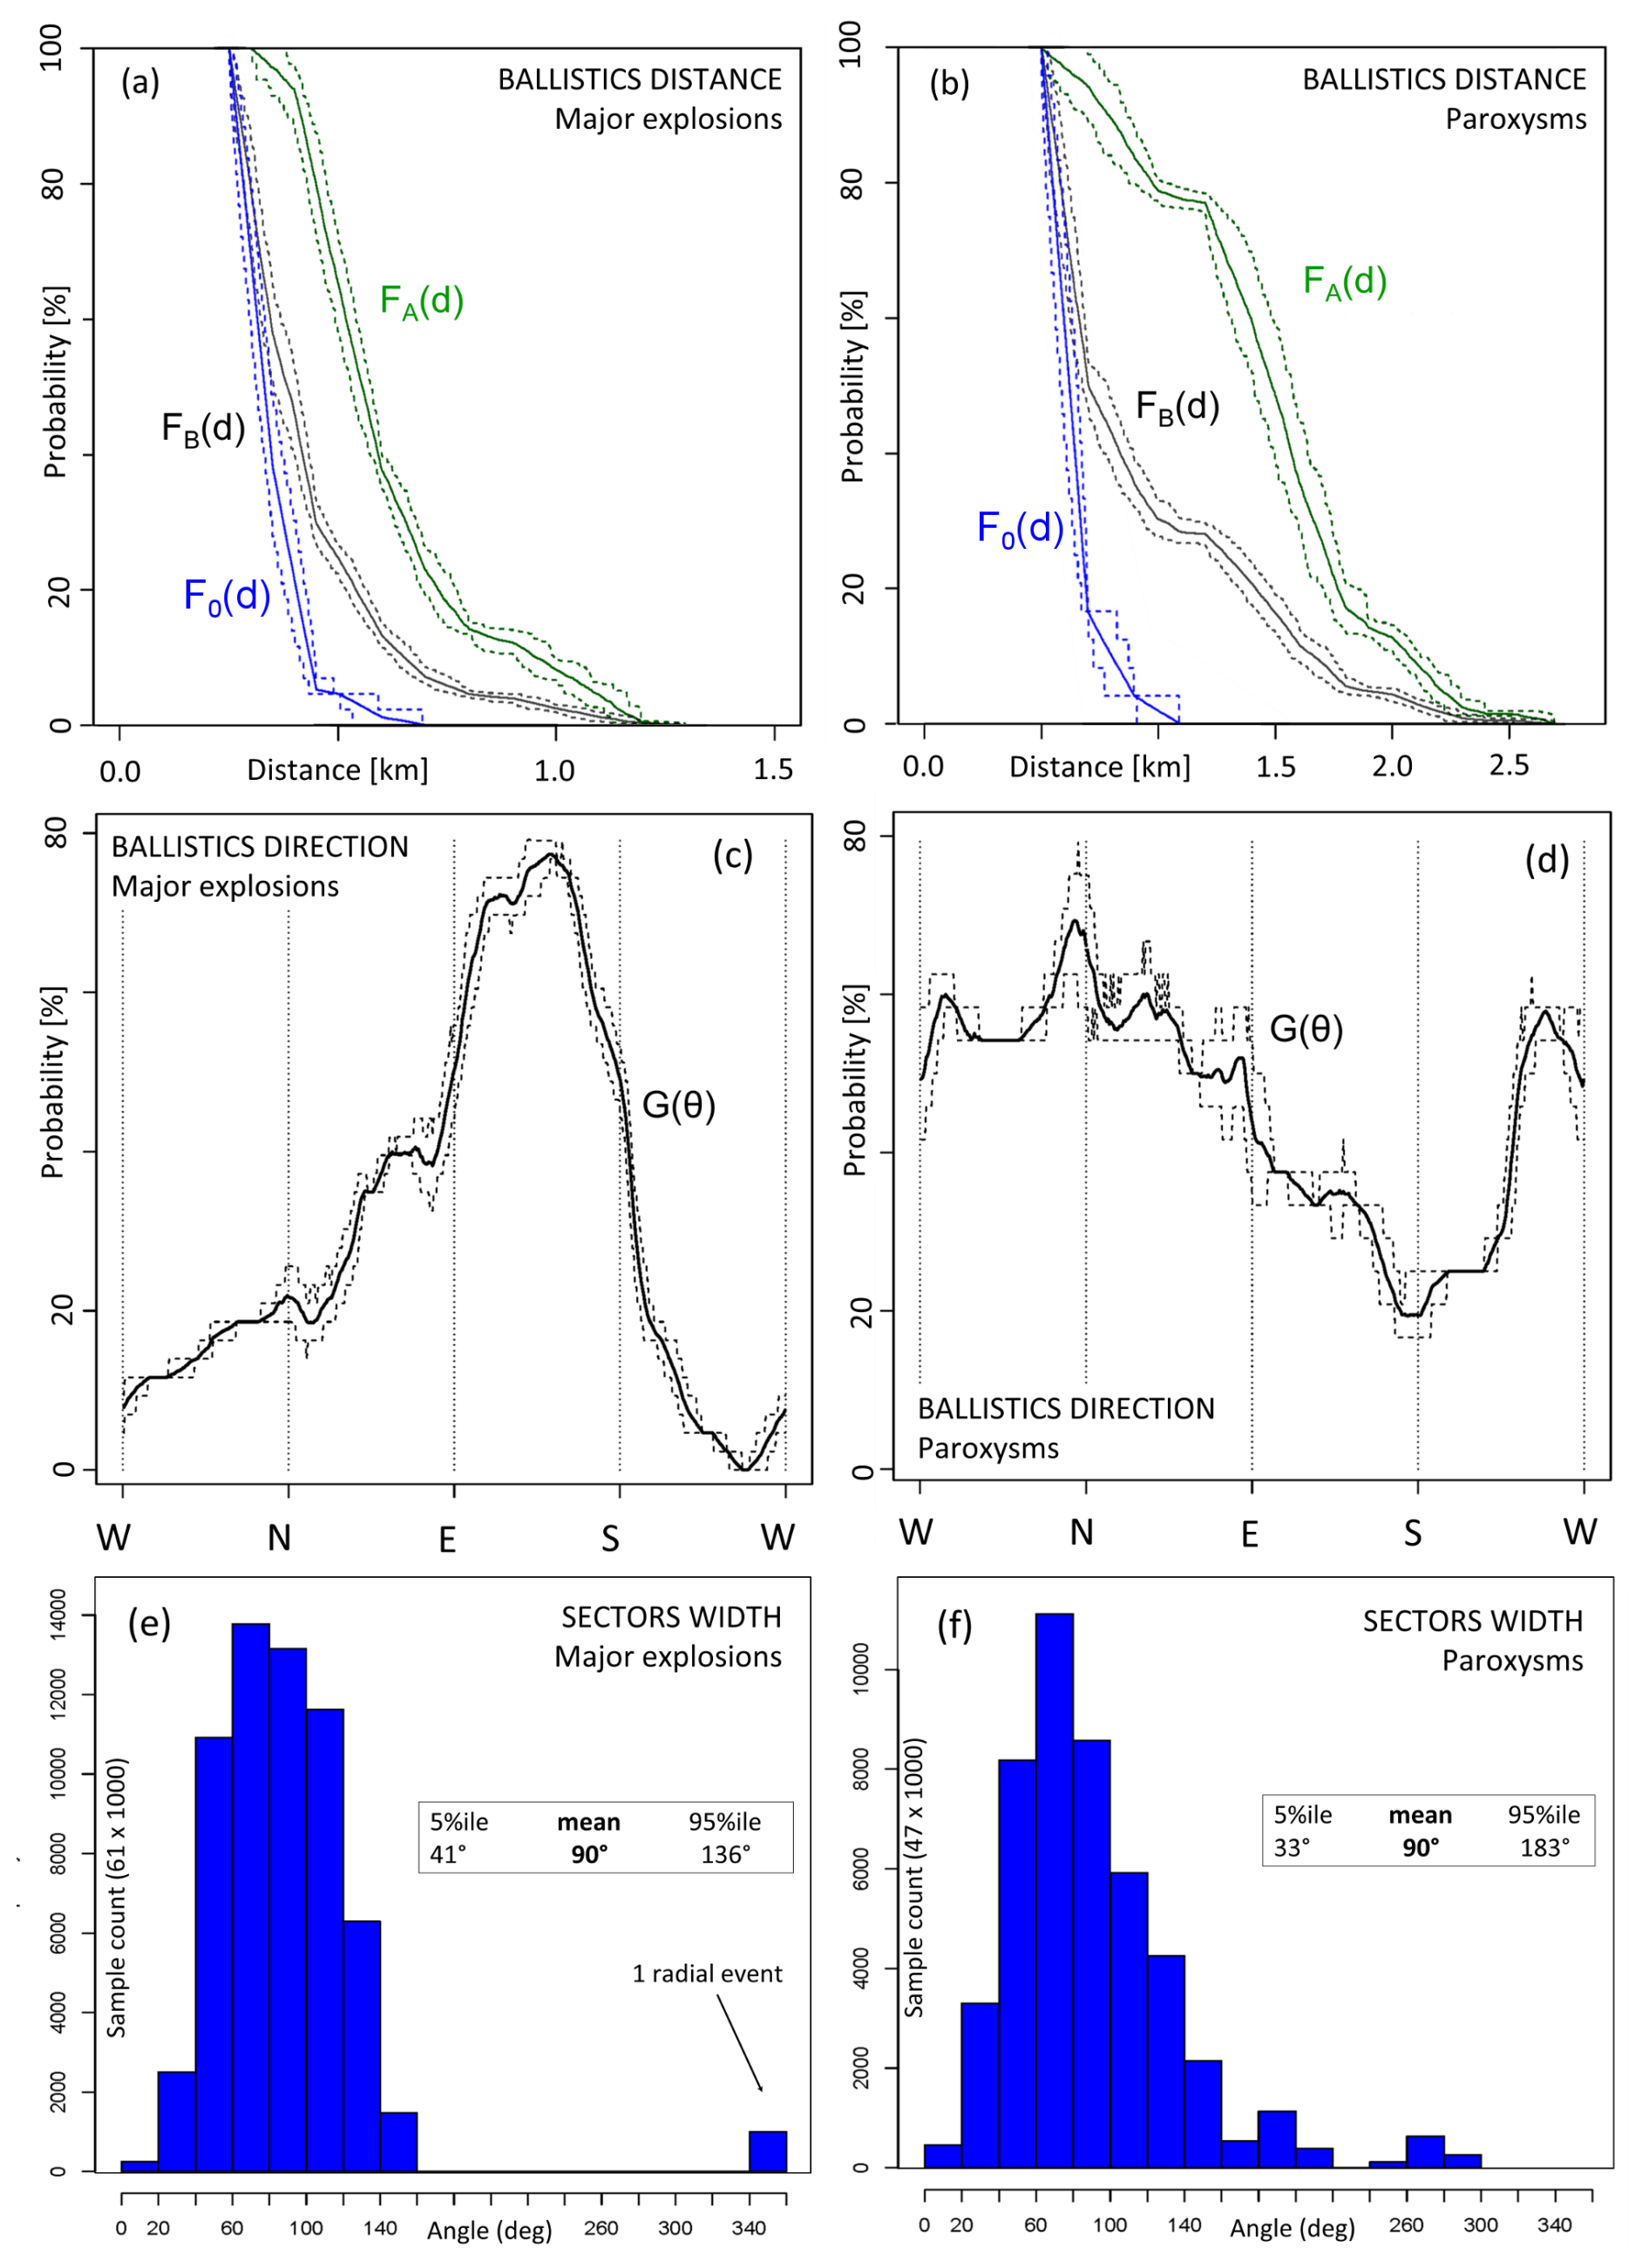
Figure 2Summary of the data analysis from Bevilacqua et al. (2026b). (a, b) Exceedance probability functions of the ballistic distances in all directions (including, FB, and not including, FA, the axisymmetric part F0); (c, d) ballistic direction probability percentage based on estimates from all circular sectors; (e, f) histograms of the widths of all circular sectors. (a), (c), (e) are related to major explosions, and (b), (d), (f) to paroxysms. Dashed lines in (a), (b), (c), (d) highlight uncertainty intervals between 5th and 95th percentile values due to the uncertainty in the mapping of ballistic dispersal areas.
Figure 2 summarizes the main data analysis outcomes for both major explosions and paroxysms: the exceedance probability functions of the ballistic distances in all directions (including and not the axisymmetric part) (Fig. 2a, b); the ballistic direction probability percentage based on estimates from all directional circular sectors (Fig. 2c, d); the histograms of the widths of all directional circular sectors (Fig. 2e, f). It should be noted that these analyses are conditional on the occurrence of the related type of phenomenon, i.e., major explosions or paroxysms.
As regards the ballistic distances, Fig. 2a shows, for the major explosions, a probability of 25 % ± 2.0 % to meet or exceed 500 m, of 6.0 % ± 1.0 % to meet or exceed 750 m, and of 2.5 % ± 0.5 % to meet or exceed 1000 m. Figure 2b, for the paroxysms, shows a probability of 31 % ± 2.5 % to meet or exceed 1000 m, of 16.5 % ± 4.0 % to meet or exceed 1500 m, and of 4.5 % ± 1.0 % to meet or exceed 2000 m, 0.5 % ± 0.2 % to meet or exceed 2500 m. In both cases, by excluding the proximal axisymmetric part we obtain probabilities to reach a given distance up to 3 times higher with respect to the case with the axisymmetric part included.
As regards the ballistic direction, in Fig. 2c, the probability function of the ballistics directions for major explosions has a maximum of 77 % ± 2 % at 140° E ± 10°, i.e., in the SE direction, and a minimum of 0 % at 250° E ± 10°, i.e., in the SW direction. In Fig. 2d, for the paroxysms, the probability function has a maximum of 70 % ± 9 % at 355° E ± 10°, i.e., in the N direction, and a minimum of 19 % ± 2 % at 175° E ± 10°, i.e., in the S direction. A plateau above 50 % is also observed from NE to W clockwise.

Figure 3Bivariate plots of the distance, direction, and width of the circular sectors affected by ballistic fallout in the considered major explosions and paroxysms. The grey lines highlight the uncertainty considered, while the colored dots indicate the recorded values. The 8 greater distances recorded for the major explosions and the 14 for the paroxysms are also labeled. Different hues indicate different uncertainty classes (blue: low, azure: intermediate, green: high); see Bevilacqua et al. (2026a) for more details.
Then, as regards the sector width, i.e. the spread of the azimuth angle being impacted, Fig. 2e shows that, for major explosions, the mean width value is 90°, with 5th percentile of 41° and 95th percentile of 136°, while, in Fig. 2f, for the paroxysms, the mean width value is again 90°, with 5th percentile of 33° and 95th percentile of 183°. However, the total areas affected by paroxysms are 4 to 6 times larger than those of major explosions although the distribution of the areas affected is continuous between the two categories (more details in the companion paper Bevilacqua et al., 2026a). All these categorical data are tabulated in the Supplements to Bevilacqua et al. (2026a).
The three parameters of distance, azimuthal direction, and width of the described circular sectors determine our simplified representation of the areas affected by ballistic projectiles. However, these tree parameters are not fully described through their 1D distributions, and in Fig. 3 we plotted their bivariate plots, which highlight some distinctive patterns. In particular, Fig. 3a shows that the greatest distances of major explosions are observed between N and ESE, and Fig. 3b shows that those of the paroxysms are clustered in two groups oriented to the NNE and WSW. In addition, Fig. 3c and d indicate that, as expected at constant explosion energy, the greatest distances tend to correspond to lower widths, especially for the paroxysms. Finally in Fig. 3e and f the lower widths are clustered towards ESE for the major explosions, NNE and WSW for the paroxysms, confirming their correlation with the greater distances.
It should be noted that major explosions and paroxysms significantly differ in terms of their predominant directions of ballistic dispersal. A possible reason is that the most frequented trails and inhabited areas are the easiest places to survey in the hours/days after the explosions, and their directions roughly include those of peak probability of major explosions and paroxysms, respectively (see the hiking trails in Fig. 1). Nevertheless, physical reasons for these asymmetries are also possible, because the paroxysms involve deeper parts of the conduits and are able to re-shape the craters more greatly and deeply than major explosions, as discussed in the companion study Bevilacqua et al. (2026a).
For this motivation, in the production of robust and conservative hazard maps it was very important to develop ad hoc methods to mitigate potential recording biases superimposed to actual asymmetric patterns, as described in this study.
3.1 Monte Carlo simulation of the areas affected by ballistic projectiles
Three complementary models were developed to produce the probabilistic ballistic hazard maps presented in the Results section. These models differ in the way they statistically combine the distributions of directions and distances of ballistic projectiles. The spatial domain was parameterized in polar coordinates (d, θ) in [0, +∞) × [0, 360°], i.e., the distance and the direction with respect to a center located at 518400 E, 4293900 N, UTM WGS84, Zone 33N, that is approximately the center of the Crater Terrace. Notably, the involvement of distinct and/or multiple craters in the different events is not explicitly considered here as such variability is included in the considered azimuthal and radial uncertainties; in fact, all vents are generally located within ca. 100–150 m from this center (more details in Bevilacqua et al., 2026a).
Every model provides a spatial function H(k)(d, θ), with , that estimates the probability to be in an area affected by ballistic fallout. All these estimates are conditional on the occurrence of a major explosion or paroxysm and are time-homogeneous in the way they account for past events data. The main scripts are available in Bevilacqua and Neri (2026).
The first model, called Model 1, is the most obvious and directly utilizes the spatial frequency of past events, accounting for the observed dependency between distance and direction. Specifically, at each point (d, θ) in the map, we estimate the percentage of explosions that affected that point. That is:
where Sj is the total area affected by the ballistic projectiles of the jth explosion, and N is the total number of the explosions in the dataset. This approach assumes that distance and direction of ballistic projectiles are not independent, and their correlation is represented by the past events maps in Bevilacqua et al. (2026a).
The second model, called Model 2, samples the direction and distance independently. In other words, in Model 2 both the distances and the directions are based on past events maps, but we assume there is not a link between the direction of the projectiles and the distance they reach. Therefore, this model allows for combining distances and directions not as jointly observed in the past events. In this way it is possible to consider the effect of specific directional conditions that combine the average distance distribution with the most likely angular directions of dispersal. In Model 2, for every angle θ in [0, 360°], the ballistic direction probability, also reported in Fig. 2c, d, is:
where αij and Wij are the bisector azimuth and the width values of the ith sector of the jth explosion, and N is the total number of the explosions in the dataset.
For every d>0, we define FA(d), reported in Fig. 2a ,b, as the exceedance probability function of the ballistic distances calculated by not including the proximal axisymmetric part, and F0(d) the exceedance probability function by only considering the axisymmetric part. Then, for every (d, θ) in the map, we define:
The last model, called Model 3, simply considers the exceedance probability function of the ballistic distances in all directions. Therefore, in Model 3 we assume that the directions and the distances of the ballistics are independent and that the directions are uniformly distributed on a full angle. Thus, this model provides an averaged probability also towards the less accessible and possibly under recorded zones. In Model 3, for every d>0, the exceedance probability function of the ballistic distances is calculated as:
where j is uniformly sampled in 1,…, N, and i is sampled among the number of sectors of explosion jth, by including the proximal axisymmetric part and weighted in proportion to . In these expressions, N is the total number of the explosions in the dataset and Wij is the width of the sector. For every (d, θ) in the map, we define:
Also the function FB(d) is reported in Fig. 2a, b (cases with axisymmetric part included).
It should be noted that Model 2 and Model 3 redistribute the probabilities of Model 1: their probability values can be either lower or greater than the spatial frequency of past events. In particular, the total sum of the probabilities of Model 3 coincide by construction with those of Model 1, while the total sum of Model 2 can slightly differ, because the circular sectors are evaluated separately from the proximal axisymmetric parts. However, as better presented in the results section, the total difference between the sum of Model 2 and the sum of Model 1 (or 3) is, expressed in percentage, ca. −2 % for major explosions, and +12 % for the paroxysms, indicating relatively small variations.
Finally, in order to adopt a conservative and robust approach against possible particularly directional dispersal and data under-sampling in the least accessible areas, we have produced maps by considering the point wise maximum of the three Models (), i.e.,:
We also adopted a doubly stochastic approach to account for the effect of the uncertainty of the ballistic dispersal maps generated (Bevilacqua, 2016). In particular, we considered the effect of the uncertain definition of distances and directions of ballistic dispersal during past explosions. By following the detailed descriptions in Bevilacqua et al. (2026a), the calculation of the probability maps was performed in a Monte Carlo simulation that randomly changes the simplified maps of past events. Such a procedure generates ensembles of probability maps, represented in terms of mean and 5th and 95th percentile values (Neri et al., 2015; Bevilacqua et al., 2017; Rutarindwa et al., 2019; Aravena et al., 2023).
3.2 Probabilistic combination of the two categories of major explosions and paroxysms
As presented above, the description of major explosions and paroxysms rely on two different datasets, i.e., Bevilacqua et al. (2023) for major explosions from January 1970 to October 2023, and Bevilacqua et al. (2020b, 2023) for paroxysms from January 1879 to October 2023. Therefore, in the Results sections these two categories are initially treated separately in order to describe their associated hazard with respect to ballistics. We also produced a probabilistic combination of these two categories. This is justified by two main reasons: (1) the evidence that we cannot know a priori the type of the next future event and (2) the finding that the main parameters describing the ballistic dispersal, such as the distance, width and area distributions of the two categories are remarkably continuous, thus indicating the absence of a net separation between the two categories (Bevilacqua et al., 2026a).
The combination of these two categories was done by estimating the relative frequency of major explosions and paroxysms using the data from the two catalogs (see Table S1 in the Supplement). Specifically, the paroxysms accounted for pA=7.3 % of events between 1970 and 2023, and for pB=12 % of events between 2003 and 2023 (a more conservative estimate). These estimates have both been made after excluding all the uncertain major explosions, i.e., major explosions insufficiently described in terms of their ballistic distribution, which could have been also an expression of relatively ordinary activity. Including uncertain major explosions would have decreased the paroxysm percentage of ca. , i.e., between 2003 and 2023.
The difference between pA and pB is due to the fact that only 5 paroxysms occurred after 1970: their time series is irregular and characterized by temporal clusters and a 44-year gap between 1959 and 2003 (Bevilacqua et al., 2020a). Therefore, the fraction of the number of paroxysms over the number of major explosions drops down if we include the time interval between 1970 and 2003. However, the same ratio grows to ca. 19 % if evaluated on the longer time interval from 1879 to 2023, even after we included all the uncertain major explosions, possibly because of under recording of major explosions before 1960 (see Bevilacqua et al., 2026a). Therefore, we assumed that pB=12 % as a relatively robust (see Discussion) and conservative estimate of this important scale parameter.
As a consequence, for every Model , the combined model is defined as:
where p is equal to pA or pB.
We finally note that for the combined model M, which considers in each spatial point the maximum values between Model 1, 2 and 3 holds:
because the dominant model for the major explosions can differ from the dominant model for the paroxysms, depending on the location. In the following, we will always show the outcomes of the formulation (d, θ).

Figure 4Mean probability maps of ballistic projectiles from major explosions (a, c, e) and paroxysms (b, d, f). In (a) and (b) Model 1 is applied, in (b) and (c) Model 2 and in (e) and (f) Model 3. Estimates are conditioned on the occurrence of either a major explosion or a paroxysm, respectively. Colors and contour lines indicate percentage values. In the background is a vertical shaded relief map from the 2012 LiDAR data (MASE, 2013; Di Traglia et al., 2020).
4.1 Ballistics probability maps of major explosions and paroxysms
Figure 4 shows the mean probability maps of ballistic projectiles fallout according to Models 1, 2 and 3, and by considering separately major explosions and paroxysms. All the maps represent the mean values with respect to epistemic uncertainty considered.
-
Major explosions: Model 1 (Fig. 4a) describes the distribution of the ballistic particles as obtained from the reconstruction of past events. The probability curves clearly show a predominant dispersal towards NE. In more detail, the contours below 35 % are all significantly asymmetric towards NE, on the slopes above 400 m a.s.l., whereas the contours over 35 % are slightly asymmetric towards SE, on the upper portion of Rina Grande. In Model 2 (Fig. 4c), the distribution of probability is significantly different from that of Model 1 and all contours are asymmetric towards SE, affecting the whole Rina Grande area above 400 m a.s.l. Finally, Model 3 (Fig. 4e) assumes an axisymmetric distribution of the area affected by ballistics. In this case the 35 % contour is over ca. 700 m elevation except towards Sciara del Fuoco. A notable difference between the three models is that the trails at 600 m elevation to the NE of the summit, over 750 m from the craters, are affected 10 % of the times under Model 2 and Model 3, and ca. 20 % according to Model 1.
-
Paroxysms: in Model 1 (Fig. 4b) all the probability contours are asymmetric towards NE and WSW, with the 35 % contours enclosing regions at ca. 300 m a.s.l. above Ginostra and Stromboli villages. Contours up to 10 %–20 % also affect the village of Ginostra whereas the village of Stromboli is affected by probabilities between 2 % and 5 %. For Model 2 (Fig. 4d) all the contours above 35 % are widely asymmetric towards N with the 35 % contour enclosing similar zones to Model 1, but also the entire Sciara del Fuoco; Ginostra experiences values between 5 % and 10 %. Finally, Model 3 (Fig. 4f) is symmetrically distributed with the 35 % contour at 500 m a.s.l. towards NE and WSW (above the villages) and at ca. 700 m a.s.l. to the S; the 2 % contour includes the whole island with the only exception of the most NE part of the Stromboli village. Again, some major differences are evident between the three Models: for example, Ginostra village, over 1750 m from the craters, is affected 2 %–5 % of the time under Model 3, 5 %–10 % according to Model 2, and even above 20 % by assuming Model 1, on average.

Figure 5Difference between mean probability maps of ballistic projectiles: (a) and (b) are Model 1 minus Model 2, (c) and (d) are Model 3 minus Model 1, and (e) and (f) are Model 3 minus Model 2. (a), (c), (e) are related to major explosions, and (b), (d), (f) to paroxysms. Colors and contour lines indicate differences in percentage values. Blue regions indicate where Model 1 is greater, red regions where it is Model 2, and green regions where it is Model 3. In the background is a vertical shaded relief map from the 2012 LiDAR data (MASE, 2013; Di Traglia et al., 2020).
Figure 5 shows in more detail the differences between the mean probability maps of ballistic projectiles after Model 1, 2 and 3, for both major explosions and paroxysms. Regarding major explosions, Fig. 5a, c, e, illustrate that Model 1 dominates towards the NE direction, Model 2 dominates towards the SE direction, whereas Model 3, which axisymmetric, relatively dominates towards W. In all cases the differences between all pairs of Models are up to ca. 15 %.
As regards the paroxysms, Fig. 5b, d, f, show that Model 1 dominates towards NE and WSW, Model 2 mostly dominates towards NW, i.e., in the Sciara del Fuoco, whereas Model 3 relatively dominates towards S. Also for paroxysms, the differences in the mean values between each pair of Models are also up to ca. 15 %.
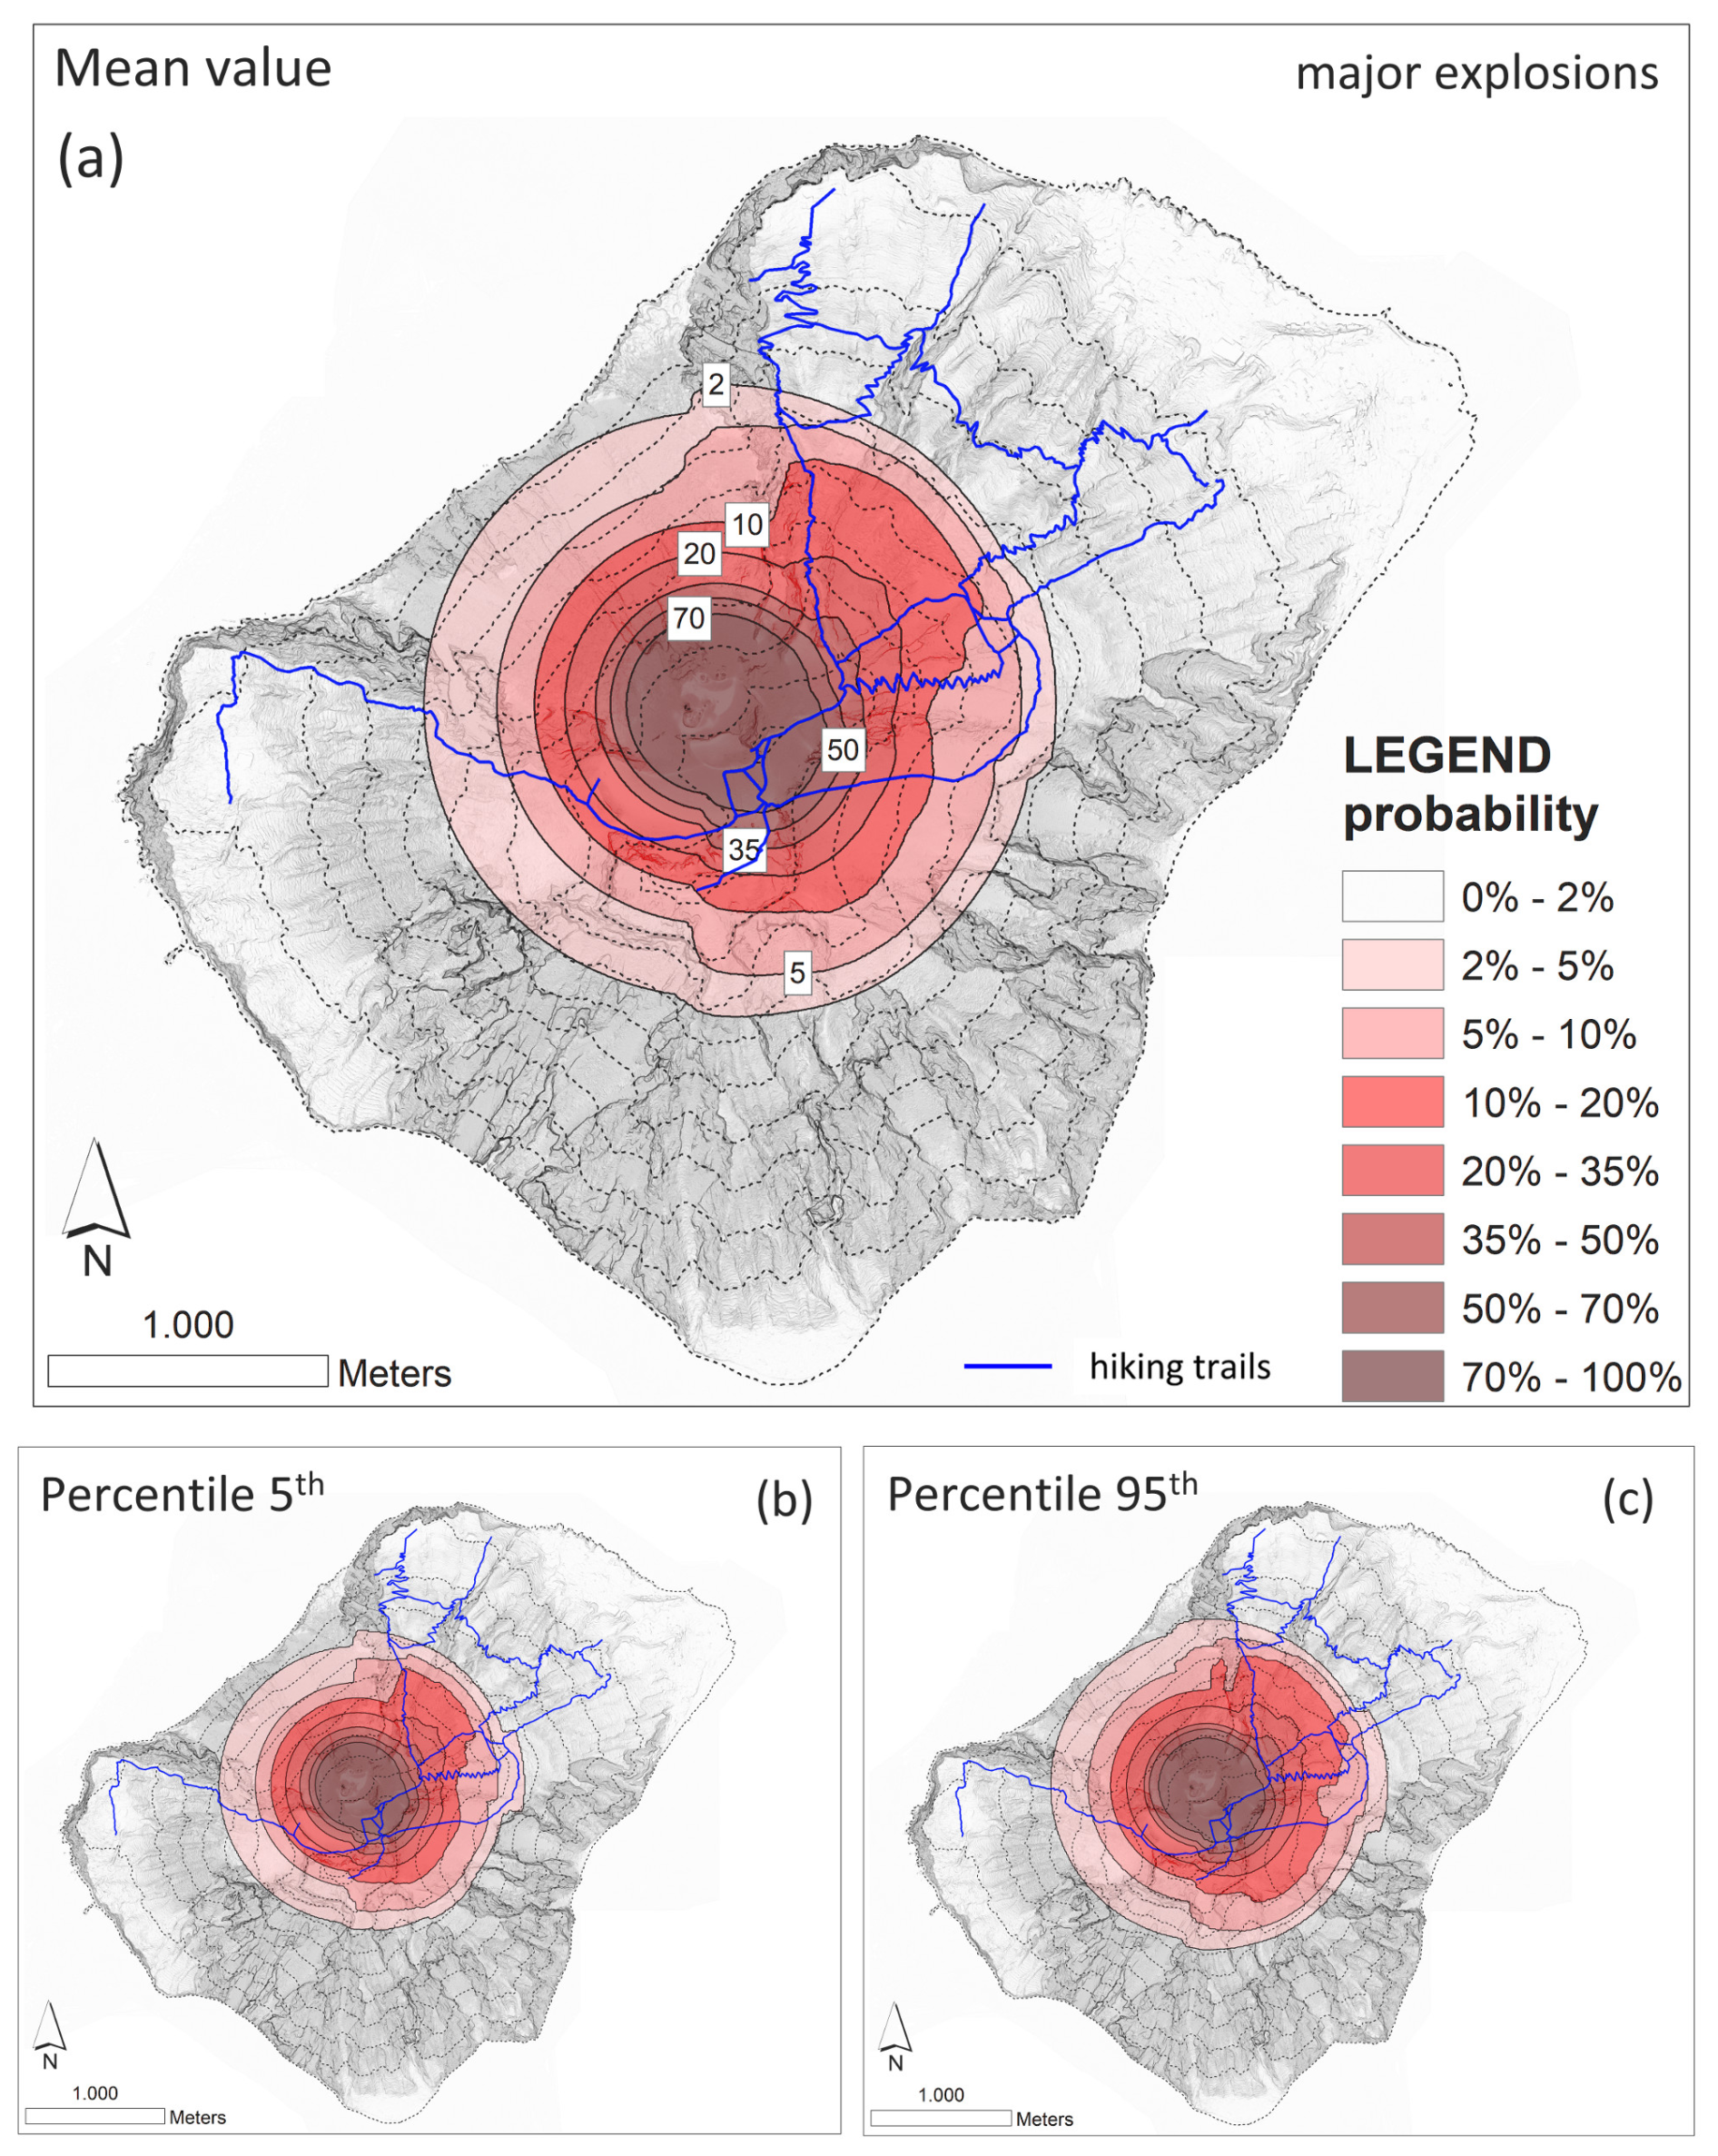
Figure 6(a) Mean and (b, c) 5th and 95th percentiles probability maps of the areas affected by ballistic projectiles fallout from major explosions assuming in each spatial point the maximum values between Model 1, Model 2, and Model 3. Estimates are conditioned on the occurrence of a major explosion. Colors and contour lines indicate percentage values as shown in the legend. In the background is a vertical shaded relief of the island from the 2012 LiDAR data (MASE, 2013; Di Traglia et al., 2020).
Figures 6 and 7 show the mean values and the 5th and 95th percentile values probability maps of ballistic projectiles from major explosions and paroxysms, respectively, according to the doubly stochastic formulation described in Sect. 3.1. These maps refer to the maximum values between Models 1, 2, and 3, i.e., H(M)(d, θ) as in Eq. (6).
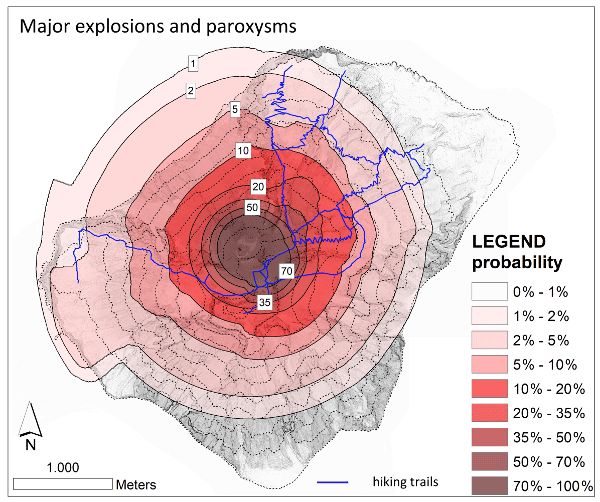
In the mean map of major explosions, shown in Fig. 6a, the 10 % contour is asymmetrical towards E, and particularly towards NE, enclosing the slopes above Stromboli village above ca. 450 m a.s.l. and the Rina Grande above ca. 550 m a.s.l. However, the 2 % contour is almost symmetrically distributed with a radius of about 1 km and just a minor asymmetry in the E halfplane.
In the mean map of paroxysms, presented in Fig. 7a, instead the 10 % contour encloses the lower slopes above Stromboli village at ca. 100 m a.s.l., and, towards WSW, almost the entire Ginostra village is affected by probability above 20 %. Moreover, during the paroxysms, the sea in front of Sciara del Fuoco is affected ca. 40 % of the times near the shoreline, and ca. 5 % at 1 km distance offshore.
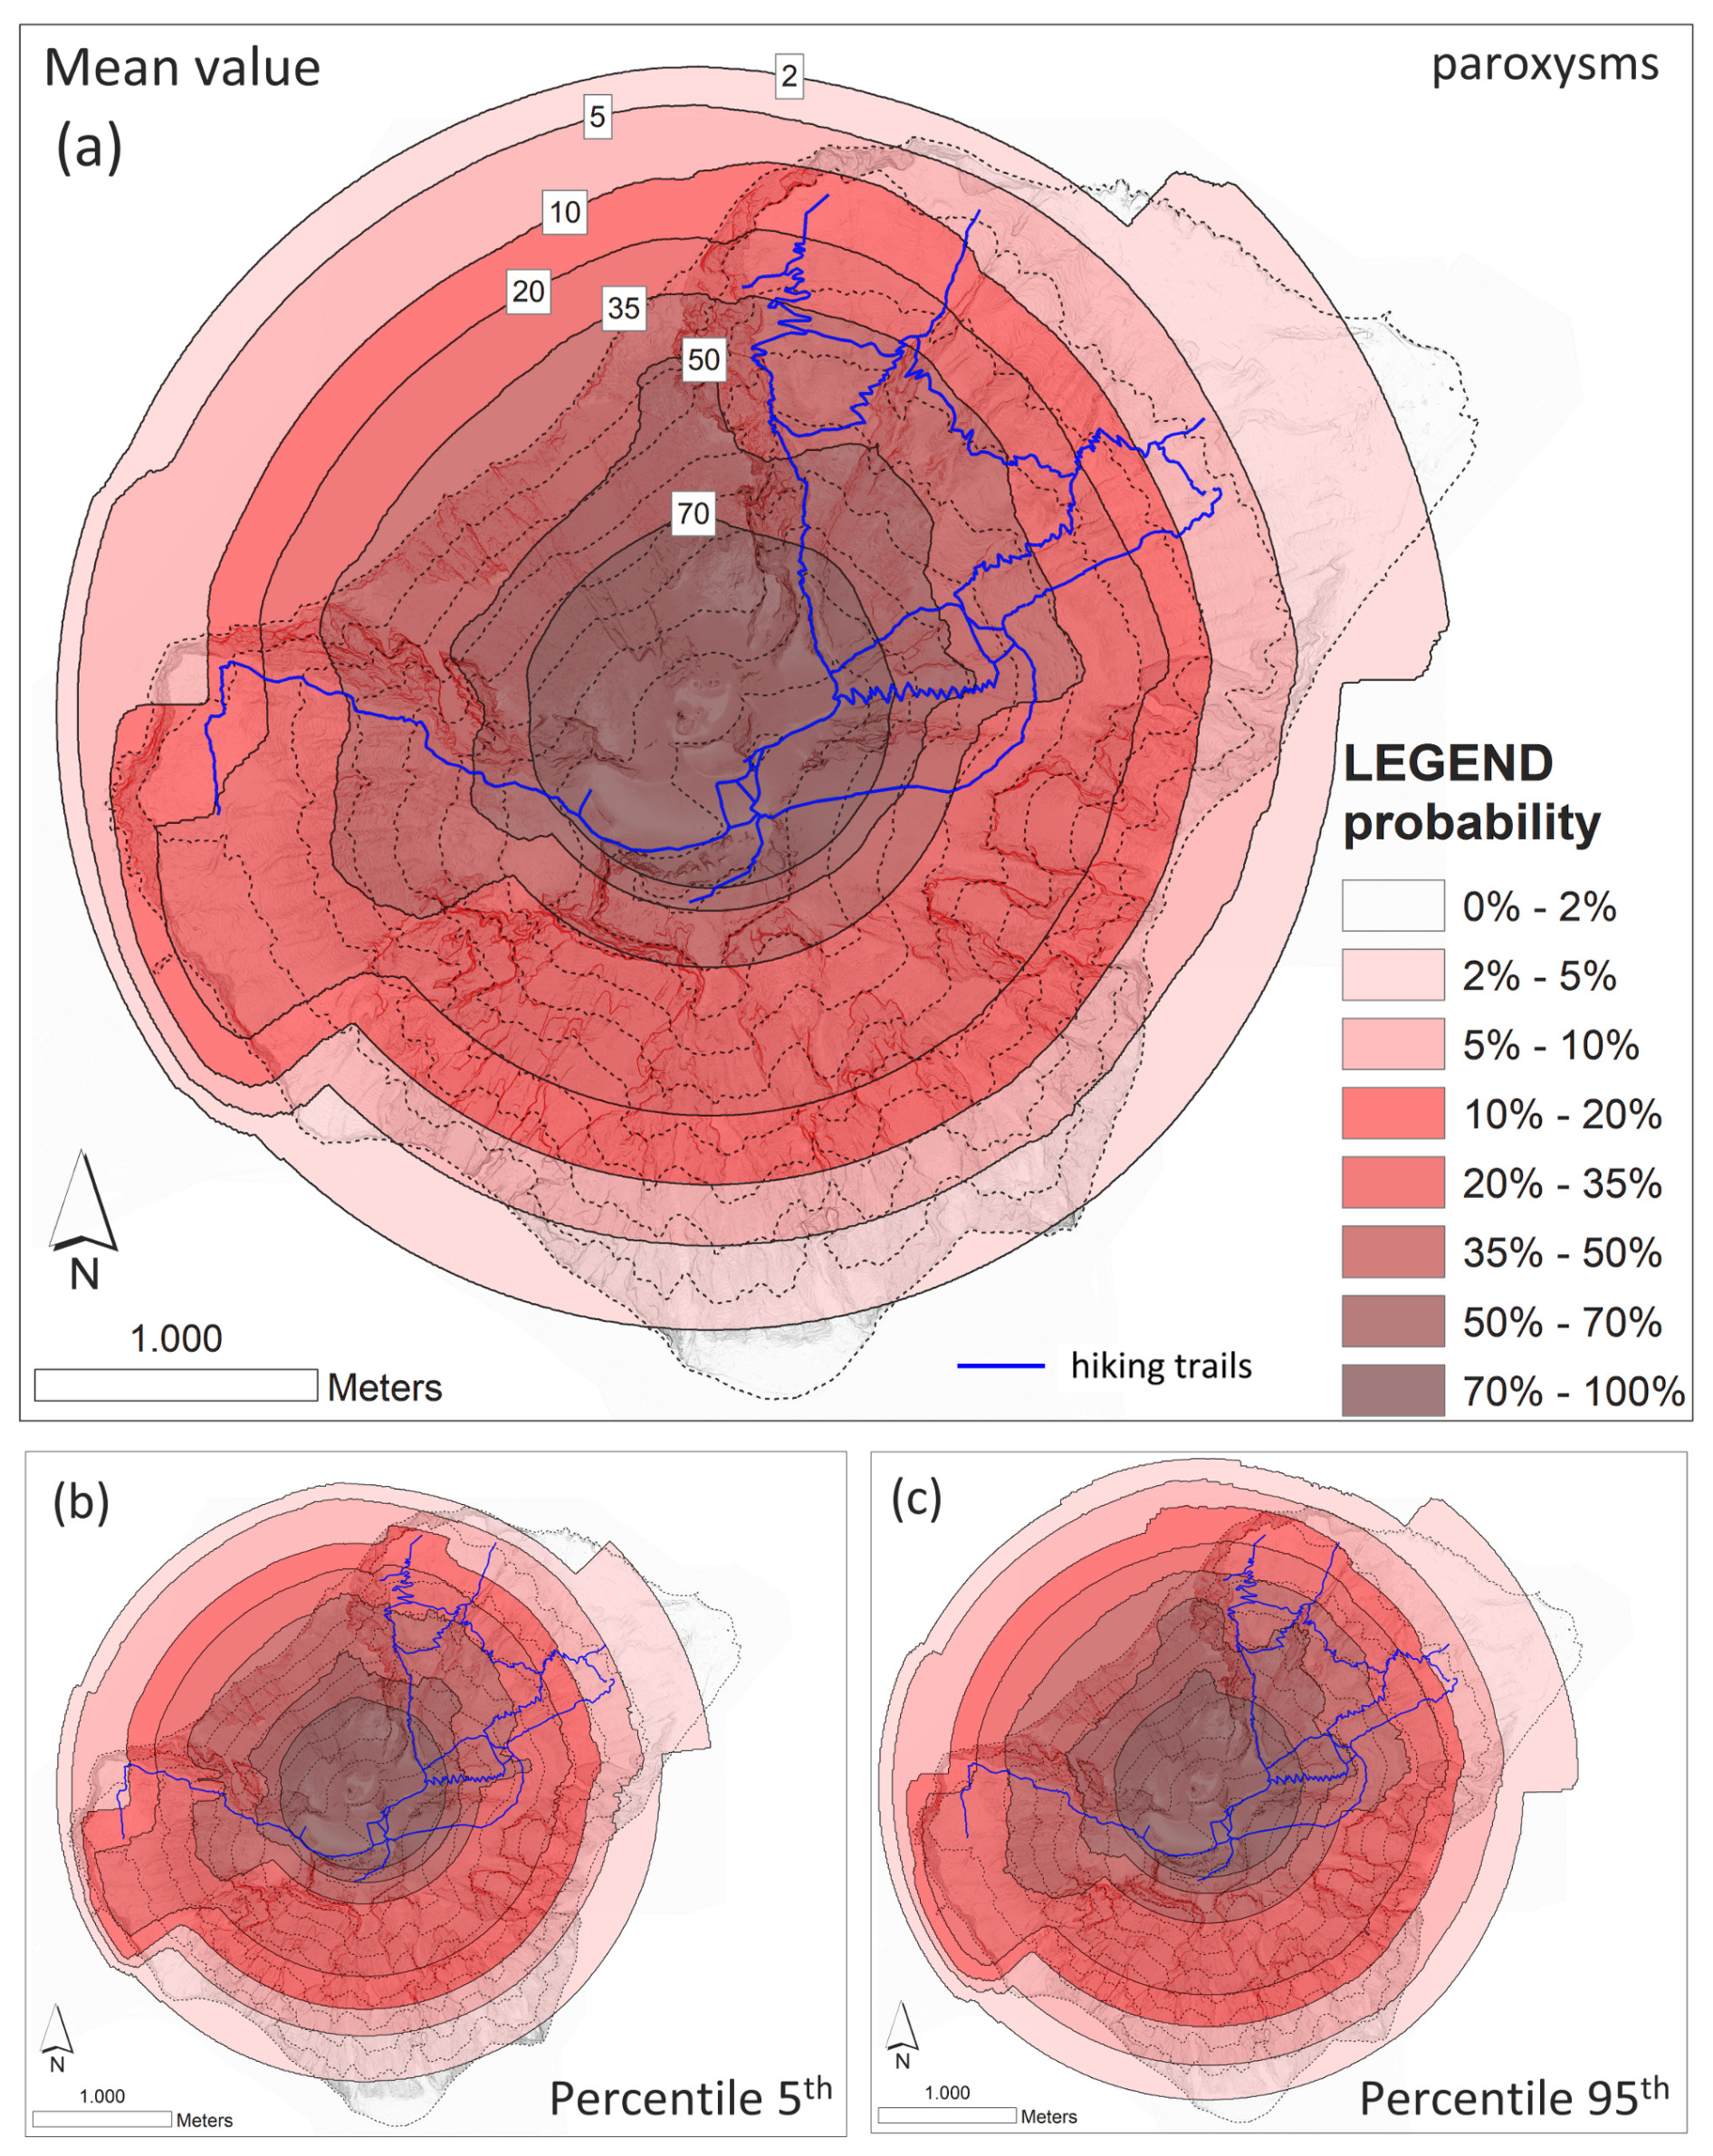
Figure 7(a) Mean and (b, c) 5th and 95th percentiles probability maps of the areas affected by ballistic projectiles fallout from paroxysms assuming in each spatial point the maximum values between Model 1, Model 2, and Model 3. Estimates are conditioned on the occurrence of a paroxysm. Colors and contour lines indicate percentage values as shown in the legend. In the background is a vertical shaded relief of the island from the 2012 LiDAR data (MASE, 2013; Di Traglia et al., 2020).
Finally, it is worth noting that the estimated uncertainty on the reconstructed areas affected by ballistics, has a rather limited effect on the probability isolines of both major explosions and paroxysms: in fact the 95th percentile contours are ca. 150 m (Fig. 6b and c) and ca. 250 m (Fig. 7b and c) larger than the equivalent 5th percentile contours, for the two categories, respectively.
Table 1Summary of main probability values to be affected by ballistic fallout for different areas of Stromboli as derived by the presented probability maps. The numbers reported from Figs. 6–8 and S3 are the approximate mean values with respect to the considered uncertainty. The numbers referred to Figs. 10 and S4 are the uncertainty interval between the 5th percentiles of Fig. S3 and the 95th percentiles of Fig. 8. For locations see Fig. 1b.
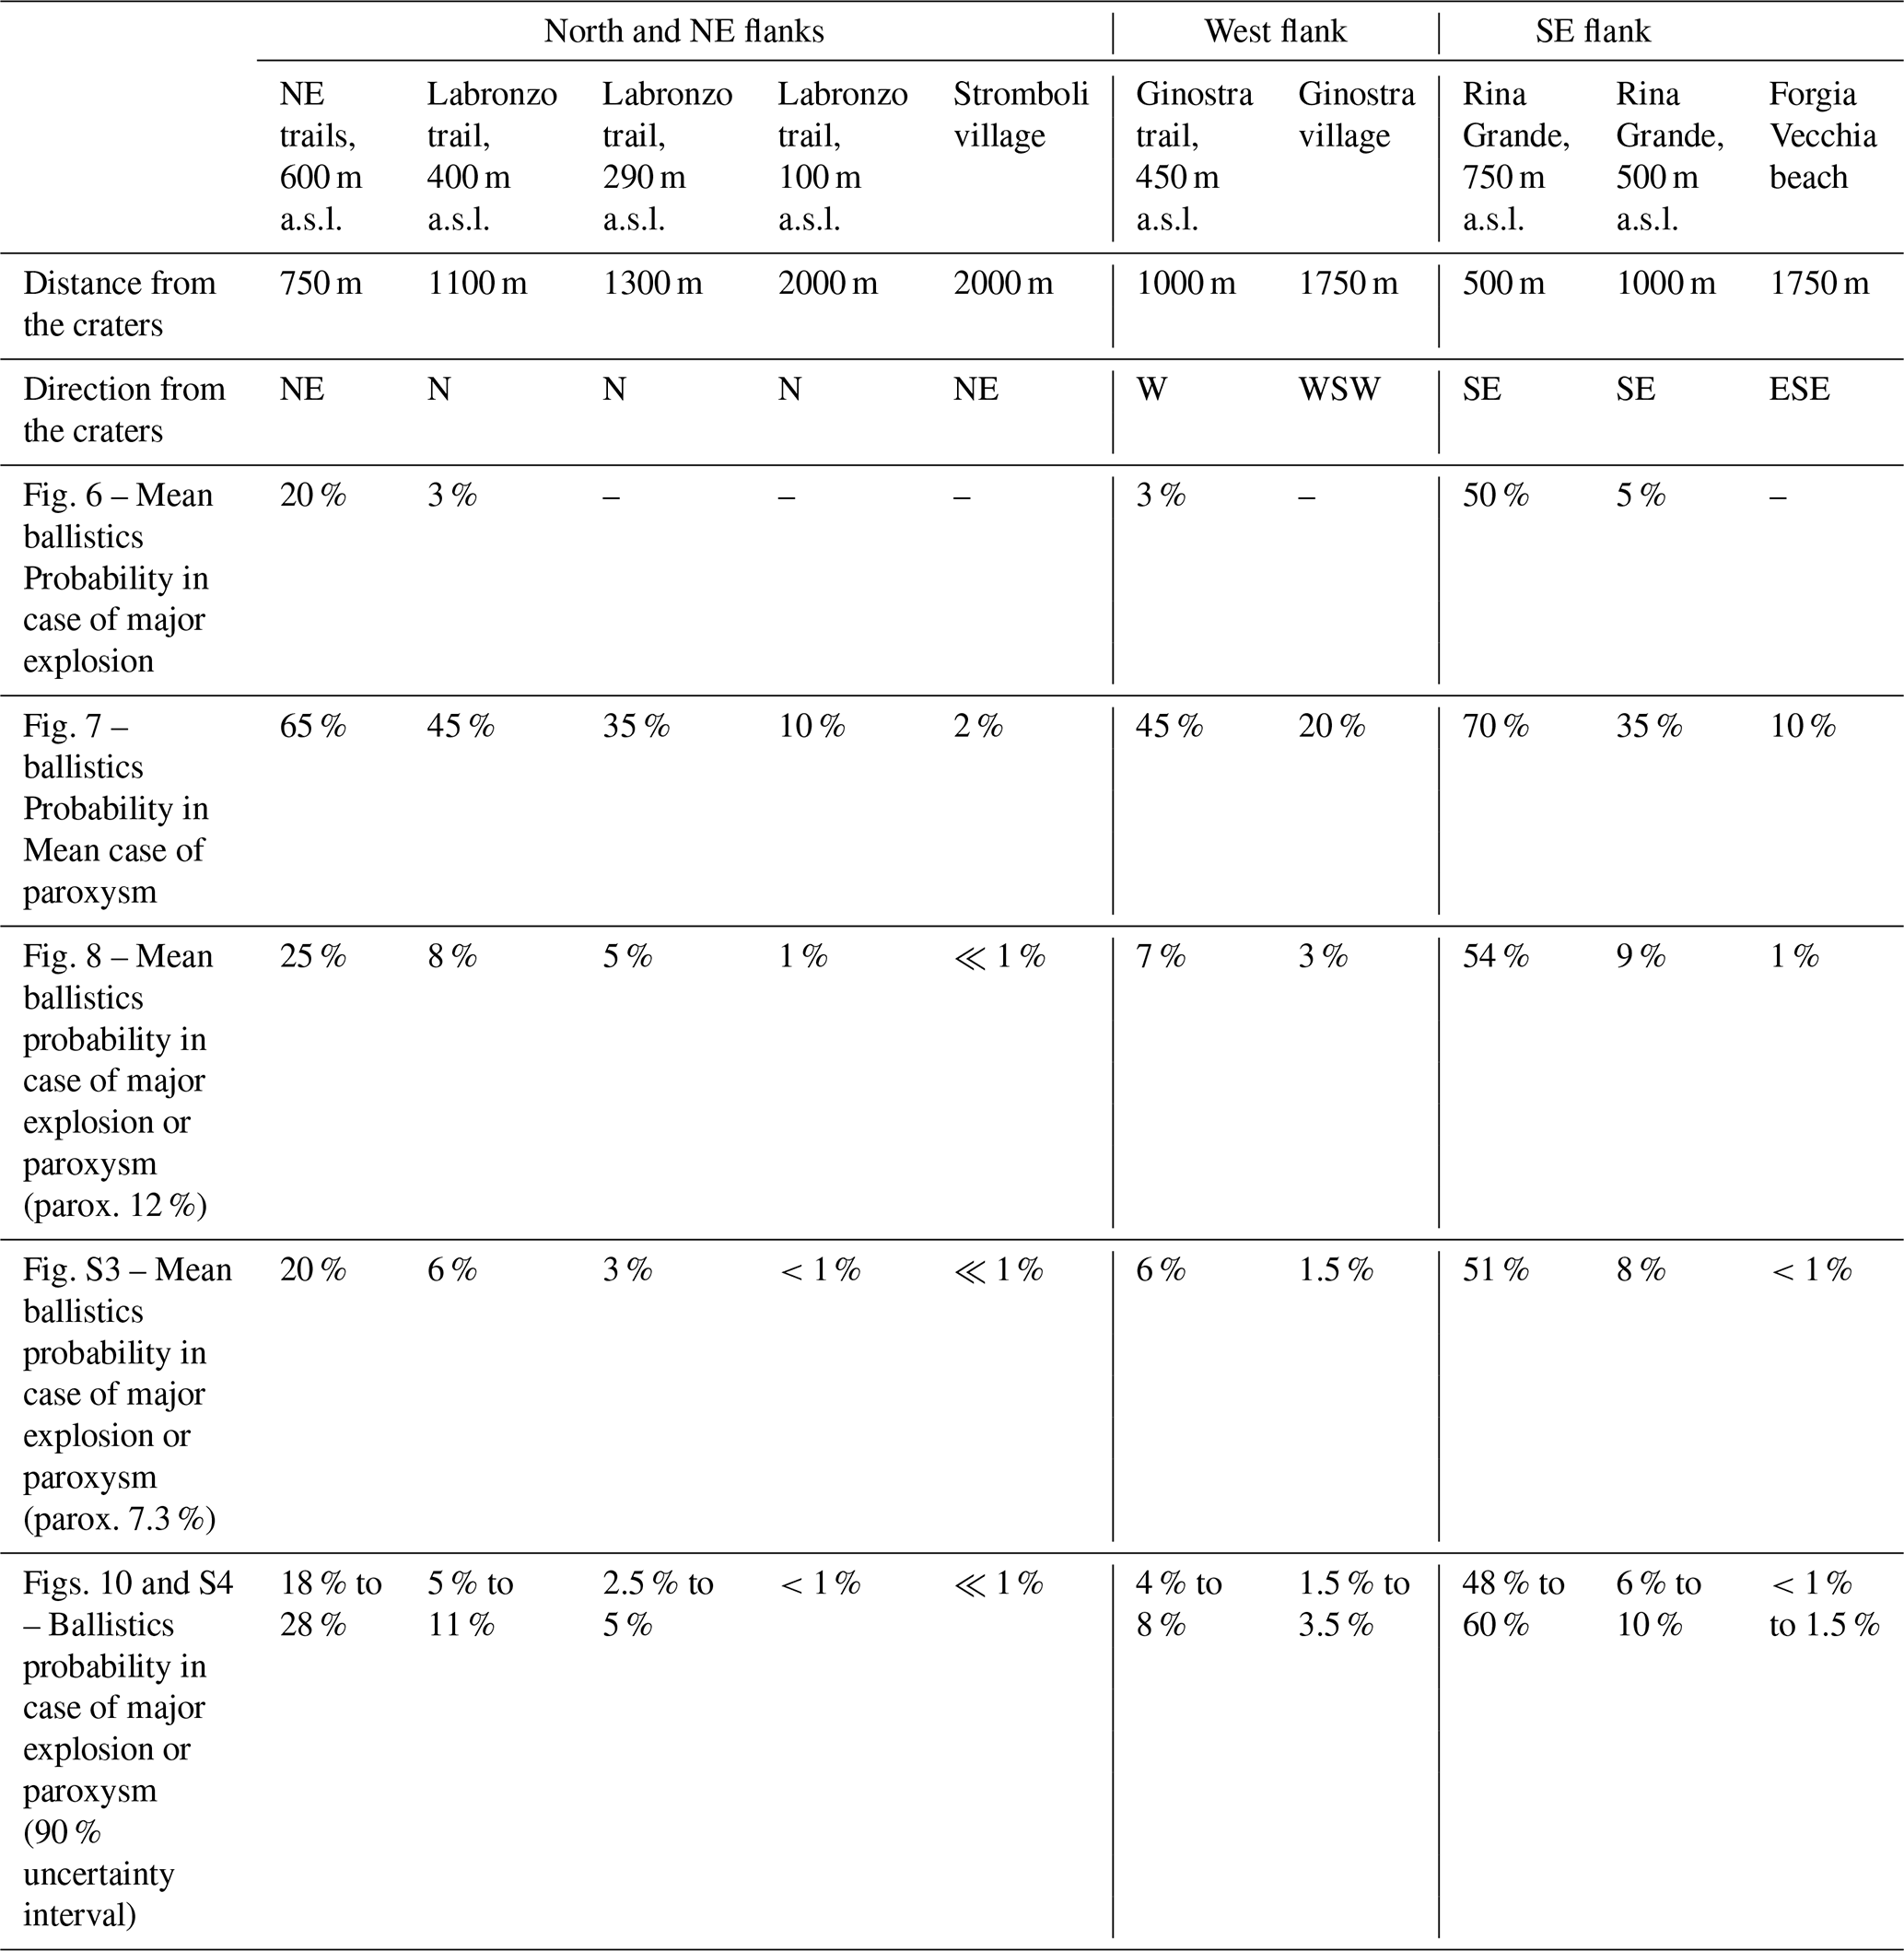
Table 1 summarizes the mean values of the probability to be affected by ballistics in a list of ten areas of the island at different distances and directions from the craters. These are touristic or populated areas, or crossed by one of the main climbing trails. Namely, we consider, the NE trails at 600 m a.s.l., Labronzo trail at 400, 290 and 100 m a.s.l., Stromboli village, Ginostra trail at 450 m a.s.l., Ginostra village, upper and lower Rina Grande area, Forgia Vecchia beach (Fig. 1b).
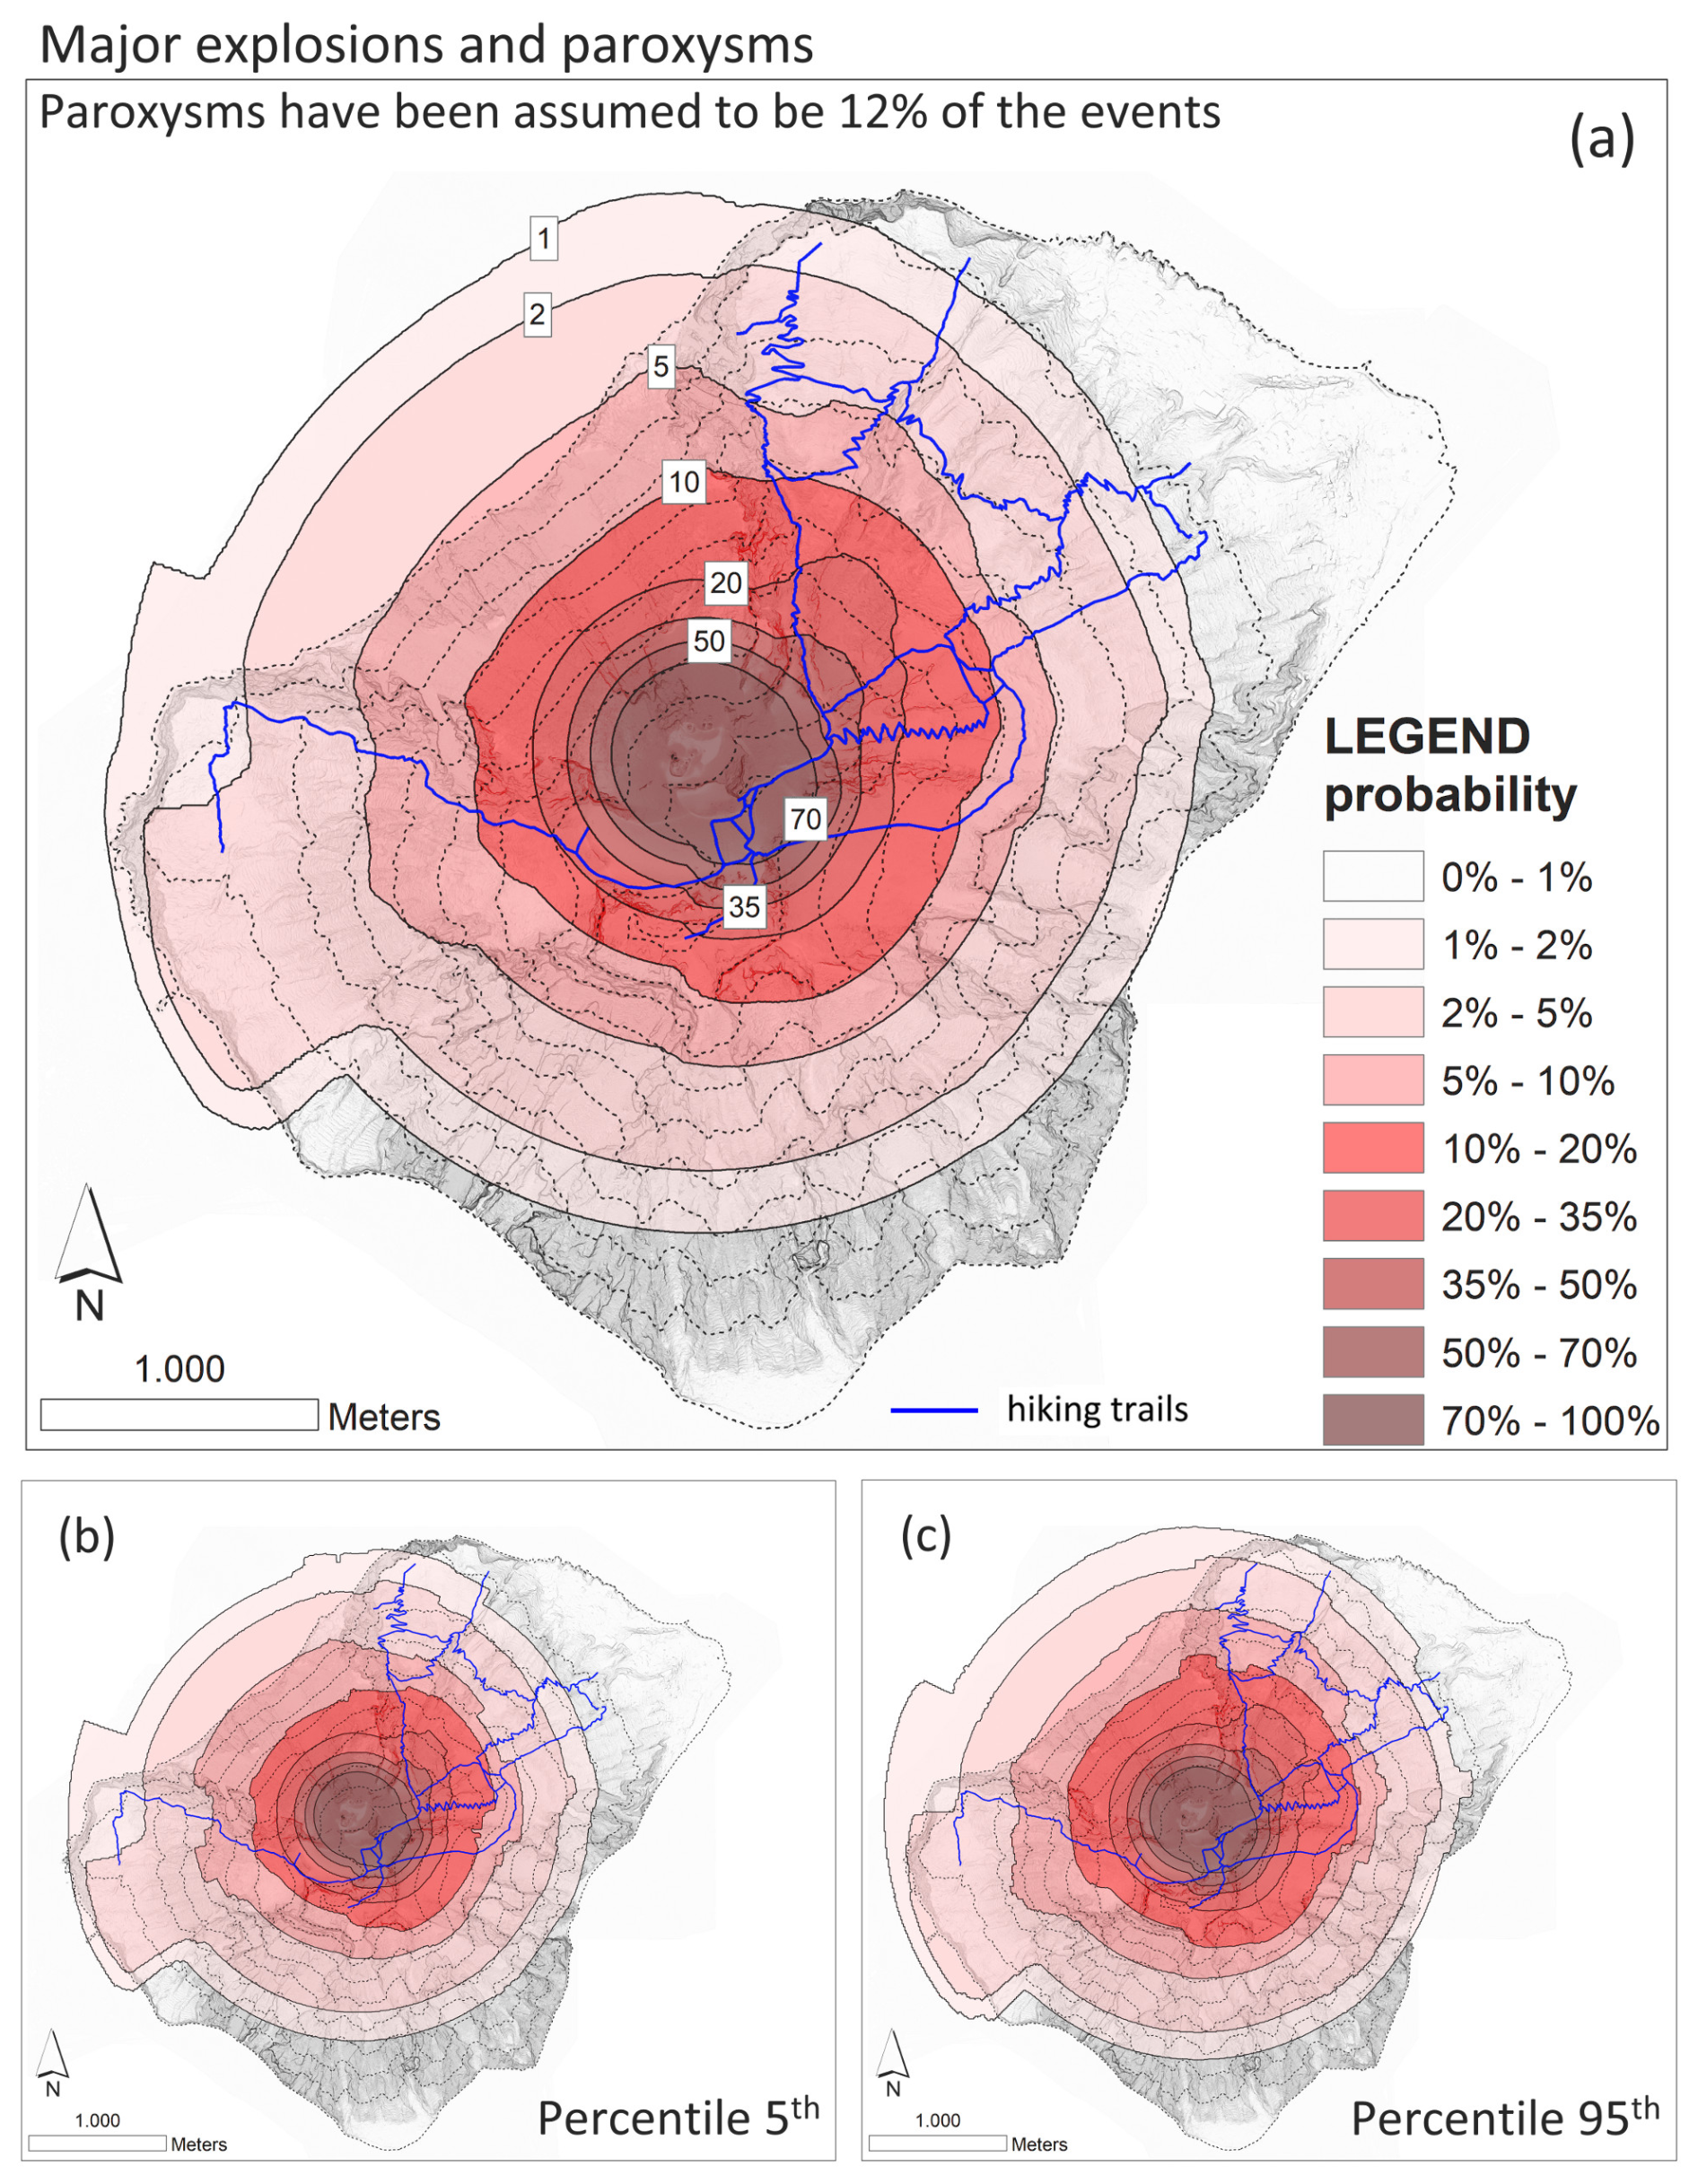
Figure 8(a) Mean and (b, c) 5th and 95th percentile probability maps of the areas affected by ballistic projectiles fallout from major explosions and paroxysms, based on event count from 2003 to 2023. Estimates are conditioned on the occurrence of a major explosion or a paroxysm with relative probabilities of 88 % and 12 %, respectively. Maximum values between Models 1, 2, and 3 are assumed in each location. Colors and contour lines indicate percentage values as shown in the legend. In the background is a vertical shaded relief of the island from the 2012 LiDAR data (MASE, 2013; Di Traglia et al., 2020).
4.2 Ballistics probability maps and curves combining major explosions and paroxysms
According to the combination formula (Eq. 7) in Sect. 3.2, Fig. 8 shows the mean value and the 5th and 95th percentile probability maps of ballistic projectiles from major explosions and paroxysms considered together, i.e. as a single category. Specifically, in Fig. 8 the paroxysms account for 12 % of events, the remaining 88 % of events being major explosions, as observed during the last two decades of activity, i.e. between 2003 and 2023 (see Bevilacqua et al., 2026a). It is noteworthy that contour lines extend now to minimum values of 1 % (against the 2 % value adopted for the two separate categories) given the larger number of events considered in producing the combined map.
In the combined mean map, the 10 % contour is asymmetrically distributed towards E and particularly towards NE, enclosing the slopes above Stromboli village above 400 m a.s.l., Rina Grande and the area above Ginostra above 500 m a.s.l. In contrast, the 2 % contour is asymmetrical towards WSW, enclosing the entire Ginostra village up to the harbor, the sea in front of Sciara del Fuoco up to about 600 m offshore, and the slopes above Stromboli village at ca. 200 m a.s.l. These different patterns of the higher and lower contour lines clearly reflect the remarkably different features of major explosions and paroxysms, with the former dominating in the most proximal areas and the latter in the distal ones.
As for the maps shown in Figs. 6 and 7, the effect of the uncertainty is limited also for the combined map. The 95th percentile contours are up to ca. 150 m more distant from the craters than the 5th percentile contours in the upper portion of the island, exposed to both the major explosions and the paroxysms, whereas they are up to ca. 250 m larger in the lower portion, which is only exposed to paroxysms.
In Fig. S3 we reported the combined maps of the paroxysms account for just 7.3 % of events, as computed considering the more extended period of activity between 1970 and 2023, with less than 5 % probability reduction in the considered areas, if compared to the corresponding values shown in Fig. 8. See Table 1 for a summary of the probability values associated to these combined maps.
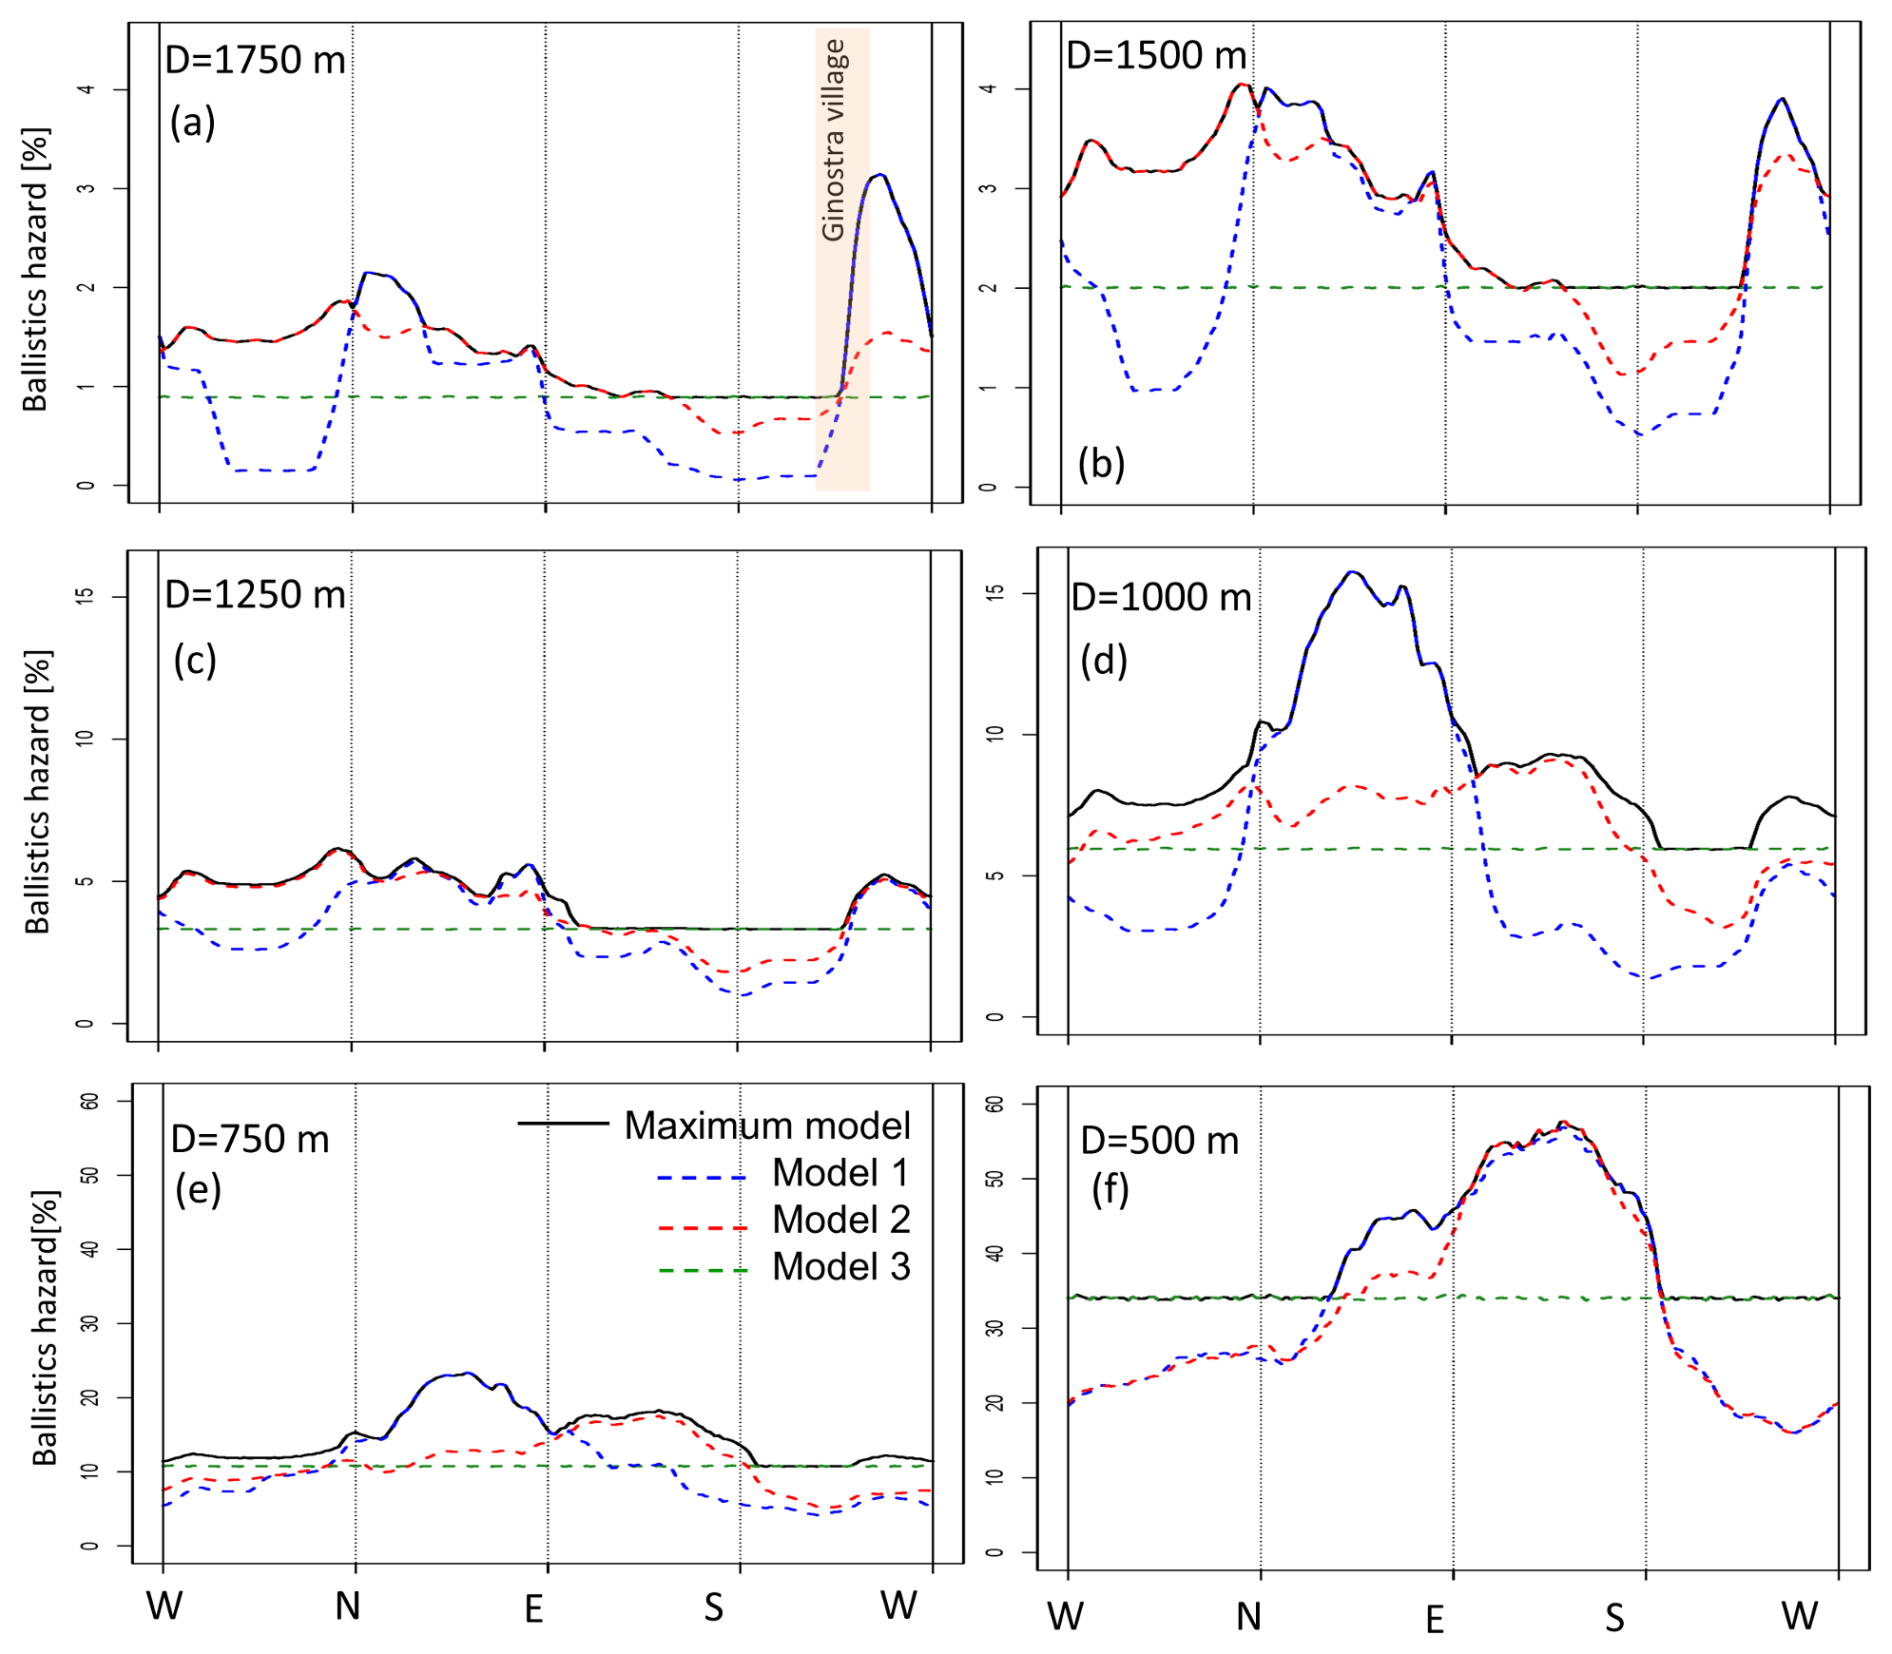
Figure 9Probability curves of ballistic hazard from major explosions and paroxysms, considered as a single category, as a function of direction from the center of the Crater Terrace, at six selected distances from it (see Fig. 1a for the location of the corresponding distances). The plots show the curves of the Maximum Model values (black curve) compared to those of Models 1 (blue dashed), 2 (red dashed), and 3 (green dashed). The plots refer to mean values with respect to the uncertainty and assume, in this example, a relative weight of paroxysms of 12 % with respect to the total explosive events considered (major explosions and paroxysms). In panel (a), the direction of Ginostra village is highlighted in pink. Note the different scales reported on the ordinate of the different plots.
It is also informative to analyze the distribution of ballistic hazard at specific distances from the craters and specific elevations. Figure 9 shows the probability curves of ballistic hazard from major explosions and paroxysms, considered as a single category, as a function of direction from the center of the Crater Terrace, at six selected distances from the craters. These curves report the Maximum Model values shown in Fig. 8a (as mean value) and also those calculated by Models 1, 2, and 3, along the selected isolines of distance and parameterized with respect to the azimuth angle. Their comparison highlights the importance of having considered multiple models. In fact, for each distance isoline, depending on the direction, the dominant model can be any of the three depending on the specific features of each model for that direction. We also note that in a few cases, the maximum values are slightly greater than all the three models, because the dominant model for the major explosions can differ from the dominant model for the paroxysms. Figures S5 and S6 similarly report the major explosions and the paroxysms probability curves separately.

Figure 10Probability curves of ballistic hazard from major explosions and paroxysms, considered as a single category, as a function of direction from the center of the Crater Terrace, at six selected elevations a.s.l. (see Fig. 1b for the location of the corresponding isoipses). All curves refer to the Maximum Model values between Models 1, 2, and 3. The uncertainty interval between the two continuous curves refers to the choice of the relative weight of paroxysms, either 7.3 % or 12 %, as discussed in the text. The dashed curves indicate the 5th and 95th percentiles of the uncertainty. In panel (a), the directions of the two inhabited areas of Stromboli and Ginostra villages are highlighted in pink, in panels (c) and (d) the directions of the viewpoints on the Labronzo trail are shown as vertical red lines (see Fig. 1). Note the different scales reported on the ordinate of the different plots.
Similarly, Figs. 10 and S4 show the mean probability hazard curves of Figs. 8 and S3 as a function of direction, at six selected distances from the craters, and six elevations a.s.l., respectively. Specifically, they report the mean values of Figs. 8 and S3, and the uncertainty interval between the 5th percentiles of Fig. S3 and the 95th percentiles of Fig. 8. This analysis complements the probability values computed at the locations listed in Table 1. For example from Fig. 10b, at 150 m elevation, there is 1.5 % to 3 % probability on the Labronzo trail, and 2 % to 4 % in the cultivated fields above Ginostra. Similarly, from Fig. S4d, at 1000 m from the craters, there is a peak probability of 11 % to 17 % at ENE, in the area where the climbing trail exits vegetation (see Fig. 1b).
4.3 Temporal occurrence model and spatio-temporal ballistic hazard estimates
All the hazard estimates presented in the previous sections were conditional on the occurrence of a major explosion or a paroxysm. To account for the time variable, it is necessary to assume a temporal model, in order to consider the probabilities of occurrence of major explosions and paroxysms. In Bevilacqua et al. (2020a), a two-state Markov chain was able to replicate the clustering features of major explosions and paroxysms at Stromboli, by fitting the bulk of the inter-event times with an exponential and the tail with a lognormal distribution. In fact, a constant probability rate of events, i.e., a Poisson model, was inadequate to estimate these clustered events. Figure S7 reports the hourly probabilities of the major explosions and paroxysms as a combined class, and only of paroxysms. It should be noted that the probability of occurrence models can be either fitted by excluding the uncertain major explosions, or including them in the count, thus producing different results (Bevilacqua et al., 2020a).
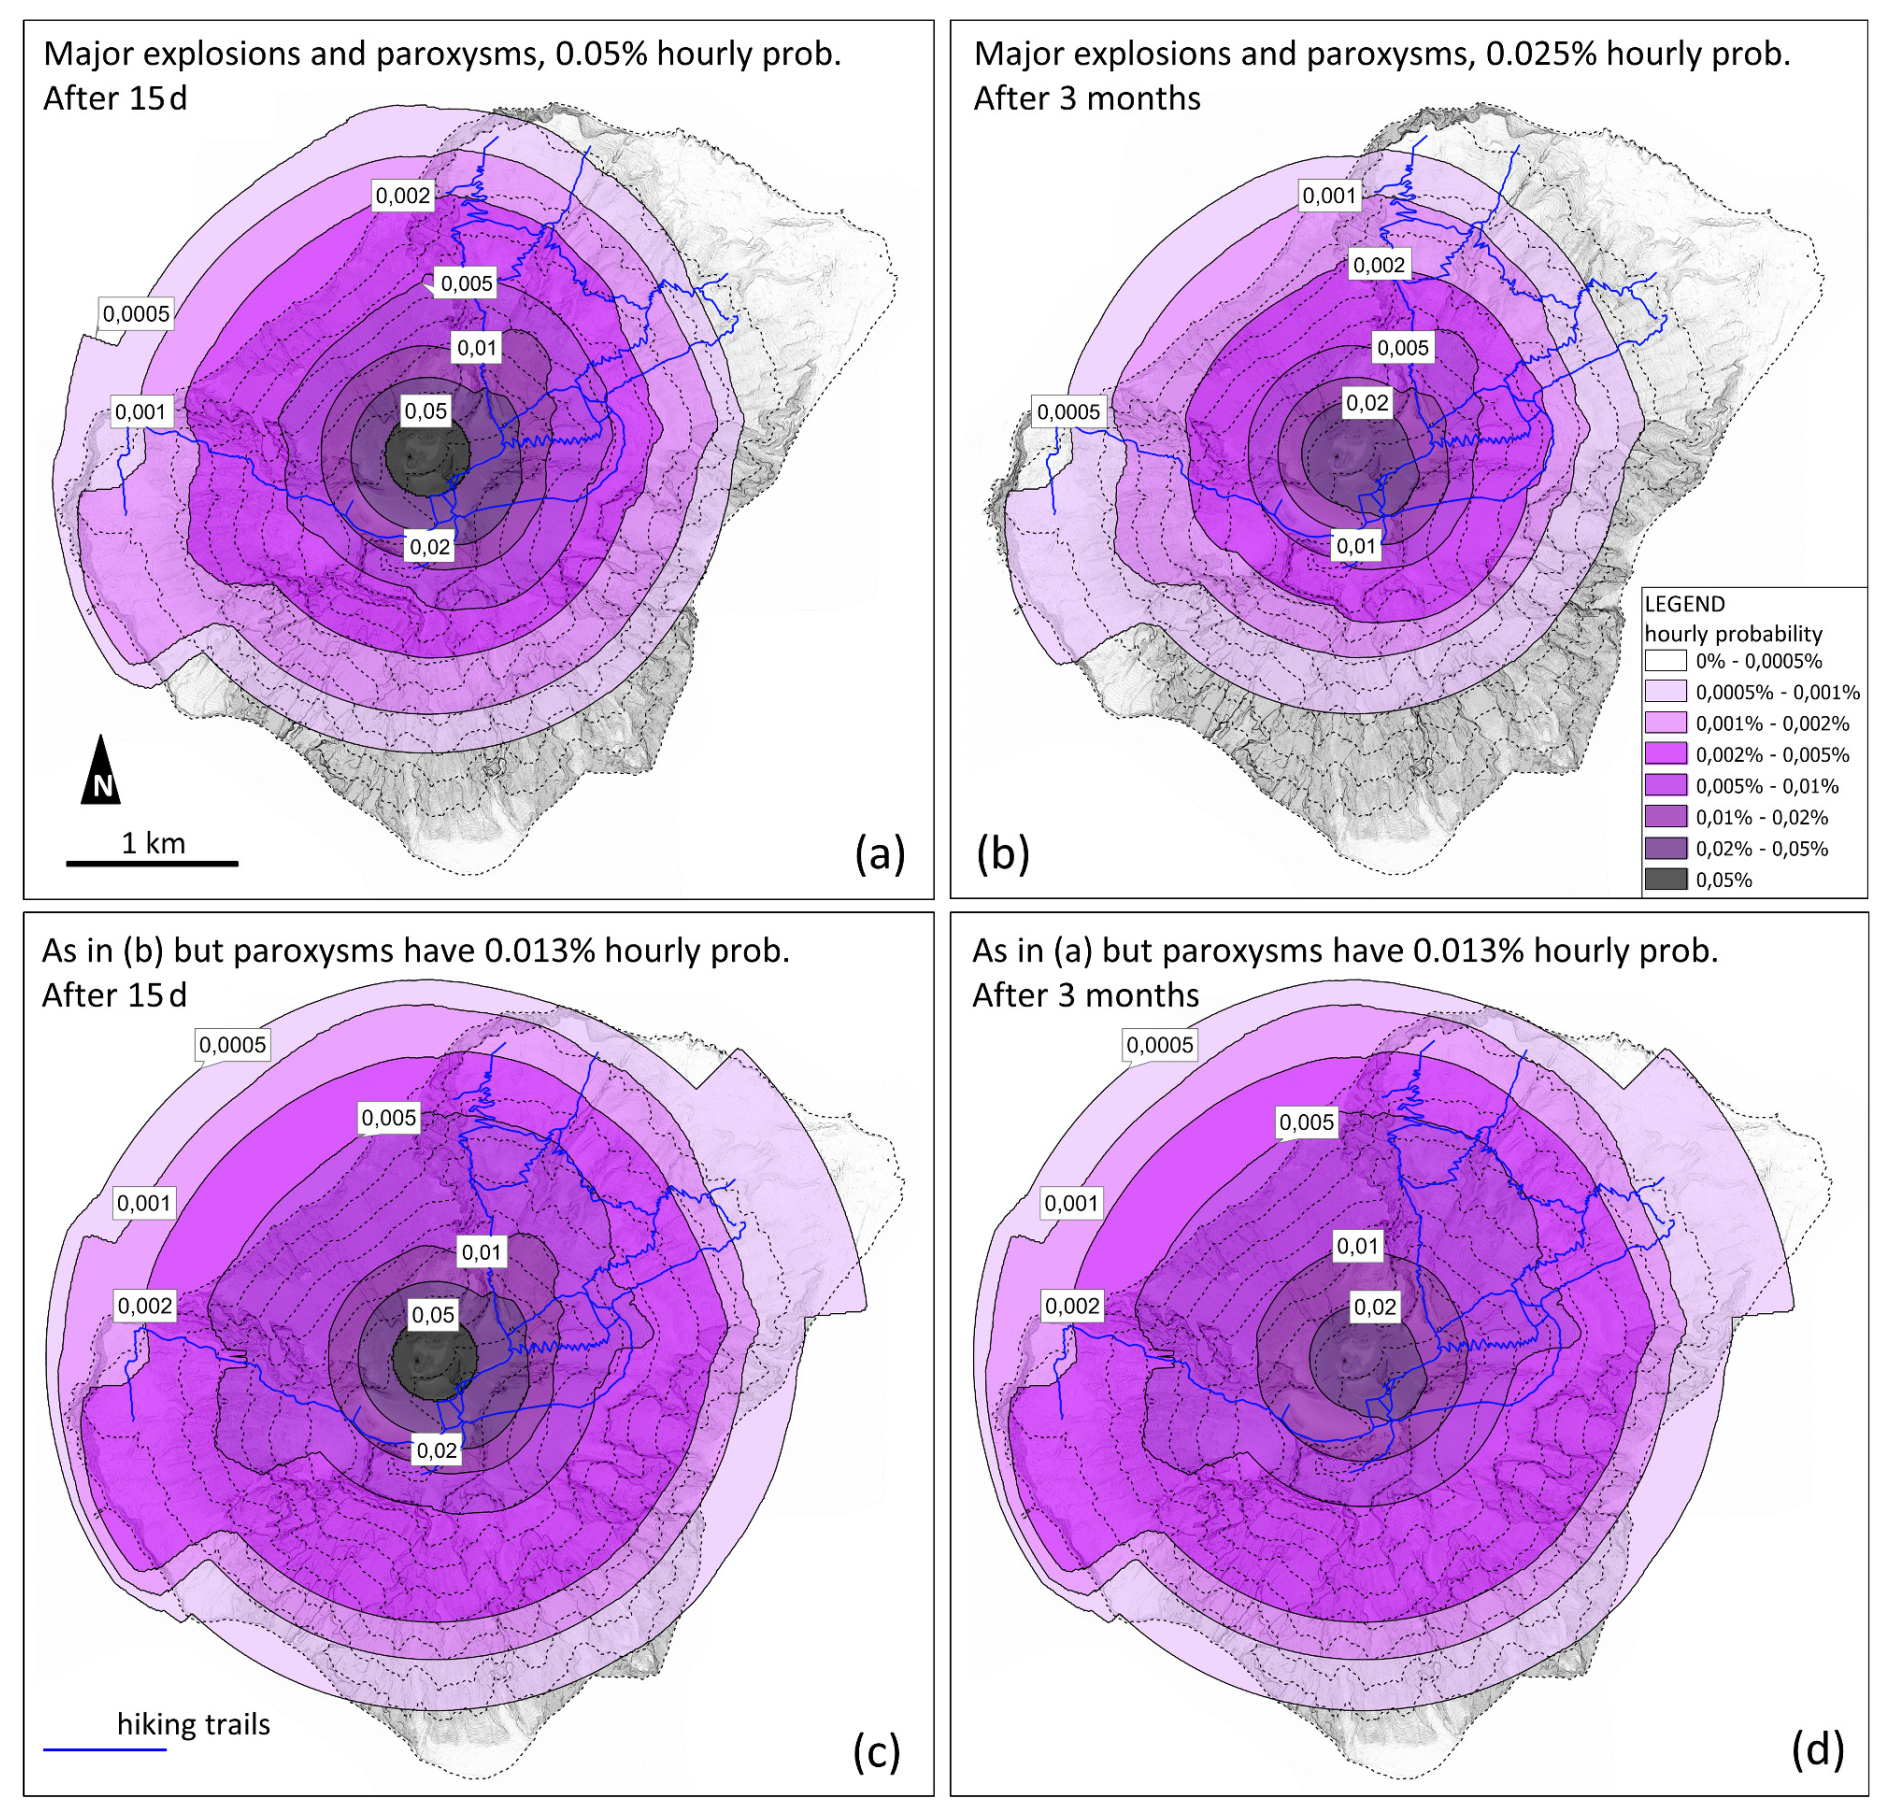
Figure 11Hourly probability maps of the areas affected by ballistic projectiles of major explosions and paroxysms after (a, c) 15 d (days) and (b, d) 3 months from the last event. All estimates are based on Fig. 8 but assuming different occurrence probabilities. In (a) we assumed 0.025 % and in (b) 0.05 % hourly probability of major explosions and paroxysms considered as a combined class. In (c) and (d) we modified (a) and (b), respectively, by incrementing the occurrence probability of only the paroxysms to 0.013 %. Colors and contour lines indicate percentage values as shown in the legend. In the background is a vertical shaded relief of the island from the 2012 LiDAR data (MASE, 2013; Di Traglia et al., 2020).
The probability rates of major explosions and paroxysms are not constant in time, but significantly increase in the weeks/months after one of these events has occurred. In particular, based on Fig. S7, after including the uncertain major explosions, the hourly probability of major explosions and paroxysms is ≈ 0.05 % in the first weeks after the event, but gradually decreases below 0.025 % in ca. 3 months. Similarly, the hourly probability of paroxysms is ≈ 0.013 % in the first months after the event, and then decreases below 0.0025 % in ca. 15 months. These results refer to the currently analyzed eruption record, but they are broadly consistent with those reported in Bevilacqua et al. (2020a).
Figure 11 summarizes four examples of ballistic hazard maps using different hourly probabilities, i.e. representative of the hazard after specific time periods from the last explosive event. In Fig. 11a we used 0.05 %, i.e., the “peak” hourly probability estimated after about 15 d of the last major explosion or paroxysm; in Fig. 11b we assumed 0.025 %, as estimated after 3 months without major explosions or paroxysms. It should be noted that the mapped values are the product of Fig. 8 and the hourly probabilities mentioned above, and therefore the values in Fig. 11a are twice of those in Fig. 11b. Moreover, because the hourly probability of the paroxysms shows an increase lasting for over a year after every event of that type, in Fig. 11c and d we modified the previous maps by assuming 0.013 % hourly probability only for the paroxysms. In practice, in Fig. 11c and d we considered the maximum value between Fig. 11a and b, respectively, and the product of Fig. 7 and 0.013 % hourly probability of occurrence. These two maps report greater probabilities than the previous pair, especially in the lower portions of the island, i.e., below 400 m a.s.l. Simplifying, Fig. 11a and b are representing the ballistic hazard if no paroxysm occurred in the previous few months; Fig. 11c and d are valid in the few months after a paroxysm occurred. It should be noted that the peak hourly probability values in Fig. S7 are greater than 0.05 % in the first few days after the last explosive event.
After the hourly probabilities, the probabilities of the areas affected by ballistic projectiles of at least one major explosion or paroxysm in the next 10 or 50 years are also relevant, particularly in the inhabited areas. For all spatial coordinates (x, y) we calculated the ballistic fallout probability for the next N years by using the following equations:
where the index j=1, …, k parameterizes the number of major explosions or paroxysms that may occur, PN,j is the probability to have exactly j such events over the next N years, and H(x,y) is the conditional probability of the areas affected by ballistic fallout.

Figure 12(a, b) Probability maps of the areas affected by ballistic projectiles of at least one major explosion or paroxysm in the next 10 years, based on the number of (c) the probability distribution of the number of major explosions and paroxysms considered as a combined class. In (a) we exclude the uncertain major explosions, and in (b) we include them in the occurrence probability estimates. We adopt a Monte Carlo simulation of the occurrence probabilities reported in Fig. S7a and b, respectively.
Figure 12 shows two examples of ballistic hazard maps from major explosions and paroxysms, considered as a single category, in the next 10 years, based on a MC simulation of 500 000 samples of the number of major explosions and paroxysms that may occur. In particular, Fig. 12a excludes the uncertain major explosions, and Fig. 12b includes them in the occurrence probability estimates: in the Stromboli Village we calculated probabilities up to 5 % in Fig. 12a and up to 10 % in Fig. 12b, whereas in Ginostra we calculated probabilities up to 35 % and up to 50 %, respectively. Figure 12c shows the probability distribution of the number of major explosions and paroxysms that we considered in the next 10 years, and a similar estimate for the next 50 years. It should be noted that, after including the uncertain major explosions, mean values are 24 of these events in the next 10 years, and ca. five times more, ca. 120, in the next 50 years, of which ca. 88 % would be expected to be major explosions and 12 % to be paroxysms, according to the event ratio assumed in Fig. 8.
5.1 Ballistic hazard estimates at Stromboli
The ballistic fallout hazard estimates in the existing scientific literature started with qualitative maps mostly informed by the areas of heavy ballistic fall described in 1930 (Nappi, 1977; Capaldi et al., 1978). Then, Barberi et al. (1993) by leveraging on their pioneering historical catalog, improved on this, by outlining five hazard zones affected by different volcanic hazards in the past. Four of these zones were related to ballistic hazard, enveloping the region above 400 m a.s.l. plus some of the island flanks down to the coastline. In Rosi et al. (2013) two qualitative maps were presented, the first related to the probability of ballistic fallout of blocks during major explosions, and the second to the probability of ballistic fall in general, including “spatter” fallout and hot avalanches related to the paroxysms. Both maps were informed by the field data from a small number of events, namely six major explosions and three paroxysms. The former map roughly corresponded to a circular sector oriented towards NE, with hazard modulated from high to low in terms of distance from the craters and main topographic basins. The latter map delineated a wide sector, from SSW to NNW clockwise, were ballistic hazard was considered high from the coastline to the summit, plus a few hundreds of meters offshore Sciara del Fuoco; on the rest of the island the ballistic hazard ranged from low to high as a function of elevation a.s.l. It should be noted that both these maps established qualitative hazard rankings, ranging from low to high, without assigning any numerical values.
In this study we developed a new method implementing complementary models to estimate probabilistically the areas affected by ballistic projectiles during the major explosions and paroxysms at Stromboli, including the less accessible sectors of the island. We quantified probability values informed by a new dataset of 67 of these events and their uncertainty. First we directly used the reconstructed areal data as reported in the companion study (Bevilacqua et al., 2026a), i.e., at each point on the island we estimated the percentage of cases in which ballistic fallout affected that point (we called this Model 1). Then, we modeled the categorized dispersal areal data, i.e., distance, azimuthal direction and width angles of the circular sectors representing the ballistic fallout of past events. The existence of correlation structures characterizing the categorized data is evident from Figs. 2 and 3, but it is unclear if they have been mostly caused by characteristics in the morphology of craters and shallow part of conduits, which likely change from time to time and become different in the future, or also by the wind or by sampling biases.
In particular, the asymmetric ballistic patterns may derive from the two distinct dyke-like conduit structures identified in Chouet et al. (2008) by Very-Long Period seismic data inversion, each representative of explosive eruptions from the different vents located near the northern and southern perimeters of the Crater Terrace. The existence of asymmetric dyke intrusions related to the two main faults crossing the island (N41 and N68; Finizola et al., 2002; Tibaldi et al., 2009) and the presence of a low-density anomaly underneath the SE-side of the Crater Terrace, were also hypothesized by modeling gravimetric and geodetic data, and by independent muographic imaging (Linde et al., 2014; Tioukov et al., 2019).
Regarding the possible role of prevailing winds, because the dispersal sectors were delineated from the observed impact locations of ballistic projectiles, any systematic wind-induced deflection is already implicitly included in our estimates. Nevertheless, although atmospheric winds may substantially modify ballistic trajectories under some conditions, their effect at Stromboli appears to be relatively limited. Calculations based on previous studies of crosswind effects (e.g., Bertin, 2017) indicate that, under standard atmospheric conditions, a 5 m s−1 crosswind representative of typical conditions at Stromboli, would displace a 10 cm diameter spherical lithic clast by approximately 60–125 m, assuming a drag coefficient of 0.5 and a trajectory apex 500–1000 m above the source, as commonly associated with major explosions and of about 155–210 m for a free fall from an apex of about 3000–4000 m above the source, as may occur during paroxysms. Low-level wind field for Stromboli, derived from the coarse-resolution reanalysis dataset of Mastin (2017) for elevations between 0 and 5 km, indicates predominantly E and SE transport. These directions do not appear to account fully for the observed ballistic dispersal patterns. Local circulation may, however, be significantly modified by the steep topography of the volcano. Resolving such effects would require a dedicated reconstruction of the local wind field, including that of specific recent events, which is beyond the scope of this study.
A significant advantage of using categorized data of the areas affected by ballistic fallout was the possibility to model distances and directions independently, still assuming that some directions were more likely affected than others, according to what observed in the available data. Therefore, the marginal distribution of the distances (FA(d)) was calculated from the statistics of all the sectors, regardless of their direction (we called this Model 2). Finally, we also dropped the assumption that some directions were more likely than others and followed an axisymmetric assumption, by using the marginal distribution of all the observed distances (FB(d)) uniformly in all directions (we called this Model 3). We believe that such a multi-model and conservative approach, although still firmly based on past data and observations, significantly enhances the robustness of the hazard maps against possible under-recording issues and unstationary behavior of the volcanic system.
5.2 Considerations on the areal density of the ballistic projectiles
A remarkable aspect of the study is that we referred to the probability that a given area would be affected by ballistic fallout if a major explosion or a paroxysm occurs. In other words, in our analysis we did not consider the areal density of the projectiles. In fact, although there is a remarkable record of scientific articles and eyewitness descriptions of the products of major explosions and paroxysms in the past ca. 150 years (Bevilacqua et al., 2026a), the number of projectiles per unit area was rarely reported and therefore it is difficult to evaluate. Unseen, unnoticed, or fragmental projectiles pose a major challenge to such measurements. In practice, witnesses often struggled to provide precise data, meaning that only the largest or most destructive projectiles tend to be reported.
Estimates of the areal density of ballistics are indeed quite rare and partial. Just for the most recent major explosions, a few field surveys locally measured the areal density of clasts, in terms of number of projectiles per meter square. These estimates are listed in Table S2, and the peak densities range from 0.01–0.05 to 10–15 clasts per m2 at distance of 300–500 m from the craters (e.g., Andronico and Pistolesi, 2010; Gurioli et al., 2013; INGV reports summarized in Bevilacqua et al., 2026a). Schmid et al. (2025) reported a photogrammetric reconstruction of the ballistic fallout in the most proximal areas of the major explosion of 13 May 2022, identifying 20 scoriaceous bombs and more than 2000 lithic blocks dispersed less than 250 m from the center of Crater Terrace. They did not quantify the areal density of the ballistics, but indicated several patches of continuous cover extending up to ca. 20 m of diameter.
Similarly, for paroxysms, the most studied event in terms of areal density of projectiles was the event of 3 July 2019. Notably, a continuous ballistic deposit was documented up to 350 m in the NE direction from the craters (Giordano and De Astis, 2021), and up to ca. 850 m in the WSW direction (i.e., 500 m a.s.l., Andronico et al., 2021). An areal density of 0.25 clasts per m2 was observed 400 m NE from the craters, and one of 0.01–0.04 clasts per m2 was observed at ca. 1800 m WSW (i.e., 100 m a.s.l., Andronico et al., 2021). In addition, for this paroxysm, detailed information on the areal density towards E was provided in Bisson et al. (2023), from an aerial survey performed 6 d after the paroxysm. In particular, they mapped up to 1.2 clasts per meter square at ca. 350 m from the craters, deemed equivalent to ca. 30 % ground cover; they also measured a ground cover over 10 % in the upper Rina Grande Area, ca. 500 m from the craters. On the W flank, Bevilacqua et al. (2024a) measured a ground cover up to 12 % at ca. 900 m from the craters.
As a consequence, the areal density of ballistics during major explosions and paroxysms can be highly variable as a function of distance, diameter of the projectiles, and azimuthal direction: local clusters can also significantly diverge from the average measurements (Gurioli et al., 2013; Breard at al., 2014). Moreover, given an areal density of projectiles, the actual ballistic exposure of an individual target is hard to estimate, i.e., the probability of being struck. From a hazard perspective, any density above 1 clast per meter square is not different from a continuous cover (Jolly et al., 2014; Deligne et al., 2018). In fact, while a complete ballistics exposure calculation should take into account the trajectory of the projectiles and their diameter (Jolly et al., 2014; Deligne et al., 2018), it is also the case that for these ballistic missiles there are no established injury thresholds for striking the head or other parts of the body, and their relatively low impact energies, i.e., 40–120 J, may even cause lacerations and skull trauma, depending on their shape and angle of strike (TNO, 1992; Davies, 1993; Baxter and Gresham, 1997). Then, it should be noted that even a slight areal enlargement, e.g., a buffer related to hot fragments affecting the surroundings, can produce a significant increase of the total area impacted by ballistics (Bevilacqua et al., 2024a), in particular, blocks falling on hard rock may fragment upon impact, sending dangerous shards as far as several tens of meters from the impact site (Rittmann, 1931; Rosi et al., 2006).
For all these reasons, although we did not include in our analysis the areal density and the shape of the clasts, along with information on the ballistic trajectories, and our estimates cannot be considered as a measure of the probability to be struck by a ballistic fragment, our results allowed us to estimate the probability that a given sector of the volcano is affected by ballistic fallout and are certainly representative of the presence of a major risk in the area.
5.3 Uncertainty affecting the major-explosions/paroxysms ratio
An additional key parameter for the hazard assessment of major explosions and paroxysms at Stromboli is the fraction p of the number of paroxysms over the number of major explosions plus paroxysms, which we assumed equal to 12 % in Fig. 8, and equal to 7.3 % in Fig. S3, as discussed in the Methods section, contributing to the uncertainty affecting the results summarized in Figs. 10 and S4, and Table 1. This uncertainty comes from the natural variability of the volcano dynamics as well as from the difficulty to reconstruct a robust record of major explosions over long periods. However, the temporal models of the occurrence probabilities of major explosions and paroxysms as a combined class, and only of the paroxysms, can provide additional insight on the scale parameter p (see Fig. S7). In fact, the fraction between the peak hourly probabilities in the first weeks after an event considered in Fig. 11, i.e., 0.05 % and 0.013 %, is ca. 25 %, indicating that after a paroxysm, the parameter p can double with respect to a 12 % “background” estimate. This is the reason why in Fig. 11 we also considered a possible decoupling of the paroxysms occurrence probability from that of the major explosions plus paroxysms, under specific conditions.
Similarly, the statistics of the number of expected major explosions and paroxysms in the next 10 and 50 years, presented in Fig. 12 and Table S3 (modified from Bevilacqua et al., 2026b), can provide other estimates of the scale parameter p, if compared to the expected number of paroxysms in the same time intervals, according to the hourly probabilities in Fig. S7. For example, after including the uncertain major explosions, the mean number of major explosions and paroxysms expected in the next 50 years is ca. 120, and the mean number of paroxysms is 16, which would imply p=14 %, not far from 12 %. However, it should be noted that, after excluding the uncertain major explosions in the next 50 years, the resulting p would increase to ca. 20 %. In fact, as shown in Fig. S7, the average rate of major explosions and paroxysms observed in the last ca. 40 years has been significantly lower than in the last 10 years, but the temporal model of the paroxysms is not affected by this change, because it is based on the last ca. 150 years. It is unknown if the relatively high rate of paroxysms observed before 1960 was accompanied by a proportionally higher rate of major explosions or not, and therefore we preferred to rely on specific time intervals, i.e., 1970–2023 and 2003–2023, consistent between the two phenomena, rather than comparing these temporal models.
In addition, it should be noted that the average p=12 %, calculated in the period 2003–2023, does not change significantly if we consider the updated record of major explosions and paroxysms until the time of writing, i.e., June 2026, which is reported in Table S4. In fact, calculating p=13 % over the extended time domain does not produce any significant change in the probability estimates presented in this study. Similarly, after including the uncertain major explosions, negligibly increases from 8.3 % to 8.8 % after the updated record. Table S5 summarizes the calculated values of p, as a function of the considered datasets of major explosions and paroxysms, and includes a 90 % confidence interval based on a binomial test (Clopper and Pearson, 1934; see Bevilacqua et al., 2026b for more details). Finally, the rate of 12 % is still well representative of the current style of activity.
In this study, the first quantitative doubly stochastic probability maps of the areas potentially affected by ballistic fallout from major explosions and paroxysms, as well as from their combination, at Stromboli, have been presented. The hazard maps were based on a new database of simplified maps of the area affected by ballistics produced from the analysis of the rich information included in the historical and recent catalogs of the explosive activity of Stromboli, coming from all available scientific literature as well as from monitoring and field/observation reports, as described in Bevilacqua et al. (2026a). Moreover, the proposed hazard maps were based on the combination of three diverse and complementary models to statistically combine the distributions of directions and distances of ballistic fallout as estimated from the data. A key feature of the probabilistic hazard maps is also the quantitative description of the uncertainty associated with the reconstruction of the areas affected by ballistic fallout during past events.
In particular, the main findings of the study are:
-
Based on the frequency of available observations, ballistic dispersals from major explosions and paroxysms show distinct patterns which were illustrated by the so-called Model 1 (Fig. 4a ,b). For major explosions, ballistic dispersal is predominantly towards NE for contours below 35 %, with a 2 % probability up to about 400 m a.s.l., whereas contours over 35 % are slightly asymmetric towards SE, i.e. the upper portion of Rina Grande. For paroxysms, all the contours are more extended towards NE and mostly towards WSW, with the 35 % contours enclosing regions at 300 m a.s.l. in both directions, on the slopes above Ginostra and Stromboli villages, and about 20 % probability of affecting the entire village of Ginostra, which, as a result, is particularly exposed to ballistic fallout.
-
To account for a likely under-sampling in the less accessible sectors of the island and for unobserved enhanced dispersal of ballistics in other directions due to potential variations in the morphology of craters and/or shallow part of conduits, Model 2 and Model 3 were introduced (Fig. 4c ,d, e, f). These two models dominate in distinct directions different from those of Model1, differing up to ±15 % in mean value. The maximum of the three Models in each location was then chosen to produce robust and, at the same time, conservative maps for major explosions and paroxysms, considered as separate categories (see Figs. 6 and 7, respectively). Notably, except for two limited regions along NE and S shores, the entire island has over 2 % probability of being affected by ballistic fallout during a paroxysm.
-
Given the substantial continuity of the main parameters characterizing the ballistic fallout for major explosions and paroxysms (Bevilacqua et al., 2026a), and the present impossibility to predict with certainty the type of the next event, combined hazard maps for major explosions and paroxysms were also produced by assuming a relative proportion of the two categories as observed over the last few decades (Figs. 8 and S3). For instance, assuming a relative proportion of events as in the period 2003–2023 (i.e., 12 % or paroxysms over the total of paroxysms and major explosions), in the resulting mean map (Fig. 8), the NE trails at 600 m are affected with ca. 25 % probability, the viewpoints at 400 m a.s.l. on Labronzo trail and at 450 m on the Ginostra trail with ca. 8 % and 7 % probability, respectively. The viewpoint at 290 m on Labronzo trail and Ginostra Village are affected with ca. 5 % and 3 % probability, respectively. The sea in front of Sciara del Fuoco is affected by ca. 2 % probability up to 600 m from the shoreline whereas almost the entire Sciara is interested by probabilities above 5 %.
-
The uncertainty associated with the reconstructed areas affected by ballistic fallout has an appreciable but overall limited effect. The 95th percentile contours are ca. 150 m larger than the 5th percentile equivalents, for major explosions, and up to 250 m larger, for paroxysms. Similarly, using the lower event ratio of major explosions and paroxysms as observed from 1970 to 2023 (7.3 % instead of 12 %) has also a limited effect. For instance, on the NE trails at ca. 600 m a.s.l. the probability decreases of ca. 5 %, at the 400 m viewpoint on Labronzo trail the probability decreases of ca. 2 %, and in Ginostra village of ca. 1.5 %.
-
The product of the hourly probability of major explosions and paroxysms based on the occurrence model of Bevilacqua et al. (2020a), and of the conditional hazard maps presented here, provides hourly hazard assessments of the areas affected by ballistic fallout (Fig. 11). Hourly probabilities after 30 d of the last major explosion or paroxysm are about 0.05 % whereas after 3 months without major explosions or paroxysms they decrease to about 0.025 %. In addition, the hourly probability of the paroxysms shows a long-lasting increase, up to 0.013 %, for over a year after every event of that type, which has significant implications in the resulting hazard maps, especially below 400 m a.s.l.
-
According to the temporal modeling of recurrence times updated from Bevilacqua et al. (2020a) (Table S3 and Fig. S7), in the next 10 years we estimated a total of N=24 major explosions and paroxysms on average, with 90 % uncertainty from 14 to 33 events; in the next 50 years N=120, with 90 % uncertainty from 96 to 140. These values include ca. uncertain major explosions. The combination of these estimates and conditional hazard maps produces probability maps of the areas affected by ballistic projectiles of at least one major explosion or paroxysm in the next 10 years (Fig. 12). These maps also account for the occurrence of multiple major explosions and paroxysms. In particular, in the next 10 years Stromboli Village has 5 % to 10 % probability to be affected by ballistic fallout, and Ginostra 35 % to 50 %, respectively after excluding the uncertain major explosions from the temporal modeling or after including them.
The probabilistic hazard maps presented, either conditional on the occurrence of the event or over a specific time period, represent a first attempt to quantify the ballistic fallout hazard at Stromboli. Despite the several limitations of the approach followed as well as the still incomplete description of this activity, the maps are able to describe the main features of this phenomenon and associated hazard also including the quantification of some important sources of uncertainty. The maps represent a prerequisite to produce quantitative impact and risk assessments for the exposed individuals and buildings, once combined with vulnerability functions and exposure data (e.g. Baxter et al., 2008; Neri et al., 2008). Some of these findings have been already used to investigate the prevailing directions of coarse products ejection with the aim to assess the valleys most exposed to deposit-derived PDCs (Neri et al., 2026; Bevilacqua et al., 2026). Finally, the study highlights the importance of a close and continuous observation of the explosive activity of Stromboli aimed to quantify the ballistic dispersal as well as of its quantitative representation in order to produce quantitative hazard analyses.
The full collection of simplified maps of major explosions and paroxysms is available in the companion study Bevilacqua et al. (2026). The dataset of ASCII files of the presented probability maps is available at https://doi.org/10.5281/zenodo.14268921 (Bevilacqua et al., 2024b). The derived data is available under request and the R scripts utilized for statistical analysis are available at https://doi.org/10.5281/zenodo.21476780 (Bevilacqua and Neri, 2026).
The supplement related to this article is available online at https://doi.org/10.5194/nhess-26-4503-2026-supplement.
All authors gathered, cured, and discussed the historical data, their classification, and uncertainty quantification of the past ballistic dispersions. A.B. and A.N. conceived the main modeling ideas and scientific objectives. A.B. implemented the codes, performed the statistical analysis, and produced the graphs and maps. A.B. and A.N. prepared the first draft of the manuscript. All authors discussed the results, commented on the manuscript, provided critical feedback, and gave final approval for publication.
The contact author has declared that none of the authors has any competing interests.
The manuscript does not necessarily represent official views and policies of the Dipartimento della Protezione Civile (Italy).
Publisher's note: Copernicus Publications remains neutral with regard to jurisdictional claims made in the text, published maps, institutional affiliations, or any other geographical representation in this paper. The authors bear the ultimate responsibility for providing appropriate place names. Views expressed in the text are those of the authors and do not necessarily reflect the views of the publisher.
We would like to thank the Associate Editor, as well as Gianfilippo De Astis and an anonymous reviewer, for their thoughtful review of this study. We also thank two anonymous reviewers that provided comments on a previous version of the manuscript, which significantly helped to strengthen our analysis. The contribution and support of ideas of many colleagues participating to the supporting projects are acknowledged.
This research has been supported by the Dipartimento della Protezione Civile, Presidenza del Consiglio dei Ministri (Convenzione Attuativa per il Potenziamento delle Attività di Servizio, Task 4.1, Accordo Quadro DPC-INGV 2022-2028, and Piano di Potenziamento Stromboli EW-DPC, ex OCDPC n. 762/2021 grant) and the Istituto Nazionale di Geofisica e Vulcanologia (Rete Multiparametrica – Vulcani grant).
This paper was edited by Amy Donovan and reviewed by Gianfilippo De Astis and one anonymous referee.
Alatorre-Ibargüengoitia, M. A., Morales-Iglesias, H., Ramos-Hernández, S. G., Jon-Selvas, J., and Jiménez-Aguilar, J. M.: Hazard zoning for volcanic ballistic impacts at El Chichón Volcano (Mexico), Nat. Hazards, 81, https://doi.org/10.1007/s11069-016-2152-0, 2016.
Andronico, D. and Pistolesi, M.: The November 2009 paroxysmal explosions at Stromboli, J. Volcanol. Geoth. Res., 196, 120–125, https://doi.org/10.1016/j.jvolgeores.2010.06.005, 2010.
Andronico, D., Del Bello, E., D'Oriano, C., Landi, P., Pardini, F., Scarlato, P., de' Michieli Vitturi, M., Taddeucci, J., Cristaldi, A., Ciancitto, F., Pennacchia, F., Ricci, T., and Valentini, F.: Uncovering the eruptive patterns of the 2019 double paroxysm eruption crisis of Stromboli volcano, Nat. Commun., 12, 4213, https://doi.org/10.1038/s41467-021-24420-1, 2021.
Aravena, A., Bevilacqua, A., Neri, A., Gabellini, P., Ferrés, D., Escobar, D., Aiuppa, A., and Cioni, R.: Scenario-based probabilistic hazard assessment for explosive events at the San Salvador volcanic complex, El Salvador, J. Volcanol. Geoth. Res., 438, 107809, https://doi.org/10.1016/j.jvolgeores.2023.107809, 2023.
Barberi, F., Rosi, M., and Sodi, A.: Volcanic hazard assessment at Stromboli based on review of historical data, Acta Vulc., 3, 173–187, 1993.
Baxter, P. J. and Gresham, A.: Deaths and injuries in the eruption of Galeras Volcano, Colombia, J. Volcanol. Geoth. Res., 77, 325–338, https://doi.org/10.1016/S0377-0273(96)00103-5, 1997.
Baxter, P. J., Aspinall, W., Neri, A., Zuccaro, G., Spence, R. S. J., Cioni, R., and Woo, G.: Emergency planning and mitigation at Vesuvius: A new evidence-based approach, J. Volcanol. Geoth. Res., 178, 454–473, https://doi.org/10.1016/j.jvolgeores.2008.08.015, 2008.
Bebbington, M. S.: Assessing spatio-temporal eruption forecast in a monogenetic volcanic field, J. Volcanol. Geoth. Res., 252, 14–28, 2013.
Bernard, B.: Rapid hazard assessment of volcanic ballistic projectiles using long-exposure photographs: insights from the 2010 eruptions at Tungurahua volcano, Ecuador, Volcanica, 1, 49–61, https://doi.org/10.30909/vol.01.01.4961, 2018.
Bertagnini, A., Coltelli, M., Landi, P., Pompilio, M., and Rosi, M.: Violent explosions yield new insights into dynamics of Stromboli volcano, EOS T. Am. Geophys. Un., 80, 633–636, https://doi.org/10.1029/99EO00415, 1999.
Bertagnini, A., Metrich, N., Francalanci, L., Landi, P., Tommasini, S., and Conticelli, S.: Volcanology and magma geochemistry of the present-day activity: constraints on the feeding system, in: Learning from Stromboli, edited by: Calvari, S., Inguaggiato, S., Puglisi, G., Ripepe, M., and Rosi, M., American Geophysical Union, Geophys Mono 182, Washington, DC, 19–38, https://doi.org/10.1029/182GM04, 2008.
Bertagnini, A., Di Roberto, A., and Pompilio, M.: Paroxysmal activity at Stromboli: lessons from the past, B. Volcanol., 73, https://doi.org/10.1007/s00445-011-0470-3, 2011.
Bertin, D.: 3-D ballistic transport of ellipsoidal volcanic projectiles considering horizontal wind field and variable shape-dependent drag coefficients, J. Geophys. Res.-Sol. Ea., 122, 1126–1151, https://doi.org/10.1002/2016JB013320, 2017.
Bevilacqua, A.: Doubly stochastic models for volcanic hazard assessment at Campi Flegrei caldera, Theses, 21, Edizioni della Normale, Birkhäuser/Springer, 227 pp., https://doi.org/10.1007/978-88-7642-577-6, 2016.
Bevilacqua, A. and Neri, A.: Software supporting: Ballistic projectile hazard of major explosions and paroxysms at Stromboli (Italy) with uncertainty quantification: 2. Conditional and temporal probability maps, Zenodo [software], https://doi.org/10.5281/zenodo.21476780, 2026.
Bevilacqua, A., Isaia, R., Neri, A., Vitale, S., Aspinall, W. P., Bisson, M., Flandoli, F., Baxter, P. J., Bertagnini, A., Esposti Ongaro, T., Iannuzzi, E., Pistolesi, M., and Rosi, M.: Quantifying volcanic hazard at Campi Flegrei caldera (Italy) with uncertainty assessment: I. Vent opening maps, J. Geophys. Res.-Sol. Ea., 120, 2309–2329, https://doi.org/10.1002/2014JB011775, 2015.
Bevilacqua, A., Flandoli, F., Neri, A., Isaia, R., and Vitale, S.: Temporal models for the episodic volcanism of Campi Flegrei caldera (Italy) with uncertainty quantification, J. Geophys. Res.-Sol. Ea., 121, 7821–7845, https://doi.org/10.1002/2016JB013171, 2016.
Bevilacqua, A., Neri, A., Bisson, M., Esposti Ongaro, T., Flandoli, F., Isaia, R., Rosi, M., and Vitale, S.: Effects of vent location, event scale and time forecasts on pyroclastic density currents hazard maps at Campi Flegrei caldera, (Italy), Front. Earth Sci., 5, 1–16, https://doi.org/10.3389/feart.2017.00072, 2017.
Bevilacqua, A., Bursik, M., Patra, A., Pitman, E. B., Yang, Q., Sangani, R., and Kobs-Nawotniak, S.: Late Quaternary eruption record and probability of future volcanic eruptions in the Long Valley volcanic region (CA, USA), J. Geophys. Res.-Sol. Ea., 123, 5466–5494, https://doi.org/10.1029/2018JB015644, 2018.
Bevilacqua, A., Bertagnini, A., Pompilio, M., Landi, P., Del Carlo, P., Di Roberto, A., Aspinall, W., and Neri, A.: Major explosions and paroxysms at Stromboli (Italy): a new historical catalog and temporal models of occurrence with uncertainty quantification, Sci. Rep., 10, 17357, https://doi.org/10.1038/s41598-020-74301-8, 2020a.
Bevilacqua, A., Bertagnini, A., Pompilio, M., Landi, P., Del Carlo, P., Di Roberto, A., Piccione, C., and Neri, A.: Historical catalog of major explosions and paroxysms at Stromboli (Italy), INGV Ufficio Dati [data set], https://doi.org/10.13127/STROMBOLI/STRCATALOG, 2020b.
Bevilacqua, A., Bertagnini, A., Pompilio, M., Landi, P., Del Carlo, P., Di Roberto, A., Piccione, C., Falsaperla, S., Spampinato, S., and Neri, A.: Catalog of major explosions and paroxysms at Stromboli volcano (Italy) from 1970 to 2023, INGV Ufficio Dati [data set], https://doi.org/10.13127/STROMBOLI/STRCATALOG2, 2023.
Bevilacqua, A., Nannipieri, L., Favalli, M., and Fornaciai, A.: UAS-based mapping of the July 3, 2019, ballistics density distribution on the W flank of Stromboli with uncertainty quantification, B. Volcanol., 86, 48, https://doi.org/10.1007/s00445-024-01741-9, 2024a.
Bevilacqua, A., Neri, A., Landi, P., Del Carlo, P., and Pompilio, M.: Database of probability maps supporting: “Quantifying ballistic projectile hazard of major explosions and paroxysms at Stromboli (Italy) with uncertainty assessment: 2. probability maps”, Zenodo [data set], https://doi.org/10.5281/zenodo.14268921, 2024b.
Bevilacqua, A., Landi, P., Del Carlo, P., Neri, A., and Pompilio, M.: Ballistic projectile hazard of major explosions and paroxysms at Stromboli (Italy) with uncertainty quantification – Part 1: Mapping method and data analysis, Nat. Hazards Earth Syst. Sci., 26, 4479–4502, https://doi.org/10.5194/nhess-26-4479-2026, 2026a.
Bevilacqua, A., Neri, A., Bertagnini, A., Corna, L., de' Michieli Vitturi, M., Di Roberto, A., Di Traglia, F., Flandoli, F., Geddo, Z., Pompilio, M., and Tadini, A.: Assessing deposit-derived pyroclastic flow hazard at Stromboli (Italy): 2. Probabilistic invasion maps, J. Geophys. Res.-Sol. Ea., 131, e2025JB032571, https://doi.org/10.1029/2025JB032571, 2026b.
Biass, S., Falcone, J. L., Bonadonna, C., Di Traglia, F., Pistolesi, M., Rosi, M., and Lestuzzi, P.: Great Balls of Fire: A probabilistic approach to quantify the hazard related to ballistics – A case study at La Fossa volcano, Vulcano Island, Italy, J. Volcanol. Geoth. Res., 325, 1–14, https://doi.org/10.1016/j.jvolgeores.2016.06.006, 2016.
Bisson, M., Spinetti, C., Gianardi, R., Strehlow, K., De Beni, E., and Landi, P.: High-resolution mapping and dispersion analyses of volcanic ballistics emitted during the 3rd July 2019 paroxysm at Stromboli, Sci. Rep., 13, 13465, https://doi.org/10.1038/s41598-023-39600-w, 2023.
Breard, E. C. P., Lube, G., Cronin, S. J., Fitzgerald, R., Kennedy, B., Scheu, B., Montanaro, C., White, J. D. L., Tost, M., Procter, J. N., and Moebis, A.: Using the spatial distribution and lithology of ballistic blocks to interpret eruption sequence and dynamics: August 6 2012 Upper Te Maari eruption, New Zealand, J. Volcanol. Geoth. Res., 276, 383–376, 2014.
Brown, S. K., Jenkins, S. F., Stephen, R., Sparks, J., Odbert, H., and Auker, M. R.: Volcanic fatalities database: analysis of volcanic threat with distance and victim classification, J. Appl. Volcanol., 6, 15, https://doi.org/10.1186/s13617-017-0067-4, 2017.
Calvari, S., Giudicepietro, F., Di Traglia, F., Bonaccorso, A., Macedonio, G., and Casagli, N.: Variable Magnitude and Intensity of Strombolian Explosions: Focus on the Eruptive Processes for a First Classification Scheme for Stromboli Volcano (Italy), Remote Sens., 13, 944, https://doi.org/10.3390/rs13050944, 2021.
Capaldi, G., Guerra, I., Lo Bascio, A., Luongo, G., Pece, R., Rapolla, A., and Scarpa, R.: Stromboli and its 1975 eruption, B. Volcanol., 41, 259–285, https://doi.org/10.1007/BF02597227, 1978.
Carcano, S., Bonaventura, L., Esposti Ongaro, T., and Neri, A.: A semi-implicit, second-order-accurate numerical model for multiphase underexpanded volcanic jets, Geosci. Model Dev., 6, 1905–1924, https://doi.org/10.5194/gmd-6-1905-2013, 2013.
Chouet, B., Dawson, P., and Martini, M.: Shallow-conduit dynamics at Stromboli Volcano, Italy, imaged from waveform inversions, in: Fluid Motions in Volcanic Conduits: A Source of Seismic and Acoustic Signals, edited by: Lane, S. J. and Gilbert, J. S., Geological Society, London, Special Publications, 307, 161–184, https://doi.org/10.1144/SP307.9, 2008.
Clopper, C. J. and Pearson, E. S.: The use of confidence or fiducial limits illustrated in the case of the binomial, Biometrika, 26, 404–413, https://doi.org/10.2307/2331986, 1934.
Coltelli, M., Del Carlo, P., and Pompilio, M.: Vulcano and Stromboli, 1. Eruptive History (Stromboli), Acta Vulc., 12, 93–95, 2000.
Corradino, C., Amato, E., Torrisi, F., Calvari, S., and Del Negro, C.: Classifying Major Explosions and Paroxysms at Stromboli Volcano (Italy) from Space, Remote Sens., 13, 4080, https://doi.org/10.3390/rs13204080, 2021.
Davies, P.: A guide to the evaluation of condensed phase explosions, J. Hazard. Mater., 33, 1–33, https://doi.org/10.1016/0304-3894(93)85061-I, 1993.
Deligne, N. I., Jolly, G. E., Taig, T., and Webb, T.: Evaluating life-safety risk for fieldwork on active volcanoes: the volcano life risk estimator (VoLREst), a volcano observatory's decision-support tool, J. Appl. Volcanol., 7, https://doi.org/10.1186/s13617-018-0076-y, 2018.
de' Michieli Vitturi, M., Neri, A., Esposti Ongaro, T., Lo Savio, S., and Boschi, E.: Lagrangian modeling of large volcanic particles: Application to Vulcanian explosions, J. Geophys. Res., 115, B08206, https://doi.org/10.1029/2009JB007111, 2010.
Di Traglia, F., Fornaciai, A., Favalli, M., Nolesini, T., and Casagli, N.: Catching geomorphological response to volcanic activity on steep slope volcanoes using multi‐platform remote sensing, Remote Sens., 12, 438, https://doi.org/10.3390/rs12030438, 2020.
Esposti Ongaro, T., Neri, A., Menconi, G., de' Michieli Vitturi, M., Marianelli, P., Cavazzoni, C., Erbacci, G., and Baxter, P. J.: Transient 3D numerical simulations of column collapse and pyroclastic density current scenarios at Vesuvius, J. Volcanol. Geoth. Res., 178, 378–396, https://doi.org/10.1016/j.jvolgeores.2008.06.036, 2008.
Finizola, A., Sortino, F., Lénat, J. F., and Valenza, M.: Fluid circulation at Stromboli volcano (Aeolian Islands, Italy) from self-potential and CO2 surveys, J. Volcanol. Geoth. Res., 116, 1–18, https://doi.org/10.1016/S0377-0273(01)00327-4, 2002.
Fitzgerald, R. H., Tsunematsu, K., Kennedy, B. M., Breard, E. C. P., Lube, G., Wilson, T. M., Jolly, A. D., Pawson, J., Rosenberg, M. D., and Cronin, S. J.: The application of a calibrated 3D ballistic trajectory model to ballistic hazard assessments at Upper TeMaari, Tongariro, J. Volcanol. Geoth. Res., 286, 248–262, 2014.
Fitzgerald, R. H., Kennedy, B. M., Wilson, T. M., Leonard, G. S., Tsunematsu, K., and Keys, H.: The communication and risk management of volcanic ballistic hazards, in: Observing the Volcano World, Volcano Crisis Communication, edited by: Fearnley, C. J., Bird, D. K., Haynes, K., McGuire, W. J., and Jolly, G., Springer Open, Advs in Volcanology, 121–147, https://doi.org/10.1007/11157_2016_35, 2018.
Genco, R. and Ripepe, M.: Inflation-deflation cycles revealed by tilt and seismic records at Stromboli volcano, Geophys. Res. Lett., 37, L12302, https://doi.org/10.1029/2010GL042925, 2010.
Giordano, G. and De Astis, G.: The summer 2019 basaltic Vulcanian eruptions (paroxysms) of Stromboli, B. Volcanol., 83, 1–27, https://doi.org/10.1007/s00445-020-01423-2, 2021.
Graettinger, A. H., Valentine, G. A., and Sonder, I.: Circum-crater variability of deposits from discrete, laterally and vertically migrating volcanic explosions: Experimental evidence and field implications, J. Volcanol. Geoth. Res., 308, 61–69, https://doi.org/10.1016/j.jvolgeores.2015.10.019, 2015.
Guardo, R., Bilotta, G., Ganci, G., Zuccarello, F., Andronico, D., and Cappello, A.: Modeling Fire Hazards Induced by Volcanic Eruptions: The Case of Stromboli (Italy), Fire, 7, 70, https://doi.org/10.3390/fire7030070, 2024.
Gurioli, L., Harris, A. J. L., Colo, L., Bernard, J., Favalli, M., Ripepe, M., and Andronico, D.: Classification, landing distribution, and associated flight parameters for a bomb field emplaced during a single major explosion at Stromboli, Italy, Geology, 41, 559–562, 2013.
Iacono, F., Bisson, M., Spinetti, C., and Kwasnitschka, T.: Wildfires Induced by Volcanic Activity at Stromboli Island during the 2019 Summer through Satellite and Drone Data, Remote Sens. Earth Syst. Sci., 8, 733–752, https://doi.org/10.1007/s41976-025-00215-6, 2025.
Jolly, G. E., Keys, H. J. R., Procter, J. N., and Deligne, N. I.: Overview of the co-ordinated risk-based approach to science and management response and recovery for the 2012 eruptions of Tongariro volcano, New Zealand, J. Volcanol. Geoth. Res., 286, 184–207, 2014.
Konstantinou, K. I.: Maximum horizontal range of volcanic ballistic projectiles ejected during explosive eruptions at Santorini caldera, J. Volcanol. Geoth. Res., 301, 107–115, 2015.
Laiolo, M., Coppola, D., Aveni, S., Campus, A., Massimetti, F., Aiuppa, A., Innocenti, L., Lacanna, G., Trisciuzzi, G. L. B., Pistolesi, M., Ripepe, M., and Voloschina, M.: Switching between ordinary and non-ordinary activity at Stromboli volcano: insights from short- and long-term thermal trends recorded from space, B. Volcanol., 88, 11, https://doi.org/10.1007/s00445-025-01932-y, 2026.
Linde, N., Baron, L., Ricci, T., Finizola, A., Revil, A., Muccini, F., and Carmisciano, C.: 3-D density structure and geological evolution of Stromboli volcano (Aeolian Islands, Italy) inferred from land-based and sea-surface gravity data, J. Volcanol. Geoth. Res., 273, 58–69, https://doi.org/10.1016/j.jvolgeores.2014.01.006, 2014.
Tioukov, V., Alexandrov, A., Bozza, C., Consiglio, L., D'Ambrosio, N., De Lellis, G., De Sio, C., Giudicepietro, F., Macedonio, G., Miyamoto, S., Nishiyama, R., Orazi, M., Peluso, R., Sheshukov, A., Sirignano, C., Stellacci, S. M., Strolin, P., and Tanaka, H. K. M.: First muography of Stromboli volcano, Sci. Rep., 9, 6695, https://doi.org/10.1038/s41598-019-43131-8, 2019.
Maeno, F., Nakada, S., Nagai, M., and Kozono, T.: Ballistic ejecta and eruption condition of the vulcanian explosion of Shinmoedake volcano, Kyushu, Japan on 1 February, 2011, Earth Planet. Space, 65, 609–621, 2013.
Marzocchi, W. and Bebbington, M. S.: Probabilistic eruption forecasting at short and long time scales, B. Volcanol., 74, 1777–1805, 2012.
MASE: DTM LiDAR con risoluzione a terra 1 metro – Regione Sicilia, Geoportale Nazionale, Ministero dell'Ambiente e della Sicurezza Energetica, http://www.pcn.minambiente.it/ (last access: 26 June 2026), 2013.
Massaro, S., Rossi, E., Sandri, L., Bonadonna, C., Selva, J., Moretti, R., and Komorowski, J. C.: Assessing hazard and potential impact associated with volcanic ballistic projectiles: The example of La Soufrière de Guadeloupe volcano (Lesser Antilles), J. Volcanol. Geoth. Res., 423, 107473, https://doi.org/10.1016/j.jvolgeores.2021.107453, 2022.
Mastin, L. G.: Plots of Wind Patterns of the World's Volcanoes: U.S. Geological Survey data release, USGS Volcano Science Center [data set], https://doi.org/10.5066/F7SQ8XKT, 2017.
Métrich, N., Bertagnini, A., and Pistolesi, M.: Paroxysms at Stromboli volcano (Italy): source, genesis and dynamics, Front. Earth Sci., 9, 1–17, https://doi.org/10.3389/feart.2021.593339, 2021.
Nappi, G.: Rischio vulcanico e sorveglianza nei Campi Flegrei e nell'isola di Stromboli, Boll. Soc. Geol. Ital., 98, 141–156, 1977.
Neri, A., Aspinall, W. P., Cioni, R., Bertagnini, A., Baxter, P. J., Zuccaro, G., Andronico, D., Barsotti, S., Cole, P. D., Esposti Ongaro, T., Hincks, T. K., Macedonio, G., Papale, P., Rosi, M., Santacroce, R., and Woo, G.: Developing an Event Tree for Probabilistic Hazard and Risk Assessment at Vesuvius, J. Volcanol. Geoth. Res., 178, 397–415, https://doi.org/10.1016/j.jvolgeores.2008.05.014, 2008.
Neri, A., Bevilacqua, A., Esposti Ongaro, T., Isaia, R., Aspinall, W. P., Bisson, M., Flandoli, F., Baxter, P. J., Bertagnini, A., Iannuzzi, E., Orsucci, S., Pistolesi, M., Rosi, M., and Vitale, S.: Quantifying volcanic hazard at Campi Flegrei caldera (Italy) with uncertainty assessment: II. Pyroclastic density current invasion maps, J. Geophys. Res.-Sol. Ea., 120, 2330–2349, https://doi.org/10.1002/2014JB011776, 2015.
Neri, A., Bevilacqua, A., Geddo, Z., Corna, L., de' Michieli Vitturi, M., Di Roberto, A., Di Traglia, F., Pompilio, M., Bertagnini, A., Flandoli, F., and Tadini, A.: Assessing deposit-derived pyroclastic flow hazard at Stromboli (Italy): 1. Reconstruction of the dynamics of the 11 September 1930 event, J. Geophys. Res.-Sol. Ea., 131, e2025JB032568, https://doi.org/10.1029/2025JB032568, 2026.
Ogden, D. E., Wohletz, K. H., Brodski, E. E., and Glatzmaier, G. A.: Numerical simulation of volcanic jets: importance of vent overpressure, J. Geophys. Res., 113, B02204, https://doi.org/10.1029/2007JB005133, 2007.
Pioli, L., Pistolesi, M., and Rosi, M.: Transient explosions at open-vent volcanoes: the case of Stromboli (Italy), Geology, 3–6, https://doi.org/10.1130/G35844.1, 2014.
Pistolesi, M., Delle Donne, D., Pioli, L., Rosi, M., and Ripepe, M.: The 15 March 2007 explosive crisis at Stromboli volcano, Italy: Assessing physical parameters through a multidisciplinary approach, J. Geophys. Res., 116, B12206, https://doi.org/10.1029/2011JB008527, 2011.
Pompilio, M., Bertagnini, A., and Di Roberto, A.: Present-day activity of Stromboli: eruptive history and eruptive styles, Acta Vulc., 22, 29–34, 2010.
Re, G., Di Roberto, A., Del Carlo, P., and Pompilio, M.: Evolution of the eruptive activity at Stromboli (Aeolian Islands – Italy) during the last 4 millennia. A tephrostratigraphic investigation on the early-phase of Recent Stromboli Eruptive Epoch, J. Volcanol. Geoth. Res., 462, 108308, https://doi.org/10.1016/j.jvolgeores.2025.108308, 2025.
Ripepe, M., Lacanna, G., Pistolesi, M., Silengo, M. C., Aiuppa, A., Laiolo, M., Massimetti, F., Innocenti, L., Della Schiava, M., Bitetto, M., La Monica, F. P., Nishimura, T., Rosi, M., Mangione, D., Ricciardi, A., Genco, R., Coppola, D., Marchetti, E., and Delle Donne, D.: Ground deformation reveals the scale-invariant conduit dynamics driving explosive basaltic eruptions, Nat. Commun., 12, 1683, https://doi.org/10.1038/s41467-021-21722-2, 2021.
Rittmann, A.: Der Ausbruch des Stromboli am 11 September 1930, Zeits. Vulkanol., 14, 47–77, 1931.
Rosi, M., Bertagnini, A., and Landi, P.: Onset of the persistent activity at Stromboli Volcano (Italy), B. Volcanol., 62, 294–300, https://doi.org/10.1007/s004450000098, 2000.
Rosi, M., Bertagnini, A., Harris, A. J. L., Pioli, L., Pistolesi, M., and Ripepe, M.: A case history of paroxysmal explosion at Stromboli: timing and dynamics of the April 5, 2003 event, Earth Planet. Sc. Lett., 243, 594–606, https://doi.org/10.1016/j.epsl.2006.01.035, 2006.
Rosi, M., Pistolesi, M., Bertagnini, A., Landi, P., Pompilio, M., and Di Roberto, R.: Stromboli volcano, Aeolian Islands (Italy): present eruptive activity and hazards, in: The Aeolian Islands Volcanoes, edited by: Lucchi, F., Peccerillo, A., Keller, J., Tranne, C. A., and Rossi, P. L., Geological Society, London, Memoirs, 37, 473–490, https://doi.org/10.1144/M37.14, 2013.
Rosi, M., Di Traglia, F., Pistolesi, M., Esposti Ongaro, T., de' Michieli Vitturi, M., and Bonadonna, C.: Dynamics of shallow hydrothermal eruptions: new insights from Vulcano's Breccia di Commenda eruption, B. Volcanol., 80, 83, https://doi.org/10.1007/s00445-018-1252-y, 2018.
Rutarindwa, R., Spiller, E. T., Bevilacqua, A., Bursik, M. I., and Patra, A. K.: Dynamic probabilistic hazard mapping in the Long Valley Volcanic Region CA: Integrating vent opening maps and statistical surrogates of physical models of pyroclastic density currents, J. Geophys. Res.-Sol. Ea., 124, https://doi.org/10.1029/2019JB017352, 2019.
Schmid, M., Kueppers, U., Ricci, T., Civico, R., Cigala, V., Fee, D., Gestrich, J. E., Iezzi, A. M., Cimarelli, C., Vossen, C. E. J., Buzard, R. M., Ripepe, M., Lacanna, G., and Dingwell, D. B.: The morphological response to the 13 May 2022 major explosive event at Stromboli volcano, Italy, characterised by high-resolution UAS surveys, Volcanica, 8, 387–397, https://doi.org/10.30909/vol/crjj4989, 2025.
Sparks, R. S. J. and Aspinall, W. A.: Volcanic activity: Frontiers and challenges in forecasting, prediction and risk assessment, in: The state of the planet, Frontiers and challenges in geophysics, Geophys Mono 150, IUGG, 19, 359–373, https://doi.org/10.1029/150GM28, 2004.
Taddeucci, J., Valentine, G. A., Sonder, I., White, J. D. L., Ross, P. S., and Scarlato, P.: The effect of pre-existing craters on the initial development of explosive volcanic eruptions: An experimental investigation, Geophys. Res. Lett., 40, 507–510, https://doi.org/10.1002/grl.50176, 2013.
Taddeucci, J., Alatorre-Ibargüengoitia, M. A., Cruz-Vàzquez, O., Del Bello, E., Scarlato, P., and Ricci, T.: In-flight dynamics of volcanic ballistic projectiles, Rev. Geophys., 55, 675–718, https://doi.org/10.1002/2017RG000564, 2017.
Tibaldi, A., Corazzato, C., Marani, M., and Gamberi, F.: Subaerial-submarine evidence of structures feeding magma to Stromboli Volcano, Italy, and relations with edifice flank failure and creep, Tectonophysics, 469, 112–136, https://doi.org/10.1016/j.tecto.2009.01.031, 2009.
TNO: Methods for the determination of possible damage to people and objects resulting from release of hazardous materials, Nederlandse organisatie voor toegepast-natuurwetenschappelijk onderzoek (TNO), Committee for the Prevention of Disasters, The Hague, 337 pp., ISBN 90-5307-052-4, 1992.
Tsunematsu, K., Chopard, B., Falcone, J. L., and Bonadonna, C.: A numerical model of ballistic transport with collisions in a volcanic setting, Comput. Geosci., 63, 62–69, https://doi.org/10.1016/j.cageo.2013.10.016, 2015.
Turchi, A., Di Traglia, F., Luti, T., Olori, D., Zetti, I., and Fanti, R.: Environmental aftermath of the 2019 Stromboli eruption, Remote Sens., 12, 994, https://doi.org/10.3390/rs12060994, 2020.
Valentine, G. A., White, J. D. L., Ross, P.-S., Amin, J., Taddeucci, J., Sonder, I., and Johnson, P. J.: Experimental craters formed by single and multiple buried explosions and implications for volcanic craters with emphasis on maars, Geophys. Res. Lett., 39, L20301, https://doi.org/10.1029/2012GL053716, 2012.
Vanderkluysen, L., Harris, A. J. L., Kelfoun, K., Bonadonna, C., and Ripepe, M.: Bombs behaving badly: unexpected trajectories and cooling of volcanic projectiles, B. Volcanol., 74, 1849–1858, https://doi.org/10.1007/s00445-012-0635-8, 2012.
Voloschina, M., Métrich, N., Bertagnini, A., Marianelli, P., Aiuppa, A., Ripepe, M., and Pistolesi, M.: Explosive eruptions at Stromboli volcano (Italy): a comprehensive geochemical view on magma sources and intensity range, B. Volcanol., 85, 34, https://doi.org/10.1007/s00445-023-01647-y, 2023.
Williams, G. T., Kennedy, B. M., Wilson, T. M., Fitzgerald, R. H., Tsunematsu, K., and Teissier, A.: Buildings vs. ballistics: Quantifying the vulnerability of buildings to volcanic ballistic impacts using field studies and pneumatic cannon experiments, J. Volcanol. Geoth. Res., 343, 171–180, 2017.
Wilson, L.: Explosive Volcanic Eruptions-II The Atmospheric Trajectories of Pyroclasts, Geophys. J. Internat., 30, 381–392, https://doi.org/10.1111/j.1365-246X.1972.tb05822.x, 1972.