
the Creative Commons Attribution 4.0 License.
the Creative Commons Attribution 4.0 License.
 | 12 Oct 2026
Human-centred design approaches to tsunami mitigation under sea level rise in Kesennuma, Japan
Hayley Leggett

Muhammad Daffa Al Farizi
Muhammad Rizki Purnama
Anawat Suppasri
Fumihiko Imamura
Human-centred design (HCD) is increasingly prioritised as studies show human experience is critical in infrastructure use, and recent policies call for more socially responsive design. Tsunami impacts intensify as sea level rise (SLR) raises baseline water levels and reduces existing defence effectiveness. This study aims to develop and evaluate HCD-integrated multi-layered tsunami defences, assessing whether socially integrated designs can deliver effective protection under projected SLR conditions. Based on identified infrastructure preferences in Kesennuma City, Japan, we develop three multi-layered defence configurations: an environmentally integrated eco-hybrid system (Defence 1), a discreet open-feeling barrier system (Defence 2), and a reinforced high-performance system (Defence 3). Using TUNAMI-N2 numerical modelling, 150 simulations combine three tsunami sources, five SLR conditions, and five defence states. Results for inundation extent, fatality rates, and economic loss show a consistent hierarchy: Defence 3 achieves the strongest containment, while Defence 2, which more closely aligns with residents' preferences for openness and access, delivers near equivalent reductions typically within 10 %–15 %. Defence 1 provides only limited hazard reduction and is unsuitable as a standalone mitigation system. We show that HCD-integrated configurations can deliver strong technical performance and support a shift toward socially integrated, multi-layered tsunami protection under rising sea levels.
- Article
(14110 KB) - Full-text XML
- BibTeX
- EndNote


The interaction between tsunami and sea level rise (SLR) has become a central consideration in coastal hazard mitigation and infrastructure design. Tsunami generated by megathrust earthquakes along subduction zones displace vast volumes of seawater and can devastate coastlines within minutes (Fuji et al., 2024; Lay et al., 2005; Satake, 2015). Long-term SLR amplifies tsunami impacts by raising baseline sea levels and increasing the frequency and depth of overtopping, while reduced bottom friction and altered flow dynamics may compromise the structural integrity and functional life of coastal defences (Li et al., 2018; Dura et al., 2021; Sepúlveda et al., 2021; Koyano et al., 2022; Chua et al., 2024). Together, these processes create compound hazards that allow tsunami waves to travel further inland and increase inundation extent and damage potential (Grezio et al., 2017; Welsh et al., 2023). Traditional disaster risk reduction (DRR) strategies dominated by hard-engineered structures such as seawalls and breakwaters cannot be readily adjusted as coastal conditions shift over time. Recent approaches promote multi-layered protection systems that integrate physical, ecological, and social measures (UNDRR, 2022; Takabatake et al., 2020). A multi-layered defence system is a hybrid protection strategy that combines several types of defence, such as seawalls, breakwaters, embankments, and non-structural measures, each adding a further layer of protection that reduces the risk of tsunami inundation and loss of life (Tsimopoulou et al., 2013; Oetjen et al., 2022). The social dimension of these systems can be addressed through Human Centred Design (HCD), a methodology that places the needs, values, and lived experiences of end users at the heart of the design process through participation and iteration (Giacomin, 2014; Charlesworth and Fien, 2022). Applied to tsunami mitigation, it offers a framework for balancing engineering performance with the lived experiences and values of coastal communities. In DRR, it reframes defences as socio-technical systems where perception and everyday interaction influence safety outcomes (Bell et al., 2022; Wolff, 2021). In Japan, post-2011 reconstruction raised debate over how large-scale mitigation can coexist with the social and aesthetic character of coastal settlements (Strusińska-Correia, 2017; Aoki, 2018).
In Kesennuma, the tension between large-scale mitigation and the social character of the coast has been examined directly through empirical work by Leggett et al. (2025), which explored the relationship between community perception and infrastructure performance. Their mixed-methods work identified the priorities residents hold for tsunami infrastructure, visibility and connection to the sea, integration of defences with the landscape, alternatives to concrete, and trust resting on local identity as much as on perceived safety. The present study takes these priorities as its design inputs, the criteria from which its defence configurations are generated through an HCD process. However, Leggett et al. (2025) did not test whether defences built from such criteria can maintain technical performance under future conditions, including SLR. Kesennuma is well suited to that test: it is highly vulnerable to tsunami and SLR, and is also a place where resident priorities have already shaped real defences through post-GEJE participatory reconstruction, producing features such as glass windows and hydraulic flap gates that preserved sightlines while maintaining protection against present sea level (Tashiro and Sakisaka, 2015; Otsuyama and Shaw, 2021). This study uses HCD as its primary design method, translating the community-derived priorities identified in Kesennuma into three multi-layered defence configurations and testing each under combined tsunami and SLR scenarios. HCD therefore functions as a generative design tool, producing and evaluating infrastructure rather than only interpreting community preferences.
The objectives of this study are threefold: (1) to develop multi-layered tsunami defence systems that integrate HCD principles identified through community research in Kesennuma; (2) to evaluate their performance under combined tsunami and SLR scenarios using numerical modelling; and (3) to assess whether community-informed, human centred infrastructure can balance social integration with engineering effectiveness to strengthen long-term coastal resilience. We use fatality, inundation, and economic loss results throughout as relative measures of protective performance across defence configurations and draw conclusions on countermeasure effect from these relative comparisons rather than from absolute predictions of real-world outcomes. Through this threefold approach, the study links social understanding with quantitative performance assessment, advancing both theoretical and applied dimensions of human centred DRR. In practice, however, this study is a numerical performance assessment: HCD is used to generate the design inputs for the three defence configurations, and the evaluation itself is conducted entirely through hydrodynamic modelling of their physical and economic outcomes.
2.1 Tsunami exposure and multi-layered mitigation in Kesennuma
Kesennuma, located on the Sanriku Coast of Miyagi Prefecture, faces the Pacific Ocean near the Japan Trench, one of the world's most active subduction zones. The city's ria coastline concentrates tsunami wave energy as it funnels through narrow inlets, producing higher run-up and inundation than on open coasts (Otsuyama and Shaw, 2021). Historical records show repeated large-scale tsunami, including the 1896 Meiji Sanriku and 1933 Showa Sanriku events, both of which caused severe casualties and extensive destruction across the Sanriku region (Shibayama et al., 2013). The GEJE was the most catastrophic event in Kesennuma history, producing local run-up heights exceeding 20 m, inundating central Kesennuma, and destroying large portions of the fishing port, coastal industry, and housing. More than 1300 people were killed and over 15 000 buildings were damaged or destroyed (Otsuyama and Shaw, 2021). The GEJE exposed the limitations of Japan's pre-2011 tsunami countermeasures, which had been designed primarily on the basis of historical tsunami heights, particularly those recorded during the 1933 Showa Sanriku and 1960 Chile tsunami (Hatamura et al., 2014; Koshimura and Shuto, 2015; Strusińska-Correia, 2017). Many seawalls were overtopped or collapsed, revealing weaknesses in foundation design, construction methods, and the assumption that past events represented the upper bound of hazard potential.
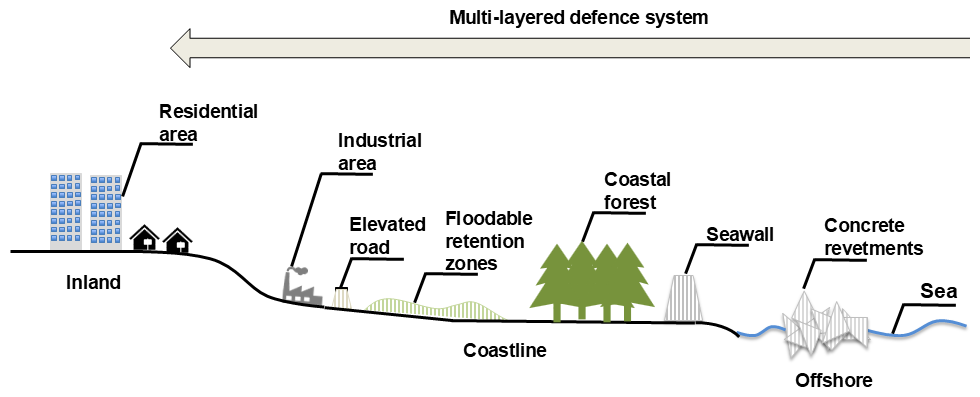
After the GEJE, the MLIT introduced a national framework promoting multi-layered tsunami countermeasures that integrated structural and non-structural approaches (Strusińska-Correia, 2017; Takabatake et al., 2020). Level 1 (L1) tsunamis represent relatively frequent events with return periods of up to around 100 years and are used as the design basis for standard coastal protection infrastructure. Level 2 (L2) tsunamis correspond to rare, large-magnitude events with recurrence intervals of up to roughly 1000 years, reflecting extreme, low-probability scenarios such as the 2011 GEJE. Primary structures such as seawalls and breakwaters were intended to reduce inundation and provide time for evacuation during L1 events, while secondary measures, including embankments, roads, and green infrastructure, slowed flow velocity and reduced damage during L2 events (Fig. 1). Non-structural strategies such as hazard zoning, evacuation planning, and education complemented these physical layers. These principles were further institutionalised through the Technical Standards for Coastal Facilities (MLIT, 2013a) and the National Resilience Plan (MLIT, 2015), which provide national guidance on integrated coastal defence and adaptive risk management. In Kesennuma, reconstruction was shaped by local priorities, physical constraints, and the preferences of residents rather than by national design logic. The city's approach emphasised maintaining visibility, accessibility, and cultural continuity along the coast while improving safety through structural reinforcement and land-use modification. Its topography, economic dependence on fisheries, and strong civic culture required solutions that balanced protection with the preservation of community identity and daily life.
2.2 Post-GEJE reconstruction and existing tsunami defences
Reconstruction in Kesennuma involved the redevelopment of coastal infrastructure through a combination of large concrete seawalls, raised roads, hydraulic barriers, and embankments designed to withstand tsunami seen in Fig. 2. These projects were funded and overseen jointly by national and prefectural agencies but implemented through local consultation processes led by the Kesennuma City Office. Major reconstruction works were completed by 2019 under the national Reconstruction Agency programme, allowing sufficient time for assessment of performance and public reception. Unlike many neighbouring municipalities, Kesennuma invited public participation in reconstruction planning, allowing residents to express concerns about the visual and spatial effects of new seawalls and the potential loss of connection to the sea (Ueda and Shaw, 2014). Participation focused primarily on negotiating visibility, access, and aesthetic impact rather than redefining engineering specifications. Residents' input led to adjustments such as lowering seawall heights in certain areas, incorporating reinforced glass windows into the seawall along the port, and adopting hydraulically operated barriers to preserve sightlines and maintain the usability of waterfront areas (Tashiro and Sakisaka, 2015).
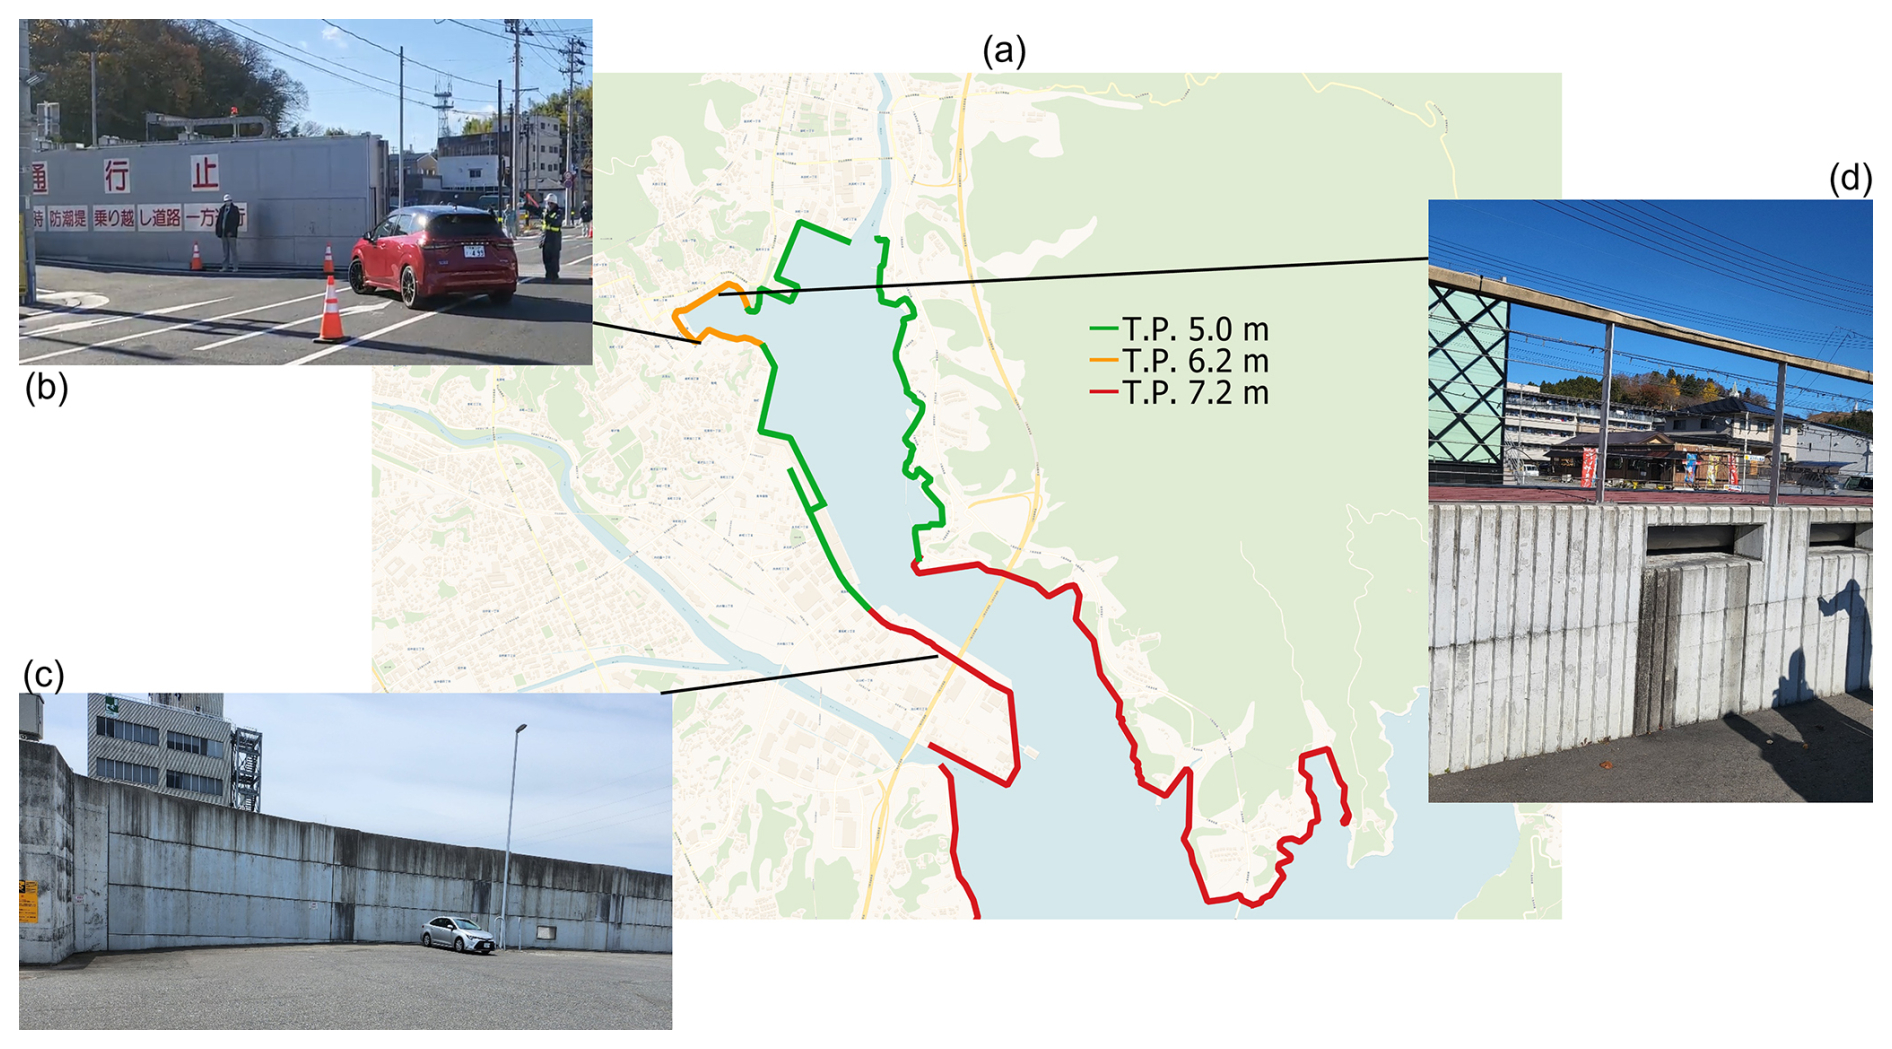
Figure 2Current tsunami mitigation infrastructure in Central Kesennuma (a) Seawall heights, (b) automatic seagate controlled remotely by J Alert in Tokyo, (c) tallest concrete seawall observed at Kesennuma Port, (d) barrier hydraulically activated by water ingress, increasing barrier height by 1 m. Base map from OpenStreetMap contributors.
These locally driven changes sought to balance safety with cultural and experiential dimensions of the coastal landscape. However, not all responses were positive. Some regional media and neighbouring municipalities criticised Kesennuma's participatory stance as overly individualistic or “selfish,” arguing that the negotiated reductions in defence height lowered protection relative to the original designs (Ueda and Shaw, 2014; Imakawa, 2021). This criticism reflected deeper national tensions between locally driven adaptation and Japan's highly centralised, technocratic reconstruction model (Ueda and Shaw, 2014). The resulting defence system represents a hybrid between national engineering requirements and locally negotiated modifications. Primary concrete seawalls act as the first line of protection, while secondary structures such as adaptive embankments, elevated roads, and hydraulic flap gates provide additional layers of defence. Complementary measures, including evacuation buildings, hazard mapping, and regular community drills coordinated by the city's Crisis Management Division, strengthen non-structural preparedness. Together, these measures demonstrate Kesennuma's effort to achieve physical safety while retaining visibility, accessibility, and continuity with the coastal environment. Kesennuma's defences were designed and negotiated under present sea level conditions, which will not remain constant. What remains unclear is whether community-informed defences can deliver technical performance and community priorities together as sea levels rise.
The performance of multi-layered tsunami mitigation designs in Kesennuma was evaluated using numerical modelling. Numerical modelling provides a controlled and replicable means of testing how alternative defensive strategies perform under different tsunami source conditions and projected SLR scenarios. This approach enables systematic comparison of the overall effectiveness of each design and their capacity to sustain protection as baseline sea levels change. The focus on multi-layered defences reflects recognition that a single structural element is rarely sufficient to manage tsunami risk effectively. Instead, combinations of primary and secondary measures, designed with different priorities such as durability, visual integration, and accessibility, can work together to reduce inundation, maintain the usability of the coast, and respond to evolving environmental conditions. Insights from community preferences, post-GEJE reconstruction plans, and existing literature on coastal defence performance were used to guide the conceptual development of new human centred multi-layered defence configurations. These designs were then assessed through numerical simulations to quantify their technical performance.
3.1 Conceptional Basis and Design Rationale
Tsunami mitigation in Japan has traditionally relied on large, single-purpose structures whose limited adaptability and social acceptance have become increasingly evident since the GEJE (Nateghi et al., 2016; Strusinska-Correia, 2017). This study is premised on the view that effective tsunami protection must balance engineering performance with the needs, perceptions, and everyday experiences of local communities. The rationale is that infrastructure designed to integrate with the environment and community identity is more likely to be maintained, trusted, and functionally sustainable under changing hazard conditions, including future SLR. The national DRR framework now promotes multi-layered defence systems that combine several complementary measures to address both L1 and L2 tsunami. This study extends that framework by incorporating HCD principles into the conceptual development of multi-layered systems for Kesennuma. The conceptual foundation for the designs presented in this study draws on three key elements: community-derived insights from Kesennuma, national reconstruction policy, and evidence from previous coastal engineering research. Results from Leggett et al. (2025) identified that residents valued visibility and openness to the sea, preferred defences that blended with the natural landscape, and expressed concern about excessive reliance on rigid concrete structures. However, the same study also showed that residents were divided about the sense of protection created by existing defences, with roughly equal proportions reporting that they did and did not feel secure behind the new seawalls. This divergence highlights the importance of evaluating whether different configurations, ranging from socially aligned to more structurally dominant, can achieve both technical reliability and community confidence. These social preferences were translated into engineering design principles that emphasised three priorities: (1) environmental integration through use of vegetated or low-impact elements, (2) unobtrusive protection that maintains visual and physical access to the waterfront, and (3) robust structural safety capable of withstanding rare, large-magnitude events.
Together, these priorities form the conceptual rationale for evaluating whether designs informed by community perspectives can achieve equivalent or superior technical performance compared with conventional configurations. The study therefore developed three conceptual multi-layered defence systems, each representing one of the priorities above. These configurations were not intended as construction plans but as analytical prototypes for quantitative assessment. By modelling their physical performance under present and future SLR conditions, this research examines the relationship between social preference and engineering effectiveness within a human centred tsunami protection framework. The following section describes the structure and composition of each system in detail, outlining how individual components and materials were combined to create integrated, testable configurations.
3.2 Alternative Multi-Layered Infrastructure
Developing tsunami mitigation systems that balance structural performance with social, environmental, and aesthetic considerations remains a major challenge for Japanese coastal cities. Following the GEJE, reconstruction highlighted both the strengths and limitations of hard-engineered measures such as seawalls and offshore breakwaters. While effective in reducing inundation and direct wave impacts (Suppasri et al., 2013; Strusińska-Correia, 2017), these defences have been criticised for their scale, cost, and lack of adaptability under future SLR scenarios. Their rigid designs often restrict visibility and coastal access, reducing public acceptance and disrupting the character of the waterfront (Oetjen et al., 2022; Aoki, 2018).
The designs developed in this study were guided by three sources: (1) community-derived preferences from Leggett et al. (2025), (2) evidence from peer-reviewed research confirming the prior use and tested effectiveness of each structural element, and (3) the principles of Kesennuma City's Disaster Recovery Plan, which emphasises “harmony with nature” and “community-focused planning to ensure that infrastructure aligns with both environmental and civic goals”. This integration ensures that the proposed systems are not reproductions of previous studies, but novel configurations created specifically for the Kesennuma context. Each design combines proven components to reflect one of three distinct priorities identified in Sect. 2.1: environmental integration, unobtrusive protection, and maximum structural protection. Each configuration includes offshore, coastal, and inland elements selected to perform complementary functions within Kesennuma's topography and urban structure. Construction and maintenance costs were not considered during the design process, as the focus was on conceptual performance and comparative effectiveness rather than financial feasibility. The layouts of the three designs, including component locations, elevations, and Manning's coefficients, are shown in Figs. 3–5.
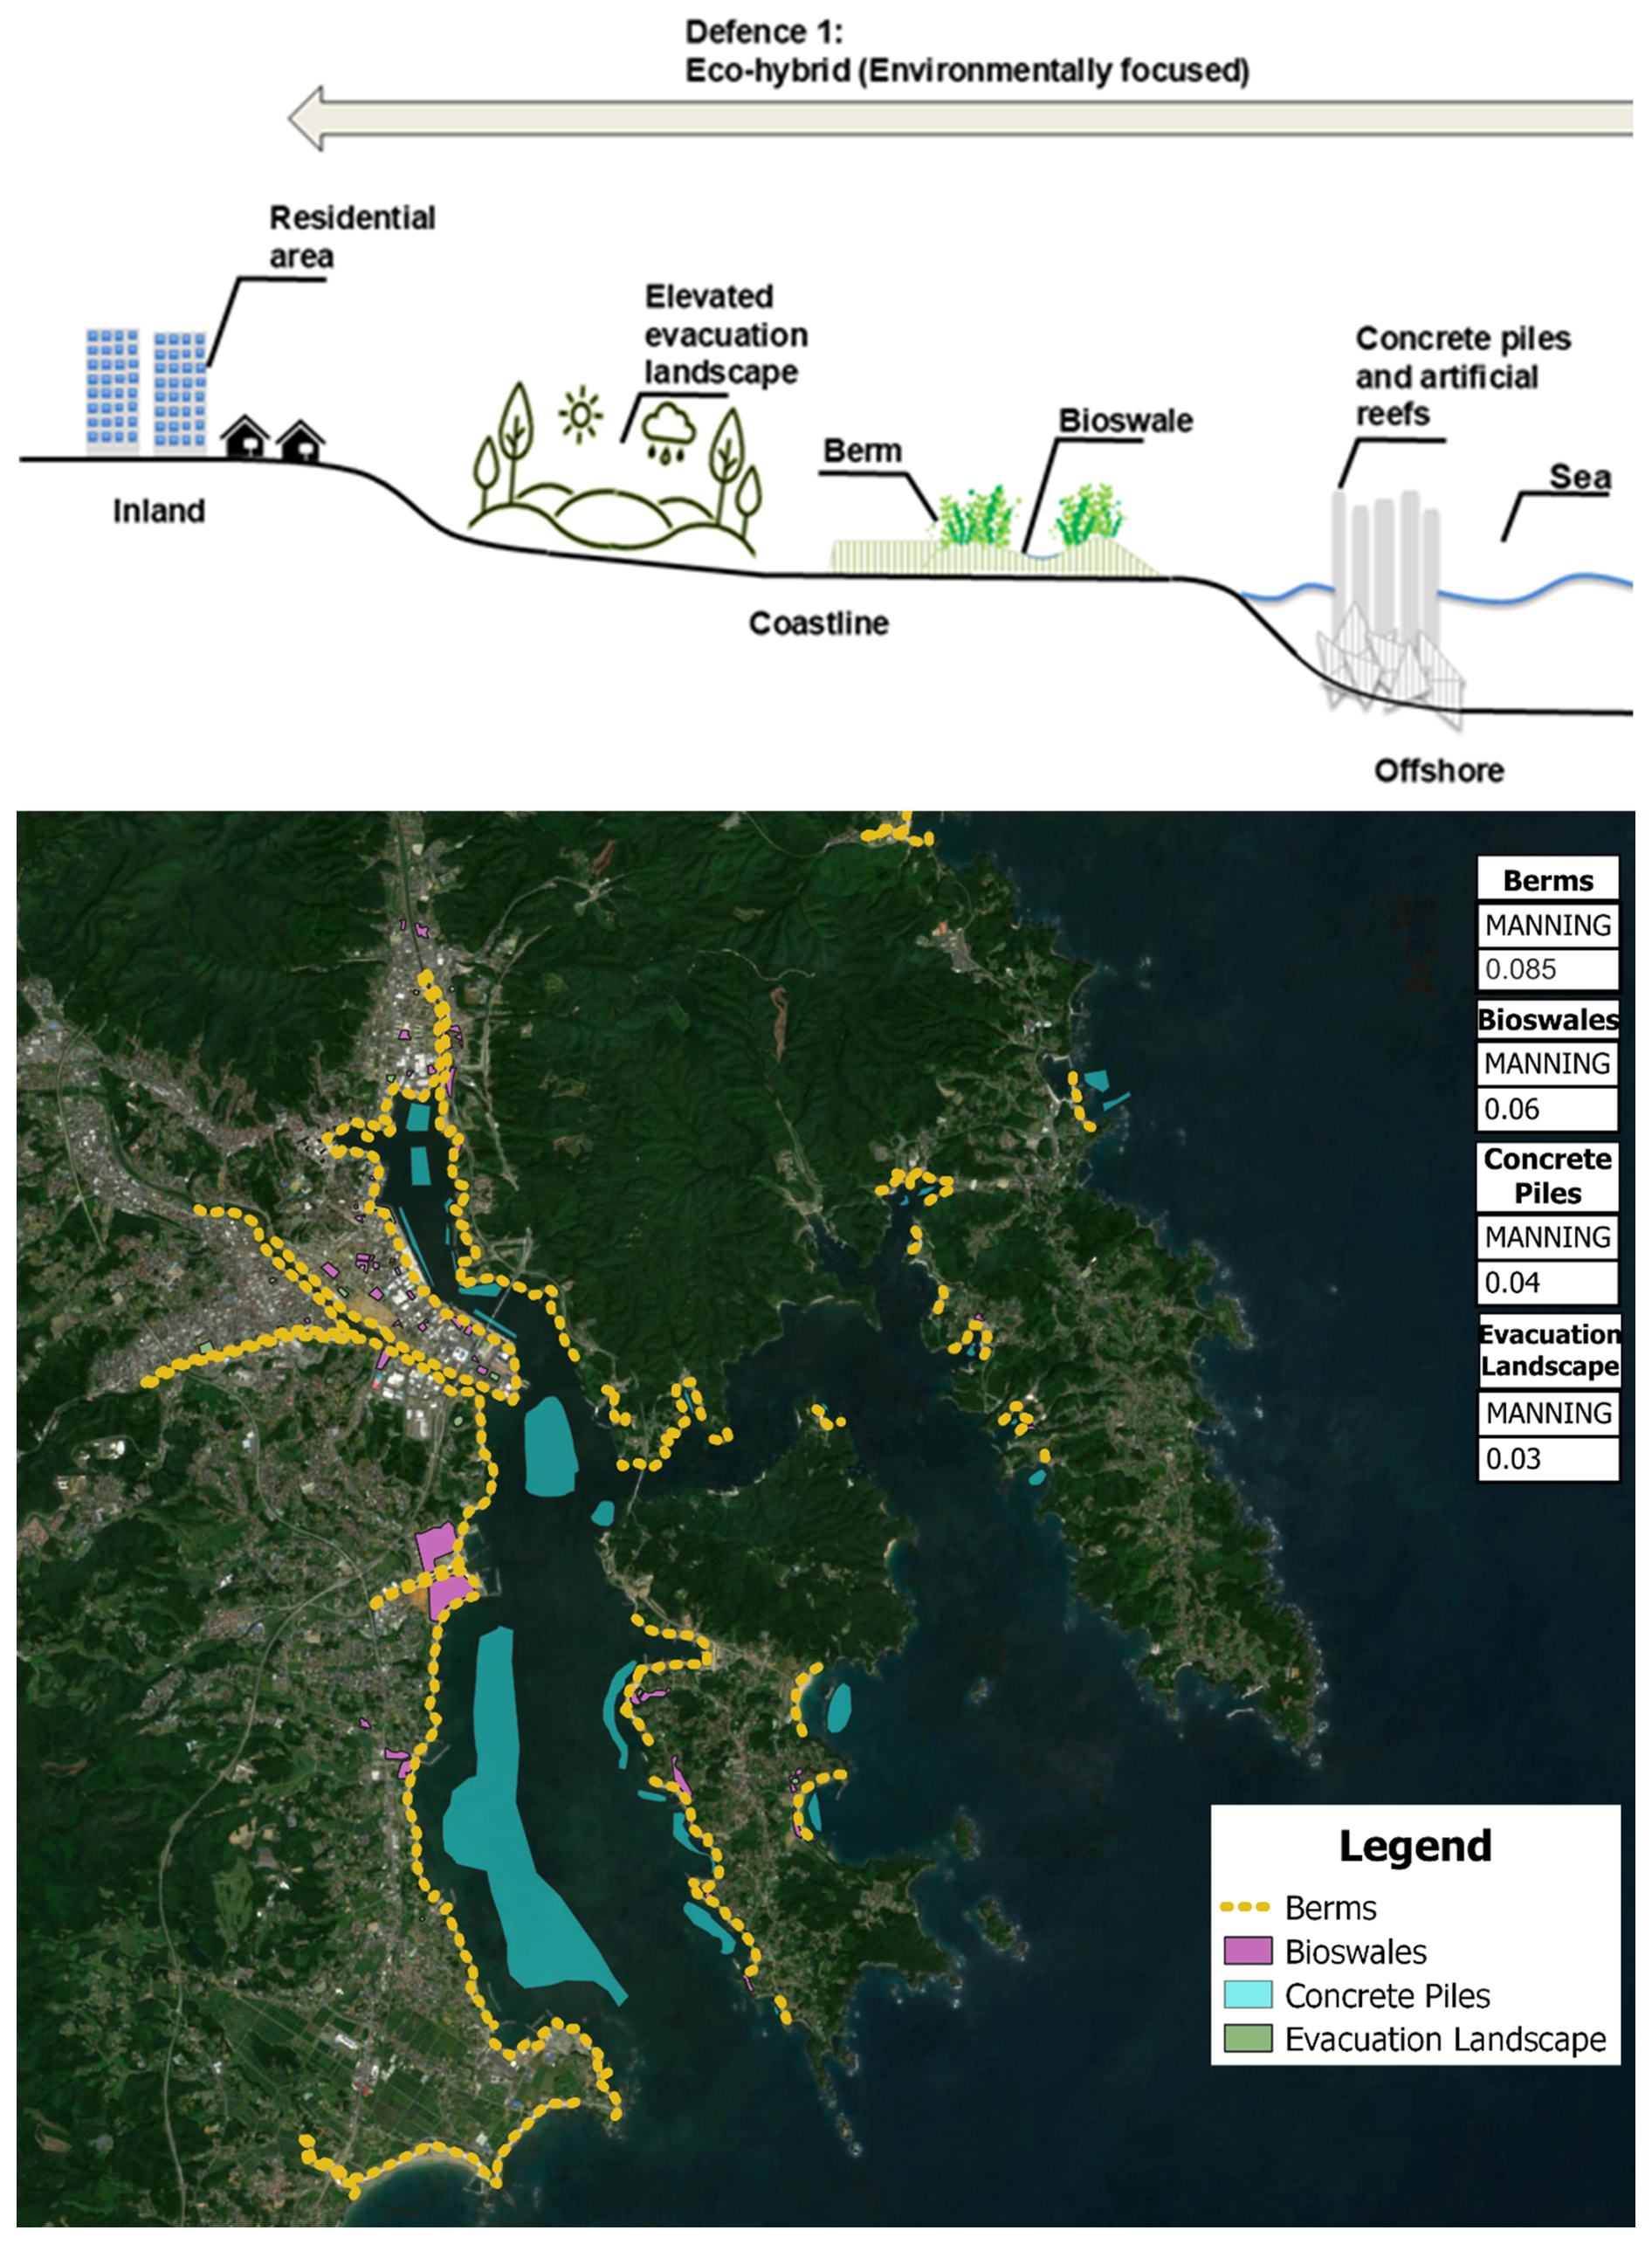
Figure 3Multi-layered defence cross section and placement within Kesennuma for the Eco-hybrid defence system (Defence 1). Sentinel-2 imagery by © European Union, Copernicus Programme. All rights reserved.
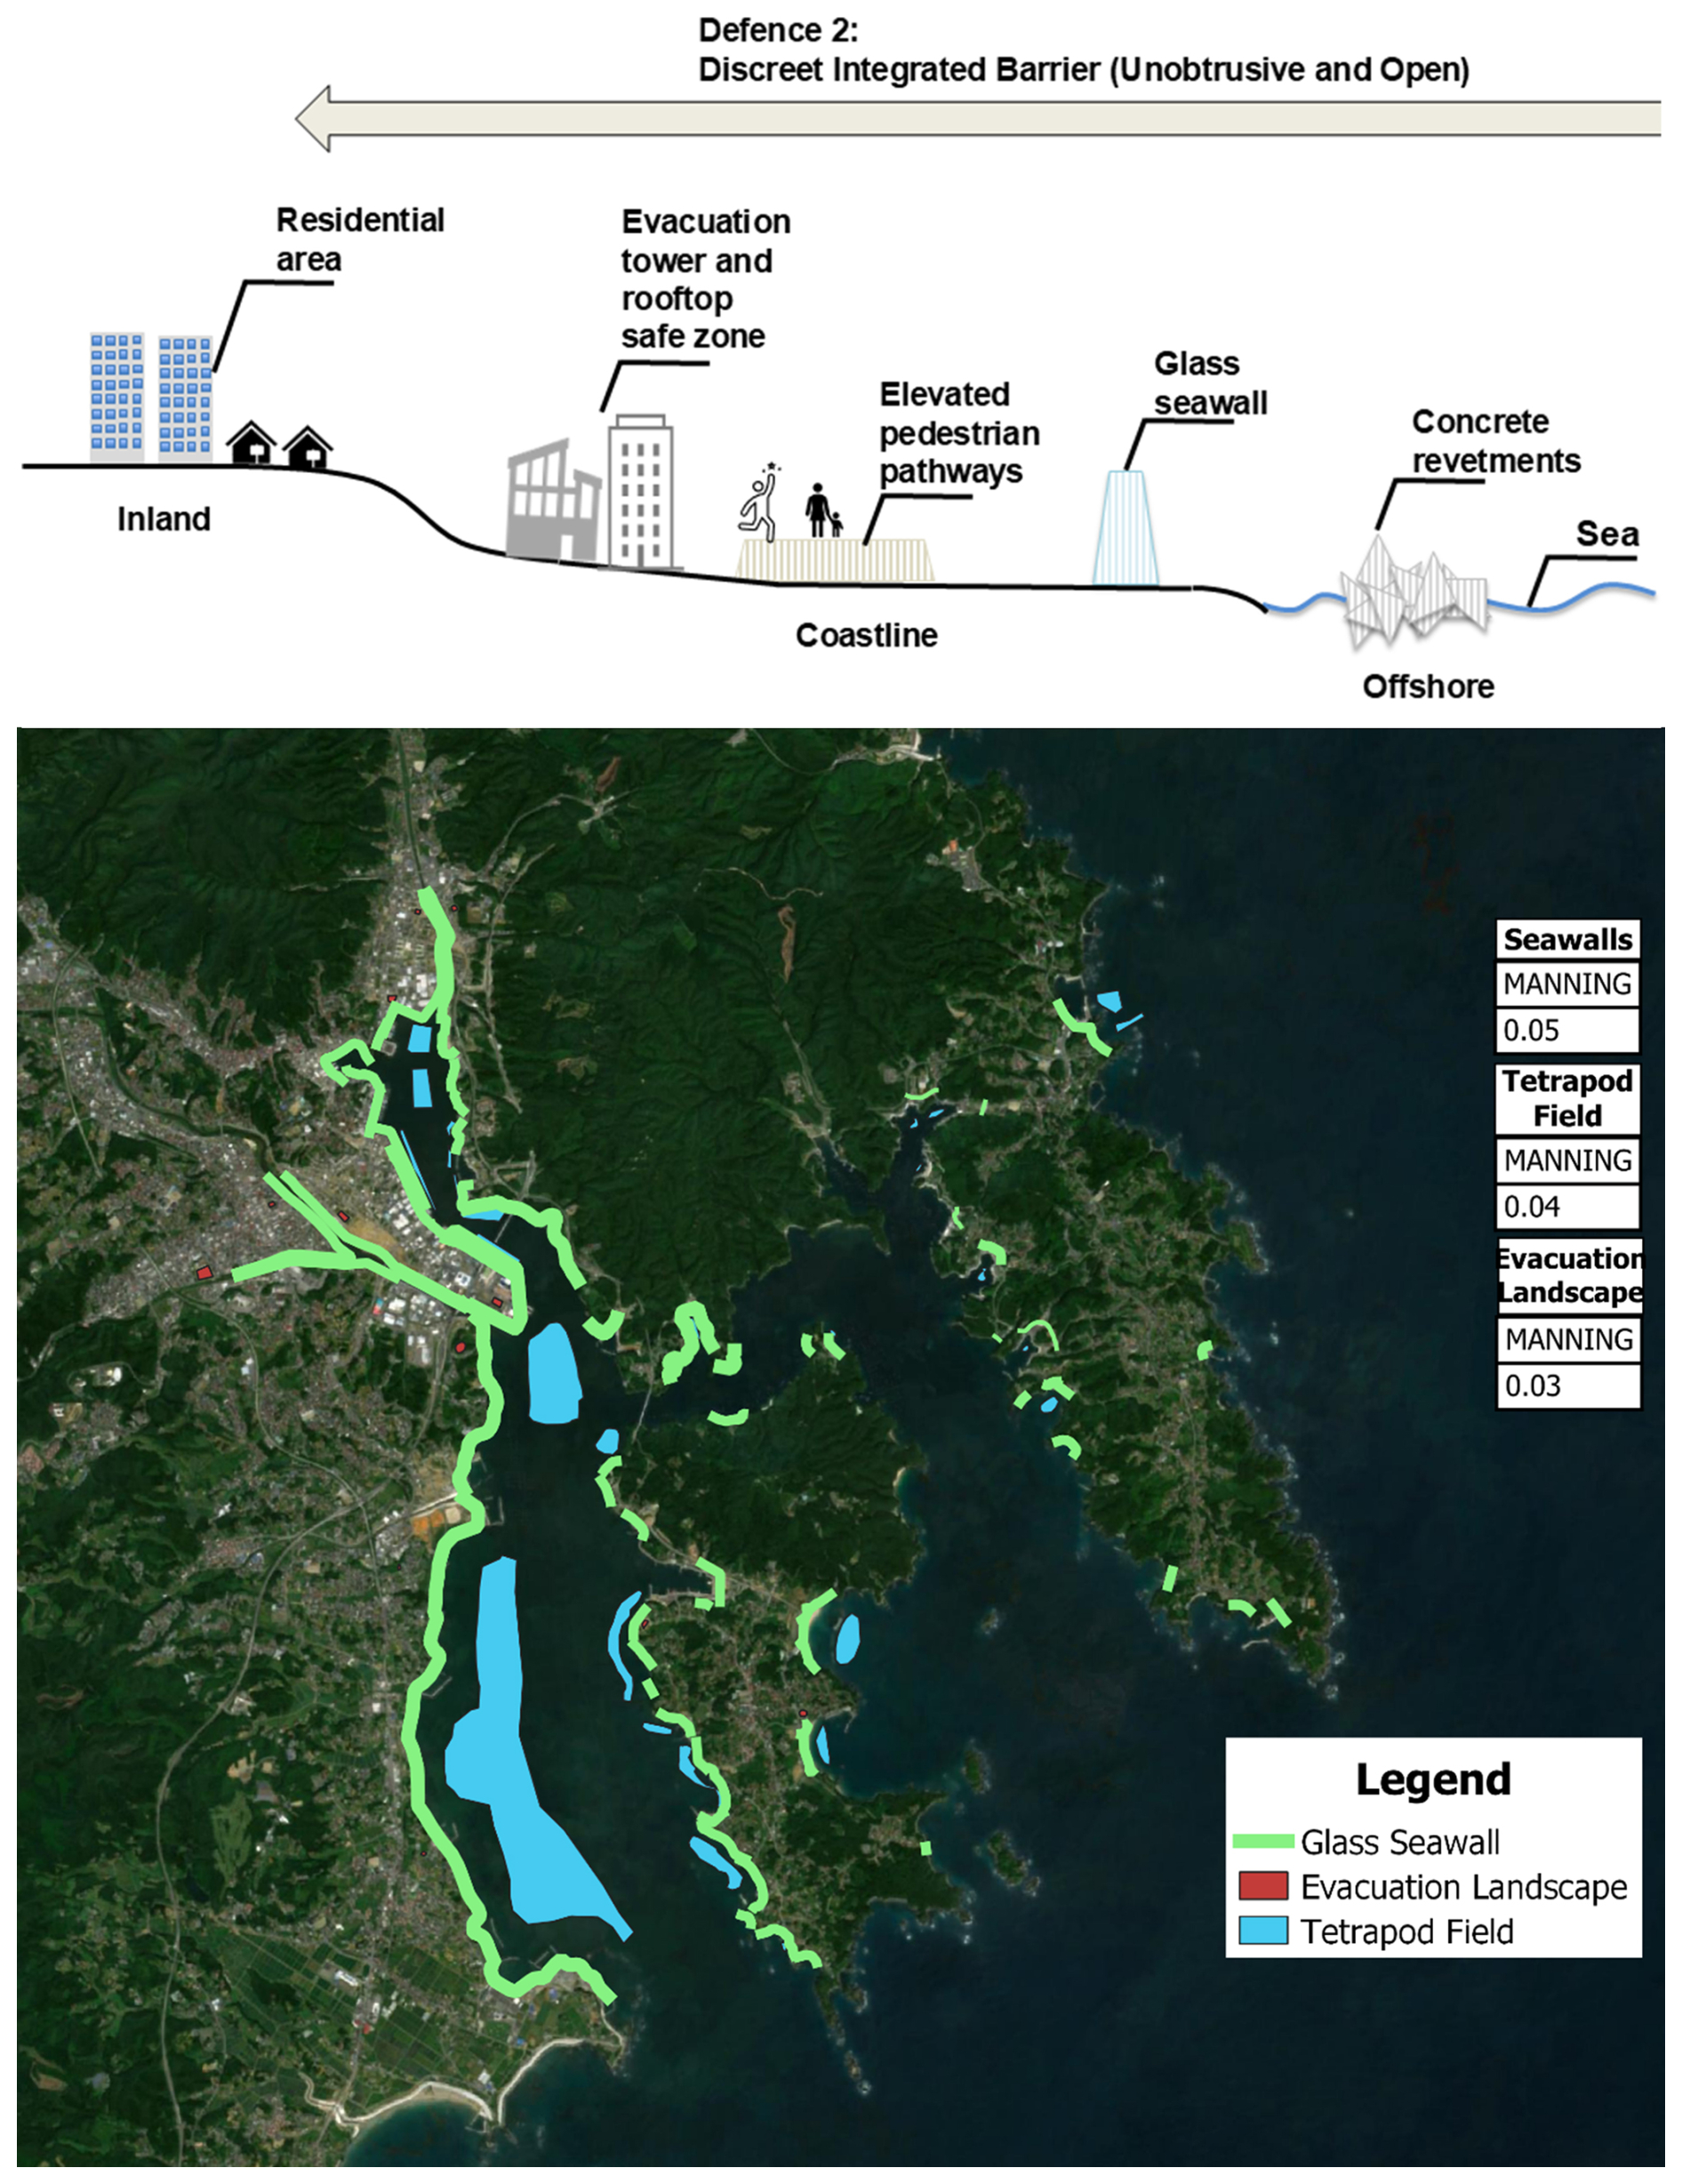
Figure 4Multi-layered defence cross-section and in-situ placement for the Discreet Integrated Barrier system (Defence 2). Sentinel-2 imagery by © European Union, Copernicus Programme. All rights reserved.
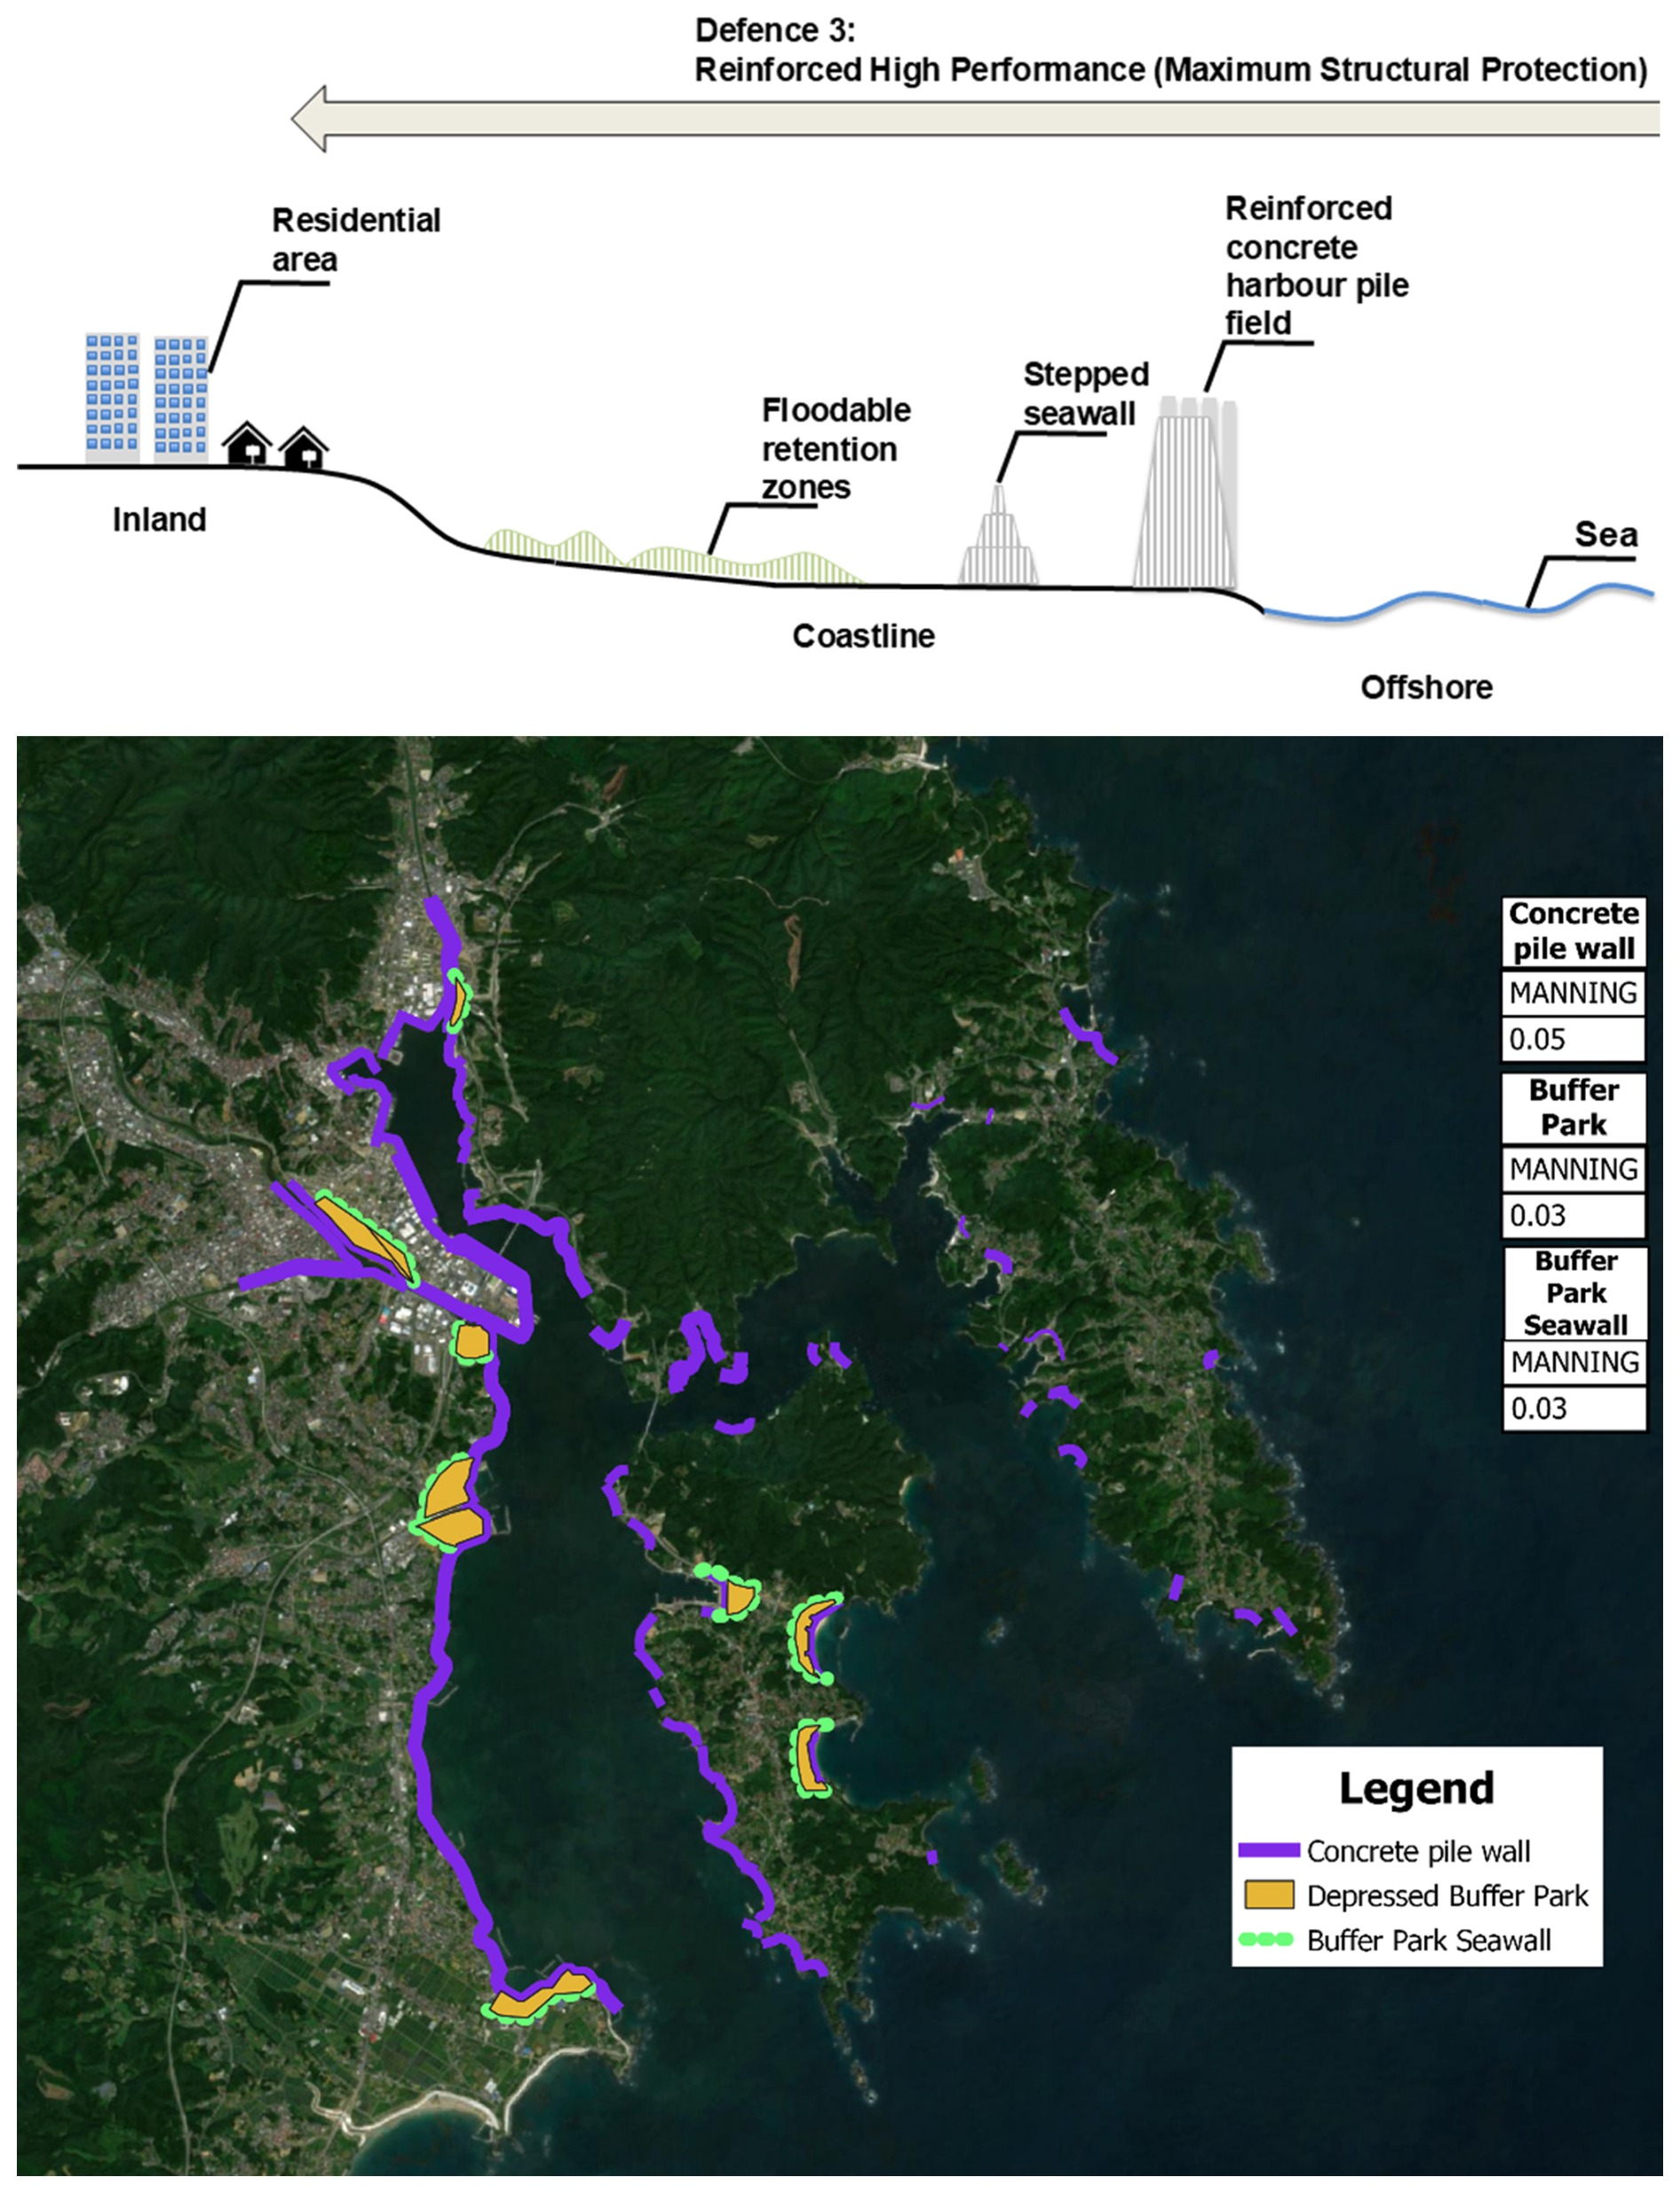
Figure 5Cross-section and in-situ placement of the three elements from the Reinforced High-Performance system (Defence 3). Sentinel-2 imagery by © European Union, Copernicus Programme. All rights reserved.
3.2.1 Defence Design 1: Eco-Hybrid System (Environmentally Focused)
This configuration integrates natural and low-impact solutions to provide tsunami mitigation while maintaining ecological value and landscape continuity (Fig. 3). Offshore, submerged concrete pile arrays combined with artificial reef structures reduce wave energy through drag and turbulence while enhancing biodiversity (Strusińska-Correia, 2017). Along the coastline, narrow vegetated berms and bioswales act as secondary buffers that absorb overflow, filter sediment, and blend visually with the urban edge (Takabatake et al., 2020). Inland, elevated evacuation landscapes and urban green spaces create tertiary protection layers that function as both safe zones and daily-use public areas (Omori et al., 2019). This system tests whether ecologically sensitive, visually integrated designs can sustain tsunami protection under future SLR conditions while aligning with Kesennuma's emphasis on harmony with nature.
3.2.2 Defence Design 2: Discreet Integrated Barrier System (Unobtrusive and Open)
This configuration prioritises openness and visibility, minimising the psychological sense of separation from the sea (Fig. 4). Offshore, low-crest tetrapod fields are placed in a staggered grid to dissipate energy before waves reach the shore without creating strong visual obstruction. At the coastal interface, glass-composite seawalls with automated hydraulic floodgates provide transparency and adaptive protection in urban areas (Strusińska-Correia, 2017). These gates remain flush with the ground under normal conditions and elevate automatically during tsunami alerts. Inland, rooftop safe zones and elevated pedestrian pathways provide continuity of access and vertical evacuation options connected to key public buildings. This design evaluates whether maintaining open sightlines and physical connectivity to the waterfront can achieve acceptable tsunami mitigation performance while enhancing community acceptance and daily usability.
3.2.3 Defence Design 3: Reinforced High-Performance System (Maximum Structural Protection)
This configuration represents the most structurally focused of the three systems, providing a benchmark for maximum protection and redundancy (Fig. 5). Offshore, reinforced concrete pile fields are positioned around the harbour entrance to reduce resonance and limit surge penetration (Strusińska-Correia, 2017). Along the shoreline, stepped seawalls 5–7 m in height are paired with buffer parks that act as retention zones, temporarily storing overtopping water and reducing inland flow velocity (Takabatake et al., 2020). Further inland, floodable retention areas and channels provide controlled drainage and secondary containment (Omori et al., 2019). This design represents the engineering-led end of Kesennuma's mitigation spectrum, testing the upper limit of structural performance against future SLR scenarios while allowing comparison with more socially aligned systems.
Together, these three configurations provide a structured basis for assessing how different design priorities influence inundation reduction and associated trade-offs. Each represents a distinct, yet technically feasible system developed from validated precedent studies, community insight, and local reconstruction principles. Collectively, they form the foundation for quantitative modelling and performance evaluation within a human centred tsunami protection framework.
3.3 TUNAMI-N2 Numerical Model
Tsunami propagation and inundation in Kesennuma City were simulated using TUNAMI-N2, a two-dimensional nonlinear shallow-water model that solves the depth-averaged nonlinear shallow-water equations (NSWE) for incompressible flow under the hydrostatic assumption (Imamura, 1996; Imamura et al., 2006). The model conserves mass and momentum in the horizontal plane and represents bottom friction through a spatially varying Manning coefficient (Imamura and Imteaz, 1995). The governing equations are:
Equation (1) Continuity (mass conservation):
Equation (2) x-momentum:
Equation (3) y-momentum:
where η is the free-surface elevation, M and N are the depth-integrated discharge fluxes in the x- and y-directions respectively, is the total water depth, h is the still-water depth, g is gravitational acceleration, and n is the spatially varied Manning roughness coefficient. The nonlinear friction terms represent bed shear stress, which dissipates flow momentum and controls near-shore velocity, inundation depth, and run-up.
The equations are solved using a staggered leap-frog finite-difference scheme that achieves second-order accuracy in both space and time while maintaining numerical stability in regions of rapid flow variation (Goto and Ogawa, 1997). Nonlinear advection terms are approximated using second-order central differences at interior nodes and first-order upwind differences near boundaries.
TUNAMI-N2 has been extensively validated for tsunami propagation, run-up, and inundation in Japan, including applications along the Sanriku coast that share the complex topography and narrow bays characteristic of Kesennuma (Sugawara and Goto, 2012; Suppasri et al., 2013). TUNAMI-N2 has been validated against observed data from real tsunami events, including the 2011 Tohoku tsunami along the Sanriku coast (Oishi et al., 2015; Suppasri et al., 2013) and the 2004 Indian Ocean tsunami (Dao and Tkalich, 2007). Given this prior validation, the present study employs the same TUNAMI-N2 framework, spatial resolution hierarchy, and parameterisation approach to evaluate relative performance differences among defence configurations. The model is therefore used not to replicate a specific historical event but to provide a consistent, controlled environment for comparing multi-layered defence scenarios under present and projected SLR conditions. Boundary conditions were applied according to the standard TUNAMI-N2 configuration. Open ocean boundaries used radiation conditions to allow outgoing wave energy to exit the domain without reflection, ensuring numerical stability during offshore propagation. Reflective boundary conditions were imposed at the closed domain boundaries, while coastal structures such as seawalls were incorporated into the DEM and assigned Manning's roughness coefficients, allowing wave impact, overtopping, and inundation to be represented dynamically. Inland boundaries were treated as closed unless explicitly inundated. Grid interfaces between nested layers were linked through bilinear interpolation of surface elevations and discharge fluxes, conserving both mass and momentum during energy transfer from coarse to fine resolution grids. This fit-for-purpose application ensures that the modelling results are robust for assessing comparative trends in inundation behaviour and mitigation effectiveness in Kesennuma's coastal setting.
3.3.1 Computational Domain and Nested Grids
The computational domain covered the northern Tohoku region of Japan (37.8–44.0° N, 140.8–144.5° E), encompassing the Sanriku coast, Kesennuma City, and the full rupture areas of the fault sources considered (Fig. 6). Model coordinates and figure locations are expressed in metres using the Japan Plane Rectangular Coordinate System (Zone IX), providing a consistent georeferencing framework. This extent ensures that tsunami generation, offshore propagation, and nearshore transformation processes are all captured within a single consistent framework.
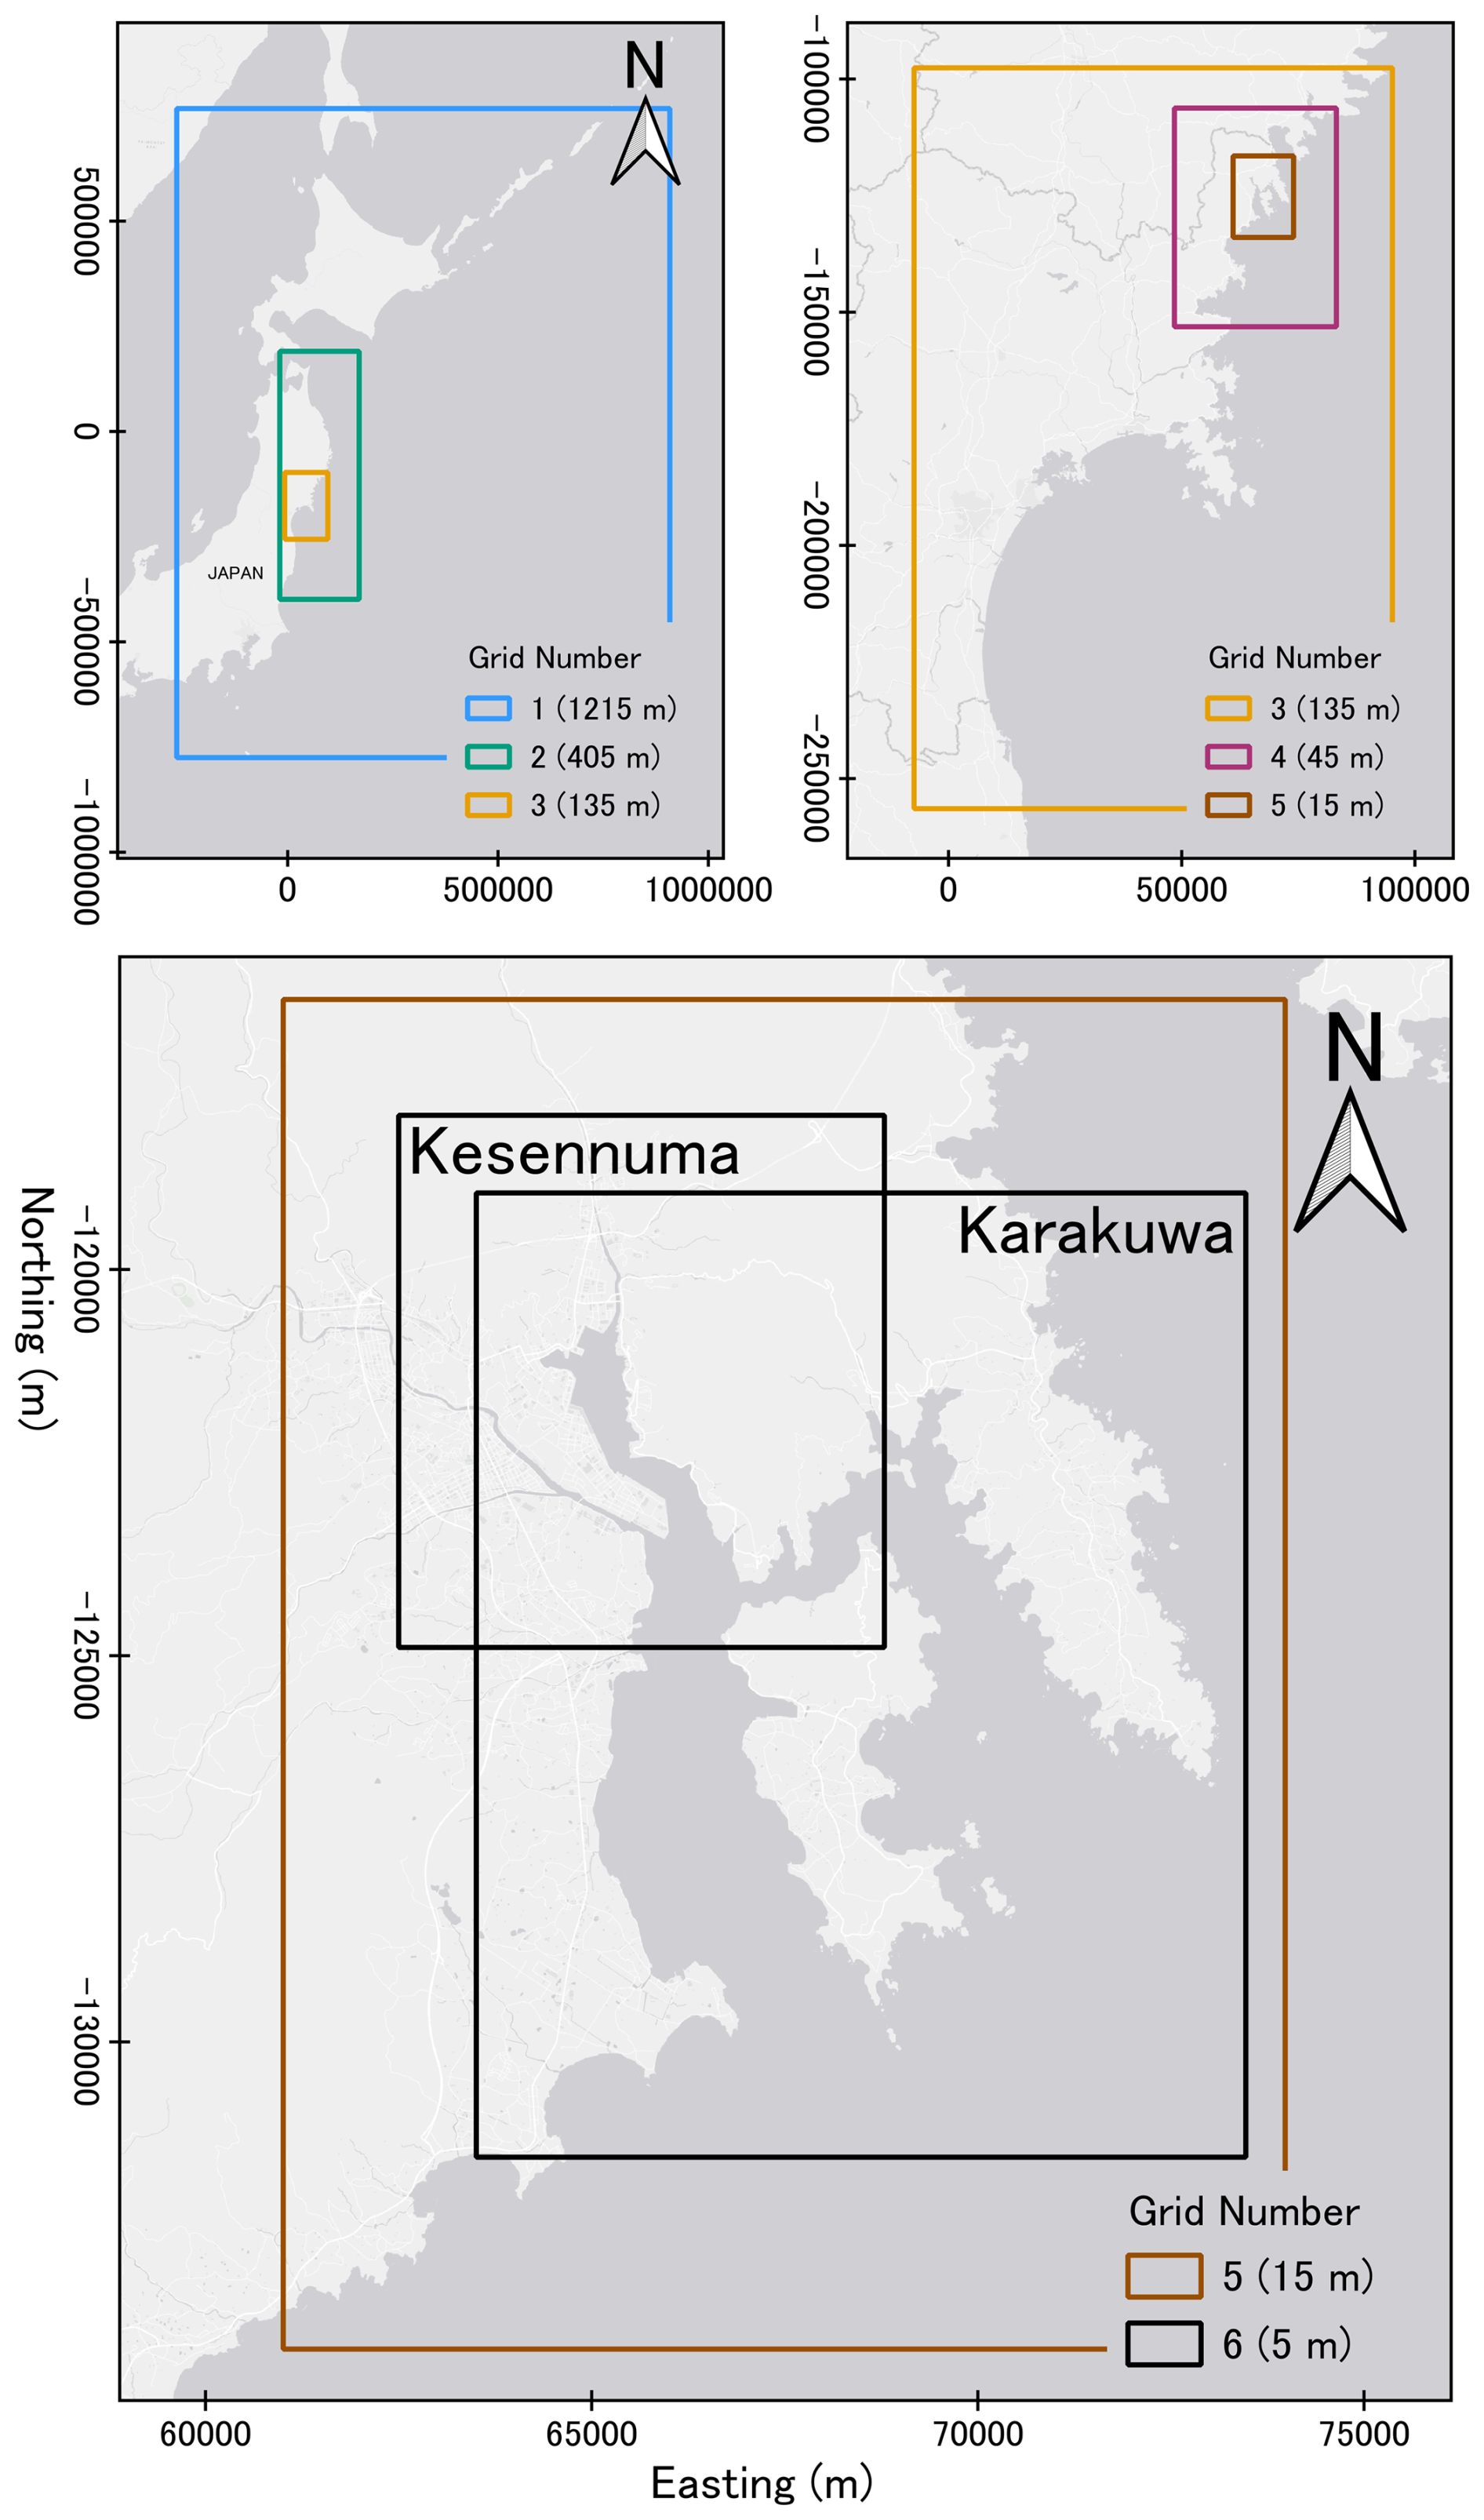
Figure 6Computational Domain (Grid 1) and the subsequent nesting grids, showing the difference in locations of the Kesennuma and Karakuwa final grids. Sources: Esri (World Gray Canvas) | Powered by Esri.
A six-layer nested grid system was implemented to resolve tsunami dynamics from offshore sources to detailed inundation within the urban environment. Grid resolutions ranged from 1215 m in the outermost layer to 5 m in the innermost, with intermediate layers of 405, 135, 45, and 15 m. The innermost domain consisted of two 5 m grids: one covering Central Kesennuma, including the dense urban core and adjacent low-lying districts, and another extending across Kesennuma Bay, incorporating the Karakuwa Peninsula and surrounding coastal neighbourhoods. Coarser grids simulated regional propagation and wave dispersion across the wider bathymetry, while the 5 m grids resolved urban streets, river mouths, ports, and coastal slopes where run-up and inundation occur. This configuration provided the spatial precision needed to capture localised flow dynamics while maintaining computational efficiency across multiple simulation scenarios. A uniform time step of 1 s was applied across all nested grids, chosen to satisfy the Courant–Friedrichs–Lewy (CFL) stability condition in the finest 5 m domain, where the constraint is most restrictive.
Bathymetric and topographic data were obtained from the high-resolution composite DEM developed by Sugawara et al. (2014), originating from the foundational Sanriku bathymetry and topography compilation by Takahashi et al. (2000). These datasets provide pre-2011 terrain for the Sanriku coast and represent the natural coastal and floodplain morphology prior to reconstruction. They were selected to ensure that the model evaluates new defence designs against a consistent pre-reconstruction baseline. Elevations were standardised to a mean sea level datum to maintain consistency with SLR scenarios. Reflective boundaries were applied along solid coastal structures, such as seawalls and revetments, while open boundaries used radiation conditions to allow outward wave propagation. Coastal defences, river embankments, and terrain features were incorporated directly into the digital elevation model, ensuring their effects on wave propagation, refraction, and overtopping were dynamically represented.
3.3.2 Tsunami Source Models, Boundary Conditions and SLR Scenarios
Three tsunami source models were implemented to represent the main regional subduction zones that influence Kesennuma: the Kuril Trench, the Japan Trench, and the 2011 GEJE (Tohoku) source (Fig. 7). These correspond to the official three-fault framework used in Kesennuma City's hazard mapping and national Cabinet Office tsunami assessments. Fault parameters for the Kuril and Japan Trench scenarios were obtained from the Cabinet Office (2020), while the 2011 GEJE source parameters were taken from Satake et al. (2013). Okada (1985) dislocation theory was then applied to each subfault to compute seafloor deformation, providing the rupture geometry and vertical displacement associated with each event type. Together, these sources represent major megathrust earthquakes which, despite occurring in different locations, have demonstrated or are expected to produce tsunamis with significant impacts on Kesennuma. Each model was selected and implemented to produce representative maximum wave heights along the Sanriku coast, allowing meaningful comparison between scenarios. While this deterministic scenario approach reflects the official hazard framework for Kesennuma and is appropriate for the comparative purposes of this study, it does not capture the full range of potential source variability that a probabilistic approach would represent (Grezio et al., 2017; Davies et al., 2018; Behrens et al., 2021). The implications of this limitation are explored further in the discussion.
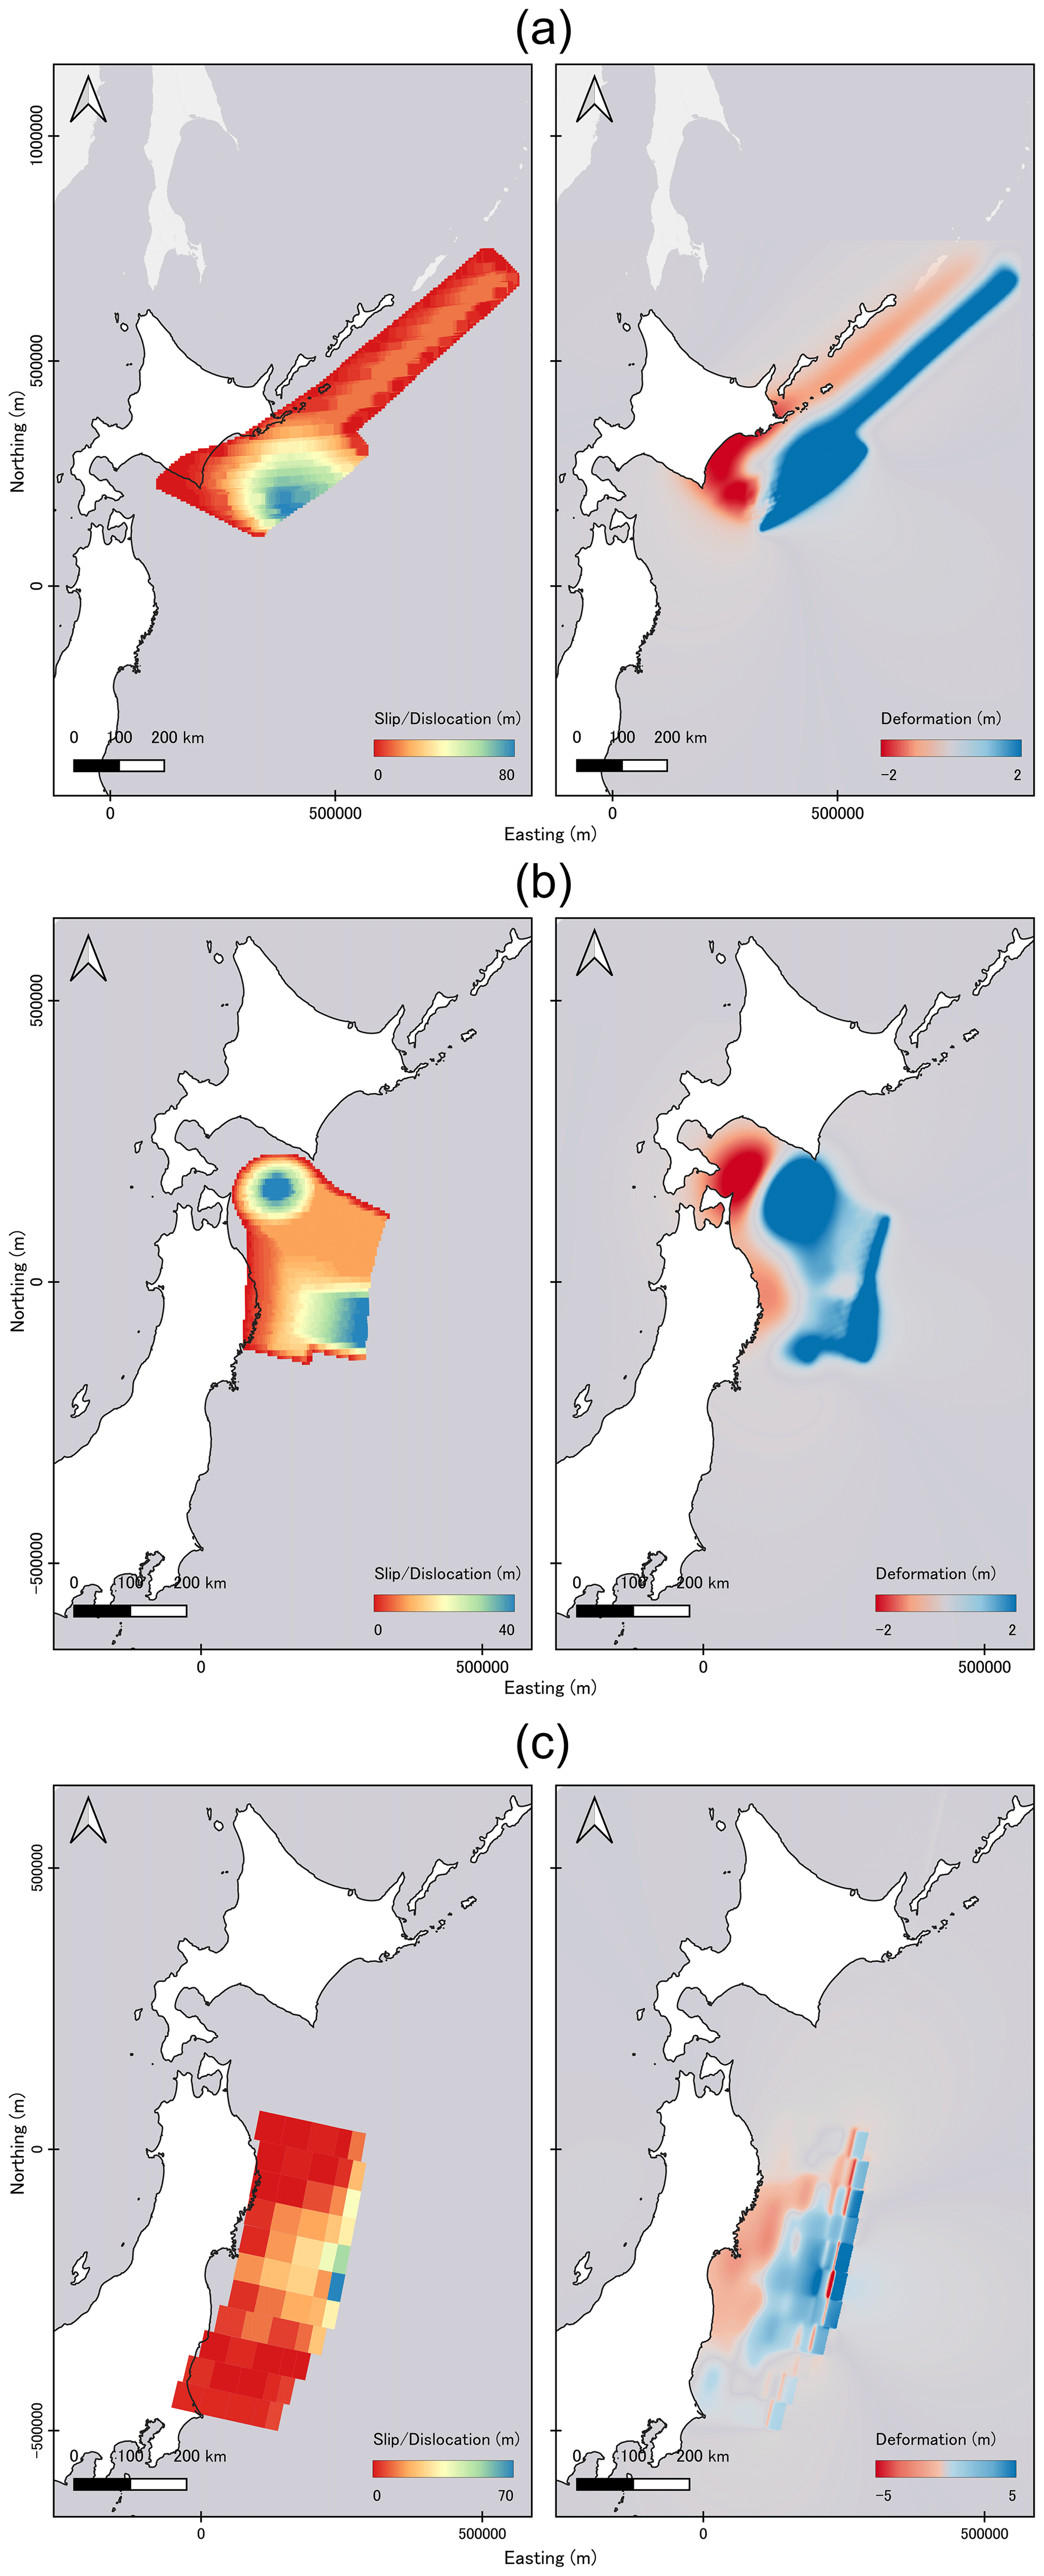
Figure 7Tsunami source model locations, slip distribution and deformation for (a) Kuril Trench (b) Japan Trench and (c) 2011 GEJE (Tohoku).
SLR projections were incorporated into all simulations to represent changing baseline conditions. Two Shared Socioeconomic Pathways (SSPs) were used: SSP2–4.5, which represents the most probable mid-range warming and emissions trajectory under current global policy trends, and SSP5–8.5, which depicts a high-emissions, worst-case scenario. Local SLR projections for Kesennuma were obtained from the NASA Sea Level Projection Tool at the Ofunato II reference location with mean sea level increments of +0.40 m for 2050 and +0.97 m for 2100 applied for SSP2–4.5, and +0.44 m for 2050 and +1.28 m for 2100 for SSP5–8.5 (NASA, 2021). These increments were added to the still-water depth across all nested grids prior to simulation, modifying the baseline water level used by the model and influencing wave propagation, run-up, and inundation. No adjustments were made for vertical land movement.
3.3.3 Surface roughness and Manning Coefficients
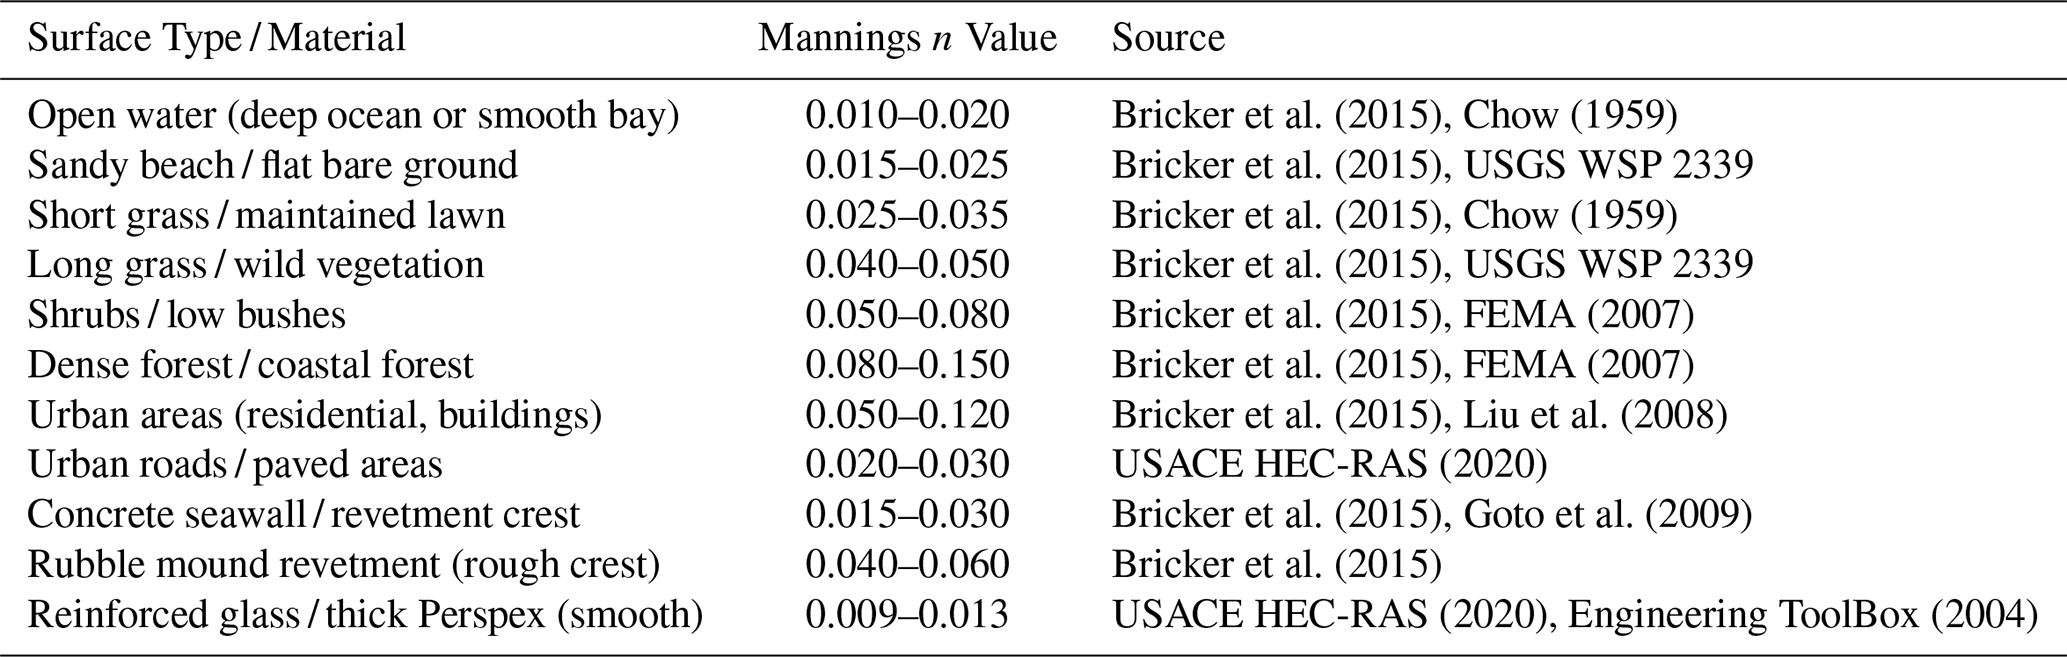
Spatially varied Manning's coefficients were applied to represent differences in surface roughness associated with land cover and coastal infrastructure. Land-cover data were obtained from the ESA WorldCover 2020 dataset via Google Earth Engine and reclassified to a 5 m resolution grid to match the innermost computational domains (Zanaga et al., 2021). The default classification was then replaced with a custom land-cover dataset developed for this study to ensure that surface categories accurately represented the physical and built conditions across Kesennuma's coastal plain. Manning's coefficients and their corresponding surface types were derived from established literature, including Bricker et al. (2015), Chow (1959), FEMA (2007), Yanagisawa et al. (2009), Liu et al. (2008), and USACE HEC-RAS (2020). These sources were used to capture realistic variability across open water, beaches, vegetation, and urbanised areas. The coefficients listed in Table 1 were applied consistently across all simulations, including both present and future SLR conditions, so that variations in model results could be attributed to differences in water level or defence configuration rather than to changes in surface roughness. Frictional resistance was therefore the primary factor influencing nearshore flow velocity, wave attenuation, and inundation depth. This configuration follows established practice in tsunami inundation modelling and remains consistent with validated applications of TUNAMI-N2.
Table 1Mannings coefficient value ranges and their sources used in this study. Unless otherwise shown in the figures for each defence system, values were typically taken from the midpoint of these ranges.
3.4 Simulation set-up and Outputs
A total of 150 simulations were conducted to evaluate the performance of alternative multi-layered tsunami defence configurations under varying source and SLR conditions. The simulations covered all combinations of two study areas (Central Kesennuma and the Karakuwa Peninsula), three tsunami sources (Kuril Trench, Japan Trench, and GEJE), five defence scenarios (no defences, current defences, and the three proposed multi-layered designs), and five SLR conditions (current, plus SSP2–4.5 and SSP5–8.5 for 2050 and 2100). This structure enabled systematic comparison across both present and projected conditions while isolating the influence of defence configuration and sea level.
Each simulation produced a complete set of spatial and temporal outputs stored as georeferenced raster datasets. The resulting data were subsequently analysed to derive quantitative indicators representing the physical and human dimensions of tsunami impact under different hazard and defence conditions. These outputs provide the foundation for the subsequent assessment of inundation extent, fatality rate, and economic loss, which together capture the combined physical and social performance of the tested defence systems. The following sections describe in detail the procedures used to calculate each of these indicators from the model results.
3.4.1 Inundation extent
Inundation extent represents one of the most fundamental indicators in tsunami hazard assessment, providing a direct, spatially quantifiable measure of the total area flooded during a tsunami event. It serves as a first-order metric of hazard intensity and potential exposure, enabling comparison of the relative protective capacity of different coastal defence configurations.
For each simulation, inundation extent was calculated from the model output by summing the total area of all grid cells in which water depth values were positive. This method captures spatial variation in flooding and provides a single aggregated value for each scenario. The calculation followed Eq. (4):
where hi,j represents the water depth at grid cell (i,j), and Δx and Δy are the dimensions of each cell in metres. A minimum depth threshold of 0.01 m (1 cm) was applied to define inundation. This threshold does not represent physically significant flooding but serves to exclude minor numerical oscillations and residual wetting inherent to finite-difference tsunami solvers. Similar small thresholds have been adopted in previous tsunami modelling studies to stabilise wet–dry interfaces and maintain computational accuracy (Imamura, 1996; Goto et al., 1997).
This cell-based approach preserves the fine-scale variability of inundation patterns across Kesennuma's coastal plain and allows consistent aggregation at the city scale. By applying the same computational domain and grid resolution across all scenarios, the resulting inundation areas can be directly compared to assess the effect of different defence designs.
The use of total inundated area as a comparative measure is well supported in tsunami research, having been shown to correlate strongly with flow depth, run-up, and structural damage in both empirical and model-based studies (Shuto and Fujima, 2009; Shigihara et al., 2022). Comparing inundation areas between identical source and SLR conditions isolates the influence of defence design, allowing reductions in flooded area to be interpreted as direct indicators of mitigation effectiveness. This provides a reproducible and transparent basis for evaluating how each defence configuration contributes to overall hazard reduction.
3.4.2 Fatality Rates
Fatality estimation provides a comparative indicator of relative human impact across defence configurations within a controlled modelling framework. It links physical hazard intensity to population exposure, allowing evaluation of how changes in defence configuration alter potential casualties. The outputs should not be interpreted as predictions of real-world casualties, as they are derived from a deterministic scenario framework that does not account for behavioural or situational factors. For this study, fatalities were estimated using depth based empirical fatality rates derived from observed tsunami impacts. Population data were obtained from the official 500 m Japanese census mesh, which represents night-time residential distributions. Census counts were transferred to the 5 m tsunami model grid using an areal weighting, population conserving redistribution approach. For each 500 m census cell, population density was assumed to be spatially uniform within the cell. The total population of each census cell was therefore distributed across all intersecting 5 m tsunami grid cells in proportion to the fraction of the census cell area covered by each 5 m cell. This ensured that population totals were exactly preserved while enabling population exposure to be represented at the tsunami model resolution. For each grid cell, the modelled maximum water depth was used to assign a fatality rate based on depth ranges established in prior studies, shown in Table 2.
Table 2Depth based fatality rates used in our fatality rates calculations adopted from empirical tsunami fatality functions consistent with Suppasri et al. (2016a) and Koshimura et al. (2009b).
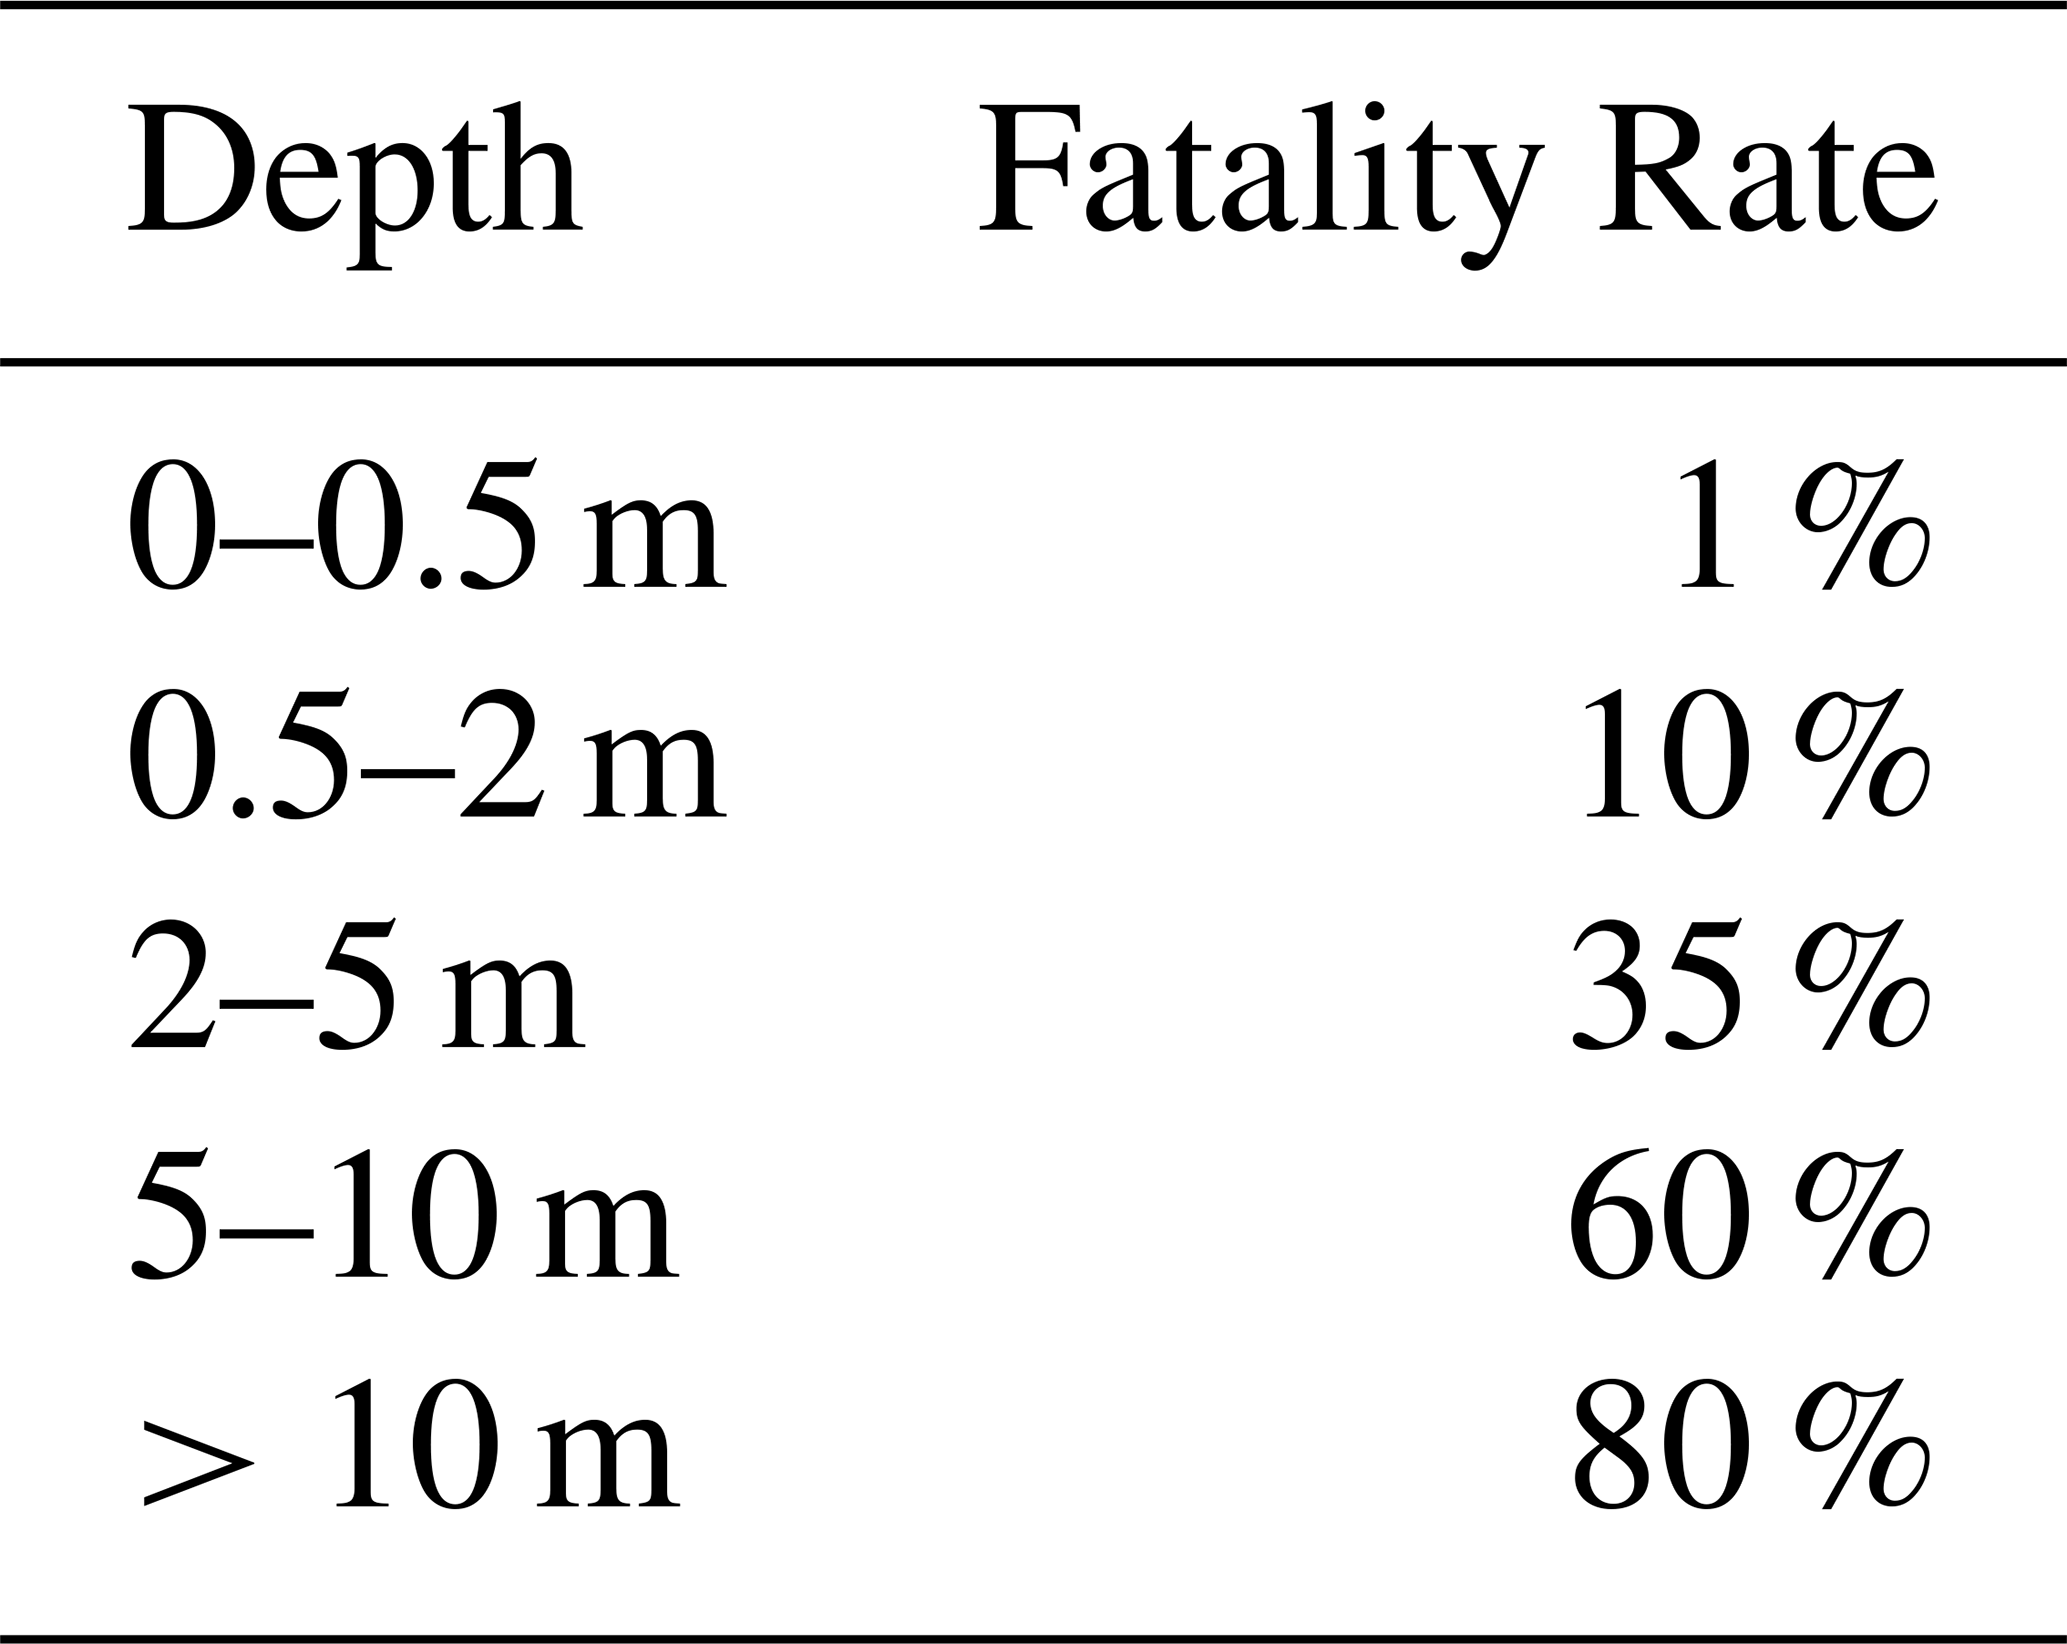
The depth thresholds in Table 2 assume a uniform fatality probability within each depth band and do not account for velocity, debris loading, or building type, factors known to modify mortality at a given depth. The empirical fatality ratios underlying Table 2 were derived using residential population counts as the exposure basis, that is, people living in the area rather than people present at the moment of impact, consistent with the census-based population data used in this study, ensuring the depth-based rates are applied to a population exposure basis matching the one they were derived from. The estimated fatalities for a single computational mesh (Fi) are defined as the product of the exposed population and the depth-dependent fatality rate, as expressed in Eq. (5):
where Pi represents the population count within mesh i, and R(hi) is the fatality rate derived from the specific inundation depth h at that location i. Finally, the total fatality count for the entire simulation area Ftotal was obtained by aggregating the values across all meshes (N) in the domain, as shown in Eq. (6):
This method captures the non-linear relationship between inundation depth and mortality, which increases sharply with flow depth and velocity (Ishiguro and Yano, 2015; Suppasri et al., 2016a). Field evidence from past tsunamis, including the 2011 Tohoku event, shows the same pattern: mortality rises rapidly once depths exceed approximately 2–3 m due to greater flow energy, debris loading, and reduced survivability (Koshimura et al., 2009b; Suppasri et al., 2016a). Depth-based fatality models therefore provide a practical and empirically grounded method when detailed behavioural or evacuation data are unavailable. They have been applied successfully across multiple tsunami settings and magnitudes, demonstrating suitability for scenario-based comparative assessment. By comparing fatality estimates across scenarios that share identical fault models, SLR conditions, and population distributions, any reduction in total or spatially distributed fatalities can be attributed directly to the influence of coastal defence design. This provides an interpretable, human centred measure of protective performance and complements the physical metrics of inundation and flow depth.
Depth-based fatality functions carry inherent uncertainties that are important to acknowledge. Real-world mortality outcomes are influenced by a range of situational and behavioural factors, including time of day, population distribution at the moment of impact, evacuation behaviour, warning status, age demographics, and community preparedness, none of which are captured in a deterministic depth-based framework (Suppasri et al., 2016b; Latcharote et al., 2018; Behrens et al., 2021). For example, the 2011 GEJE occurred in the afternoon, meaning daytime population distributions differed substantially from the census-derived night-time values used in such models, introducing considerable uncertainty into absolute fatality estimates (Suppasri et al., 2016b). The fatality outputs in this study should therefore not be interpreted as predictions of real-world casualties but as comparative indicators within a controlled scenario framework, where source, SLR, and population conditions are held constant within each comparison to isolate the influence of defence configuration.
3.4.3 Economic Loss
Economic loss estimation translates physical damage into financial impact, providing an intuitive and policy-relevant measure of tsunami consequences. It complements physical hazard metrics by expressing results in economic terms that directly relate to reconstruction needs and fiscal risk. Building footprints for Kesennuma were obtained from OpenStreetMap (© OpenStreetMap contributors) using a BBBike.org extract, processed with osmium2shape to retain building polygons and clipped to the model domain. Attribute fields in the OSM dataset enabled identification of building use, allowing the separation of all buildings from key buildings. All features were converted to centroids and rasterised at 5 m resolution to align with the innermost computational grid.
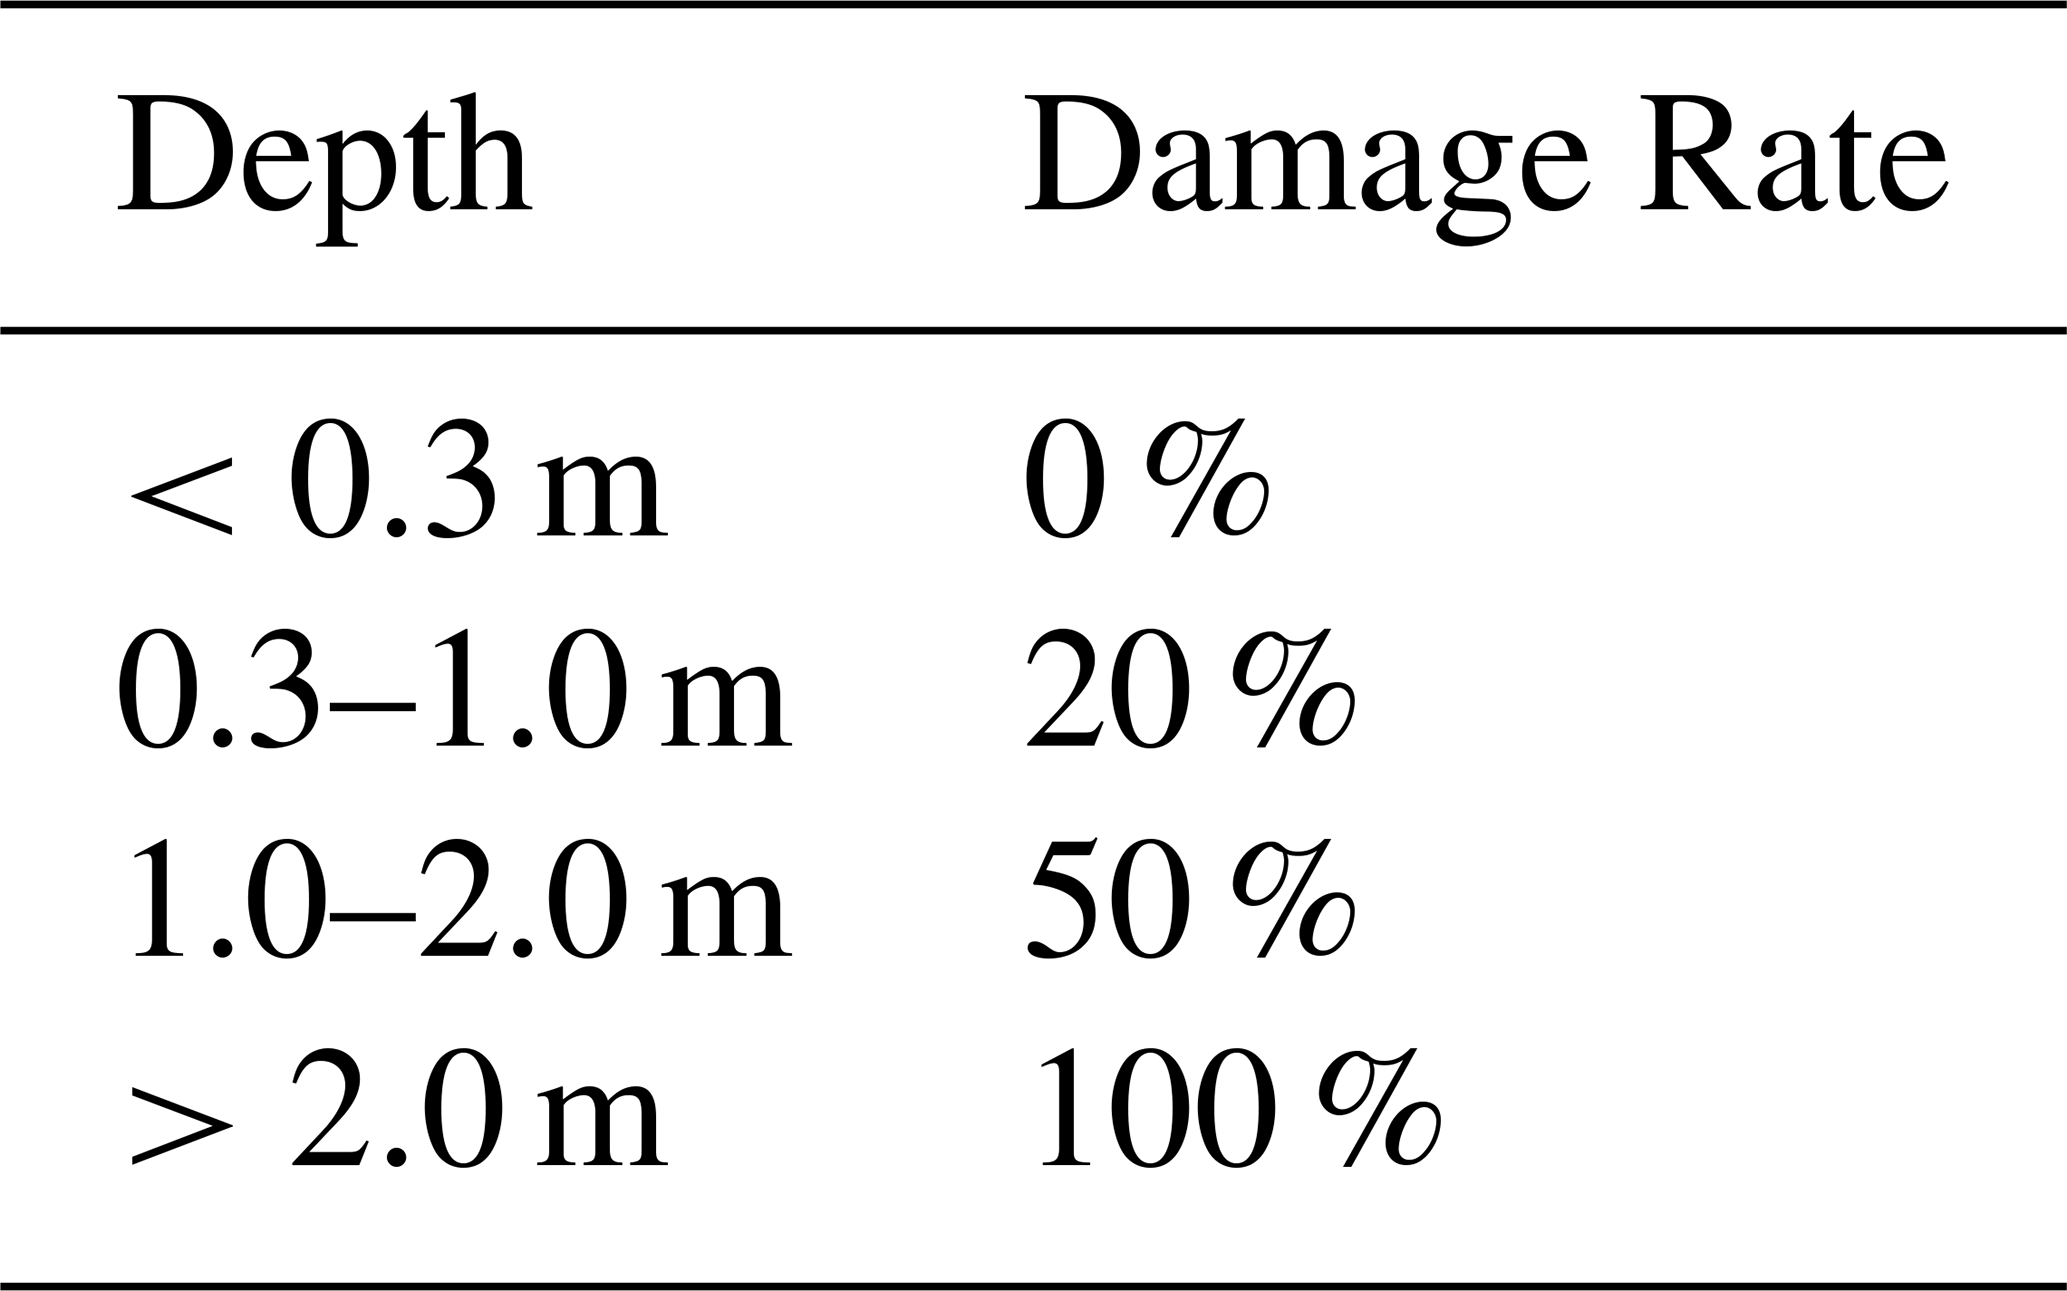
Each building footprint was assigned a damage rate based on the maximum inundation depth calculated in the model outputs. The classification adopted in this study is seen in Table 3 (after MLIT, 2013b; Suppasri et al., 2013; FEMA, 2015).
Table 3Depth based damage rates used within the study (after MLIT, 2013b; Suppasri et al., 2013; FEMA, 2015).
Per-building economic loss was then computed as Eq. (7)
where JPY 20 000 000 represents a single conservative proxy for building replacement cost (after Japan Cabinet Office, 2019; Tanikawa et al., 2017). Although this represents a typical residential replacement cost, it is applied to all building types because Japanese government guidelines permit the use of a single representative asset value when detailed typology data are unavailable. This follows the approach adopted in rapid post-disaster loss accounting by the Cabinet Office (2019), where aggregated capital-stock values are applied uniformly in municipalities lacking structure-specific inventories, and in nationwide building-stock estimation methods such as Tanikawa et al. (2017), which use averaged unit construction costs across heterogeneous building stocks. MLIT flood-damage survey procedures likewise allow the application of unified asset values and depth–damage functions when structural categories cannot be reliably distinguished (MLIT, 2023). In Kesennuma, the coastal built environment is dominated by small-scale residential dwellings, making a residential proxy representative of most structures in the study area. Because non-residential and reinforced-concrete buildings generally have higher replacement costs than dwellings, applying a residential-scale proxy (JPY 20 million) yields conservative loss estimates for mixed inventories. This remains consistent with MLIT and Cabinet Office practice, in which hazard intensity (e.g., inundation depth or seismic motion) drives variation in loss, while the monetary value of exposed buildings may be represented with a unified proxy when structural categories cannot be distinguished. Although OSM building footprints only provide basic typology tags rather than detailed structural information, the available building type data was sufficient for this study, and using per building footprints with depth-based loss functions remains suitable because variation in inundation depth contributes more to economic loss than structural characteristics in this modelling framework. Key buildings, including hospitals, schools, fire and police stations, designated evacuation facilities, and other critical service providers, were analysed separately using the same depth–damage classes and unit replacement cost; building distribution and the location of key buildings can be seen in Fig. 8. This allows targeted assessment of potential disruption to essential services and supports prioritisation of mitigation and recovery efforts beyond aggregate loss alone. Total citywide loss for each simulation was obtained as Eq. (8):
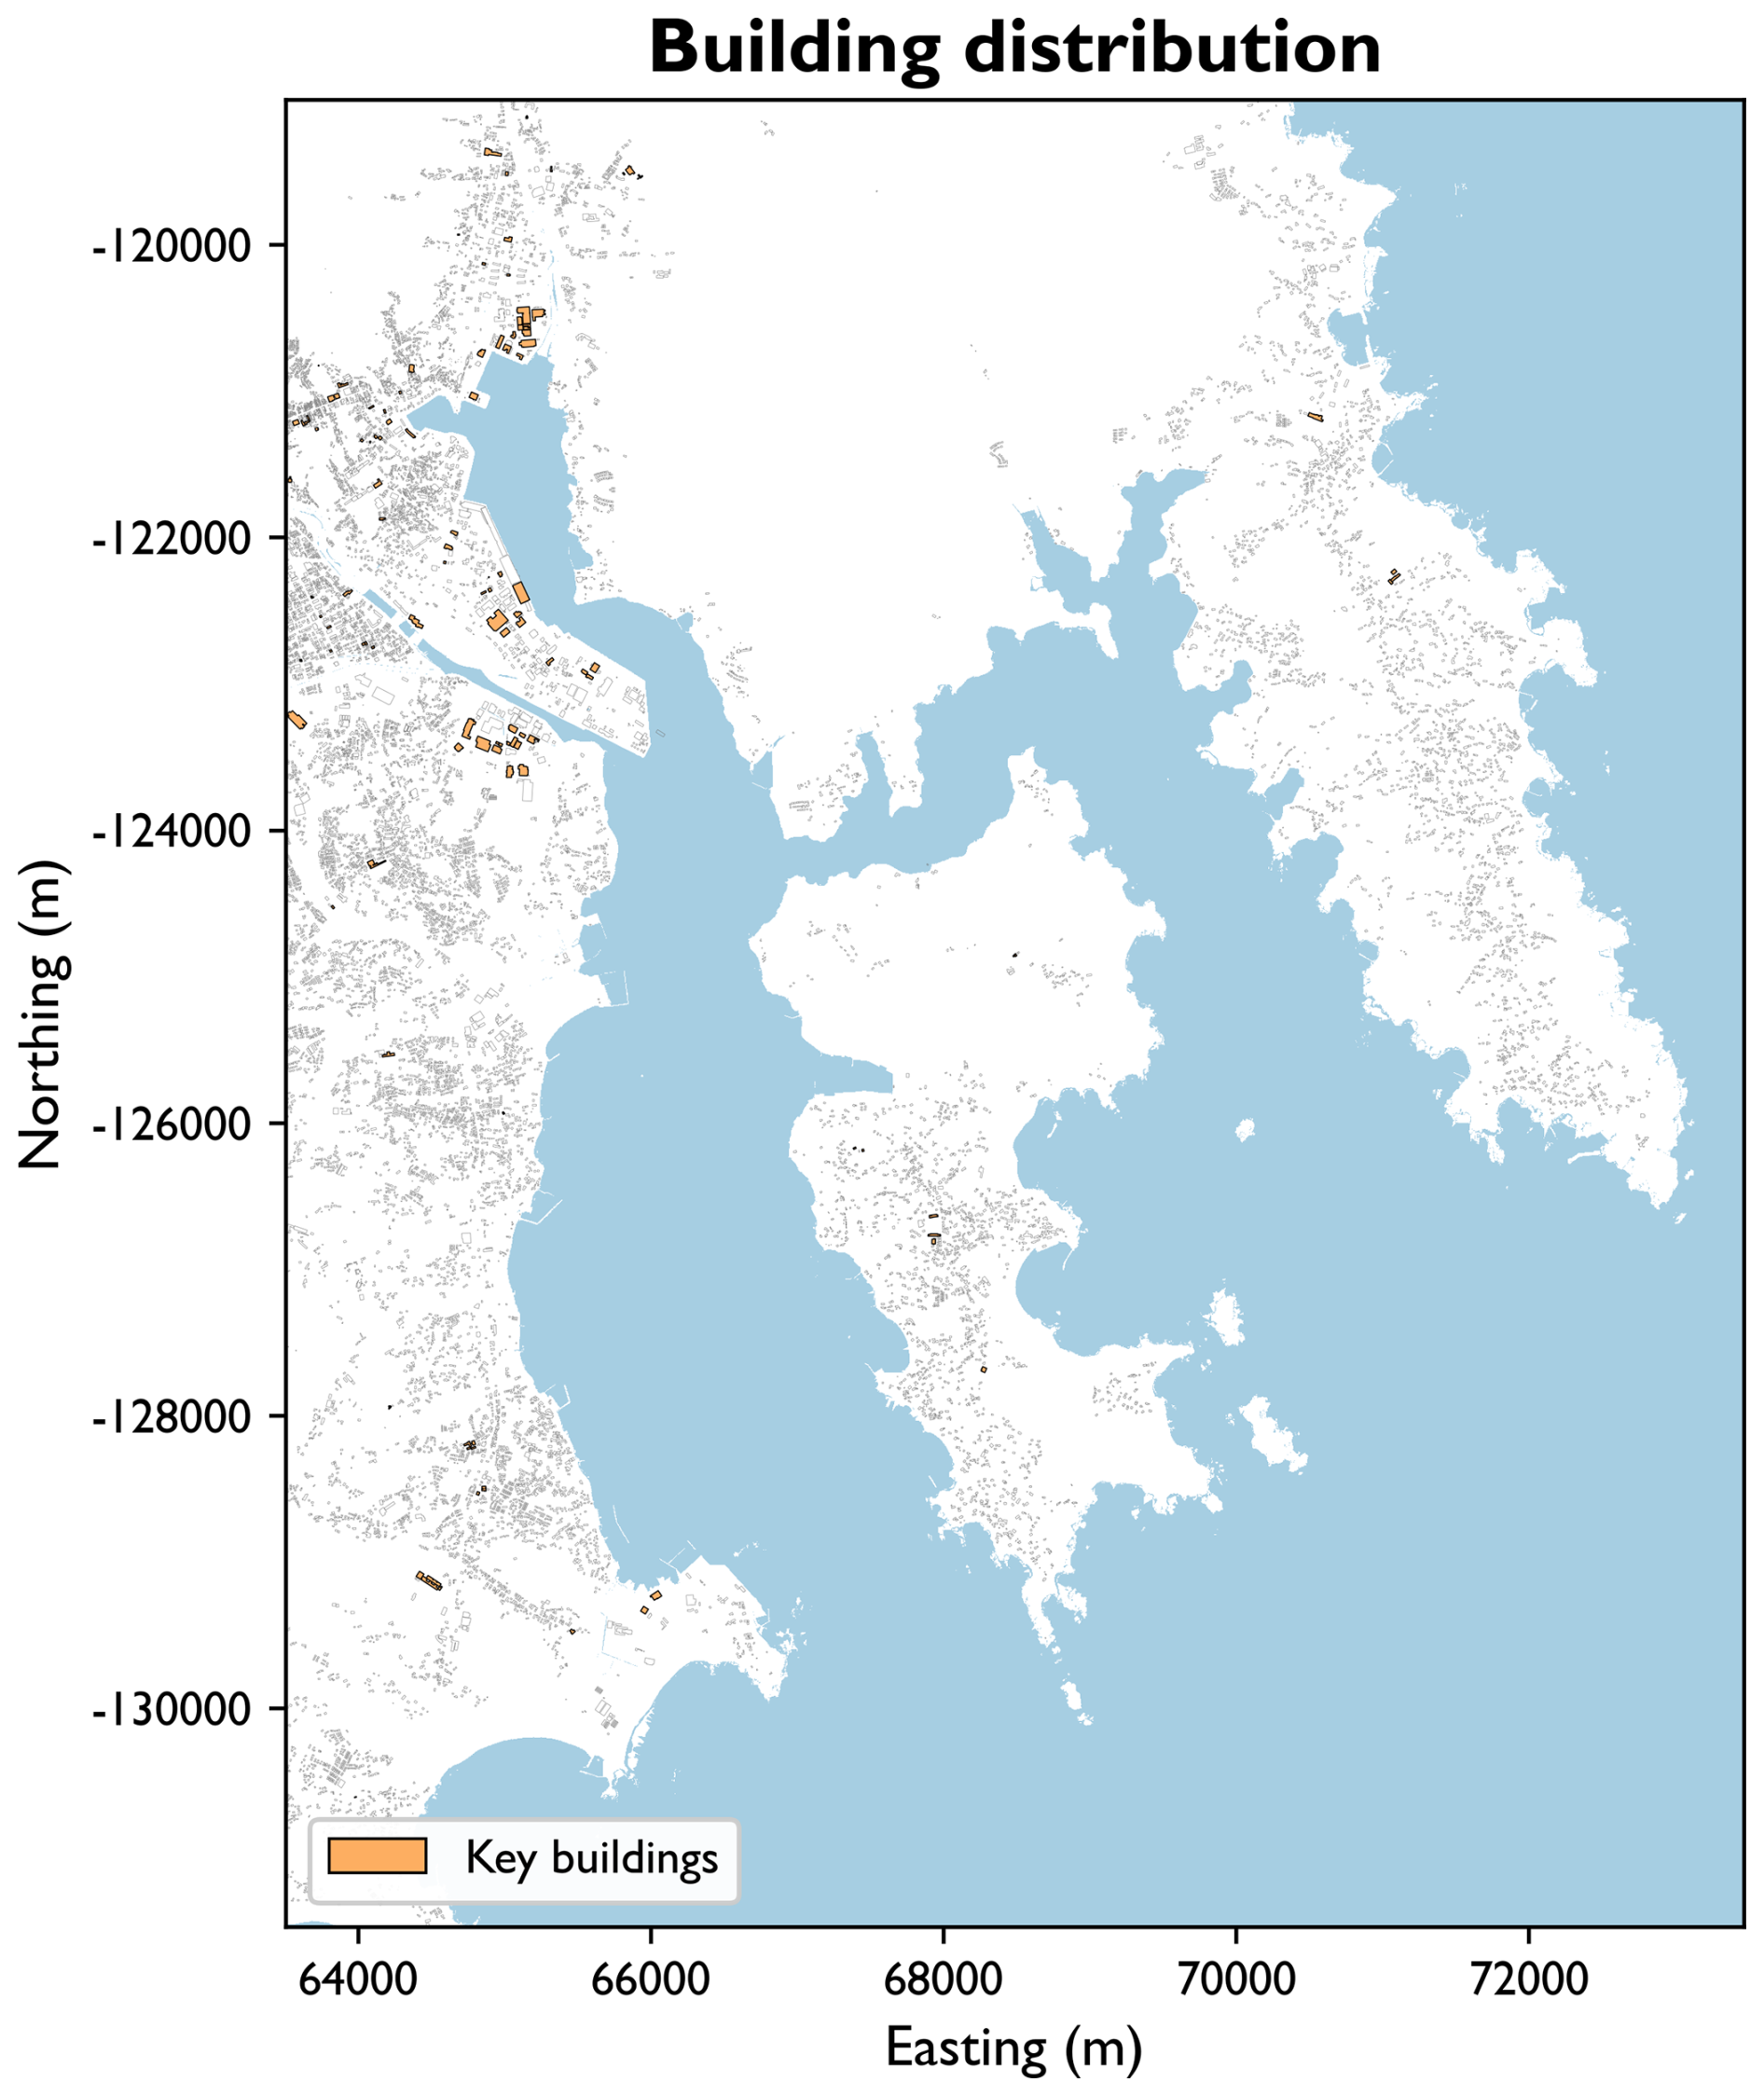
Figure 8Building distribution within Kesennuma, showing the location of Key Buildings such as hospitals, dentists and other health facilities, schools, government offices and utilities.
A damage ratio was deliberately not used because averaging damage rates across all buildings collapses spatial and structural variation, removing the differentiation that the ratio is intended to represent. Economic loss calculations preserve this variation by maintaining per-building distinctions and provide a more interpretable expression of impact for both technical and public audiences. Reporting total-building and key-building losses together therefore captures both the overall financial impact and the specific vulnerability of critical infrastructure. By comparing economic losses across identical source, SLR, and location conditions, differences can be directly attributed to the presence and configuration of tsunami defences.
The economic loss estimates derived from this approach are subject to uncertainties associated with the simplified depth-damage functions and uniform building replacement cost applied (MLIT, 2013b; Suppasri et al., 2013; FEMA, 2015; Cabinet Office, 2019; Tanikawa et al., 2017). These assumptions follow established practice in rapid loss assessment (Cabinet Office, 2019; Tanikawa et al., 2017) but do not capture variability in structural typology, construction quality, building contents, or indirect losses such as business disruption and loss of function. Outputs should therefore be treated as comparative indicators of relative defence performance rather than absolute financial predictions.
Building on the simulation framework described in Sect. 3, this section presents the outcomes of the TUNAMI-N2 modelling and subsequent analyses. The results evaluate how each multi-layered defence configuration performs across the modelled tsunami scenarios and SLR conditions. Outputs for inundation extent, fatality rate, and economic loss were derived from the numerical simulations and spatial post-processing described previously. Together, these indicators provide an integrated basis for assessing the physical, human, and economic performance of each defence system. All figures in the following results sections use outputs from the Japan Trench tsunami source as a representative case. Although the absolute magnitudes of inundation, fatalities, and economic losses differ between the three modelled source scenarios (Japan Trench, Kuril Trench, and GEJE), all three produced the same relative performance hierarchy among the three defence configurations. The Japan Trench scenario is therefore presented throughout as the representative case, illustrating the spatial patterns and comparative differences between defences, without altering the conclusions drawn from the full multi-source dataset.
4.1 Sea level rise
Simulations show that tsunami inundation area and depth both increase progressively with rising sea levels under the SSP2–4.5 and SSP5–8.5 scenarios (Fig. 9). Across all simulations, higher SLR levels produced deeper and more extensive flooding, greater overlap between adjacent flood zones, and wider low-lying areas exposed to inundation. In Kesennuma, water depths increased most noticeably along inner bay margins, river corridors, and reclaimed coastal land, where even moderate SLR led to deeper and more continuous flooding. By 2100, particularly under SSP5–8.5, isolated shallow zones merged into a single, continuous inundation belt along the waterfront, with deeper pockets forming in enclosed basins and port areas. In Karakuwa, the effect of SLR was more pronounced, with both inundation depth and flooded area expanding substantially across the low-lying southern and eastern plains. Floodwaters penetrated further inland and maintained higher depths for longer durations, especially under late-century high-emission conditions. Overall, both study areas exhibited a consistent pattern of increasing inundation depth and total flooded area with SLR, with the most pronounced amplification occurring by 2100 under the SSP5–8.5 scenario.
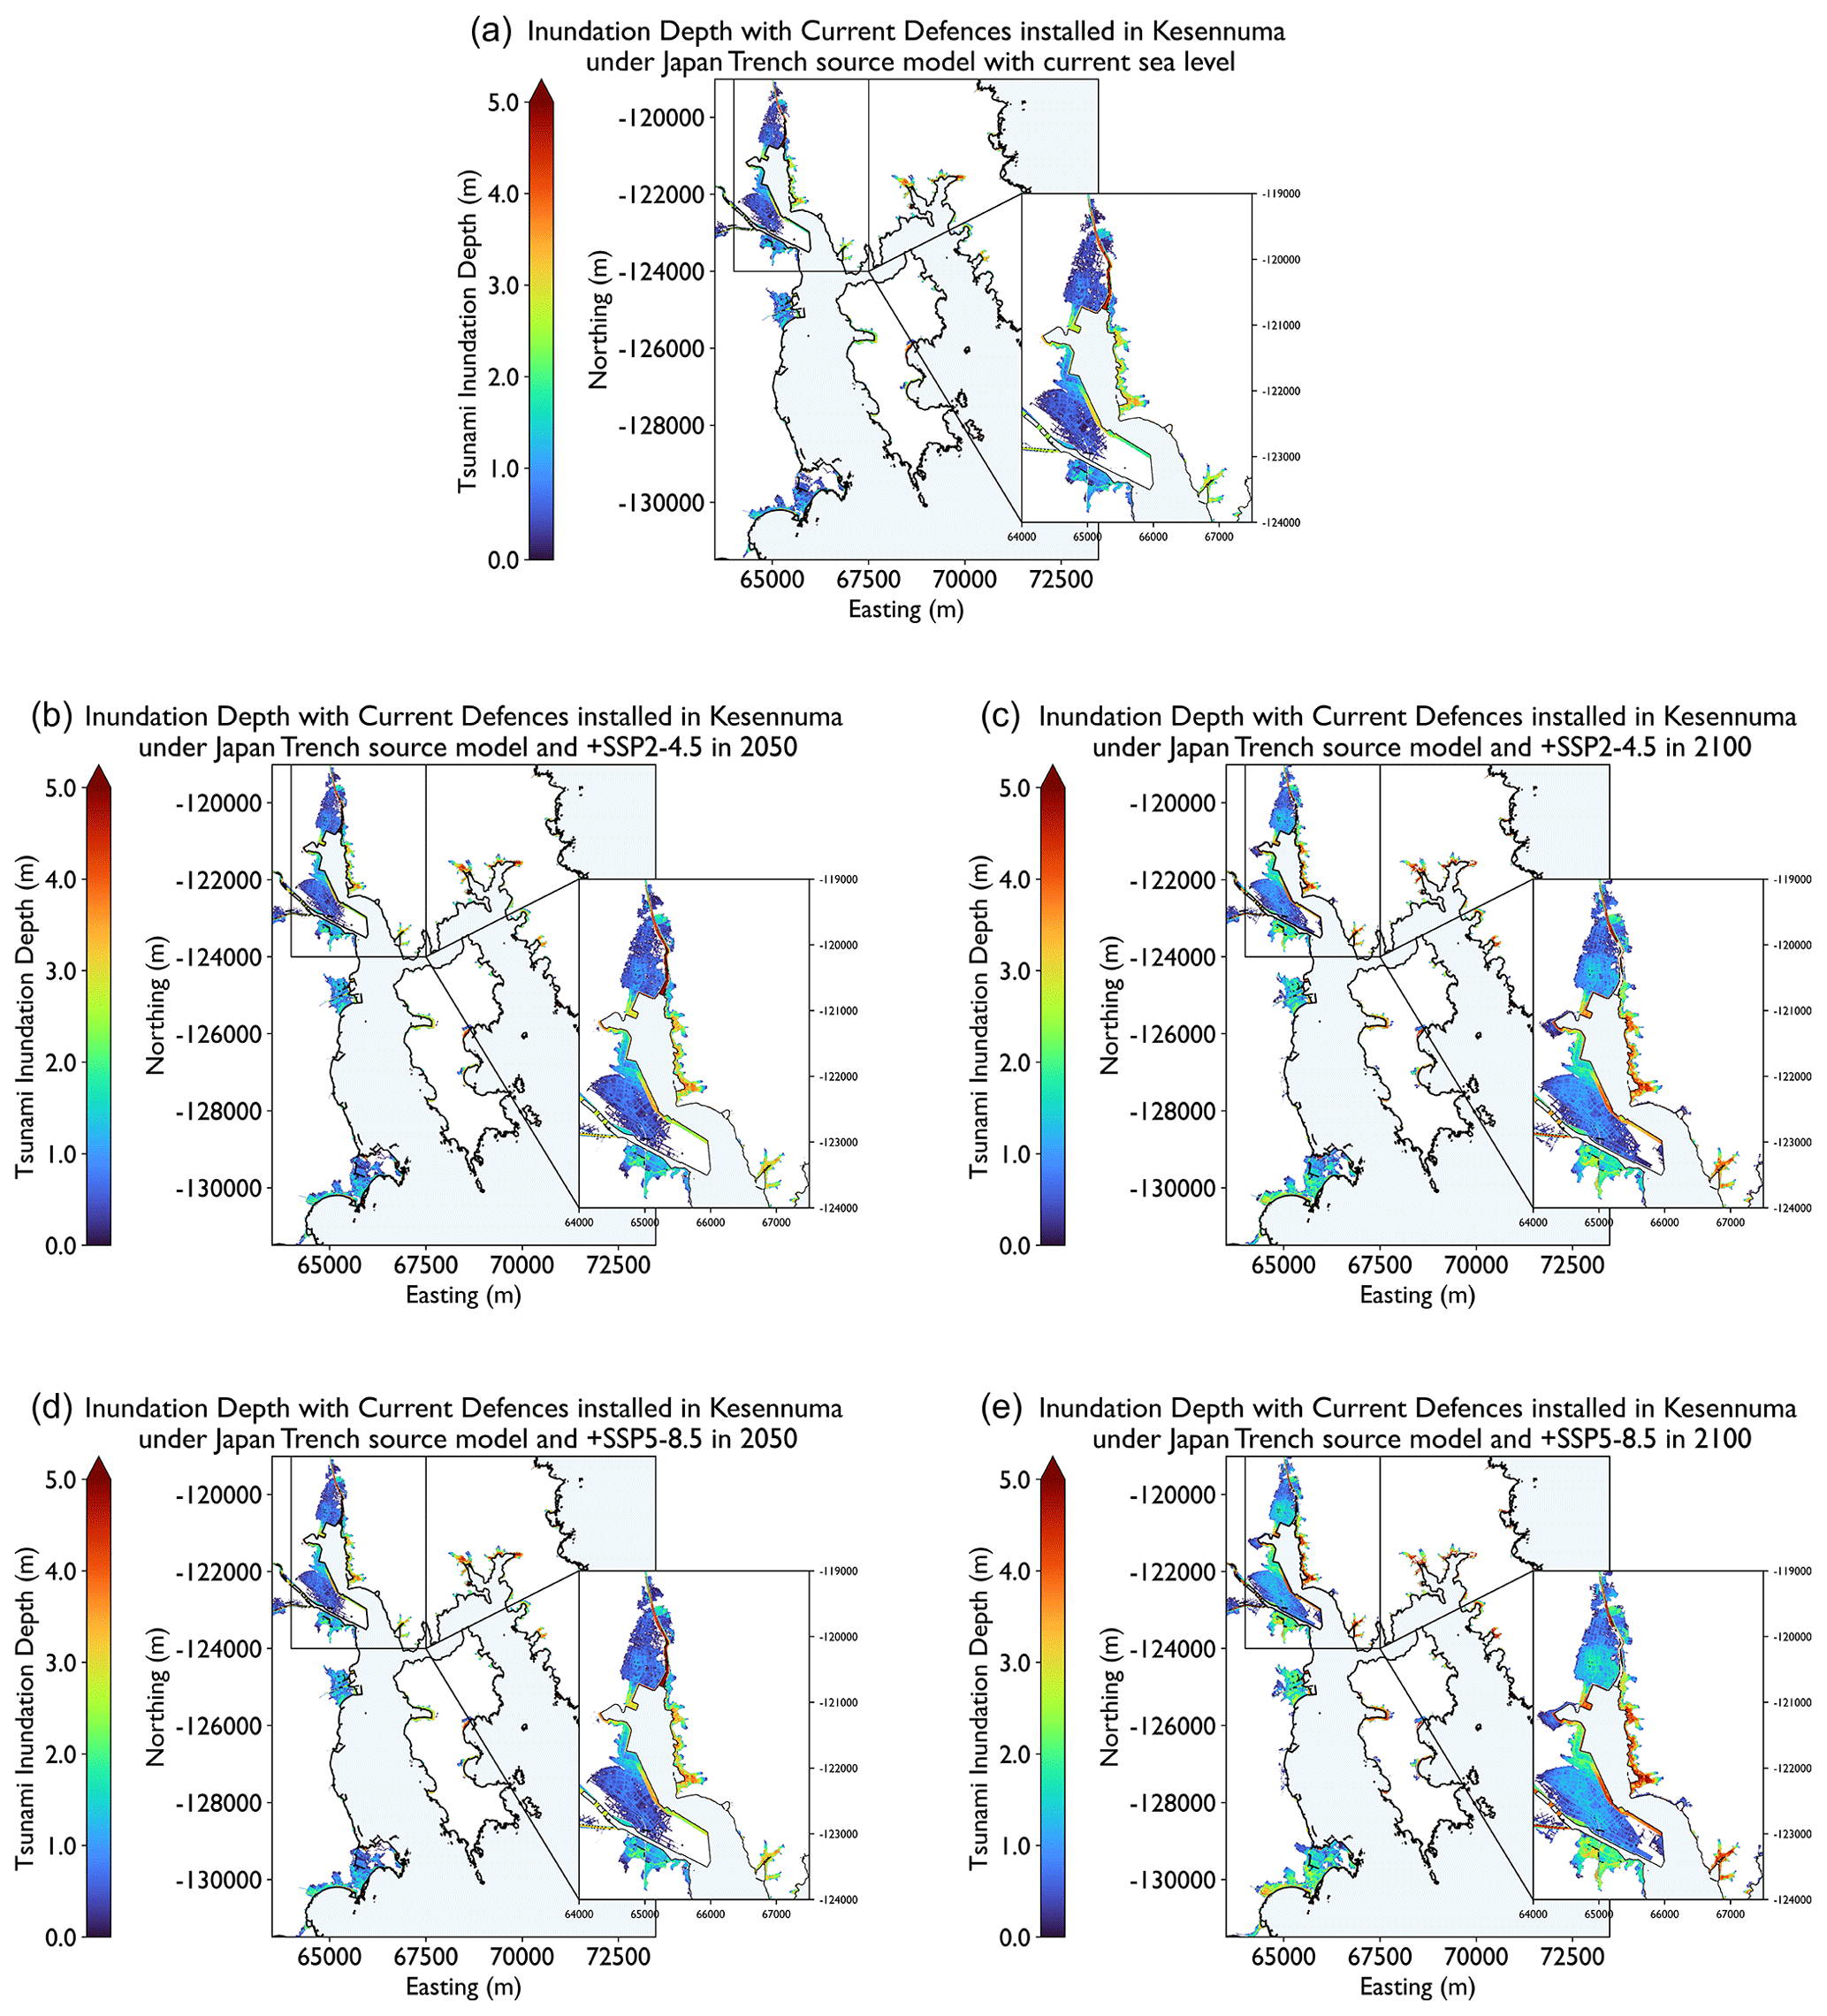
Figure 9Increasing inundation extent and depth under different SLR scenarios (a) No SLR, (b) SSP2–4.5 in 2050, (c) SSP2–4.5 in 2100, (d) SSP5–8.5 in 2050 and (e) SSP5–8.5 in 2100 for the defences currently installed within Kesennuma. Results are shown for the Japan Trench scenario as the representative case, as all three modelled sources produced consistent relative patterns.
4.2 Inundation Extent
Differences in inundation area and containment capacity between the three proposed multi-layered defence configurations are evident across all scenarios (Figs. 10 and 11). Under current sea levels, all three designs substantially reduced flooding compared with the undefended baseline, demonstrating the effectiveness of layered protection. As SLR intensities were increased, however, the ability of each system to sustain protection diverged, revealing distinct performance hierarchies. Across both Kesennuma and Karakuwa, Defence 3 consistently achieved the strongest containment, limiting inland spread and maintaining smaller inundated areas. Defence 2 provided nearly equivalent performance, showing minor additional lateral propagation, while Defence 1 allowed broader, shallower flooding across low-lying terrain. These contrasts became more pronounced under high SLR scenarios, indicating that robust, continuous configurations retained protective capacity more effectively than softer or more permeable designs.
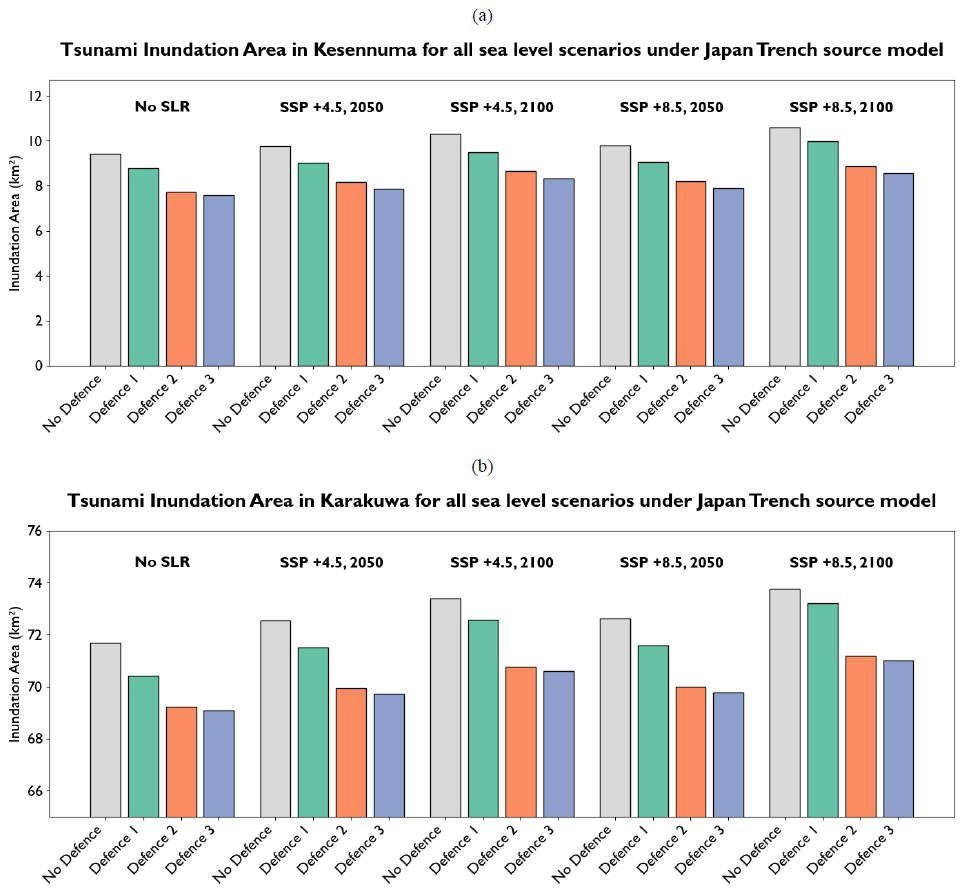
Figure 10Inundation area for (a) Kesennuma and (b) Karakuwa across all SLR scenarios for the three defence configurations and a No Defence baseline, based on the Japan Trench tsunami source model, shown as the representative case because all three modelled sources produced the same relative performance hierarchy among the defence configurations. In both locations, inundation extent increases with SLR, with Defence 2 and Defence 3 limiting area more effectively than Defence 1.
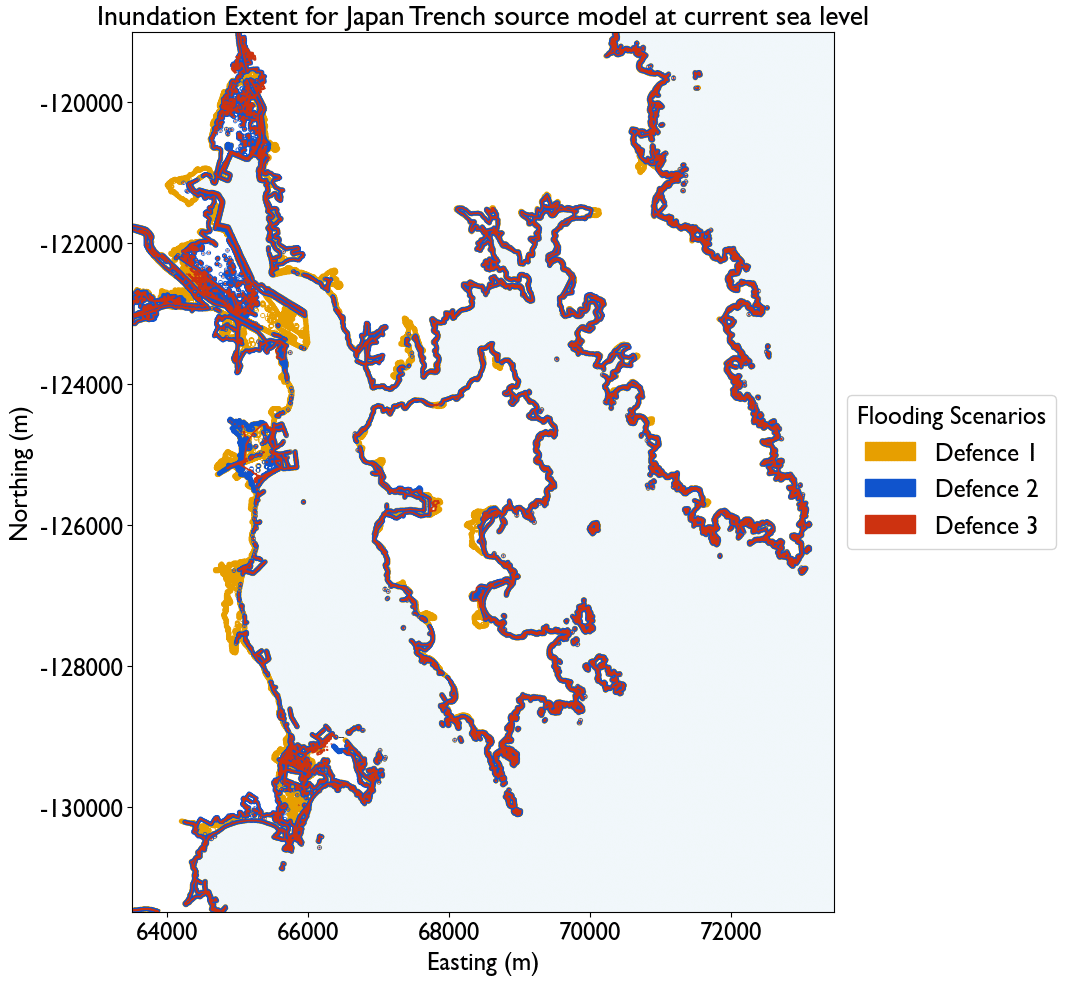
Figure 11Spatial extents showing differences in inundation patterns and areas for each defence configuration.
In Kesennuma, inundation under Defence 1 extended through urban corridors near the port and along transport routes, while Defence 2 and Defence 3 confined flooding largely to the immediate waterfront. Both reinforced systems preserved interior dry zones, even under late-century SLR, while the eco-hybrid design permitted shallow flooding across a wider area. In Karakuwa, Defence 3 restricted inundation to narrow coastal strips, maintaining clear separation between shoreline and inland settlements. Defence 2 performed similarly, though with slightly greater expansion along southern embayment's. Defence 1 produced the widest and most continuous flooding, especially where the vegetated berms and bioswales were overtopped. The spatial comparison map in Fig. 11 highlights these relationships. The blue zones (Defence 3) show the smallest inundation footprint, green (Defence 2) display moderate expansion, and orange (Defence 1) represent the broadest flood coverage. The consistency of this ranking across all SLR conditions confirms that defence configuration, rather than SLR alone is the principal determinant of inundation area and depth.
4.3 Fatality Rate
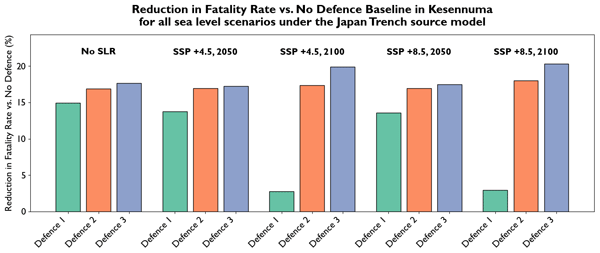
The comparative fatality results presented in Fig. 12 reflect clear spatial and structural patterns across the study area. Across both study areas, defence configuration and structural continuity are the primary determinants of relative human impact outcomes, with SLR functioning as a secondary amplifier of existing performance differences rather than a driver of ranking changes.
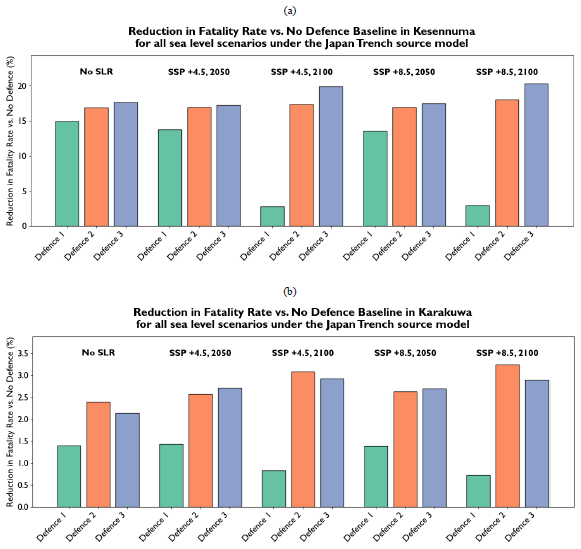
Figure 12Fatality reduction relative to the no-defence baseline for the three defence configurations under all SLR scenarios for (a) Kesennuma and (b) Karakuwa, based on the Japan Trench tsunami source model. In Kesennuma, Defence 2 and Defence 3 show increasing reduction as SLR increases, while Defence 1's reduction falls sharply under late-century, high-emission scenarios. The same pattern is observed in Karakuwa.
In Kesennuma, all three defences perform similarly under present-day and mid-century (2050) conditions, with only marginal differences between SLR scenarios. By 2100, Defence 1's performance against the no-defence baseline falls substantially compared with present-day and mid-century conditions, indicating reduced containment of inundation in the densely populated urban core, while Defence 2 and Defence 3 continue to improve as SLR increases. In Karakuwa, the same pattern is observed, with Defence 1's performance against the no-defence baseline falling by 2100, while Defence 2 and Defence 3 continue to improve as SLR increases. The limited variation across scenarios reflects the topographic control exerted by the peninsula's elevated terrain and the smaller extent of exposed settlement areas.
The comparative fatality results across both sites reveal a consistent structural hierarchy in relative human impact. Defence 2 and Defence 3 maintain comparable and improving performance under all SLR conditions, while Defence 1 shows substantially reduced effectiveness under late-century, high-emission scenarios. These trends should be interpreted in light of the uncertainties inherent in depth-based fatality modelling, as discussed in Sect. 3.4.2, and confirm that defence configuration and structural continuity remain the dominant determinants of comparative human impact outcomes across all tested scenarios, with SLR acting as a secondary amplifier.
4.4 Economic Loss
Patterns of economic loss further reinforce the structural hierarchy observed with SLR and inundation extent. Total losses for all buildings and key infrastructure increased under higher SLR, but the rate and magnitude of increase were strongly dependent on the defence configuration (Figs. 13 and 15). Across both study areas, Defence 3 consistently produced the lowest total and key-building losses, while Defence 2 achieved nearly comparable reductions. Defence 1 allowed significantly higher losses due to broader inundation and deeper flooding across developed areas. The largest differences between designs occurred under late-century SLR, highlighting that continuous, structurally reinforced systems maintain their performance advantage even as background water levels rise. In Kesennuma, economic losses were concentrated along waterfront districts, industrial areas, and river-mouth corridors. Defences 2 and 3 limited these losses primarily to shallow zones near the port, preventing inland spread and protecting critical facilities. Defence 1 reduced losses relative to the baseline but allowed wider low-intensity flooding, increasing the number of affected buildings despite lower individual damage levels. Figure 14 illustrates the spatial distribution of economic loss per building under Defence 1 for the SSP5–8.5 scenario in 2100, representing the conditions with the largest overall losses across all simulations. Loss is seen around Kesennuma's port district, along the main waterways, and near river mouths and coastal margins where inundation depths are greater and building density is high. In contrast, little loss is evident in the more elevated and inland sectors, particularly outside the central urban basin, where topography limits flood penetration. The pattern shows that economic loss is concentrated in low-lying urban and estuarine zones around the port area, while inland and higher-elevation areas remain largely unaffected. Defences 2 and 3 display similar spatial distributions but with smaller affected areas and lower loss magnitudes.
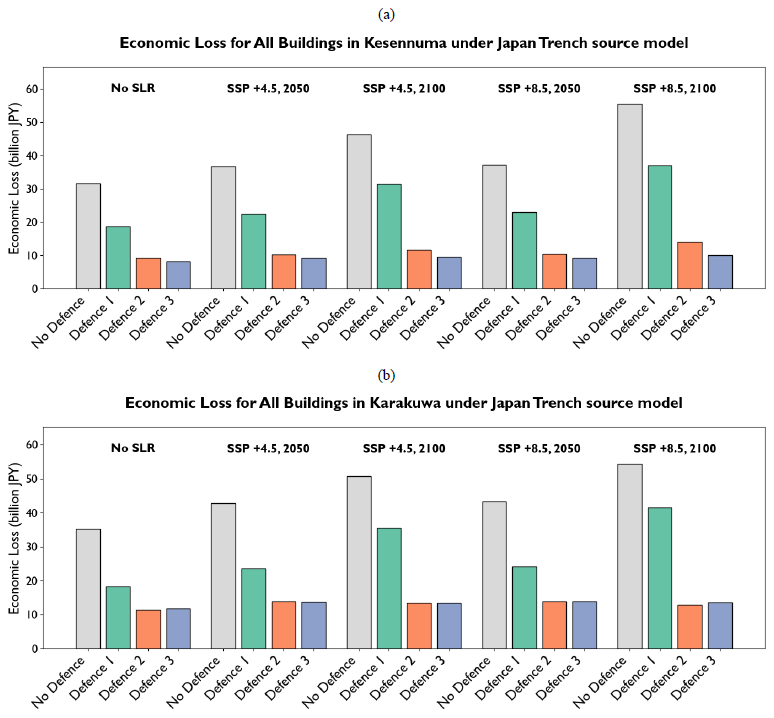
Figure 13Economic loss for all buildings in (a) Kesennuma and (b) Karakuwa. Defence 1 produces consistently higher losses across all scenarios, while Defences 2 and 3 differ only marginally.
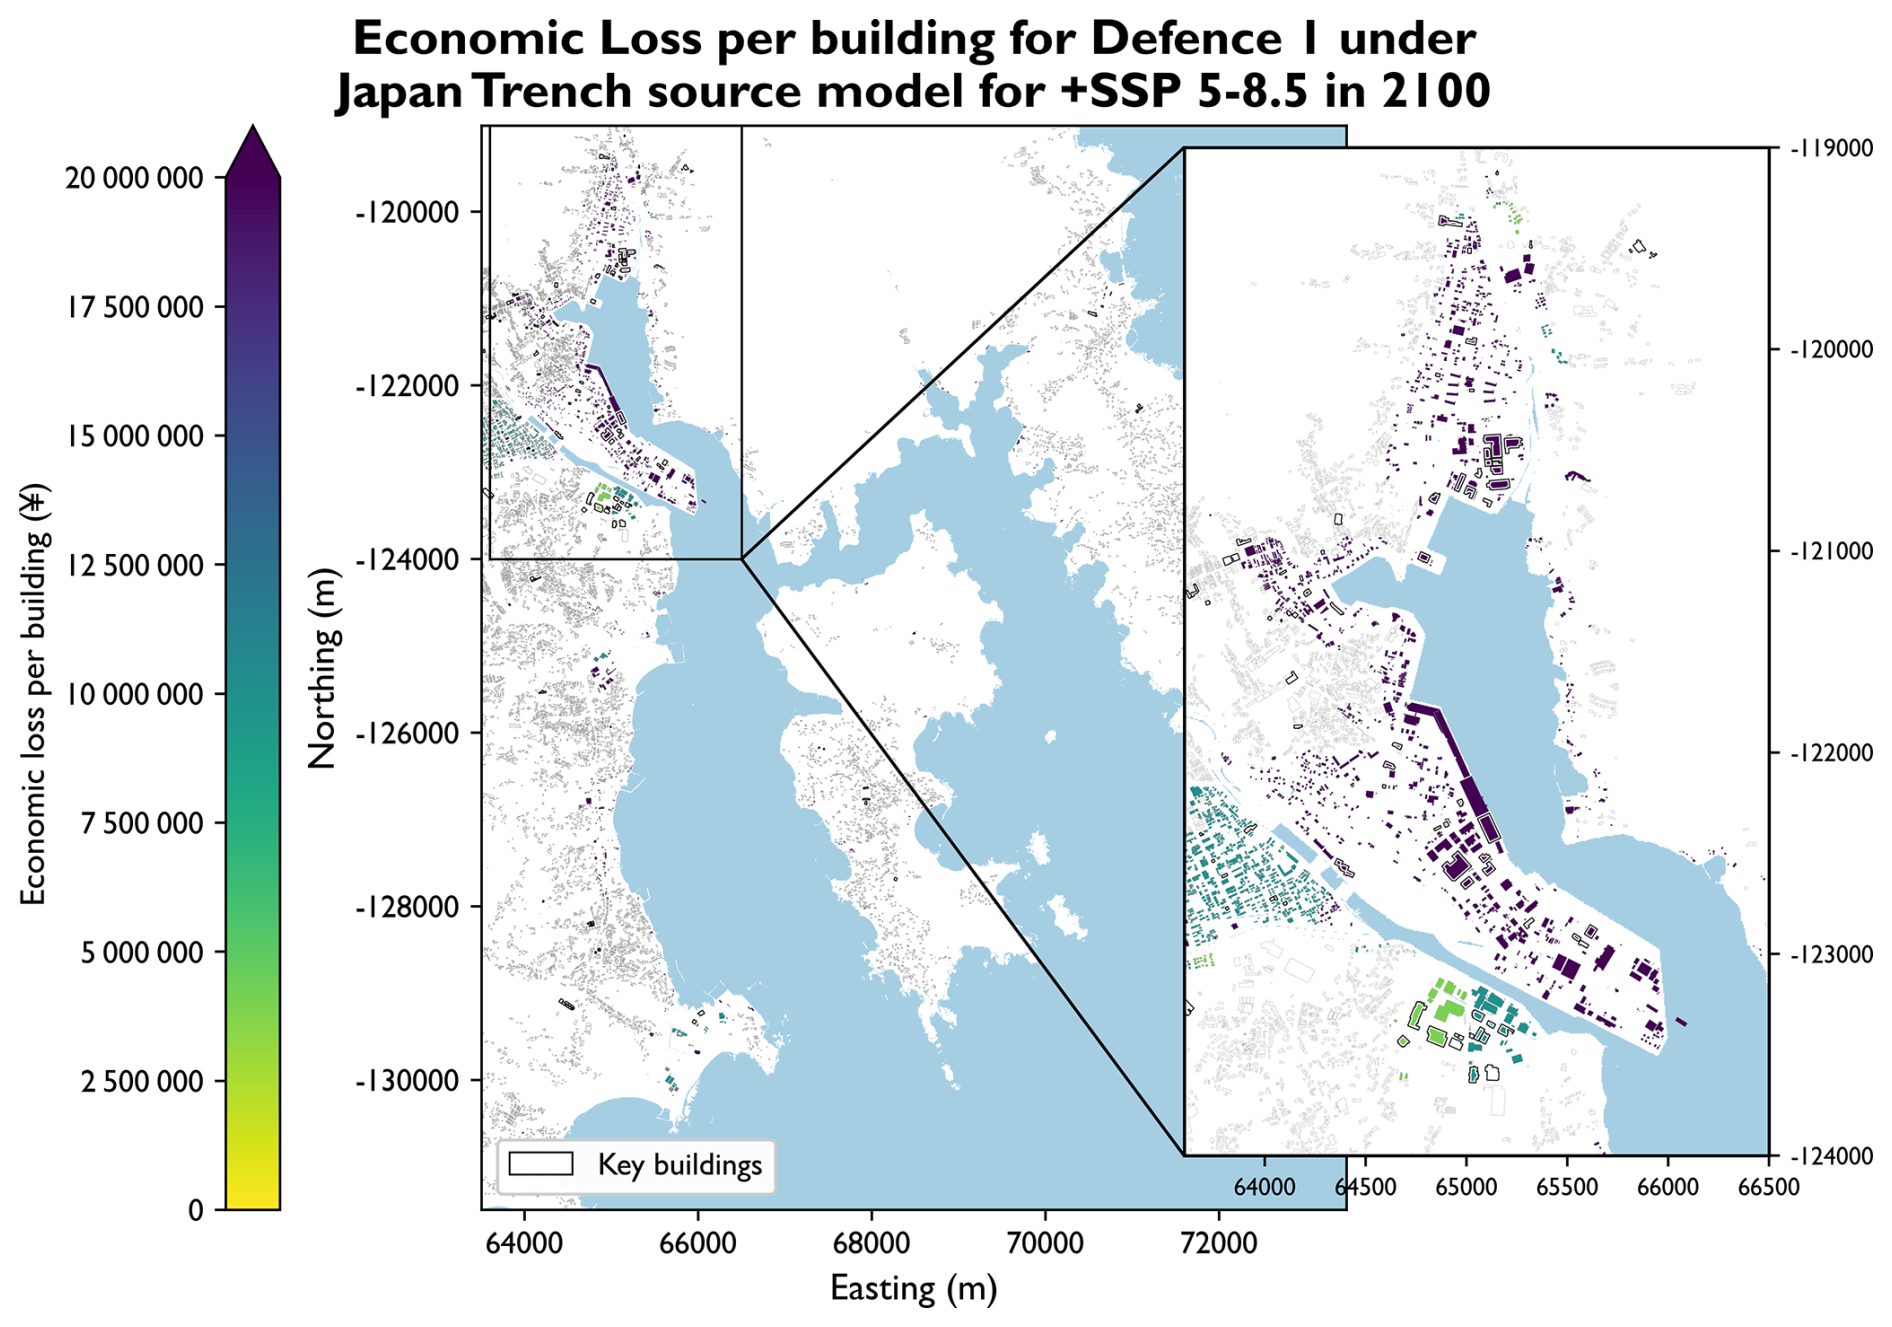
Figure 14Spatial distribution of economic loss per building for Defence 1 under the Japan Trench source, SSP5–8.5 scenario in 2100. Loss hotspots are concentrated around Kesennuma's port, waterways, and coastal margins, where inundation depth and building density are highest. Inland and elevated zones exhibit minimal losses due to reduced exposure and topographic protection.
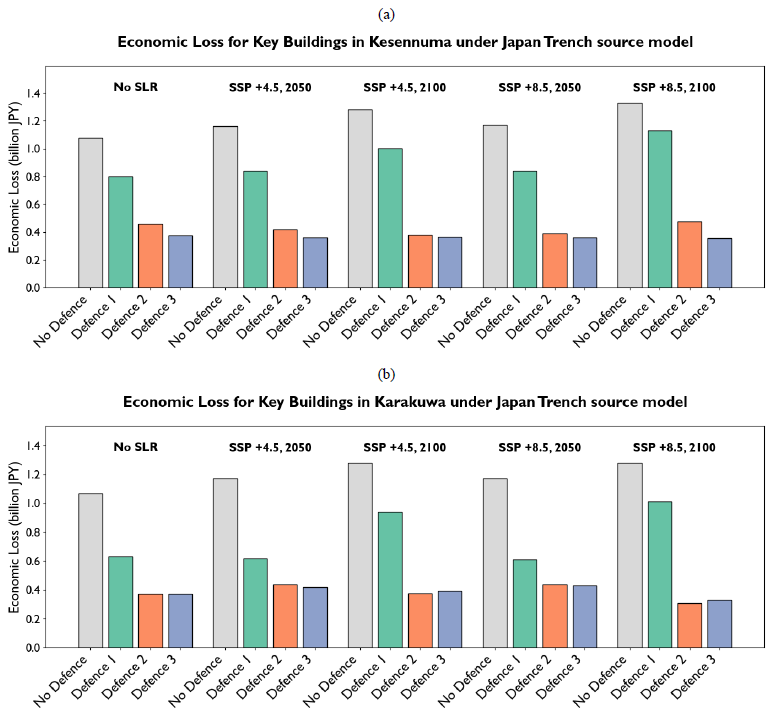
Figure 15Economic loss for key buildings in (a) Kesennuma and (b) Karakuwa, mirroring results from all buildings where Defence 1 produces consistently higher losses across all scenarios and Defences 2 and 3 differ only marginally.
In Karakuwa, overall losses were smaller due to lower population and building density, but the proportional differences between configurations were larger. Defence 3 again achieved the strongest containment, preventing substantial damage to inland settlements. Defence 2 showed similar behaviour with slightly greater exposure along southern bays, while Defence 1 experienced the highest losses, particularly in areas where berms were overtopped.
The consistency of this hierarchy across all emission and SLR conditions confirms that the configuration and continuity of multi-layered systems dominate their capacity to limit financial impacts. Against the no-defence case, total losses under all three configurations fall substantially, with the largest reductions occurring under Defence 2 and Defence 3. Rising sea levels amplify losses across all systems, but the gap between robust and softer defences widens under more extreme conditions, reinforcing the importance of structural integrity for long-term resilience. While the relative performance hierarchy is considered robust across all tested scenarios, the absolute loss values are subject to the uncertainties outlined in Sect. 3.4.3 Economic Loss, including the uniform building replacement cost and simplified depth-damage functions applied.
The results demonstrate a clear structural hierarchy across all evaluated indicators, yet the magnitude of difference between the two stronger configurations was smaller than expected, given their contrasting design philosophies. Defence 2 achieved performance comparable to Defence 3, typically within 10 %–15 % across inundation, fatality, and economic loss metrics. Defence 3, which most closely mirrors conventional Japanese coastal engineering, achieved the greatest overall containment but relied heavily on large-scale concrete structures and seawalls that impose significant spatial and visual intrusion. In contrast, Defence 2, designed around transparency, unobstructed visibility, and social openness, achieved nearly equivalent protection with substantially lower physical dominance. This outcome indicates that an open and visually integrated design can maintain technical effectiveness while aligning with HCD priorities. However, it should be noted that the simulated configurations were conceptual rather than physically validated, meaning that their mechanical feasibility, constructability, and long-term maintenance performance were not empirically tested.
The relative performance of Defence 1 further highlights this balance between environmental integration and structural containment. While it embodies Kesennuma's municipal reconstruction principles emphasising ecological harmony and landscape continuity, it consistently exhibited greater inundation spread, slightly higher fatality estimates, and elevated economic losses compared with the other two systems. It should be emphasised that the fatality estimates presented here are comparative indicators derived from a depth-based model and should not be interpreted as predictions of real-world casualties, as outlined in Sect. 3.4.2 Fatality Rates. In practice, absolute fatality outcomes would depend on a range of situational factors including time of day, evacuation behaviour, warning status, age demographics, and community preparedness, none of which are represented in a deterministic depth-based approach (Yun and Hamada, 2015; Suppasri et al., 2016b; Latcharote et al., 2018). These outcomes mirror results from other hybrid or nature-based defence studies, which highlight that vegetation and soft materials effectively dissipate flow energy but cannot fully prevent inland propagation during extreme events (Takabatake et al., 2020; Omori et al., 2019). However, in the fatality results, this difference was relatively minor, particularly in Karakuwa, where the elevated terrain and dispersed settlement pattern constrained population exposure. Real-world fatality outcomes in Karakuwa would additionally be influenced by whether residents had evacuated and the effectiveness of early warning systems at the time of the event, meaning the comparative indicators presented here represent a controlled approximation rather than a likely outcome. The peninsula's topographic control limited the amplification of fatalities under higher SLR, resulting in only marginal change across all scenarios (Mori et al., 2011; Suppasri et al., 2013; Koyano et al., 2022). Population data used in the fatality analysis were based on night-time residential distributions derived from national census datasets, meaning that fatalities were only estimated for inhabited areas. This represents a further source of uncertainty, as daytime population distributions, particularly in port and commercial areas, may differ substantially from the census-derived values used here, potentially altering both the magnitude and spatial distribution of estimated fatalities (Yun and Hamada, 2015; Suppasri et al., 2016b; Latcharote et al., 2018). As a result, no losses appear within the port, even though this area experiences high inundation and economic exposure. This also reflects a limitation of the modelling framework, which parameterised vegetation effects through surface roughness coefficients rather than explicitly modelling stem-scale drag or dynamic deformation, and therefore provides a generalised rather than process-resolved representation of hybrid performance. Defence 1 therefore represents an important complementary layer within a wider system but not a substitute for continuous, engineered protection.
When considering economic loss, the difference between All Building and Key Building impacts reveals further nuances in performance. In both Kesennuma and Karakuwa, the two stronger configurations not only reduced total losses but also provided proportionally greater protection to key buildings, such as schools, hospitals, and civic facilities, whose replacement value and social importance are high. The majority of key buildings are located within Kesennuma's central urban area, near the port and river mouths, where continuous engineered defences play a major role in limiting direct damage. Across all SLR conditions, losses for key buildings increased more gradually than total losses, particularly under Defence 2 and Defence 3, which showed nearly identical performance. This pattern indicates that well-connected, structurally reinforced systems are most effective in safeguarding essential facilities located in the lower-lying urban zones. Comparable results have been reported in previous post-tsunami evaluations, where consistent defence lines around civic clusters reduced infrastructure losses even when residential zones remained partially flooded (Suppasri et al., 2013; Muhari et al., 2018). However, the economic loss model used here assumes uniform building replacement costs and simplified structural typologies, which means variations in construction materials, floor area, or building height were not represented. This simplification limits absolute accuracy but is sufficient to capture relative differences in performance.
Across both study sites, the updated fatality results confirm that SLR acts primarily as a background amplifier rather than a determinant of relative performance (Koyano et al., 2022; Church et al., 2013; Suppasri et al., 2013). The ranking of the three systems remains stable under all scenarios, with Defence 2 and Defence 3 maintaining comparable protection and Defence 1 showing only slight performance decline under late-century, high-emission conditions. In Karakuwa, the influence of topography further constrained SLR-driven change, reinforcing that site-specific elevation and exposure characteristics can moderate hazard escalation (Mori et al., 2011; Shibayama et al., 2022). This behaviour aligns with previous observations that small increases in water level can alter tsunami severity through interactions with coastal topography and defence continuity (Mori et al., 2011; Koshimura et al., 2009a; Koyano et al., 2022; Church et al., 2013). Reduction in fatalities compared to the no-defence baseline is relatively small as fatality estimation is population-weighted. Defences 2 and 3 achieve their largest decrease in inundation extent in the port district and industrial areas, where resident population is minimal, in contrast to the substantial fall in economic loss achieved in the same areas. Fatality ratios are inherently a function of the population present within an area, and residential fatalities during the 2011 GEJE were concentrated within populated inland areas rather than commercial or industrial zones, consistent with the small change observed here (Latcharote et al., 2018; Suppasri et al., 2016b). This suggests that physical defences alone provide a less direct route to improving life safety than to reducing economic loss, consistent with evidence that hard structural measures are less effective at reducing loss of life than at reducing physical damage (Takabatake et al., 2020). This study cannot therefore determine whether closing this gap would be better achieved through further structural investment or through non-structural measures such as evacuation planning and early warning, since the fatality model used here does not capture evacuation, warning status, or behavioural factors known to significantly influence real-world outcomes (Suppasri et al., 2016b; Latcharote et al., 2018).
Nevertheless, SLR increased spatial flood connectivity, especially in low-lying areas of Karakuwa, which led to compounded exposure when flood compartments merged. Because simulations were deterministic, stochastic variability and uncertainty in tsunami generation, source rupture, and local hydrodynamics were not captured. In particular, larger magnitude megathrust sources considered in PTHA could produce tsunamis with longer wavelengths and greater offshore amplitudes than those modelled here, which could produce greater flow depths and longer overtopping durations, potentially overwhelming defences that perform effectively under the scenarios modelled here (Grezio et al., 2017). Differences in focal mechanism could additionally alter the directivity of tsunami energy and the relative exposure of Kesennuma's ria coastline, potentially affecting the relative performance of the defence configurations in ways not captured by the three scenarios modelled here (Grezio et al., 2017; Behrens et al., 2021) Future applications should employ probabilistic frameworks that incorporate variable source parameters, sediment dynamics, overtopping, and compound flooding effects.
From a broader perspective, the results align with national and international evidence that continuity and integration of coastal defences, rather than extreme height or rigidity, determine overall system resilience. Koshimura et al. (2009a) and Suppasri et al. (2016a) similarly found that once overtopping was prevented along major urban frontages, further reinforcement produced diminishing returns. In this study, Defence 2 achieved near-equivalent outcomes to Defence 3 while incorporating more open and visually integrated design principles, supporting arguments for design optimisation that balances technical performance with aesthetic and social considerations. The practical implication is that defences prioritising openness and spatial integration can maintain effective protection and enhance public acceptance, consistent with post-disaster recovery principles in Japan (Shibayama et al., 2022; Aoki, 2018). Equally, the consistent under-performance of the eco-hybrid Defence 1 reinforces the challenge of translating environmental and social priorities into structural effectiveness. While its vegetated berms and bioswales enhance ecological and visual quality, their lower resistance allows broader shallow flooding, which, although less destructive per building, increases cumulative exposure. This pattern echoes results from hybrid-coast experiments in Japan and Southeast Asia, where partial overtopping and channelisation through vegetation belts limited the protective benefit under large-magnitude forcing (Takabatake et al., 2020; Omori et al., 2019). The results therefore highlight the need to integrate soft measures as secondary buffers within layered systems rather than as stand-alone defences.
These results emphasise that HCD-based tsunami protection does not require a compromise in technical performance. Defence 2 demonstrates that transparent, spatially integrated designs can achieve protection levels comparable to traditional reinforced systems while preserving visual openness and community access, two priorities repeatedly identified in Kesennuma's civic feedback and recovery plans (Leggett et al., 2025; Kesennuma City, 2011). The approach aligns with broader transitions in Japan's DRR policy, which increasingly favours co-existence with water and community-driven design over purely structural isolation (MLIT, 2015). For cities like Kesennuma, where public sentiment remains divided over the sense of safety and spatial separation imposed by high seawalls, the results offer practical evidence that a balanced, participatory design ethos can deliver comparable resilience with greater social legitimacy. Ultimately, while the comparative outcomes are robust, the conceptual and deterministic nature of the modelling framework means results should be interpreted as indicative rather than predictive. The conceptual configurations modelled here are also well suited to physical laboratory testing. Flume or wave tank experiments would allow the hydraulic performance simulated in this study to be validated empirically and would help refine material specifications and characterise structural behaviour, overtopping, and scour under controlled wave conditions, particularly for the vegetated and hybrid elements of Defence 1 whose drag and deformation were represented only through surface roughness here. Physical testing of comparable hybrid configurations has already shown reductions in overtopping and scour for embankment-vegetation systems, and improved structural resilience for reinforced mound breakwaters under tsunami overflow, supporting the feasibility of this kind of empirical validation for the defences proposed here (Zaha et al., 2019; Sajan et al., 2025). More in-depth research should also be conducted to extend this framework using probabilistic modelling, and cross-hazard analysis to better capture uncertainty and long-term system evolution.
This study evaluated three alternative tsunami defence configurations in Kesennuma using hydrodynamic modelling under multiple SLR scenarios. A consistent performance hierarchy was observed across all metrics: Defence 3 provided the highest containment through large-scale reinforced structures; Defence 2 achieved comparable results, typically within 10 %–15 % of Defence 3, while maintaining openness and visual integration; and Defence 1, although aligned with ecological and social goals, offered lower protection but valuable complementary benefits. SLR acted primarily as an amplifier rather than a determinant of performance ranking, highlighting that defence configuration and continuity exert stronger influence than structural height alone. These findings demonstrate that open, HCD based systems can provide robust protection while supporting civic and environmental integration. Future work should incorporate probabilistic modelling and cross-hazard analysis, including storm surges and long-term morphological change. Alternative materials such as glass or hybrid seawalls show potential to enhance transparency and public trust but require empirical validation through physical laboratory testing. Proposed designs should also be presented to residents to assess social acceptability and refine HCD integration. By showing that HCD principles can deliver near-equivalent engineering performance to conventional systems, this study reinforces the need for policy and design approaches that integrate social, environmental, and structural priorities to achieve resilient, community-centred coastal protection.
The TUNAMI-N2 model implementation used in this study is based on the publicly documented numerical framework of Imamura (1996) and Imamura et al. (2006). The model source code is distributed by the International Research Institute of Disaster Science (IRIDeS), Tohoku University, and can be obtained upon request from the developers. All pre-processing and post-processing scripts used to generate nested grids, reclassify land-cover data, rasterise building footprints, and compute inundation, fatality, and economic loss metrics were written in Python and MATLAB. These scripts rely on standard open-source libraries (NumPy, SciPy, GDAL, rasterio, geopandas, and MATLAB Mapping Toolbox). Due to containing location-specific input files and IRIDeS-distributed components, the scripts cannot be made fully public but are available from the corresponding author upon reasonable request.
The bathymetry and topography used in this study were obtained from the high-resolution Sanriku coastal DEM developed by Sugawara et al. (2014), originating from the foundational compilation by Takahashi et al. (2000). Model domains, terrain data, and resulting DEMs are available from the corresponding author upon reasonable request due to licensing conditions attached to the original datasets. Tsunami source parameters for the Kuril and Japan Trench scenarios were taken from the Cabinet Office (2020) tsunami hazard assessment and are publicly accessible at: https://www.geospatial.jp/ckan/dataset/2-003 (last access: 3 October 2025). Parameters for the 2011 GEJE source were based on Satake et al. (2013). Sea-level rise projections were obtained using the NASA Sea Level Projection Tool (https://sealevel.nasa.gov/data_tools/17, last access: 10 December 2024). Land-cover data were sourced from the ESA WorldCover 2020 dataset, available through Google Earth Engine (https://developers.google.com/earth-engine/datasets/catalog/ESA_WorldCover_v100, last access: 5 July 2025). Building footprint data were obtained from OpenStreetMap (© OpenStreetMap contributors), with extracts generated using BBBike (https://extract.bbbike.org, last access: 5 July 2025) and processed using osmium2shape by Geofabrik (https://geofabrik.de, last access: 5 July 2025). Population mesh data were derived from official Japanese government statistics (1 km grid), publicly available through the Ministry of Internal Affairs and Communications. The TUNAMI-N2 numerical model used in this study follows the publicly documented framework of Imamura (1996) and Imamura et al. (2006). Model configuration files, custom land-cover reclassification layers, processed OSM building datasets, and all simulation outputs (inundation rasters, flow-depth grids, fatality grids, and economic loss layers) are available from the corresponding author upon reasonable request.
HL conceptualised the study and led the methodology, investigation, and visualisation, including performing the formal analysis, and prepared the original draft. MRP and MDA contributed to data curation, software, and visualisation, and reviewed and edited the manuscript. AS supervised the study and reviewed and edited the manuscript. FI supervised the study.
The contact author has declared that none of the authors has any competing interests.
Publisher's note: Copernicus Publications remains neutral with regard to jurisdictional claims made in the text, published maps, institutional affiliations, or any other geographical representation in this paper. The authors bear the ultimate responsibility for providing appropriate place names. Views expressed in the text are those of the authors and do not necessarily reflect the views of the publisher.
This work was supported by the 2024 Tohoku University-University College London Matching Fund and the FY2022 Inter-University Exchange Project Tohoku University.
This research has been supported by the JST SPRING (grant no. JPMJSP2114).
This paper was edited by Ira Didenkulova and reviewed by Ceren Ozer Sozdinler and one anonymous referee.
Aoki, N.: Sequencing and combining participation in urban planning: the case of tsunami-ravaged Onagawa Town, Japan, Cities, 72, 226–236, https://doi.org/10.1016/j.cities.2017.08.020, 2018.
Behrens, J., Løvholt, F., Jalayer, F., Lorito, S., Salgado-Gálvez, M. A., and Sørensen, M.: Probabilistic tsunami hazard and risk analysis: a review of research gaps, Front. Earth Sci., 9, 628772, https://doi.org/10.3389/feart.2021.628772, 2021.
Bell, S., MacDonald, D., and Taylor, T.: Establishing a statement of principles for community engagement with civil engineering, P. I. Civil Eng.-Eng. Su., 175, 77–88, 2022.
Bricker, J. D., Gibson, S., Takagi, H., and Imamura, F.: On the need for larger Manning's roughness coefficients in depth-integrated tsunami inundation models, Coast. Eng. J., 57, 1550005, https://doi.org/10.1142/S0578563415500059, 2015.
Cabinet Office: Damage estimation of the Nankai Trough earthquake (economic damage), Government of Japan, Tokyo, https://www.bousai.go.jp/jishin/nankai/taisaku_wg/pdf/3_sanko.pdf (last access: 3 October 2026), 2019 (in Japanese).
Cabinet Office, Government of Japan: Japan Trench/Kuril Trench mega-earthquake model dataset, G-Spatial Information Center [data set], https://www.geospatial.jp/ckan/organization/naikakufu-05 (last access: 3 October 2026), 2020.
Charlesworth, E. and Fien, J.: Design and disaster resilience: toward a role for design in disaster mitigation and recovery, Architecture, 2, 292–306, https://doi.org/10.3390/architecture2020017, 2022.
Chow, V. T.: Open Channel Hydraulics, McGraw-Hill, New York, NY, ISBN 978-0-07-010776-2, 1959.
Chua, C. T., Otake, T., Li, T., Cheng, A. C., Qiu, Q., Li, L., Suppasri, A., Imamura, F., and Switzer, A. D.: An approach to assessing tsunami risk to the global port network under rising sea levels, npj Nat. Hazards, 1, 38, https://doi.org/10.1038/s44304-024-00039-2, 2024.
Church, J. A., Clark, P. U., Cazenave, A., Gregory, J. M., Jevrejeva, S., Levermann, A., Merrifield, M. A., Milne, G. A., Nerem, R. S., Nunn, P. D., Payne, A. J., Pfeffer, W. T., Stammer, D., and Unnikrishnan, A. S.: Sea level change, in: Climate Change 2013: The Physical Science Basis. Contribution of Working Group I to the Fifth Assessment Report of the Intergovernmental Panel on Climate Change, edited by: Stocker, T. F., Qin, D., Plattner, G.-K., Tignor, M., Allen, S. K., Boschung, J., Nauels, A., Xia, Y., Bex, V., and Midgley, P. M., Cambridge University Press, Cambridge, UK and New York, NY, USA, 1137–1216, https://doi.org/10.1017/CBO9781107415324.026, 2013.
Dao, M. H. and Tkalich, P.: Tsunami propagation modelling – a sensitivity study, Nat. Hazards Earth Syst. Sci., 7, 741–754, https://doi.org/10.5194/nhess-7-741-2007, 2007.
Davies, G., Griffin, J., Løvholt, F., Glimsdal, S., Harbitz, C., Thio, H. K., Lorito, S., Basili, R., Selva, J., Geist, E., and Baptista, M. A.: A global probabilistic tsunami hazard assessment from earthquake sources, Geol. Soc. London Spec. Publ., 456, 219–244, https://doi.org/10.1144/SP456.5, 2018.
Dura, T., Garner, A. J., Weiss, R., Kopp, R. E., Engelhart, S. E., Witter, R. C., Briggs, R. W., Mueller, C. S., Nelson, A. R., and Horton, B. P.: Changing impacts of Alaska-Aleutian subduction zone tsunamis in California under future sea-level rise, Nat. Commun., 12, 7119, https://doi.org/10.1038/s41467-021-27445-8, 2021.
Engineering ToolBox: Manning's Roughness Coefficients for Open Channel Flow, https://www.engineeringtoolbox.com/mannings-roughness-d_799.html (last access: 3 October 2026), 2004.
Federal Emergency Management Agency (FEMA): Guidelines and specifications for flood hazard mapping partners, FEMA, Washington, DC, https://www.fema.gov/flood-maps/guidance-reports/guidelines-standards/archive (last access: 3 October 2026), 2007.
Federal Emergency Management Agency (FEMA): Hazus-MH 2.2, Multi-hazard Loss Estimation Methodology, FEMA [software], Washington, DC, https://www.fema.gov/flood-maps/products-tools/hazus (last access: 3 October 2026), 2015.
Fuji, K., Suppasri, A., Kwanchai, P., Lahcene, E., and Imamura, F.: Assessing future tsunami hazards from Japan Trench coupling with sea level rise impact on economic risks using an input–output table, Int. J. Disast. Risk Re., 104, 104286, https://doi.org/10.1016/j.ijdrr.2024.104286, 2024.
Giacomin, J.: What is human centred design?, Des. J., 17, 606–623, https://doi.org/10.2752/175630614X14056185480186, 2014.
Goto, C. and Ogawa, Y.: Numerical method of tsunami simulation with the leap-frog scheme, Part 2, in: IUGG/IOC TIME Project, IOC Manuals and Guides No. 35, UNESCO, Paris, http://www.jodc.go.jp/info/ioc_doc/Manual/122367eb.pdf (last access: 3 October 2026), 1997.
Goto, C., Ogawa, Y., Shuto, N., and Imamura, F.: Numerical method of tsunami simulation with the leap-frog scheme, IUGG/IOC TIME Project, IOC Manuals and Guides No. 35, UNESCO, Paris, 1–126, http://www.jodc.go.jp/info/ioc_doc/Manual/122367eb.pdf (last access: 3 October 2026), 1997.
Grezio, A., Babeyko, A., Baptista, M. A., Behrens, J., Costa, A., Davies, G., Geist, E. L., Glimsdal, S., González, F. I., Griffin, J., and Harbitz, C. B.: Probabilistic tsunami hazard analysis: multiple sources and global applications, Rev. Geophys., 55, 1158–1198, https://doi.org/10.1002/2017RG000579, 2017.
Hatamura, Y., Abe, S., Fuchigami, M., Kasahara, N., and Iino, K.: The 2011 Fukushima Nuclear Power Plant Accident: How and Why It Happened, Woodhead Publishing, Cambridge, ISBN 978-0-08-100118-9, 2014.
Imakawa, S.: Tsunami-stricken town resists “Great Wall” mentality: Kesennuma's quest for a middle way, Nippon.com, https://www.nippon.com/en/in-depth/d00684/ (last access: 8 October 2026), 2021.
Imamura, F.: Review of tsunami simulation with a finite difference method, in: Long-Wave Runup Models, 25–42, ISBN 981-02-2909-7, 1996.
Imamura, F. and Imteaz, M. M. A.: Long waves in two-layers: governing equations and numerical model, Sci. Tsunami Hazards, 13, 3–24, http://tsunamisociety.org/TitlesAuthors.html (last access: 3 October 2026), 1995.
Imamura, F., Yalciner, A. C., and Ozyurt, G.: Tsunami modelling manual (TUNAMI model), UNESCO IOC International Training Course on Tsunami Numerical Modelling, 137–209, https://www.tsunami.irides.tohoku.ac.jp/media/files/_u/project/manual-ver-3_1.pdf (last access: 3 October 2026), 2006.
Ishiguro, A. and Yano, E.: Tsunami inundation after the Great East Japan Earthquake and mortality of affected communities, Public Health, 129, 1390–1397, https://doi.org/10.1016/j.puhe.2015.08.003, 2015.
Kesennuma City: Kesennuma City Earthquake-Reconstruction Plan, Kesennuma City, Kesennuma, https://www.kesennuma.miyagi.jp/sec/s019/010/050/010/1389054300072.html (last access: 3 October 2026), 2011 (in Japanese).
Koshimura, S. and Shuto, N.: Response to the 2011 Great East Japan Earthquake and tsunami disaster, Philos. T. Roy. Soc. A, 373, 20140373, https://doi.org/10.1098/rsta.2014.0373, 2015.
Koshimura, S., Namegaya, Y., and Yanagisawa, H.: Tsunami fragility: a new measure to identify tsunami damage, J. Disaster Res., 4, 479–488, https://doi.org/10.20965/jdr.2009.p0479, 2009a.
Koshimura, S., Oie, T., Yanagisawa, H., and Imamura, F.: Developing fragility functions for tsunami damage estimation using numerical model and post-tsunami data from Banda Aceh, Indonesia, Coast. Eng. J., 51, 243–273, https://doi.org/10.1142/S0578563409002004, 2009b.
Koyano, K., Takabatake, T., Esteban, M., and Shibayama, T.: Magnification of tsunami risks due to sea level rise along the eastern coastline of Japan, J. Coast. Hydraul. Struct., 2, https://doi.org/10.48438/jchs.2022.0012, 2022.
Latcharote, P., Leelawat, N., Suppasri, A., Thamarux, P., and Imamura, F.: Estimation of fatality ratios and investigation of influential factors in the 2011 Great East Japan Tsunami, Int. J. Disast. Risk Re., 29, 37–54, https://doi.org/10.1016/j.ijdrr.2017.06.024, 2018.
Lay, T., Ammon, C. J., Kanamori, H., Koper, K. D., Hutko, A. R., Ye, L., Yue, H., and Rushing, T. M.: The great Sumatra–Andaman earthquake of 26 December 2004, Science, 308, 1127–1133, https://doi.org/10.1126/science.1112250, 2005.
Leggett, H., Kitamura, M., Suppasri, A., Imamura, F., and Rossetto, T.: Understanding community attitudes and responses to tsunami mitigation infrastructure and DRR methods in Kesennuma, Japan, Int. J. Disast. Risk Re., 105870, https://doi.org/10.1016/j.ijdrr.2025.105870, 2025.
Li, L., Switzer, A. D., Wang, Y., Chan, C.-H., Qiu, Q., and Weiss, R.: A modest 0.5 m rise in sea level will double the tsunami hazard in Macau, Sci. Adv., 4, eaat1180, https://doi.org/10.1126/sciadv.aat1180, 2018.
Liu, P. L.-F., Yeh, H., and Synolakis, C. (Eds.): Advanced Numerical Models for Simulating Tsunami Waves and Runup, Advances in Coastal and Ocean Engineering, Vol. 10, World Scientific, Singapore, https://doi.org/10.1142/6226, 2008.
Ministry of Land, Infrastructure, Transport and Tourism (MLIT): Guidelines for tsunami-resistant design of breakwaters, MLIT, Tokyo, https://www.mlit.go.jp/common/001012142.pdf (last access: 3 October 2026), 2013a (in Japanese).
Ministry of Land, Infrastructure, Transport and Tourism (MLIT): Guidelines for tsunami disaster prevention town planning, MLIT, Tokyo, https://www.mlit.go.jp/common/001000488.pdf (last access: 3 October 2026), 2013b (in Japanese).
Ministry of Land, Infrastructure, Transport and Tourism (MLIT): National Resilience Action Plan 2015, Government of Japan, Tokyo, https://www.cas.go.jp/jp/seisaku/kokudo_kyoujinka/kihon.html (last access: 3 October 2026), 2015 (in Japanese).
Ministry of Land, Infrastructure, Transport and Tourism (MLIT): Flood statistics survey manual, MLIT, Tokyo, https://www.mlit.go.jp/river/toukei_chousa/kasen/suigaitoukei/shiryou.html (last access: 3 October 2026), 2023 (in Japanese).
Mori, N., Takahashi, T., Yasuda, T., and Yanagisawa, H.: Survey of the 2011 Tohoku earthquake tsunami inundation and run-up, Geophys. Res. Lett., 38, L00G14, https://doi.org/10.1029/2011GL049210, 2011.
Muhari, A., Imamura, F., Arikawa, T., Hakim, A. R., and Afriyanto, B.: Solving the puzzle of the September 2018 Palu, Indonesia, tsunami mystery, J. Disaster Res., 13, 1058–1070, https://doi.org/10.20965/jdr.2018.sc20181108, 2018.
NASA Sea Level Change Team: IPCC AR6 sea level projection tool, NASA Sea Level Portal, https://sealevel.nasa.gov/ipcc-ar6-sea-level-projection-tool (last access: 3 October 2026), 2021.
Nateghi, R., Bricker, J. D., Guikema, S. D., and Bessho, A.: Statistical analysis of the effectiveness of seawalls and coastal forests in mitigating tsunami impacts in Iwate and Miyagi prefectures, PLoS ONE, 11, e0158375, https://doi.org/10.1371/journal.pone.0158375, 2016.
Oetjen, J., Sundar, V., Venkatachalam, S., Reicherter, K., Engel, M., Schüttrumpf, H., and Sannasiraj, S. A.: A comprehensive review on structural tsunami countermeasures, Nat. Hazards, 113, 1419–1449, https://doi.org/10.1007/s11069-022-05367-y, 2022.
Oishi, Y., Imamura, F., and Sugawara, D.: Near-field tsunami inundation forecast using the parallel TUNAMI-N2 model: application to the 2011 Tohoku-Oki earthquake combined with source inversions, Geophys. Res. Lett., 42, 1083–1091, https://doi.org/10.1002/2014GL062577, 2015.
Okada, Y.: Surface deformation due to shear and tensile faults in a half-space, B. Seismol. Soc. Am., 75, 1135–1154, 1985.
Omori, R., Kurosawa, K., and Saito, Y.: Social learning in community-based disaster risk reduction: case studies from Kesennuma, Japan, Int. J. Disast. Risk Re., 36, 101100, https://doi.org/10.1016/j.ijdrr.2019.101100, 2019.
OpenStreetMap Contributors: Kesennuma building footprint extract, https://www.bbbike.org (last access: 5 July 2025), 2025.
Otsuyama, K. and Shaw, R.: Exploratory case study for neighborhood participation in recovery process, Prog. Disaster Sci., 9, 100141, https://doi.org/10.1016/j.pdisas.2021.100141, 2021.
Sajan, M. K., Chaudhary, B., Akarsh, P. K., and Sah, B.: Investigations on the development of hybrid mound breakwaters for tsunami defense, Appl. Ocean Res., 156, 104489, https://doi.org/10.1016/j.apor.2025.104489, 2025.
Satake, K.: Geological and historical evidence of irregular recurrent earthquakes and tsunamis at the Japan Trench, Philos. T. Roy. Soc. A, 373, 20140375, https://doi.org/10.1098/rsta.2014.0375, 2015.
Satake, K., Fujii, Y., Harada, T., and Namegaya, Y.: Time and space distribution of coseismic slip of the 2011 Tōhoku Earthquake inferred from tsunami waveform data, B. Seismol. Soc. Am., 103, 1473–1492, https://doi.org/10.1785/0120120122, 2013.
Sepúlveda, I., Haase, J. S., Liu, P. L.-F., Grigoriu, M., and Winckler, P.: Non-stationary probabilistic tsunami hazard assessments incorporating climate-change-driven sea level rise, Earths Future, 9, e2021EF002007, https://doi.org/10.1029/2021EF002007, 2021.
Shibayama, T., Esteban, M., Nistor, I., Takagi, H., Thao, N. D., Matsumaru, R., Mikami, T., Aranguiz, R., Jayaratne, R., and Ohira, K.: Classification of tsunami and evacuation areas, Nat. Hazards, 67, 365–386, https://doi.org/10.1007/s11069-013-0567-4, 2013.
Shigihara, Y., Imai, K., Iwase, H., Kawasaki, K., Nemoto, M., Baba, T., Chikasada, N. Y., Chida, Y., and Arikawa, T.: Variation analysis of multiple tsunami inundation models, Coast. Eng. J., 64, 344–371, https://doi.org/10.1080/21664250.2021.1991730, 2022.
Shuto, N. and Fujima, K.: A short history of tsunami research and countermeasures in Japan, P. Jpn. Acad. B-Phys., 85, 267–275, https://doi.org/10.2183/pjab.85.267, 2009.
Strusińska-Correia, A.: Tsunami mitigation in Japan after the 2011 Tōhoku tsunami, Int. J. Disast. Risk Re., 22, 397–411, https://doi.org/10.1016/j.ijdrr.2017.02.001, 2017.
Sugawara, D. and Goto, K.: Numerical modeling of the 2011 Tohoku-oki tsunami in the offshore and onshore of Sendai Plain, Japan, Sediment. Geol., 282, 110–123, https://doi.org/10.1016/j.sedgeo.2012.09.002, 2012.
Sugawara, D., Takahashi, T., and Imamura, F.: Sediment transport due to the 2011 Tohoku-oki tsunami at Sendai, Mar. Geol., 358, 18–37, https://doi.org/10.1016/j.margeo.2014.09.002, 2014.
Suppasri, A., Shuto, N., Imamura, F., Koshimura, S., Mas, E., and Yalciner, A. C.: Lessons learned from the 2011 Great East Japan tsunami, Pure Appl. Geophys., 170, 993–1018, https://doi.org/10.1007/s00024-012-0511-7, 2013.
Suppasri, A., Latcharote, P., Bricker, J. D., Leelawat, N., Hayashi, A., Yamashita, K., Makinoshima, F., Roeber, V., and Imamura, F.: Improvement of tsunami countermeasures based on lessons from the 2011 Great East Japan Earthquake and tsunami, Coast. Eng. J., 58, 1640011, https://doi.org/10.1142/S0578563416400118, 2016a.
Suppasri, A., Hasegawa, N., Makinoshima, F., Imamura, F., Latcharote, P., and Day, S.: An analysis of fatality ratios and the factors that affected human fatalities in the 2011 Great East Japan tsunami, Front. Built Environ., 2, 32, https://doi.org/10.3389/fbuil.2016.00032, 2016b.
Takabatake, T., Esteban, M., Nistor, I., Shibayama, T., and Nishizaki, S.: Effectiveness of hard and soft tsunami countermeasures on loss of life under different population scenarios, Int. J. Disast. Risk Re., 45, 101491, https://doi.org/10.1016/j.ijdrr.2020.101491, 2020.
Takahashi, T., Shuto, N., Imamura, F., and Asai, D.: Modeling sediment transport due to tsunamis with exchange rate between bed load layer and suspended load layer, in: Proceedings of the 27th International Conference on Coastal Engineering, Sydney, Australia, 1508–1519, https://doi.org/10.1061/40549(276)117, 2000.
Tanikawa, H., Sugimoto, K., Okuoka, K., and Akiyama, Y.: Estimation of lost building stock due to the 2016 Kumamoto earthquakes, J. Jpn. Soc. Civ. Eng. Ser. G, 73, II_293–II_300, https://doi.org/10.2208/jscejer.73.II_293, 2017.
Tashiro, A. and Sakisaka, K.: Model analysis of residents' consciousness regarding seawall construction, Chiikigaku Kenkyu, 45, 419–433, 2015.
Tsimopoulou, V., Jonkman, S. N., Kolen, B., Maaskant, B., Mori, N., and Yasuda, T.: A multi-layered safety perspective on the tsunami disaster in Tohoku, Japan, in: Proceedings of the Flood Risk 2012 Conference, Rotterdam, the Netherlands, 981–990, ISBN 978-0-415-62144-1, 2013.
Ueda, Y. and Shaw, R.: Community recovery in tsunami-affected area: lessons from Minami-Kesennuma, in: Tohoku Recovery, Springer Japan, Tokyo, 131–146, https://doi.org/10.1007/978-4-431-55136-2_10, 2014.
United Nations Office for Disaster Risk Reduction: Global Assessment Report on Disaster Risk Reduction 2022, UNDRR, Geneva, ISBN 978-92-1-232028-1, 2022.
USACE: HEC-RAS River Analysis System User's Manual, Version 5.0.7, Report CPD-68, Hydrologic Engineering Center, Davis, CA, https://www.hec.usace.army.mil/software/hec-ras/download.aspx (last access: 3 October 2026), 2020.
Welsh, R., Williams, S., Bosserelle, C., Paulik, R., Chan Ting, J., Wild, A., and Talia, L.: Sea-level rise effects on changing hazard exposure to far-field tsunamis, J. Mar. Sci. Eng., 11, 945, https://doi.org/10.3390/jmse11050945, 2023.
Wolff, E.: The promise of a people-centred approach to floods, Prog. Disaster Sci., 10, 100171, https://doi.org/10.1016/j.pdisas.2021.100171, 2021.
Yanagisawa, H., Koshimura, S., Goto, K., Miyagi, T., Imamura, F., Ruangrassamee, A., and Tanavud, C.: Reduction effects of mangrove forest on a tsunami, Estuar. Coast. Shelf S., 81, 27–37, https://doi.org/10.1016/j.ecss.2008.10.020, 2009.
Yun, N. Y. and Hamada, M.: Evacuation behavior and fatality rate during the 2011 Tohoku-Oki earthquake and tsunami, Earthq. Spectra, 31, 1237–1265, https://doi.org/10.1193/082013EQS234M, 2015.
Zaha, T., Tanaka, N., and Kimiwada, Y.: Flume experiments on optimal arrangement of hybrid defense system comprising an embankment, moat, and emergent vegetation to mitigate inundating tsunami current, Ocean Eng., 173, 45–57, https://doi.org/10.1016/j.oceaneng.2018.12.054, 2019.
Zanaga, D., Van De Kerchove, R., De Keersmaecker, W., Souverijns, N., Brockmann, C., Quast, R., Wevers, J., Grosu, A., Paccini, A., Vergnaud, S., Cartus, O., Santoro, M., Fritz, S., Georgieva, I., Lesiv, M., Carter, S., Herold, M., Li, L., Tsendbazar, N. E., Ramoino, F., and Arino, O.: ESA WorldCover 10 m 2020 v100, Zenodo, https://doi.org/10.5281/zenodo.5571936, 2021.