
the Creative Commons Attribution 4.0 License.
the Creative Commons Attribution 4.0 License.
 | 06 Oct 2026
Forecasting European temperature-related mortality in Summer 2024: data-driven vs. physics-based forecast approaches

Leonardo Olivetti
Heat has emerged as a major public health concern. Over 62 000 heat-related deaths were estimated to have occurred during the European summer of 2024, exemplifying the pressing need to develop effective early warning systems. Such systems depend critically on the quality of the underlying forecasts, and recent work has focused on developing impact-based forecasts for heat-related mortality, which provide impact-oriented information. To date, heat-related mortality forecasts have been based on the output of numerical weather prediction models, or physics-based forecasts. The field of weather forecasting is undergoing a rapid transformation with the advent of skillful data-driven forecasts. This case study compares European temperature-related mortality forecasts for summer 2024 based on physics-based weather forecasts with those based on data-driven weather forecasts. Our results highlight that both the physics-based and data-driven forecasts systematically underestimate temperature-related mortality, more pronouncedly so in the latter. Both types of forecasts appear sensitive to forecast errors at hot temperatures, due to the non-linear relationship between temperature and mortality. Nevertheless, temperature-related mortality forecasts based on data-driven weather forecasts appear to be a promising alternative to traditional physics-based weather forecasts, and targeted improvement of the representation of hot temperatures through bias correction or adjustment of the loss function to give greater weighting to hot temperatures could be beneficial for temperature-related mortality forecasting. We suggest the application of this approach to both data-driven and physics-based forecast ensembles as an important next step in the continued development of informative, impact-oriented forecasts.
- Article
(5060 KB) - Full-text XML
- BibTeX
- EndNote


Heat has been highlighted as a major public health issue. Over 62 000 heat-related deaths were estimated to have occurred in Europe during the summer of 2024 (Janoš et al., 2025), which follows similarly high death tolls in the previous two summers (Ballester et al., 2023; Gallo et al., 2024). There is an urgent need to help society adapt to our warming climate, and to mitigate the burden of preventable heat-related fatalities (Jay et al., 2021; Vanos et al., 2023). Effective early-warning systems are a key element in this process; these systems depend on reliable and informative underlying forecasts. Traditionally, heat warning systems were based on hazard-focused forecasts (Martínez-Solanas et al., 2019). Recent work has argued for moving towards an impact-focused perspective, which is able to provide richer information to decision makers (Merz et al., 2020).
Impact-based forecasts typically depend on accurate and reliable hazard forecasts. Currently, two main frameworks exist for generating weather forecasts. Physics-based forecasts refer to weather forecasts issued from numerical weather prediction models. These models develop predictions by solving numerical equations representing the physics of the atmosphere, as well as other components of our earth system such as oceans, and have been the core framework for producing weather predictions for the past decades. Data-driven forecasts refer to weather forecasts where techniques from the field of statistics and artificial intelligence have been used to train weather models based on large amounts of historical weather data, typically in the form of reanalysis datasets such as ERA5. The rapid development of data-driven weather models contrasts the so called `quiet revolution' of traditional, physics-based numerical weather prediction (NWP) models (Bauer et al., 2015). In the last few years, data-driven approaches have achieved a level of improvement that took physics-based approaches decades to achieve (Rasp et al., 2024). Now, data driven approaches show competitiveness not only for general skill metrics, but also for extremes (Zhao et al., 2025; Olivetti and Messori, 2024b). Nevertheless, important challenges remain. Data-driven approaches still struggle to forecast extremes in some cases (Pasche et al., 2025; Zhang et al., 2026), and the loss functions typically used in deterministic training prioritise performance near the centre of the distribution rather than in its tails (Xu et al., 2024; Olivetti and Messori, 2024a). As a result, these models are prone to underestimating extremes due to the double-penalty problem. Furthermore, it remains an open question as to whether data-driven models can reliably predict events outside the domain of their training data, particularly those approaching or exceeding historical records (Sun et al., 2025).
These limitations are likely to be especially relevant for impact forecasting, as impacts are often non-linearly related to hazards, with extreme conditions producing disproportionately large consequences (Ebi et al., 2021; Robine et al., 2008). Holmberg et al. (2025) showed that this non-linear relationship is critically important for forecasts of heat-related mortality, which are particularly sensitive to errors in temperature forecasts at high temperatures. This means that weather forecasts with low average error may not necessarily translate to accurate and reliable impact forecasts. Instead, we posit that underlying weather forecasts that perform best for high temperatures would correspond to the lowest errors for heat-related mortality forecasts. Because of these reasons, it is currently not clear whether data driven approaches can outperform physics-based forecasts for impact forecasting.
Here we compare European temperature-related mortality forecasts based on data-driven weather forecasts with those based on traditional physics-based NWP model forecasts for the summer of 2024. This summer was chosen as a case study both because it represented the most recent forecasts available at the time the analysis was conducted, thereby the most recent forecast model versions, and because 2024 provides an illustrative example of a hot summer (Copernicus, 2024) with a high heat-related death toll (Janoš et al., 2025). In our warming climate, this is representative of conditions where health impacts based forecasts could ideally be used operationally to inform early warning systems and heat action plans. In essence, our aim is to use an epidemiological transformation for temperature-related mortality as an explicitly impact-oriented error metric.
The remainder of the study is structured as follows: Sect. 2 details the data and methods used in this study. The results of this study are presented in Sect. 3, and then discussed in Sect. 4. Finally, we summarise the main conclusions of this work in Sect. 5.
2.1 Meteorological data
This study uses 2 m temperature values from two types of meteorological datasets: ERA5 reanalysis data (Hersbach et al., 2020) (spatial resolution: 0.25 × 0.25°) and operational forecast data from the European Centre for Medium-range Weather Forecasts (ECMWF; spatial resolution: 0.25 × 0.25°). The reanalysis data was temporally averaged to daily resolution to correspond to the temporal resolution of the health data as in Masselot et al. (2023). For the forecasts data we used 12-hourly forecast initialisations and performed a daily average so as to correspond to daily average values as in Masselot et al. (2023). Our temporal domain spans the boreal summer of 2024 (1 June 2024–31 August 2024), and the spatial domain encompasses Europe. Specifically, this study focuses on a selection of 854 cities across 30 European countries further detailed in Sect. 2.2. The location of each of these cities was approximated by the closest grid point of the meteorological data. Here we consider reanalysis data to be our ground truth; in this case 2 m temperature from the ERA5 dataset (Hersbach et al., 2020). We also use 2 m temperature from archived forecasts from two different types of weather prediction models, one physical model (IFS HRES cycle 48r1), and one data driven model (AIFS single v1), which were the model versions available at the time this analysis was performed. These models are the flagship, state-of-the-art models developed ECWMF, and are widely considered some of the best weather forecasting models in the world. We consider lead times of 1, 3, 5, 7 and 10 d, and take forecast initialisations so that the forecasts correspond to the reanalysis data and are valid for the time period 1 June 2024–31 August 2024. In both cases we only consider a deterministic perspective, which is a limitation of this study.
2.2 Epidemiological framework
Temperature-related mortality is here calculated using an epidemiological framework to estimate the exposure-response relationship between temperature and all-cause mortality for a given location. This methodology relating lagged mortality effects to environmental variables was first developed by Ferreira Braga et al. (2001); Schwartz (2000), then subsequently expanded upon and popularised by Gasparrini et al. (2010, 2015). We use the fits for 854 European cities presented by Masselot et al. (2023). Figure A1 in the Appendix shows the location of these cities. This is based on a two-stage time series analysis which employs distributed lag non-linear models (DLNM) (Gasparrini et al., 2015). The exposure-response function is first estimated using a quasi-Poisson regression, which accounts for the over-dispersed nature of mortality data. The lagged effect due to temperature is taken into account by a cross-basis function, which allows for a high degree of flexibility to capture the complex dependence structure. These estimates are refined in a second stage by pooling the coefficients of the exposure-response functions in a repeated-measure multivariate meta-regression model (Masselot et al., 2023). This step accounts for the numerous, often correlated, factors affecting the differing vulnerability between cities. The risk of mortality is calculated based on the fitted regression model. The relative risk (RR) is then defined as the risk of mortality at a given temperature divided by the risk of mortality at the minimum mortality temperature (MMT):
where RR(t2 m) is the RR, R(t2 m(t)) is the risk of mortality, t2 m is the temperature, t denotes time and MMT denotes the MMT. Equation (1) is equivalent to the following:
where 𝔼(M(t2 m(t))) is the expected value of mortality at a given temperature, t2 m. The RR is related to the attributable fraction of mortality due to non-optimal temperatures (AF) as follows:
this quantity is a fraction and therefore unit-less. For further details on this methodology we refer the reader to Masselot et al. (2023).
2.3 Computation of temperature-related mortality forecasts
We compute AF forecasts by applying the epidemiological framework outlined in Sect. 2.2 to our weather forecasts and reanalysis data separately, following the methodology of Quijal-Zamorano et al. (2024). We compare the AF forecasts from the two forecasts models (IFS and AIFS), using the mean error and mean absolute error (MAE), calculated separately for each lead-time and location, as described in Holmberg et al. (2024); Persson and Grazzini (2007), respectively. The mean error (bias) is a standard metric for assessing systematic biases in forecasts and is defined as the difference between the forecast and a reference dataset (here ERA5):
where N is the total number of forecast initialisations (here N=92, and corresponds to once per day over boreal summer), xi is the ith realisation of the forecast, and yi is the corresponding ground truth value, in our case ERA5. This metric is applied as a means of assessing for the presence of systematic under- or over-estimation of temperature related mortality. In this study we consider only one year, and so consider the average over all days in the study. Additionally, we consider the bias of forecast quantiles with the help of quantile-quantile plots, as for instance in Bouallègue et al. (2024). The MAE is a standard metric for evaluating the performance of deterministic forecasts, and is defined as:
where again N is the total number of forecast initialisations, xi is the ith realisation of the forecast, and yi is the corresponding ground truth value. This metric complements the forecast bias as it is not vulnerable to the cancellation of errors. We quantify uncertainty using a bootstrapping approach from the bootstrap function from the stats module of the Python package SciPy (Virtanen et al., 2020) to estimate the 95 % confidence interval for the mean. We do not evaluate the uncertainty owing to the epidemiological fit as we are here focusing on the performance of the two different types of forecasts. The linear fits were performed using the “linregress” routine from the Python package Scipy (Virtanen et al., 2020).
We present our results in two parts: first we examine Rome as an illustrative case study, and then proceed to perform a skill assessment for Europe at continental scale. Italy reported the highest heat-related death toll for Europe in 2024 (Janoš et al., 2025), thus we have selected its capital as the location of our case study. The continental scale assessment was performed using population weighted averages for the variables concerned, where the population data was that provided together with the temperature-mortality associations by Masselot et al. (2023).
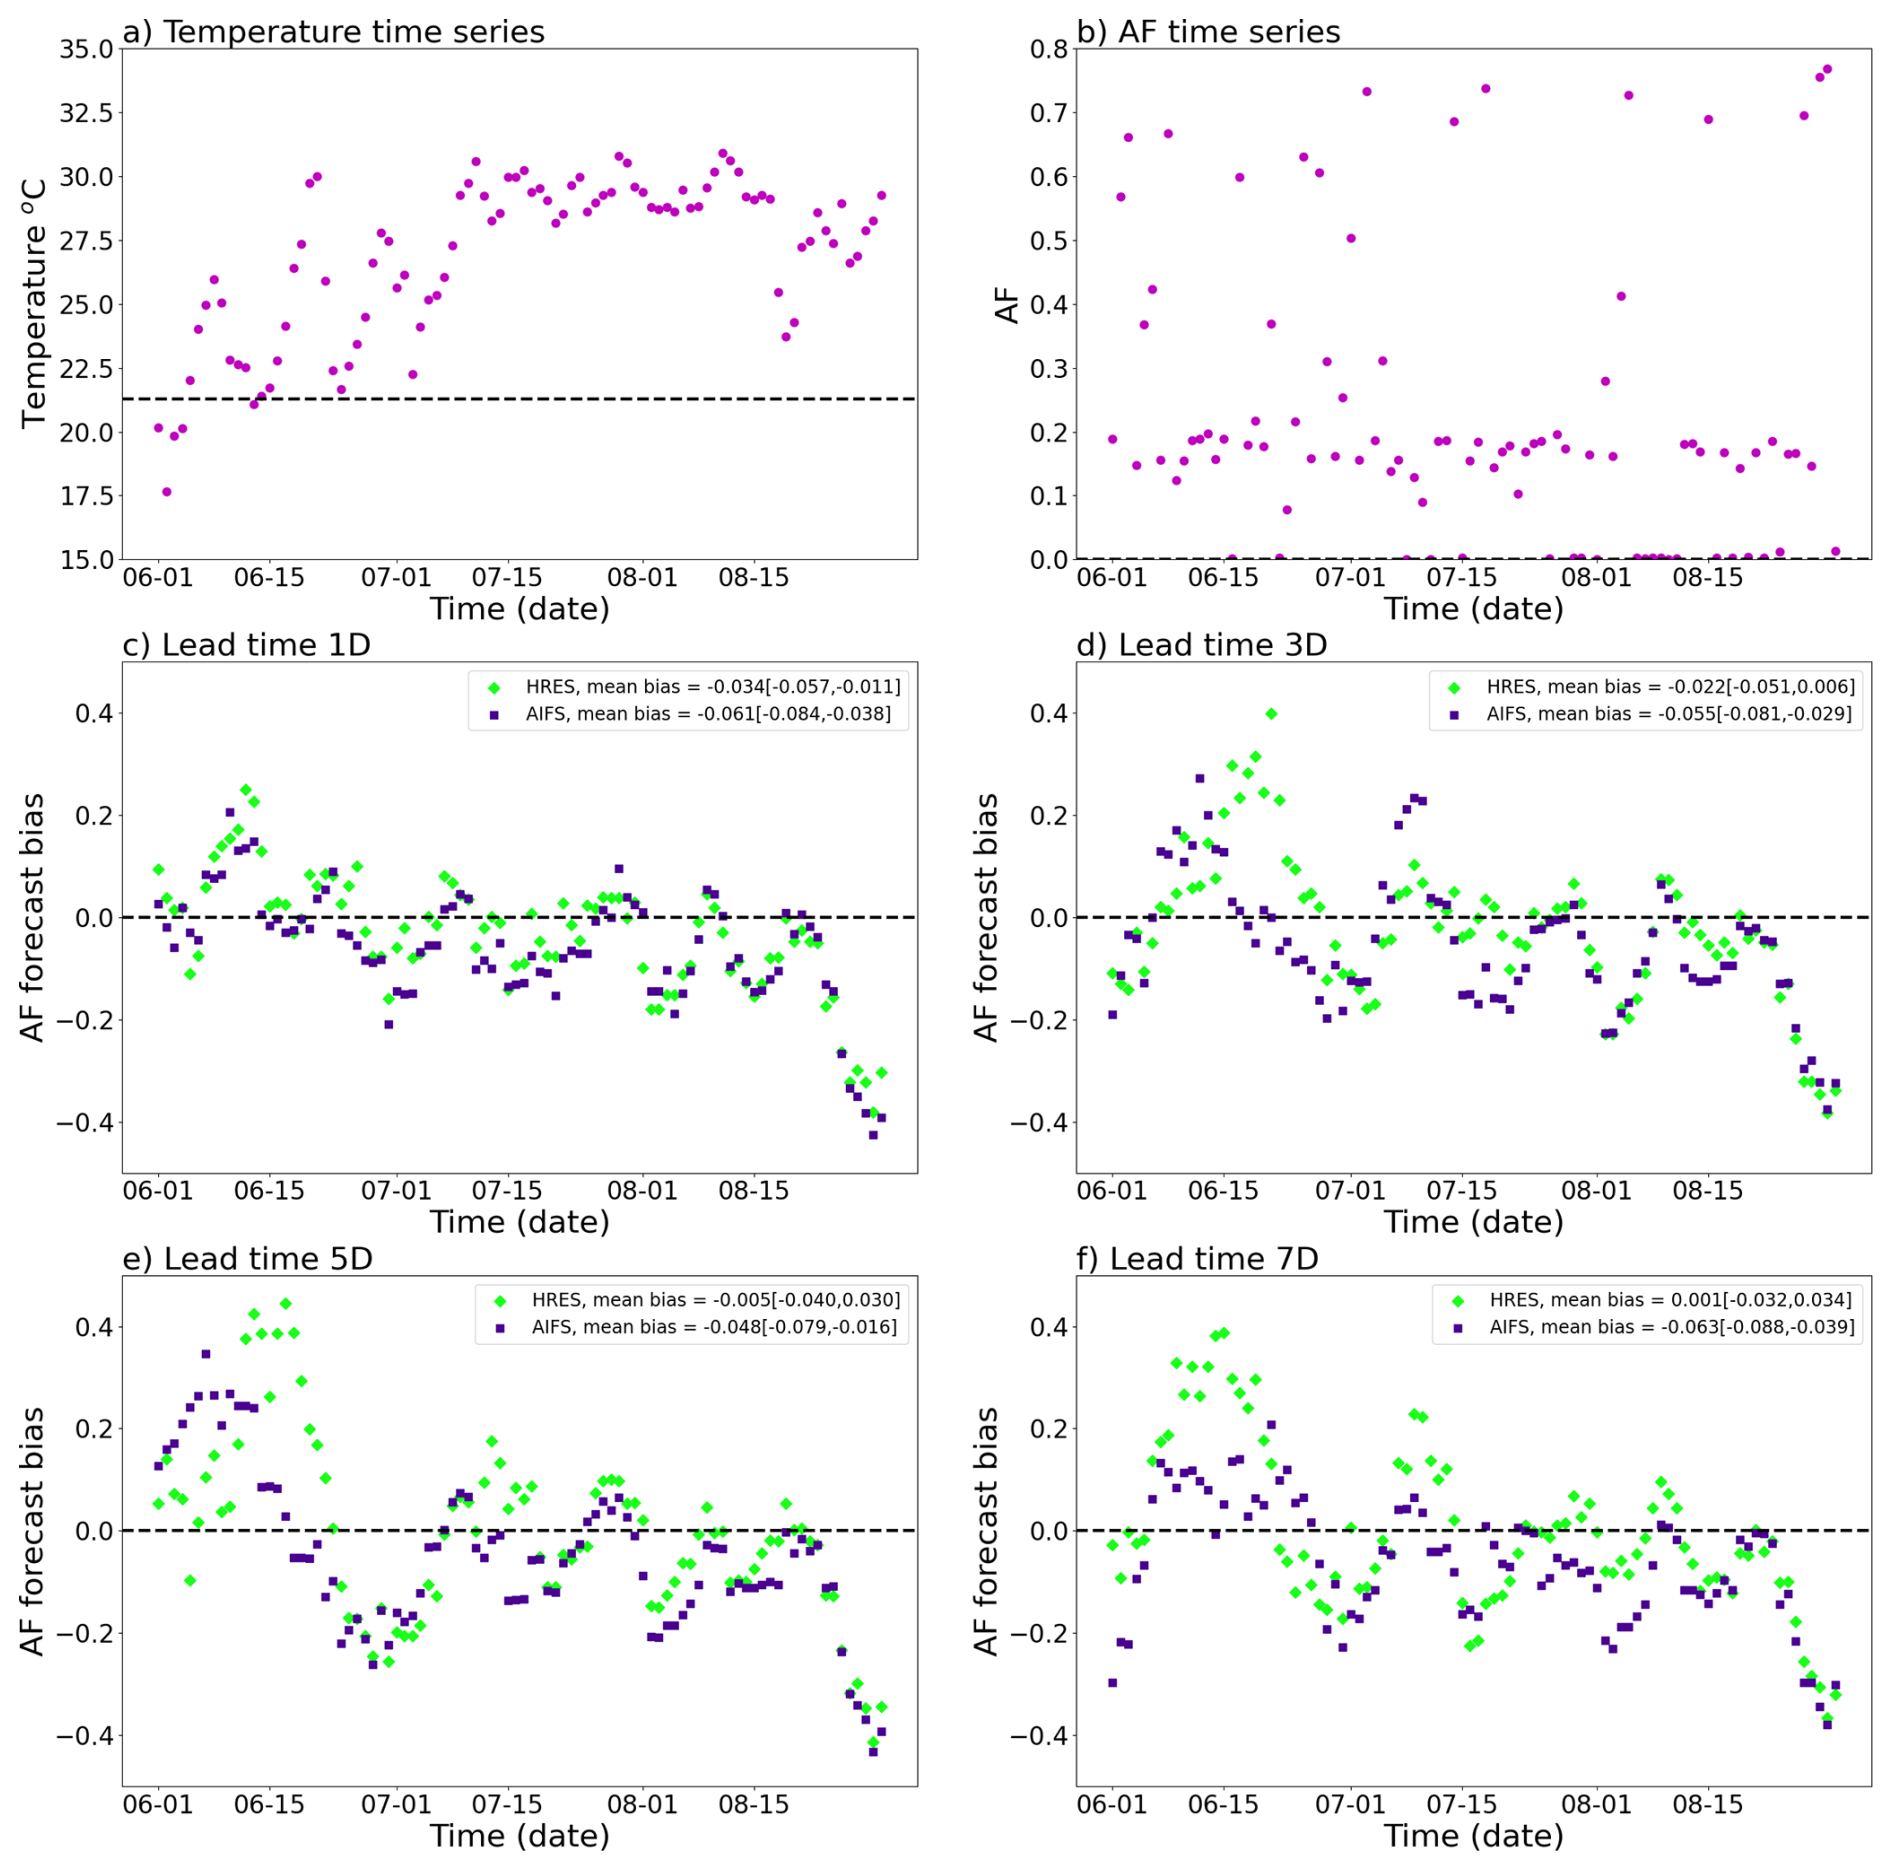
Figure 1Time series of temperature (a) and AF (b) for the summer of 2024 in Rome. The minimum mortality temperature for Rome is shown by the black dashed line in (a). Time series of the AF forecast bias for Rome during the summer of 2024, where green denotes the physics-based forecast (HRES) and purple denotes the data-driven forecast (AIFS), smoothed with a 7 d rolling mean (c–f). Lead times 1 d (c), 3 d (d), 5 d (e) and 7 d (f) are shown. The dashed black line represents the ground truth obtained when using ERA5 as meteorological input data.
3.1 Case study: Rome
We begin by looking at time series of temperature and AF for our case study. Figure 1a shows a time series of temperature corresponding to the city of Rome. June is generally cooler and more variable than later in the summer, albeit with several hot periods clearly exceeding the MMT. The corresponding AF is highly variable; no clear trend is evident, which may be due to the small sample size (Fig. 1b). In Fig. 1c–f we see that the AF forecast bias is smaller in magnitude for the physics-based forecasts than the data-driven forecasts for all lead times. On average the MAE is lower for the data-driven forecasts than the physics-based forecasts (Appendix Figs. A3, A4). We also show the distribution of forecast bias with a histogram in Fig. A2. No pattern with respect to lead-time is clearly visible.
We now consider the relationship between temperature and AF, and lead time. Figure 2a shows a systematic overestimation of temperature for Rome from the physics-based forecast, which increases with lead time. The data-driven forecast overestimates temperature for lead times 1 and 3 d, and decreases with lead time. After transforming to AF, the physics-based forecast shows no significant systematic error. The data-driven forecast shows an underestimation, albeit with the upper bound of the 95 % confidence interval very close to zero for the first week of forecasts (Fig. 2b). The data-driven temperature forecasts show lower MAE than for the physics based temperature forecasts (Fig. 2c), the signal remains present but weaker for the AF MAE (Fig. 2d).

Figure 2(a) Mean temperature forecast bias vs. lead time for the summer of 2024 in Rome. (b) Mean AF forecast bias vs. lead time. (c) MAE for temperature forecasts vs. lead time. (d) MAE for AF forecasts vs. lead time. Physics-based forecasts are shown in green and data-driven forecasts are shown in purple (a–d). The shading denotes the 95 % confidence intervals, which were computed by bootstrapping as described in the methods section.
In summary, this case study showcases the high variability within AF estimations and predictions for summer 2024. Nonetheless, these results highlight the non-linear relationship between temperature and AF; this forecast evaluation showed qualitatively different results for temperature and AF, as well as for the different types of AF forecasts, for the summer of 2024 in Rome.
3.2 Forecast assessment at continental scale
We now turn our attention to a continental scale, considering a population-weighted average for all cities in the study. First we show time series of temperature and AF. Figure 3a shows the hottest temperatures from mid-July through to mid August, although another hot period of slightly lower intensity is also visible in late June. The corresponding AF shows larger variability than for temperature, although again the highest values are present during the middle of summer (Fig. 3b). The remainder of Fig. 3 considers AF forecast bias time series for the different lead times. Figure 3c–f shows largest positive forecast bias at the beginning of summer in June, and negative forecast bias in the late summer in August, for all lead times. The signal for positive bias in June is most evident for the physics-based forecasts, with this becoming more prominent with increasing lead time (Fig. 3d–f). The data-driven forecasts show larger (negative) bias than the physics-based forecasts, with the bias increasing in size for longer lead times (Fig. 3d–f).
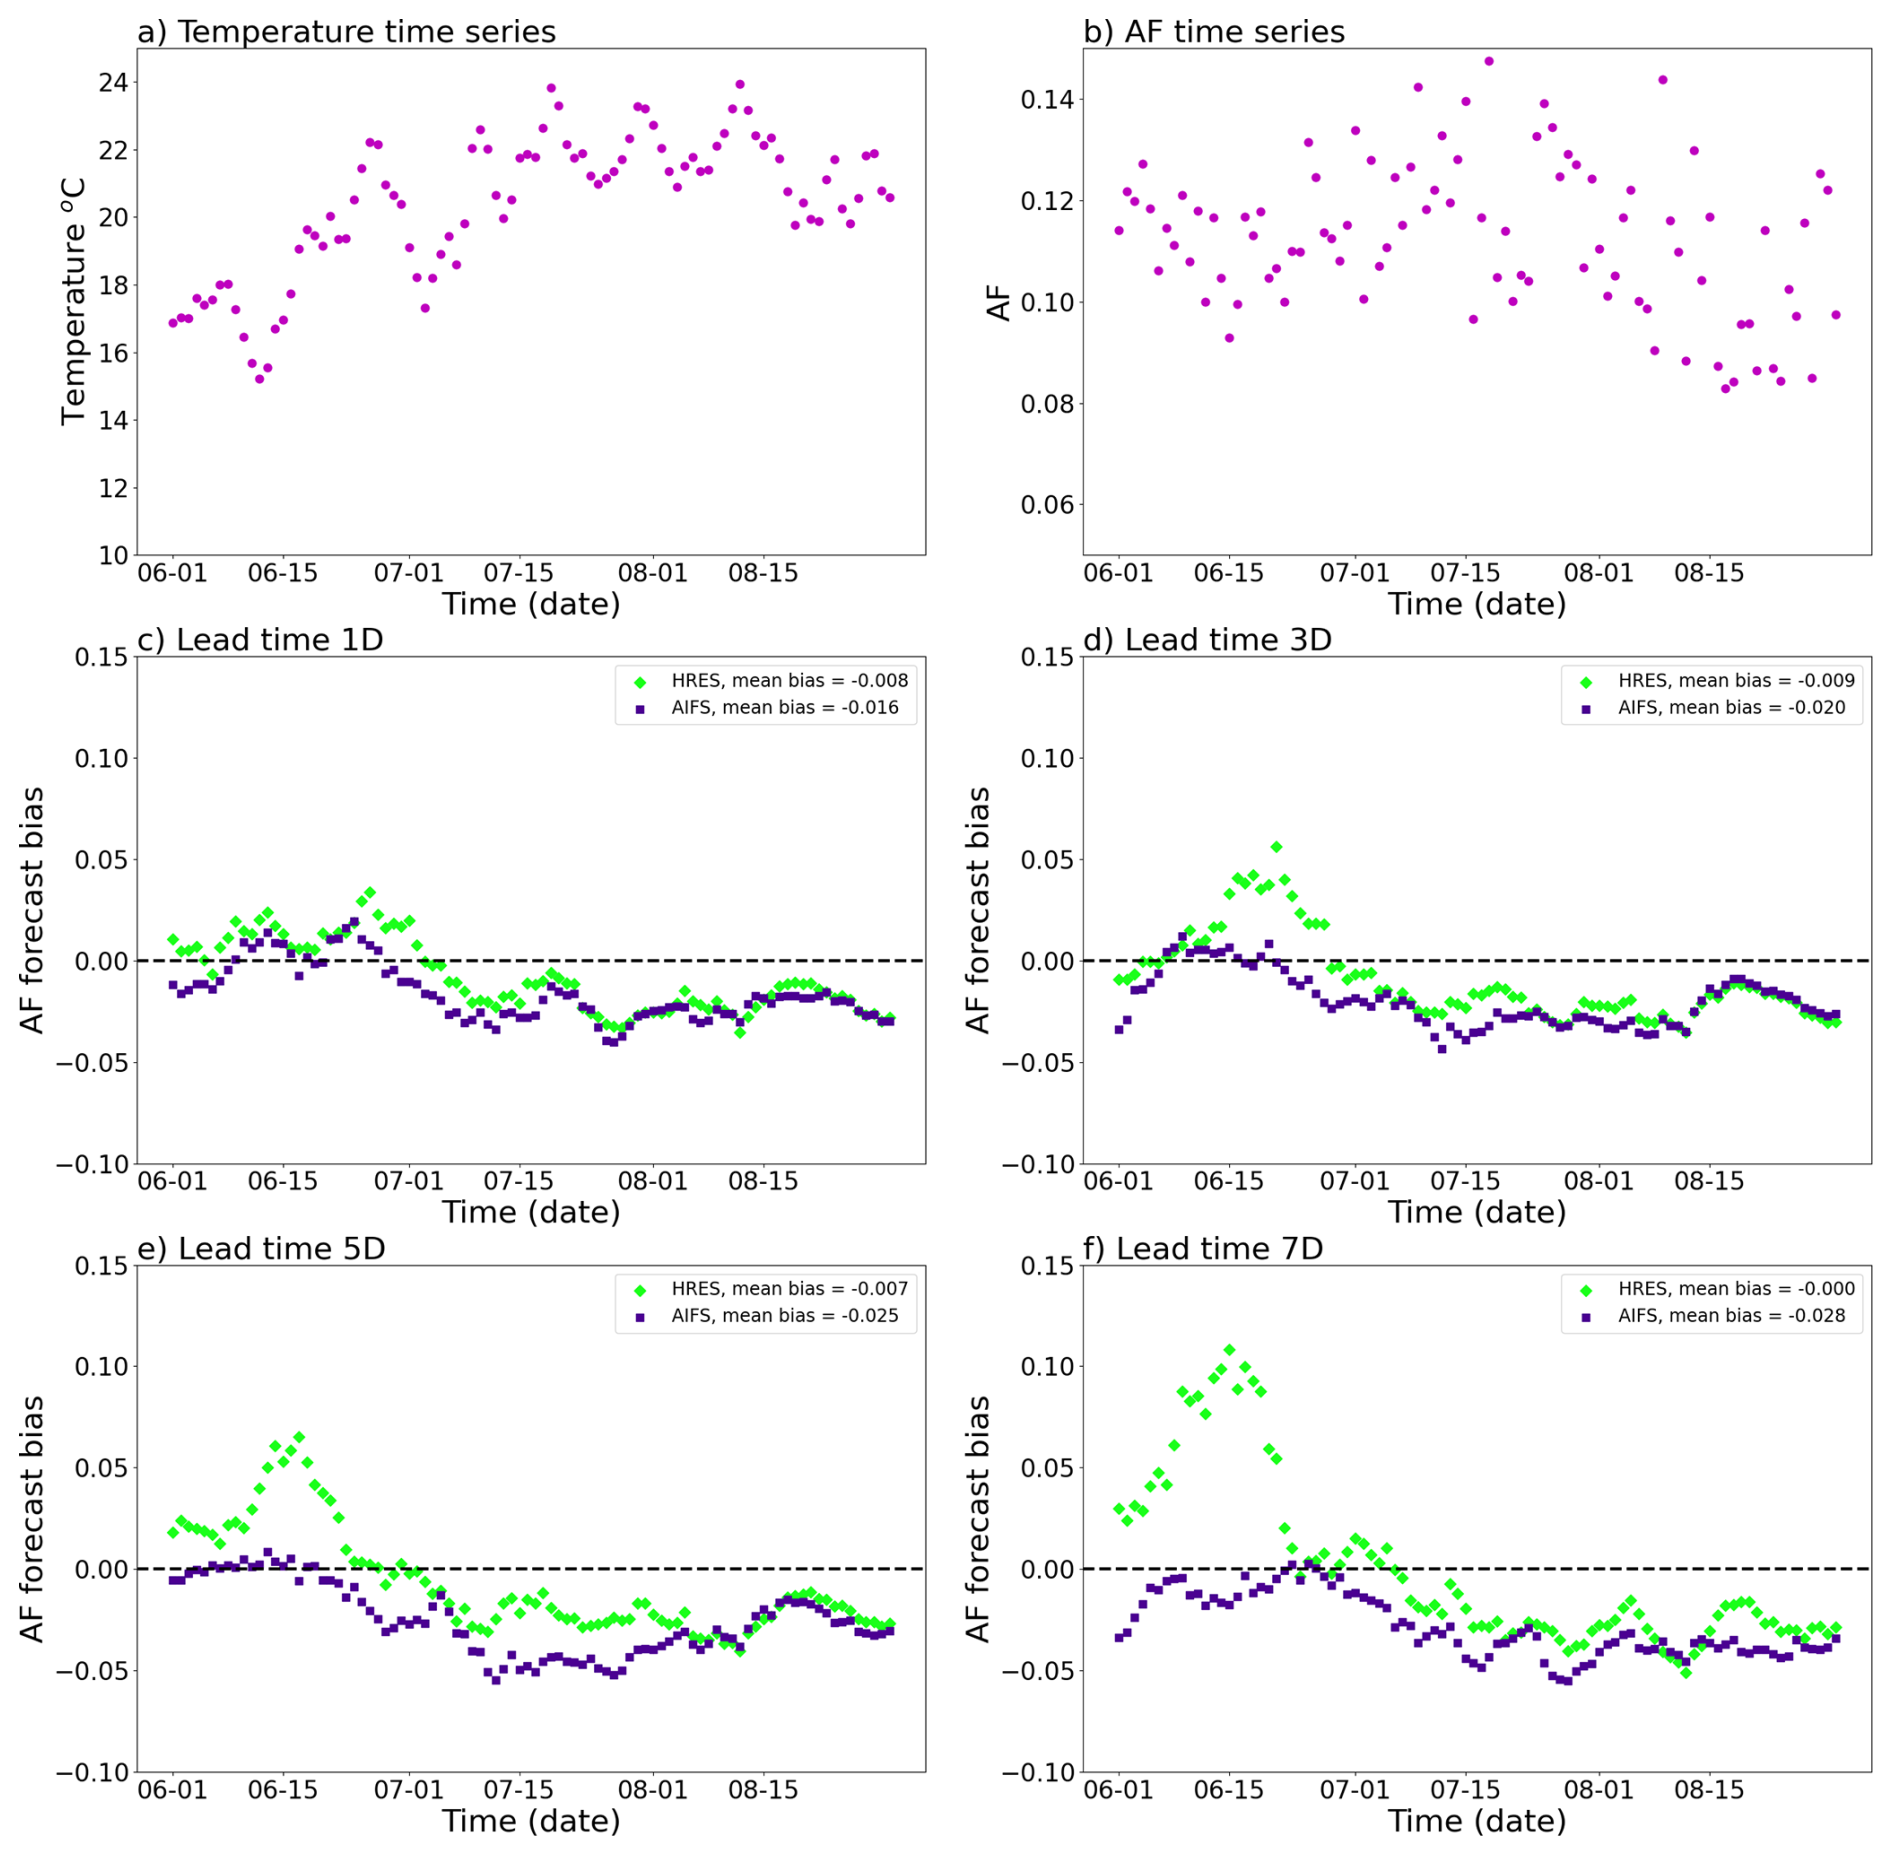
Figure 3Time series for the summer of 2024 for temperature (a), AF (b), AF forecast bias smoothed with a 7 d rolling mean for lead times 1 d (c), 3 d (d), 5 d (e) and 7 d (f), where values are population-weighted means. Green denotes the physics-based forecast and purple denotes the data-driven forecast (a–f).
Next we look into systematic errors in more detail by considering a series of QQ plots to compare the distributions of several quantities. First, we examine the population-weighted mean temperature forecasts compared to the ground truth, here represented by the population-weighted mean temperature from the ERA5 data (Fig. 4). Both forecasts fall close to the 45 ° line, although the data-driven forecasts are consistently lower than the physics-based forecasts across all lead times (Fig. 4a–d).
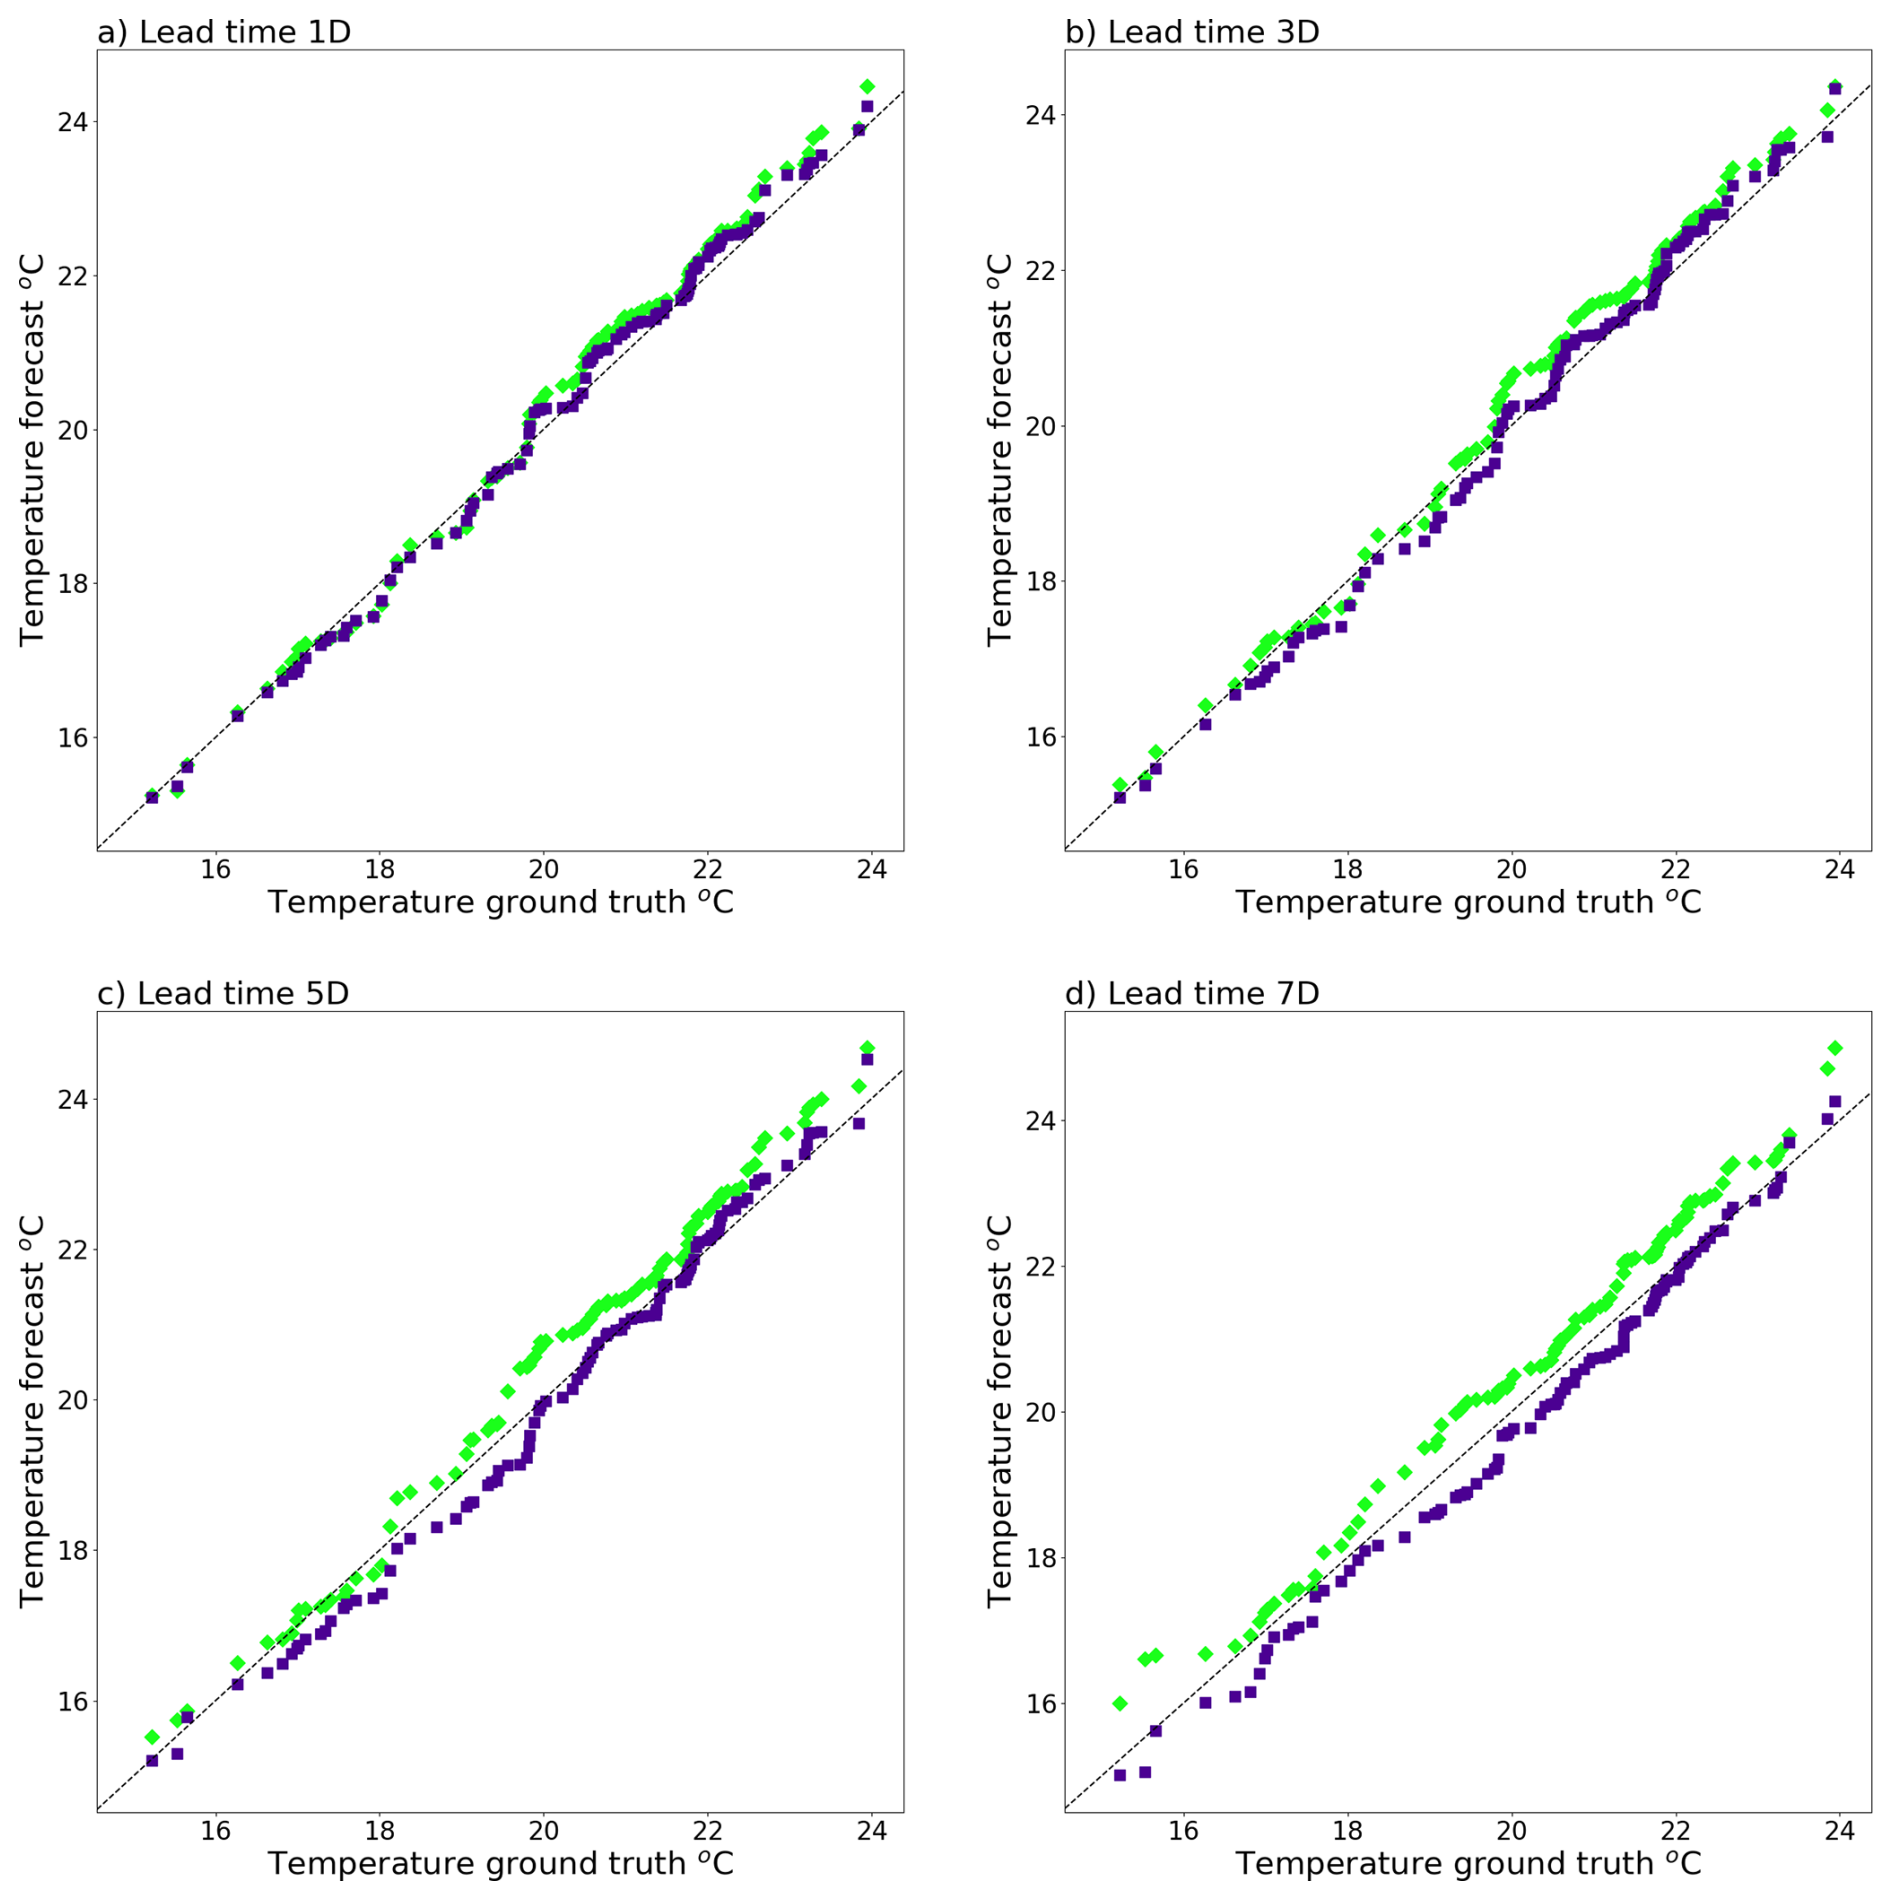
Figure 4QQ plot of population-weighted mean temperature forecast vs. ground truth for lead time 1 d (a), 3 d (b), 5 d (c) and 7 d (d). Green denotes the physics-based forecasts, purple denotes the data-driven forecasts (a–d). The solid lines denote the 45 ° line.
We then repeat the analysis but for population-weighted mean AF forecasts compared to the ground truth here represented by the population-weighted mean AF estimated using ERA5 data. The results suggest some systematic under-estimation with more values falling below the 45 ° line than above for both types of forecast, although this is more pronounced for the data-driven forecasts (Fig. 5a–d). Both types of forecast show heavy tails (Fig. 5a–d).
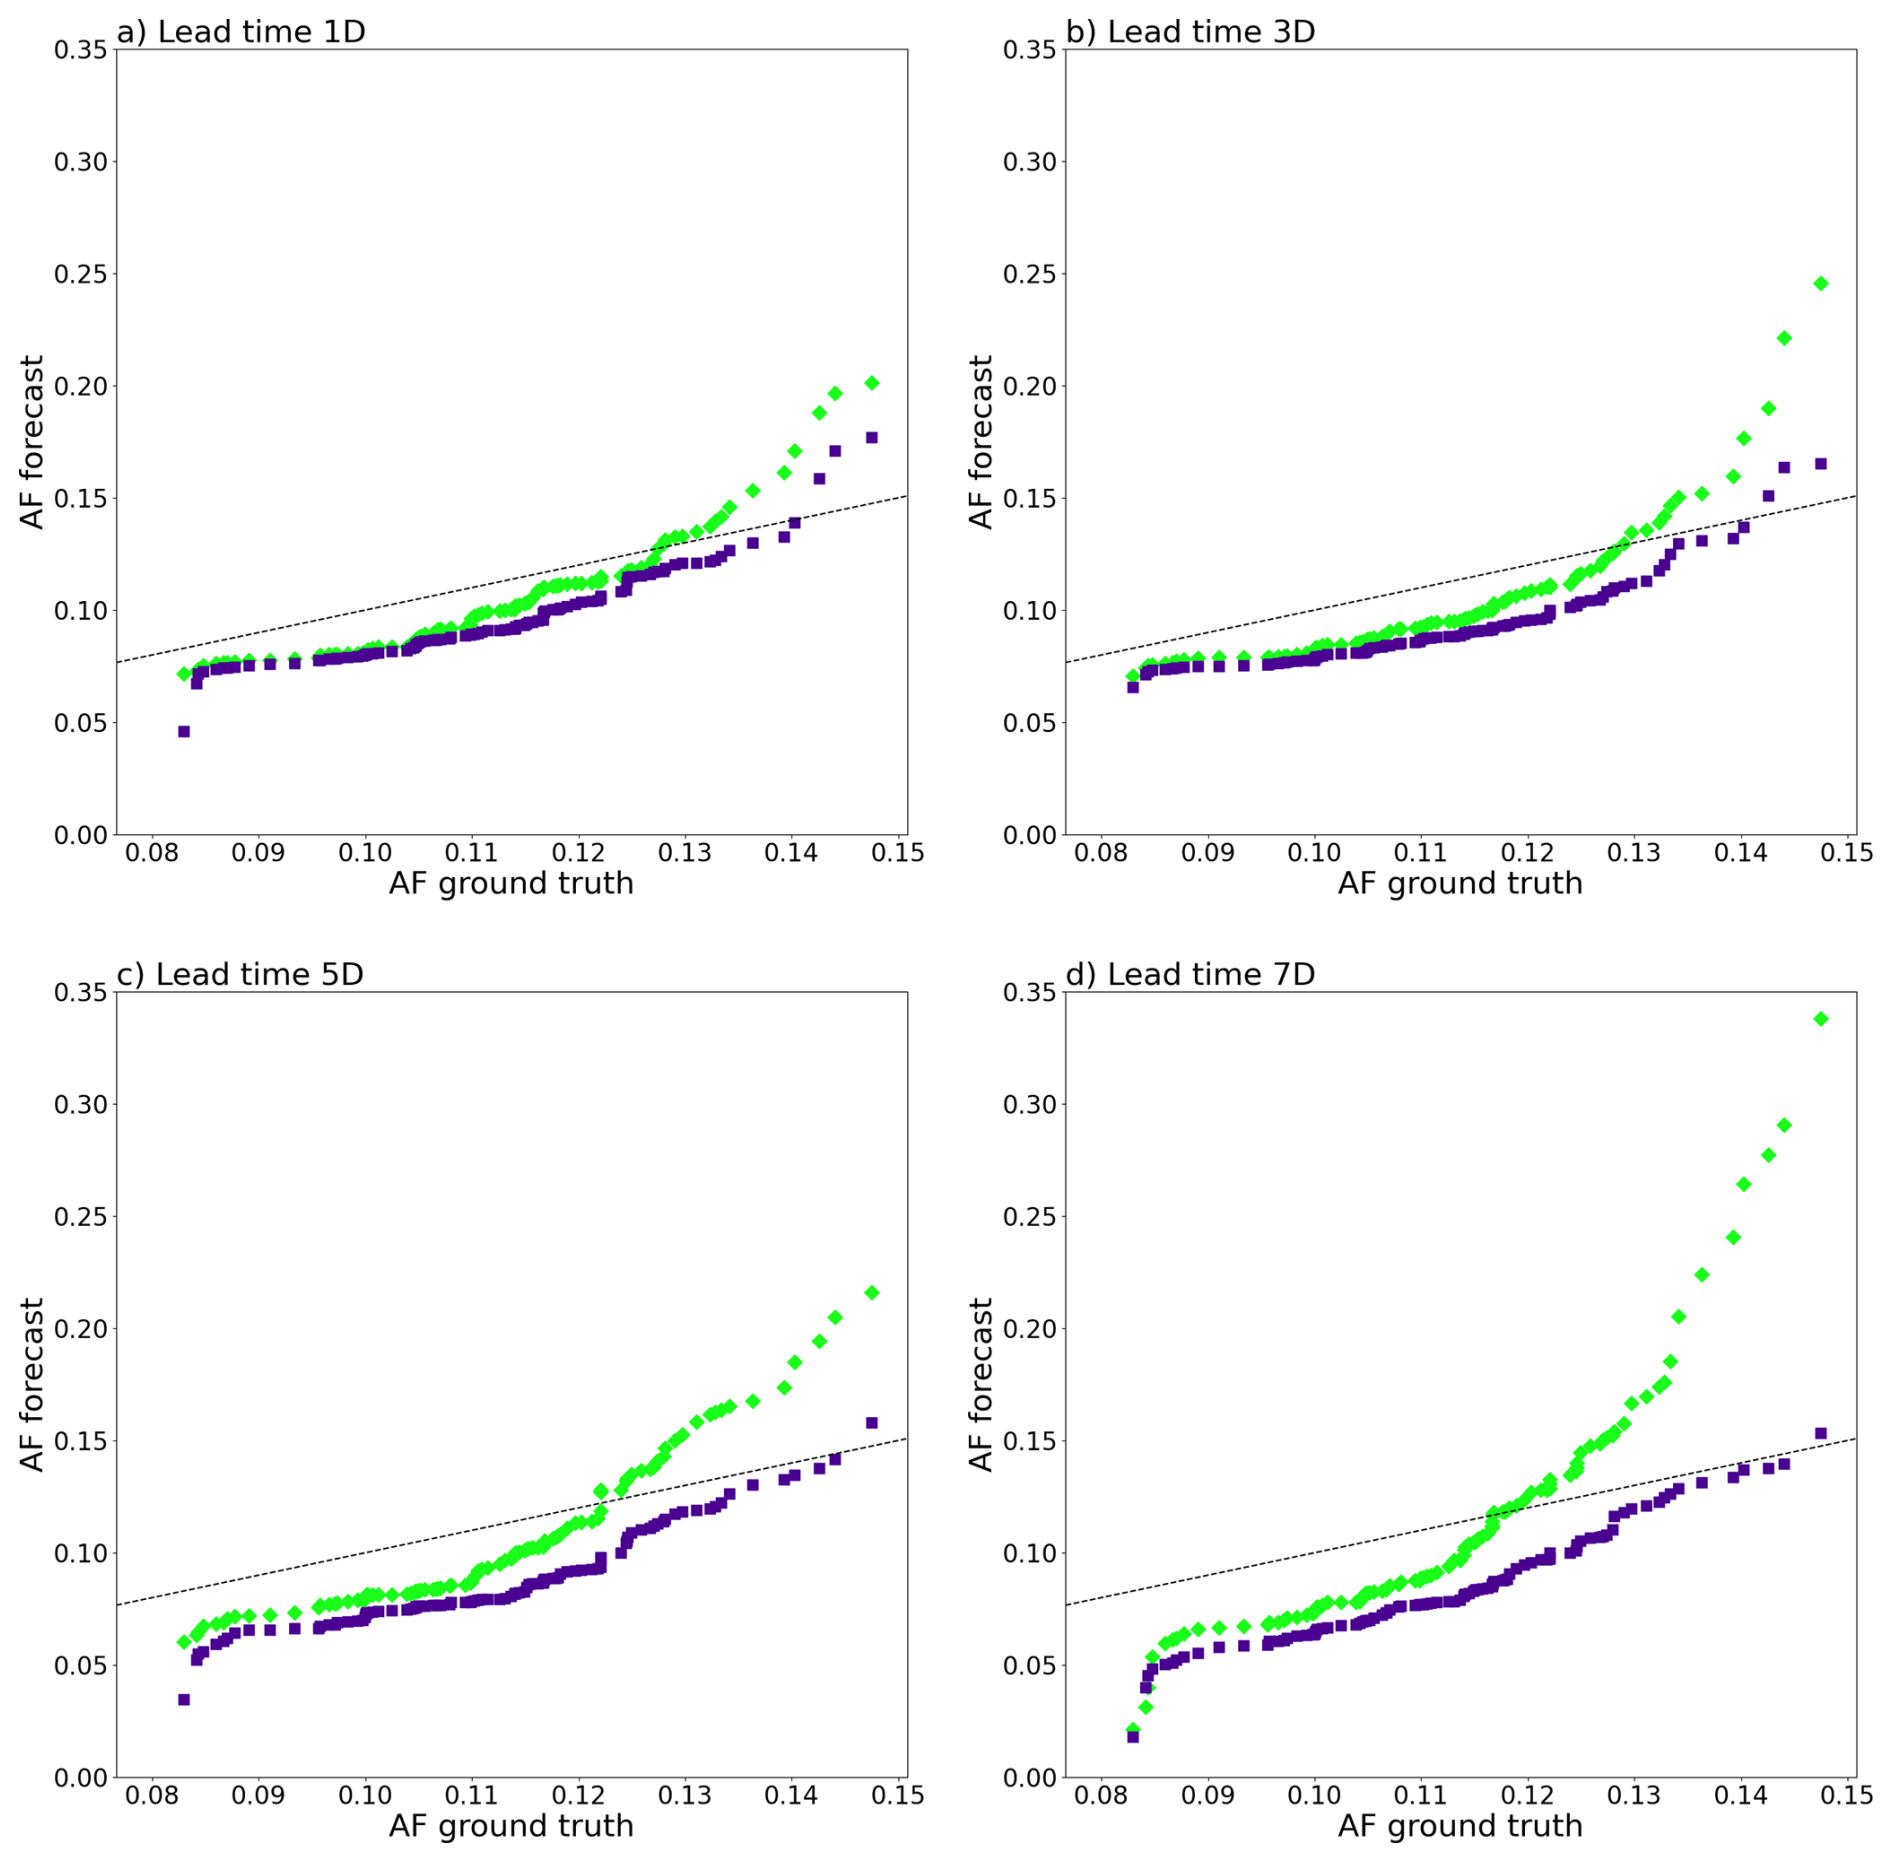
Figure 5QQ plot of population-weighted mean AF forecast vs. AF ground truth (estimated from ERA5) for lead time 1 d (a), 3 d (b), 5 d (c) and 7 d (d). Green denotes the physics-based forecasts, purple denotes the data-driven forecasts (a–d). The solid line denotes the zero error line.
To investigate the relationship between AF forecast bias and temperature further, we compare the distributions of AF forecast bias of the two models by performing Kolmogorov-Smirnov tests. The results indicated that for lead times 3, 5 and 7 d, the physics-based and data-driven AF forecasts correspond to different distributions (p-values = 0.026, 0.026 and < 0.001 respectively). This underscores the complex relation between errors in AF forecasts and temperature, particularly for hot temperatures where AF forecasts would be most relevant for application in heat warning systems.
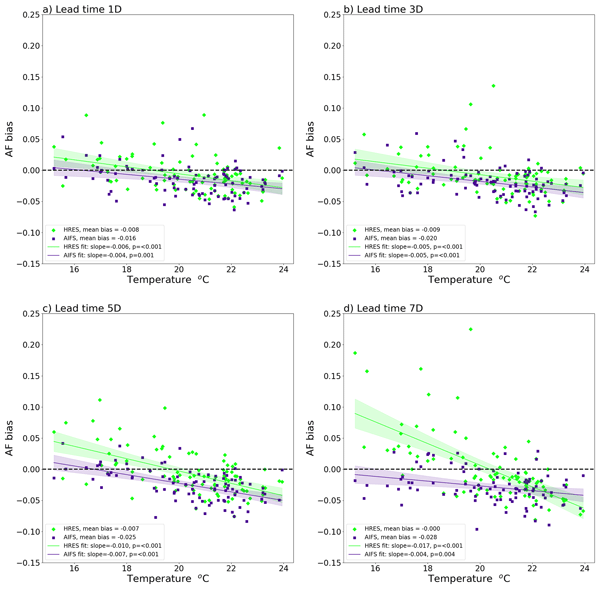
We further consider the relationship between AF forecast bias and temperature in Fig. 6a–d, which shows negative correlations between the two quantities. On average both forecasts underestimate temperature-related mortality at hot temperatures for all lead times, although this is more clearly visible for the data-driven forecasts than the physics-based forecasts. The physics-based forecasts show a markedly stronger correlation for lead times 1, 5 and 7 d than the data-driven forecasts (Fig. 6a, c, d). For lead time 3 d the two forecasts show a correlation (slope) of similar magnitude (Fig. 6b).
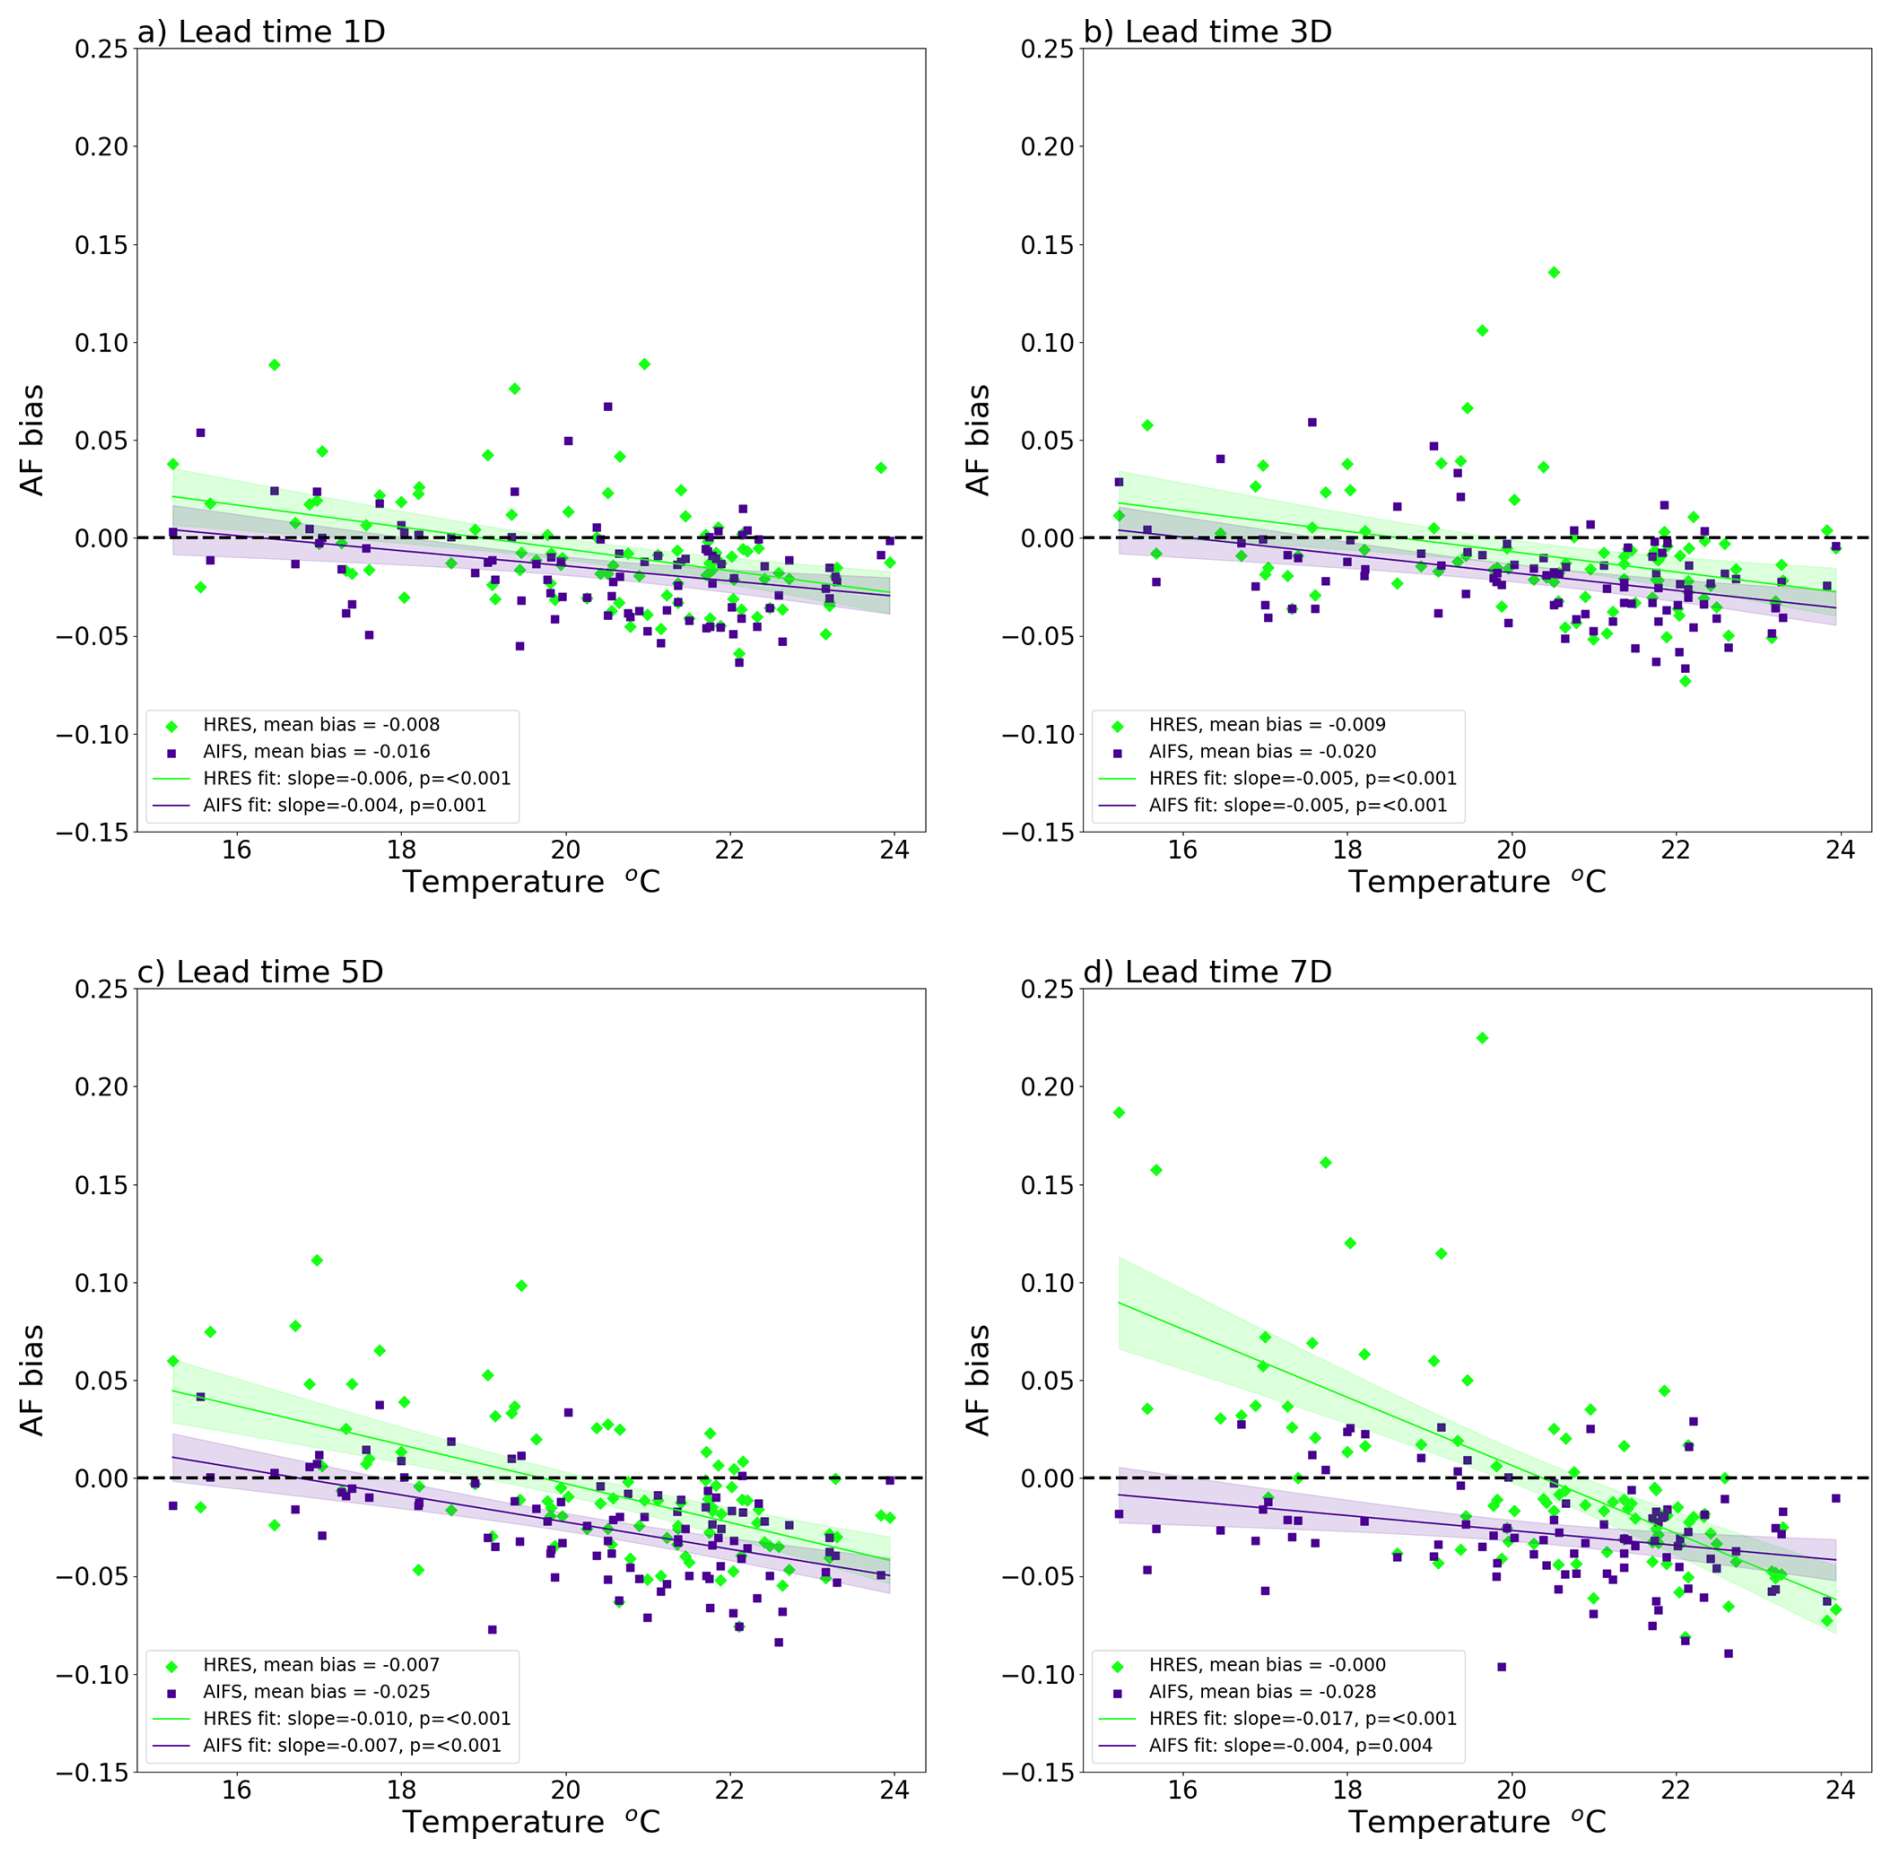
Figure 6Scatter plot of the population-weighted mean AF forecast bias vs. temperature for the summer of 2024; green denotes the physics-based forecast (HRES) and purple denotes the data-driven forecast (AIFS) (a–d). Lead times 1 d (a), 3 d (b), 5 d (c) and 7 d (d) are shown. The lines show a linear fit and the shading denotes the 95 % confidence interval.
We repeat the analysis for the MAE. Figure 7a shows an extremely weak correlation between the MAE and temperature for the physics-based forecast, and a weak positive correlation for the data driven forecast for lead time 1 d. Considering lead time 3 d, no correlation between MAE and temperature is evident for the physics based forecasts, whilst there is again a weak positive correlation for the data driven forecast (Fig. 7b). At longer lead times of 5 and 7 d, we see a weak negative correlation for the physics based forecasts, and a weak positive correlation for the data driven forecasts (Fig. 7c, d).
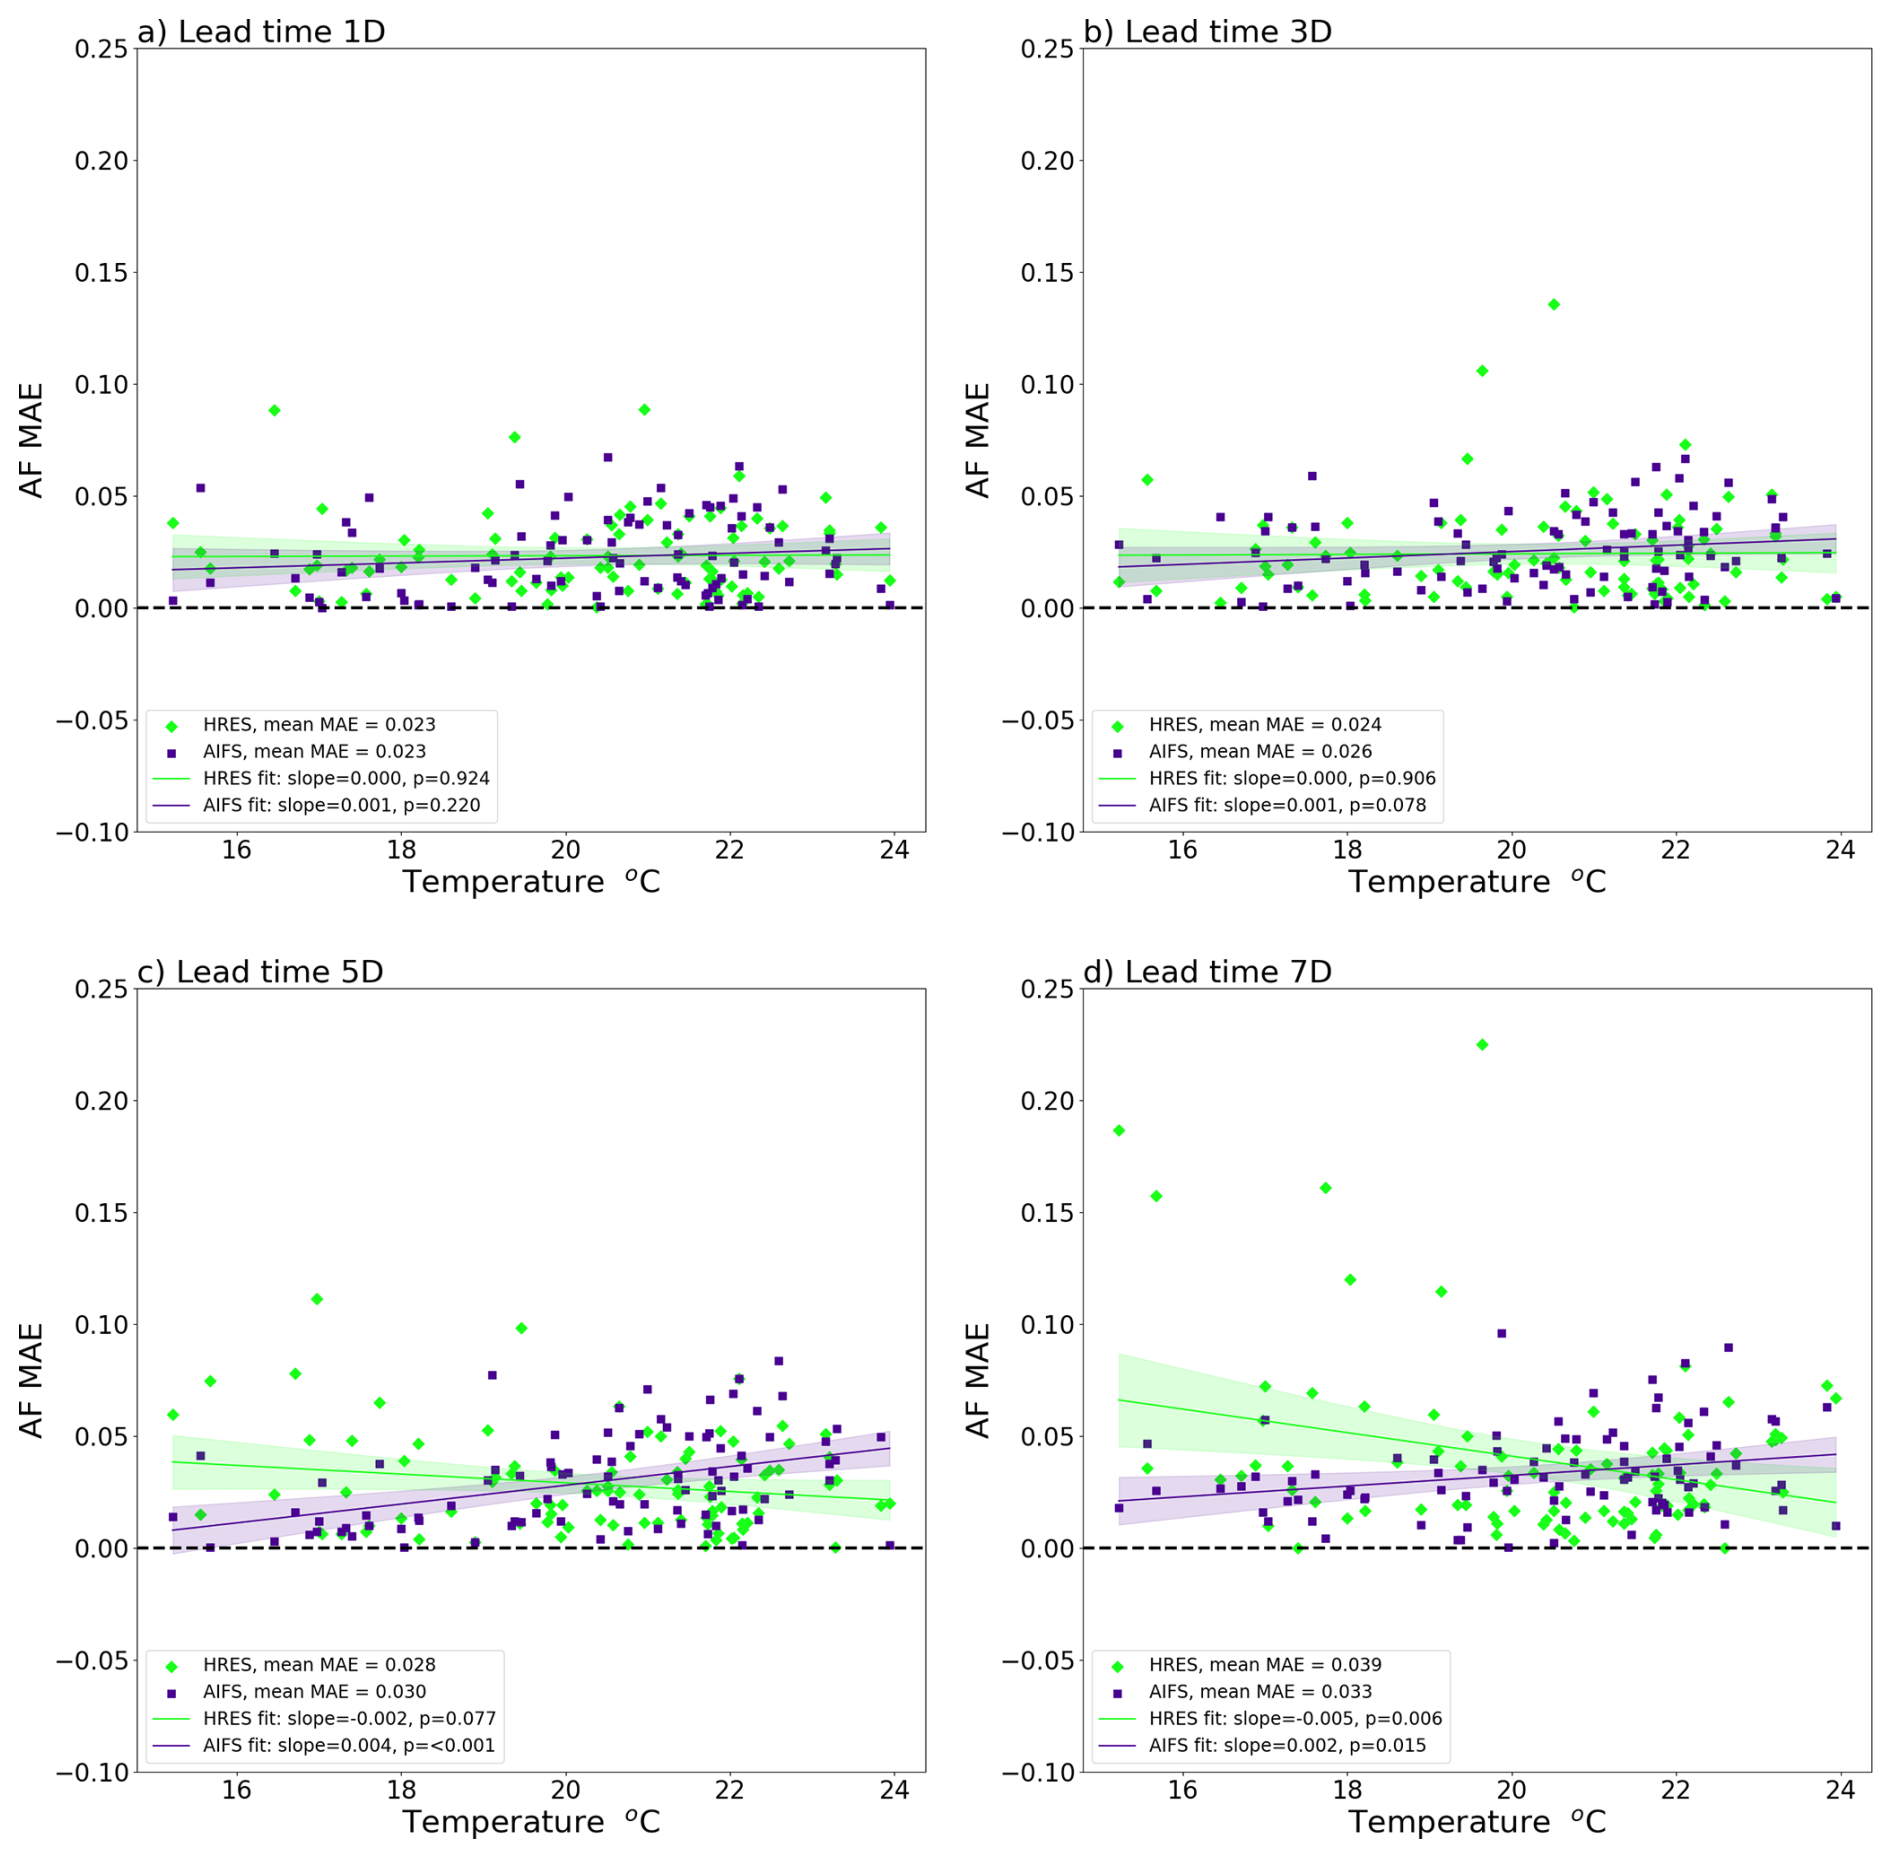
Figure 7Scatter plot of the population-weighted mean AF forecast MAE vs. temperature for the summer of 2024; green denotes the physics-based forecast (HRES) and purple denotes the data-driven forecast (AIFS) (a–d). Lead times 1 d (a), 3 d (b), 5 d (c) and 7 d (d) are shown. The lines show a linear fit and the shading denotes the 95 % confidence interval.
Lastly, we consider the perspective of forecast performance with respect to lead time. Figure 8a shows the physics-based forecast systematically overestimating temperature, with the error growing for longer lead times. Initially the data-driven forecast overestimates temperature at lead time 1 d, and then underestimates for forecasts at lead times 7 and 10 d. After transforming to AF, the physics-based forecasts underestimate AF for short lead times, and overestimate for long lead times (Fig. 8b). The data-driven forecast systematically underestimates at all lead times; this is most visible at lead times corresponding to the end of the first week of the forecast. This corresponds to the predictability limit for AF (Quijal-Zamorano et al., 2024; Holmberg et al., 2025), beyond which the forecast typically loses deterministic skill. As expected, Fig. 8c shows the MAE of the temperature forecasts increasing with respect to lead time. Furthermore, the data-driven forecast has slightly lower values for all lead times. Finally, we consider the MAE for AF forecasts in Fig. 8d. The MAE for both AF forecasts is very similar up to and including lead time 5 d. Beyond this there is a sharp increase in the MAE for the physics-based forecasts, before both forecasts show a decrease in MAE at lead time 10 d. MAE does not typically decrease for increasing lead time, and this is potentially a sampling issue, as evidenced especially by the large confidence interval for the physics-based AF forecast at lead time 7 d.
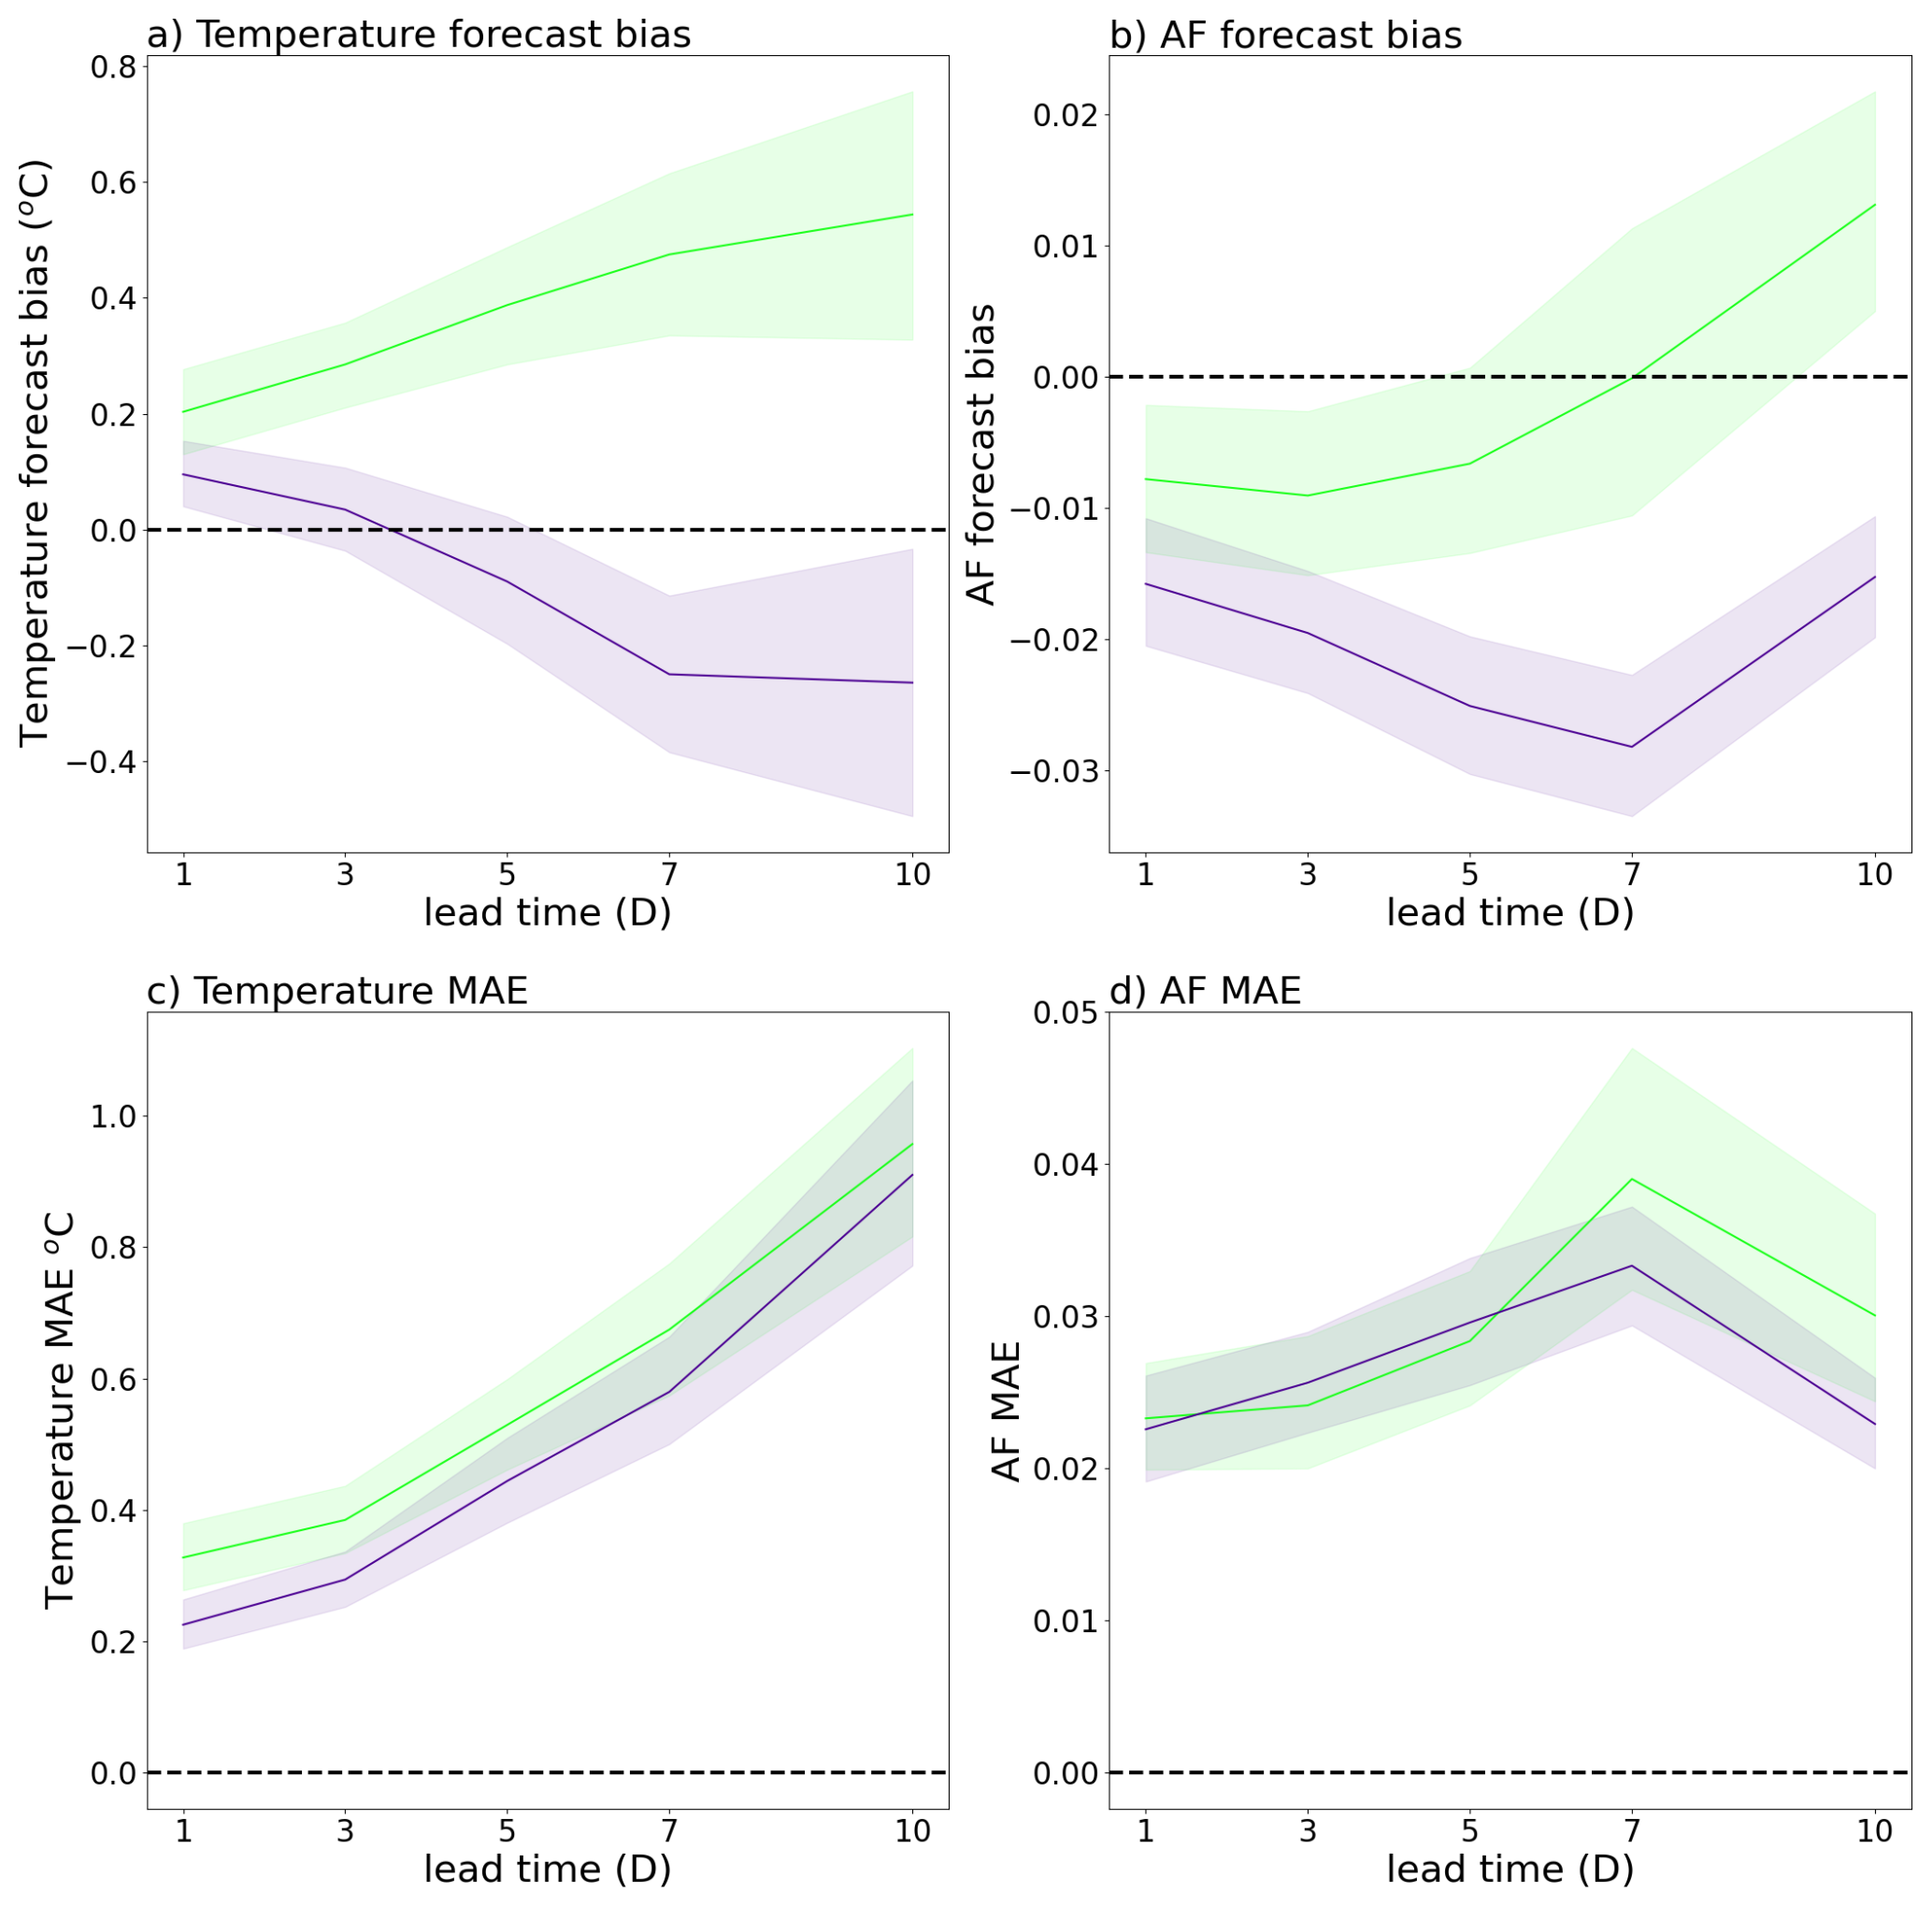
Figure 8(a) Mean temperature forecast bias vs. lead time. (b) Mean AF forecast bias vs. lead time. (c) MAE for temperature forecasts vs. lead time. (d) MAE for AF forecasts vs. lead time. Physics based forecasts are denoted by green and data-driven forecasts by purple (a–d). The shading denotes the 95 % confidence intervals, which were computed by bootstrapping as described in the methods section.
Our results show that data-driven forecasts performed approximately as well as physics-based forecasts when considering the average forecast bias over the summer of 2024, however, these data-driven forecasts systematically underestimated AF, especially for hot temperatures. This is consistent with past work showing data-driven approaches generally outperforming physics-based forecasts on key variables like 2 m temperature, but struggling to capture extremes (Olivetti and Messori, 2024a). For the physics-based forecasts, this underestimation was to a lesser extent also evident, but only for exceptionally hot temperatures. Surface temperature is affected by complex interactions with the land-surface – Fischer et al. (2007) highlight the important role of land-atmosphere coupling for a number of European heatwaves. Representing the effects of quantities such as soil moisture, vegetation and urban landscapes is an ongoing area of development for NWP modelling (Ingleby et al., 2024), and is in part challenging due to the fine spatial resolution of these local effects. To produce accurate and reliable AF forecasts it is nevertheless crucial that the underlying weather forecasts are able to represent hot temperatures well. Continued development in this field is imperative, not just for improving physics-based forecasts for hot temperatures, but also for the continued improvement of reanalysis datasets, which are used to train data-driven weather models.
Shifting focus to lead-time dependency, our results showed a different relationship for AF than temperature. The MAE for temperature forecasts increased with respect to lead time, as expected, whilst this trend was not as clearly evident for AF forecasts. Previous work showed AF forecast errors depending critically on absolute temperature, owing to the non-linear transformation (Holmberg et al., 2025). We suggest that the weak lead-time dependent signal for AF MAE is an artefact of our small sample size combined with the interaction between the lead-time dependent error growth in temperature forecasts, and the amplification of forecast errors for hot temperatures. The non-linear propagation of errors from temperature to AF forecasts likely obscures the lead-time dependent error growth for temperature forecasts, leading to a far less clear signal for AF error growth with respect to lead time than is seen for temperature forecasts. Further verification of these results through a systematic study considering multiple years is necessary.
For explicitly impact-focused applications such as the AF forecasts presented here, alternate weightings giving more importance to the extremes could be considered in the training of data-driven forecast models. Furthermore, even a simplistic approach of post processing data-driven forecasts using a tailored bias correction could prove useful for AF forecasts. In particular, we suggest that future work could explore a bias correction which is dependent on forecast temperature, to account for the apparent underestimation of AF for hot temperatures. These findings have important ramifications for the up-take of such forecasts by agencies who issue health warnings. A major advantage of data-driven forecasts is that they are cheap to run. This means that bespoke AF forecasts could be run comparatively cheaply, which is attractive for settings with limited computational resources.
This study has a number of limitations. Firstly, we consider one summer as a case study, which limits the generalisability of our results. We apply this epidemiological framework to temperatures outside the range of temperatures used for fitting, similar to approaches taken in e.g. Lüthi et al. (2023, 2024). This means that we have large uncertainties associated with the hottest temperatures of 2024. Nonetheless, our focus here is to compare forecast model performance relative to reanalysis data from an impact-focused perspective, rather than to evaluate the performance of the underlying epidemiological model. Furthermore, we only consider weather forecasts output from two global models, one data-driven and one physics-based, as opposed to regional weather forecasts produced by national weather services. This study is associated with uncertainty from both the weather forecasting and epidemiological perspective. These are two fundamentally different approaches to uncertainty quantification since the epidemiological framework is at its core an advanced statistical model, whilst the uncertainty due to weather is due to the chaotic nature of the atmosphere. The extension of this approach to ensemble weather forecasts could prove illustrative for the quantification of the uncertainty stemming from the weather forecasts. We further note that multiple long term trends affect temperature-related mortality; anthropogenic warming from the climate perspective (Vicedo-Cabrera et al., 2021), and a combination of population ageing, improving health care systems, and adaptation to our changing climate from the epidemiological perspective (Gallo et al., 2024; Huber et al., 2025; Masselot et al., 2025). This is an active area of research and we welcome future studies which provide the broader scientific community with updated epidemiological fits accounting for long term trends from both perspectives.
Recent developments in the AI forecast model domain have moved towards ensemble forecasts trained to represent a distribution rather than an ensemble average, leading to remarkable improvements in terms of representation of extremes (e.g. Price et al., 2025). We thus suggest that this study could be expanded to an ensemble perspective, where sufficient computational resources were available, or extended to focus specifically on heatwaves. A further extension of the work presented here would be to focus on specific subregions within Europe, as well as regions beyond Europe, particularly those that have been highlighted as being especially vulnerable to climate change. Furthermore, this framework could be readily applied to other health outcomes where an analogous exposure-response function is available. The association between heat and health outcomes beyond all cause mortality is an active area of research within the health community, and we warmly welcome efforts to increase accessibility to this data. Further progress in this domain would be very beneficial for enabling targeted preventative measures to help improve health outcomes.
This study evaluated the performance of temperature-related mortality forecasts based on data-driven weather forecasts relative to those based on physics-based weather forecasts for the European summer of 2024. We found that the temperature-related mortality forecasts based on data-driven weather forecasts performed approximately as well as those based on physics-based forecasts. The temperature-related mortality forecasts based on data-driven weather forecasts showed a more pronounced systematic underestimation than their physics-based counterparts. Both types of forecasts showed sensitivity to errors at hot temperatures. We suggest that for temperature-related mortality forecasts based on data-driven weather forecasts, a temperature-dependent bias correction or adjustment of the loss function to give greater weighting to hot temperatures could present a fruitful line of further inquiry. This is particularly relevant for resource limited settings, since running data-driven weather forecasts is far less computationally expensive. Irrespective of the underlying type of weather forecast, our finding underscore the importance of continued development in weather forecasts for hot temperatures. Further investigation of these findings from a systematic perspective would be crucial for providing robust recommendations to stakeholders and local authorities about the potential for integrating these forecasts into heat action plans or early warning systems.
Figure A1 shows a map indicating the cities included in this study from Masselot et al. (2023).

Figure A1Map of the cities included in this study, with marker size indicating the population.
Figure A2 shows a histogram of AF forecast bias for Rome. Initially for lead time 1 d the distributions are similar (Fig. A2a), however, for the remaining lead times, the physics-based forecast shows a heavier right hand tail, demonstrating larger positive bias (Fig. A2b–d).
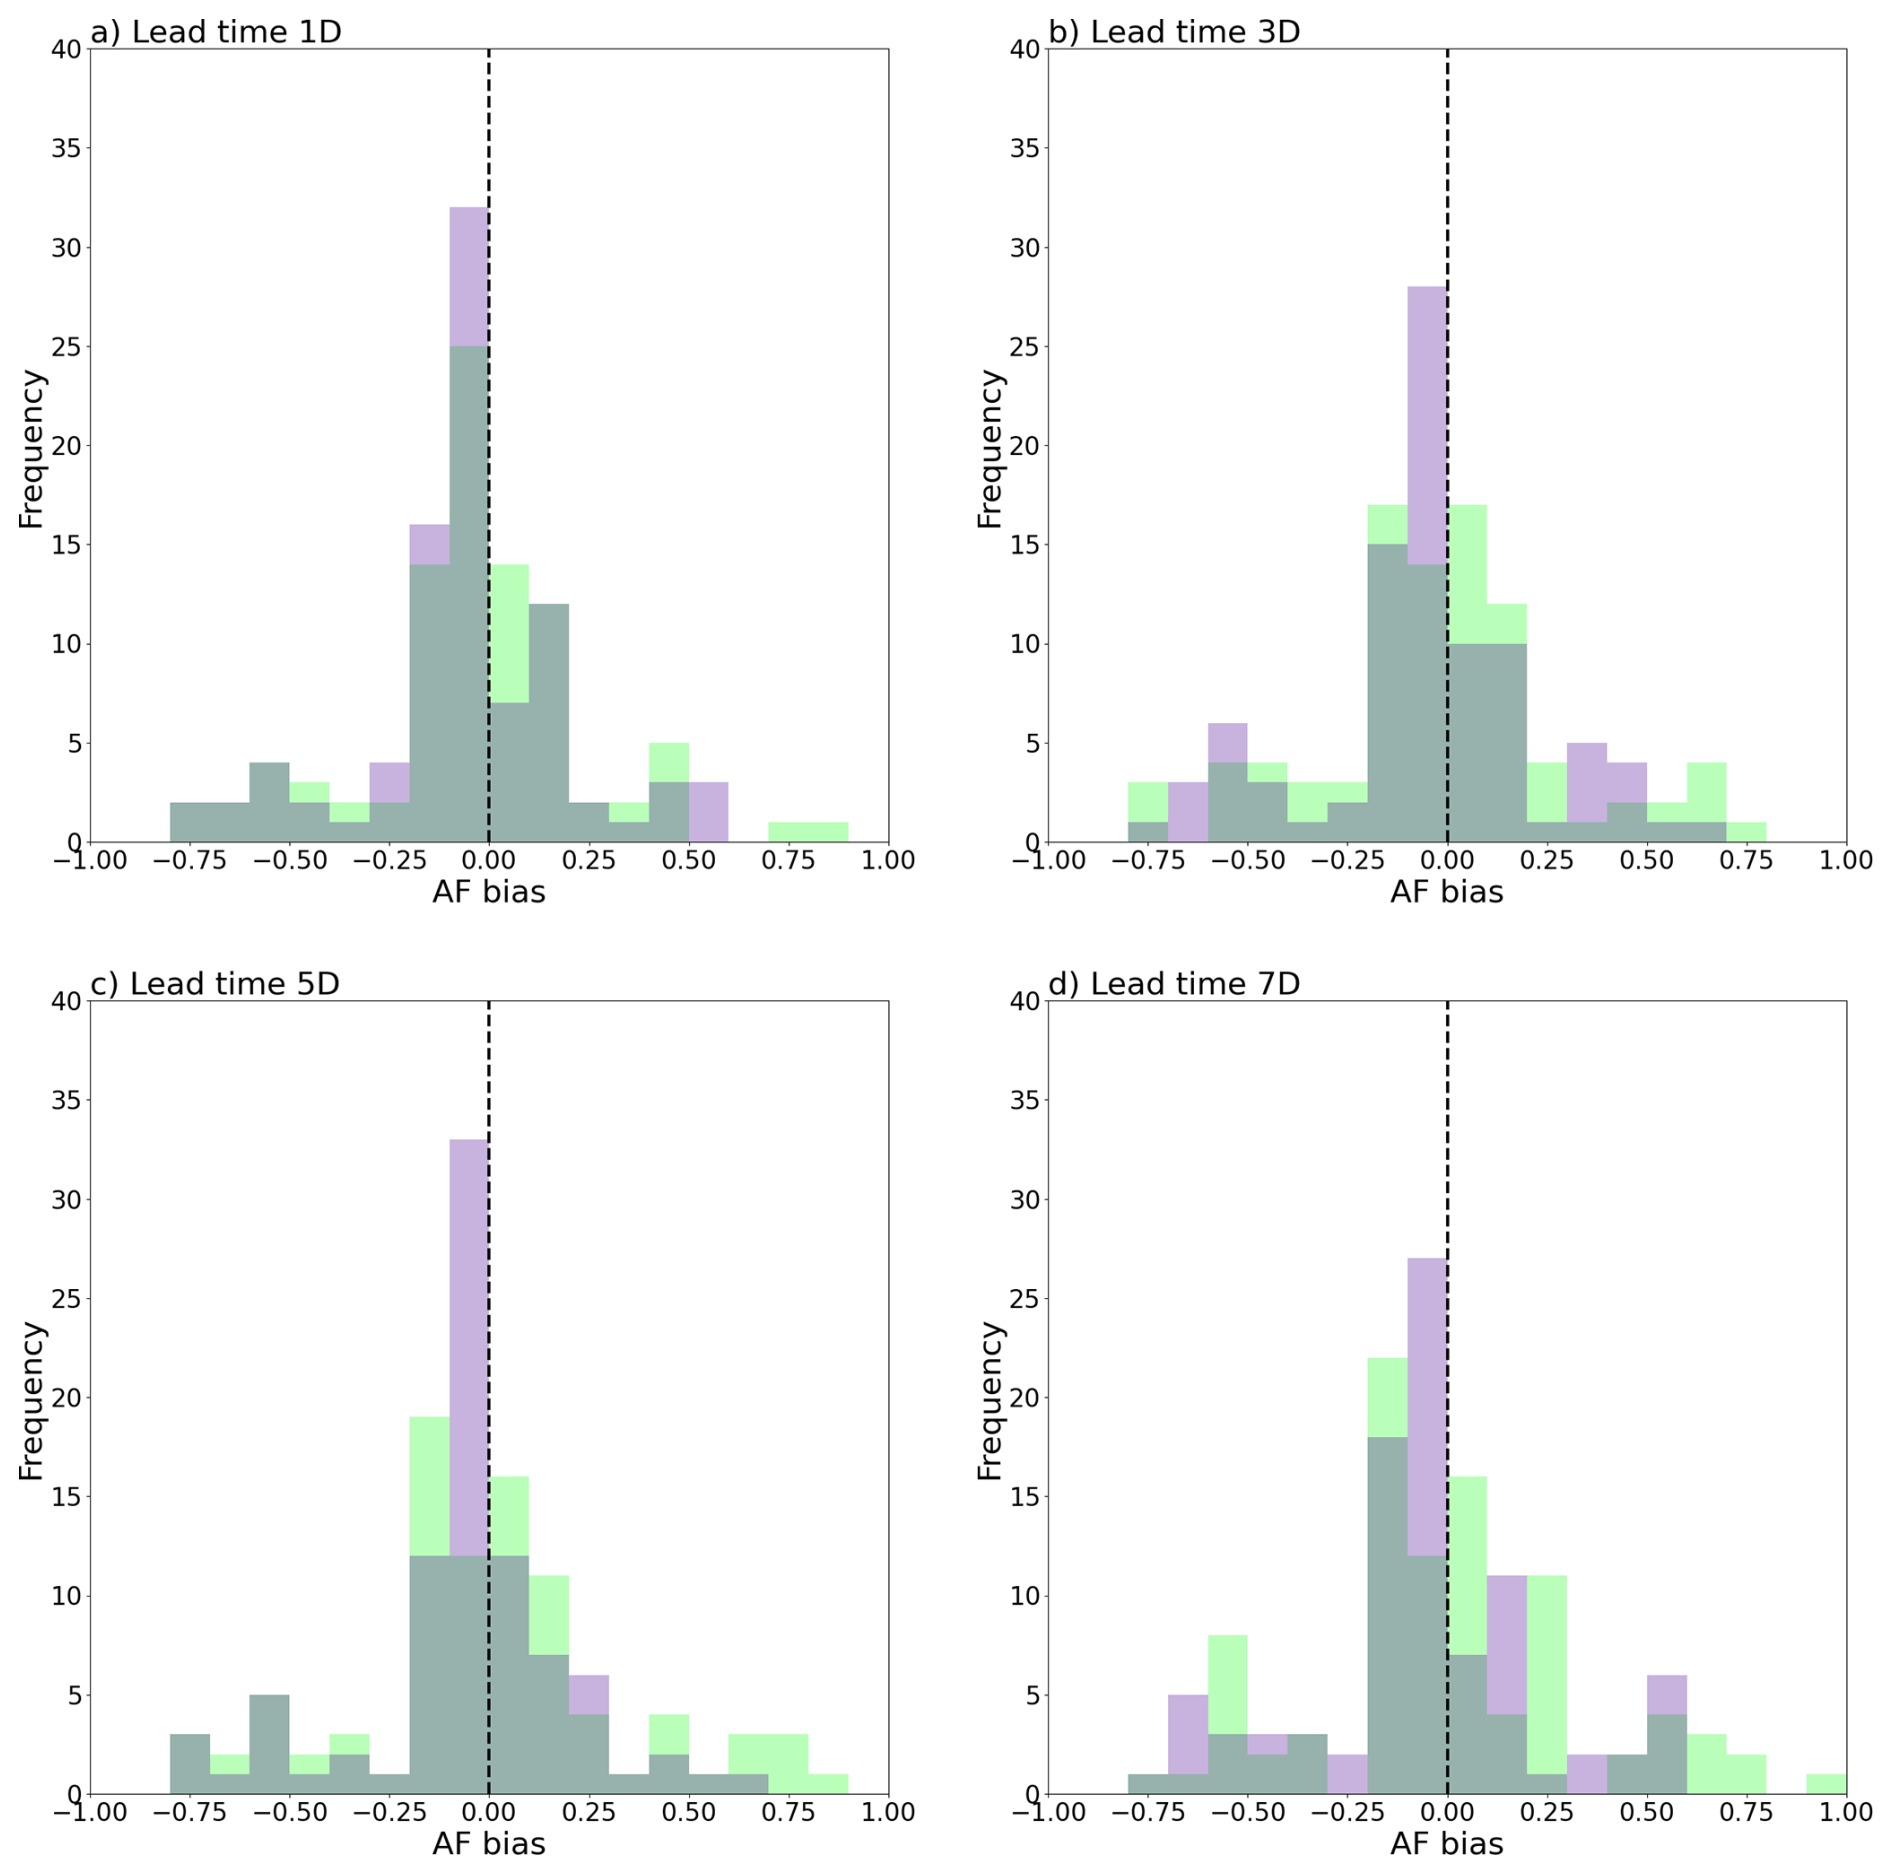
Figure A2Histogram of the distribution of AF forecast biases for lead times 1 d (a), 3 d (b), 5 d (c) and 7 d (d) for Rome. Green denotes the physics-based forecast whilst purple denotes the data-driven forecast.
Now we investigate for the presence of a systematic bias by looking at the relationship between AF forecast bias and temperature. We first consider our case study of Rome, before investigating population-weighted averages. As for Fig. 1c–f in the main text, Fig. A3a–d shows lower mean forecast bias for data-driven forecasts at all lead-times for Rome. No trend is evident with respect to temperature or lead time.
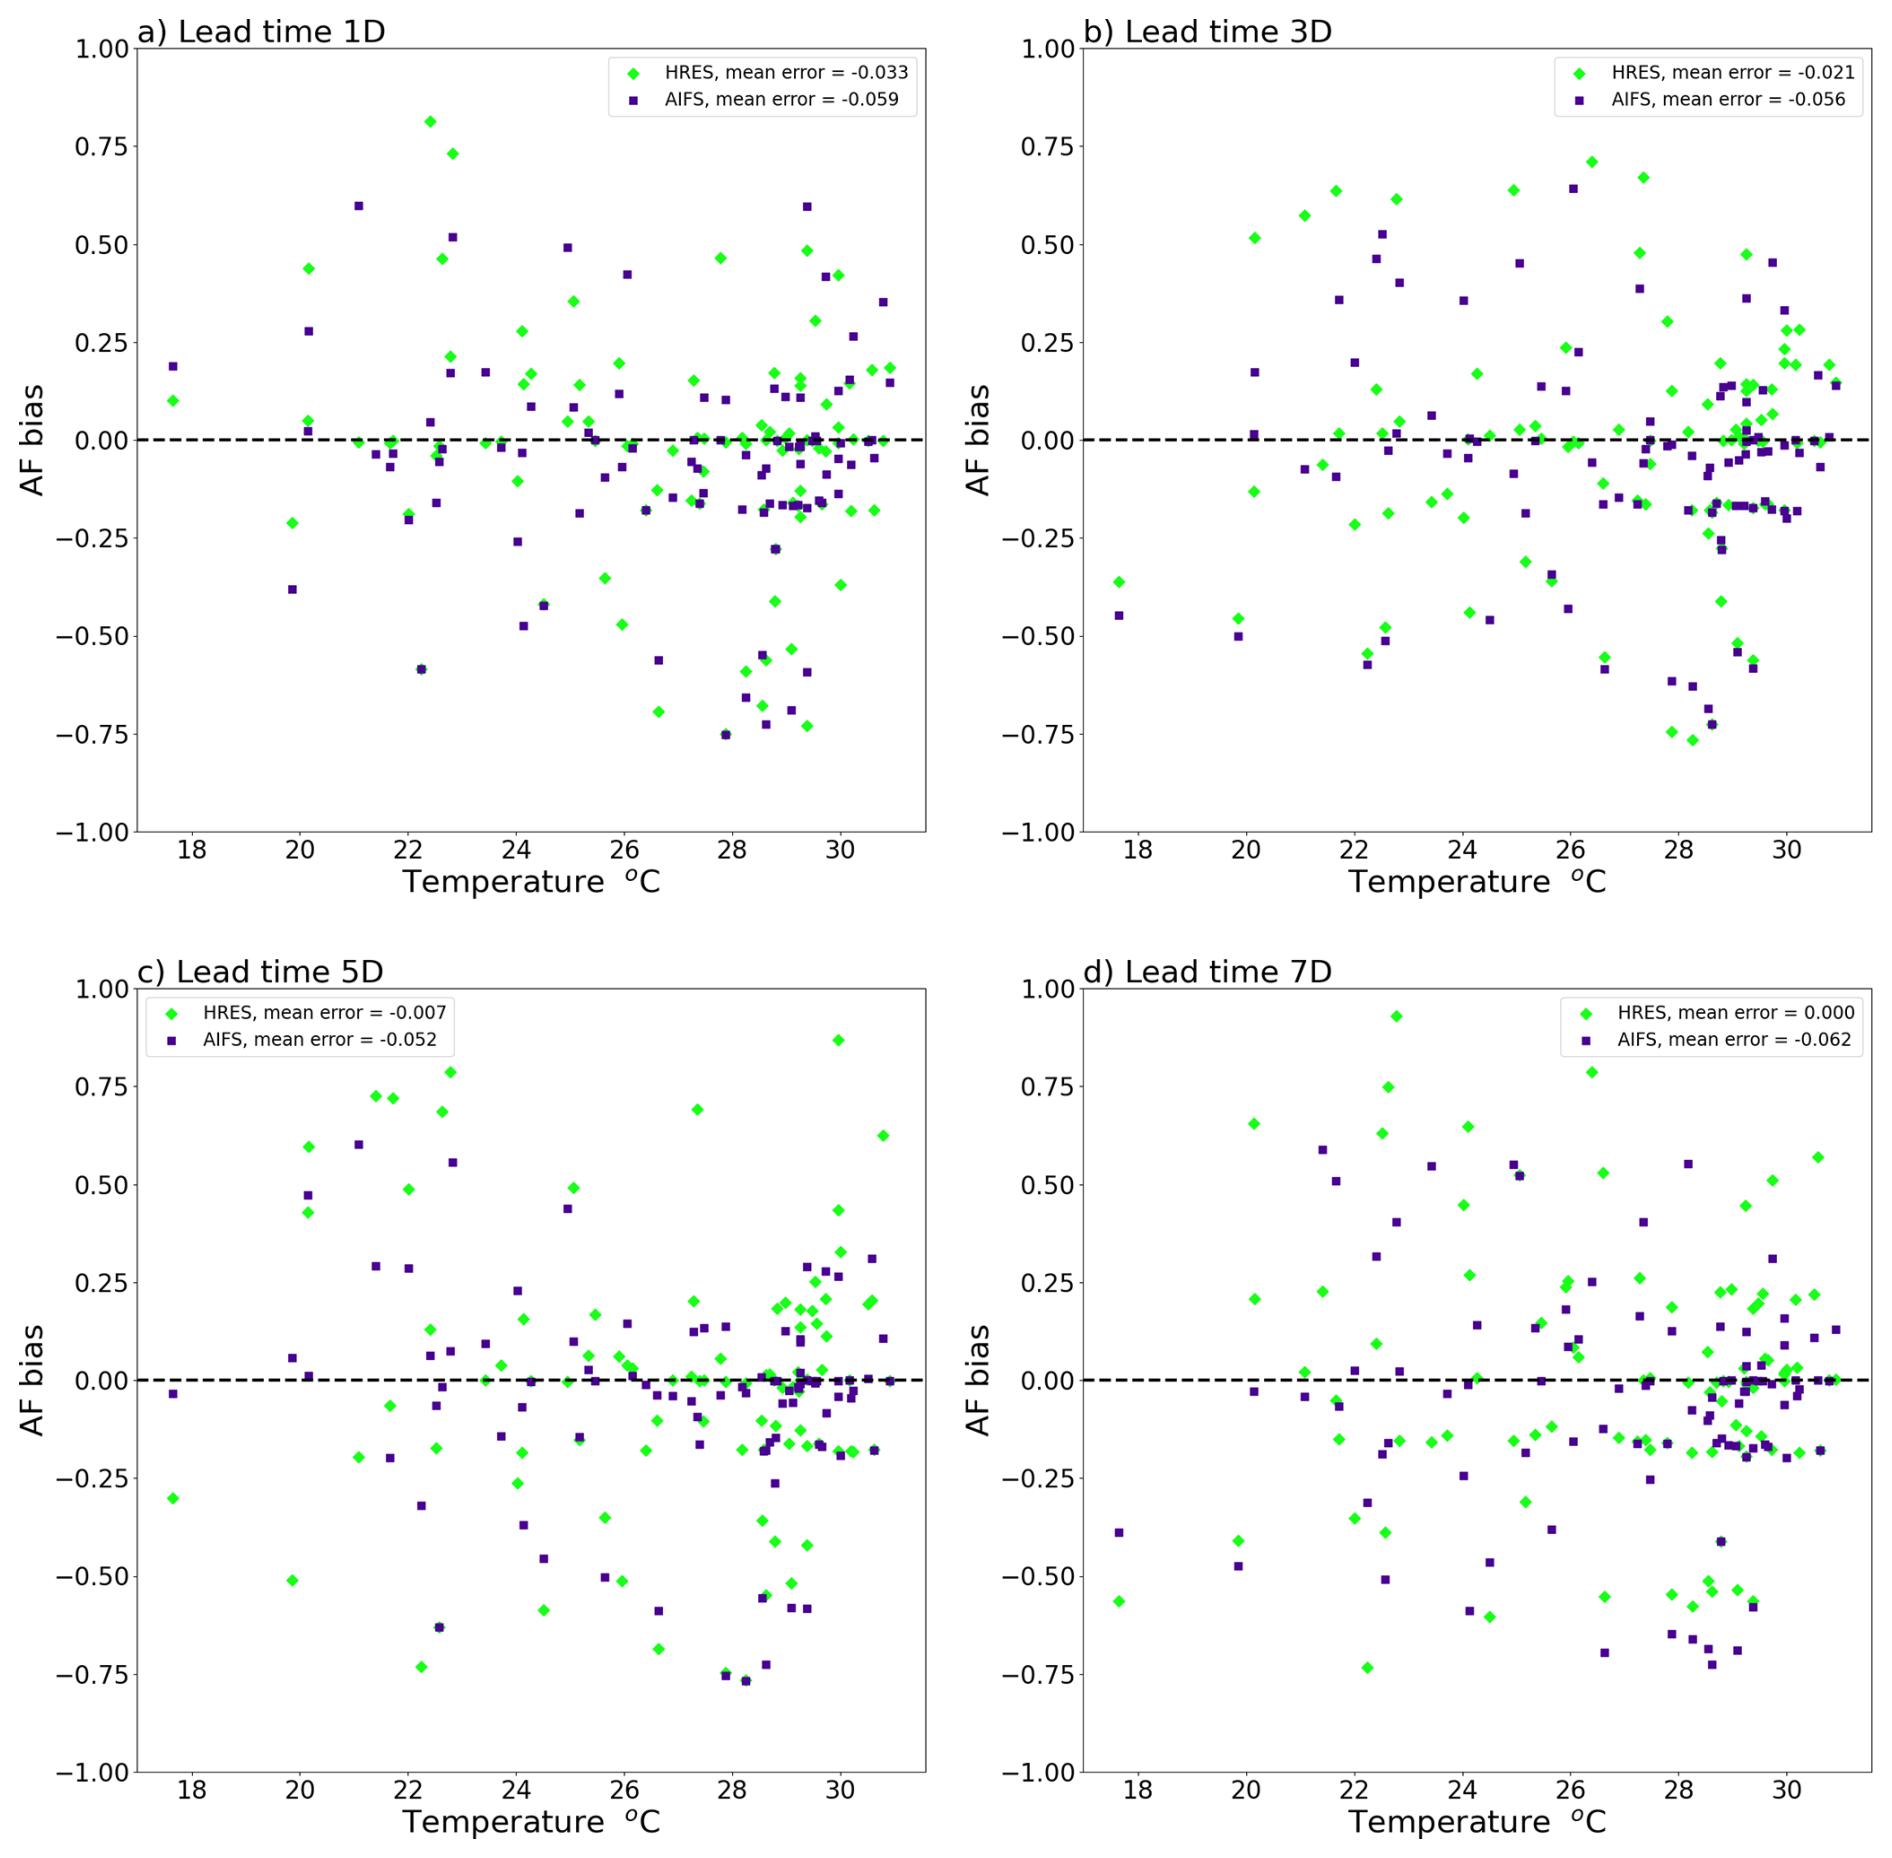
Figure A3Scatter plot of the AF forecast bias for Rome during the summer of 2024, where green denotes the physics-based forecast (HRES) and purple denotes the data-driven forecast (AIFS) (a–d). Lead times 1 d (a), 3 d (b), 5 d (c) and 7 d (d) are shown.
Repeating the analysis for the MAE we see a noisy signal across all lead times with no clearly visible trend (Fig. A4a–d).
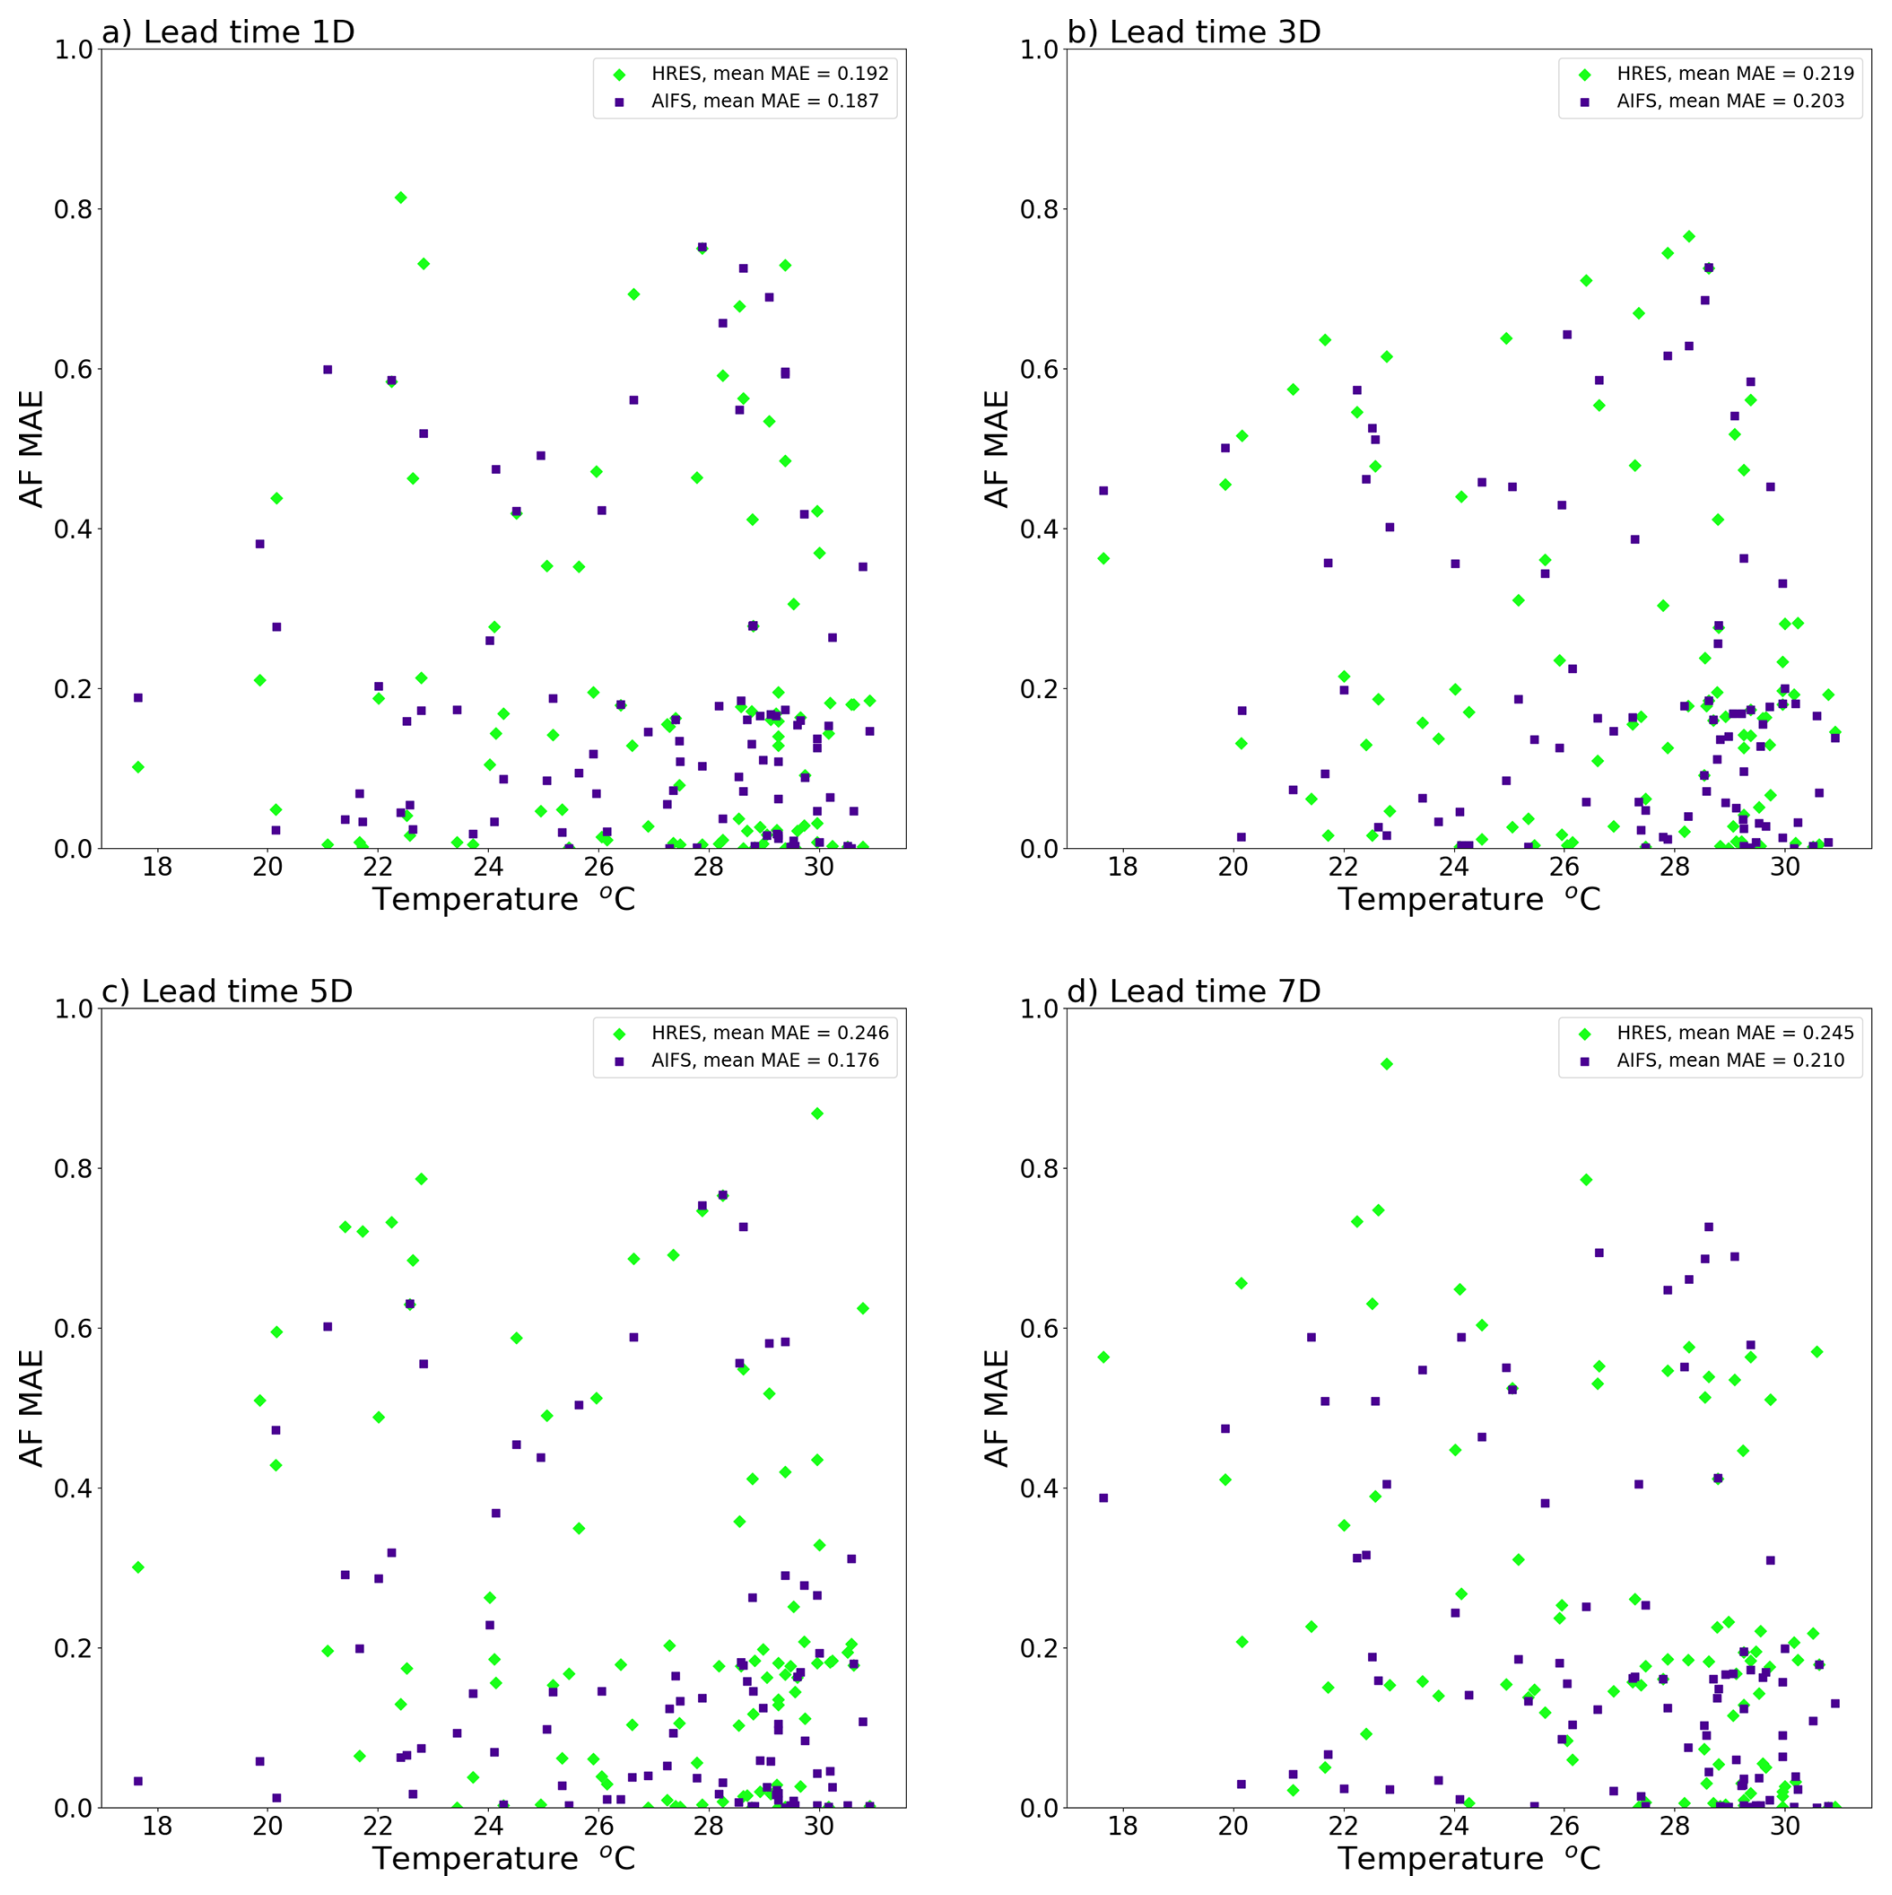
Figure A4Scatter plot of the AF forecast MAE vs. temperature for Rome durng the summer of 2024; green denotes the physics-based forecast (HRES) and purple denotes the data-driven forecast (AIFS) (a–d). Lead times 1 d (a), 3 d (b), 5 d (c) and 7 d (d) are shown.
The reanalysis and forecast data used in this study are freely available online (CC-BY 4.0) and were retrieved from ECMWF Copernicus at https://doi.org/10.24381/cds.adbb2d47 (Copernicus Climate Change Service, Climate Data Store, 2023) and MARS archives (https://www.ecmwf.int/en/forecasts/access-forecasts/access-archive-datasets, last access: 2 October 2026). The coefficients for the epidemiological analysis and population data were retrieved from https://doi.org/10.5281/zenodo.10288665 (Masselot and Gasparrini , 2023).
EH: formal analysis, software, investigation, visualisation, primary responsibility for writing of the original manuscript. EH and OL shared responsibility for conceptualisation, data curation methodology, review and editing, validation.
The contact author has declared that neither of the authors has any competing interests.
ECMWF does not accept any liability whatsoever for any error or omission in the data, their availability, or for any loss or damage arising from their use.
Publisher's note: Copernicus Publications remains neutral with regard to jurisdictional claims made in the text, published maps, institutional affiliations, or any other geographical representation in this paper. The authors bear the ultimate responsibility for providing appropriate place names. Views expressed in the text are those of the authors and do not necessarily reflect the views of the publisher.
EH gratefully acknowledges funding from the European Union's Horizon 2020 research and innovation programme , the Swedish Research Council Vetenskapsrådet, and the COST Action CA22162 FutureMed. LO thankfully acknowledges the support of the European Research Council (ERC) and the Swedish Research Council Vetenskapsrådet. The authors would like to thank Gabriele Messori for valuable discussions.
EH has been supported by the European Union's Horizon 2020 research and innovation programme under the Marie Skłodowska-Curie grant agreement no. 956396 (EDIPI – European weather extremes: drivers, predictability and impacts), the Swedish Research Council Vetenskapsrådet Grant Agreement No. 2022-06599 and 2022-03448 and the COST Action CA22162 FutureMed. LO has been supported by the European Research Council (ERC) under the European Union’s Horizon 2020 research and innovation programme (project CENÆ (“compound Climate Extremes in North America and Europe: from dynamics to predictability”); grant no. 948309) and of the Swedish Research Council Vetenskapsrådet (grant. no. 2022-06599).
The publication of this article was funded by the Swedish Research Council, Forte, Formas, and Vinnova.
This paper was edited by Henning Rust and reviewed by two anonymous referees.
Ballester, J., Quijal-Zamorano, M., Méndez Turrubiates, R. F., Pegenaute, F., Herrmann, F. R., Robine, J. M., Basagaña, X., Tonne, C., Antó, J. M., and Achebak, H.: Heat-related mortality in Europe during the summer of 2022, Nat. Med., 29, 1857–1866, https://doi.org/10.1038/s41591-023-02419-z, 2023. a
Bauer, P., Thorpe, A., and Brunet, G.: The quiet revolution of numerical weather prediction, Nature, 525, 47–55, https://doi.org/10.1038/nature14956, 2015. a
Bouallègue, Z. B., Clare, M. C. A., Magnusson, L., Gascón, E., Maier-Gerber, M., Janoušek, M., Rodwell, M., Pinault, F., Dramsch, J. S., Lang, S. T. K., Raoult, B., Rabier, F., Chevallier, M., Sandu, I., Dueben, P., Chantry, M., and Pappenberger, F.: The rise of data-driven weather forecasting: A first statistical assessment of machine learning-based weather forecasts in an operational-like context, B. Am. Meteorol. Soc., 105, E864–E883, https://doi.org/10.1175/BAMS-D-23-0162.1, 2024. a
Copernicus: Copernicus: Summer 2024 – Hottest on record globally and for Europe, Copernicus, https://climate.copernicus.eu/copernicus-summer-2024-hottest-record-globally-and-europe (last access: 4 December 2025), 2024. a
Copernicus Climate Change Service, Climate Data Store: ERA5 hourly data on single levels from 1940 to present, Copernicus Climate Change Service (C3S) Climate Data Store (CDS) [data set], https://doi.org/10.24381/cds.adbb2d47, 2023. a
Ebi, K. L., Capon, A., Berry, P., Broderick, C., de Dear, R., Havenith, G., Honda, Y., Kovats, R. S., Ma, W., Malik, A., Morris, N. B., Nybo, L., Seneviratne, S. I., Vanos, J., and Jay, O.: Hot weather and heat extremes: health risks, The Lancet, 398, 698–708, https://doi.org/10.1016/S0140-6736(21)01208-3, 2021. a
Ferreira Braga, A. L., Zanobetti, A., and Schwartz, J.: The Time Course of Weather-Related Deaths, Epidemiology, 12, 662–667, https://doi.org/10.1097/00001648-200111000-00014, 2001. a
Fischer, E. M., Seneviratne, S. I., Vidale, P. L., Lüthi, D., and Schär, C.: Soil moisture–atmosphere interactions during the 2003 European summer heat wave, J. Climate, 20, 5081–5099, 2007. a
Gallo, E., Quijal-Zamorano, M., Méndez Turrubiates, R. F., Tonne, C., Basagaña, X., Achebak, H., and Ballester, J.: Heat-related mortality in Europe during 2023 and the role of adaptation in protecting health, Nat. Med., 30, 3101–3105, https://doi.org/10.1038/s41591-024-03186-1, 2024. a, b
Gasparrini, A., Armstrong, B., and Kenward, M. G.: Distributed lag non-linear models, Stat. Med., 29, 2224–2234, https://doi.org/10.1002/sim.3940, 2010. a
Gasparrini, A., Guo, Y., Hashizume, M., Lavigne, E., Zanobetti, A., Schwartz, J., Tobias, A., Tong, S., Rocklöv, J., Forsberg, B., Leone, M., De Sario, M., Bell, M. L., Leon Guo, Y., Wu, C., Kan, H., Yi, S., de Sousa Zanotti Stagliorio Coehlo, M., Nascimento Saldiva, P. H., Honda, Y., Kim, H., and Armstrong, B.: Mortality risk attributable to high and low ambient temperature: a multicountry observational study, The Lancet, 386, 369–375, https://doi.org/10.1016/S0140-6736(14)62114-0, 2015. a, b
Hersbach, H., Bell, B., Berrisford, P., Hirahara, S., Horányi, A., Muñoz-Sabater, J., Nicolas, J., Peubey, C., Radu, R., Schepers, D., Simmons, A., Soci, C., Abdalla, S., Abellan, X., Balsamo, G., Bechtold, P., Biavati, G., Bidlot, J., Bonavita, M., De Chiara, G., Dahlgren, P., Dee, D., Diamantakis, M., Dragani, R., Flemming, J., Forbes, R., Fuentes, M., Geer, A., Haimberger, L., Healy, S., Hogan, R. J., Hólm, E., Janisková, M., Keeley, S., Laloyaux, P., Lopez, P., Lupu, C., Radnoti, G., de Rosnay, P., Rozum, I., Vamborg, F., Villaume, S., and Thépaut, J.-N.: The ERA5 global reanalysis, Q. J. R. Meteorol. Soc., 146, 1999–2049, https://doi.org/10.1002/qj.3803, 2020. a, b
Holmberg, E., Tietsche, S., and Messori, G.: Forecasting atmospheric persistence and implications for the predictability of temperature and temperature extremes, Q. J. R. Meteorol. Soc., 150, 5518–5534, https://doi.org/10.1002/qj.4885, 2024. a
Holmberg, E., Quijal-Zamorano, M., Ballester, J., and Messori, G.: Skillful heat-related mortality forecasting during recent deadly European summers, P. Natl. Acad. Sci., 122, https://doi.org/10.1073/pnas.2426516122, 2025. a, b, c
Huber, V., Breitner-Busch, S., Feldbusch, H., Frieler, K., He, C., Matthies-Wiesler, F., Mengel, M., Zhang, S., Peters, A., and Schneider, A.: Improvements in life expectancy mask rising trends in heat-related excess mortality attributable to climate change, Nat. Commun., 16, https://doi.org/10.1038/s41467-025-66681-0, 2025. a
Ingleby, B., Arduini, G., Balsamo, G., Boussetta, S., Ochi, K., Pinnington, E., and de Rosnay, P.: Improved two-metre temperature forecasts in the 2024 upgrade, ECMWF, https://www.ecmwf.int/en/newsletter/178/earth-system-science/improved-two-metre-temperature-forecasts-2024-upgrade (last access: 7 December 2025), 2024. a
Janoš, T., Quijal-Zamorano, M., Shartova, N., Gallo, E., Méndez Turrubiates, R. F., Denisse Beltrán Barrón, N., Peyrusse, F., and Ballester, J.: Heat-related mortality in Europe during 2024 and health emergency forecasting to reduce preventable deaths, Nat. Med., 31, https://doi.org/10.1038/s41591-025-03954-7, 2025. a, b, c
Jay, O., Capon, A., Berry, P., Broderick, C., de Dear, R., Havenith, G., Honda, Y., Kovats, R. S., Ma, W., Malik, A., Morris, N. B., Nybo, L., Seneviratne, S. I., Vanos, J., and Ebi, K. L.: Reducing the health effects of hot weather and heat extremes: from personal cooling strategies to green cities, The Lancet, 398, 709–724, https://doi.org/10.1016/S0140-6736(21)01209-5, 2021. a
Lüthi, S., Fairless, C., Fischer, E. M., Scovronick, N., Armstrong, B., Coelho, M. D. S. Z. S., Guo, Y. L., Guo, Y., Honda, Y., Huber, V., Kyselý, J., Lavigne, E., Royé, D., Ryti, N., Silva, S., Urban, A., Gasparrini, A., Bresch, D. N., and Vicedo-Cabrera, A. M.: Rapid increase in the risk of heat-related mortality, Nat. Commun., 14, 4894, https://doi.org/10.1038/s41467-023-40599-x, 2023. a
Lüthi, S., Huber, V., Pascal, M., Beyerle, U., Pyrina, M., Domeisen, D., Fischer, E. M., and Vicedo-Cabrera, A. M.: Storylines for month-long heatwaves and associated heat-related mortality impacts over Western Europe, Research Square [preprint], https://doi.org/10.21203/rs.3.rs-5356341/v1, 2024. a
Martínez-Solanas, È., Rodó, X., Herrmann, F., Robine, J., Petrova, D., and Ballester, J.: An integrated heat early warning system for Europe, Environ. Epidemiol., 3, 262–263, 2019. a
Masselot, P. and Gasparrini, A.: Temperature-related mortality exposure-response functions for 854 cities in Europe, Version 2.0.0, Zenodo [data set], https://doi.org/10.5281/zenodo.10288665, 2023. a
Masselot, P., Mistry, M., Vanoli, J., Schneider, R., Iungman, T., Garcia-Leon, D., Ciscar, J. C., Feyen, L., Orru, H., Urban, A., Breitner, S., Huber, V., Schneider, A., Samoli, E., Stafoggia, M., De'Donato, F., Rao, S., Armstrong, B., Nieuwenhuijsen, M., Vicedo-Cabrera, A. M., Gasparrini, A., Achilleos, S., Kyselý, J., Indermitte, E., Jaakkola, J. J., Ryti, N., Pascal, M., Katsouyanni, K., Analitis, A., Goodman, P., Zeka, A., Michelozzi, P., Houthuijs, D., Ameling, C., das Neves Pereira da Silva, S., Madureira, J., Holobaca, I. H., Tobias, A., Íñiguez, C., Forsberg, B., Åström, C., Ragettli, M. S., Zafeiratou, S., Vazquez Fernandez, L., Monteiro, A., Rai, M., Zhang, S., and Aunan, K.: Excess mortality attributed to heat and cold: a health impact assessment study in 854 cities in Europe, The Lancet Planetary Health, 7, e271–e281, https://doi.org/10.1016/S2542-5196(23)00023-2, 2023. a, b, c, d, e, f, g
Masselot, P., Mistry, M. N., Rao, S., Huber, V., Monteiro, A., Samoli, E., Stafoggia, M., De'Donato, F., Garcia-Leon, D., Ciscar, J. C., Feyen, L., Schneider, A., Katsouyanni, K., Vicedo-Cabrera, A. M., Aunan, K., and Gasparrini, A.: Estimating future heat-related and cold-related mortality under climate change, demographic and adaptation scenarios in 854 European cities, Nat. Med., 31, https://doi.org/10.1038/s41591-024-03452-2, 2025. a
Merz, B., Kuhlicke, C., Kunz, M., Pittore, M., Babeyko, A., Bresch, D. N., Domeisen, D. I. V., Feser, F., Koszalka, I., Kreibich, H., Pantillon, F., Parolai, S., Pinto, J. G., Punge, H. J., Rivalta, E., Schröter, K., Strehlow, K., Weisse, R., and Wurpts, A.: Impact Forecasting to Support Emergency Management of Natural Hazards, Rev. Geophys., 58, https://doi.org/10.1029/2020RG000704, 2020. a
Olivetti, L. and Messori, G.: Advances and prospects of deep learning for medium-range extreme weather forecasting, Geosci. Model Dev., 17, 2347–2358, https://doi.org/10.5194/gmd-17-2347-2024, 2024a. a, b
Olivetti, L. and Messori, G.: Do data-driven models beat numerical models in forecasting weather extremes? A comparison of IFS HRES, Pangu-Weather, and GraphCast, Geosci. Model Dev., 17, 7915–7962, https://doi.org/10.5194/gmd-17-7915-2024, 2024b. a
Pasche, O. C., Wider, J., Zhang, Z., Zscheischler, J., and Engelke, S.: Validating Deep Learning Weather Forecast Models on Recent High-Impact Extreme Events, Artificial Intelligence for the Earth Systems, 4, https://doi.org/10.1175/AIES-D-24-0033.1, 2025. a
Persson, A. and Grazzini, F.: User Guide to ECMWF forecast products 4.0, Meteorological Bulletin, 3, https://doi.org/10.21957/m1cs7h 2007. a
Price, I., Sanchez-Gonzalez, A., Alet, F., Andersson, T. R., El-Kadi, A., Masters, D., Ewalds, T., Stott, J., Mohamed, S., Battaglia, P., Lam, R., and Willson, M.: Probabilistic weather forecasting with machine learning, Nature, 637, 84–90, https://doi.org/10.1038/s41586-024-08252-9, 2025. a
Quijal-Zamorano, M., Petrova, D., Martínez-Solanas, E., Herrmann, F. R., Rodó, X., Robine, J.-M., Marí-Dell'Olmo, M., Achebak, H., and Ballester, J.: Forecast skill assessment of an operational continental heat-cold-health forecasting system: New avenues for health early warning systems, Sci. Adv., 10, https://doi.org/10.1126/sciadv.ado5286, 2024. a, b
Rasp, S., Hoyer, S., Merose, A., Langmore, I., Battaglia, P., Russell, T., Sanchez-Gonzalez, A., Yang, V., Carver, R., Agrawal, S., Chantry, M., Ben Bouallegue, Z., Dueben, P., Bromberg, C., Sisk, J., Barrington, L., Bell, A., and Sha, F.: WeatherBench 2: A Benchmark for the Next Generation of Data-Driven Global Weather Models, J. Adv. Model. Earth Sy., 16, https://doi.org/10.1029/2023MS004019, 2024. a
Robine, J.-M., Cheung, S. L. K., Le Roy, S., Van Oyen, H., Griffiths, C., Michel, J.-P., and Herrmann, F. R.: Death toll exceeded 70 000 in Europe during the summer of 2003, Comptes Rendus. Biologies, 331, 171–178, 2008. a
Schwartz, J.: The distributed lag between air pollution and daily deaths, Epidemiology, 11, 320–326, https://journals.lww.com/epidem/fulltext/2000/05000/the_distributed_lag_between_air_pollution_and.16.aspx (last access: 2 October 2026), 2000. a
Sun, Y. Q., Hassanzadeh, P., Zand, M., Chattopadhyay, A., Weare, J., and Abbot, D. S.: Can AI weather models predict out-of-distribution gray swan tropical cyclones?, P. Natl. Acad. Sci., 122, https://doi.org/10.1073/pnas.2420914122, 2025. a
Vanos, J., Guzman-Echavarria, G., Baldwin, J. W., Bongers, C., Ebi, K. L., and Jay, O.: A physiological approach for assessing human survivability and liveability to heat in a changing climate, Nat. Commun., 14, 1–14, https://doi.org/10.1038/s41467-023-43121-5, 2023. a
Vicedo-Cabrera, A. M., Scovronick, N., Sera, F., Royé, D., Schneider, R., Tobias, A., Astrom, C., Guo, Y., Honda, Y., Hondula, D. M., Abrutzky, R., Tong, S., Coelho, M. d. S. Z. S., Saldiva, P. H., Lavigne, E., Correa, P. M., Ortega, N. V., Kan, H., Osorio, S., Kyselý, J., Urban, A., Orru, H., Indermitte, E., Jaakkola, J. J., Ryti, N., Pascal, M., Schneider, A., Katsouyanni, K., Samoli, E., Mayvaneh, F., Entezari, A., Goodman, P., Zeka, A., Michelozzi, P., De'Donato, F., Hashizume, M., Alahmad, B., Diaz, M. H., Valencia, C. D. L. C., Overcenco, A., Houthuijs, D., Ameling, C., Rao, S., Di Ruscio, F., Carrasco-Escobar, G., Seposo, X., Silva, S., Madureira, J., Holobaca, I. H., Fratianni, S., Acquaotta, F., Kim, H., Lee, W., Iniguez, C., Forsberg, B., Ragettli, M. S., Guo, Y. L., Chen, B. Y., Li, S., Armstrong, B., Aleman, A., Zanobetti, A., Schwartz, J., Dang, T. N., Dung, D. V., Gillett, N., Haines, A., Mengel, M., Huber, V., and Gasparrini, A.: The burden of heat-related mortality attributable to recent human-induced climate change, Nat. Clim. Change, 11, 492–500, https://doi.org/10.1038/s41558-021-01058-x, 2021. a
Virtanen, P., Gommers, R., Oliphant, T. E., Haberland, M., Reddy, T., Cournapeau, D., Burovski, E., Peterson, P., Weckesser, W., Bright, J., van der Walt, S. J., Brett, M., Wilson, J., Millman, K. J., Mayorov, N., Nelson, A. R. J., Jones, E., Kern, R., Larson, E., Carey, C. J., Polat, İ., Feng, Y., Moore, E. W., VanderPlas, J., Laxalde, D., Perktold, J., Cimrman, R., Henriksen, I., Quintero, E. A., Harris, C. R., Archibald, A. M., Ribeiro, A. H., Pedregosa, F., van Mulbregt, P., and SciPy 1.0 Contributors: SciPy 1.0: Fundamental Algorithms for Scientific Computing in Python, Nat. Methods, 17, 261–272, https://doi.org/10.1038/s41592-019-0686-2, 2020. a, b
Xu, W., Chen, K., Han, T., Chen, H., Ouyang, W., and Bai, L.: ExtremeCast: Boosting Extreme Value Prediction for Global Weather Forecast, arXiv [preprint], https://doi.org/10.48550/arXiv.2402.01295, 2024. a
Zhang, Z., Fischer, E., Zscheischler, J., and Engelke, S.: Physics-based models outperform AI weather forecasts of record-breaking extremes, Sci. Adv., 12, https://doi.org/10.1126/sciadv.aec1433, 2026. a
Zhao, T., Li, Q., Tu, T., and Chen, X.: An extension of WeatherBench 2 to binary hydroclimatic forecasts, Geosci. Model Dev., 18, 5781–5799, https://doi.org/10.5194/gmd-18-5781-2025, 2025. a