
the Creative Commons Attribution 4.0 License.
the Creative Commons Attribution 4.0 License.
 | 02 Oct 2026
Brief communication: Rise of the Guadalupe River – a multifaceted post event analysis of 4 July 2025, flood in Central Texas
Anupal Baruah

Dinuke Munasinghe
Mohamed Abdelkader
Dipsikha Devi
Yixian Chen
Humberto Vergara
Riley McDermott
The flash flooding across Central Texas on 4 July 2025, caused more than 130 fatalities and property losses exceeding USD 20 billion. The objective of this study is to evaluate the performance of the NOAA operational flood forecasting pipeline, including Quantitative Precipitation Forecasts, National Water Model short-range streamflow forecasts, and Office of Water Prediction flood inundation mapping during this catastrophic event, and to characterize how forecast skill and impact-based predictions varied with forecast lead time at gauged and ungauged locations. Using the Operational National Water Model short-range streamflow forecast product, we generated 306 forecasted flood inundation maps between 3 and 4 July 2025. For evaluation, we constructed an inundation extent benchmark derived from USGS high water marks. Both impact based and skill-based assessments are presented.
- Article
(5373 KB) - Full-text XML
-
Supplement
(4530 KB) - BibTeX
- EndNote


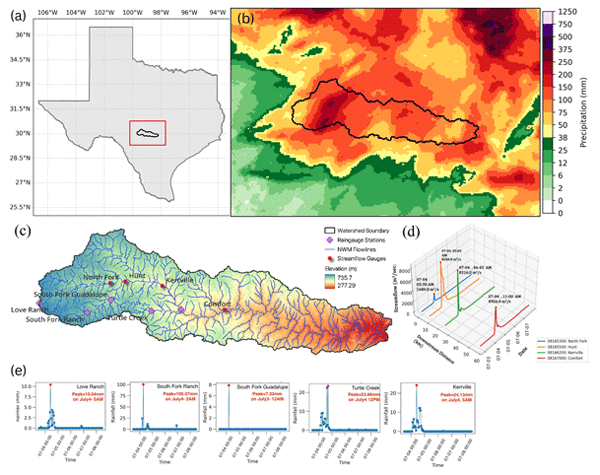
On 4 July at dawn, a catastrophic flash flood hit Kerr and Kendall Counties in Texas, claiming at least 135 lives, making it one of the deadliest inland flooding events in United States history (https://psl.noaa.gov/news/2025/texasfloods.html, last access: 25 September 20226). The event was triggered by intense rainfall up to 76–100 mm (3–4 in.) per hour in some of the impacted areas, causing flash flooding with exceptionally high peaks throughout the Guadalupe River basin. The Texas Hill Country, including Kerr and Kendall County, is prone to flash flooding, known as “Flash Flood Alley” (Saharia et al., 2017), partly due to the geomorphology of the area, having steep slopes and clay-rich soils, which result in high runoff rates (Sharif et al., 2010). Based on United States Geological Survey (USGS) streamflow observations, extreme flows were recorded downstream of the confluence of the South Fork Guadalupe River and the North Fork River (Fig. 1d). At Hunt (Gage ID: 08615500), the streamflow reached 8260.8 m3 s−1 at 05:05 AM, far exceeding the 500-year return period flow of 4160.8 m3 s−1. A significant portion of this peak was contributed by the ungauged South Fork Guadalupe River, which caused numerous fatalities near Camp Mystic (Nevitt, 2025). Further downstream, at Kerrville, the streamflow peaked at 8316.0 m3 s−1 at 06:45 AM, crossing the 500-year return period flow of 7937.6 m3 s−1. Apart from the peak values, the hydrographs at both upstream gauge stations exhibited exceptionally short times to peak, reaching the 500-year return period level within just 1–1.5 h. This rapid rise of flow is indicative of extremely high runoff response, amplifying the severity of the event.
The main motivation of this study was to utilize the operational forecast pipeline and conduct an extensive impact-based and categorical assessment of the event across different forecast hours against a high-water-mark-derived benchmark FIM. We employed the National Weather Service (NWS) National Water Model (NWM) short-range forecast (Cosgrove et al., 2024) and the FIMserv tool (Baruah et al., 2025) to generate 306 FIMs at the Hydrologic Unit Code (HUC)-8 scale. Additionally, we developed a methodology to use post-event USGS observed high-water marks to create a spatially continuous FIM benchmark for evaluating the forecast FIMs. We investigate the trade-off between NWM forecast range and the reliability of flood impact predictions and translate the forecast error into meaningful information by quantifying building-level impacts in addition to standard skill-based metrics. Specifically, we examined how FIM forecast skill, including building-level impacts, varied with respect to different forecast hours at five different locations (four streamflow gauges and near Camp Mystic).

Figure 1(a) Geographical location of the study area, (b) MRMS-derived total precipitation between 4–6 July 2025, (c) locations of USGS streamflow and rainfall gauges, (d) Gauge streamflow records along the reach, and (e) hourly rainfall time series.
Between 3 and 6 July 2025, the Texas Hill County region experienced an extraordinary rainfall amounts that produced catastrophic flash flooding along the Guadalupe River (Fig. 1a–c). The event was initiated by remnant moisture from Tropical Storm Barry, which had made landfall in Mexico days earlier, and was further intensified by a mesoscale convective vortex embedded within a persistent mid-level trough. These factors, combined with a strengthening low-level jet to sustain widespread convection, favor back-building successive thunderstorms across the Hill County (WPC, 2025). Hourly precipitation amounts from the Multi-Radar Multi-Sensor (MRMS) gauge-corrected Quantitative Precipitation Estimates (QPE) product (Zhang et al., 2016), along with rain gauge observations, reveal accumulations exceeding 500 mm (20 in.) in parts of the upper Guadalupe basin between 3 to 6 July (Fig. 1b). Rainfall intensities surpassed 100-year return period thresholds for durations ranging from 3 to 24 h at the rainfall gauges when compared against NOAA Atlas 14 precipitation frequency curves (Perica et al., 2018; NSSL, 2025). One of the most severe bursts occurred between 02:00 and 05:00 AM on 4 July, when localized rainfall rates reached 100 mm h−1 (Fig. 1e and Fig. S2 in the Supplement). The persistence of convective regeneration amplified accumulations and produced rainfall totals approaching 460 mm in some localized areas on 4 July. Gauge records showed peaks at stations in the western part of the basin that aligned with MRMS QPE observations, where total precipitation indicated higher accumulations (Figs. 1b, e, S2).
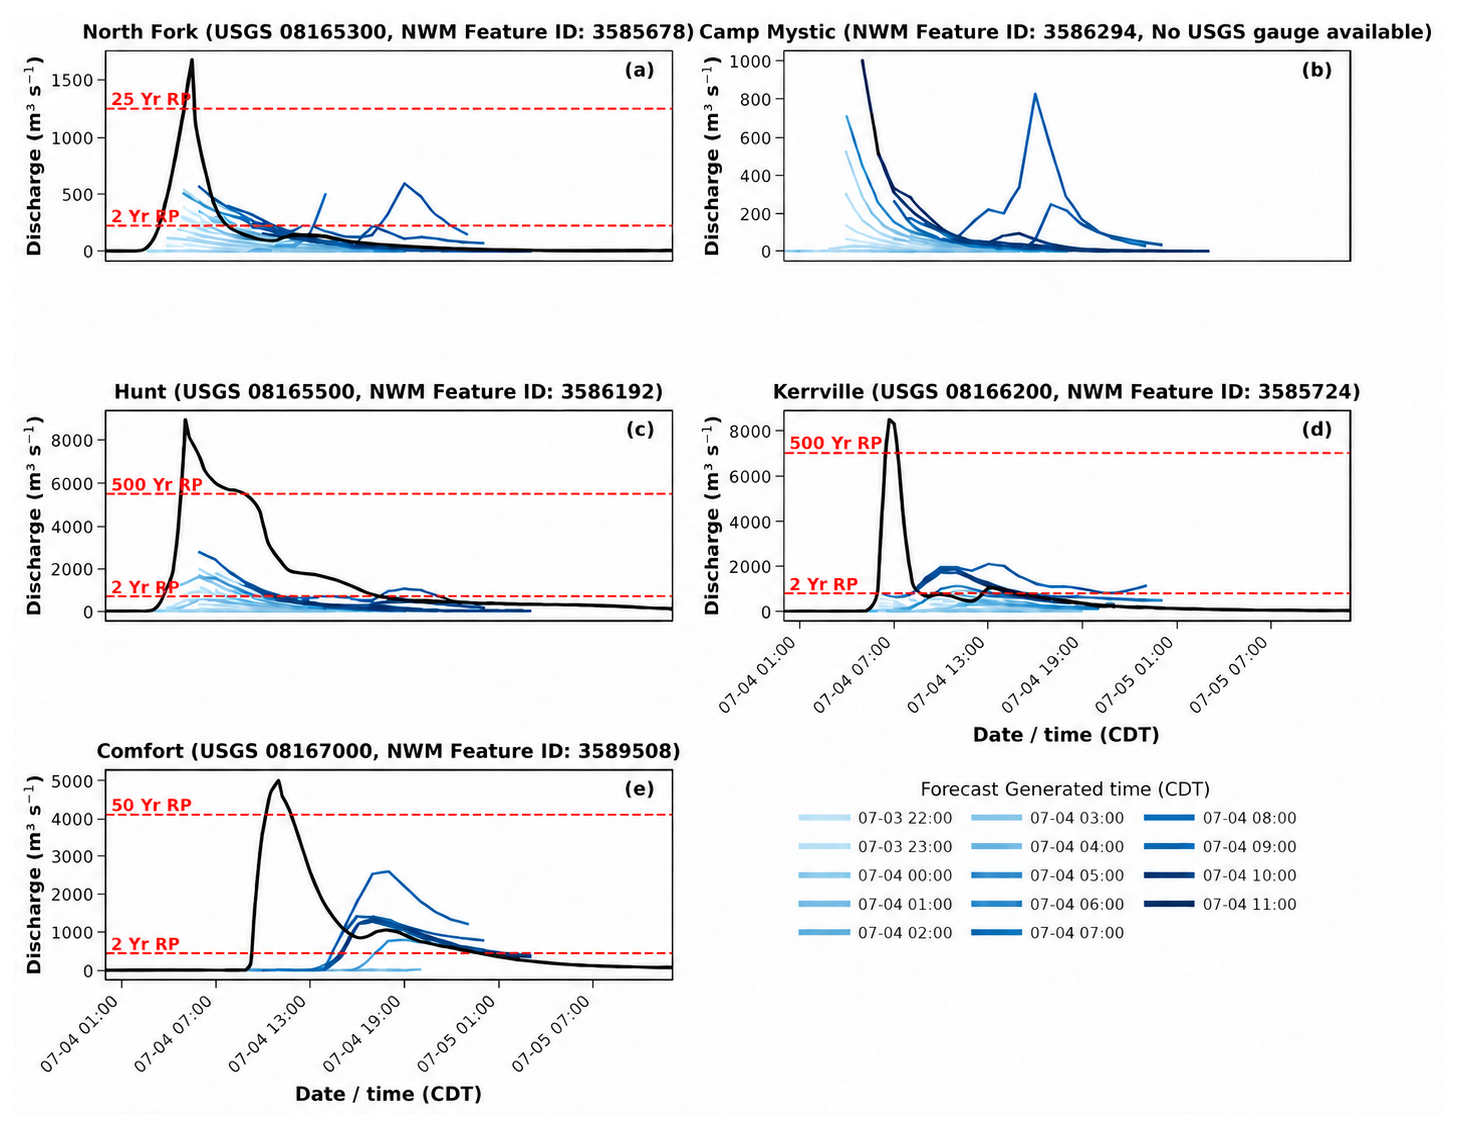
Figure 2NWM short-range forecast at different lead times at (a) North Fork (b) Camp Mystic (c) Hunt (d) Kerrville and (e) Comfort. Near Camp Mystic, there is no USGS gauge data available. The different shades of blue color indicate the Short-Range forecast generated at different hour and red dash line indicates the return period flow for the associated USGS gauges.
The NWM short-range forecasts (SRF) provide hourly streamflow predictions extending to 18 h forecast range https://water.noaa.gov/about/nwm (last access: 25 September 2026). We identified the NWM flowlines (feature_id) that intersect with the USGS gauges and downloaded the SRF generated from 10:00 PM, 3 July till 02:00 PM, 4 July using FIMserv (Fig. 2). At North Fork (peak at 05:30 AM), earlier SRFs show no flooding conditions, but there is a sudden jump on the forecast generated on 4 July, between 04:00 to 07:00 AM (120 to 600 m3 s−1). Near Camp Mystic, for which we do not have a USGS gauge, the forecast for 04:00 AM in South Fork Guadalupe River predicted a peak of 750 m3 s−1. A Zoom-in view of the generated forecast closer to the event is shown in Fig. S1. At Hunt (peak at 05:05 AM), the forecast generated for 04:00 AM indicates a possibility that flow will cross 500 m3 s−1 (above 2 Year RP flow of 266.08 m3 s−1) in the next 2 h, while the forecast generated for 05:00 AM, reaches the 10-year RP (1276.52 m3 s−1). At this Station (USGS 08165500), the peak discharge was recorded approximately at 05:00 AM CDT on 4 July 2025, while the upstream gauge on the North Fork Guadalupe River (USGS 08165300) peaked roughly 1 h later, at 06:00 CDT. As shown in Fig. 1a, the Hunt gauge is located immediately downstream of the confluence of the North Fork and South Fork branches of the Guadalupe River. The observed flow at the North Fork gauge, did not exceed the 25-year return-period, whereas the peak at Hunt exceeded the 500-year return-period level. This huge difference cannot be explained by inflow from the North Fork River alone and is consistent only with a substantial contribution from the South Fork Guadalupe River, which drains the Camp Mystic catchment and joins the North Fork just upstream of the Hunt gauge. Since no operational USGS stream gauge existed at that time on the South Fork reach, the streamflow contribution from the South Fork River cannot be directly verified from in-situ observations. However, the timing of the peak and the spatial distribution of rainfall during the event strongly indicate that the South Fork River was the dominant contributor to the very high flashy streamflow peak at Hunt. Further downstream, at Kerrville (peak at 06:45 AM), there was no indication of a high flow event; however, the forecast generated for 06:00 AM shows that flow will exceed the 2-year return period flow (284.22 m3 s−1). At Comfort (peak at 11:00 AM), the initial forecast shows low flows, while the forecast generated after 10:00 AM indicates that flow will exceed the 10-year RP flow (1842.73 m3 s−1), and the subsequent forecast follows the same trend.
Overall, the NWM SRF deviated substantially from the USGS observations in this case (Fig. 2). These underpredictions in NWM SRF during the flood event were strongly affected by two primary sources of uncertainty: (1) Inconsistency in the location and magnitude of precipitation rates in the precipitation forcing from the High-Resolution Rapid Refresh (HRRR) model leading up to the event, and (ii) the failure of USGS stream gauges used for data assimilation. The NWM short-range configuration relies on HRRR Quantitative Precipitation Forecast (QPF) at 3 km resolution (Dowel et al., 2022), to drive streamflow forecast.
A rainfall-to-rainfall comparison between the HRRR-QPF and MRMS (QPE) indicated a notable underestimation in the HRRR rainfall forecasts (Fig. S3). When QPF underestimates or spatially misplaces convective rainfall cells, the resulting simulated discharge and flood peaks are either lower in magnitude or displaced in time and location relative to a reference data series (Krajewski et al., 2025; Vergara et al., 2023). This bias has a pronounced effect on streamflow forecasts, especially for small basins (typically smaller than 1000 km2) that are prone to flash flooding. Although a full atmospheric diagnostic of HRRR is beyond the scope of this Brief Communication, the systematic limitations of operational HRRR forecasts of warm-season convective rainfall are well documented in the literature and provide important context for the underprediction reported here. James et al. (2022) report regional warm-season precipitation biases over the southern and central United States, including a tendency for HRRR to dissipate nocturnal mesoscale convective systems over the Mississippi and southern Plains region too rapidly. Min et al. (2021) document a seasonally dependent warm and dry near-surface bias in HRRR during the warm season and an associated 2 to 4 h lag in the diurnal evolution of forecast convective available potential energy (CAPE) relative to Atmospheric Emitted Radiance Interferometer (AERI) observations. This lag time has been attributed in part to the representation of sub-grid clouds and the planetary boundary layer and that is directly relevant to the timing of convective initiation. Bytheway et al. (2017) and Bytheway and Kummerow (2015) document object-based precipitation displacement errors in HRRR warm-season QPF on the order of 100 to 150 km, with no systematic geographical preference but with the largest errors over the southeastern United States. Kiel et al. (2022) similarly find centroid displacement errors and a slow propagation bias for some convective systems in the HRRR ensembles. Henderson et al. (2021) show that HRRR convective initiation is frequently mistimed relative to GOES-16 brightness-temperature evolution. Chen et al. (2024) further document that HRRR systematically struggles with the spatial organization of warm-season precipitation modes. In a nutshell, the errors QPE impacting the FIM forecast could be attributed to (i) localized convective rainfall rates can be substantially underestimated when nocturnal MCSs dissipate prematurely in the model, (ii) the location of intense precipitation cells can be displaced between successive forecast initializations, and (iii) the timing of convective initiation and CAPE evolution may lag by a few hours. Each of these behaviors is consistent with what we observe for the 4 July 2025, Guadalupe event. For instance, successive HRRR initializations placed the convective core in different locations, under-resolved the localized rainfall rates, and produced a streamflow that consistently underrepresented both the magnitude and the timing of the rising limb.
The combination of the spatially misplaced QPF, smaller basin sizes, and flash flood prone geomorphology caused the NWM to signal intense flooding potential in the basins surrounding the Guadalupe River in the hours leading up to the event. However, the changing signal location in each timestep resulted in underprediction for the Guadalupe basin. By “changing signal location” we mean that there is a spatial mismatch in successive HRRR forecast cycles in the hours leading up to the event over different geographic locations in Upper Guadalupe Basin from one cycle to the next. Consequently, the NWM short-range forecasts driven by these HRRR cycles produced spatially inconsistent runoff predictions. The underestimation in the NWM during the event was exacerbated by the failure of the USGS gauge (08165500) near Hunt on the Guadalupe River during the fast-rising streamflow, which is confirmed on the USGS National Water Information System page for the site, where the peak of 315 000 ft3 s−1 (≈8910 m3 s−1) is documented as estimated value rather than an observed one (https://waterdata.usgs.gov/monitoring-location/USGS-08165500, last access: 25 September 2026) The streamflow values shown in Fig. 2c between approximately 04:50 on 4 July and 15:20 on 5 July are not direct gauge measurements, those are post-event reconstructions developed by USGS from surveyed high-water marks using indirect measurement techniques (Benson and Dalrymple, 1967). In the National Water Model (NWM), forecast errors are partially constrained through streamflow nudging during the Analysis and Assimilation (AnA) cycle, in which simulated discharge at USGS-gauged reaches is adjusted toward observations by adding a time-weighted correction to the channel-routing equation. The corrected discharge state then propagates downstream through the Muskingum–Cunge routing scheme, thereby reducing forecast errors at downstream locations (Cosgrove et al., 2024). In this event the failure of the Hunt gauge on the rising limb of the flood hydrograph prevents the assimilation of streamflow observations at this upstream location. Consequently, the incoming flood wave entered the routing network without observational constraint, allowing rainfall-driven errors in upstream inflows to propagate and accumulate downstream rather than being corrected. This resulted in progressively degraded discharge forecasts at downstream gauges, which in turn systematically reduced the accuracy of the corresponding flood inundation map (FIM) forecasts. However, even with the continuous gauge observations without any failure, the current NWM streamflow nudging scheme provides limited correction at longer forecast lead times because the observational discharge adjustment decays with forecast time (Seo et al., 2021).
We used FIMserv to generate 306 flood inundation maps using the above described NWM forecasted flows. FIMserv assigns each forecast as an inflow to the OWP HAND-FIM model, which uses reach-averaged synthetic rating curves to generate binary FIMs, based on the Height Above Nearest Drainage (HAND) approach (Aristizabal et al., 2023; Chen et al., 2025; Baruah et al., 2025).
3.1 Derivation of Maximum Forecasted Inundation
The maximum extents from the forecast FIMs at a given reference time are estimated by combining multiple short-range forecast FIMs (Fig. S4). For example, to assess flooding on 4 July, 05:00 AM (reference time), we used the maximum inundation extent from a total of 7 forecasts from earlier timestamps (10:00 PM 3 July through 04:00 AM 4 July) that predict conditions at 05:00 AM. Each raster (i.e., each of the 7 forecasts) was stacked, and for each pixel, if it was marked as flooded in any raster, it was considered flooded in the final composite. This approach produces a temporally integrated, conservative estimate of potential flooding (i.e., the largest possible forecasted extent for that hour), capturing uncertainty and variability in subsequent short-range forecasts.
3.2 Flood benchmark map creation using High Water Marks (HWMs)
We used the USGS High-water marks (HWMs) as the primary reference data for the creation of the benchmark FIM. HWM observations were obtained from the USGS Short-Term Network (STN) database (https://stn.wim.usgs.gov/, last access: 25 September 2026) and subjected to multi-stage preprocessing. First HWMs were filtered based on data quality (“Good” or “Excellent” quality were retained). Surveyed elevations (elev_ft) were converted to metric units (elev_m) relative to mean sea level. Next, global outlier removal was performed using the interquartile range (IQR) method (Tukey, 1977) to eliminate extreme data points. Subsequently, spatial outliers were identified using Local Moran's I, which evaluates each HWM in the context of its neighboring points rather than the dataset as a whole. The spatial relationships are defined using a weights matrix, with the neighborhood distance empirically determined through semivariogram analysis. This approach ensures that the detection of local outliers reflects the natural decay of spatial autocorrelation across the floodplain, improving the reliability of the interpolated water surface elevation. The filtered HWM dataset was then interpolated into a continuous Water Surface Elevation (WSE) raster using the Topo to Raster algorithm in ArcGIS Pro 3.4.0, a hydrologically conditioned interpolation approach that enforces drainage continuity (Feaster and Koenig, 2017; Koenig et al., 2016). The interpolated WSE surface was subtracted from a 10 m Digital Elevation Model (DEM), yielding flood depth estimates. Cells with positive residuals (DEM ≤ WSE) were classified as inundated, while negative residuals were assigned as non-flooded. This procedure yielded a benchmark flood inundation map derived solely from empirical HWM data that was used in FIM forecast evaluations in subsequent sections. This benchmark is particularly valuable because it enables spatial evaluation of forecast FIMs at locations where in-situ streamflow observations are unavailable either because no USGS gauge exists, as is the case near Camp Mystic, or because the gauge failed during the event, as occurred at Hunt.

Figure 3Top panel shows the FIM evaluation locations at North Fork, Camp Mystic, Hunt, Kerrville and Comfort. The bottom left panel (b1–f1) shows the accuracy metrics of FIM evaluation for North Fork, Camp Mystic, Hunt, Kerrville and Comfort. The right panel (b2–f6) shows the forecast flood extent, benchmark flood extent, and number of buildings hits by forecasted flood extents at different forecast hours (Buildings Hit) and those hit by the benchmark flood extents (Buildings Hit BM) at these locations. Each subpanel lists the forecast hour in the upper-left box; times that coincide with, or cover, the USGS-observed peak discharge are highlighted in bold.
3.3 Evaluation of the forecasted FIM against the benchmark FIM
We used FIMeval (Devi et al., 2026a) to evaluate the forecasted FIMs at five locations (Fig. 3) across different forecast times against the benchmark FIM. Since, the HWMs do not carry information about when each mark was attained during the event, and there is no guarantee that all HWMs across the basin correspond to the same time, different locations have reached their maximum at different hours. The HWM-derived benchmark FIM is therefore inherently a maximum-extent product rather than a snapshot at a specific time. We used the gauge-recorded peak time as a physically meaningful temporal anchor (the closest available proxy for when peak conditions occurred at each location), and the ± 2 h window allows the evaluation to accommodate the fact that the HWM recorded maximum may have been attained slightly before or after the gauged peak. Aligning to the forecasted peak would not remove this ambiguity, because the source of the temporal uncertainty lies in the benchmark itself, not in the choice of reference time.
We used both skill-based and impact-based assessments for FIM evaluation. Skill-based evaluation primarily assesses FIM performance using categorical metrics, whereas impact-based assessment focuses on affected infrastructure, such as buildings and road networks within the flood extent. For skill-based assessment, we used Critical Success Index (CSI), F1-Score, Probability of Detection (POD), and False Alarm Rate (FAR) as the evaluation matrix (Fig. 3), and for impact assessment, we compared the number of predicted and observed flooded buildings at different forecast hour. At North Fork, the flood peak occurred at 05:30 AM. Compared to earlier forecasts, the FIM forecasts for 04:00 to 06:00 AM show gradual improvements in CSI, F1, and POD scores, while FAR decreases over the same period, indicating an overall improvement in performance (Fig. 3b1). The impact assessment (Fig. 3b2–b6) indicates that the benchmark FIM estimates 133 buildings impacted, compared to only 2 for the 04:00 AM forecast and 19 for the 05:00 AM forecast. Near Camp Mystic, the evaluation scores for the 04:00 and 05:00 AM forecasts improved substantially compared to earlier forecasts (Fig. 3c1). In terms of impacts, the benchmark FIM shows 118 buildings affected, while the 04:00 and 05:00 AM forecasts predict only 18 and 72 flooded buildings, respectively (Fig. 3c2–c6). At Hunt, the flood peak was recorded at 05:05 AM. Here, the evaluation scores also improved, with CSI values increasing from 0.34 for the 04:00 AM forecast to 0.52 for the 05:00 AM forecast, while earlier forecasts yielded much lower scores (< 0.25) (Fig. 3d1). The impact assessment (Fig. 3d2–d6) indicates that the benchmark FIM estimates 133 buildings impacted, compared to only 19 for the 05:00 AM forecast and only 2 for the 04:00 AM forecast. At Kerr, the peak was recorded at 06:45 AM. Here, we found higher evaluation scores in the post-event forecast. For instance, the CSI scores are below 0.30 for 06:00 AM, but the scores are increasing at 10:00 AM, at 0.53. A similar trend was observed in POD and F1 score. From the impact assessment, we found that the benchmark FIM shows 140 flooded buildings, while the forecast FIMs have only one building flooded at 06:00 AM. We also observed notable underprediction in forecast FIM extents downstream of hydraulic structures (Fig. 3e2–e6). Such discrepancies likely stem from artifacts in the HAND raster and insufficient representation of dam release flows in the NWM streamflow forecasts (Aristizabal et al., 2023; Kim et al., 2020). At Comfort, the flood peak occurred at 11:00 AM. Early forecasts showed very low scores (< 0.1), but the scores improved at 01:00 PM (Fig. 3f1). Eventually, we found no buildings hit from the predicted FIMs until 01:00 PM At 01:00 PM for Comfort, there are 25 buildings predicted to be flooded, while the benchmark indicates 188 flooded buildings (Fig. 3f2–f6).
In this brief communication, we have presented an end-to-end evaluation of the NOAA operational forecasting chain for the Texas flash flood event on 4 July 2025, using precipitation forecasts, streamflow predictions, and flood inundation mapping. Using USGS gauge observations and a benchmark flood inundation extent generated from post-event ground-sampled high-water marks, we analyzed the NWM short-range streamflow forecasts and the resulting OWP HAND-derived flood inundation maps. Across all four gauged locations (North Fork, Hunt, Kerrville, and Comfort), the NWM short-range forecasts considerably underpredicted the peak flow, with a pronounced lag between observed and forecasted flows at downstream sites. No USGS gauge data is available on the South Fork Guadalupe River near Camp Mystic for that time period, so a direct streamflow evaluation was not possible at that location. We found that underprediction and lag in short-range forecasts are mainly due to errors in rainfall estimation and the failure of data assimilation (“nudging”) caused by malfunctioning USGS gauges during peak flow. The streamflow forecast underpredictions seem to have propagated, resulting in substantially underestimated flood extents in forecasted FIMs at different lead times. Given the risk of in-situ gauge failure at peak flows, complementary observations beyond the USGS telemetered network should be considered to support continuous data assimilations in the NWM. Realistically, no single alternative observation type can match the sub-hourly temporal resolution required to capture a flash flood that, in this case, exceeded the 500-year return period at Hunt in less than 1.5 h. At the in-situ level, dense networks of low-cost water-level sensors (Nemnem et al., 2026), bridge-mounted flood sensors (radar or acoustic), and image-based discharge estimation from fixed cameras (Young et al., 2015) using Large Scale Particle Image Velocimetry (LSPIV) can provide sub-hourly observations that are far less likely to be damaged during extreme flow. At the spaceborne level, satellite altimetry such as SWOT (Patidar et al., 2025), Sentinel-3 (Kittel et al., 2021), and Synthetic Aperture Radar (SAR) inundation retrievals provide spatially distributed water-surface and extent information, but their fixed revisit cycles (typically multiple days) and orbit timing rarely coincide with the few hour duration of a flash flood scale. We see particular potential, however, in commercial SAR satellite constellations with tasking capabilities for all weather day/night imaging. When pre-configured for tasking over flash flood-prone basins based on NWS watches or QPF-based heavy rain outlooks, these constellations can provide near-real-time inundation snapshots at multiple times during a single event.
Using the gauge-recorded peak time as a reference, we evaluated forecast FIMs at different hours against the HWM-derived benchmark. At upstream gauges, forecast skill improved as the forecast time approached the reference peak, whereas at downstream locations (Kerr and Comfort), evaluation scores were very poor at the reference time but improved after the observed peak flow. The HWM-derived benchmark also enabled forecast FIM evaluation at the ungauged Camp Mystic location. It is also clear from the impact assessment that forecast FIM was unable to capture the majority of the building impacts. From the evaluation, we also found that two locations, such as Hunt and Kerrville, can have similar CSI scores while experiencing different levels of flood impacts. This indicates the need to combine skill-based and impact-based assessments to better quantify the spatial errors in FIM. This study also points to the need for communicating the uncertainty and error bounds in operational forecast FIMs for early response and decision-making. One promising emerging approach is probabilistic FIM which can effectively represent and leverage uncertainty in streamflow forecasts and terrain parameters, providing more informative and actionable guidance for emergency responders. Probabilistic FIM can be most useful in operational settings when paired with predefined action triggers. By contrast, a binary deterministic forecast offers only “flood” or “no flood”, and repeated false alarms or false sense of security, which can erode public trust. A probabilistic map, on the other hand, allows responders to decide if, e.g., a 10 % probability triggers preparation, while a 90 % probability may trigger action or evacuation. Specifically, ensemble exceedance probabilities can be tied to (i) impact thresholds, e.g., the probability that critical infrastructure, schools, or evacuation routes are inundated; and (ii) jointly developed emergency-management protocols in which a given probability level automatically activates a defined response action. For instance, action triggers can be defined as a joint function of the probability of inundation and the severity of its impact on people and infrastructure. A low-to-moderate probability (e.g., P (flooding) ≥ 0.2) over high-consequence assets such as low-water crossings, school routes, or campsites can be sufficient to initiate precautionary road and bridge closures and to pre-position emergency resources, whereas a higher probability (e.g., for P≥0.5–0.7) over residential zones can trigger formal evacuation preparation (mobilization of buses, notification of vulnerable residents, opening of shelters). Embedding both impact and probability may help emergency managers to prioritize the alerts, situating probabilistic forecasting as a compelling focus for future studies aimed at improving the accuracy of prediction in flash flood events. While this study focuses on the technical components of the operational forecasting pipeline, we acknowledge that forecast quality is only one component of an effective early warning system. Other factors such as warning dissemination, warning interpretations by at-risk populations, evacuation timing, and the operational decisions of emergency responders all contribute substantially to the alert dissemination process.
Code for downloading the NWM short-range forecast and for producing the flood inundation maps is available at https://github.com/sdmlua/FIMserv (Baruah et al., 2025). The benchmark high water flood inundation map for the Texas Flood event is available in https://github.com/sdmlua/fimbench (last access: 25 September 2026) and linked through Zenodo at https://doi.org/10.5281/zenodo.22961099 (Devi et al., 2026b).
The supplement related to this article is available online at https://doi.org/10.5194/nhess-26-4753-2026-supplement.
Conceptualization: Anupal Baruah, Dinuke Munasinghe, Sagy Cohen. Formal analysis and methodology: Anupal Baruah, Dinuke Munasinghe, Mohamed Abdelkader, Dipsikha Devi, Yixian Chen, Supervision: Sagy Cohen. Writing (original draft preparation): Anupal Baruah, Mohamed Abdelkader, Dinuke Munasinghe, Dipsikha Devi, Riley McDermott, Humberto Vergara. All authors reviewed the final paper.
The contact author has declared that none of the authors has any competing interests.
The scientific results and conclusions, as well as any views or opinions expressed herein, are those of the authors and do not necessarily reflect the views of NOAA.
Publisher's note: Copernicus Publications remains neutral with regard to jurisdictional claims made in the text, published maps, institutional affiliations, or any other geographical representation in this paper. The authors bear the ultimate responsibility for providing appropriate place names. Views expressed in the text are those of the authors and do not necessarily reflect the views of the publisher.
This article is part of the special issue “Early Warning Systems from Research to Operations: Status, Innovations and Multi-Hazard Applications”. It is not associated with a conference.
Funding for this project was provided by the National Oceanic & Atmospheric Administration (NOAA), awarded to the Cooperative Institute for Research to Operations in Hydrology (CIROH) through the Cooperative Agreement with The University of Alabama (NA22NWS4320003).
This research has been supported by the National Oceanic and Atmospheric Administration (grant no. NA22NWS4320003).
This paper was edited by Timothy Tiggeloven and reviewed by two anonymous referees.
Aristizabal, F., Salas, F., Petrochenkov, G., Grout, T., Avant, B., Bates, B., and Judge, J.: Extending height above nearest drainage to model multiple fluvial sources in flood inundation mapping applications for the US National Water Model, Water Resour. Res., 59, e2022WR032039, https://doi.org/10.1029/2022WR032039, 2023.
Baruah, A., Dhital, S., Cohen, S., Tran, T. N. D., Elhaddad, H., Watts, C. L., Devi, D., Chen, Y., and Pruitt, C.: FIMserv v.1.0: A tool for streamlining Flood Inundation Mapping (FIM) using the United States operational hydrological forecasting framework, Environ. Modell. Softw., 192, 106581, https://doi.org/10.1016/j.envsoft.2025.106581, 2025 (code available at: https://github.com/sdmlua/FIMserv, last access: 25 September 2026).
Benson, M. A. and Dalrymple, T.: General field and office procedures for indirect discharge measurements (U.S. Geological Survey Techniques of Water-Resources Investigations, Book 3, Chapter A1), U.S. Government Printing Office, https://doi.org/10.3133/twri03A1, 1967.
Bytheway, J. L. and Kummerow, C. D.: Toward an object-based assessment of high-resolution forecasts of long-lived convective precipitation in the central US, J. Adv. Model. Earth Sy., 7, 1248–1264, https://doi.org/10.1002/2015MS000497, 2015.
Bytheway, J. L., Kummerow, C. D., and Alexander, C.: A features-based assessment of the evolution of warm season precipitation forecasts from the HRRR model over three years of development, Weather Forecast., 32, 1841–1856, https://doi.org/10.1175/WAF-D-17-0050.1, 2017.
Chen, I.-H., Berner, J., Keil, C., Kuo, Y.-H., and Craig, G.: Classification of warm-season precipitation in High-Resolution Rapid Refresh (HRRR) model forecasts over the contiguous United States, Mon. Weather Rev., 152, 187–201, https://doi.org/10.1175/MWR-D-23-0108.1, 2024.
Chen, Y., Cohen, S., Baruah, A., Devi, D., Dhital, S., Tian, D., and Munasinghe, D.: Merging remote sensing derived river slope datasets with high-resolution hydrofabrics for the United States, Sci. Data, 12, 1657, https://doi.org/10.1038/s41597-025-05941-6, 2025.
Cosgrove, B., Gochis, D., Flowers, T., Dugger, A., Ogden, F., Graziano, T., and Zhang, Y.: NOAA's National Water Model: Advancing operational hydrology through continental-scale modeling, J. Am. Water Resour. As., 60, 247–272, https://doi.org/10.1111/1752-1688.13184, 2024.
Devi, D., Dhital, S., Munasinghe, D., Cohen, S., Baruah, A., Chen, Y., Tian, D., and Pruitt, C.: A framework for the evaluation of flood inundation predictions over extensive benchmark databases, Environ. Modell. Softw., 196, 106786, https://doi.org/10.1016/j.envsoft.2025.106786, 2026a.
Devi, D., Munasinghe, D., Tian, D., Dhital, S., Cohen, S., Raghavan, R., Swain, N., Nikrou, P., Baruah, A., Chen, Y., Zarrabi, R., and Seyvani, S.: FIMbench: An Extensive Benchmark Flood Inundation Mapping Database, Version v1, Zenodo [data set], https://doi.org/10.5281/zenodo.22961099, 2026b.
Feaster, T. D. and Koenig, T. A.: Field manual for identifying and preserving high-water mark data (U.S. Geological Survey Open-File Report 2017-1105), U.S. Geological Survey, https://doi.org/10.3133/ofr20171105, 2017.
Henderson, D. S., Otkin, J. A., and Mecikalski, J. R.: Evaluating convective initiation in high-resolution numerical weather prediction models using GOES-16 infrared brightness temperatures, Mon. Weather Rev., 149, 1153–1172, https://doi.org/10.1175/MWR-D-20-0272.1, 2021.
James, E. P., Alexander, C. R., Dowell, D. C., Weygandt, S. S., Benjamin, S. G., Manikin, G. S., and Turner, D. D.: The High-Resolution Rapid Refresh (HRRR): An hourly updating convection-allowing forecast model. Part II: Forecast performance, Weather Forecast., 37, 1397–1417, https://doi.org/10.1175/WAF-D-21-0130.1, 2022.
Kiel, B. M., Gallus Jr., W. A., Franz, K. J., and Erickson, N.: A preliminary examination of warm season precipitation displacement errors in the upper Midwest in the HRRRE and HREF ensembles, J. Hydrometeorol., 23, 1007–1024, https://doi.org/10.1175/JHM-D-21-0076.1, 2022.
Kim, J., Read, L., Johnson, L. E., Gochis, D., Cifelli, R., and Han, H.: An experiment on reservoir representation schemes to improve hydrologic prediction: Coupling the national water model with the HEC-ResSim, Hydrolog. Sci. J., 65, 1652–1666, https://doi.org/10.1080/02626667.2020.1757677, 2020.
Kittel, C. M. M., Jiang, L., Tøttrup, C., and Bauer-Gottwein, P.: Sentinel-3 radar altimetry for river monitoring – a catchment-scale evaluation of satellite water surface elevation from Sentinel-3A and Sentinel-3B, Hydrol. Earth Syst. Sci., 25, 333–357, https://doi.org/10.5194/hess-25-333-2021, 2021.
Koenig, T. A., Bruce, J. L., O'Connor, J., McGee, B. D., Holmes Jr., R. R., Hollins, R., and Peppler, M. C.: Identifying and preserving high-water mark data (U.S. Geological Survey Techniques and Methods, Book 3, Chapter A24), U.S. Geological Survey, https://doi.org/10.3133/tm3A24, 2016.
Krajewski, W. F., Goska, R., Post, R., Quintero, F., and Velasquez, N.: Is this rainfall forecast good or bad? For flood forecasting, the answer is scale-dependent, B. Am. Meteor. Soc., 106, E1772–E1793, https://doi.org/10.1175/BAMS-D-24-0166.1, 2025.
Min, L., Fitzjarrald, D. R., Du, Y., Rose, B. E. J., Hong, J., and Min, Q.: Exploring sources of surface bias in HRRR using New York State Mesonet, J. Geophys. Res.-Atmos., 126, e2021JD034989, https://doi.org/10.1029/2021JD034989, 2021.
National Severe Storms Laboratory (NSSL): MRMS Operational Product Viewer, NOAA National Severe Storms Laboratory, https://mrms.nssl.noaa.gov/qvs/product_viewer/ (last access: 21 September 2026), 2025.
Nemnem, A. M., Khan, M. A., Downey, A. R. J., and Imran, J.: Early warning potential of low-cost sensors evaluated using the Camp Mystic flash-flooding event, in: World Environmental and Water Resources Congress 2026, American Society of Civil Engineers, 293–303, https://doi.org/10.1061/9780784486931.024, 2026.
Nevitt, M.: Eight Takeaways From the Texas Flood Tragedy, Lawfare, https://doi.org/10.2139/ssrn.5374687, 2025.
Patidar, G., Paris, A., Indu, J., and Karmakar, S.: How can SWOT derived water surface elevations help calibrating a distributed hydrological model?, J. Hydrol., 656, 132968, https://doi.org/10.1016/j.jhydrol.2025.132968, 2025.
Perica, S., Pavlovic, S., St. Laurent, M., Trypaluk, C., Unruh, D., and Wilhite, O.: Precipitation-Frequency Atlas of the United States, Volume 11 Version 2.0: Texas, NOAA Atlas 14, National Weather Service, https://doi.org/10.25923/1ceg-5094, 2018.
Saharia, M., Kirstetter, P.-E., Vergara, H., Gourley, J. J., Hong, Y., and Giroud, M.: Mapping flash flood severity in the United States, J. Hydrometeorol., 18, 397–411, https://doi.org/10.1175/JHM-D-16-0082.1, 2017.
Seo, B.-C., Krajewski, W. F., and Quintero, F.: Multi-scale hydrologic evaluation of the national water model streamflow data assimilation, J. Am. Water Resour. As., 57, 875–884, https://doi.org/10.1111/1752-1688.12955, 2021.
Sharif, H. O., Hassan, A. A., Bin-Shafique, S., Xie, H., and Zeitler, J.: Hydrologic modeling of an extreme flood in the Guadalupe River in Texas, J. Am. Water Resour. As., 46, 881–891, https://doi.org/10.1111/j.1752-1688.2010.00459.x, 2010.
Tukey, J. W.: Exploratory Data Analysis, Addison-Wesley, Reading, Massachusetts, USA, ISBN 978-0-201-07616-5, 1977.
Vergara, H., Gourley, J. J., and Erickson, M.: An efficient ensemble technique for hydrologic forecasting driven by quantitative precipitation forecasts, J. Hydrometeorol., 24, 479–495, https://doi.org/10.1175/JHM-D-22-0109.1, 2023.
Weather Prediction Center (WPC): Mesoscale Precipitation Discussion 0582, NOAA/NWS Weather Prediction Center, https://www.wpc.ncep.noaa.gov/metwatch/metwatch_mpd_multi.php?md=582&yr=2025, 3 July 2025 (last access: 21 September 2026).
Young, D. S., Hart, J. K., and Martinez, K.: Image analysis techniques to estimate river discharge using time-lapse cameras in remote locations, Comput. Geosci., 76, 1–10, https://doi.org/10.1016/j.cageo.2014.11.008, 2015.
Zhang, J., Howard, K., Langston, C., Kaney, B., Qi, Y., Tang, L., and Kitzmiller, D.: Multi-Radar Multi-Sensor (MRMS) quantitative precipitation estimation: Initial operating capabilities, B. Am. Meteor. Soc., 97, 621–638, https://doi.org/10.1175/BAMS-D-14-00174.1, 2016.