
the Creative Commons Attribution 4.0 License.
the Creative Commons Attribution 4.0 License.
 | 04 Sep 2026
Future fire weather projections show the importance of mitigation and adaptation for dynamic fire management
Inika Taylor

Camilla Mathison
Karina E. Bett-Williams
Andrew J. Hartley
Richard A. Betts
Chantelle Burton
Maria L. F. Barbosa
Understanding future shifts in fire weather (FW) risk across peak-season, transitional, and off-season periods is crucial for adapting fire preparation and management to climate change. Fire management planning depends not only on reducing fire risk through climate change mitigation, but also on how residual risk evolves under different warming pathways, including low levels of global warming. Additionally, while most FW projections focus on peak-season severity and length, fire management decisions – including prevention, preparedness, and controlled burning- are made throughout the annual cycle. This creates a growing information gap between climate-driven shifts in fire risk under different mitigation scenarios and year-round fire management frameworks. To address this, we explore future climate-driven FW projections using the McArthur Forest Fire Danger Index (FFDI) and a large perturbed-physics ensemble, enabling a systematic assessment of uncertainty and confidence in projected changes globally and across three focus regions: Australia, Brazil, and the United States of America. We evaluate future FW across all phases of the annual cycle relative to both a historical baseline (1986–2005) and a recent reference period (2004–2023), under three Global Warming Levels (1.5, 2.0, and 4.0 °C) and two emissions scenarios (RCP2.6 and RCP8.5). In addition to changes in season length and peak FFDI, we quantify transitions between meteorological FW periods and shifts in low FW windows, linking projected climate change impacts directly to the timing and feasibility of Integrated Fire Management (IFM) activities. We project a global rise in FW at all GWLs, with the largest increases in Australia, then Brazil and the USA. At 1.5 °C, 31 % (25 %–36 %) of global burnable land area is projected to see more days with Very High fire weather (FFDI ≥ 24) than in the baseline period of 1986–2005. Higher GWLs drive further increases, with more than a threefold rise in days with Very High FW from 2.0 to 4.0 °C. The transition from preparation periods to fire season advances by 7–36 d (Australia), 12–32 d (Brazil), and 5–36 d (the United States of America) at 2.0 °C. Low FW windows persist, offering crucial opportunities for out-of-season preparation, though they narrow with warming. Our findings highlight the dual need for mitigation and adaptation strategies, including accounting for changes in out-of-season fire risks. We offer an initial step toward a more dynamic form of IFM by illustrating how climate projections, impact metrics and seasonal diagnostics can be combined to inform preparedness, flexible planning, and providing a foundation for operational dynamic IFM.
- Article
(18255 KB) - Full-text XML
- BibTeX
- EndNote


Wildfires, defined as unusual or extraordinary free-burning vegetation events, can be destructive to human society and ecosystems (UNEP et al., 2022), with impacts experienced over a range of timescales. The immediate consequences may include loss of life, wildlife, habitat, crops and carbon, and destruction of property and infrastructure. Longer-term impacts can include environmental degradation, reduced air quality contributing to health effects, mental ill health and decreased well-being, economic damage and increased greenhouse gas emissions (Head et al., 2014; Sharples et al., 2016). Fire weather (FW) driving these events are already becoming more frequent and intense (Dowdy, 2018; Sharples et al., 2016), extending high-risk fire seasons and increasing wildfire occurrence. Recent wildfire events demonstrate the consequences of elevated fire danger, providing a glimpse of the devastation that a future increase could bring (Jones et al., 2024; Kelley et al., 2025).
The Black Summer fires of 2019/2020 in Eastern Australia, for example, were unprecedented in recorded history (Boer et al., 2020), causing at least 34 deaths, the destruction of nearly 6000 buildings, hazardous air quality levels and an estimated 1.5 billion wild animals killed (Van Oldenborgh et al., 2021; Ward et al., 2020). Similarly, the western USA has also seen a series of recent extreme wildfire events (Higuera and Abatzoglou, 2021), with the 2025 Los Angeles fires explicitly linked to climate change and causing severe impacts in the region (Kelley et al., 2025). Canada's 2023 fire season burned over 150 000 km2, forcing the evacuation of 232 000 people and causing degraded air quality across North America (Jain et al., 2024; Jones et al., 2024). Increased wildfires have also been observed across parts of South America, including extreme levels of burning in the Pantanal wetlands in 2020 and 2024, and widespread fires across Amazonia during 2023/2024, driven by drier conditions, seasonal shifts, and land-use change (Barbosa et al., 2021; Kelley et al., 2021; Silveira et al., 2020).
The frequency and intensity of destructive wildfires are projected to continue rising. UNEP et al. (2022), estimate an 8 %–14 % increase in extreme wildfire events in the next decade and 31 %–57 % by 2100, with regions such as southeast Australia, southern Amazon, and, under higher emissions scenarios, western USA expected to experience significantly larger increases. While the Paris Agreement aims to limit global warming to well below 2.0 °C (UNFCCC, 2015), projections indicate that substantial increases in wildfires are likely even under scenarios of 1.5 °C (UNEP et al., 2022). Achieving this target will be highly challenging, and many regions are already experiencing climate-driven fire impacts at lower levels of warming, with global effects on forest cover and carbon sequestration possible at just 1.0–1.3° of warming (Burton et al., 2024). Exceeding 1.5, 2.0 °C, or higher thresholds is expected to further increase extreme wildfires, emphasizing the urgent need for adaptive fire management strategies.
Despite this threat, there has been little progress linking climate, ecological, and fire research with fire management (Hamilton et al., 2024). This lack of progress has been identified as the biggest bottleneck for developing effective and future-proof fire management plans (Jones et al., 2024; UNEP et al., 2022).
Integrated Fire Management (IFM) is widely promoted as the framework for coordinating mitigation, preparedness, response, and recovery across the full fire cycle (UNEP et al., 2022). It recognizes fires as both a natural ecological process and a societal hazard, seeking to balance prevention, fuel management, suppression, and post-fire recovery across ecological, climatic and socio-economic contexts. In practice, many operational activities, such as fuel-reduction burns, training, and preparedness, still rely on historically stable seasonal windows, though some modern approaches increasingly incorporate adaptive, climate-informed planning (Oliveras Menor et al., 2025).
Fuel reduction burns are often conducted during off-season periods, while preparatory actions occur ahead of peak fire weather conditions to reduce fuel loads and mitigate later wildfire severity (Burrows and McCaw, 2013; Morgan et al., 2020; da Veiga et al., 2025; da Veiga and Nikolakis, 2022). In Australia, controlled burns are concentrated in cooler months to minimise risks to people and biodiversity, while in the western United States of America (USA), prescribed burning and mechanical thinning are scheduled during low wind periods, particularly near the wildland–urban interface (Stephens et al., 2012). By contrast, in Brazil, controlled burning has historically been limited, with fire management focused on suppressing agricultural and pasture fires to prevent their spread into protected or ecologically sensitive regions such as Amazonia rainforest and Pantanal wetlands.
Across these contexts, effective IFM depends on the availability and total duration of low-risk periods for safe fuel management, training, and preparedness. An earlier onset of high fire weather and a longer fire season, may shift or shorten these operational windows, constraining activities, particularly for part-time, volunteer and community-based firefighting services, common in Australia, the USA and Brazil. Climate-driven changes in the timing and duration of these windows is as important as the length and intensity of periods of high fire weather for effective IFM, and evidence of how these windows may change is needed to prepare for potential future realignment of seasonal management actions.
Here, we present a new way of assessing how wildfire management cycles might need to adapt under climate change, combining future climate projections with year-round fire weather danger indices. Fire weather describes short-term atmospheric conditions, including temperature, humidity, drought and wind, that influence fire ignition and spread, and are shaped by longer-term climate conditions (Flannigan et al., 2016; UNEP et al., 2022), Fire weather indices, such as the FFDI (Noble et al., 1980), integrate these meteorological conditions to quantify fire danger and capture the direct influence of climate variability and change on wildfire risk. Wildfire risk encompasses fire danger, exposure, and vulnerability, where fire danger represents the hazardous fire weather conditions that enable fire ignition and spread. Here, we focus on fire danger as quantified by fire weather, while using fire risk to refer to the broader impacts of wildfire on society and ecosystems
Fire weather indices are particularly useful in ecosystems with abundant fuel, such as temperate and tropical forests, where meteorological conditions, rather than fuel availability, drive fire occurrence and severity, especially for extreme events (Jolly et al., 2015; Kelley and Harrison, 2014). In regions including southeast Australia and parts of the USA, these indices are widely used to support wildfire preparedness and response. In such contexts, fire weather indices provide a robust proxy for changes in fire season length and the frequency of dangerous conditions, offering a clearer signal than more stochastic fire metrics such as burned area (Jones et al., 2022). Although a range of models exist to simulate physical fire behaviour, including burnt area and fire intensity (Haas et al., 2022; Hantson et al., 2016; Kelley et al., 2019), the stochastic nature of fire means these approaches are often less suited to informing management about timing, duration, and seasonal change. Such models continue to exhibit substantial uncertainty (Burton et al., 2024; Hantson et al., 2020), particularly when applied across regions and under future projections (Kloster and Lasslop, 2017; Li et al., 2024). By contrast, fire weather indices provide a simple and transparent representation of the meteorological conditions that underpin fire danger, without introducing the stochasticity inherent in modelling ignition, spread, or suppression processes. Click or tap here to enter text.
The FFDI can be calculated from standard climate model outputs, and thereby can be used to assess different future emissions pathways. Given uncertainty in the climate system response to greenhouse gas forcing, ensembles of climate projections are required to sample a plausible range of futures. Perturbed Physics Ensemble (PPE) address this by varying key physical parameters within a single climate model framework, generating a large number of internally consistent climate projections (Booth et al., 2013; Lambert et al., 2013). This approach complements multi-model ensembles such as CMIP6 by providing a much denser and controlled exploration of uncertainty in the climate system, particularly in temperature, humidity, wind and fuel dryness. Because all ensemble members share the same model structure, differences between members can be attributed primarily to physical uncertainty, making PPEs valuable for analyzing compound metrics such as the FFDI and for assessing how incremental warming alters fire weather seasonality.
We use a PPE to examine projected changes in fire weather globally, focusing on wildfire-prone regions including Australia, the USA, and Brazil, as well as fuel-rich ecosystems worldwide. We assess changes in the frequency, duration, and seasonal timing of Very High, High and Low-moderate fire weather as indicators of shifts in fire season onset, operational windows for fuel management, and periods critical for recovery and preparedness. By analyzing these changes across Global Warming Levels of 1.5, 2.0, and 4.0 °C, we evaluate how climate-driven fire weather shifts may challenge current management practices, the potential benefits of meeting Paris Agreement targets, and priorities for adaptive fire management under continued warming.
2.1 The Forest Fire Danger Index
We calculated the McArthur Forest Fire Danger Index (FFDI) using input variables from the HadCM3C PPE. The integration of FFDI with the HadCM framework ensures consistency with established methodologies and benefits from extensive evaluation and a robust body of supporting literature, enhancing the reliability of our projections (Betts et al., 2015; Burton et al., 2018, 2020; Golding and Betts, 2008). The FFDI is a widely used fire weather index that combines temperature, relative humidity, wind speed, and prior rainfall to assess the risk of fire occurrence and spread, particularly in fuel-abundant ecosystems. Originally developed for Australian forests, the FFDI is highly sensitive to temperature and relative humidity, making it well-suited for regions where climate-induced changes in these variables significantly influence fire risk (Dowdy et al., 2009). The FFDI also fulfils the balance of being simple enough to understand within our modelling framework, whilst still being used operationally, especially in Australia, alongside other fire indices such as the Canadian FWI (Dowdy et al., 2009). The FFDI has also been used in global studies of fire weather under climate variability and change, often integrated with climate model output (Betts et al., 2015; Burton et al., 2018; Clarke and Evans, 2019b; Golding and Betts, 2008; Jolly et al., 2015). One of the key strengths of the FFDI in this study is its high correlation with observed fire occurrences in tropical regions (Figs. 1, A1), as shown in studies such as Hoffmann et al. (2003) for the Amazon, where seasonal dryness and extreme temperatures drive fire activity. The index's sensitivity to these meteorological factors is especially valuable for studies projecting future fire weather patterns, as it closely aligns with anticipated climate-induced shifts in temperature and humidity that will affect fire risk.
In comparison, the Canadian FWI, more commonly used in boreal and temperate ecosystems, has a reduced sensitivity to temperature and humidity shifts (Dowdy et al., 2010) . This difference makes the FFDI well-suited to regions such as Australia, the USA, and Brazil, where temperature and humidity play critical roles in fire dynamics (Forkel et al., 2017; Kelley et al., 2019).
While FFDI does not explicitly capture regional fuel types or suppression practices, this limitation is consistent with our emphasis on the climate signal in fire danger, and the index's responsiveness to temperature and humidity provides a robust basis for evaluating future fire weather risks across our study regions.
The FFDI calculation is expressed as follows:
where DF = drought factor, T= daily maximum temperature at 1.5 m (°C), H= daily relative humidity (%), and V= daily 10 m wind speed (km h−1) (Noble et al., 1980).
The drought factor (DF) is calculated as:
where N= number of days since last rain, P= precipitation (mm d−1) (Noble et al., 1980) and SMD = soil moisture deficit calculated using the models soil moisture to a soil depth of 1m compared to critical volumetric soil moisture corresponding to a soil matric water potential of −33 kPa (Best et al., 2011; Holgate et al., 2017). This provides a climate model representation of the Keetch-Byram drought index (KBDI) as in Burton et al. (2018). This method of calculation can result in drier soils than the KBDI calculated from observed meteorology, leading to less time at lower FFDIs (Holgate et al., 2017). We therefore, focus our results on patterns of changes in FFDI, or changes in time in each FFDI category (Table 1) as a proxy for changes in different windows of the fire season, rather than FFDI itself. The drought factor is limited to 10, as suggested by Sirakoff (1985).
Table 1FFDI categories (Holgate et al., 2017), with the part of the season we use each category as a proxy for.
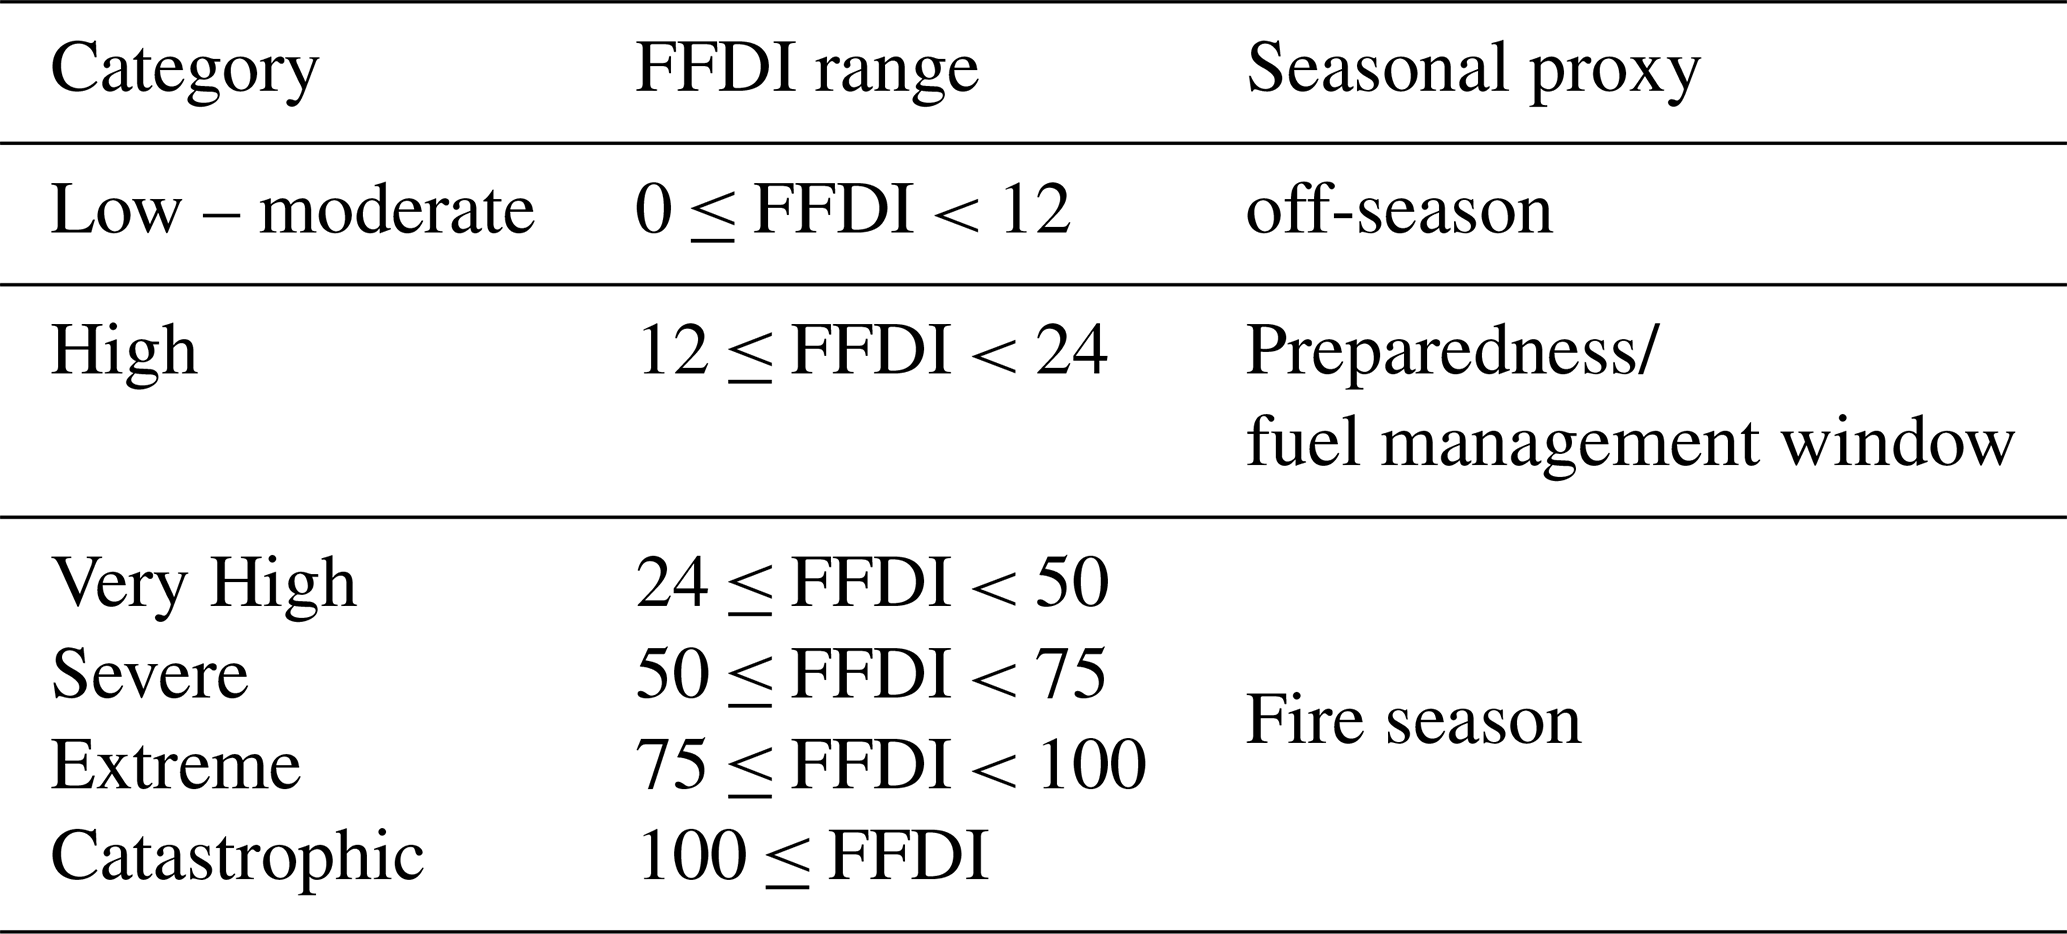
We consider days exceeding the Very High threshold (FFDI > 24) as an indicator of fire season length and to explore the future extent of fire weather (Cruz et al., 2015; Hadisuwito and Hassan, 2020; Holgate et al., 2017; Khastagir et al., 2018). In fuel-abundant ecosystems, days above this threshold are strongly associated with periods of elevated fire activity and extreme fire behaviour, making them a robust proxy for the effective fire season. This threshold is widely used, operationally and in previous studies, to represent conditions under which fires are likely to spread rapidly and pose substantial risks to life, property, and ecosystems (Dowdy et al., 2009; Dowdy, 2018; Hoffmann et al., 2003; Jolly et al., 2015; Noble et al., 1980) requiring active fire suppression and a continual state of suppression readiness.
We also analyse changes in the High FFDI category (12 ≤ FFDI < 24). The High category captures conditions under which fires may be actively managed, although spread potential and suppression difficulty are increasing. It therefore provides a practical upper-bound proxy for control burn conditions (Jones, 2019). Even where it is not formally defined as an operational burning window, the duration of High fire danger provides a consistent, management-relevant proxy for the upper bound of conditions under which fuel management and controlled burning may still be feasible (Clarke and Evans, 2019b).
Finally, we assess changes in the proportion of days classed as Low–Moderate fire weather (FFDI < 12). These conditions are associated with low ignition likelihood, limited fire spread, and fires that are generally controllable with routine suppression resources. Consequently, Low–Moderate fire weather days provide an indication of the relative length of the fire off-season or low risk period, during which fire agencies typically do not experience sustained wildfire activity, and suppression readiness requirements are lower.
2.2 Models and data
We use a PPE of the Met Office Hadley Centre global climate model, HadCM3C. This ensemble includes 57 plausible variants of HadCM3C to sample uncertainties in atmospheric feedbacks, the land carbon cycle, ocean physics and aerosol sulphur cycle processes as described in Booth et al. (2013) and used in Taylor et al. (2013). This ensemble was designed to sample a large range of future global average temperatures. Unlike many other PPE, the HadCM3C model includes dynamic vegetation coupled to the atmosphere model, allowing for biophysical vegetation-climate and climate-carbon cycle feedbacks. HadCM3C is part of a family of models based around the HadCM3 configuration (Gordon et al., 2000), which showed large reductions in precipitation in the Amazon region under future climate change projections associated with particular patterns of sea surface temperature (SST) change (Good et al., 2008; Harris et al., 2008). When dynamic vegetation is included, this leads to forest die-back in the Amazon (Cox et al., 2000), with biophysical vegetation-climate feedback playing a key role in magnifying the circulation-induced precipitation reduction (Betts et al., 2004). The range of future global average temperature changes broadly spans the Coupled Model Intercomparison Project Phase 5 (CMIP5) projections, except at the lower end (Booth et al., 2013),
We use two future emissions scenarios related to the Representative Concentration Pathways (RCPs), a low-emissions scenario, RCP2.6 and a high-emissions scenario, RCP8.5, to explore a wide range of future climate outcomes. Since the HadCM3C model includes an interactive carbon cycle, the scenarios are used here as emissions scenarios rather than concentration pathways, as is more commonly used in climate models that do not simulate the carbon cycle, such as the CMIP5 ensemble.
We look at changes in future fire weather at three GWLs, 1.5, 2.0 and 4.0 °C, defined relative to 1850–1900, as used in the IPCC 6th Assessment Report (Masson-Delmotte et al., 2021) and Burton et al. (2022), for both emissions scenarios and each ensemble member. We calculated the relevant GWL for each ensemble member as twenty years surrounding the year in which the member first passed the GWL threshold. This means that the time periods analysed for each GWL are not the same across the ensemble, as there are a range of future temperatures and periods when each model variant reaches them. We compare these changes in fire weather to a baseline period of 1986–2005, as used in the IPCC Special Report on Global Warming of 1.5 °C. We also compare breakdowns of the length of the season in each FFDI category to the recent present (2004–2023).
All analyses are performed on the fraction of burnable land, defined using the SAGE potential vegetation database (Bett et al., 2020). Non-burnable areas, including ice-covered regions and grid cells where more than 50 % of the surface is classified as bare soil, are masked out, as illustrated by the grey mask in Fig. 1. This burnable land mask is applied consistently across the evaluation of modelled FFDI against Copernicus FFDI, as well as for the baseline, historical, and all future GWLs (1.5, 2.0, and 4.0 °C), and across all ensemble members. We henceforth refer to this burnable land as “exposed area” for simplicity.
2.3 Evaluation
We evaluate the simulated FFDI from the HadCM PPE against FFDI constructed from reanalysis meteorology (“Copernicus FFDI”; CMES, 2019). Evaluation is performed separately for the number of days in the Low–Moderate, High, Very High, and Severe-or-higher FFDI categories over the baseline period.
Because the PPE is an untrained ensemble designed to sample a wide range of plausible climate responses, our evaluation focuses on whether the ensemble adequately represents and contains observed fire weather characteristics, rather than on exact agreement with observations at every location (Burton et al., 2025). We therefore use two complementary evaluation approaches. First, we assess the position of the Copernicus-based FFDI within the model ensemble for each FFDI category and grid cell, following the ensemble evaluation framework described in Barbosa et al. (2025). For each location, we determine the fraction of ensemble members that simulate more or fewer days in a given FFDI category than Copernicus. If approximately half of the ensemble members lie on either side of the Copernicus value, this indicates an unbiased ensemble. A systematic tendency for most ensemble members to lie above (below) the Copernicus estimate indicates a positive (negative) bias in simulated fire weather. For untrained ensembles such as the PPE, however, the primary requirement is that the observations fall within the ensemble spread (Burton et al., 2025).
Second, we quantify model performance using the Normalised Mean Error (NME) metrics following (Burton et al., 2019; Kelley et al., 2013). NME is well-suited to non-normally distributed data and is widely applied in global fire model evaluation (Burton et al., 2024; Hantson et al., 2020; Rabin et al., 2017). Three NME variants are calculated:
-
NME1 is the area-weighted mean absolute difference between simulated and observed values and measures the overall magnitude of model error.
-
NME2 is calculated after removing the spatial mean from model and observations, assessing differences in spatial variability about the mean.
-
NME3 is calculated after removing the mean and the absolute mean variance, isolating differences in spatial pattern alone.
For all three metrics, lower values indicate better agreement with reanalysis-based FFDI, with a value of zero representing a perfect match to observations. To aid interpretation, NME scores are compared against three null models following Burton et al. (2018). The median null model compares observations to a spatially uniform field equal to the median observed value, representing the best possible single-value predictor. The mean null model compares observations to their spatial mean and, by construction, yields an NME score of 1. The randomly resampled null model is generated by randomly permuting the observed data and comparing it to the observations; this is repeated 1000 times, and the 5th–95th percentile range is reported to indicate expected scores under random spatial structure. Because NME is a distance-based metric, the extent to which model scores approach zero relative to these null models indicates the degree of improvement over simple or random predictors.
NME metrics are calculated separately for each ensemble member, following Kelley et al. (2019), and results are summarized using the 5th–95th percentile range across the ensemble. This approach allows us to characterize typical model performance and the spread of plausible outcomes represented by the PPE.
2.4 Metrics calculated
To assess projected changes in fire weather under future global warming, we calculated a series of metrics derived from our PPE ensemble simulations of FFDI, changes in fire weather intensity during the peak fire season, and shifts in the start and end of the high-risk period while accounting for ensemble uncertainty. All analyses were conducted globally and focused regionally on Australia, Brazil, and the western USA.
2.4.1 Increases in Very High fire weather
For each grid cell and ensemble member, we calculated the number of days in which the FFDI exceeded the Very High threshold (FFDI > 24, Table 1). The increase in extreme fire weather for each grid cell was defined as the difference between the number of days above the Very High threshold at a given GWL relative to the baseline period (1986–2005). To visualize these results, we generated consensus maps showing the spatial distribution of changes in Very High FFDI days. The method of model consensus is used as an approach to represent and maintain the full range of information available in the PPE using the method of Kaye et al. (2012) as implemented in Taylor et al. (2013), which quantifies the level of agreement across the 57-member PPE ensemble and highlights the fraction of ensemble members showing an increase, no change, or decrease in days at Very High FFDI. This approach maintains more of the ensemble's spatial characteristics than taking the model mean.
We then aggregated the results spatially to determine the area-weighted mean number of days exposed area experienced Very High or greater FFDI, globally and for each region. This calculation was performed for each ensemble member that reached a given GWL. To test for significant changes at each GWL for each RCP relative to the baseline, we compared paired ensemble values for days above Very High FFDI using a one-tailed Wilcoxon signed-rank test.
Finally, we calculated the relative change in Very High or greater FFDI days versus the baseline for each grid cell and ensemble member, expressed as a percentage of exposed area experiencing an increase, and summarised across the ensemble by reporting the 10th, 50th (median), and 90th percentiles. Because both increases in the number of days and in the spatial extent contribute, doubling either the number of days above the Very High threshold or the number of grid cells with such days results in a 100 % increase.
2.4.2 Mitigation potential
To assess the potential benefits of limiting global warming, we calculated the mitigation potential in terms of reduction in days above the Very High FFDI threshold vs 4.0 °C, globally and for each region. We used the same calculation for the number of days at or above Very High FFDI described in Sect. 2.4.1. The mitigation potential was then calculated as the difference between the number of Very High FFDI days at 4.0 °C under RCP8.5 and the number of days at the lower warming levels (2.0 or 1.5 °C) for the same ensemble member. This yields a distribution of reductions across the ensemble, which captures both spatial and parametric uncertainty.
Significance of the differences was assessed using a one-sided, paired Wilcoxon signed-rank test, with pairing by ensemble member. This test evaluates whether the reduction in Very High fire weather days is consistently less than zero across the ensemble for 4.0 °C vs. the lower GWLs.
2.4.3 Meteorological drivers of FFDI
To assess the meteorological drivers of FFDI, we used a Random Forest (RF) machine learning model to quantify variable importance. RF models (Breiman, 2001) are often used to systematically assess the importance of each variable for predicting the FFDI value. We took a bootstrapping approach to assess uncertainty in RF model construction by performing 1000 independent samples of data points without replacement (n=300) from a population containing all grid cells with FFDI > 12 and all ensemble members for a given country and warming level (Baseline or 4 °C under RCP8.5). We split each sample into a randomly selected 75 % training set and a 25 % testing set, using an RF classifier to predict FFDI from a set of meteorological variables.
The variable importance is estimated by repeatedly removing individual predictors and quantifying the resulting decrease in model skill. This provides a systematic and internally consistent way to evaluate the relative role of different drivers of fire weather across climates. All RF models were trained and evaluated using the same predictor set and sampling strategy to ensure comparability between the baseline and +4.0 °C experiments, with the mean and standard deviation of each sample plotted for each country and warming level. Changes in variable importance are interpreted as changes in the relative and marginal contribution of individual meteorological drivers to FFDI predictability, rather than as changes in total explained variance. A reduction in importance across variables under stronger warming reflects increased co-occurrence and reduced separability of fire-conducive conditions, rather than a weakening of fire-weather controls.
2.4.4 Change in FFDI seasonal cycle
To examine how fire weather evolves throughout the year, we analysed daily FFDI values for each PPE ensemble member. For the regions of interest (Australia, Brazil, and the USA), FFDI values were averaged spatially using area weights across the entire region for each day of the year, producing a daily seasonal cycle for 20-year periods corresponding to the baseline (1986–2005), historic (2004–2023) and each GWL of 1.5, 2.0, 4.0 °C and under both emissions scenarios. Individual ensemble members were retained in the analysis to represent parametric uncertainty, and ensemble medians, interquartile ranges, and 5th–95th percentiles were calculated for visualization. Significance testing of changes relative to the baseline was performed using a one-sided, paired Wilcoxon signed-rank test, with pairing by ensemble member, for FFDI values averaged over a 7-d running window to reduce short-term variability.
In addition to analysing changes in the magnitude of fire weather, we assessed shifts in the timing of the end of the typical fire management season in each region. Baseline end-of-season dates were chosen from regional references: 31 October for Australia (Clarke et al., 2019; Clarke and Evans, 2019a), 1 September for Brazil (da Veiga et al., 2025; da Veiga and Nikolakis, 2022), and 31 May for the USA (Swain et al., 2023; Knapp et al., 2009). There is much within-country variability of these timings, with exact FFDIs for control burns vary among and even within a region, depending on the risk to local populations, fuel loads, and need depending on the likelihood of later extreme fires (Cirulis et al., 2020; Gill et al., 1987; Howard et al., 2020; da Veiga and Nikolakis, 2022). We use these more as an indicative proxy rather than a firm projection.
For each ensemble member, we used the 7-d running mean of the daily seasonal cycle FFDI on these end-of-season dates as our baseline. We then identified the date in the future GWL projections (under RCP2.6 and RCP8.5) when this same FFDI value occurred. The difference in days between the baseline end-of-season date and the projected date provided the directional shift for each ensemble member. To summarise ensemble agreement, we calculated the percentage of ensemble members projecting an earlier or later transition relative to the baseline.
2.4.5 Change in Low-moderate to High FFDI
To characterise changes in the distribution of fire weather intensity throughout the year, we calculated the annual time spent in each FFDI category (Low–Moderate, High, Very High, Severe+) for each ensemble member. For each grid cell, the number of days falling into each category was summed over the course of a representative year (baseline: 1986–2005; historical: 2004–2023; future: at each Global Warming Level, GWL). This produces a per-ensemble-member, per-grid-cell annual allocation of days to each FFDI category.
We then aggregated these values spatially over each region of interest (Australia, Brazil, and the USA), weighting each grid cell by its fractional exposed area coverage to account for varying cell area. For each region and scenario, the ensemble spread was summarised by reporting the 10th, 50th (median), and 90th percentiles of annual time in each category across ensemble members.
3.1 Evaluation of the modelled FFDI vs reanalysis
We begin by evaluating fire weather derived from the PPE model simulations against FFDI constructed from reanalysis. Figure 1 compares the time spent in Low–Moderate, High, Very High, and Severe+ FFDI categories during the baseline period (1986–2005) from the PPE ensemble with FFDI calculated from Copernicus reanalysis data. Overall, the model reproduces the large-scale spatial patterns of fire weather across FFDI categories well. Both the Copernicus reanalysis and the PPE ensemble show High and Very High FFDI emerging in known fire-prone regions, including the western USA, the Cerrado and central Argentina, the interior of Australia, the Mediterranean Basin, western India, the Eurasian Steppe, and southern African grasslands. In these regions, the ensemble spread is generally small, indicating strong agreement across ensemble members.
At high northern latitudes, both the Copernicus reanalysis and the HadCM3C ensemble indicate that fire weather remains predominantly within the Low–Moderate FFDI category throughout the year. A similar dominance of Low–Moderate FFDI is found in densely forested tropical regions, including much of the Amazon Basin, the Congo Basin, and the Maritime Southeast Asian region (including the Indonesian archipelago), reflecting persistently humid conditions. Northern boreal regions of North America show limited representation of High or Very High FFDI in both observations and model output, consistent with the FFDI's design for warmer, fuel-abundant environments.
In arid and semi-arid regions, including the Sahara and Sahel, both Copernicus and the PPE show extended periods of elevated fire weather, with approximately 2–4 months in the High FFDI category, 6–8 months in Very High FFDI, and in some areas 1–2 months reaching Severe+ FFDI. Similar seasonal lengths are evident in northern India and central Australia, although there is no strong signal of Severe+ conditions in these locations.
Across most regions, the Copernicus-derived FFDI falls within the spread of the PPE ensemble. Where systematic biases appear, these are typically modest and regionally specific. In parts of the Sahel, the ensemble tends to overestimate time spent in the Low–Moderate category, with around 95 % of ensemble members exceeding the Copernicus estimate, and correspondingly underestimate time spent at High and above FFDI. A similar bias is evident in central Australia. In the Cerredo region of Brazil, this bias is present but weaker, with approximately 90 % of ensemble members indicating slightly longer Low–Moderate periods than observed.
The model also captures the presence of the Eurasian Steppe fire region, although its spatial extent appears slightly displaced northward. In the southern part of this region, the ensemble tends to overestimate Low–Moderate FFDI and underestimate High or greater FFDI. In contrast, the opposite bias is apparent toward the northern margins. Across India, the ensemble tends to underestimate time spent in the Low–Moderate category (with more than 95 % of ensemble members below the Copernicus estimate) and overestimate time spent in Very High FFDI. Parts of the western USA show a tendency toward longer Low–Moderate periods (80 %–95 % of ensemble members above Copernicus) and correspondingly less time in the High category.
Despite these regional biases, the PPE ensemble consistently reproduces the observed spatial patterns of fire weather categories. Importantly, even in regions where the ensemble mean shows a bias, the ensemble distribution still encompasses the observational Copernicus-derived FFDI. This supports the use of PPE to assess changes in fire-weather characteristics, including the timing and duration of Low, transitional, and peak fire-weather periods, in the regions examined in this study – Australia, the USA, and Brazil.
Table 2Normalized Mean Error (NME) scores for the PPE ensemble compared to Copernicus-derived FFDI for the baseline period (1986–2005). Scores are shown for each FFDI category (Low–Moderate, High, Very High, Severe+), with NME1 representing absolute differences, NME2 differences after mean removal, and NME3 differences after removal of both mean and variance to assess spatial patterns. Lower NME scores indicate better model performance. For comparison, three null models are included: the median and mean null models, which represent the best single-value predictions across the domain, and a randomly resampled null model (1000 iterations, 5–95th percentile range), which provides an expected range for a model with no skill. Numbers in bold highlight performances that are better than the median null model; italics are better than the mean null model.
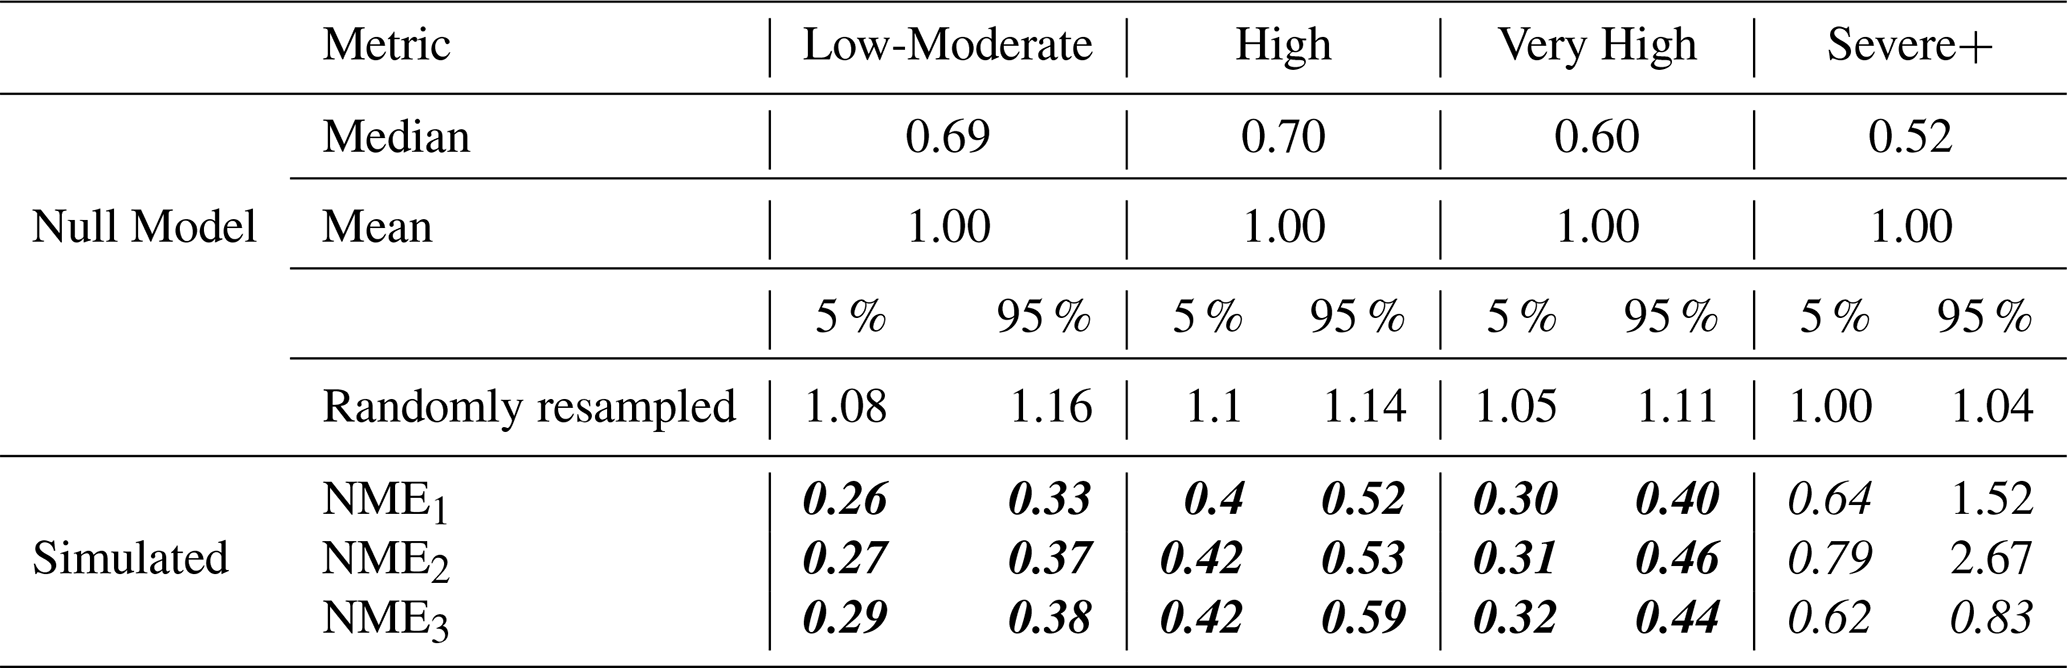
The spatial performance of the PPE in different FFDI categories compared to reanalysis FFDI is reflected in the Normalized Mean Error (NME) scores (Table 2). For annual average time in the Low–Moderate category, NME1 scores across the ensemble range from 0.26–0.33, indicating that the model ensemble is on average 52 %–62 % closer to the Copernicus FFDI than the median null model score of 0.69. When focusing on spatial patterns using NME3, Low–Moderate scores are 0.29–0.38, indicating that the model reliably reproduces the distribution of low fire-weather days across regions. Performance is slightly lower for higher FFDI categories, reflecting the increased stochasticity of extreme fire weather. For High fire weather days, NME1 ranges from 0.40–0.52, while NME3 ranges from 0.42–0.59, indicating reasonable skill in both magnitude and spatial distribution. At Very High FFDI, the ensemble still performs well, with NME1 of 0.30–0.40 versus a median null of 0.60, and NME3 of 0.32–0.44. Model skill declines for the Severe+ category, with NME1 ranging 0.64–1.52, exceeding the median null model (0.52) in most ensemble members. Randomly resampled null models give a 5th–95th percentile range of 1.00–1.04, illustrating that some ensemble members perform worse than a random expectation due to the very limited occurrence of extreme FFDI days in both the simulation and observations. Nonetheless, NME3 scores of 0.62–0.83 show that the ensemble still captures broad spatial patterns of more extreme FFDIs, albeit with increased uncertainty.
Overall, these results indicate that the PPE ensemble provides a robust representation of fire weather across Low–Moderate, High, and Very High categories, capturing both spatial and temporal patterns observed in reanalysis data. Severe+ fire weather is less well represented due to its rarity, and therefore the rest of our global and country-level analyses focus primarily on the Low–Moderate to Very High range.
We also illustrate in Fig. A1 that the time spent in Low–Moderate, High, and Very High FFDI categories throughout the year serves as an indicator of likely annual burned area. For example, regions that remain in the Low–Moderate category for almost the entire year show negligible burned area. Intermediate burned area (around 1 %) is associated with a reduction in Low–Moderate FFDI to approximately 335 d and an increase in High FFDI to roughly one month. The most extreme burned areas occur where Low–Moderate FFDI drops to around 250 d, accompanied by increases in both High and, importantly, Very High FFDI. This demonstrates that the FFDI categories provide a physically meaningful proxy for fire activity over the course of a year.
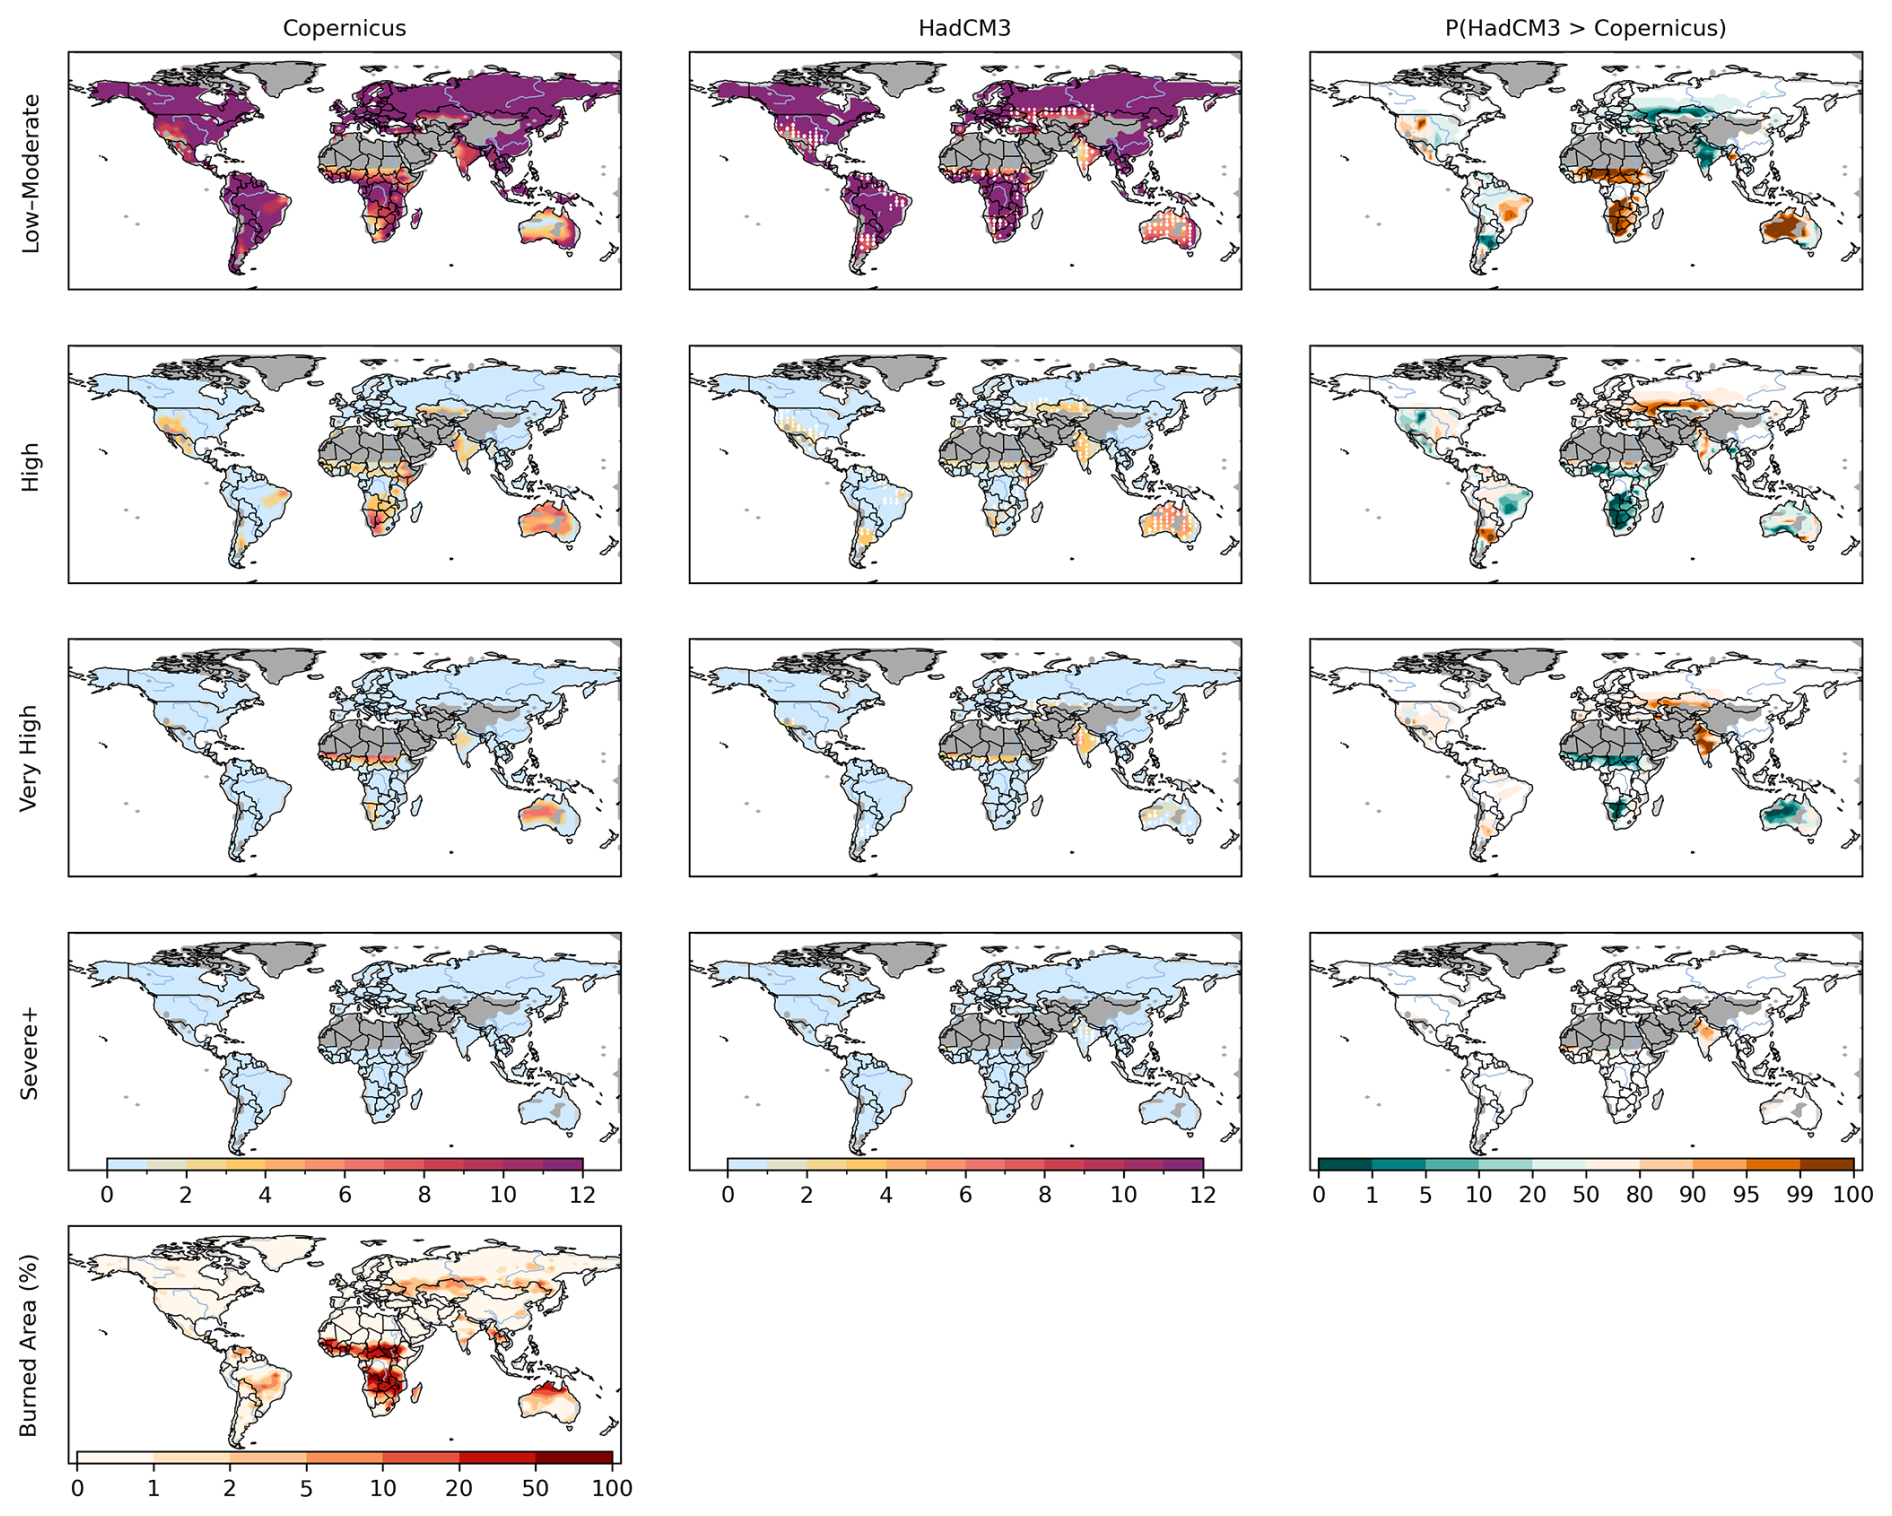
Figure 1Comparison of the average number of days per year within the (top to bottom) Low-moderate, High, Very High, and Severe or greater FFDI categories for 1986–2005, defined in Table 1. The first column shows data from Copernicus FFDI (CMES, 2019), while the second column displays HadCM3C PPE historical data (1986–2005). The model ensemble data indicate the model agreement (consensus) across the PPE, with large white dots highlighting where more than 10 % of ensemble members exhibit over one month's variation in time within that category. The third column presents the percentage of members with more time in each category compared to Copernicus, following the ensemble-based evaluation described in Barbosa et al. (2025). A value of 50 % indicates that Copernicus falls in the middle of the ensemble, suggesting an unbiased estimate, 0 or 100 indicates a biased ensemble that over- or underestimates the amount of time, respectively. We show mean annual burned area from ESA Fire CCI version 5.1 (Chuvieco et al., 2019) in the lowest panel for qualitative comparison with global patterns of fire weather derived from FFDI. Burned area is included as an observable indicator of fire activity rather than a direct measure of fire danger, and should therefore be interpreted only as contextual information rather than a target or metric of FFDI effectiveness.
3.2 FFDI fire season changes
3.2.1 Increases in Very High fire weather
We use Very High fire weather (≥24, Table 1) to determine changes in the fire season length. Table 3 gives the percent of the exposed area with an increase in the number of days above the Very High FFDI threshold globally, as well as for Australia, Brazil, and the USA, for the three GWLs and both emissions scenarios. Globally, we project between 30 % (central estimate, 25 %–37 % across the ensemble) at 1.5 °C to 50 % (41 %–58 %) at 4.0 °C of exposed area with increased fire weather days under higher emissions (RCP8.5). Limiting warming to 2.0 °C with the mitigation scenario (RCP2.6) gives 35 % (31 %–42 %) and 31 % (25 %–36 %) if we limit to 1.5 °C.
Table 3The percent of the exposed area with an increase in the number of days above the Very High FFDI threshold (compared to 1986–2005) showing the 50th percentile (central estimate) of the PPE ensemble and the 10th and 90th percentiles in brackets below, for the three GWLs (1.5, 2.0 and 4.0 °C).
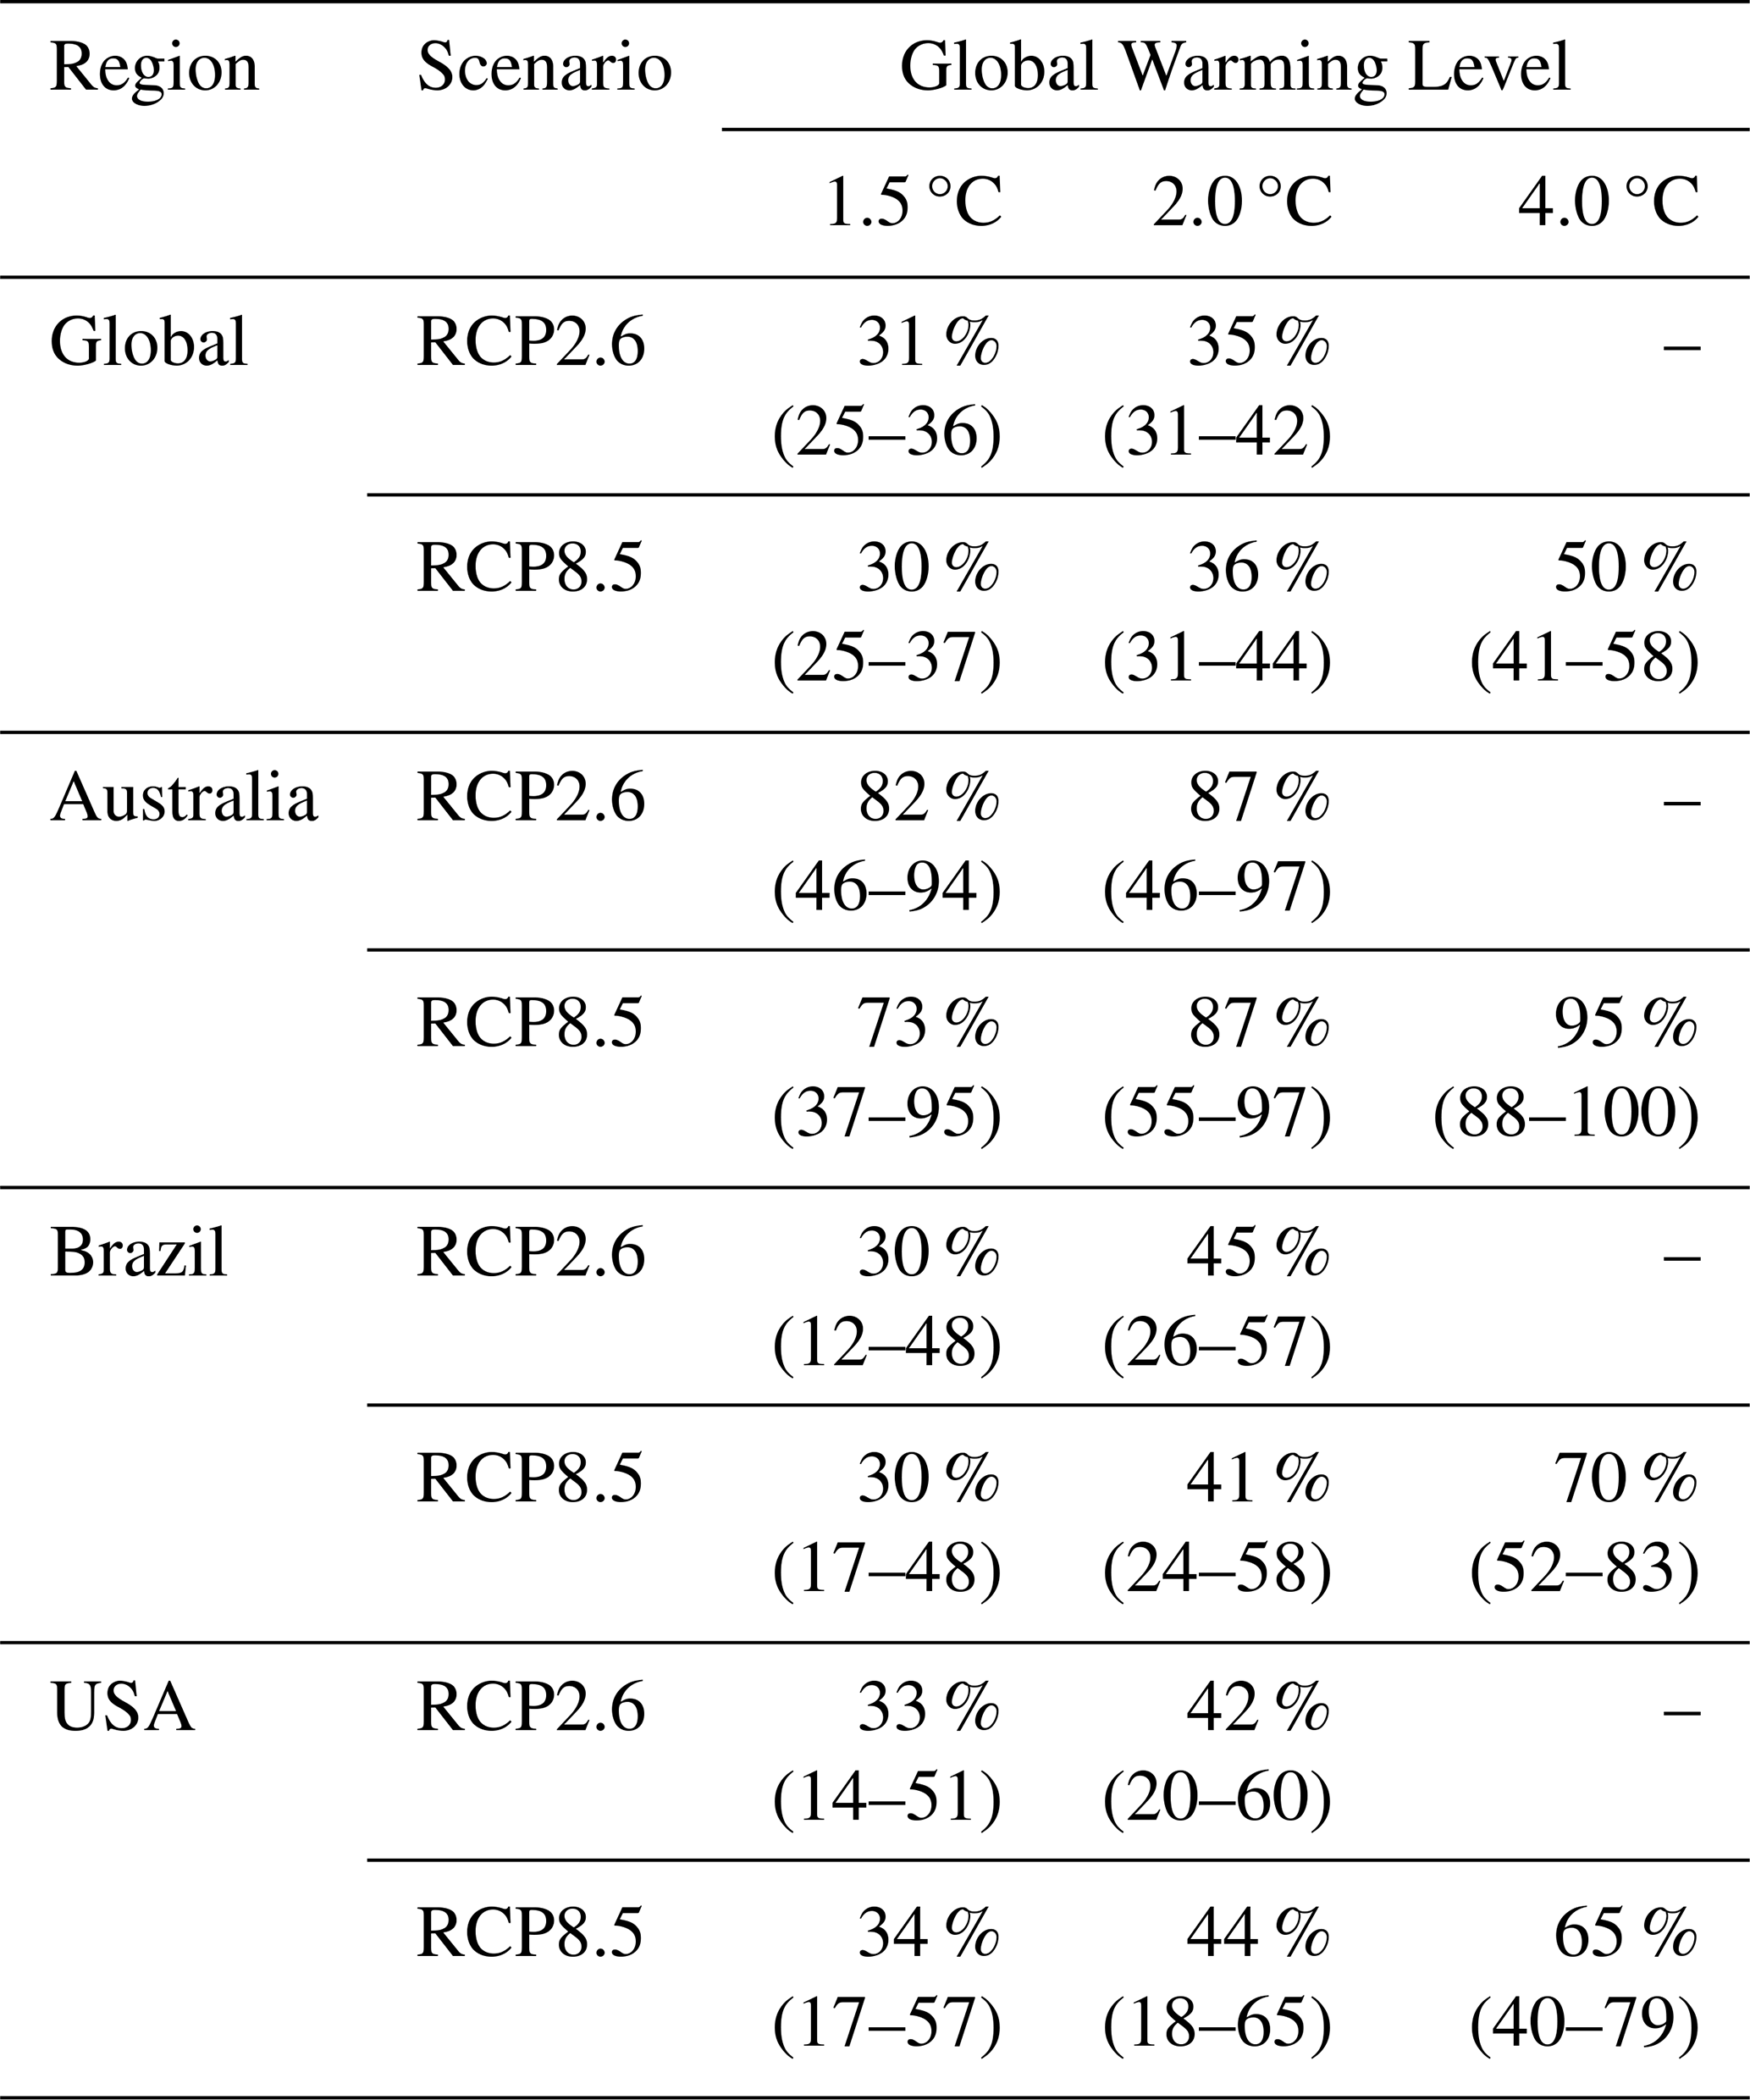
Australia has the largest amount of its exposed area surface increase in Very High fire weather at all future GWLs, ranging from 73 % (37 %–95 %) at 1.5 °C to 95 % (88 %–100 %) at 4.0 °C under higher emissions. For the mitigation scenario, 87 % (46 %–97 %) at 2.0 °C and 82 % (46 %–94 %) at 1.5 °C of the land show an increase in fire weather days. Most of Australia is fuel-limited (Kelley et al., 2019) and vegetation productivity changes will likely have a strong influence on the resultant burnt area and fire intensity in the future (Haas et al., 2026). However, we show the same pattern in the more populated and moisture-limited southern Eastern Australia (Fig. 2), though with slightly less agreement in these fuel-abundant regions at 1.5 °C. Across Brazil, 30 % (17 %–48 % at 1.5 °C) to 70 % (52 %–83 % at 4.0 °C) of the exposed area has an increase in Very High fire weather days. There is a considerable increase between 1.5 and 2.0 °C for both emissions scenarios, with 45 % (26 %–57 %) of the exposed area experiencing an increase in fire weather days at 2.0 °C for RCP2.6. For the USA, our simulations indicate between 34 % (17 %–57 % at 1.5 °C) and 65 % (40 %–79 % at 4.0 °C) of the exposed area experiencing an increase in fire weather days in RCP8.5 with the mitigation scenario limiting it to 42 % (20 %–60 %) at 2.0 °C for RCP2.6.
There is strong consensus for increases in Very High fire weather days across the eastern USA, Brazil, southern South America, southern Africa, northern Africa, southern Europe, central Asia and Australia (Fig. 2). Both 1.5 and 2.0 °C look broadly similar for both emissions scenarios; however, there are spatial differences in the extent of increases and the amount of consensus. The number of fire weather days and the level of consensus increase with warming across all regions, wherever fire weather conditions rise. There are also consistent areas showing decreases across the tropics in India and Africa, which continue to 4.0 °C, though over a reduced spatial area. Western USA and Eastern Amazon show a reasonable consensus (normally >70 %) for an increase in Very High FFDI at 1.5 °C. However, areas affected by the Black Summer fires along Southeast Australia show less consensus, often <50 %, at 1.5 °C. Consensus increases in all these regions at 2.0 °C and approaches 100 % by 4.0 °C.
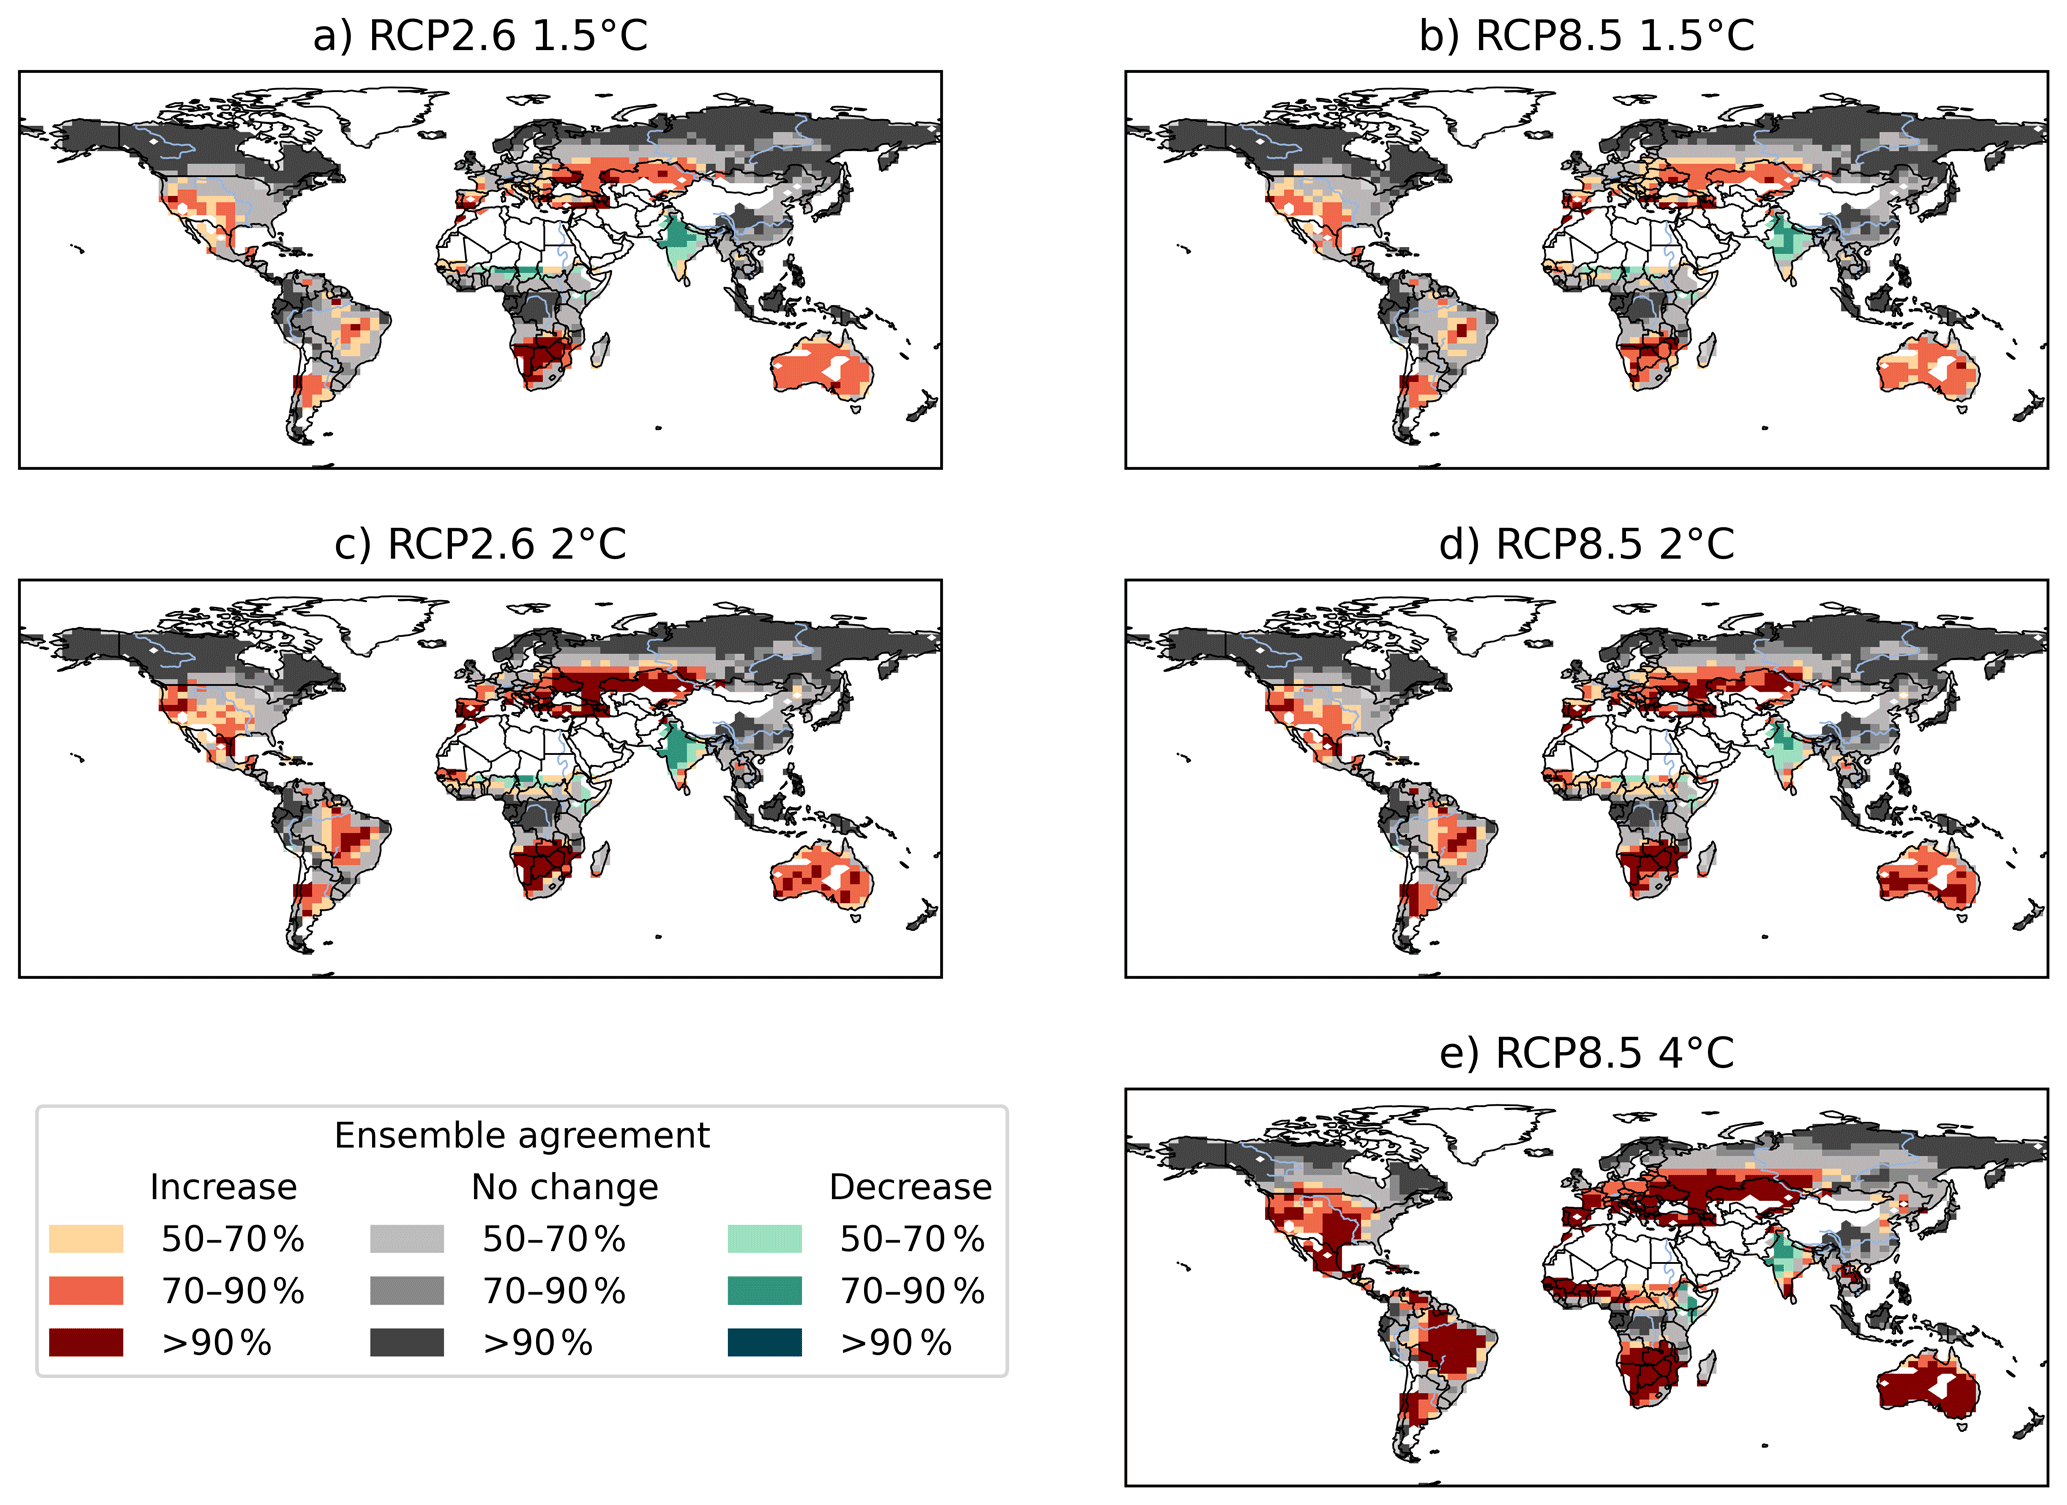
Figure 2Agreement in the change of number of days at or above the Very High FFDI threshold presented as consensus plots showing model agreement across the 57-member PPE using the method of Kaye et al. (2012) as implemented in Taylor et al. (2013) to show areas of ensemble member agreement, or “consensus”. Red indicates areas with an increase in the number of days, compared to the baseline period (1986–2005). Grey is no change and green indicates a decrease. The darker the colour, the more models agree with that change. White areas indicate no clear consensus. Non-burnable land has been excluded and appears white. For RCP2.6 (a, c) and RCP8.5 (b, d, f) and three GWLs, 1.5 °C (a, b), 2.0 °C (c, d) and 4.0 °C (e).
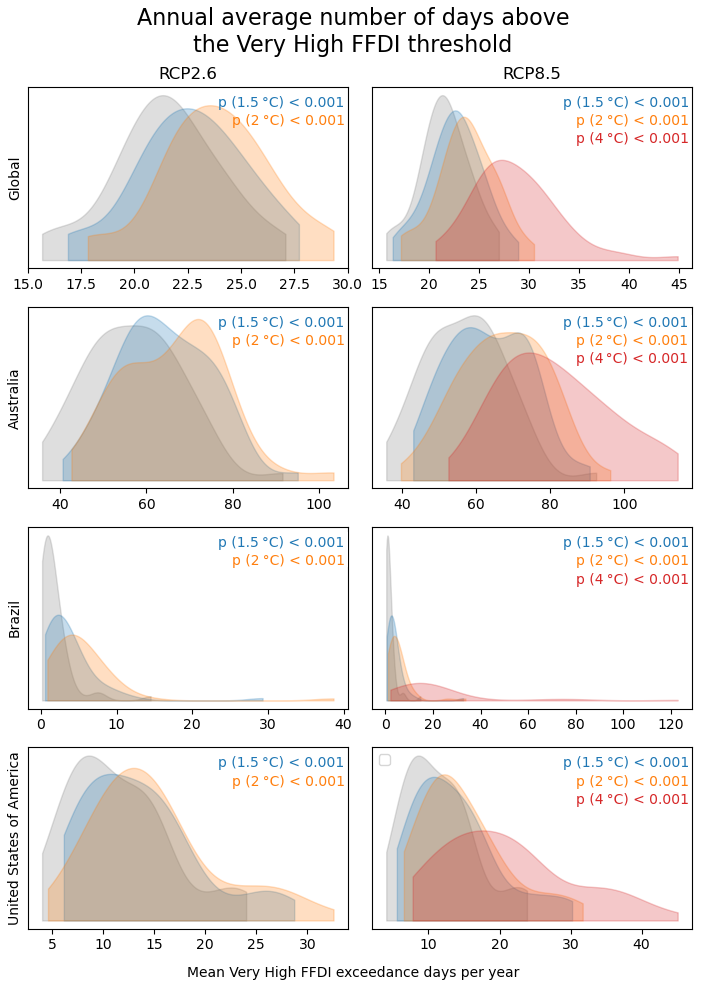
Figure 3The annual average number of days above the Very High FFDI threshold for 3 future Global Warming Levels, 1.5, 2.0 and 4.0 °C and the baseline of 1986–2005, for 2 emissions scenarios, RCP 2.6 (a mitigation scenario, left column) and RCP 8.5 (a high-end scenario, right column), and for (top to bottom) globally, and for Australia, Brazil and the USA. P-values indicate the significance of differences between future GWLs and the baseline, assessed using a one-sided paired Wilcoxon signed-rank test, with pairing by ensemble member.
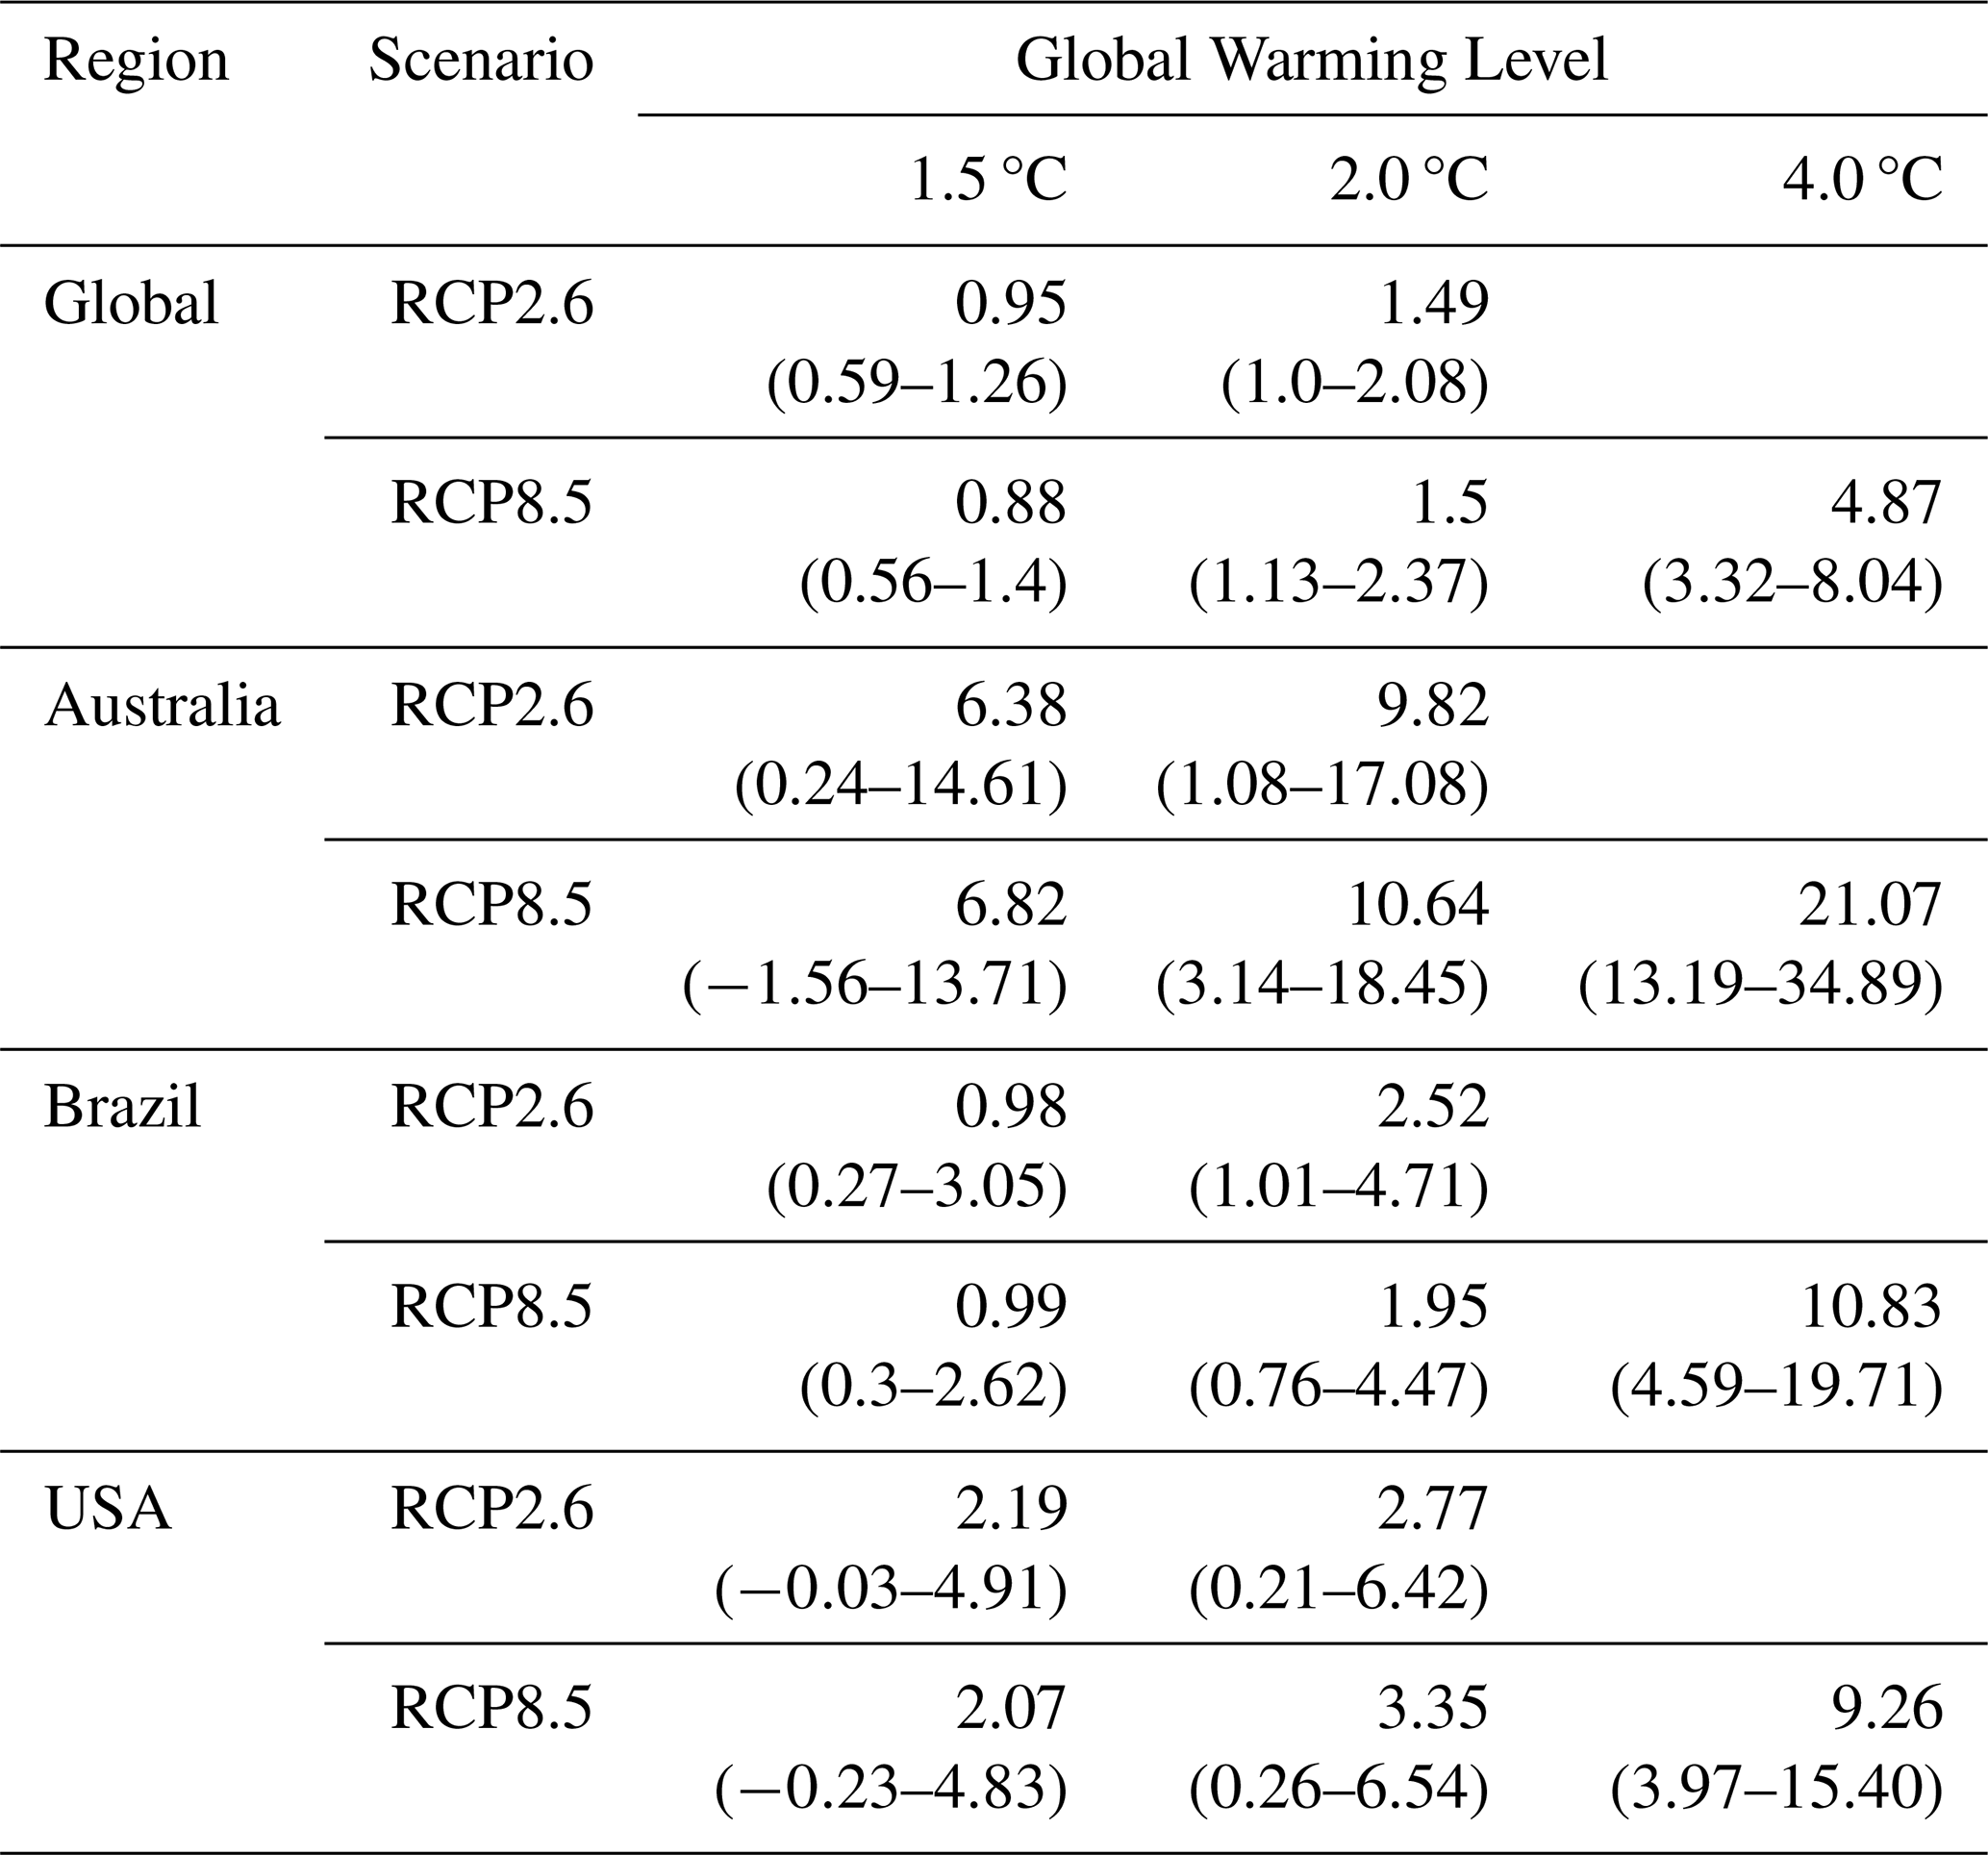
Figure 3 shows the distribution of the annual number of days at or above the Very High FFDI threshold across the ensemble, while Table 4 summarises the corresponding mean change relative to the baseline period for each Global Warming Level (GWL). Globally, there is a clear shift towards longer fire seasons as warming increases (Fig. 3). Even at 1.5 °C, the distribution moves towards higher values, with an increase of around one additional Very High fire weather day per year on average (Table 4, 0.95 d, 10–90th percentile range 0.59–1.26 under RCP2.6; 0.88, 0.56–1.40 under RCP8.5). While these global mean changes are modest, they reflect consistent shifts across regions and mask much larger regional responses.
Australia, for example, exhibits the strongest and most robust signal out of our three countries analysed. In absolute terms, the minimum number of Very High FFDI days across the ensemble increases from 36 d yr−1 in the baseline period (1986–2005) to 40–43 d at 1.5 and 2.0 °C, reaching 53 d at 4.0 °C under RCP8.5 (Fig. 3). These shifts correspond to large increases relative to baseline (Table 4), particularly at higher warming levels: +9.82 d (1.08–17.08) at 2.0 °C under RCP2.6, +10.64 d (3.14–18.45) at 2.0 °C under RCP8.5, and +21.07 d (13.19–34.89) at 4.0 °C. All ensemble percentiles show positive changes, indicating a substantial and unavoidable lengthening of the core fire season with warming.
Brazil shows greater variability but increasingly pronounced changes at higher warming levels. In absolute terms, some ensemble members retain fewer than one Very High FFDI day per year even at 4.0 °C, reflecting continued interannual variability (Fig. 3). However, the upper tail of the distribution expands dramatically, with peak years increasing from a baseline maximum of around 15 to 33 d at 1.5 °C, 34 d at 2.0 °C, and as many as 123 d at 4.0 °C. These distributional shifts are reflected in the mean changes (Table 4), which remain small under strong mitigation (+0.98 d, 0.27–3.05 at 1.5 °C under RCP2.6) but increase sharply at higher warming levels (+10.83 d, 4.59–19.71 at 4.0 °C under RCP8.5). This indicates a growing risk of exceptionally long fire seasons emerging from the upper tail of the climate distribution.
The USA shows smaller mean changes and greater uncertainty across the PPE. Absolute distributions indicate that some ensemble members still produce fewer than five Very High FFDI days per year even at 4.0 °C (Fig. 3), highlighting persistent variability. Correspondingly, mean changes at 1.5 °C remain uncertain, with ranges spanning zero (+2.19 d, −0.03–4.91 under RCP2.6; +2.07 d, −0.23–4.83 under RCP8.5; Table 4). However, by 4.0 °C, all ensemble members indicate an increase (+9.26 d, 3.97–15.40 under RCP8.5), and the upper tail of the distribution shifts from around 24 d in the baseline to up to 45 d yr−1, signalling a heightened likelihood of unusually long and severe fire seasons.
Across all regions, these results demonstrate that warming drives both systematic increases in the average length of the Very High fire weather season and disproportionate changes in the extreme tails of the distribution, particularly under higher warming levels. While mitigation limits the magnitude of change, even 1.5 °C warming is associated with meaningful lengthening of the fire season in some regions, underscoring the need for adaptation alongside mitigation.
Table 4The average (over land and excluding non-burnable land) change in the number of days above the Very High FFDI threshold (compared to 1986–2005) for the two scenarios, RCP2.6 and RCP8.5, the three Global Warming Levels, 1.5, 2.0 and 4.0 °C, showing the 50th percentile (central estimate) of the PPE ensemble and the 10th and 90th percentiles in brackets below.
3.2.2 Mitigation potential
Figure 4 illustrates the influence of mitigation on the number of days exceeding the Very High FFDI threshold, expressed as the difference between a 4.0 °C warming level and lower warming levels of 2.0 and 1.5 °C. Under RCP8.5, all PPE members globally show reductions in Very High fire weather days when warming is limited, with decreases ranging from 2–17 d at 2.0 °C and 2–20 d at 1.5 °C relative to 4.0 °C (p<0.001 for all results).
Regionally, similar patterns emerge, though with greater spread reflecting regional climate responses. In Australia, reductions under RCP8.5 range from 1–33 d at 2.0 °C and 7–40 d at 1.5 °C, while in Brazil the corresponding reductions are substantially larger, spanning a 1–97 d at 2.0 °C and 2–111 d at 1.5 °C. In the USA, most ensemble members project reductions of up to 23 d at 2.0 °C and 26 d at 1.5 °C, although a small number of members show near-zero or slight increases, indicating lower confidence in the magnitude of change. Overall, the difference between the 1.5 and 2.0 °C pathways is comparatively modest across regions, whereas the contrast with a 4.0 °C world is pronounced. Though 1.5 °C does tend to show are larger reduction vs. 4.0 °C than 2.0 °C.
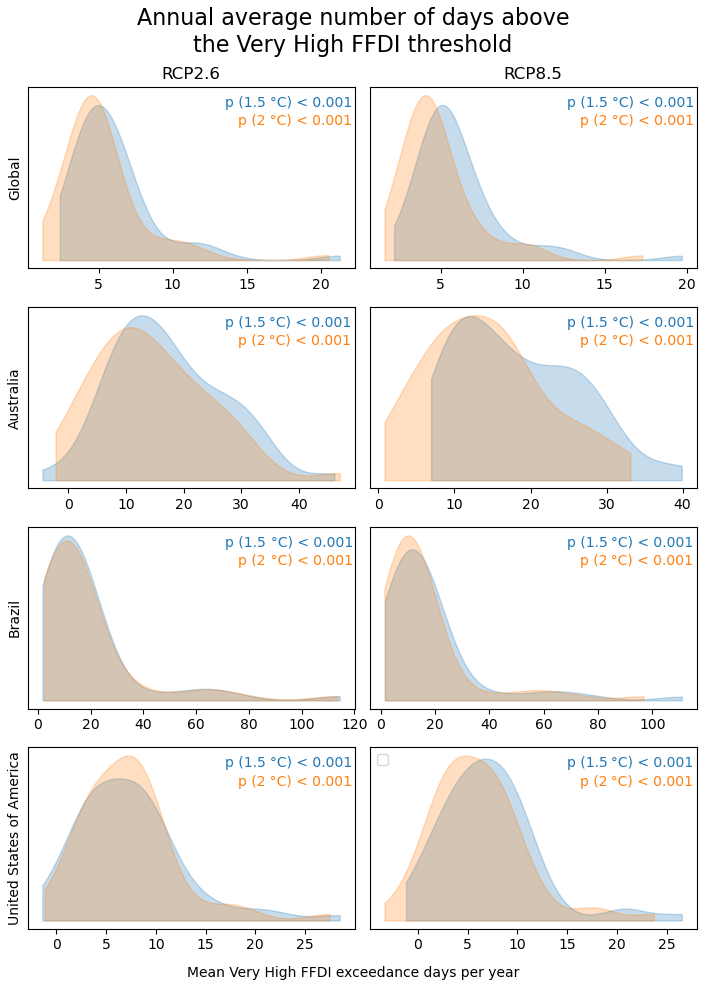
Figure 4The influence of mitigation scenarios on the change in annual average number of days above the Very High FFDI threshold, calculated as the difference between 4.0 °C GWL (RCP8.5) and 1.5 °C (blue) and 2.0 °C (orange) respectively, for both emission scenarios. RCP2.6 (left column) and RCP8.5 (right column), and for (top to bottom) Globally, Australia, Brazil and the USA. P-values indicate the significance of differences between future GWLs and RCP8.5 4.0 °C GWL, assessed using a one-sided paired Wilcoxon signed-rank test, with pairing by ensemble member.
3.2.3 Meteorological drivers of FFDI
Figure 5 shows the relative importance of meteorological drivers contributing to FFDI variability for Australia, Brazil, and the USA, estimated using RF models for baseline conditions and for a GWL of 4.0 °C. Across all regions, relative humidity, air temperature, and wind speed dominate the importance rankings under baseline conditions, while precipitation and soil moisture contribute comparatively little to short-term FFDI variability.
Under a GWL of 4.0 °, all regions exhibit a consistent reduction in the relative importance of relative humidity, temperature, and wind, accompanied by modest increases in the importance of soil moisture and, to a lesser extent, precipitation. In Australia, mean importance values for relative humidity, temperature, and wind decrease from 0.17, 0.13, and 0.10 at baseline to 0.12, 0.09, and 0.07 at GWL4, respectively, while soil moisture remains low but slightly increases in relative contribution. Brazil shows the strongest shifts, with relative humidity, temperature, and wind importance declining substantially (relative humidity from 0.50 to 0.33; temperature from 0.37 to 0.24; wind from 0.39 to 0.24), alongside a near-doubling of soil-moisture importance. In the USA, similar but more moderate changes are observed, with decreasing importance of atmospheric drivers and increasing contributions from soil moisture and precipitation.
The reduction in the relative importance of individual atmospheric variables under strong warming is accompanied by increased similarity in their contributions, suggesting a reduced separability of meteorological drivers in explaining FFDI variability at higher warming levels. Standard deviations across bootstrap samples remain small in all regions and warming levels, indicating robust and internally consistent estimates of relative importance. Differences in importance between variables is significant (t-test < 0.001) for all regions and for the baseline and 4.0 °C of warming.
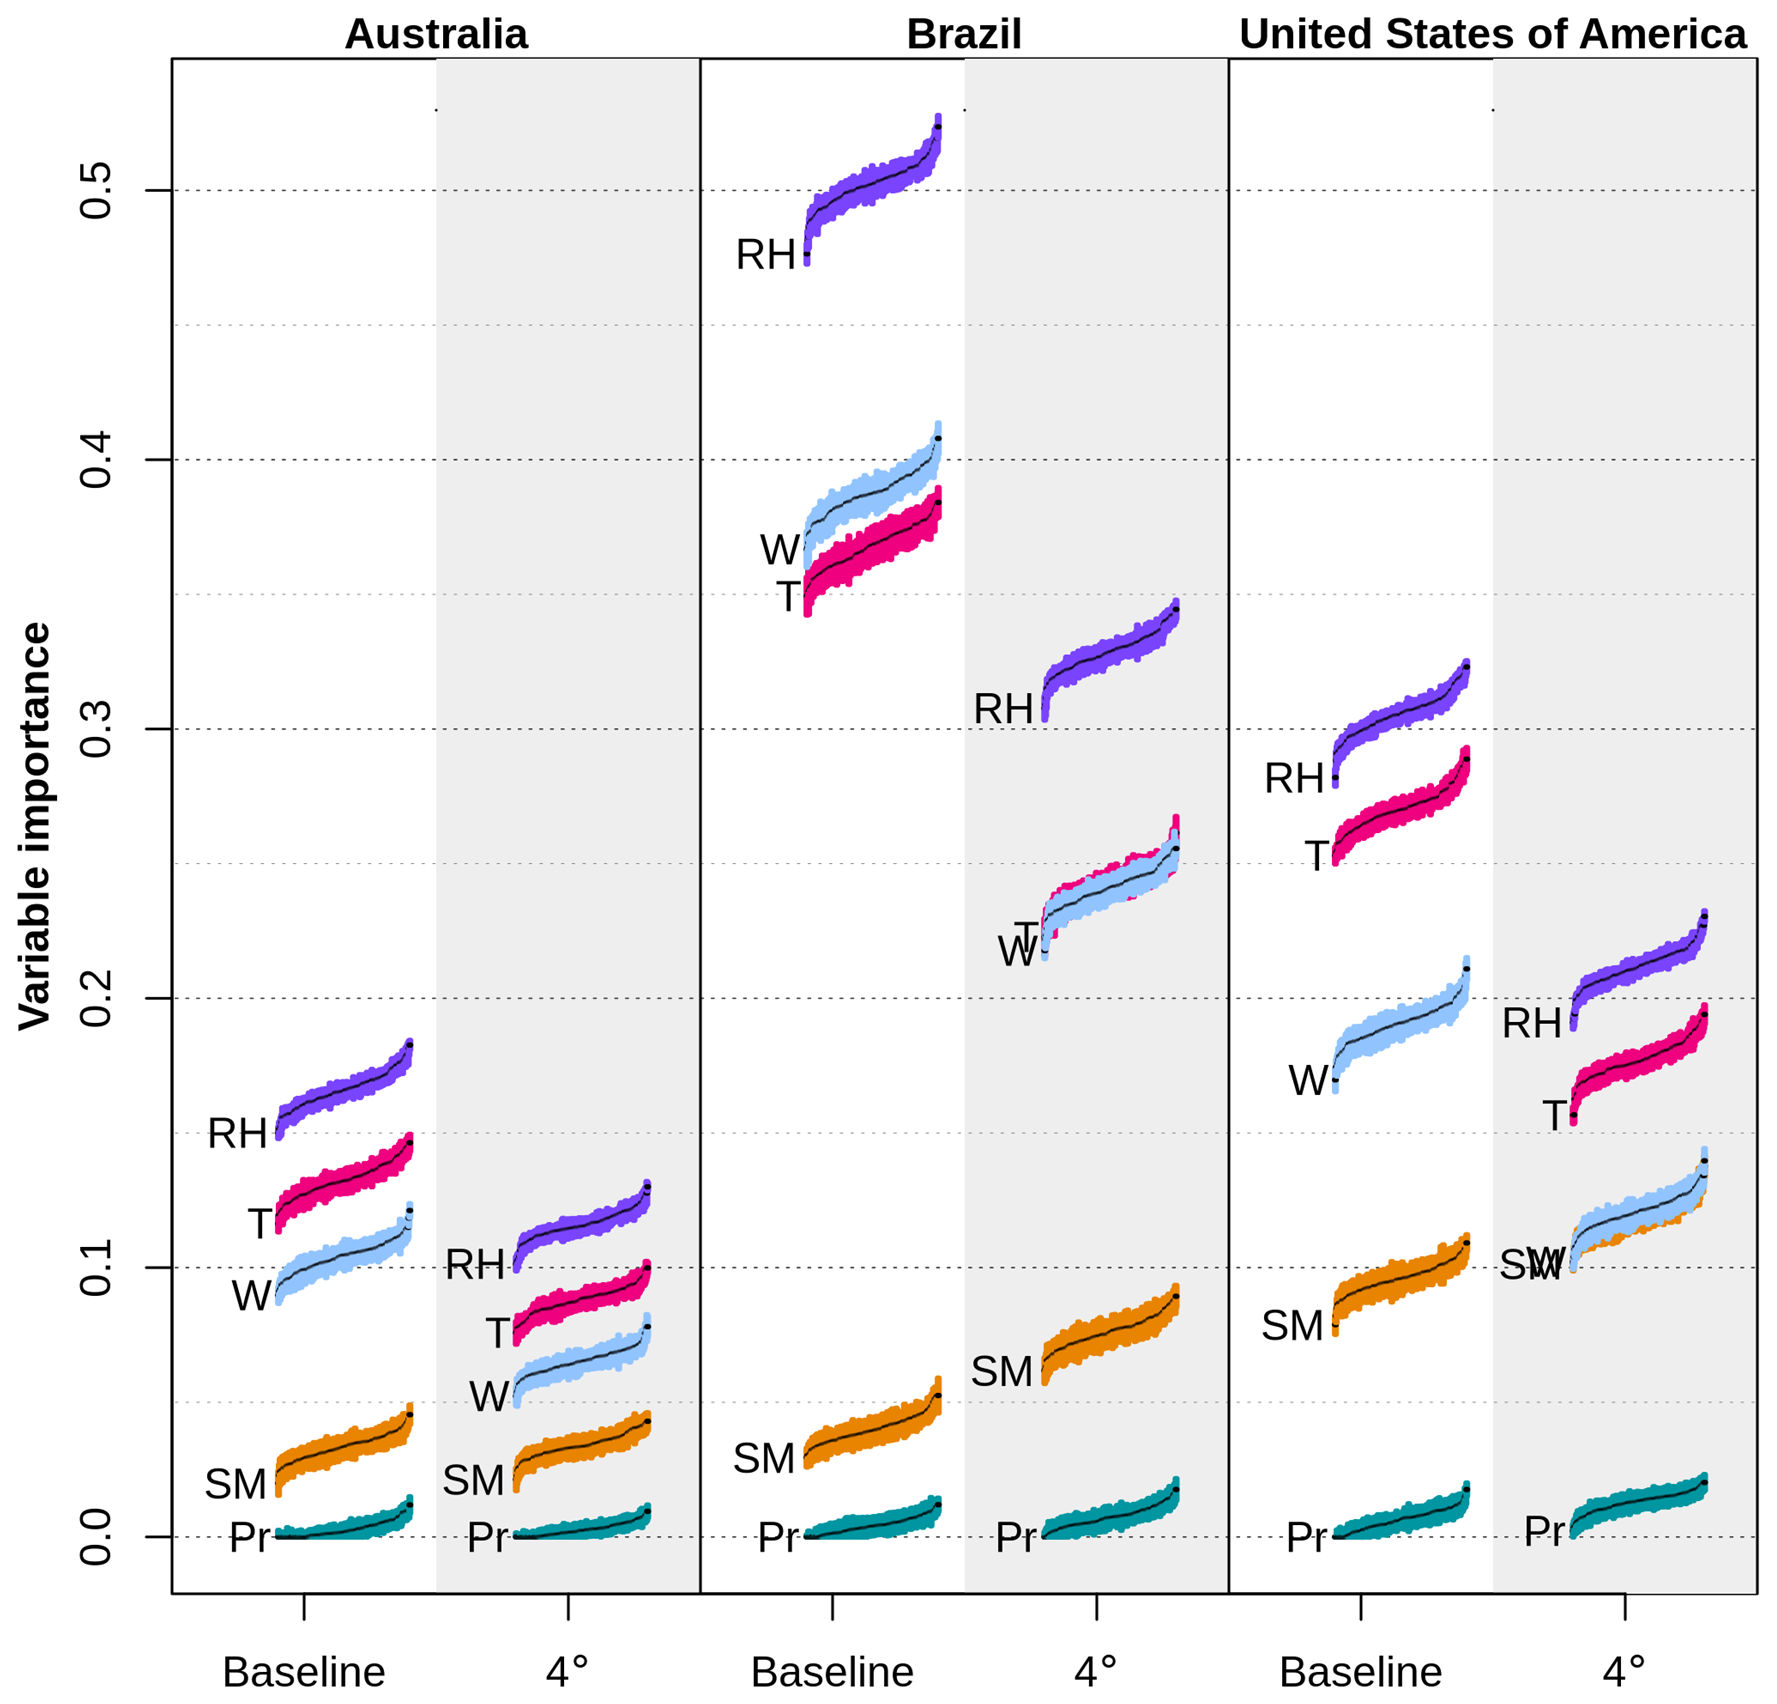
Figure 5Relative variable importance of meteorological drivers contributing to the Fire Forest Danger Index (FFDI), derived from random forest models, shown for (left to right) Australia, Brazil, and the USA. For each region, results are presented for baseline conditions (1986–2005; left column within each panel) and for a Global Warming Level (GWL) of 4.0 °C (right column). The variables are Relative Humidity (RH), Temperature (T), Wind speed (W), Soil Moisture (SM) and Precipitation (P). Variable importance values are based on 1000 bootstrapped random forest models; black bars show the mean importance across bootstrap samples, with shaded regions indicating ±1 standard deviation, illustrating variability in the estimated means and their spread.
3.2.4 Change in FFDI seasonal cycle
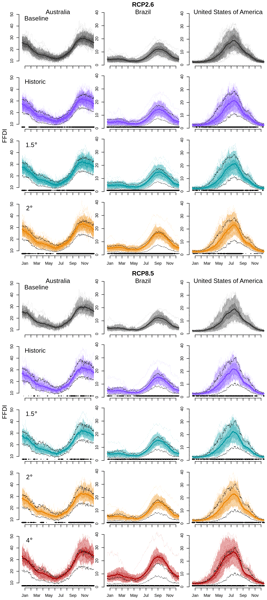
Figure 6 examines how changes in fire weather evolve across the full annual cycle by analysing the daily 90th percentile of FFDI for each model grid cell, averaged over 20-year periods at each Global Warming Level (GWL). For the baseline period (1986–2005), Australia, Brazil, and the USA each exhibit a clear seasonal cycle, with elevated fire weather during spring and summer and lower FFDI values during winter. This cycle is retained across all warming levels and emissions scenarios, indicating no fundamental change in the overall shape of the fire season. However, substantial amplification occurs across all phases of the season as warming increases.
During the baseline period, the PPE ensemble shows considerable spread in FFDI during elevated fire weather across all three regions. Even at 1.5 °C of global warming, fire weather increases across much of the fire season in all regions, with larger increases at higher GWLs. As warming intensifies, peak FFDI values rise further, and ensemble spread increases, while minimum FFDI values remain comparatively stable, indicating a widening of fire-weather extremes rather than a uniform upward shift.
In Australia, the largest changes in FFDI occur during the core fire season. Baseline peak FFDI values of 25–37 (5th–95th percentile across ensemble members) in October–November increase to 28–40 in the historical period and at 1.5 °C, rising further to 30–41 at 2.0 °C under RCP2.6 and 28–42 under RCP8.5. At 4.0 °C under RCP8.5, peak values increase substantially to 30–49. These fire-season changes are significantly different across GWLs and emissions scenarios. In contrast, out-of-season increases in FFDI emerge later under RCP8.5, becoming statistically significant only at 4.0 °C, though they are already detectable by 1.5 °C under RCP2.6.
Brazil exhibits the largest relative changes across the annual cycle of the three regions. Baseline peak FFDI values in September of 8–18 increase to 9–21 in the historical period, 10–21 at 1.5 °C under RCP2.6, and 11–22 under RCP8.5. At 2.0 °C, peak values reach 12–22 (RCP2.6) and 11–21 (RCP8.5), before rising sharply to 18–29 at 4.0 °C under RCP8.5. Unlike Australia, statistically significant increases in out-of-season FFDI emerge early, becoming nearly continuous across the year by 1.5 °C in both emissions scenarios. While the baseline period shows a modest elevation in FFDI after the fire season (3–8 through March), by 2.0 °C under RCP8.5 March begins to form a secondary peak, with 95th percentile values around 12, increasing to approximately 18 by 4.0 °C. These values fall within the range of the baseline September peak, suggesting a prolonged period of elevated fire risk extending several months beyond the historical fire season.
The USA shows the most pronounced increase in FFDI across the entire year, not solely during the peak fire season. Baseline peak FFDI values of 11–28 in July–August increase to 12–30 in the historical period, 13–31 at 1.5 °C under RCP2.6, and 13–32 under RCP8.5. At 2.0 °C, peak values reach 14–32 (RCP2.6) and 13–33 (RCP8.5), before rising sharply to 19–39 at 4.0 °C under RCP8.5. Importantly, even the lowest out-of-season FFDI values increase by 1–2 units across all GWLs, with statistically significant departures from the baseline already evident in the historical period. This indicates a systematic elevation of background fire weather risk throughout the year.
Across all three regions, warming leads to higher FFDI values during the peak fire season, earlier transitions into elevated fire weather, later transitions out, and a shortening of historically low-risk periods. While the overall seasonal shape is largely preserved – aside from the emergence of a secondary late-season peak in Brazil – the fire season effectively lengthens as conditions characteristic of today's fire season expand into transitional and off-season periods. By 4.0 °C, increases in FFDI are significant across all phases of the year in all regions, consistent with a future characterized by longer fire seasons, more extreme peak conditions, and reduced windows of low fire risk.
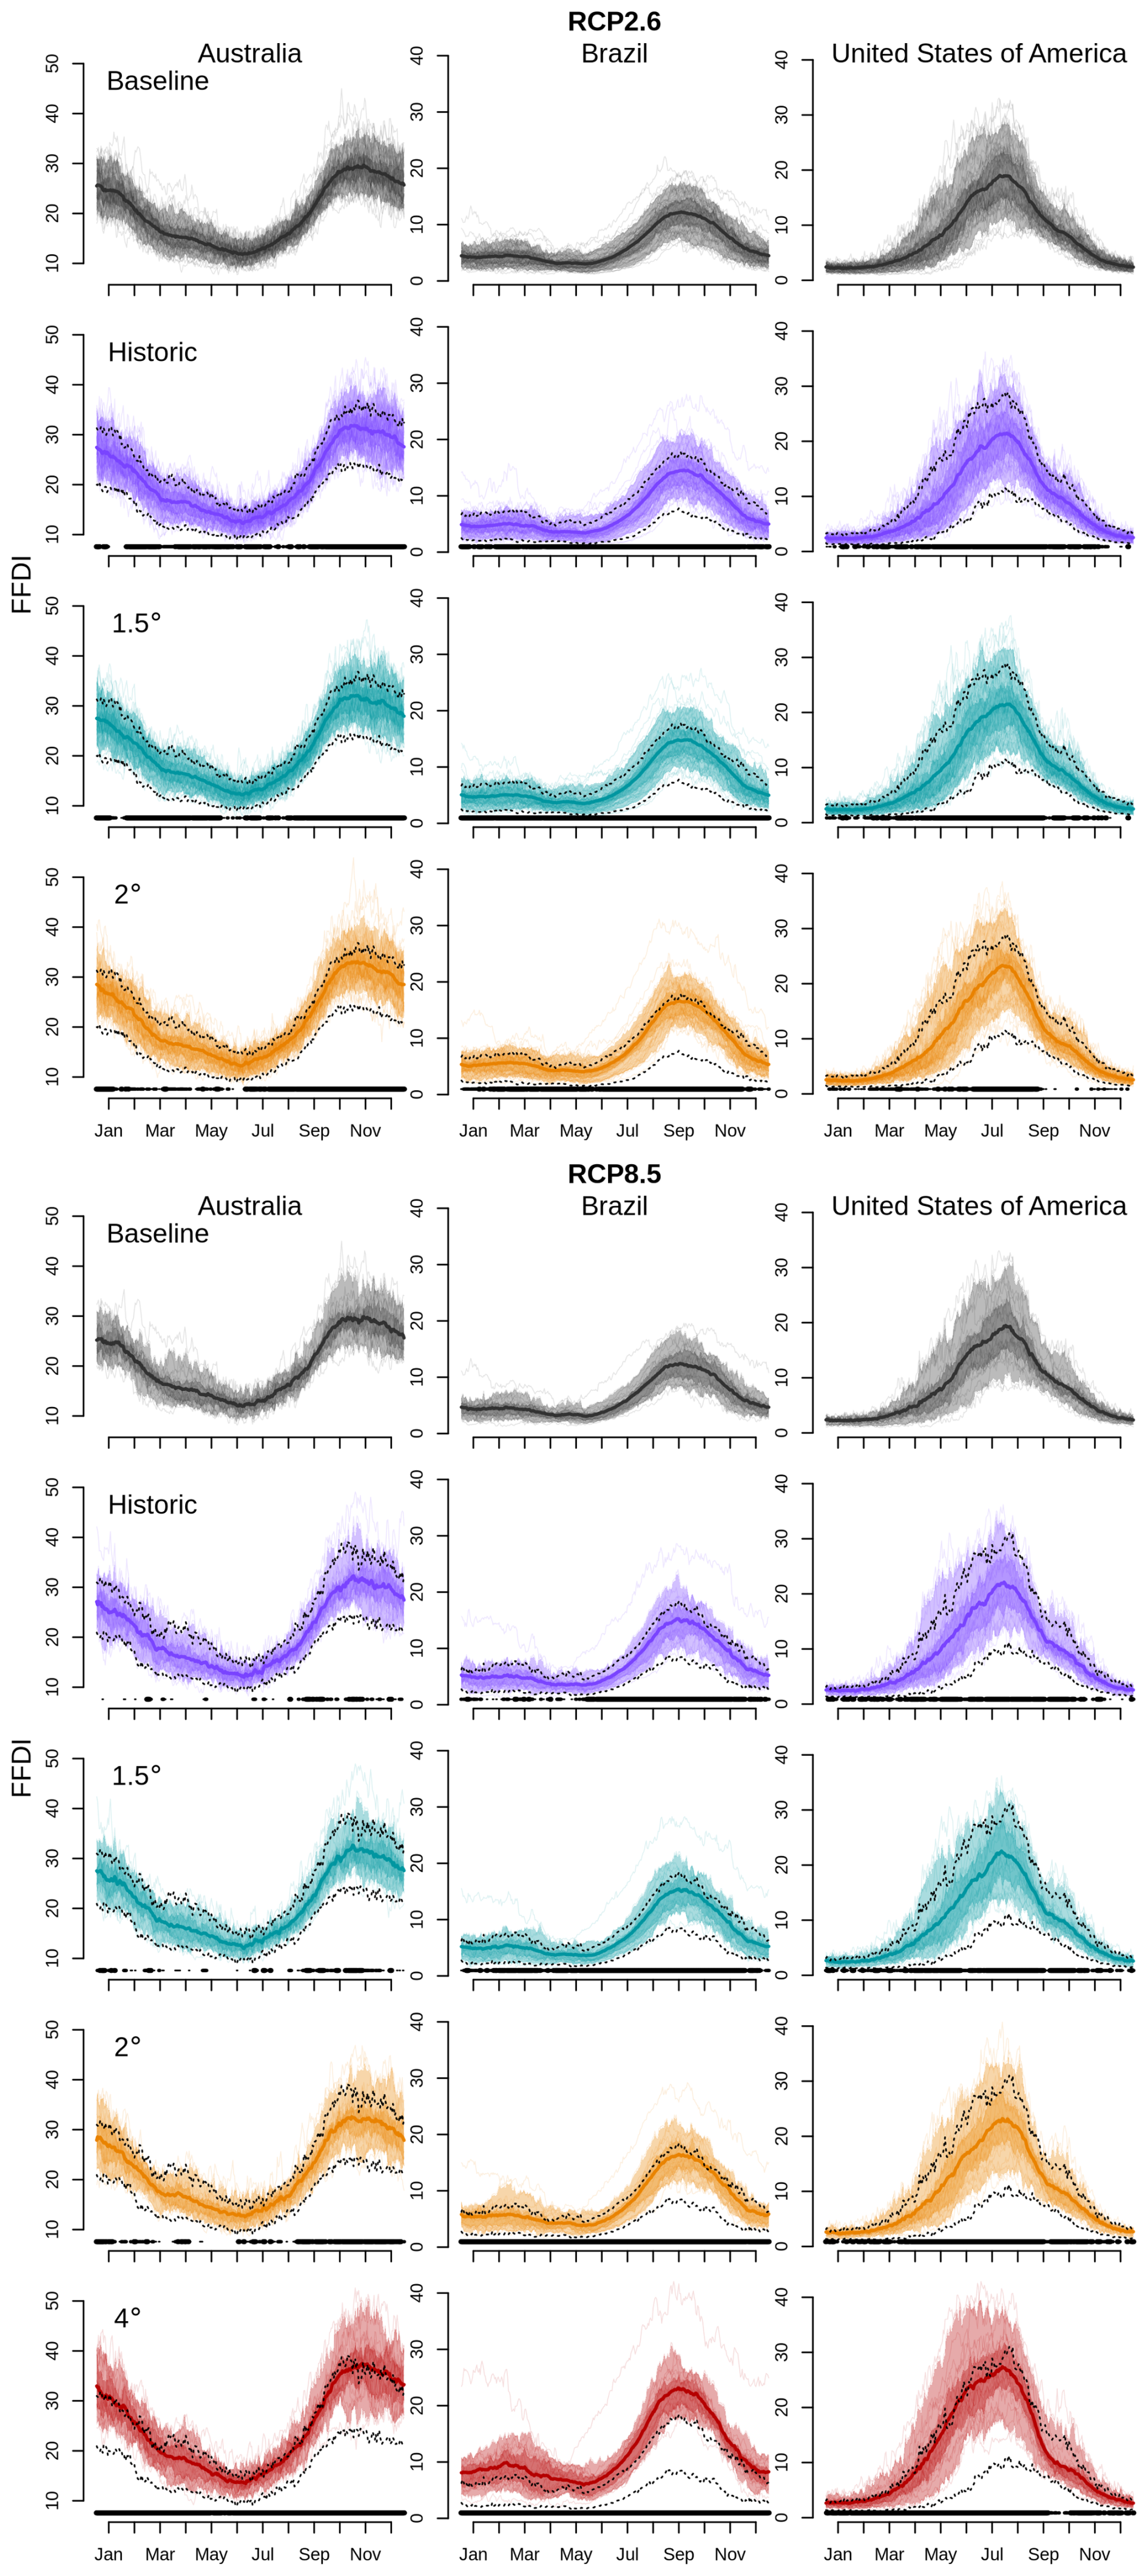
Figure 6Daily 90th percentile of future fire weather as represented by the FFDI for the baseline (1986–2005), historic (2004–2023), and three future Global Warming Levels – 1.5, 2.0, and 4.0 °C – for two emissions scenarios: (top) RCP2.6 and (bottom) RCP8.5; and (left to right) Australia, Brazil, and the USA. Thin lines depict individual ensemble members, with lighter shared areas indicating the 5–95th percentile range, darker areas showing the interquartile range, and solid-coloured lines representing the median across ensemble members. The black dotted region displays the 5–95th percentile from the baseline. The lines at the bottom of each plot show the significance level versus the difference from the baseline for a one-week running average of FFDIs, where no line indicates a p-value >0.1, a thin line indicates 0.01>p-value > 0.01, and a thick line indicates p-value < 0.01. P-values are assessed using a one-sided paired Wilcoxon signed-rank test, with pairing by ensemble member.
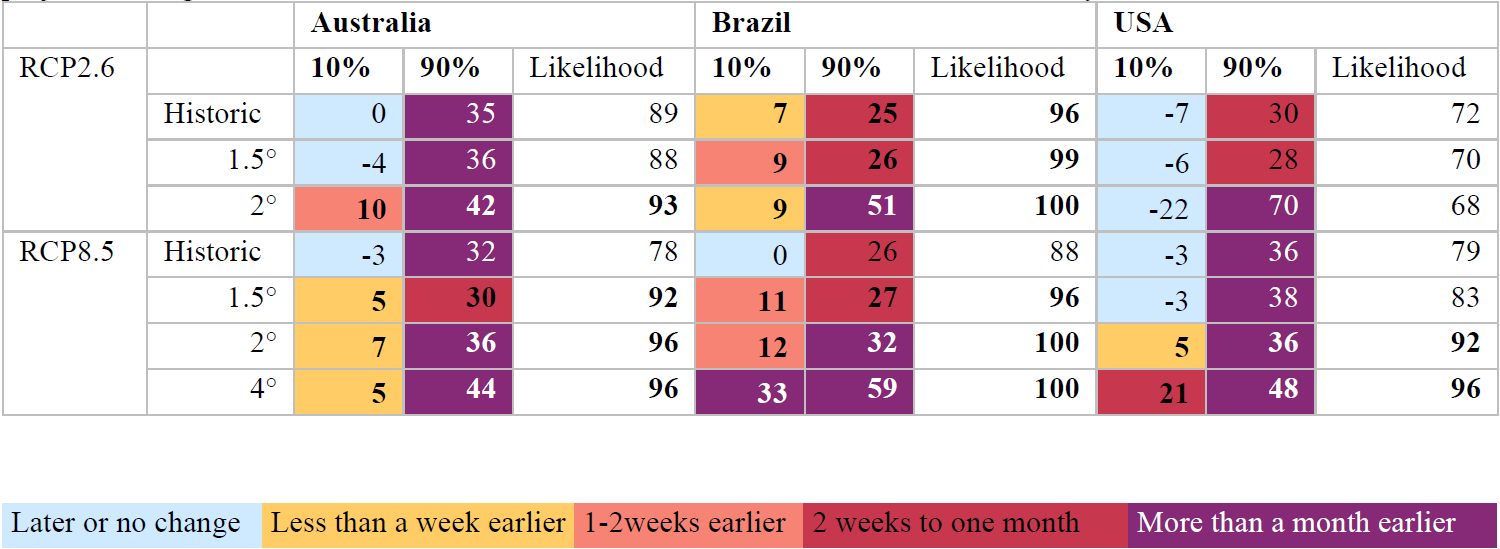
Australia exhibits substantial changes in burn season timing, with a consistent tendency towards earlier end-of-season thresholds across warming levels (Table 5). Under RCP2.6 at 1.5 °C, the end-of-burn threshold occurs between 4 d later and 36 d earlier than the baseline, with 88 % of ensemble members indicating an earlier season end. At 2.0 °C, this range shifts further earlier (10–42 d), with a 93 % likelihood of advancement. Under RCP8.5, the signal strengthens with warming: by 4.0 °C, the season end occurs 5–44 d earlier in 96 % of ensemble members. These results indicate a robust and increasingly compressed non-fire season in Australia, particularly under higher warming.
In Brazil, projected shifts are smaller at lower warming levels but become both larger and more certain with increased warming. Under RCP2.6 at 1.5 °C, the end-of-season threshold advances by 9–26 d in 99 % of ensemble members, increasing to 9–51 d at 2.0 °C with complete ensemble agreement. Under RCP8.5, the signal becomes especially pronounced at higher warming, with the end-of-season advancing by 33–59 d at 4.0 °C in 100 % of ensemble members. This substantial and highly consistent advancement suggests a marked contraction of the traditional low-fire window in Brazil under strong warming.
In the USA, projected changes show greater ensemble spread at lower warming levels but converge towards earlier season ends with increased warming. Under RCP2.6 at 1.5 °C, the end-of-season threshold ranges from 6 d later to 28 d earlier, with 70 % of ensemble members indicating advancement. By 2.0 °C, this shifts from between 22 later to 70 d earlier, with 68 % of members showing earlier. Under RCP8.5, the likelihood and magnitude of earlier season end increase steadily, reaching 21–48 d earlier by 4.0 °C in 96 % of ensemble members. While the USA exhibits more variability than Australia or Brazil, the dominant signal remains one of shortening preparatory periods.
Across all three regions, distinct periods of low fire weather persist even at higher warming levels, indicating that opportunities for fuel management, recovery, and planning remain. However, the high likelihood of earlier season termination – combined with the increasing magnitude of these shifts – points to a systematic compression of the non-fire season. This compression has direct implications for fire management strategies that rely on predictable seasonal boundaries, reinforcing the need to adapt the timing of preparedness and fuel reduction activities under climate change.
Table 5Projected shift in the end-of-season date for controlled burns in Australia, Brazil, and the USA at each global warming level (GWL). Calculated as the number of days earlier in the year that the FFDI reaches the baseline threshold, typically marking the end of the burn season: 31 October for Australia, 1 September for Brazil, and 31 May for the USA. Values show the 10th and 90th percentiles across ensemble members, indicating the range of projected changes. Likelihood is based on the % of ensemble members that show an early end of burn season. Bold highlights results that are significantly earlier based on the 10th percentile.
3.2.5 Change in Low to High FFDI
Figure 7 evaluates projected increases in Low-moderate, High fire weather days across Australia, Brazil, and the USA under historical, current, and future GWLs. Across all three regions, increases in High, as well as Very High, fire weather days are projected, especially under scenarios exceeding 1.5 °C, though 1.5 °C still shows substantial increases. Australia exhibits the highest baseline levels of fire weather among the regions analysed, with 132.61 d yr−1 at or above High fire weather between 1986 and 2005. In the present day (2004–2023), our model indicates that this may have increased by an additional 7 d annually. At 1.5 °C warming, High fire weather days will increase by approximately 8.92 d under the RCP2.6 scenario and 8.37 d under RCP8.5, with even more significant increases at 2.0 °C and higher GWLs. Brazil historically had much lower annual High fire weather days than Australia, with an average of 16.99 d yr−1 from 1986 to 2005. Since then, there has been an increase of 5 d, bringing the present-day average to approximately 21.99 d annually. At 1.5 °C, Brazil's High fire weather days are projected to increase by 7.12 d under RCP2.6 and 6.92 d under RCP8.5, indicating a notable shift towards higher fire potential even at this lower warming level. The USA had an average of 29.31 High fire weather days annually from 1986 to 2005, with an increase of 3.51 d observed by the present day, making current annual totals approximately 32.82 d. Projections at 1.5 °C warming indicate additional increases of around 3.82 d under RCP2.6 and 3.76 ds under RCP8.5. Though the USA's increases are smaller than Australia's, the cumulative effects of additional High and Very High fire weather days will still likely strain current, often seasonal fire management resources and underscore the need for adaptive strategies, especially in high-risk regions like the western USA.
We also evaluate projected changes in the spatial distribution of time spent in different FFDI categories across Australia, Brazil, and the USA (Figs. B1–B6). Rather than focusing solely on country-mean changes, these maps highlight how climate-driven shifts in fire weather are unevenly distributed within countries, with implications for where and when fire management actions – such as fuel treatment, prescribed burning, and preparedness – may remain feasible or become increasingly constrained. As in the aggregated analysis, time spent in the High FFDI category is used as a proxy for conditions that may permit controlled burning, recognising that operational thresholds vary locally depending on fuel type, risk tolerance, population exposure, and ecological objectives (Cirulis et al., 2020; Gill et al., 1987; Howard et al., 2020; da Veiga and Nikolakis, 2022). The maps therefore isolate weather-driven changes only, rather than prescribing management actions directly.
Across Australia, projected changes show a general shift away from Low–Moderate fire weather towards increased time spent in High and Very High FFDI categories, though the precise spatial pattern of change is more uncertain under RCP2.6, particularly at 1.5 °C (Fig. B1). Despite this uncertainty, a consistent signal emerges by 2.0 °C, with large parts of the continental interior experiencing substantial increases in Very High FFDIlocally reaching increases of up to ∼50–60 d yr−1 in the upper ensemble range. Importantly, regions that historically experience lower fire danger, including parts of the south-eastern and southern coastal zones, show more confident increases in time spent in the High FFDI category (typically between 0 and ∼50 additional days), areas that also coincide with higher population density and more continuous vegetation cover. There is also early evidence of the emergence of Severe-or-higher FFDI in parts of western Australia, although this remains spatially limited and ensemble-dependent at these warming levels.
Under RCP8.5 (Fig. B2), spatial patterns are broadly similar at lower warming levels, though uncertainty remains high up to 2.0 °C. By 4.0 °C, however, changes intensify markedly across much of the continent, with increases in Very High FFDI exceeding ∼70 d in some interior regions and widespread increases of 5–30 d in High FFDI along the populated south-eastern coast. Several regions, including parts of western Australia, also show increases of up to a week or more in Severe-or-higher fire weather, indicating a qualitative shift in fire risk beyond historical experience.
Brazil exhibits some of the strongest and most spatially coherent changes among the three regions (Figs. B3 and B4). Under RCP2.6, increases in High FFDI are already evident by 1.5 °C, accompanied by compensating decreases in Low–Moderate conditions across much of the eastern Amazon basin and extending towards the coastal Caatinga. In many areas, these changes range from a few days to as much as ∼50 additional High FFDI days per year. The southern Amazon–Cerrado transition zone shows the most consistent and confident signal, with nearly all ensemble members indicating increases, typically exceeding one week and locally approaching several weeks. These patterns strengthen and expand at 2.0 °C.
There are also early indications, even at 1.5–2.0 °C, of emergent Very High FFDI in forested regions, including near the Amazon river mouth and areas already associated with deforestation and land-use change. Under RCP8.5, these spatial patterns remain similar but intensify, particularly at higher warming levels (Fig. B4). At 4.0 °C, large parts of eastern Amazonia experience increases in High FFDI of several weeks to up to three months, with parts of the region showing increases in Very High FFDI approaching or exceeding one month per year. These changes suggest a substantial extension of fire-prone conditions into regions that have historically experienced only limited seasonal fire weather.
In the USA, the most pronounced spatial changes occur in the western and south-western regions, including California (particularly southern California), Nevada, Arizona, New Mexico, Texas, and extending eastward into Louisiana (Figs. B5 and B6). Under RCP2.6, increases in High and Very High FFDI are already evident by 1.5 °C, typically ranging from 0 to ∼40 additional High FFDI days per year, with the largest changes concentrated in the south-west. By 2.0 °C, these increases become more spatially extensive, particularly along the US–Mexico border. Parts of southern California also show the emergence of Severe-or-higher fire weather, locally approaching about a week per year.
Under RCP8.5, changes in High FFDI remain spatially heterogeneous and more uncertain but increases in Very High FFDI are more pronounced and robust across ensemble members (Fig. B6). At 1.5 °C, southern California already shows increases ranging from weeks to nearly 2 months, expanding eastward at 2.0 °C. By 4.0 °C, Very High FFDI increases become widespread across border states, with local increases of up to ∼2–2.5 months, while Severe-or-higher conditions become more common, in some areas increasing by a week or more across large parts of the southern USA.
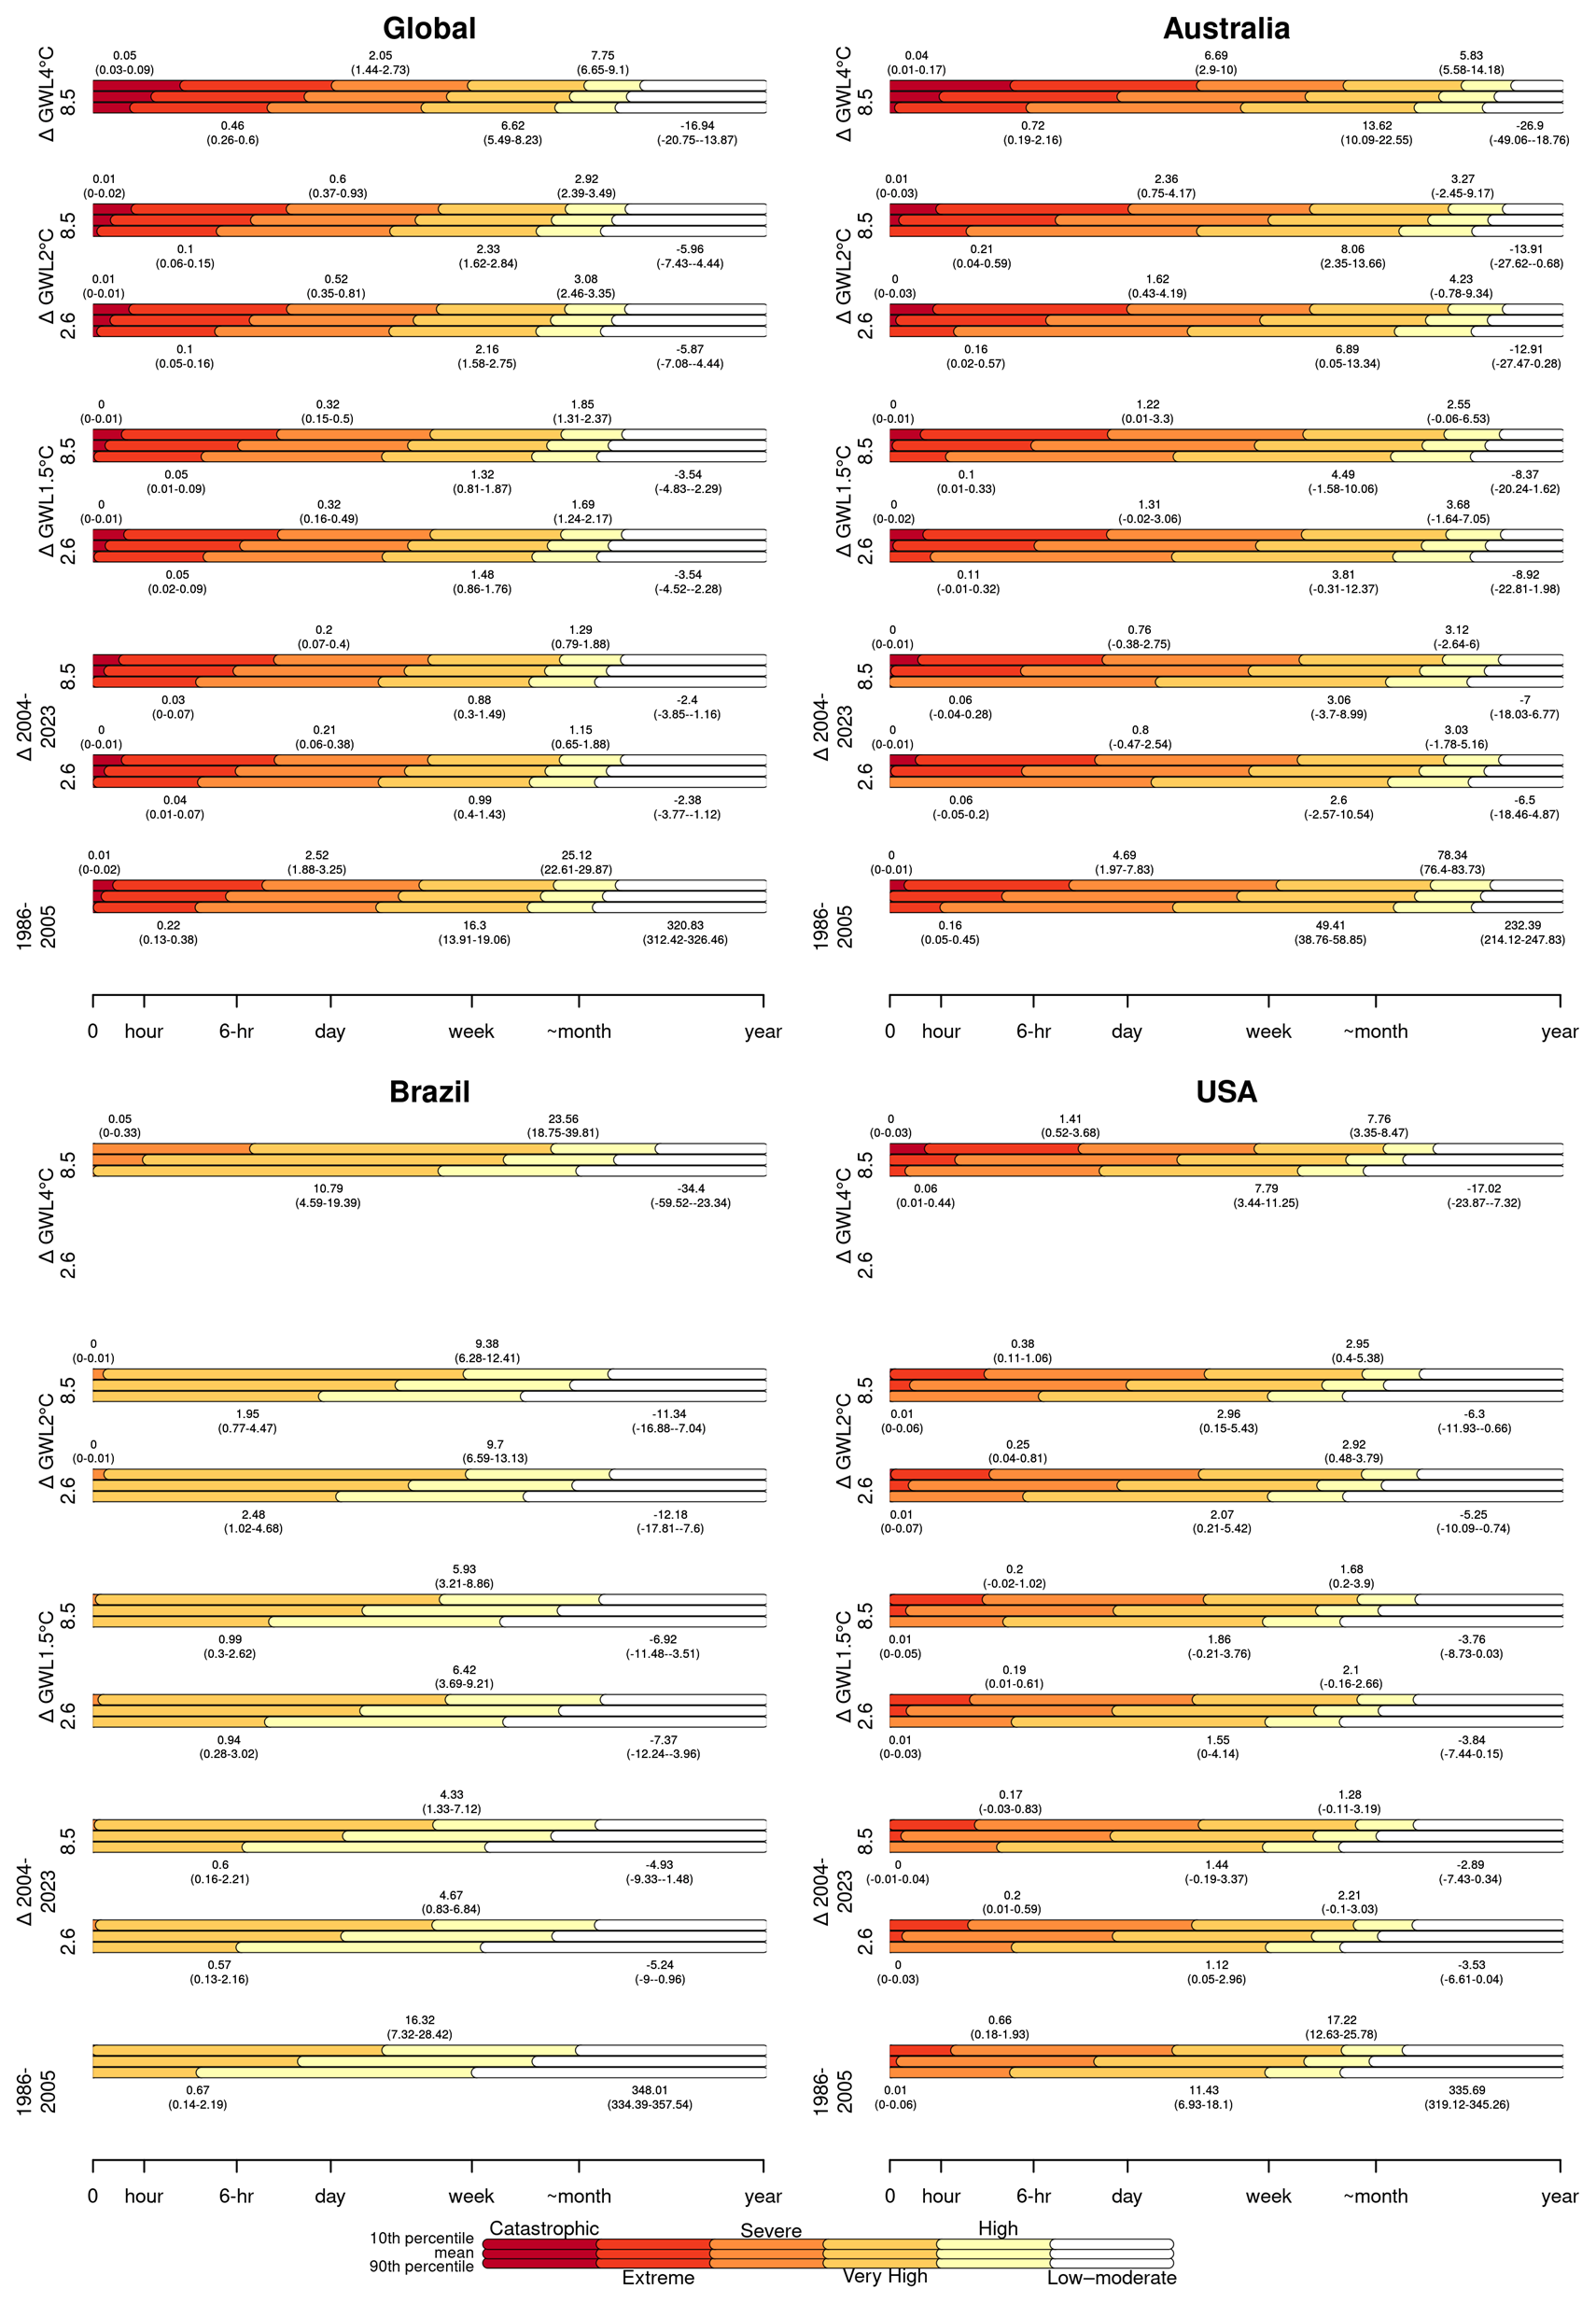
Figure 7Projected changes in annual time spent in different fire weather categories across Australia, Brazil, and the USA under various Representative Concentration Pathways (RCPs) and Global Warming Levels (GWLs). The bottom row for each region shows historical averages (1986–2005) of annual time spent in each Fire Danger Index category, from Low-Moderate (white) to High through Catastrophic (yellow to deep red), as defined in Table 1. Rows above (from bottom to top) display changes under present-day conditions (2004–2023) and future projections at 1.5, 2, and 4 °C global warming levels.
Globally, the Low–moderate FFDI category decreases by approximately 2.4 d at 1.5 °C and by nearly 17 d at 4.0 °C under RCP8.5. These reductions suggest significant global shifts in the duration of periods typically associated with low fire weather. Across all regions, there is a clear trend towards a reduction in the time spent in the Low–moderate FFDI category, accompanied by an increase in the time spent in the higher FFDI categories. This reflects a contraction of the low fire-risk period and a corresponding extension of fire-prone conditions. Australia exhibits the most pronounced changes, with a decrease in the Low–moderate category of approximately 7 d at 1.5 °C, extending to over 26 d by 4.0 °C under RCP8.5. In the USA, the decrease in the Low–moderate category is less pronounced, with reductions of approximately 1 week at 1.5 °C and up to 10 d at 4.0 °C under RCP8.5. Brazil also demonstrates a marked decline in time spent in the Low–moderate category – up to 12 d at 2.0 °C and over 26 d at 4.0 °C.
The increases in the more extreme FFDI categories (Severe, Extreme, Catastrophic) provide a useful proxy for understanding changes in fire behaviour under climate change. Globally, time spent in the Extreme category shows a modest increase of ∼0.1 d at 1.5 °C, reaching ∼0.5 d at 4.0 °C under RCP8.5. The most dramatic changes occur in the Severe category, which increases by ∼0.6 d at 1.5 °C and ∼2 d at 4.0 °C. Time spent in the Extreme category in Australia increases significantly, particularly under higher warming levels, reaching an additional ∼0.7 d by 4.0 °C under RCP8.5. Similarly, the Severe category grows by over 6 d by 4.0 °C, suggesting heightened risk of extreme fire weather events. Although changes are smaller in USA, there are notable increases in the Severe category, reaching 2–3 d at higher warming levels. Brazil shows smaller increases in extreme categories, with the Very High category dominating changes.
Our model projections show that the more global warming we experience in the future, the higher the increase in peak fire danger, and the longer Very High fire weather seasons will become, extending over much more land area, especially at 4.0 °C of warming. This supports evidence from previous studies (e.g. Jones et al., 2022; Peng et al., 2023). Our analysis provides a complementary line of evidence through a structured assessment of uncertainty across warming levels, emissions scenarios, and model parameterisations, thereby strengthening confidence in the robustness of conclusions from these previous studies. Additionally, unlike previous studies, which mostly quantify the magnitude of these increases, our analysis focuses on what these changes mean for fire management, particularly the seasonal timing of preparation windows, controlled burns, and low-fire periods, that remain critical for adaptation. This management-oriented framing inverts the usual problem: instead of only asking “how much worse will fire weather get” (Sect. 4.1), we also ask, “how and when can societies still act within an increasingly altered seasonal cycle?” (Sect. 4.2).
4.1 Projections and the scale of the adaptation challenge
Even under strong mitigation consistent with the Paris Agreement's 1.5 or 2.0 °C temperature goals, we project increases in the duration of Very High FFDI seasons across most regions globally, including all three of our study regions. This indicates that some degree of adaptation to longer and more persistent fire weather seasons will be required even under the most optimistic warming trajectories. We show significant sensitivity of fire weather to GWLs, with increases in Very High fire weather days (FFDI > 24) projected globally and regionally at all temperature thresholds. At 4.0 °C, we project an increase in days above the Very High FFDI over 50 % of affected exposed area worldwide, compared to 30 % at 1.5 °C warming (Table 3). These results align with previous studies showing measurable increases in fire weather severity and longer fire seasons even between 1.5 and 2.0 °C of warming, with particularly strong regional responses (Jones et al., 2022; Son et al., 2021; Sun et al., 2019; Tian et al., 2023). This highlights the disproportionate impact of higher warming levels and the urgent need for mitigation to limit global temperatures.
Regionally, Australia emerges as particularly vulnerable, with 82 % of its exposed area affected by an increase in Very High (or greater) fire weather days at 1.5 °C, rising to 87 % at 2.0 °C and 96 % at 4.0 °C (RCP8.5 central estimate, Table 3), with increases seen even in the fuel-abundant southeast coast. While the increases between the 1.5, 2.0 and 4.0 °C warming levels highlight the benefits of limiting warming, the high proportion of affected land, even at lower thresholds, emphasises that adaptation will also be necessary if significant impacts are to be avoided. In Brazil, fire weather also shows a marked escalation, with 30 % of exposed area affected at 1.5 °C, increasing steeply to 41 % at 2.0 °C and 70 % at 4.0 °C warming levels (RCP8.5 central estimate, Table 3). This jump reflects the acute sensitivity of Brazil's ecosystems, already under pressure from deforestation and land-use change (Ferreira et al., 2023; Kelley et al., 2021; Mataveli et al., 2022). In the USA, fire weather increases more steadily, but still markedly, with 34 % of exposed area affected at 1.5 °C, 44 % at 2.0 °C and 65 % at 4.0 °C warming levels (RCP8.5 central estimate, Table 3). Together, these results illustrate that there will likely be regional variation in how fire weather responds to warming in diverse landscapes, but they also highlight the need for adaptation even at the lowest warming level we assess.
While RCP2.6 (a mitigation scenario) limits global warming to much lower temperatures in comparison to RCP8.5, at the lower warming levels there is relatively little variation between emissions scenarios, similar to Peng et al. (2023). These results clearly show that mitigation to limit warming to well below 2.0 °C presents a substantial opportunity to reduce the area affected by worsening fire weather, but even at 1.5 °C, our results suggest that increases in Very High fire weather days are unavoidable. Any policy response to this projected increase in future fire weather ideally needs to address these two elements that should complement and support each other. Firstly, an effective global mitigation policy is needed to limit future climate change and, in turn, the increase in fire weather days. Secondly, enhanced fire management policies are needed to address the unavoidable increase in fire weather days projected across all levels of global warming.
Using the PPE in this study has helped to isolate climate sensitivities and meteorological drivers relevant to fire weather, under-pinned by a well-established framework for assessing uncertainty in GCMs (Murphy et al., 2007) Although the PPE captures considerable uncertainty in future fire weather projections by systematically perturbing key model parameters, it does not encompass the full range of plausible or possible outcomes across structurally different climate models. However, the structured nature of the PPE provides key advantages: it enables a more systematic exploration of parameter-driven uncertainties and provides a more straightforward coupling between model outputs and fire weather indices such as the FFDI. Unlike the CMIP multi-model ensemble, which relies on a smaller selection of available models with varying levels of evaluation for fire weather projections, the PPE is based on a single, extensively evaluated climate model.
4.2 Opportunities for adaptation actions
The magnitude of FFDI increases vary across our study regions, alongside shifts in fire season timing and duration and differences in regional sensitivity to key climate drivers. This indicates that each region's fire season responds differently to climate change, requiring tailored adaptation strategies as highlighted by Pandey et al. (2023). Despite this diversity in response, some consistent patterns emerge across all regions. Under strong warming (4.0 °C warming level), the relative influence of individual meteorological drivers on fire weather declines, reflecting an increasing role for compound fire weather conditions rather than the dominance of any single variable (Fig. 5).
Brazil, for example, generally experiences lower FFDI values compared to Australia and the USA, and we find that relative humidity is a dominant contributor to fire weather variability under baseline conditions, but its relative importance declines under strong warming as fire-conducive conditions become increasingly driven by compound interactions with temperature, wind, and fuel dryness. Approaches that have been proposed or implemented, such as conserving forests, protecting wetlands, especially in the Brazilian Pantanal (Barbosa et al., 2022), and preventing fragmentation of riparian zones (Ferreira et al., 2023) may help maintain local humidity levels and act as natural firebreaks. Nonetheless, our results imply that these will be more likely to remain effective if they also affect soil moisture and precipitation, whose contribution also increases by 4.0 °C in comparison to the baseline period of 1986–2005.
Large, destructive fires play a critical role in shaping fire regimes in fire-sensitive regions of Brazil, often accounting for a substantial portion of seasonal burned area (Flannigan et al., 2016). Our projected increase in fire weather days in these regions elevates the potential for ignition and preconditions the environment for large, impactful events. In the Brazilian Cerrado, where FFDI is generally higher and fire danger is more temperature-driven, forecasting periods of elevated fire danger (Anderson et al., 2022) and reducing human ignitions, such as restricting agricultural burning during peak fire weather, have been identified as strategies to reduce fire occurrence (Pivello, 2011).
Evidence also shows that controlled burns reduce late dry-season fires in areas surrounding the Cerrado (da Veiga et al., 2025; Santos et al., 2021; da Veiga and Nikolakis, 2022). Our findings indicate that the window for applying controlled burns may expand by 4–9 d at 1.5 °C under RCP2.6 and up to 13 d at 2.0 °C (Fig. 7; Brazil, High FFDI category). However, this expansion in high FFDI time, reaching up to a week at 1.5 °C and nearly a month at 4.0 °C, is likely to coincide with a contraction of Low–Moderate periods, increasing the duration over which seasonal firefighting capacity is required.
In Australia, fire danger is strongly influenced by the co-occurrence of low relative humidity, high temperatures, and high winds (Fig. 5), which exacerbate fire spread and intensity. Our findings imply that fire management effort might be most effective when they focus on reducing fuel loads, commonly through controlled burns during milder weather conditions (Morgan et al., 2020; Russell-Smith et al., 2020), and strengthening early warning systems that monitor key meteorological variables (de Groot et al., 2015). Under stronger warming, however, reliance on individual meteorological indicators becomes less effective, reinforcing the need for integrated early warning systems that explicitly account for compound fire weather conditions. We find that the end of the controlled burn season in Australia may occur earlier, by up to 36 d at 1.5 °C (though there is a small chance it could be later), under RCP2.6, and between 10 and 42 d at 2.0 °C (see Table 5). At 4.0 °C, this contraction is partly offset by a modest extension of the High FFDI period, by almost one week, during which controlled burning may still be feasible. These largely agree with the earlier and longer control burn season by mid-century found by (Clarke and Evans, 2019b). At the same time, the Low to Moderate fire weather off-season shortens substantially, by up to one month at 4.0 °C, which may affect the recruitment, training, and availability of Australia's largely volunteer-based rural fire services (Russell-Smith et al., 2020). Shifting the timing of policies aimed at reducing human ignitions, such as closing national parks and restricting campfires during high-risk periods, could complement fuel management measures. However, our results indicate that such restrictive and suppression measures are likely to be required for longer, even at 2.0 °C warming, potentially increasing firefighter fatigue and reducing public compliance over time (Doley et al., 2016). In this context, additional measures such as fire-resistant vegetation and buffer zones around vulnerable areas could help mitigate risks associated with wind-driven fires (Pandey et al., 2023).
In the USA, High fire weather is primarily linked to the combined influence of temperature and wind, with temperature showing almost as high importance as relative humidity (Fig. 5), particularly in the western regions where strong, dry winds are common. These results suggest that targeted controlled burns during periods of lower wind activity, alongside mechanical thinning to reduce fuel loads, could be important strategies. The end of the controlled burn season is expected to advance by approximately 1.5 °C, occurring up to 28 d earlier. Some simulations indicate a shift of about 7 d later under RCP2.6 at 1.5 °C, while under RCP8.5, the change may be minimal, roughly a month. While these shifts are more uncertain than those projected for Australia, they still represent a meaningful change that is likely to affect spring and early summer management Concurrently, a lengthening fire season and a contraction of the Low to Moderate fire weather period may increase pressures on firefighting capacity, recruitment, and workforce wellbeing (O'Brien and Campbell, 2021). Efforts to reduce human ignitions, particularly in the wildland- urban interface, could further alleviate fire risks. As in Australia and Brazil, the reduced dominance of individual meteorological drivers under warming suggests that fire management strategies based on single thresholds may become less effective, increasing the importance of integrated, season-scale planning.
Across all three regions, even at the highest warming levels, distinct periods of low fire weather in winter remain (Figs. 1 and 7). These retained low-fire periods provide strategic windows for resource planning, but the consistent advancement of season-start dates demonstrates an increasing need for earlier shifts for pre-season preparation within fire season firefighting and management as global temperatures rise. Projections indicate consistent increases in both High and Very High fire weather days with each level of warming, with the most substantial shifts seen in Australia and Brazil. The slight but significant projected increases in the Severe and Extreme categories, particularly in Australia, reflect a growing likelihood of extreme fire events that will require enhanced firefighting and emergency response capacities – though simulation evaluation of time in the Severe+ categories suggests more work is needed before we can be confident in these increases. By focusing on region-specific dynamics, preparing for extended fire seasons, and adapting controlled burn strategies to account for earlier season dates and potentially longer control burn seasons, fire management practices may be optimised to minimise the impacts of intensifying fire risks.
Globally, longer-term strategies, such as sustainable forest and land management practices that prevent deforestation or conserve wetland areas should align with mitigation goals and contribute to building resilience to rising fire weather risks. Building wildfire-adapted communities, particularly in regions where fire intersects with human infrastructure, can reduce fires' social and economic impacts when they do occur. Fire management focused on strategic planning and prevention will be critical in managing fire risks across diverse fire-prone regions (UNEP et al., 2022) for example, improving fire detection systems, supporting research into fire-resistant landscapes, pre-season preparation and fuel management, and enhancing rapid-response capabilities. This will require dedicated, long-term investment.
4.3 Limitations and future perspectives
Future studies that incorporate a broader range of climate models could improve confidence in projections by sampling a wider range of plausible uncertainties and offer more refined estimates of the likelihood of fire-related impacts. In particular, expanding beyond a single-model PPE could help refine fire weather estimates in regions where fire dynamics are less well understood, although our evaluation, which shows observed time in FFDI categories falling within the ensemble, suggests the PPE is already broad enough in itself.
While the FFDI provides strong sensitivity to temperature and humidity in fuel-abundant ecosystems and has proven very useful for our temperate and tropical focus regions, using multiple fire danger indices in parallel could improve understanding and applicability across biomes. For example, boreal forests may benefit from indices better suited to high-latitude ecosystems, such as the Canadian Fire Weather Index (FWI), while other metrics like the Keetch–Byram Drought Index (KBDI) or the US Energy Release Component (ERC) capture additional aspects of fire danger relevant in specific regions. Applying a suite of indices would help build a more complete picture of future fire risk and reduce reliance on any single metric, representing an important avenue for future research, particularly for studies seeking global coverage. Beyond these established measures, there is also growing interest in machine learning (ML) and AI-based indices (Di Giuseppe et al., 2025), which can integrate diverse meteorological and ecological variables and may improve predictive skill in data-rich regions. Future assessments that benchmark traditional and ML-derived indices across regions could offer valuable insights into the strengths and limitations of each approach and guide the development of hybrid frameworks that combine physical process understanding with data-driven methods.
As climate models continue to improve in resolution, future assessments could further refine these projections, linking fire management needs to more specific changes in fire weather across multiple GWLs. Additionally, improving our understanding of meteorological drivers behind regionally tailored fire indices could support more targeted fire management strategies, such as early warning systems.
One key area for future study is the identification of thresholds at which fire suppression might become ineffective under increasingly extreme fire weather conditions. Given the projected rise in Very High FFDI and earlier transitions into the fire season, future studies could link fire weather metrics to operational limits, helping to determine when and where suppression capacity may be exceeded. This also requires an objective assessment of which adaptation strategies could be most effective at reducing the risks from increased fire weather and exceeding suppression capacity. In addition, building on the analysis of transitions between fire weather periods and the persistence, yet narrowing, of low fire weather windows, future research could work closely with fire managers and practitioners to co-develop dynamic fire management strategies and translate these diagnostics into planning tools. This could include adapting fuel load management strategies to optimise fuel management whilst minimising unintended consequences. This would support more adaptive Integrated Fire Management approaches that respond to shifting seasonal risk profiles under climate change. Fire weather indices tend not to include representations of ignitions sources and fire models often use simple parametrisations of ignitions sources. An integration of socio-economic factors including population growth, land-use changes, and social behaviour could provide more robust approaches to representations of ignitions in fire modelling and inform opportunities for adaptation and Integrated Fire Management.
This study demonstrates the profound impact of future climate change on fire weather and emphasizes the importance of both mitigation and adaptation strategies. As global temperatures rise, regions such as Australia, Brazil, and the USA are projected to face longer, earlier, and more intense fire seasons, with Very High fire weather days increasing in frequency and duration. Limiting global warming to 1.5 °C could slow the rate of these changes, but even under strong mitigation scenarios, fire weather is expected to intensify, requiring some level of adaptation. Fire management strategies should evolve to address shifts in fire season timing and severity, requiring expanded controlled burn windows, enhanced pre-fire preparations, and landscape management tailored to regional conditions. Ecosystem restoration through reforestation and sustainable land use can help maintain a higher soil moisture, which can reduce an ecosystems susceptibility to fire and have a favourable impact on biodiversity. Increased resilience to fire impacts in the most affected regions could be achieved by integrating ecosystem services and fire management with the needs of local communities. Proactive adaptation, coupled with the development of fire weather indices suited to diverse ecosystems, will be essential for managing escalating risks. Ultimately, balancing mitigation to limit long-term impacts with adaptive measures, including ecosystem restoration, offers the greatest potential for protecting biodiversity, infrastructure, and communities in a warming world. Our study is the first to explicitly frame global fire weather projections through the lens of seasonal management timing, highlighting how retained low-fire windows and advancing season starts to reshape opportunities for preparation. This inversion from documenting increases to identifying adaptation pathways provides a new perspective for research and policy.
We argue for dynamic fire management, an approach that embeds shifting fire seasons, real-time fire weather information and flexible operational windows directly into Integrated Fire Management frameworks. As climate change reshapes when and where fire becomes hazardous, static calendars can no longer keep pace. A dynamic approach ensures that mitigation, preparedness and fuel treatments adapt alongside the changing risk, supporting more effective and climate-aware fire stewardship.
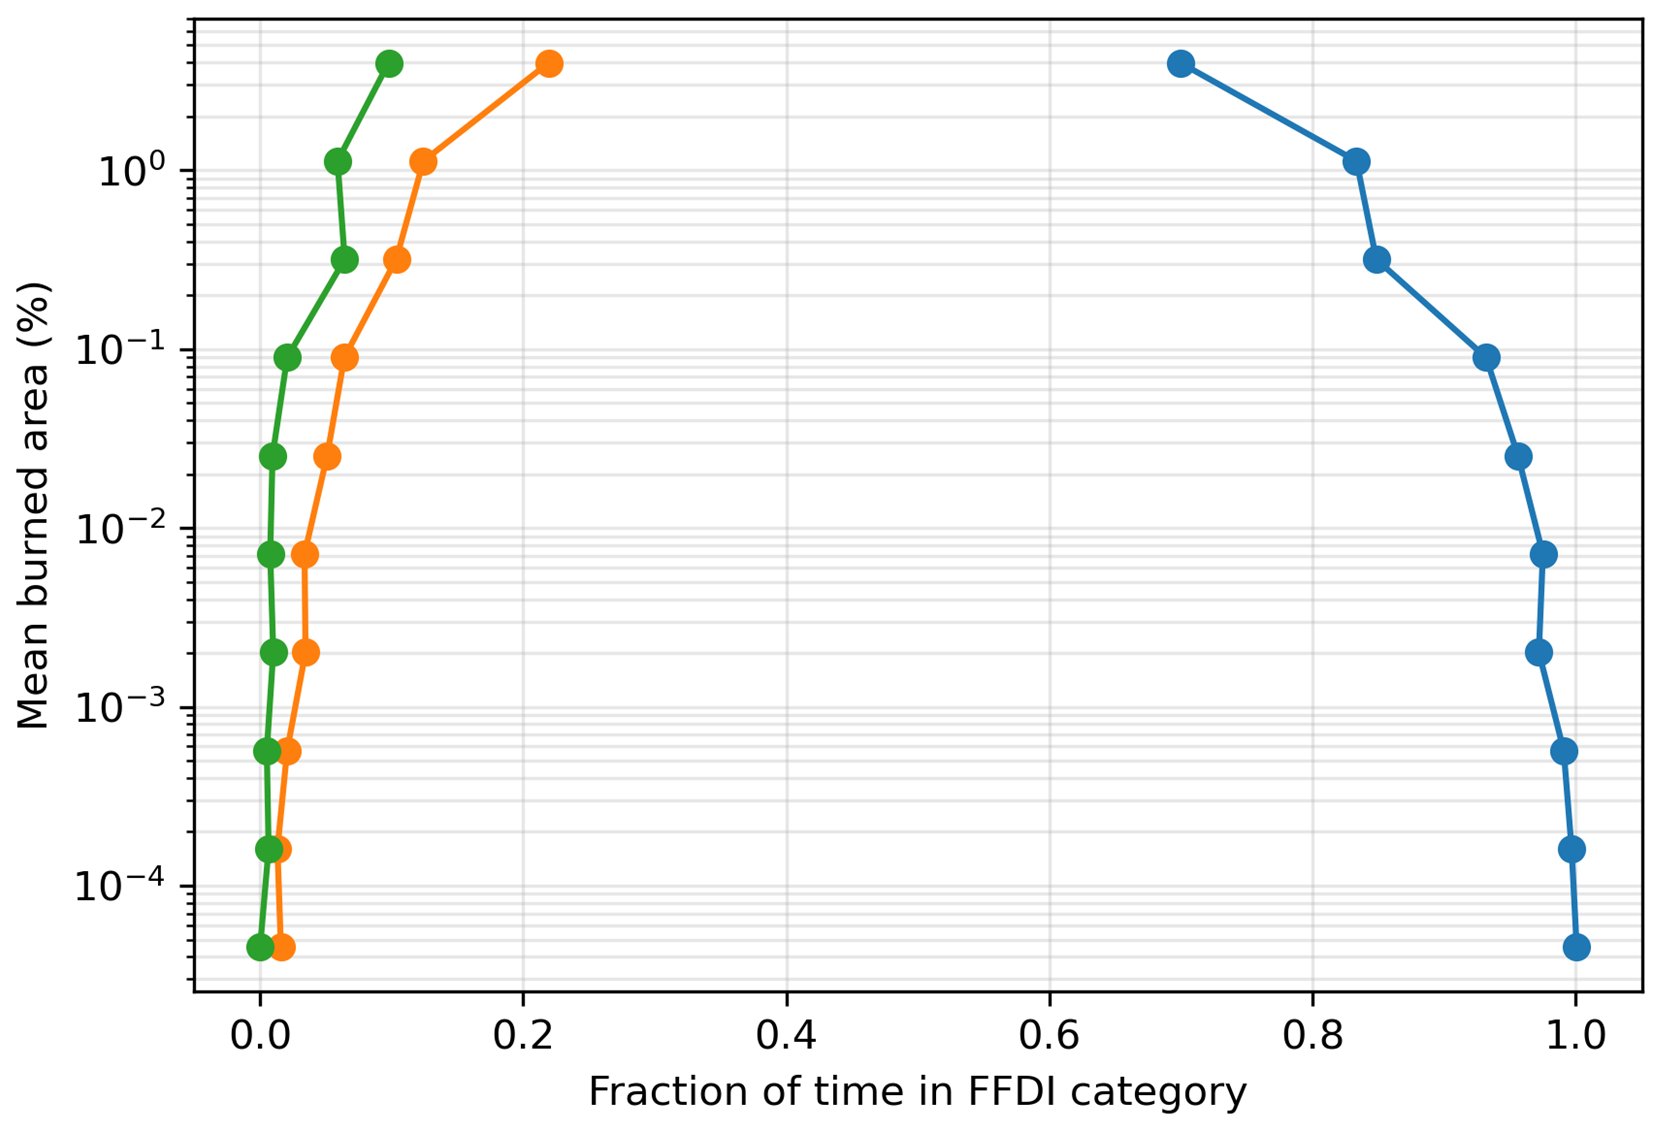
Figure A1Relationship between burned area and time spent in fire weather danger categories. Mean fraction of time spent in each McArthur Forest Fire Danger Index (FFDI) category is shown as a function of mean burned area across grid cells. Burned area is taken from the ESA Fire CCI burned area product (version 5.1), expressed as percentage of area burned. Time spent in each FFDI category is calculated using Copernicus reanalysis meteorology. Burned area values are grouped into logarithmically spaced bins, and lines show the mean fraction of time in each category within each bin.
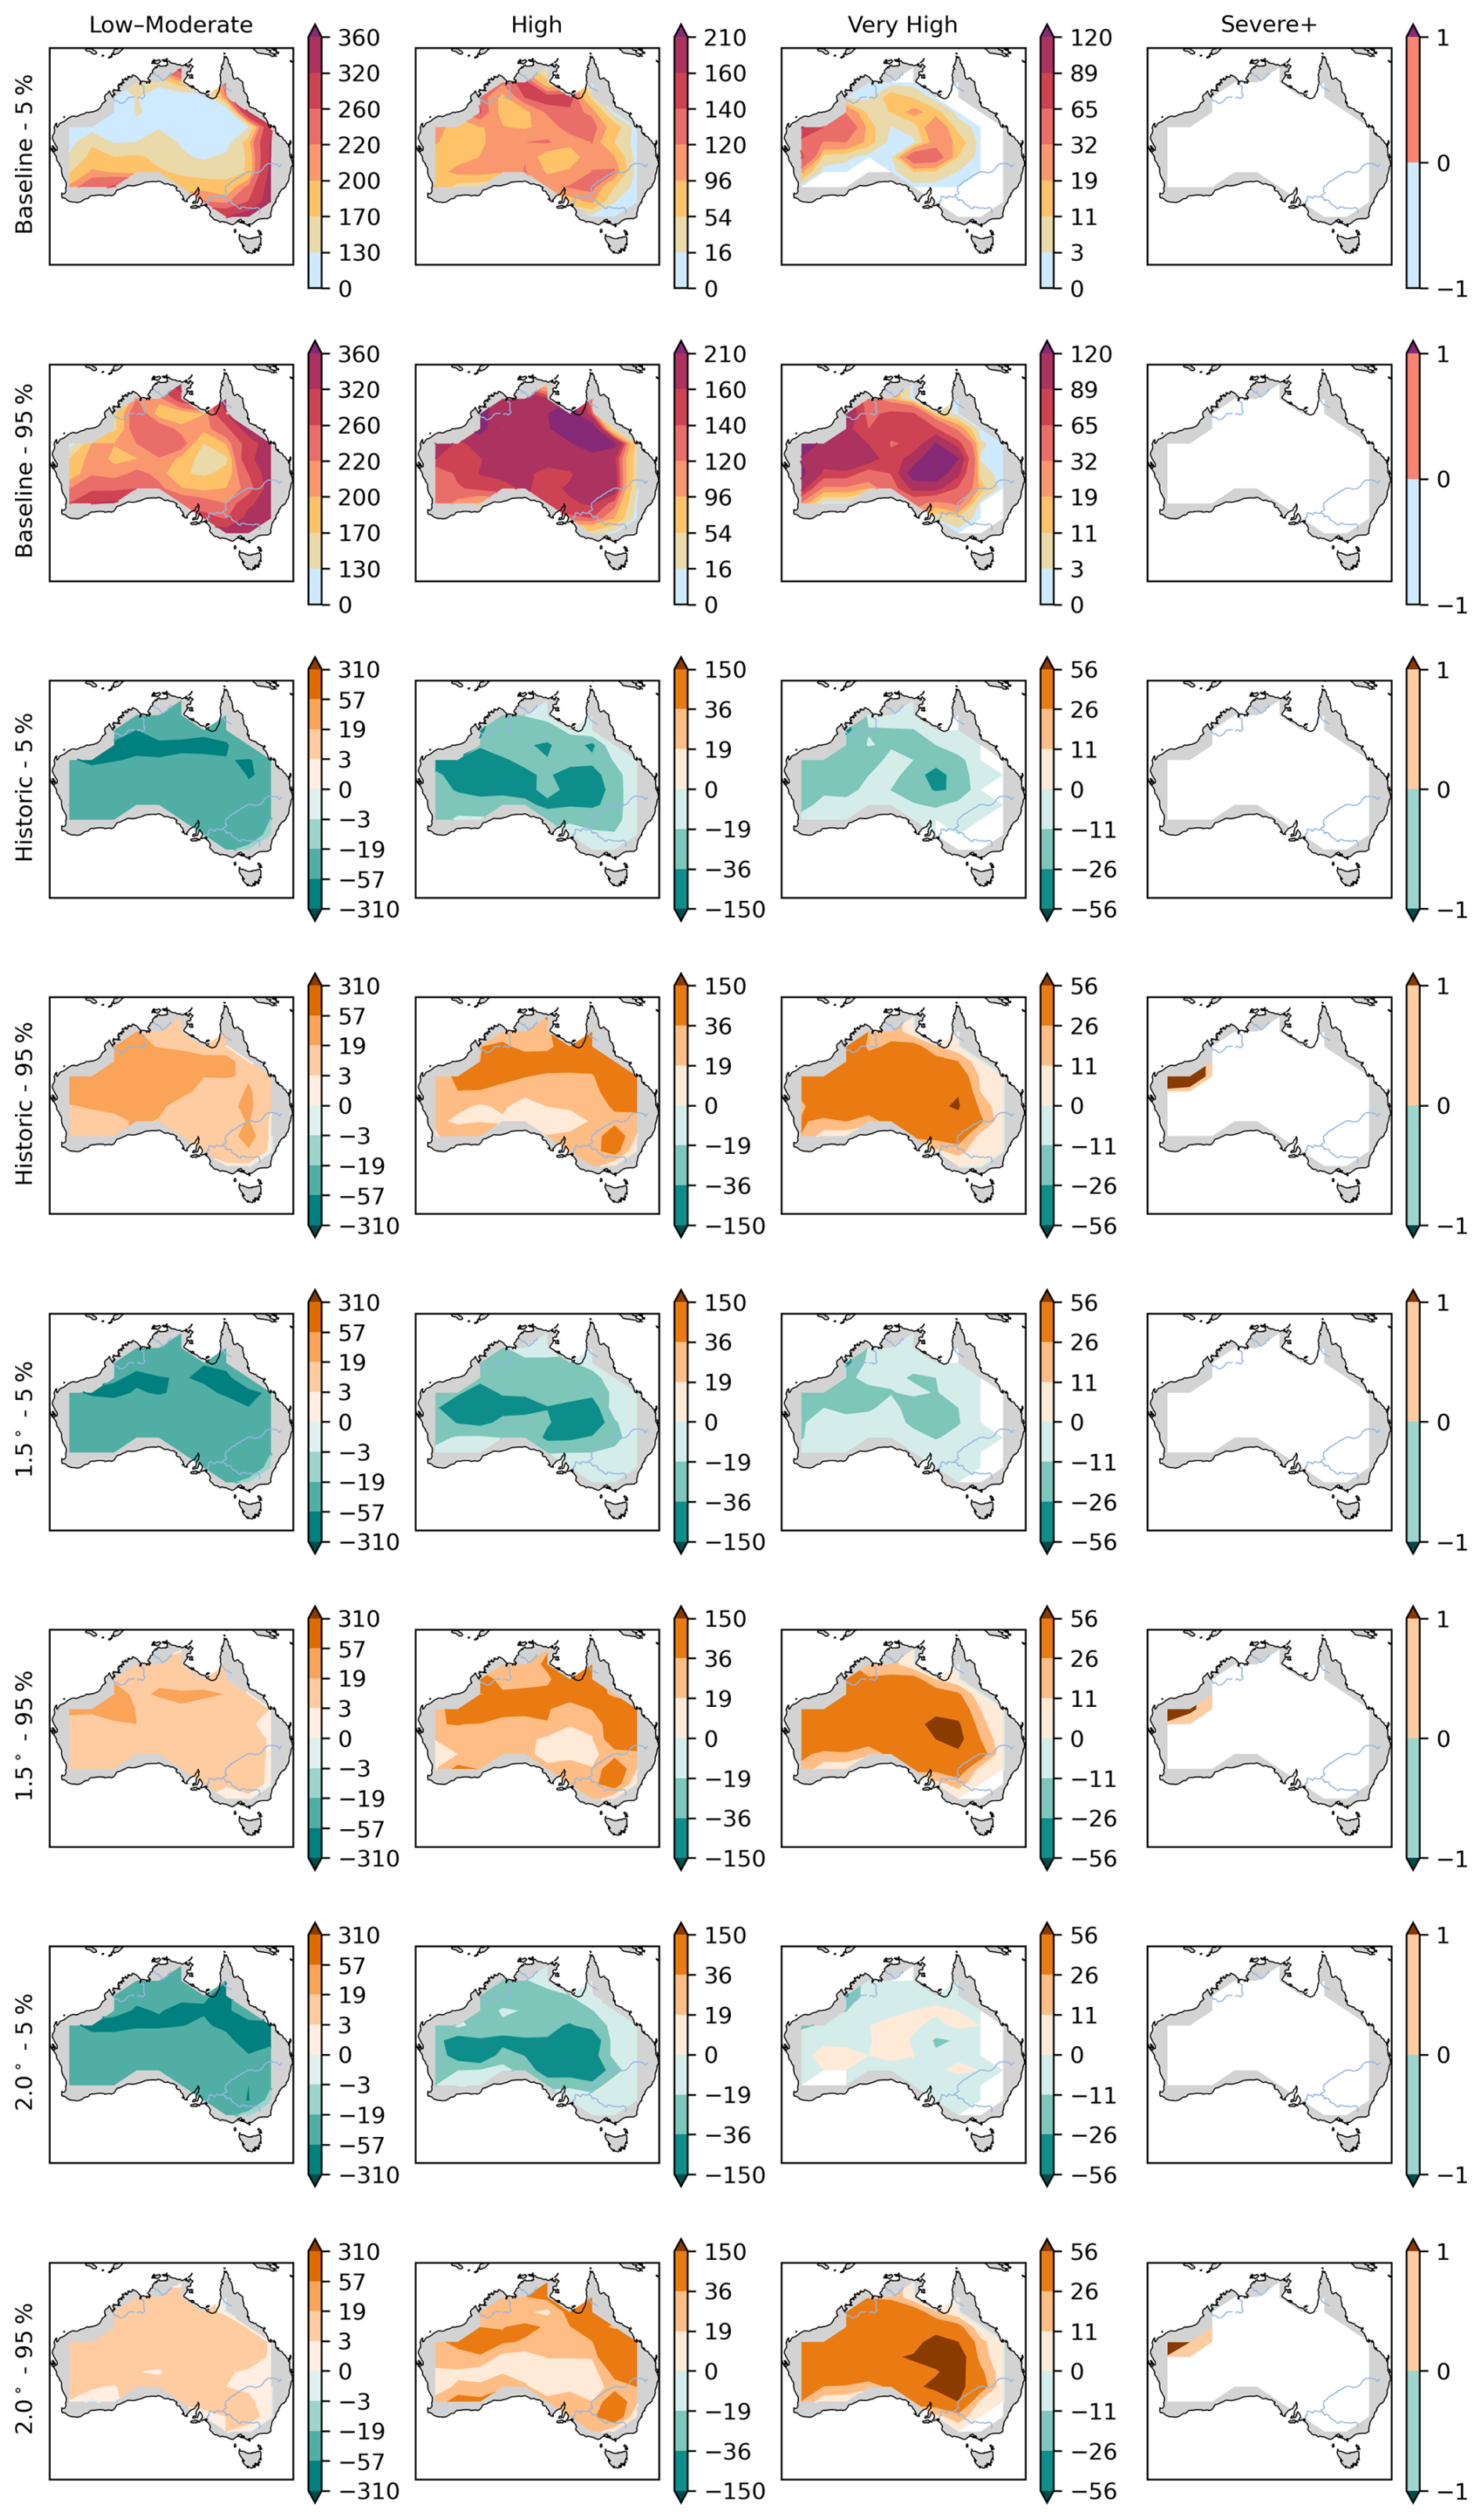
Figure B1Spatial distribution of the annual number of days in each McArthur Forest Fire Danger Index (FFDI) category across Australia. Rows show (from top to bottom): the baseline period (1986–2005), the recent historical period (2004–2023), and projections at the 1.5 and 2.0 °C Global Warming Levels (GWLs) under RCP2.6. For each GWL, uncertainty across the perturbed physics ensemble is represented by paired maps showing the 5th percentile (upper map) and 95th percentile (lower map) of ensemble members. Columns show (from left to right) the number of days in the Low–Moderate, High, Very High, and Severe-or-higher FFDI categories. The baseline period is shown as absolute annual days, while all other panels show changes in the annual number of days relative to the baseline, calculated using paired differences for each ensemble member.
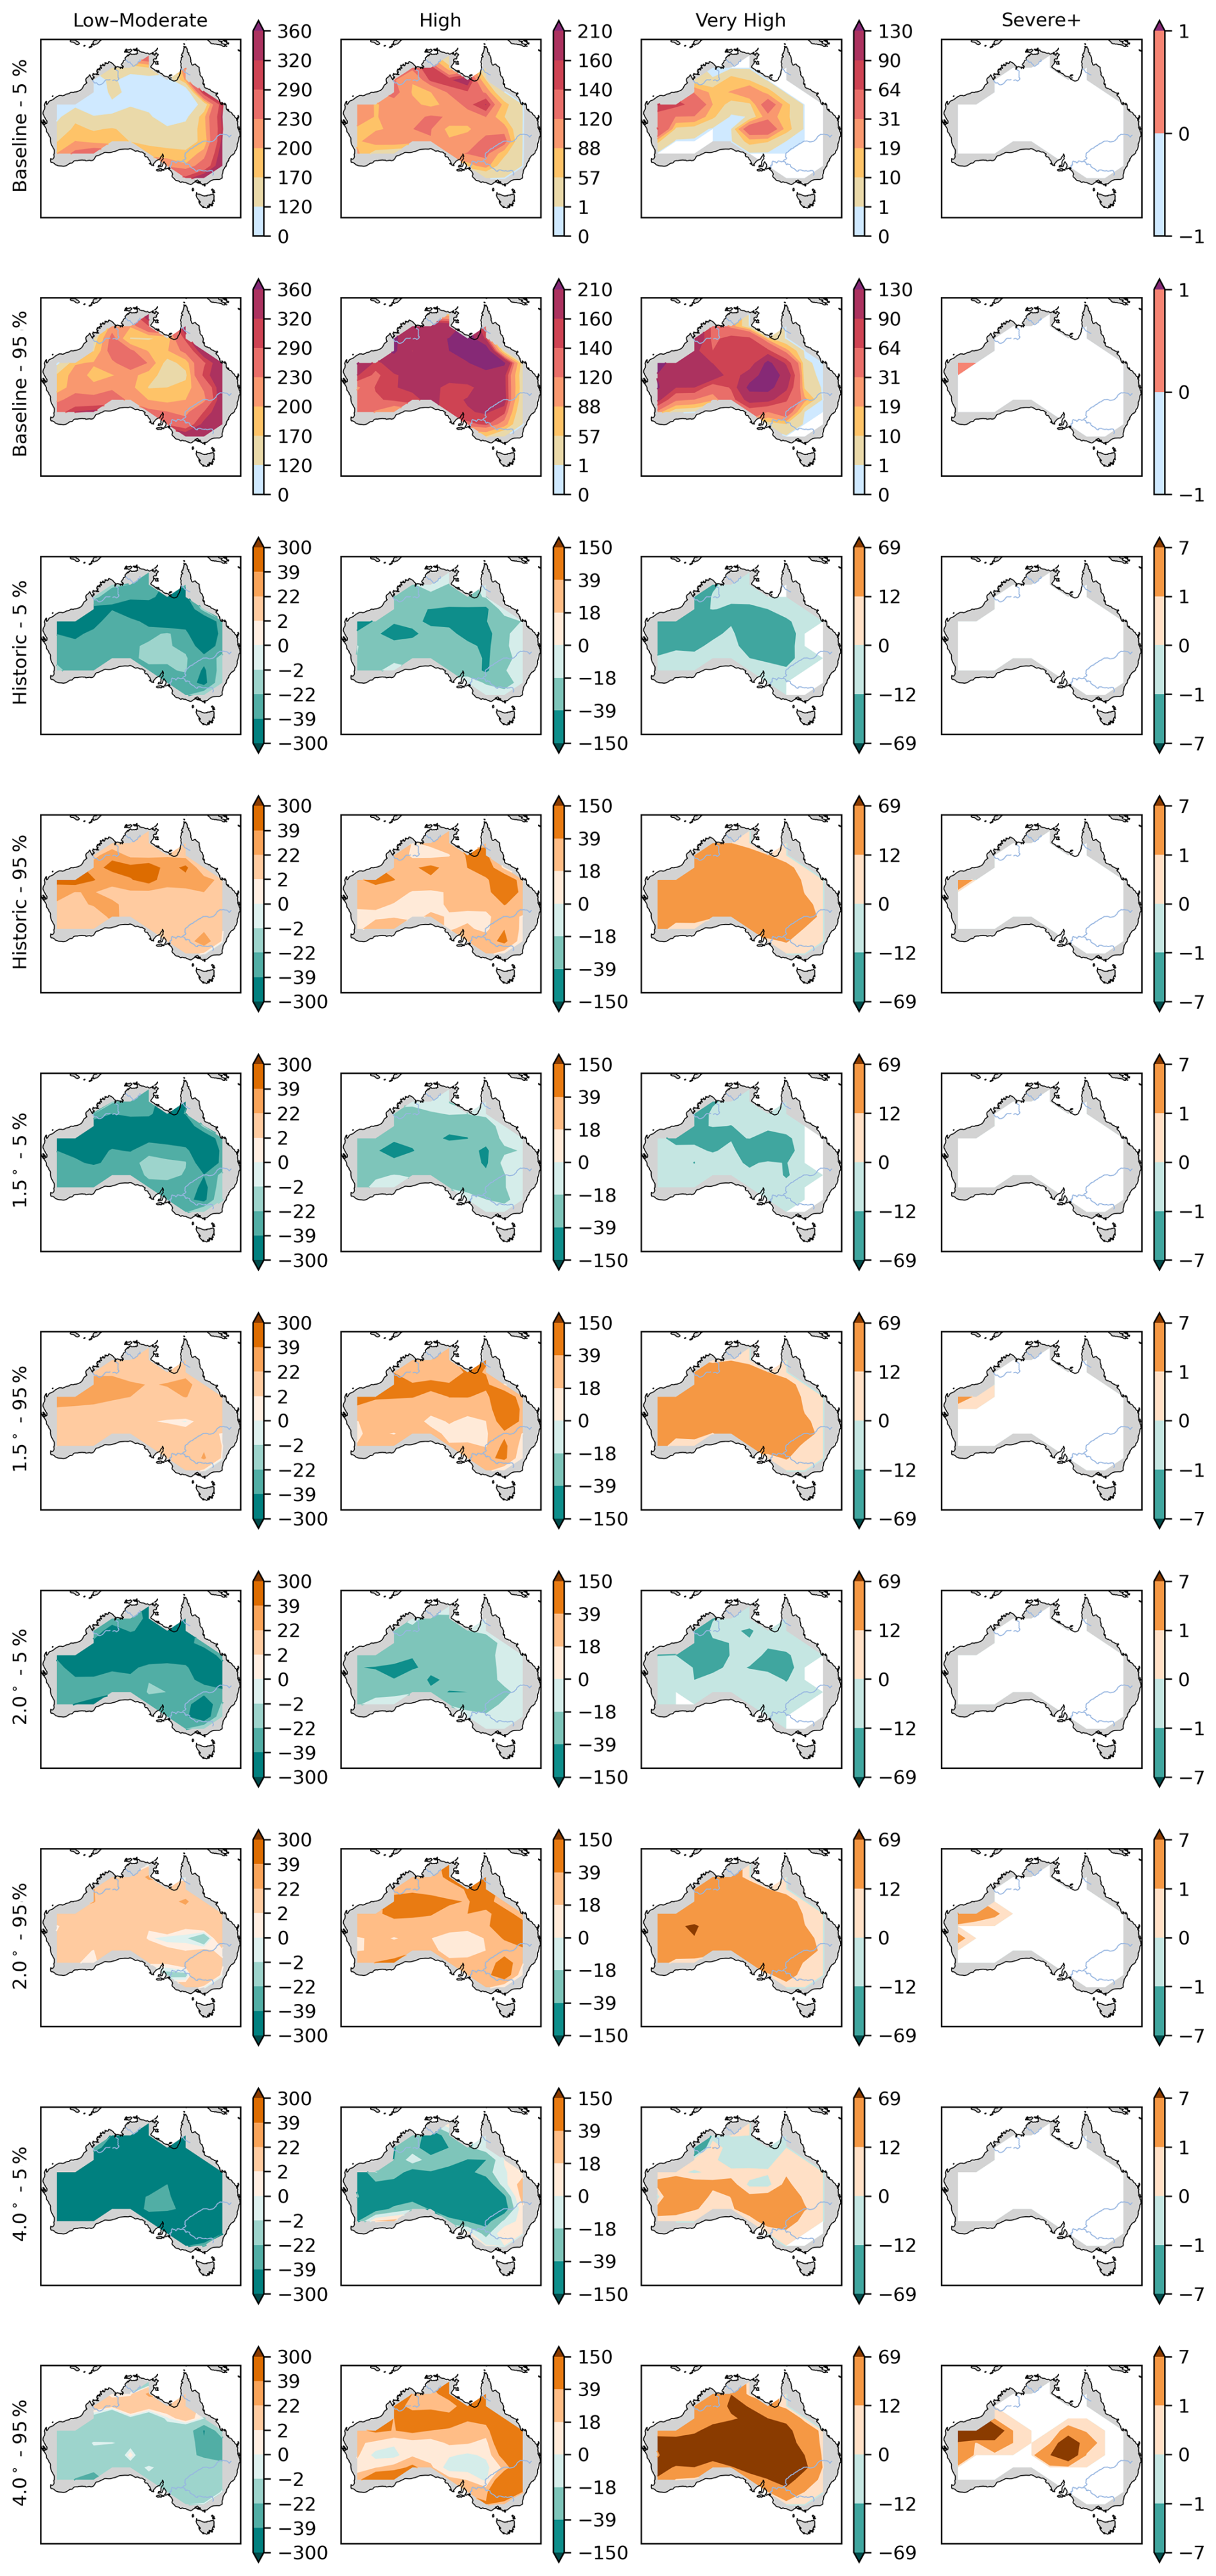
Figure B2Same as Fig. B1 but for RCP8.5 and including GWL of 4.0 °C.
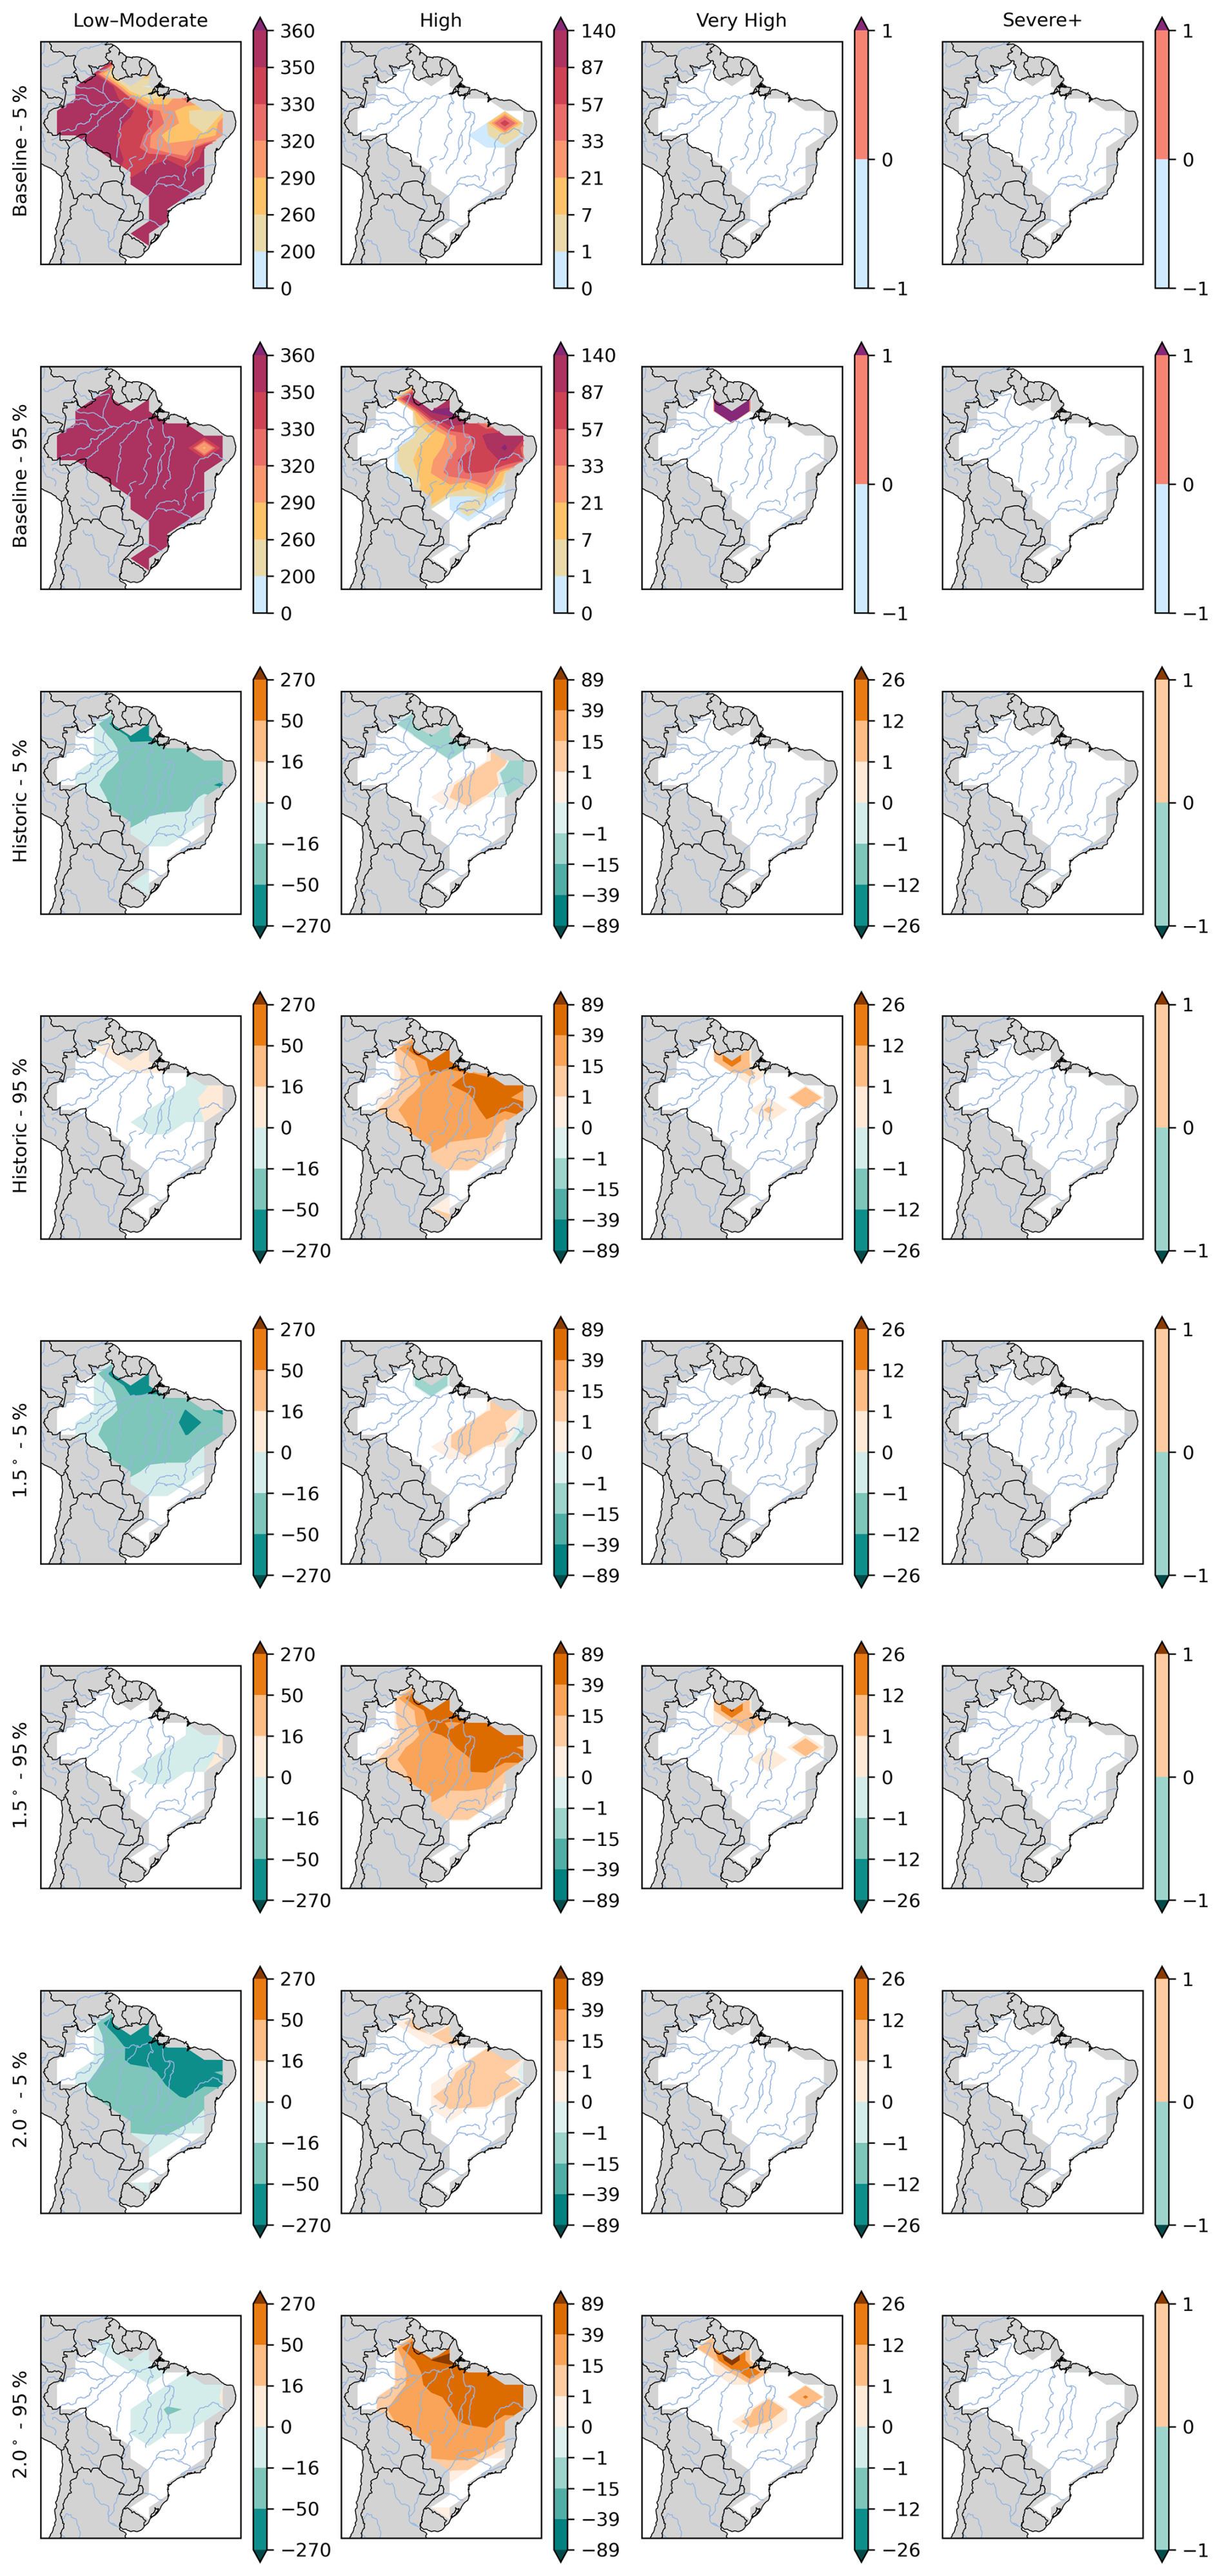
Figure B3Same as Fig. B1 but for Brazil.
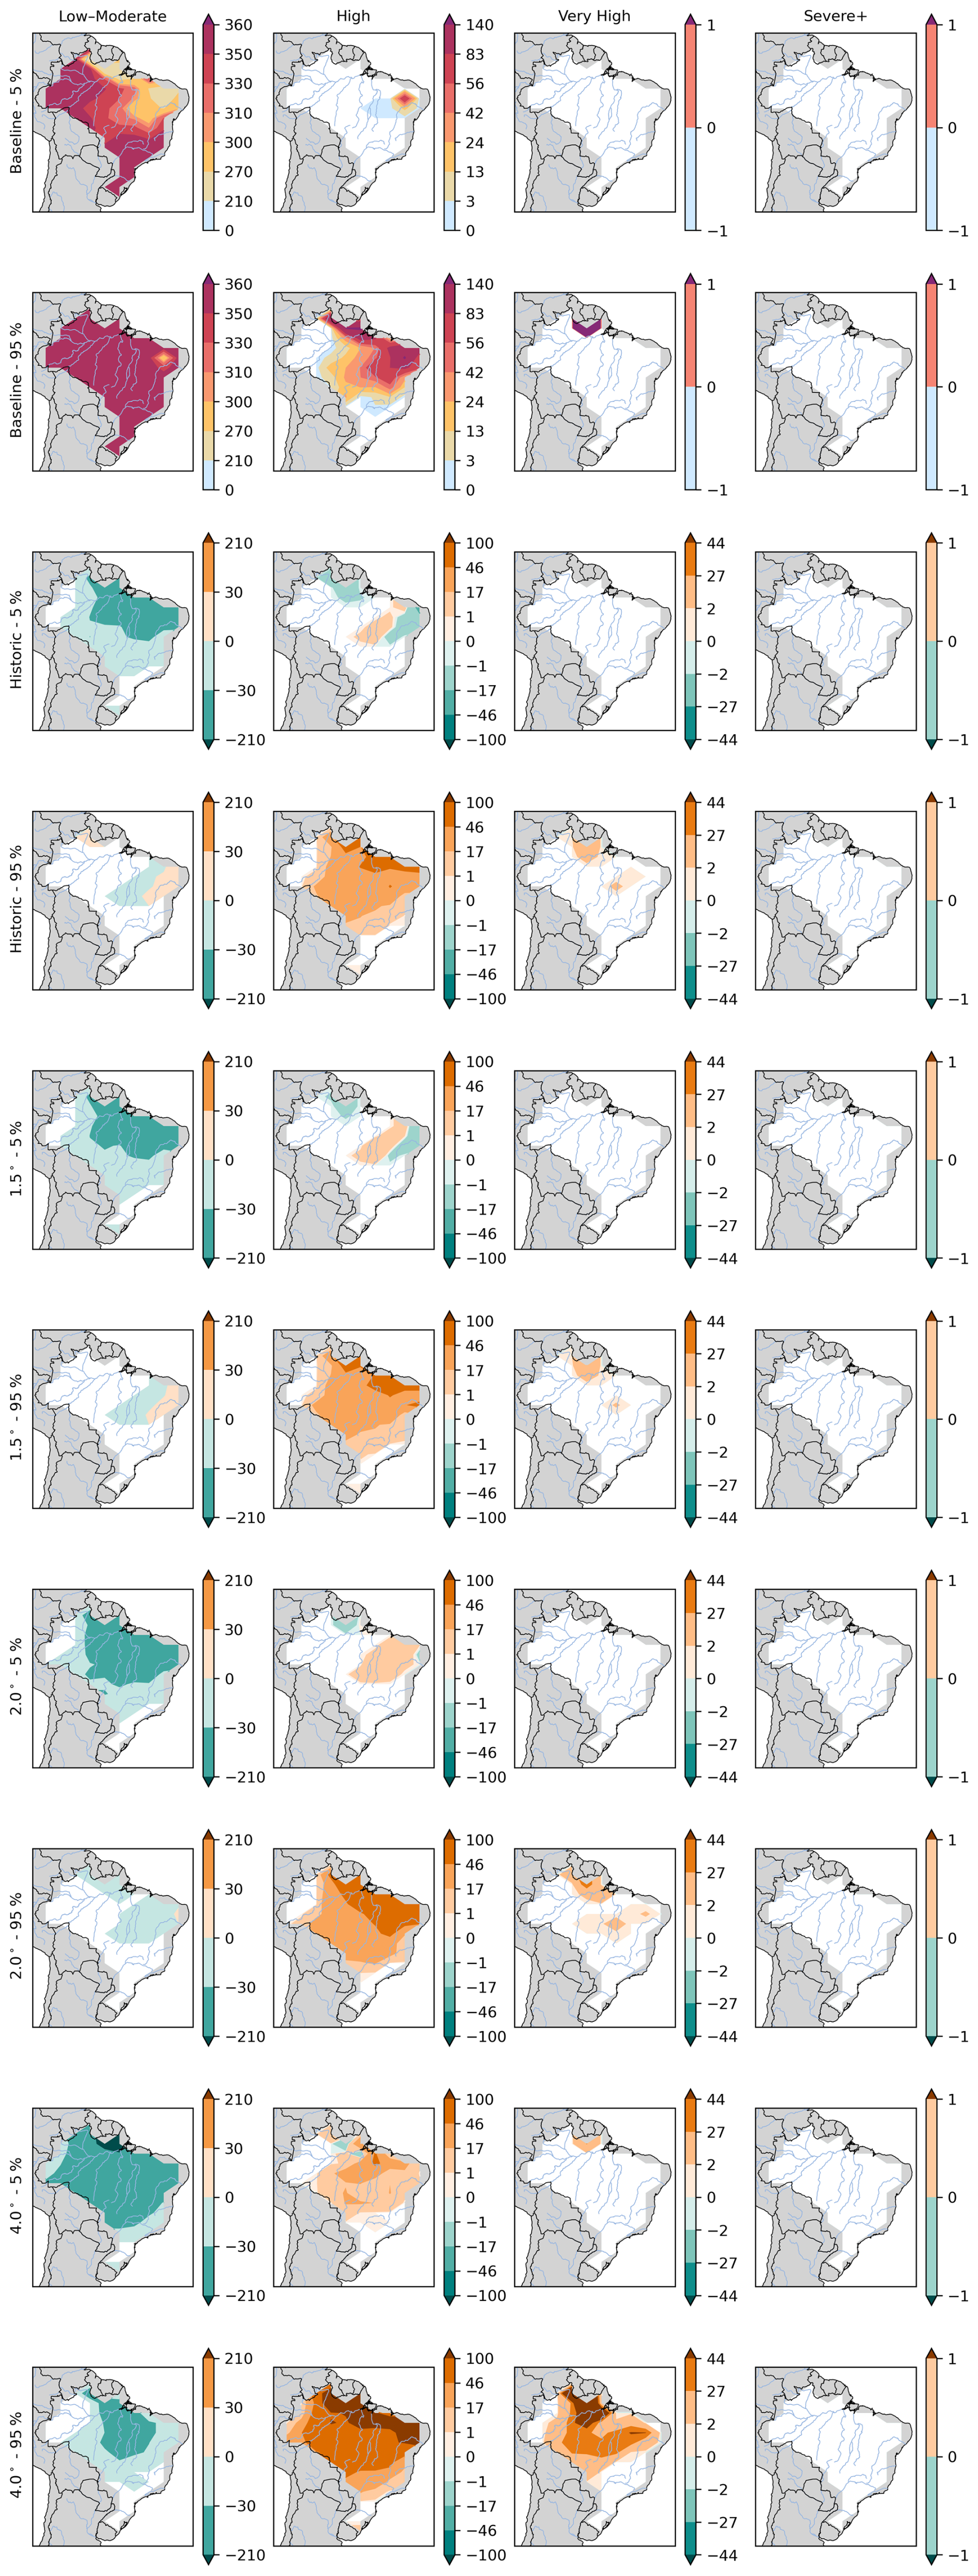
Figure B4Same as Fig. B2 but for Brazil.
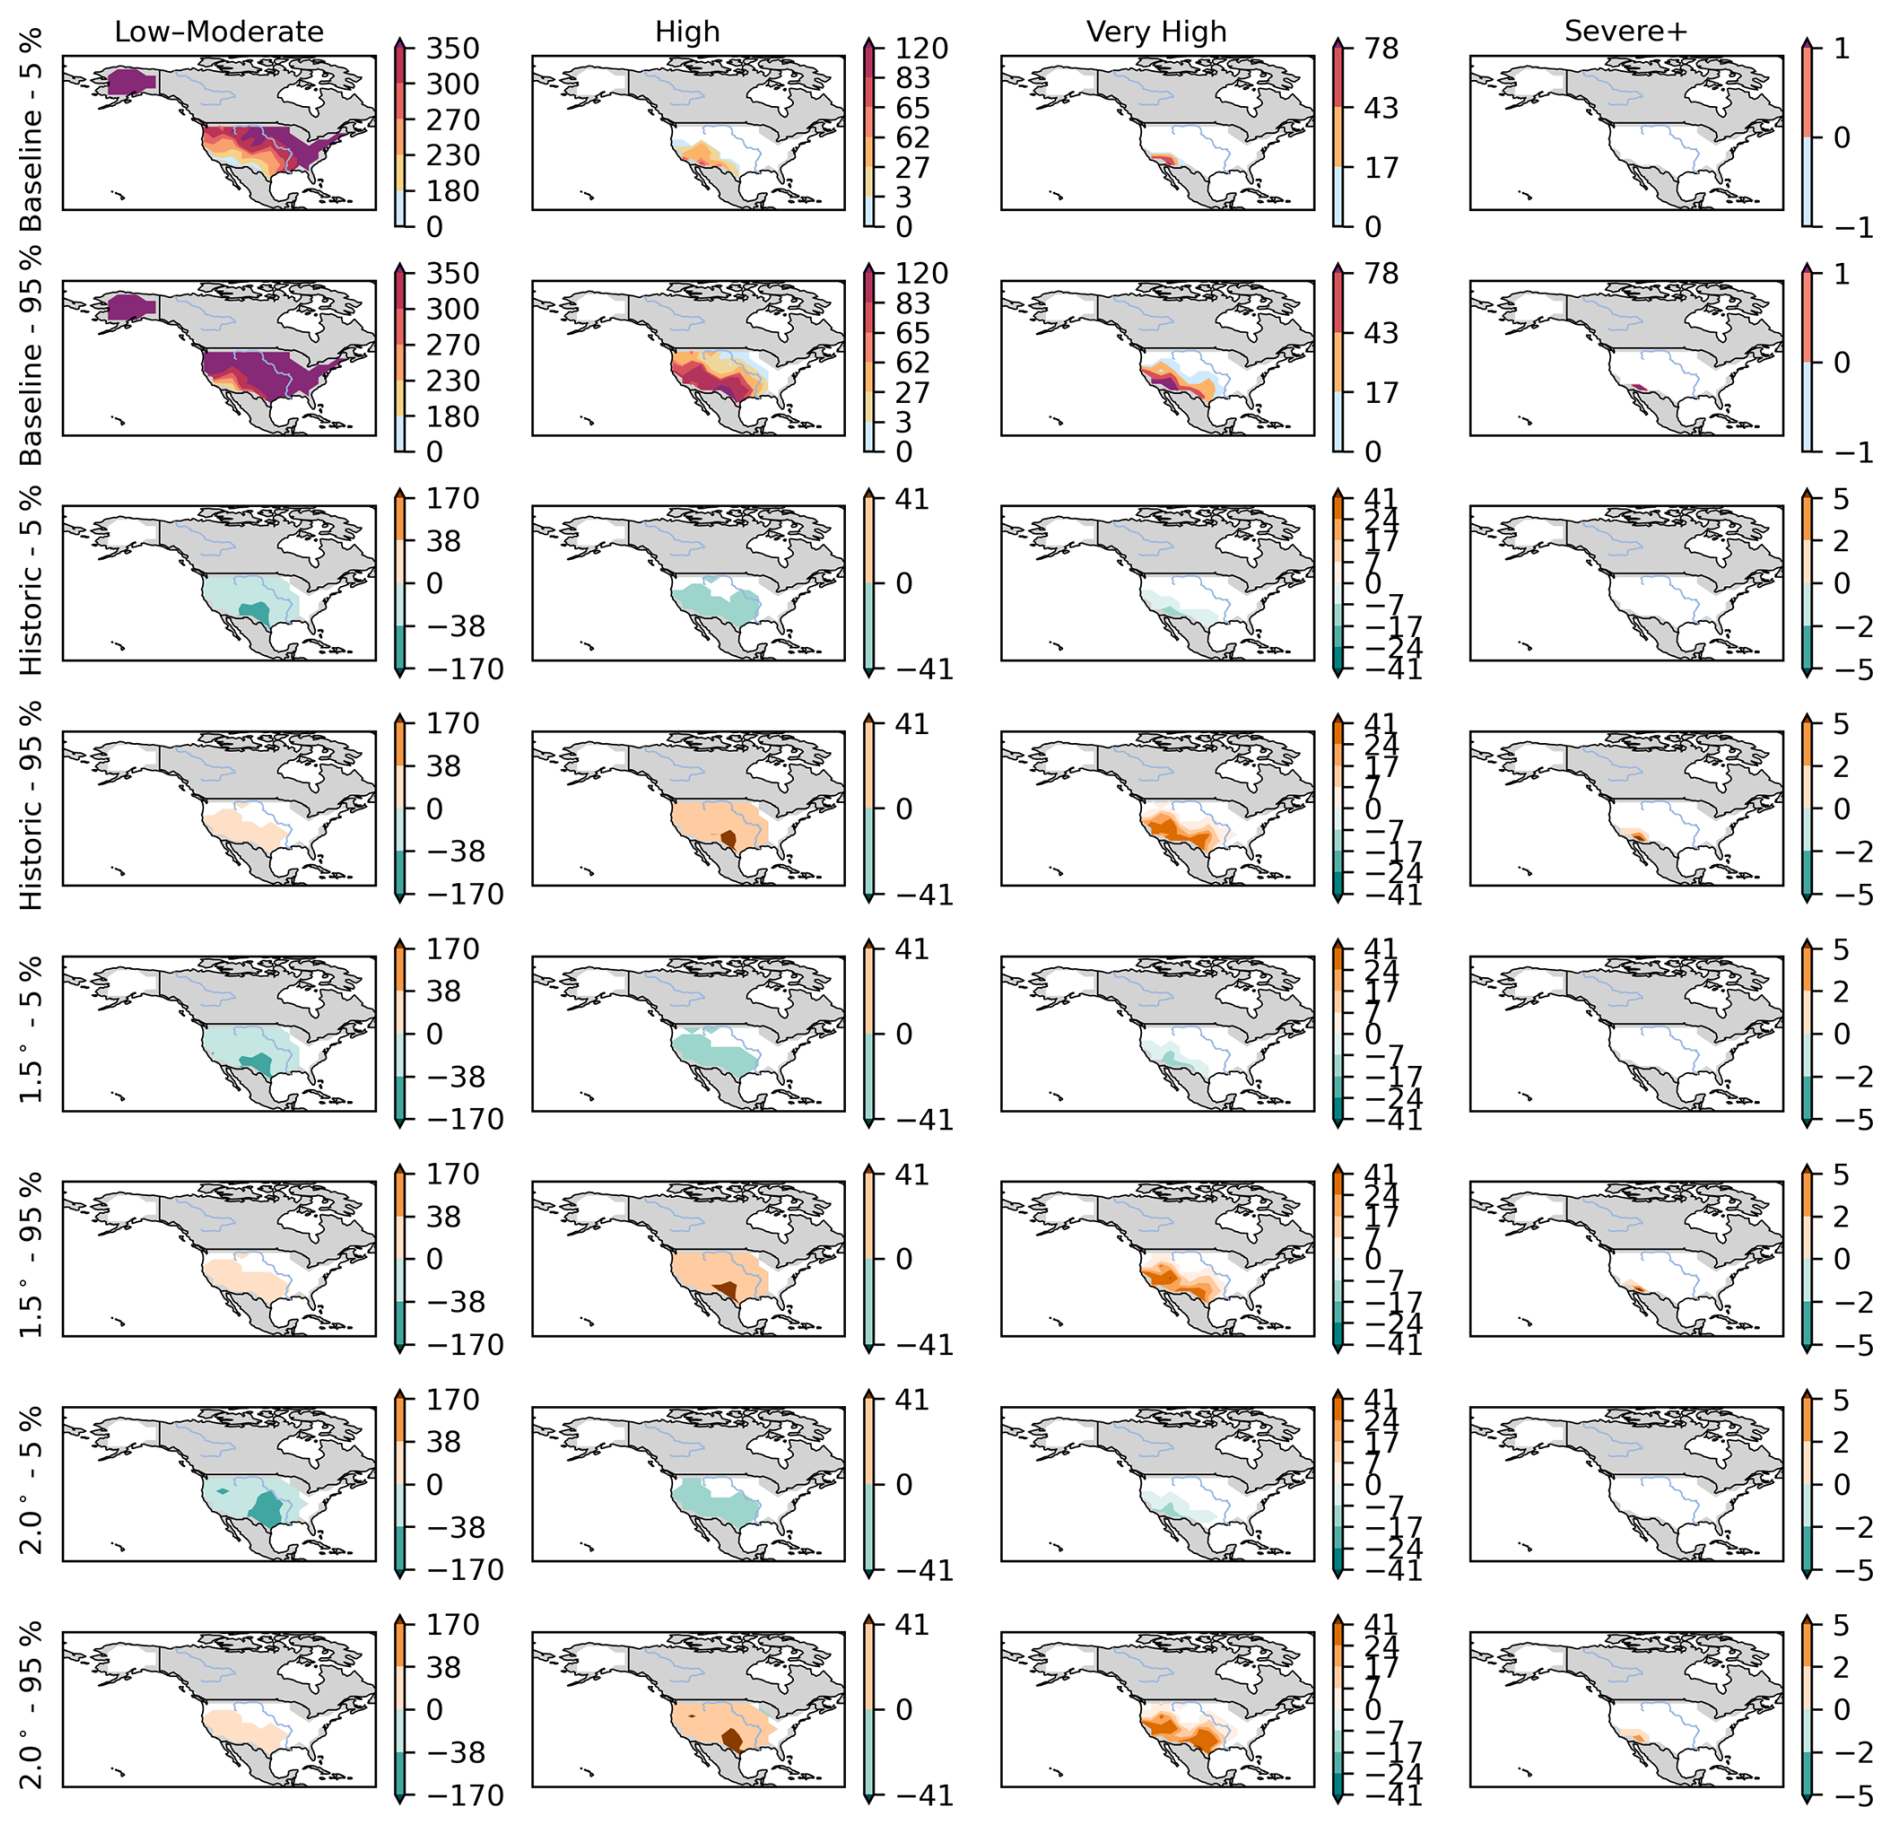
Figure B5Same as Fig. B1 but for USA.
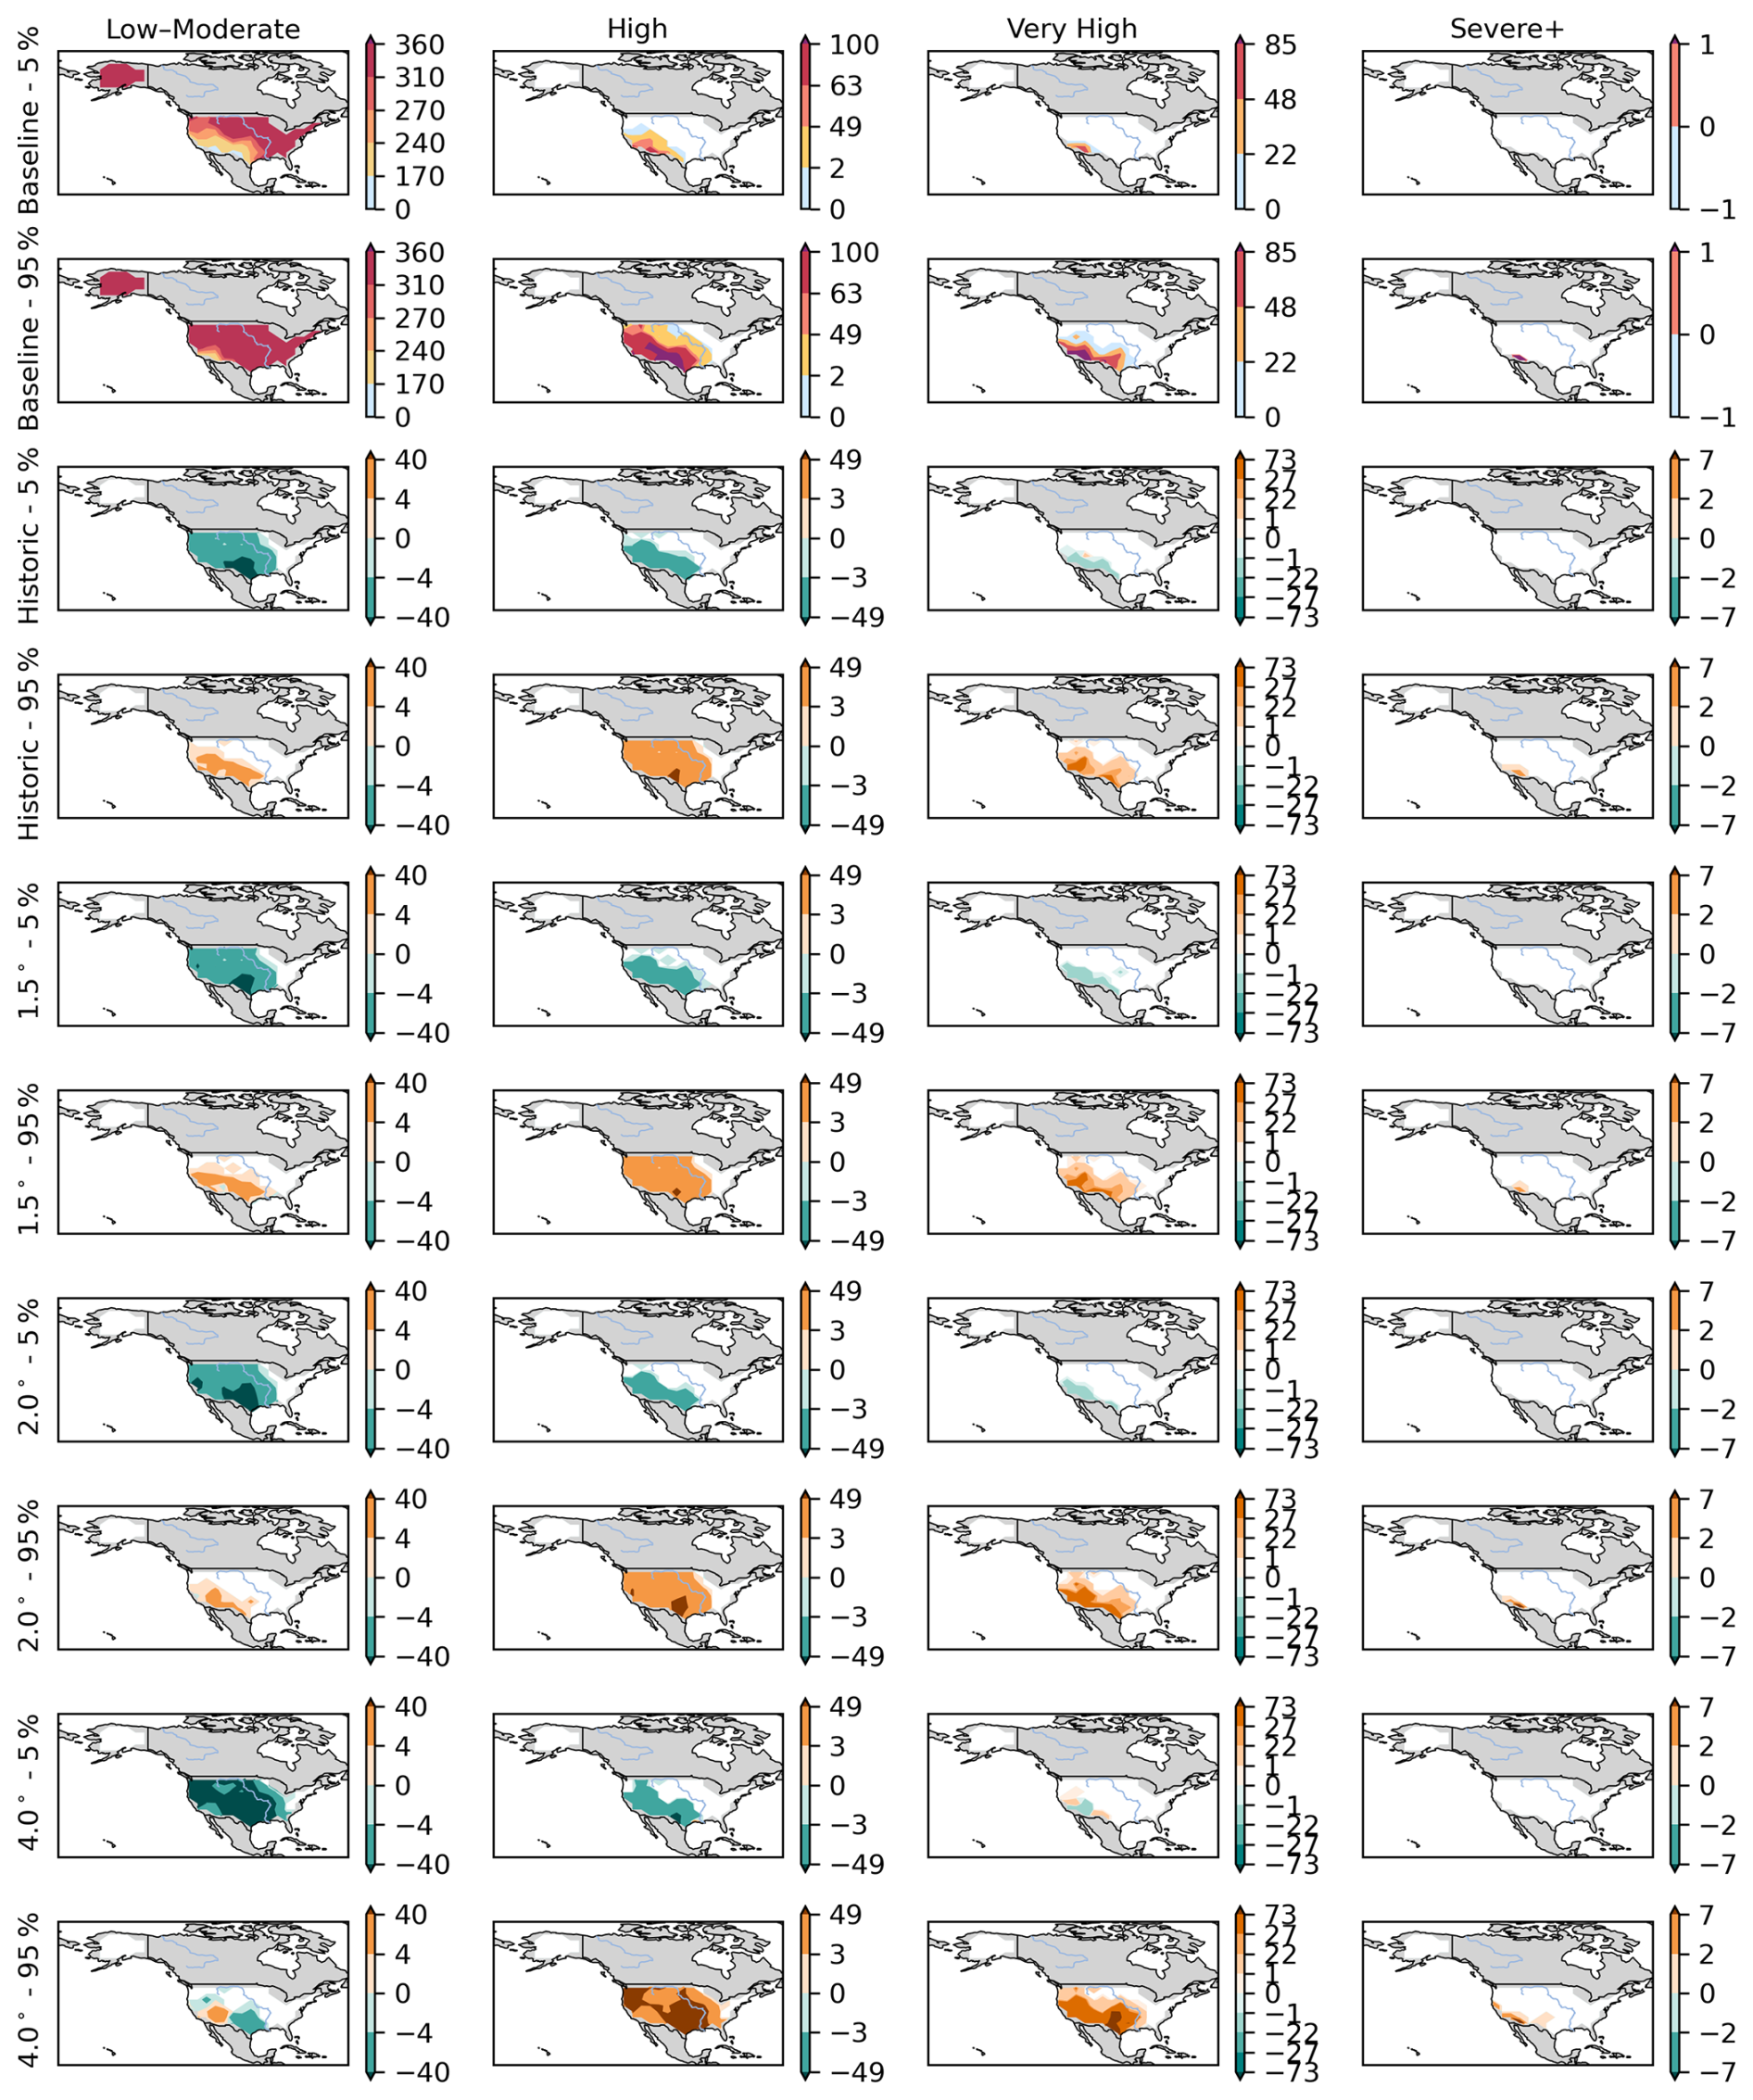
Figure B6Same as Fig. B2 but for USA.
The code to produce FFDI variables from HadCM3 is available at https://code.metoffice.gov.uk/trac/utils/wiki/fire (last access: 23 June 2026), with access to Met Office Science Repository Service freely available by registering at http://jules-lsm.github.io/access_req/JULES_access.html (last access: 23 June 2026). The code for performing analysis and producing figures and tables is available at https://doi.org/10.5281/zenodo.14871362 (Taylor et al., 2026).
HadCM3 PPE FFDI outputs are available at https://doi.org/10.5281/zenodo.14860331 (Taylor et al., 2025a) for RCP2.6 and https://doi.org/10.5281/zenodo.14859064 (Taylor et al., 2025b) for RCP8.5.
IT planned and led the research, analysis and visualisation of results, with input to the experimental design and GWLs analysis framework by DK, RB and CB. IT, DK and CM conducted the analysis and visualisation of results. AH analysed and visualised the assessment of the FFDI variables. KW developed the original model code for calculating the FFDI. IT and DK prepared the manuscript with contributions from CM, KW, AH, RB, CB and MLFB. CM and MLFB reviewed and edited the draft and final manuscripts.
The contact author has declared that none of the authors has any competing interests.
Publisher's note: Copernicus Publications remains neutral with regard to jurisdictional claims made in the text, published maps, institutional affiliations, or any other geographical representation in this paper. The authors bear the ultimate responsibility for providing appropriate place names. Views expressed in the text are those of the authors and do not necessarily reflect the views of the publisher.
We extend our sincere gratitude to Camilla Mathison for her exceptional dedication in coordinating co-authors and driving the manuscript forward. Her proactive efforts and commitment were instrumental in preparing this paper for submission.
We acknowledge the use of GrammarlyGO (https://www.grammarly.com/, last access: 23 June 2026) and ChatGPT-4 (https://chatgpt.com/, last access: 23 June 2026) to identify improvements in language use and writing style only.
This work and its contributors (Inika Taylor, Andy Hartley, Richard Betts, Chantelle Burton, Camilla Mathison and Karina Williams) were supported by the Met Office Hadley Centre Climate Programme funded by DSIT, and by the Met Office Climate Science for Service Partnership (CSSP) Brazil project under the International Science Partnerships Fund (ISPF). Douglas I. Kelley and Maria L. F. Barbosa were supported by the Natural Environment Research Council as part of the LTSM2 TerraFIRMA project.
This paper was edited by Renata Libonati and reviewed by two anonymous referees.
Anderson, L. O., Burton, C., dos Reis João, B. C., Pessôa, A. C. M., Bett, P., Carvalho, N. S., Junior, C. H. L. S., Williams, K., Selaya, G., Armenteras, D., Bilbao, B. A., Xaud, H. A. M., Rivera-Lombardi, R., Ferreira, J., Aragão, L. E. O. C., Jones, C. D., and Wiltshire, A. J.: An alert system for Seasonal Fire probability forecast for South American Protected Areas, Clim. Resil., 1, https://doi.org/10.1002/cli2.19, 2022.
Barbosa, M. L. F., Delgado, R. C., Forsad de Andrade, C., Teodoro, P. E., Silva Junior, C. A., Wanderley, H. S., and Capristo-Silva, G. F.: Recent trends in the fire dynamics in Brazilian Legal Amazon: Interaction between the ENSO phenomenon, climate and land use, Environ. Dev., 39, 100648, https://doi.org/10.1016/j.envdev.2021.100648, 2021.
Ferreira Barbosa, M. L., Haddad, I., da Silva Nascimento, A. L., Máximo da Silva, G., Moura da Veiga, R., Hoffmann, T. B., Rosane de Souza, A., Dalagnol, R., Susin Streher, A., Souza Pereira, F. R., Oliveira e Cruz de Aragão, L. E., and Oighenstein Anderson, L.: Compound impact of land use and extreme climate on the 2020 fire record of the Brazilian Pantanal, Glob. Ecol. Biogeogr., 31, 1960–1975, https://doi.org/10.1111/geb.13563, 2022.
Barbosa, M. L. F., Kelley, D. I., Burton, C. A., Ferreira, I. J. M., da Veiga, R. M., Bradley, A., Molin, P. G., and Anderson, L. O.: FLAME 1.0: a novel approach for modelling burned area in the Brazilian biomes using the maximum entropy concept, Geosci. Model Dev., 18, 3533–3557, https://doi.org/10.5194/gmd-18-3533-2025, 2025.
Best, M. J., Pryor, M., Clark, D. B., Rooney, G. G., Essery, R. L. H., Ménard, C. B., Edwards, J. M., Hendry, M. A., Porson, A., Gedney, N., Mercado, L. M., Sitch, S., Blyth, E., Boucher, O., Cox, P. M., Grimmond, C. S. B., and Harding, R. J.: The Joint UK Land Environment Simulator (JULES), model description – Part 1: Energy and water fluxes, Geosci. Model Dev., 4, 677–699, https://doi.org/10.5194/gmd-4-677-2011, 2011.
Bett, P. E., Williams, K. E., Burton, C., Scaife, A. A., Wiltshire, A. J., and Gilham, R.: Skillful seasonal prediction of key carbon cycle components: NPP and fire risk, Environ. Res. Commun., 2, 55002, https://doi.org/10.1088/2515-7620/ab8b29, 2020.
Betts, R. A., Cox, P. M., Collins, M., Harris, P. P., Huntingford, C., and Jones, C. D.: The role of ecosystem-atmosphere interactions in simulated Amazonian precipitation decrease and forest dieback under global climate warming, Theor. Appl. Climatol., 78, https://doi.org/10.1007/s00704-004-0050-y, 2004.
Betts, R. A., Golding, N., Gonzalez, P., Gornall, J., Kahana, R., Kay, G., Mitchell, L., and Wiltshire, A.: Climate and land use change impacts on global terrestrial ecosystems and river flows in the HadGEM2-ES Earth system model using the representative concentration pathways, Biogeosciences, 12, 1317–1338, https://doi.org/10.5194/bg-12-1317-2015, 2015.
Boer, M. M., de Dios, V. R., and Bradstock, R. A.: Unprecedented burn area of Australian mega forest fires, Nat. Clim. Chang., 10, 171–172, https://doi.org/10.1038/s41558-020-0716-1, 2020.
Booth, B. B. B., Bernie, D., McNeall, D., Hawkins, E., Caesar, J., Boulton, C., Friedlingstein, P., and Sexton, D. M. H.: Scenario and modelling uncertainty in global mean temperature change derived from emission-driven global climate models, Earth Syst. Dynam., 4, 95–108, https://doi.org/10.5194/esd-4-95-2013, 2013.
Breiman, L.: Random Forests, Mach. Learn., 45, 5–32, https://doi.org/10.1023/A:1010933404324, 2001.
Burrows, N. and McCaw, L.: Prescribed burning in southwestern Australian forests, Front. Ecol. Environ., 11, e25–e34, https://doi.org/10.1890/120356, 2013.
Burton, C., Betts, R. A., Jones, C. D., and Williams, K.: Will fire danger be reduced by using Solar Radiation Management to limit global warming to 1.5 C compared to 2.0 C?, Geophys. Res. Lett., https://doi.org/10.1002/2018GL077848, 2018.
Burton, C., Betts, R., Cardoso, M., Feldpausch, T. R., Harper, A., Jones, C. D., Kelley, D. I., Robertson, E., and Wiltshire, A.: Representation of fire, land-use change and vegetation dynamics in the Joint UK Land Environment Simulator vn4.9 (JULES), Geosci. Model Dev., 12, 179–193, https://doi.org/10.5194/gmd-12-179-2019, 2019.
Burton, C., Betts, R. A., Jones, C. D., Feldpausch, T. R., Cardoso, M., and Anderson, L. O.: El Niño driven changes in global fire 2015/16, Front. Earth Sci. (Lausanne), 8, 199, https://doi.org/10.3389/feart.2020.00199, 2020.
Burton, C., Kelley, D. I., Jones, C. D., Betts, R. A., Cardoso, M., and Anderson, L.: South American fires and their impacts on ecosystems increase with continued emissions, Clim. Resil. Sustain., 1, e8, https://doi.org/10.1002/cli2.8, 2022.
Burton, C. A., Kelley, D. I., Burke, E., Mathison, C., Jones, C. D., Betts, R. A., Robertson, E., Teixeira, J. C. M., Cardoso, M., and Anderson, L. O.: Fire weakens land carbon sinks before 1.5 °C, Nat. Geosci., 1–7, https://doi.org/10.1038/s41561-024-01554-7, 2024.
Burton, C. A., Ciavarella, A., Kelley, D., Hartley, A. J., McCarthy, M., S. New, Betts, R. A., and Robertson, E.: Very high fire danger in UK in 2022 at least 6 times more likely due to human-caused climate change, Environ. Res. Lett., 20, https://doi.org/10.1088/1748-9326/adb764, 2025.
Chuvieco, E., Pettinari, M. L., Lizundia Loiola, J., Storm, T., and Padilla Parellada, M.: ESA Fire Climate Change Initiative (Fire_cci): MODIS Fire_cci Burned Area Grid product, version 5.1, Centre for Environmental Data Analysis, https://doi.org/10.5285/3628CB2FDBA443588155E15DEE8E5352, 2019.
Cirulis, B., Clarke, H., Boer, M., Penman, T., Price, O., and Bradstock, R.: Quantification of inter-regional differences in risk mitigation from prescribed burning across multiple management values, Int. J. Wildland Fire, 29, 414, https://doi.org/10.1071/WF18135, 2020.
Clarke, H. and Evans, J. P.: Exploring the future change space for fire weather in southeast Australia, Theor. Appl. Climatol., 136, 513–527, https://doi.org/10.1007/s00704-018-2507-4, 2019a.
Clarke, H. and Evans, J. P.: Exploring the future change space for fire weather in southeast Australia, Theor. Appl. Climatol., 136, 513–527, 2019b.
Clarke, H., Tran, B., Boer, M. M., Price, O., Kenny, B., and Bradstock, R.: Climate change effects on the frequency, seasonality and interannual variability of suitable prescribed burning weather conditions in south-eastern Australia, Agric. For. Meteorol., 271, 148–157, https://doi.org/10.1016/j.agrformet.2019.03.005, 2019.
CMES: Fire danger indices historical data from the Copernicus Emergency Management Service, Copernicus Climate Change Service, Climate Data Store, https://doi.org/10.24381/cds.0e89c522, 2019.
Cox, P. M., Betts, R. A., Jones, C. D., Spall, S. A., and Totterdell, I. J.: Acceleration of global warming due to carbon-cycle feedbacks in a coupled climate model, Nature, 408, 184–187, https://doi.org/10.1038/35041539, 2000.
Cruz, M. G., Gould, J. S., Alexander, M. E., Sullivan, A. L., McCaw, W. L., and Matthews, S.: Empirical-based models for predicting head-fire rate of spread in Australian fuel types, Aust. For., 78, 118–158, https://doi.org/10.1080/00049158.2015.1055063, 2015.
da Veiga, R. M. and Nikolakis, W.: Fire management and carbon programs: A systematic literature review and case study analysis, Soc. Nat. Resour., 35, 896–913, https://doi.org/10.1080/08941920.2022.2053618, 2022.
da Veiga, R. M., von Randow, C., Burton, C., Kelley, D. I., Cardoso, M., and Morelli, F.: Review article: Fire emissions in the Brazilian Cerrado – dynamics, estimates, management, and their role in the global carbon budget, Nat. Hazards Earth Syst. Sci., 25, 3581–3601, https://doi.org/10.5194/nhess-25-3581-2025, 2025.
de Groot, W. J., Wotton, B. M., and Flannigan, M. D.: Chapter 11 – Wildland Fire Danger Rating and Early Warning Systems, in: Wildfire Hazards, Risks and Disasters, edited by: Shroder, J. F. and Paton, D., Elsevier, Oxford, 207–228, ISBN 9780124104341, https://doi.org/10.1016/B978-0-12-410434-1.00011-7, 2015.
Di Giuseppe, F., McNorton, J., Lombardi, A., and Wetterhall, F.: Global data-driven prediction of fire activity, Nat. Commun., 16, https://doi.org/10.1038/s41467-025-58097-7, 2025.
Doley, R. M., Bell, R., and Watt, B. D.: An investigation into the relationship between long-term posttraumatic stress disorder symptoms and coping in Australian volunteer firefighters, J. Nerv. Ment. Dis., 204, 530–536, https://doi.org/10.1097/NMD.0000000000000525, 2016.
Dowdy, A., Mills, G., Finkele, K., and Groot, W. D.: Australian fire weather as represented by the McArthur Forest Fire Danger Index and the Canadian Forest Fire Weather Index, Melbourne : Centre for Australian Weather and Climate Research, ISBN 9781921605185, 2009.
Dowdy, A. J.: Climatological variability of fire weather in Australia, J. Appl. Meteorol. Climatol., 57, 221–234, https://doi.org/10.1175/JAMC-D-17-0167.1, 2018.
Dowdy, A. J., Mills, G. A., Finkele, K., and de Groot, W.: Index sensitivity analysis applied to the Canadian forest fire weather index and the McArthur forest fire danger index, Meteorol. Appl., 17, 298–312, https://doi.org/10.1002/met.170, 2010.
Ferreira, I. J. M., Campanharo, W. A., Barbosa, M. L. F., Silva, S. S., da Selaya, G., Aragão, L. E. O. C., and Anderson, L. O.: Assessment of fire hazard in Southwestern Amazon, Front. For. Glob. Chang., 6, https://doi.org/10.3389/ffgc.2023.1107417, 2023.
Flannigan, M. D., Wotton, B. M., Marshall, G. A., de Groot, W. J., Johnston, J., Jurko, N., and Cantin, A. S.: Fuel moisture sensitivity to temperature and precipitation: climate change implications, Clim. Change, 134, 59–71, https://doi.org/10.1007/s10584-015-1521-0, 2016.
Forkel, M., Dorigo, W., Lasslop, G., Teubner, I., Chuvieco, E., and Thonicke, K.: A data-driven approach to identify controls on global fire activity from satellite and climate observations (SOFIA V1), Geosci. Model Dev., 10, 4443–4476, https://doi.org/10.5194/gmd-10-4443-2017, 2017.
Gill, A. M., Christian, K. R., Moore, P. H. R., and Forrester, R. I.: Bushfire incidence, fire hazard and fuel reduction burning, Aust. J. Ecol., 12, 299–306, https://doi.org/10.1111/j.1442-9993.1987.tb00950.x, 1987.
Golding, N. and Betts, R.: Fire risk in Amazonia due to climate change in the HadCM3 climate model: Potential interactions with deforestation, Global Biogeochem. Cy., 22, https://doi.org/10.1029/2007GB003166, 2008.
Good, P., Lowe, J. A., Collins, M., and Moufouma-Okia, W.: An objective tropical Atlantic sea surface temperature gradient index for studies of south Amazon dry-season climate variability and change, Philos. Trans. R. Soc. Lond. B Biol. Sci., 363, 1761–1766, https://doi.org/10.1098/rstb.2007.0024, 2008.
Gordon, C., Cooper, C., Senior, C. A., Banks, H., Gregory, J. M., Johns, T. C., Mitchell, J. F. B., and Wood, R. A.: The simulation of SST, sea ice extents and ocean heat transports in a version of the Hadley Centre coupled model without flux adjustments, Clim. Dyn., 16, 147–168, https://doi.org/10.1007/s003820050010, 2000.
Haas, O., Prentice, I. C., and Harrison, S. P.: Global environmental controls on wildfire burnt area, size, and intensity, Environ. Res. Lett., 17, 65004, https://doi.org/10.1088/1748-9326/ac6a69, 2022.
Haas, O., Prentice, I. C., and Harrison, S. P.: Wildfires on a changing planet, Nat. Commun., 17, 1599, https://doi.org/10.1038/s41467-025-68176-4, 2026.
Hadisuwito, A. S. and Hassan, F. H.: A comparative study of drought factors in the Mcarthur Forest Fire Danger Index in Indonesian Forest, Copyright© EM International, 27 pp., Journal of Physics: Conference Series, 1529, https://doi.org/10.1088/1742-6596/1529/5/052051, 2020.
Hamilton, D. S., Kelley, D., Perron, M. M. G., Llort, J., Burton, C., Bergas-Masso, E., Ligouri-Bills, N., Barkley, A., Buchholz, R., Diez, S., Dintwe, K., Forkel, M., Hall, J., Hantson, S., Hayman, G., Hebden, S., Jones, M. W., Kulkarni, C., Nowell, B., McCarty, J. L., Santin, C., Schneider, S. R., Shuman, J. K., Thoreson, J., Plummer, S., Poulter, B., Vanniere, B., and Volker, C.: Igniting Progress: Outcomes from the FLARE workshop and three challenges for the future of transdisciplinary fire science, Zenodo, https://doi.org/10.5281/zenodo.12634068, July 2024.
Hantson, S., Arneth, A., Harrison, S. P., Kelley, D. I., Prentice, I. C., Rabin, S. S., Archibald, S., Mouillot, F., Arnold, S. R., Artaxo, P., Bachelet, D., Ciais, P., Forrest, M., Friedlingstein, P., Hickler, T., Kaplan, J. O., Kloster, S., Knorr, W., Lasslop, G., Li, F., Mangeon, S., Melton, J. R., Meyn, A., Sitch, S., Spessa, A., van der Werf, G. R., Voulgarakis, A., and Yue, C.: The status and challenge of global fire modelling, Biogeosciences, 13, 3359–3375, https://doi.org/10.5194/bg-13-3359-2016, 2016.
Hantson, S., Kelley, D. I., Arneth, A., Harrison, S. P., Archibald, S., Bachelet, D., Forrest, M., Hickler, T., Lasslop, G., Li, F., Mangeon, S., Melton, J. R., Nieradzik, L., Rabin, S. S., Prentice, I. C., Sheehan, T., Sitch, S., Teckentrup, L., Voulgarakis, A., and Yue, C.: Quantitative assessment of fire and vegetation properties in simulations with fire-enabled vegetation models from the Fire Model Intercomparison Project, Geosci. Model Dev., 13, 3299–3318, https://doi.org/10.5194/gmd-13-3299-2020, 2020.
Harris, P. P., Huntingford, C., and Cox, P. M.: Amazon Basin climate under global warming: the role of the sea surface temperature, Philos. Trans. R. Soc. Lond. B Biol. Sci., 363, 1753–1759, 2008.
Head, L., Adams, M., McGregor, H. V, and Toole, S.: Climate change and Australia, Wiley Interdiscip. Rev. Clim. Change, 5, 175–197, 2014.
Higuera, P. E. and Abatzoglou, J. T.: Record-setting climate enabled the extraordinary 2020 fire season in the western United States, Glob. Chang. Biol., 27, 1–2, 2021.
Hoffmann, W. A., Schroeder, W., and Jackson, R. B.: Regional feedbacks among fire, climate, and tropical deforestation, J. Geophys. Res., 108, https://doi.org/10.1029/2003JD003494, 2003.
Holgate, C. M., van Dijk, A. I. J. M., Cary, G. J., and Yebra, M.: Using alternative soil moisture estimates in the McArthur Forest Fire Danger Index, Int. J. Wildland Fire, 26, 806–819, https://doi.org/10.1071/WF16217, 2017.
Howard, T., Burrows, N., Smith, T., Glen, D., and McCaw, L.: A framework for prioritising prescribed burning on public land in Western Australia, Int. J. Wildland Fire, 29, 314, https://doi.org/10.1071/WF19029, 2020.
Jain, P., Barber, Q. E., Taylor, S. W., Whitman, E., Castellanos Acuna, D., Boulanger, Y., Chavardès, R. D., Chen, J., Englefield, P., Flannigan, M., Girardin, M. P., Hanes, C. C., Little, J., Morrison, K., Skakun, R. S., Thompson, D. K., Wang, X., and Parisien, M.-A.: Drivers and impacts of the record-breaking 2023 wildfire season in Canada, Nat. Commun., 15, 6764, https://doi.org/10.1038/s41467-024-51154-7, 2024.
Jolly, W. M., Cochrane, M. A., Freeborn, P. H., Holden, Z. A., Brown, T. J., Williamson, G. J., and Bowman, D. M. J. S.: Climate-induced variations in global wildfire danger from 1979 to 2013, Nat. Commun., 6, 7537, https://doi.org/10.1038/ncomms8537, 2015.
Jones, D.: Changes to Fire Weather in Queensland Office of the Assistant Commissioner, Emergency Management and Community Capability Queensland Fire and Emergency Services, https://nla.gov.au/nla.obj-2784235013/view (last access: 23 June 2026), 2019.
Jones, M. W., Abatzoglou, J. T., Sander, V., Andela, N., Lasslop, G., Forkel, M., Smith, A. J. P., Burton, C., Betts, R. A., der Werf, G. R., Sitch, S., Canadell, J. G., Santin, C., Kolden, C., Doerr, S. H., and Le Quéré, C.: Global and regional trends and drivers of fire under climate change, Rev. Geophys., 60, https://doi.org/10.1029/2020RG000726, 2022.
Jones, M. W., Kelley, D. I., Burton, C. A., Di Giuseppe, F., Barbosa, M. L. F., Brambleby, E., Hartley, A. J., Lombardi, A., Mataveli, G., McNorton, J. R., Spuler, F. R., Wessel, J. B., Abatzoglou, J. T., Anderson, L. O., Andela, N., Archibald, S., Armenteras, D., Burke, E., Carmenta, R., Chuvieco, E., Clarke, H., Doerr, S. H., Fernandes, P. M., Giglio, L., Hamilton, D. S., Hantson, S., Harris, S., Jain, P., Kolden, C. A., Kurvits, T., Lampe, S., Meier, S., New, S., Parrington, M., Perron, M. M. G., Qu, Y., Ribeiro, N. S., Saharjo, B. H., San-Miguel-Ayanz, J., Shuman, J. K., Tanpipat, V., van der Werf, G. R., Veraverbeke, S., and Xanthopoulos, G.: State of Wildfires 2023–2024, Earth Syst. Sci. Data, 16, 3601–3685, https://doi.org/10.5194/essd-16-3601-2024, 2024.
Kaye, N. R., Hartley, A., and Hemming, D.: Mapping the climate: guidance on appropriate techniques to map climate variables and their uncertainty, Geosci. Model Dev., 5, 245–256, https://doi.org/10.5194/gmd-5-245-2012, 2012.
Kelley, D. I. and Harrison, S. P.: Enhanced Australian carbon sink despite increased wildfire during the 21st century, Environ. Res. Lett., 9, 104015, https://doi.org/10.1088/1748-9326/9/10/104015, 2014.
Kelley, D. I., Prentice, I. C., Harrison, S. P., Wang, H., Simard, M., Fisher, J. B., and Willis, K. O.: A comprehensive benchmarking system for evaluating global vegetation models, Biogeosciences, 10, 3313–3340, https://doi.org/10.5194/bg-10-3313-2013, 2013.
Kelley, D. I., Bistinas, I., Whitley, R., Burton, C., Marthews, T. R., and Dong, N.: How contemporary bioclimatic and human controls change global fire regimes, Nat. Clim. Chang., 9, 690–696, https://doi.org/10.1038/s41558-019-0540-7, 2019.
Kelley, D. I., Burton, C., Huntingford, C., Brown, M. A. J., Whitley, R., and Dong, N.: Technical note: Low meteorological influence found in 2019 Amazonia fires, Biogeosciences, 18, 787–804, https://doi.org/10.5194/bg-18-787-2021, 2021.
Kelley, D. I., Burton, C., Di Giuseppe, F., Jones, M. W., Barbosa, M. L. F., Brambleby, E., McNorton, J. R., Liu, Z., Bradley, A. S. I., Blackford, K., Burke, E., Ciavarella, A., Di Tomaso, E., Eden, J., Ferreira, I. J. M., Fiedler, L., Hartley, A. J., Keeping, T. R., Lampe, S., Lombardi, A., Mataveli, G., Qu, Y., Silva, P. S., Spuler, F. R., Steinmann, C. B., Torres-Vázquez, M. Á., Veiga, R., van Wees, D., Wessel, J. B., Wright, E., Bilbao, B., Bourbonnais, M., Gao, C., Di Bella, C. M., Dintwe, K., Donovan, V. M., Harris, S., Kukavskaya, E. A., N'Dri, A. B., Santín, C., Selaya, G., Sjöström, J., Abatzoglou, J. T., Andela, N., Carmenta, R., Chuvieco, E., Giglio, L., Hamilton, D. S., Hantson, S., Meier, S., Parrington, M., Sadegh, M., San-Miguel-Ayanz, J., Sedano, F., Turco, M., van der Werf, G. R., Veraverbeke, S., Anderson, L. O., Clarke, H., Fernandes, P. M., and Kolden, C. A.: State of Wildfires 2024–2025, Earth Syst. Sci. Data, 17, 5377–5488, https://doi.org/10.5194/essd-17-5377-2025, 2025.
Khastagir, A., Jayasuriya, N., and Bhuyian, M. A.: Assessment of fire danger vulnerability using McArthur's forest and grass fire danger indices, Nat. Hazard., 94, 1277–1291, https://doi.org/10.1007/s11069-018-3476-8, 2018.
Kloster, S. and Lasslop, G.: Historical and future fire occurrence (1850 to 2100) simulated in CMIP5 Earth System Models, Glob. Planet. Change, 150, 58–69, https://doi.org/10.1016/j.gloplacha.2016.12.017, 2017.
Knapp, E. E., Estes, B. L., and Skinner, C. N.: Ecological Effects of Prescribed Fire Season: A Literature Review and Synthesis for Managers, https://doi.org/10.2737/PSW-GTR-224, 2009.
Lambert, F. H., Harris, G. R., Collins, M., Murphy, J. M., Sexton, D. M. H., and Booth, B. B. B.: Interactions between perturbations to different Earth system components simulated by a fully-coupled climate model, Clim. Dyn., 41, 3055–3072, https://doi.org/10.1007/s00382-012-1618-3, 2013.
Li, F., Song, X., Harrison, S. P., Marlon, J. R., Lin, Z., Leung, L. R., Schwinger, J., Marécal, V., Wang, S., Ward, D. S., Dong, X., Lee, H., Nieradzik, L., Rabin, S. S., and Séférian, R.: Evaluation of global fire simulations in CMIP6 Earth system models, Geosci. Model Dev., 17, 8751–8771, https://doi.org/10.5194/gmd-17-8751-2024, 2024.
Masson-Delmotte, V. P., Zhai, P., Pirani, S. L., Connors, C., Pean, S., Berger, N., Caud, Y., Chen, L., Goldfarb, M. I., and Scheel Monteiro, P. M.: Ipcc, 2021: Summary for policymakers, in: Climate Change 2021 – The Physical Science Basis: Working Group I Contribution to the Sixth Assessment Report of the Intergovernmental Panel on Climate Change, Cambridge University Press, Cambridge, United Kingdom and New York, NY, USA, https://doi.org/10.1017/9781009157896.001, 2021.
Mataveli, G., de Oliveira, G., Silva-Junior, C. H. L., Stark, S. C., Carvalho, N., Anderson, L. O., Gatti, L. V, and Aragão, L. E. O. C.: Record-breaking fires in the Brazilian Amazon associated with uncontrolled deforestation, Nat. Ecol. Evol., 6, 1792–1793, https://doi.org/10.1038/s41559-022-01945-2, 2022.
Morgan, G. W., Tolhurst, K. G., Poynter, M. W., Cooper, N., McGuffog, T., Ryan, R., Wouters, M. A., Stephens, N., Black, P., Sheehan, D., Leeson, P., Whight, S., and Davey, S. M.: Prescribed burning in south-eastern Australia: history and future directions, Aust. For., 83, 4–28, https://doi.org/10.1080/00049158.2020.1739883, 2020.
Murphy, J. M., Booth, B. B. B., Collins, M., Harris, G. R., Sexton, D. M. H., and Webb, M. J.: A methodology for probabilistic predictions of regional climate change from perturbed physics ensembles, P. Trans. Roy. Soc. A, 365, 1993–2028, https://doi.org/10.1098/rsta.2007.2077, 2007.
Noble, I. R., Gill, A. M., and Bary, G. A. V: McArthur's fire-danger meters expressed as equations, Aust. J. Ecol., 5, 201–203, https://doi.org/10.1111/j.1442-9993.1980.tb01243.x, 1980.
O'Brien, P. and Campbell, D.: Wildland firefighter psychological and behavioral health: preliminary data from a national sample of current and former wildland firefighters in the United States, in: International Association of Wildland Fire 6th Annual Human Dimensions Conference, https://firesafety-humandimensions2021.com/ (last access: 22 December 2025), 2021.
Oliveras Menor, I., Prat-Guitart, N., Spadoni, G. L., Hsu, A., Fernandes, P. M., Puig-Gironès, R., Ascoli, D., Bilbao, B. A., Bacciu, V., Brotons, L., Carmenta, R., de-Miguel, S., Gonçalves, L. G., Humphrey, G., Ibarnegaray, V., Jones, M. W., Machado, M. S., Millán, A., de Morais Falleiro, R., Mouillot, F., Pinto, C., Pons, P., Regos, A., Senra de Oliveira, M., Harrison, S. P., and Armenteras Pascual, D.: Integrated fire management as an adaptation and mitigation strategy to altered fire regimes, Commun. Earth Environ., 6, https://doi.org/10.1038/s43247-025-02165-9, 2025.
Pandey, P., Huidobro, G., Lopes, L. F., Ganteaume, A., Ascoli, D., Colaco, C., Xanthopoulos, G., Giannaros, T. M., Gazzard, R., Boustras, G., Steelman, T., Charlton, V., Ferguson, E., Kirschner, J., Little, K., Stoof, C., Nikolakis, W., Fernández-Blanco, C. R., Ribotta, C., Lambrechts, H., Fernandez, M., and Dossi, S.: A global outlook on increasing wildfire risk: Current policy situation and future pathways, Trees For. People, 14, 100431, https://doi.org/10.1016/j.tfp.2023.100431, 2023.
Peng, X., Yu, M., Chen, H., Zhou, B., Shi, Y., and Yu, L.: Projections of wildfire risk and activities under 1.5 °C and 2.0 °C global warming scenarios, Environ. Res. Commun., 5, https://doi.org/10.1088/2515-7620/acbf13, 2023.
Pivello, V. R.: The use of fire in the cerrado and Amazonian rainforests of Brazil: Past and present, Fire Ecol., 7, 24–39, https://doi.org/10.4996/fireecology.0701024, 2011.
Rabin, S. S., Melton, J. R., Lasslop, G., Bachelet, D., Forrest, M., Hantson, S., Kaplan, J. O., Li, F., Mangeon, S., Ward, D. S., Yue, C., Arora, V. K., Hickler, T., Kloster, S., Knorr, W., Nieradzik, L., Spessa, A., Folberth, G. A., Sheehan, T., Voulgarakis, A., Kelley, D. I., Prentice, I. C., Sitch, S., Harrison, S., and Arneth, A.: The Fire Modeling Intercomparison Project (FireMIP), phase 1: experimental and analytical protocols with detailed model descriptions, Geosci. Model Dev., 10, 1175–1197, https://doi.org/10.5194/gmd-10-1175-2017, 2017.
Russell-Smith, J., McCaw, L., and Leavesley, A.: Adaptive prescribed burning in Australia for the early 21st Century – context, status, challenges, Int. J. Wildland Fire, 29, 305, https://doi.org/10.1071/WF20027, 2020.
Santos, F. L. M., Nogueira, J., de Souza Rodrigo, A. F., Falleiro, R. M., Schmidt, I. B., and Libonati, R.: Prescribed burning reduces large, high-intensity wildfires and emissions in the Brazilian Savanna, Fire, 4, 56, https://doi.org/10.3390/fire4030056, 2021.
Sharples, J. J., Cary, G. J., Fox-Hughes, P., Mooney, S., Evans, J. P., Fletcher, M.-S., Fromm, M., Grierson, P. F., McRae, R., and Baker, P.: Natural hazards in Australia: extreme bushfire, Clim. Change, 139, 85–99, 2016.
Silveira, M. V. F., Petri, C. A., Broggio, I. S., Chagas, G. O., Macul, M. S., Leite, C. C. S. S., Ferrari, E. M. M., Amim, C. G. V, Freitas, A. L. R., Motta, A. Z. V, Carvalho, L. M. E., Silva Junior, C. H. L., Anderson, L. O., and Aragão, L. E. O. C.: Drivers of Fire Anomalies in the Brazilian Amazon: Lessons Learned from the 2019 Fire Crisis, Land (Basel), 9, 516, https://doi.org/10.3390/land9120516, 2020.
Sirakoff, C.: A correction to the equations describing the McArthur forest fire danger meter, Aust. J. Ecol., 10, 481, https://doi.org/10.1111/j.1442-9993.1985.tb00909.x, 1985.
Son, R., Kim, H., Wang, S. Y., Jeong, J. H., Woo, S. H., Jeong, J. Y., Lee, B. D., Kim, S. H., LaPlante, M., Kwon, C. G., and Yoon, J. H.: Changes in fire weather climatology under 1.5 °C and 2.0 °C warming, Environ. Res. Lett., 16, https://doi.org/10.1088/1748-9326/abe675, 2021.
Stephens, S. L., McIver, J. D., Boerner, R. E. J., Fettig, C. J., Fontaine, J. B., Hartsough, B. R., Kennedy, P. L., and Schwilk, D. W.: The effects of forest fuel-reduction treatments in the United States, Bioscience, 62, 549–560, https://doi.org/10.1525/bio.2012.62.6.6, 2012.
Sun, Q., Miao, C., Hanel, M., Borthwick, A. G. L., Duan, Q., Ji, D., and Li, H.: Global heat stress on health, wildfires, and agricultural crops under different levels of climate warming, Environ. Int., 128, 125–136, https://doi.org/10.1016/j.envint.2019.04.025, 2019.
Swain, D. L., Abatzoglou, J. T., Kolden, C., Shive, K., Kalashnikov, D. A., Singh, D., and Smith, E.: Climate change is narrowing and shifting prescribed fire windows in western United States, Commun. Earth Environ., 4, https://doi.org/10.1038/s43247-023-00993-1, 1973.
Taylor, I., Williams, K., Mathison, C., Hartley, A., Betts, R., Kelley, D., and Burton, C.: Global Daily FFDI Projections from HadCM3C Perturbed Physics Ensemble – RCP2.6, Zenodo [data set], https://doi.org/10.5281/zenodo.14860331, February 2025a.
Taylor, I., Williams, K., Mathison, C., Hartley, A., Betts, R., Kelley, D., and Burton, C.: Global Daily FFDI Projections from HadCM3C Perturbed Physics Ensemble – RCP8.5, Zenodo [data set], https://doi.org/10.5281/zenodo.14859064, February 2025b.
Taylor, I., Williams, K., Mathison, C., Kelley, D., Hartley, A., Betts, R., and Burton, C.: Analysis code for Future fire weather projections show the importance of mitigation and adaptation for dynamic fire management, Zenodo [code], https://doi.org/10.5281/zenodo.14871362, 2026.
Taylor, I. H., Burke, E., McColl, L., Falloon, P. D., Harris, G. R., and McNeall, D.: The impact of climate mitigation on projections of future drought, Hydrol. Earth Syst. Sci., 17, 2339–2358, https://doi.org/10.5194/hess-17-2339-2013, 2013.
Tian, C., Yue, X., Zhu, J., Liao, H., Yang, Y., Chen, L., Zhou, X., Lei, Y., Zhou, H., and Cao, Y.: Projections of fire emissions and the consequent impacts on air quality under 1.5 °C and 2 °C global warming, Environ. Pollut., 323, https://doi.org/10.1016/j.envpol.2023.121311, 2023.
UNEP, Popescu, A., Paulson, A. K., Christianson, A. C., Sullivan, A., Tulloch, A., Bilbao, B., Mathison, C., Robinson, C., Burton, C., Ganz, D., Nangoma, D., Saah, D., Armenteras, D., Driscoll D., Hankins, D. L., Kelley, D. I., Langer, E. R. L., Baker, E., Berenguer, E., Reisen, F., Robinne, F.-N., Galudra, G., Humphrey, G., Safford, H., Baird, I. G., Oliveras, I., Littell, J., Kieft, J., Chew, J., Maclean, K., Wittenberg, L., Anderson, L. O., Gillson, L., Plucinski, M., Moritz, M., Brown, M., Soto, M. C., Flannigan, M., Costello, O., Silva, P. S., Fernandes, P., Moore, P., Jandt, R., Blanchi, R., Libonati, R., Archibald, S., Dunlop, S., McCaffrey, S., Page, S., Gonzãlez Tiina, D. T., Sokchea, T., and Charlton, V.: Spreading like Wildfire: The Rising Threat of Extraordinary Landscape Fires, edited by: Sullivan, A., Kurvits, T., and Baker, E., United Nations Environment Programme and GRID-Arendal, https://www.unep.org/resources/report/spreading-wildfire-rising-threat-extraordinary-landscape-fires (last access: 23 June 2026), 2022.
UNFCCC: Adoption of the Paris agreement, 21st conference of the parties, https://unfccc.int/resource/docs/2015/cop21/eng/10a01.pdf (last access: 23 June 2026), 2015.
van Oldenborgh, G. J., Krikken, F., Lewis, S., Leach, N. J., Lehner, F., Saunders, K. R., van Weele, M., Haustein, K., Li, S., Wallom, D., Sparrow, S., Arrighi, J., Singh, R. K., van Aalst, M. K., Philip, S. Y., Vautard, R., and Otto, F. E. L.: Attribution of the Australian bushfire risk to anthropogenic climate change, Nat. Hazards Earth Syst. Sci., 21, 941–960, https://doi.org/10.5194/nhess-21-941-2021, 2021.
Ward, M., Tulloch, A. I. T., Radford, J. Q., Williams, B. A., Reside, A. E., Macdonald, S. L., Mayfield, H. J., Maron, M., Possingham, H. P., Vine, S. J., O'Connor, J. L., Massingham, E. J., Greenville, A. C., Woinarski, J. C. Z., Garnett, S. T., Lintermans, M., Scheele, B. C., Carwardine, J., Nimmo, D. G., Lindenmayer, D. B., Kooyman, R. M., Simmonds, J. S., Sonter, L. J., and Watson, J. E. M.: Impact of 2019–2020 mega-fires on Australian fauna habitat, Nat. Ecol. Evol., 4, 1321–1326, https://doi.org/10.1038/s41559-020-1251-1, 2020.