the Creative Commons Attribution 4.0 License.
the Creative Commons Attribution 4.0 License.
 | 21 Jan 2026
Predicting the amplitude and runup of the water waves induced by rotational cliff collapse, considering fragmentation
Hasnain Gardezi
Talha Khan
Xingyue Li
Taimur Mazhar Sheikh
Yu Huang
Zhiyi Chen
Cliff collapses in small lakes, and reservoirs induce powerful waves, threatening the offshore infrastructure. Unlike previous studies on waves induced by granular slide, this study experimentally and numerically investigates the waves induced by rotational cliff collapse, whereby the cliff fragments upon impact with the water surface, and determines the wave amplitude, runup, and energy transfer mechanics. Results indicate that as the water depth decreased, the impact Froude number and relative wave amplitude increased, wave velocity decreased, and splash showed greater elongation. The numerical modelling results also confirmed the experimental trends. Moreover, compared to an equivalent amount of granular mass sliding down a 30° slope, rotational cliff collapse produced 28 %–42 % higher wave amplitudes due to the acute impact that transfers energy more efficiently. Machine learning based prediction models were subsequently developed to predict the wave amplitude and runup. The prediction models performed well both in the training and testing stages, with high R2 values, and were validated via established statistical indices, sensitivity, and parametric analysis. The prediction models highlighted a cumulative 90 % contribution of impact velocity, cliff height, and the number of fragments on the wave amplitude. In comparison, runup was greatly influenced by bank slope angle, impact velocity, cliff mass, and height. The experimental results and developed prediction models can provide the basis for understanding the rotational cliff collapse-induced waves and can help with disaster mitigation and risk assessment by effectively predicting the wave amplitude and runup.
- Article
(13265 KB) - Full-text XML
- BibTeX
- EndNote


The phenomenon of cliff overturning is common along rivers and reservoirs (glacial lakes, recreational lakes). The cliffs around these lakes are weathered due to climate change and wave action (Ró and Cerkowniak, 2024; Young et al., 2021) and can no longer be supported by the parent rock. When these initially intact, weathered cliffs fall into water, they usually fragment upon impact with the water surface, and as a result, induce an impulse water wave. Upon impact, the energy of gravitational mass is transferred to the water body, resulting in a huge splash and a wave train, propagating away from the point of impact. In the reservoirs and water channels located in mountainous regions, such as glacial lakes, dams, and a river flowing through valleys, these waves do not travel a long distance before reaching obstacles, opposite shores, or other infrastructure. As the waves retain most of their energy, size, and strength, the impact can cause significant damage to the population and infrastructure located along the banks of the reservoir. Historically, extreme impulse wave heights have been observed induced by landslides in events of 1958 Lituya Bay, USA, which caused a wave height of 524 m (Boultbee et al., 2006; Franco et al., 2020; Miller, 1960), 2007 Chehalis Lake, Canada, induced a wave of 38 m (Wang et al., 2015), 2015 Taan Fjord, USA, caused a wave of 193 m (Higman et al., 2018), and 2014 Lake Askaja (Gylfadóttir et al., 2017). More recently, a volcanic activity in 2018 at Anak Krakatoa, Indonesia, triggered a tsunami reaching up to a height of 13 m, and in 2023, the Dickson Fjord ice-rock avalanche caused a wave height of 200 m (Svennevig et al., 2024).
The cases mentioned above are extreme, whereas the phenomena of sliding, toppling, and falling of cliffs in small lakes and reservoirs are quite frequent and have been captured by various people around the globe. Figure 1a–c indicates a rotational (topple) cliff collapse in Furnas Lake, Brazil, on 8 January 2022, killing 10 people (Maciel et al., 2023; Sun et al., 2024). As a result of the collapse, a huge splash and induced waves can be seen in Fig. 1c. Despite recurring events of cliff collapse along the water banks, the rotational failure of cliffs accompanied by fragmentation upon impact with the water surface remains poorly understood. Recent studies on water waves have focused on block slides, translational slides, or granular flows, where the mass moves along a predefined basal plane. Moreover, physical modeling has also been carried out to analyse the amplitude and runup of the landslides-induced water waves either by using block slide or granular slide (Heller and Spinneken, 2015, 2013; Lindstrøm, 2016; Lindstrøm et al., 2014; McFall and Fritz, 2016; Miller, 1960; Mohammed and Fritz, 2012; Montagna et al., 2011; Romano et al., 2023, 2020; Sælevik et al., 2009; Yin et al., 2015). However, the rotational collapse is different from the type of failure mentioned above. In rotational collapse, the cliff rotates along the base and falls into water, thus inducing a huge splash and fragmenting upon impact.
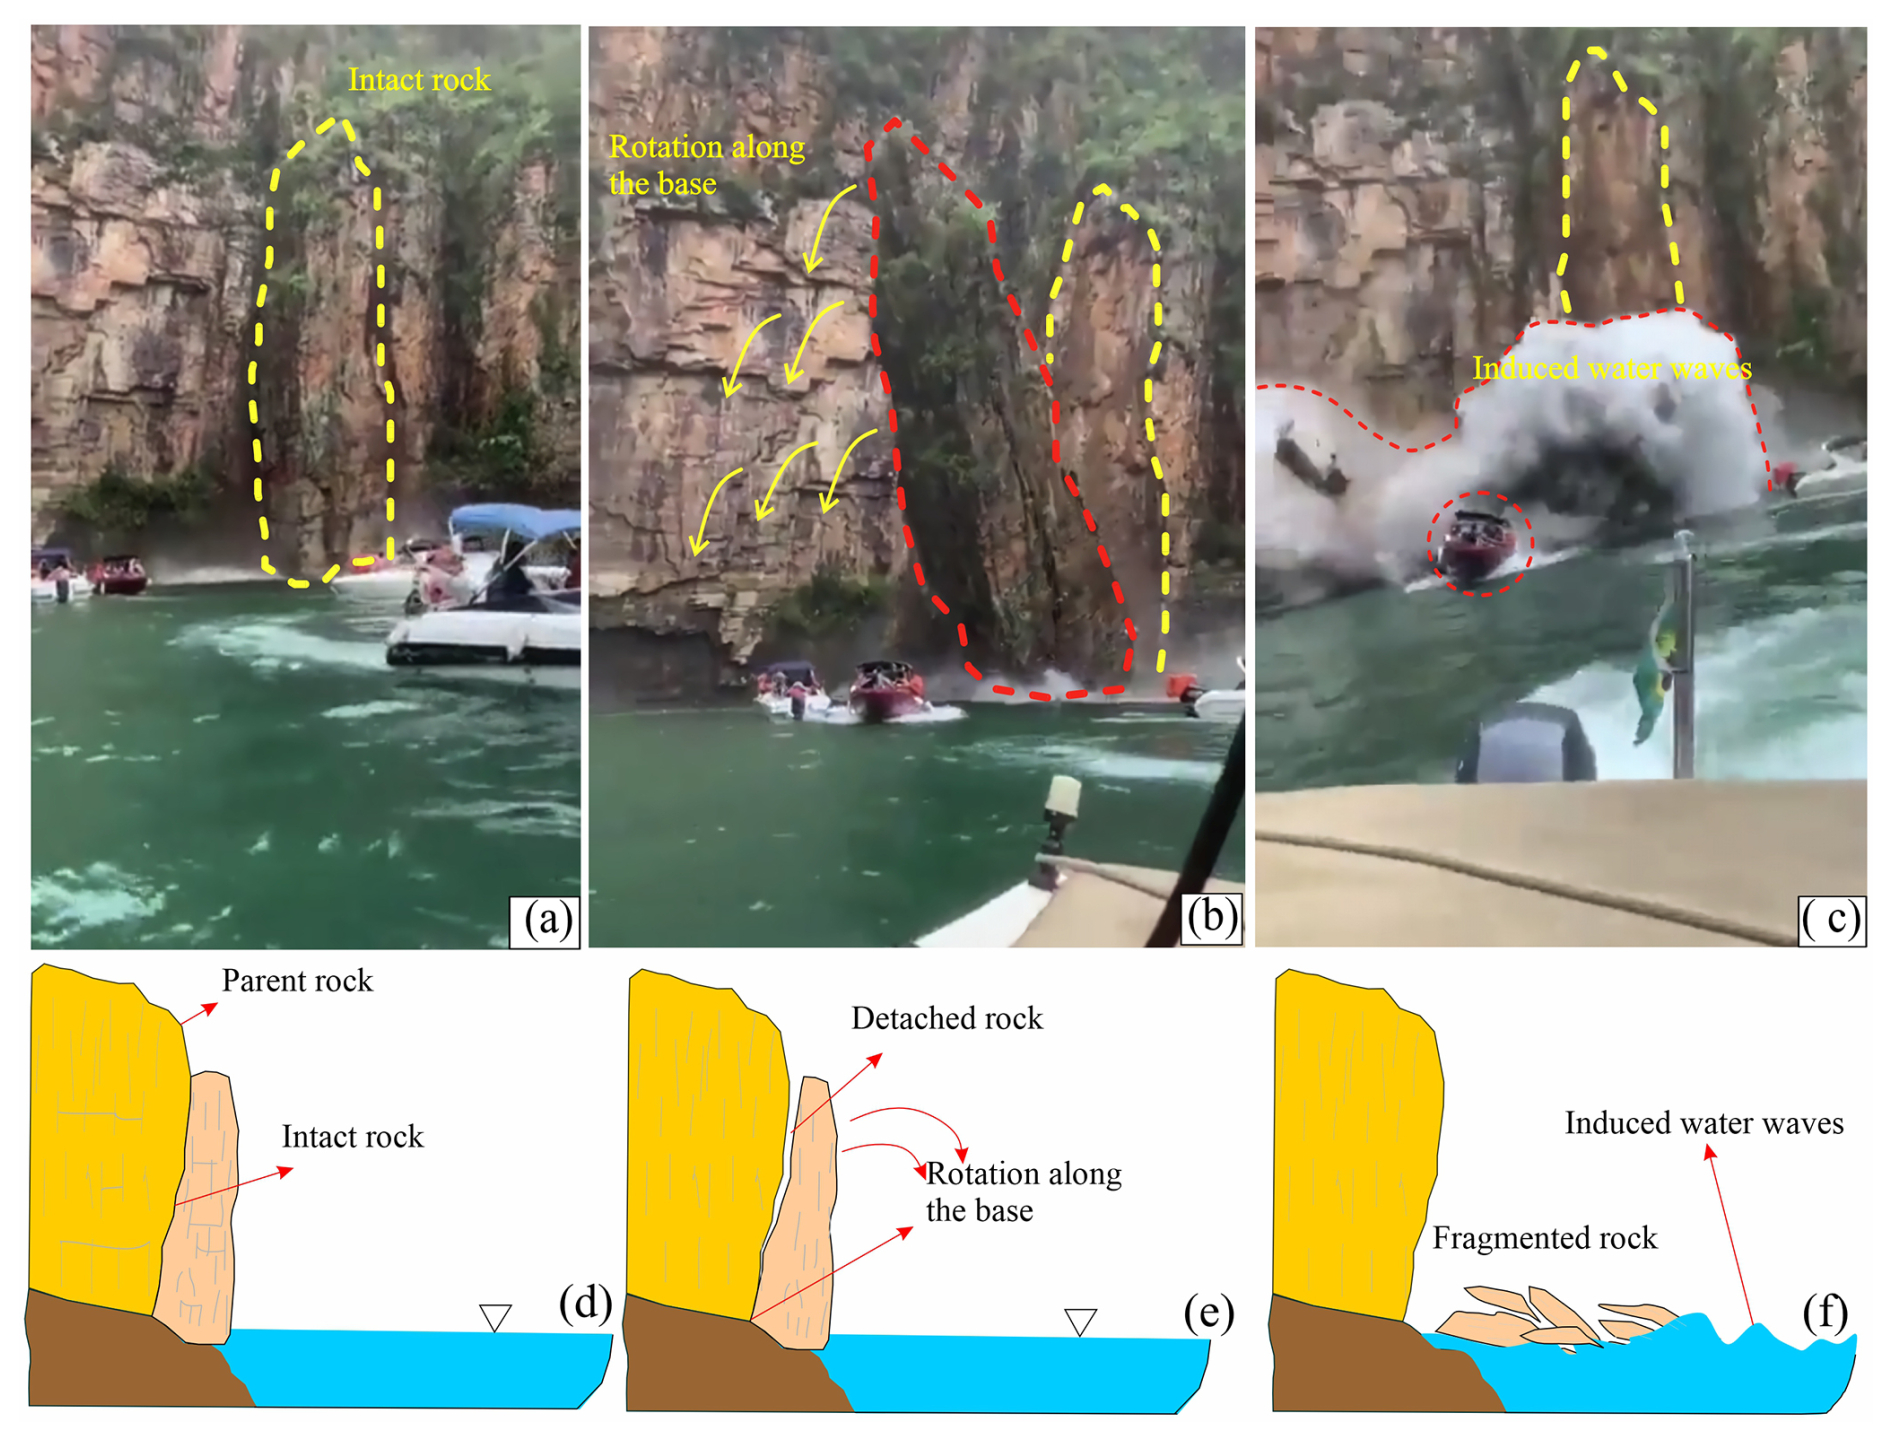
Figure 1(a–c) Waves induced by a cliff collapse in Lake Furnas, Brazil. (d–f) Sketch diagram indicating the detachment and rotational fall process.
While a few relevant studies provide partial understandings on the phenomena, such as as Liu et al. (2025) numerically analyzed the waves induced by different types of mass movements, considering different shapes using smoothed particles, similarly, Heller et al. (2021) experimentally analyzed the waves induced by iceburg calving and Yin et al. (2015) studied the potential cliff collapse of Jianchuandong rock mass in Three Gorges dam. While these studies contribute to the broader understanding of the impact induced by water waves, they do not consider the combined effect of rotational collapse and fragmentation. Moreover, the shape of the induced splash, as observed in Lake Furnas, has also not been properly explored either experimentally or numerically, as can be seen in Fig. 1a–c, the falling cliff was still intact and broke under its own weight upon impact with the water surface and induced a huge splash.
Parallel advancements in numerical modeling have enhanced our understanding of landslide induced water waves thorugh, computational fluid dynamics (CFD), Eulerian and Lagrangian methods, employing depth-averaged model, nonlinear shallow water, Navier–Stokes model, or Boussinesq equation, for both two- and three-dimensional modelling (Franci et al., 2020; Grilli et al., 2019; Guan and Shi, 2023; Heidarzadeh et al., 2020; Kim et al., 2020; Mulligan et al., 2020; Paris et al., 2021; Rauter et al., 2022; Ruffini et al., 2019). Though these methods have successfully analysed the wave generation, propagation, and wave dynamics either induced by granular slide or block slide, their direct application to rotational cliff collapse remains limited.
Furthermore, empirical and regression-based hybrid prediction models have been developed for landslide-induced water waves by considering geometric, geological, and kinematic parameters, as shown in Table 1. Das and Wiegel (1972) proposed that the sliding velocity and water depth are the main factors affecting the wave amplitude. Watts (1998) emphasised the role of slope angle, length, and mass, while Fritz et al. (2003) highlighted the role of landslide mass thickness governing the amplitude of the induced wave. While these models provide important parameteric correlations, they were developed for translational or granular slides and show limited application for complex rotational cliff collapses involving fragmentation (Dai et al., 2023; Dignan et al., 2023; Esposti Ongaro et al., 2021).
Table 1Historical overview of the prediction models for wave amplitude.
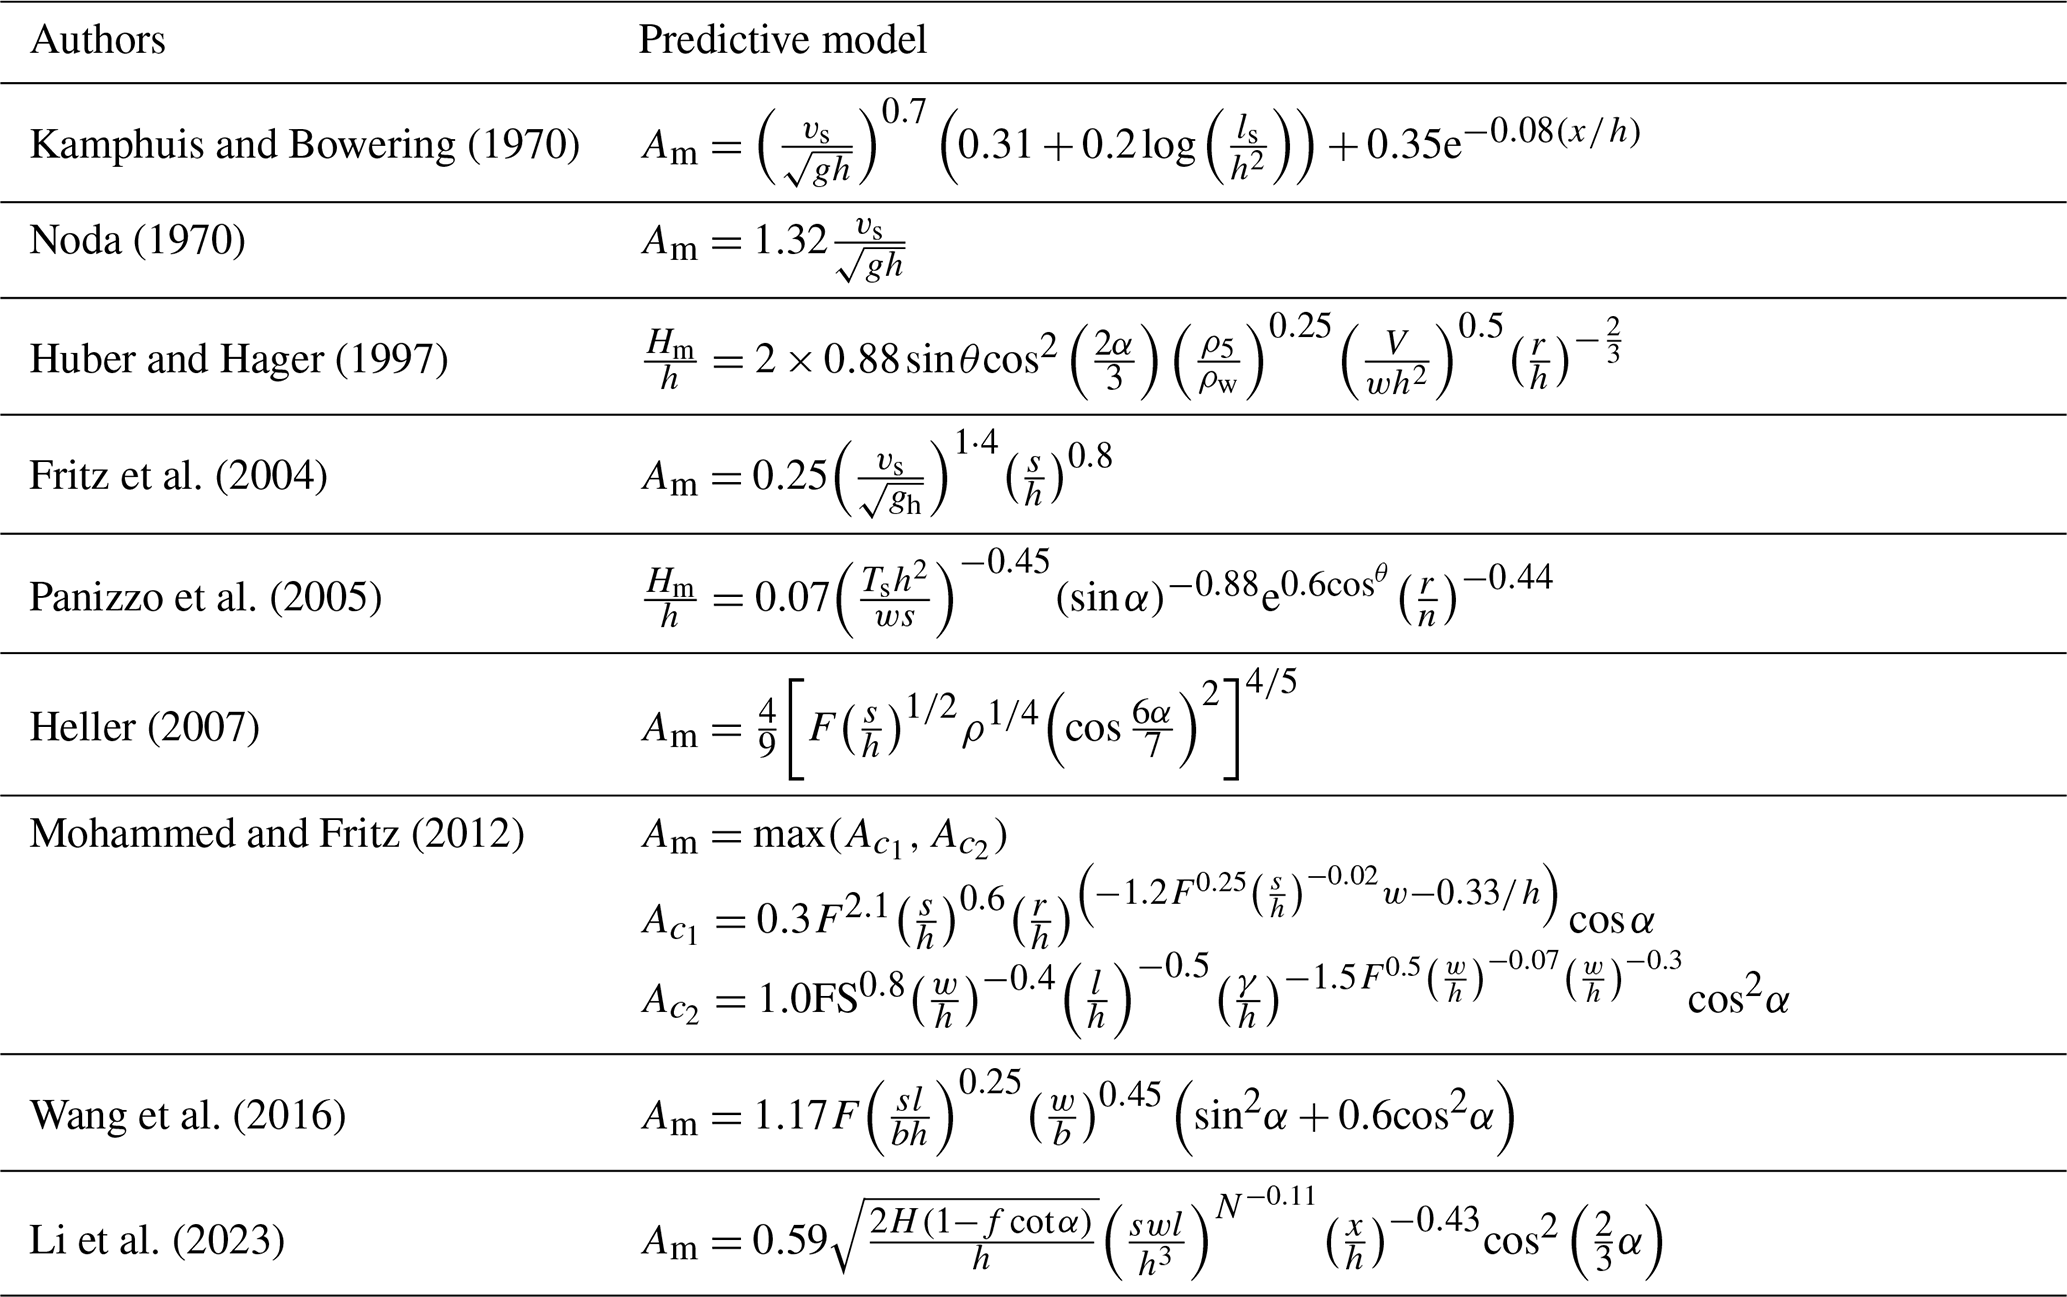
Note: l is the landslide length; s is the landslide thickness; w is the landslide width; m is the landslide mass weight; V is the landslide volume; H is the landslide height; Ts time for motion of slide, b is the river width; h is the still water depth; x(r) is the offshore distance from the bank slope; α is the slope angle; θ is the angular direction; vs is the impact velocity.
Recently, scientists have shifted to machine learning (ML) approaches for predicting wave dynamics (Bujak et al., 2023; Cesario et al., 2024; Li et al., 2024, 2023; Romano et al., 2009; Tarwidi et al., 2023; Tian et al., 2025; Wang et al., 2017; Wiguna, 2022). While these prediction models have shown improved performance over traditional regression and hybrid models, there is a need to develop an ML-based framework for predicting amplitude and runup of the waves induced by rotational cliff collapse, considering fragmentation.
To address this gap, the current study uses Genetic Programming (GP), and specifically Multi-Expression Programming (MEP), to develop a data-driven prediction model for the wave amplitude and runup. This model is similar to living organisms, which can learn, adapt, and modify their composition, size, and shape (Gardezi et al., 2024). MEP is a cutting-edge, advanced form of GP that adopts a demonstrative model for programming and uses linear chromosomes to determine optimum population size, mutation probability, and evolutionary model. Compared to other ML models, it can produce more precise results even when the problem complexity is unknown (Usama et al., 2023).
In this study, we have experimentally and numerically analyzed the hydrodynamics of the wave induced by rotational cliff collapse, considering fragmentation of the cliff upon impact, and have also developed a prediction model for wave amplitude and runup. The physical modeling was carried out by developing a scaled water flume and a platform inducing rotational motion of the cliff. A total of 162 experiments were carried out, varying seven control parameters: water depth, fall height, cliff mass, impact velocity, cliff height, runup slope angle, and number of fragments. To improve accuracy and consistency, each parametric combination was averaged from two experimental values; hence, a total of 81 experimental results were obtained. The parameters were selected to comprehensively elaborate on the distinct phases of rotational cliff collapse and induced waves. Water depth and runup slope angle provide the basis for wave propagation and runup. Whereas, the cliff collapse dynamics are explained by cliff mass (which governs the energy input), height of the cliff (defines the initial potential energy), and fall height (determines the transformation of potential to kinetic energy). Cliff impact velocity determines the amount of kinetic energy imparted to the water body at the time of impact, which is important for wave generation. Finally, the number of fragments is selected to demonstrate the effect of fragments of cliff upon impact with the water surface on wave amplitude and runup height. Together, these parameters define the energy budget from the state of rest to its release and then transfer to the water body to its final stage as amplitude and runup. Since the wave velocity was not directly measured during the experiments, it was measured using a 2D numerical model developed using Ansys-Fluent. Furthermore, the numerical modeling results for wave amplitude and runup were cross-validated with their experimental counterparts.
Finally, based on experimental results, prediction modeling for the amplitude and runup of water waves was carried out using multi-expression programming (MEP), and a novel prediction model was developed for the water waves induced by rotational cliff collapse, considering fragmentation of the cliff upon impact with the water surface.
2.1 Experimental setup
The physical modeling for wave amplitude and runup induced by rotational cliff collapse was carried out in a three-dimensional water flume made up of plexiglass, as shown in Figs. 2 and 3. One end of the flume is vertical at 90°, whereas the other end is inclined and fixed at 30° (Fig. 3a and b). The flume is 0.55 m high, 0.5 m wide, and 1.4 m long along the base and 2.35 m long at the top. Furthermore, to measure the runup of induced water waves at various slope angles, two sliding rails were installed towards the inclined end at 45 and 60°. So, upon insertion of the gate at 45 and 60°, the top length of the flume was further reduced according to the Pythagoras theorem. To induce the rotational cliff collapse, a 0.55 m wide and 0.6 m high movable platform was designed, which can move in the vertical direction and can also rotate about its axis. The rotational motion was induced by pulling the hinge; the release ensured a pure rotational motion, which was visually verified by video analysis. The flume was marked with a vertical scale to measure the water depth. The wave amplitude was measured using capacitance-type wave gauges with an accuracy of ±0.5 mm, placed along the centerline at specified intervals. The runup height was measured using a graduated paper attached to the inclined surface. The entire process was recorded using a digital camera (240 fps, 720p resolution) placed perpendicular to the experimental flume; the velocity of the falling cliff was verified by frame-by-frame video analysis using Particle Image Velocitymeter (PIV).
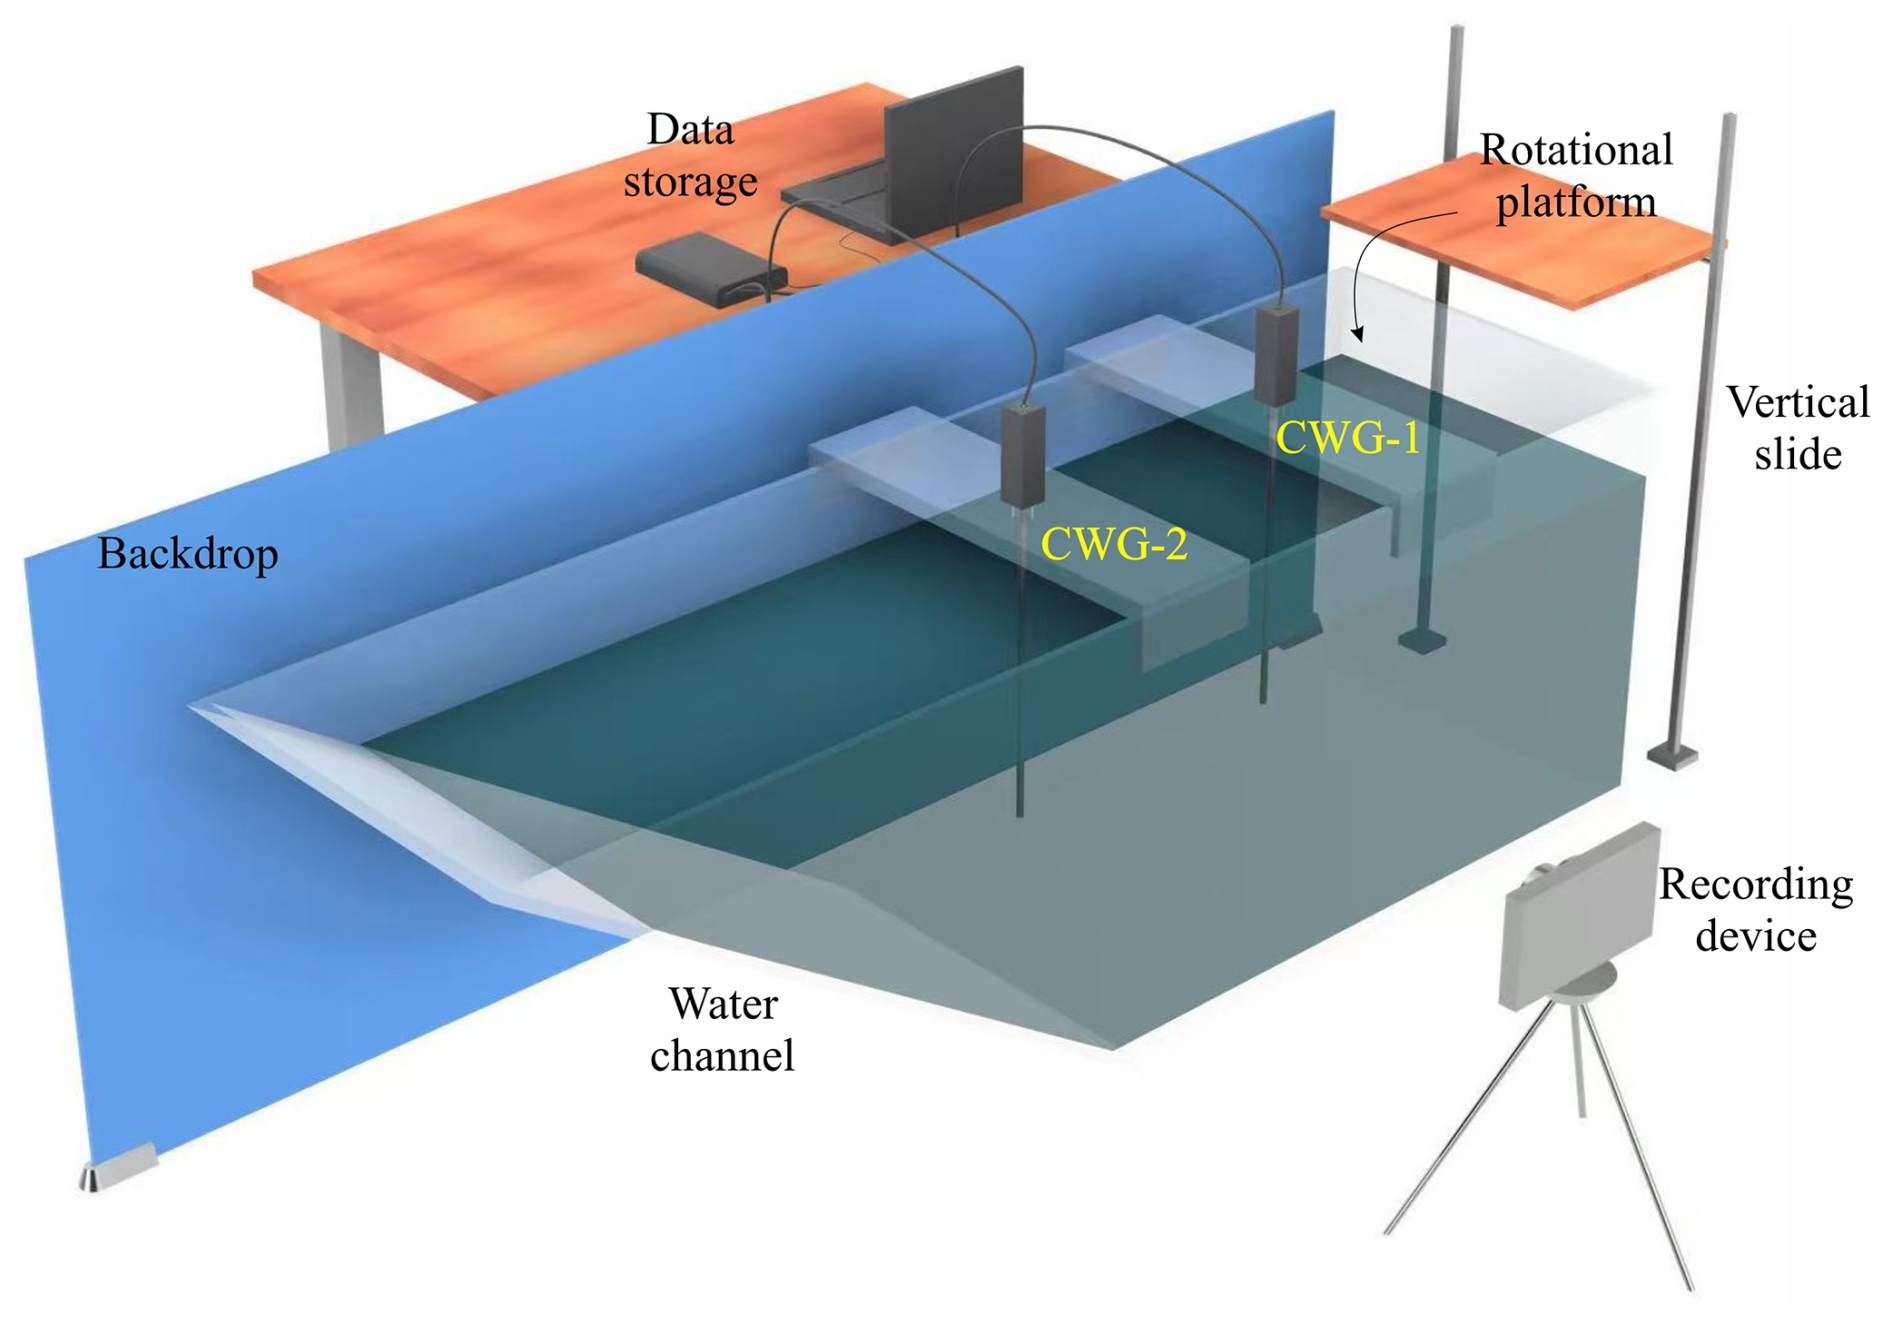
Figure 2Illustration of experimental setup including wave gauges, rotational platform, recording, and data storage devices.
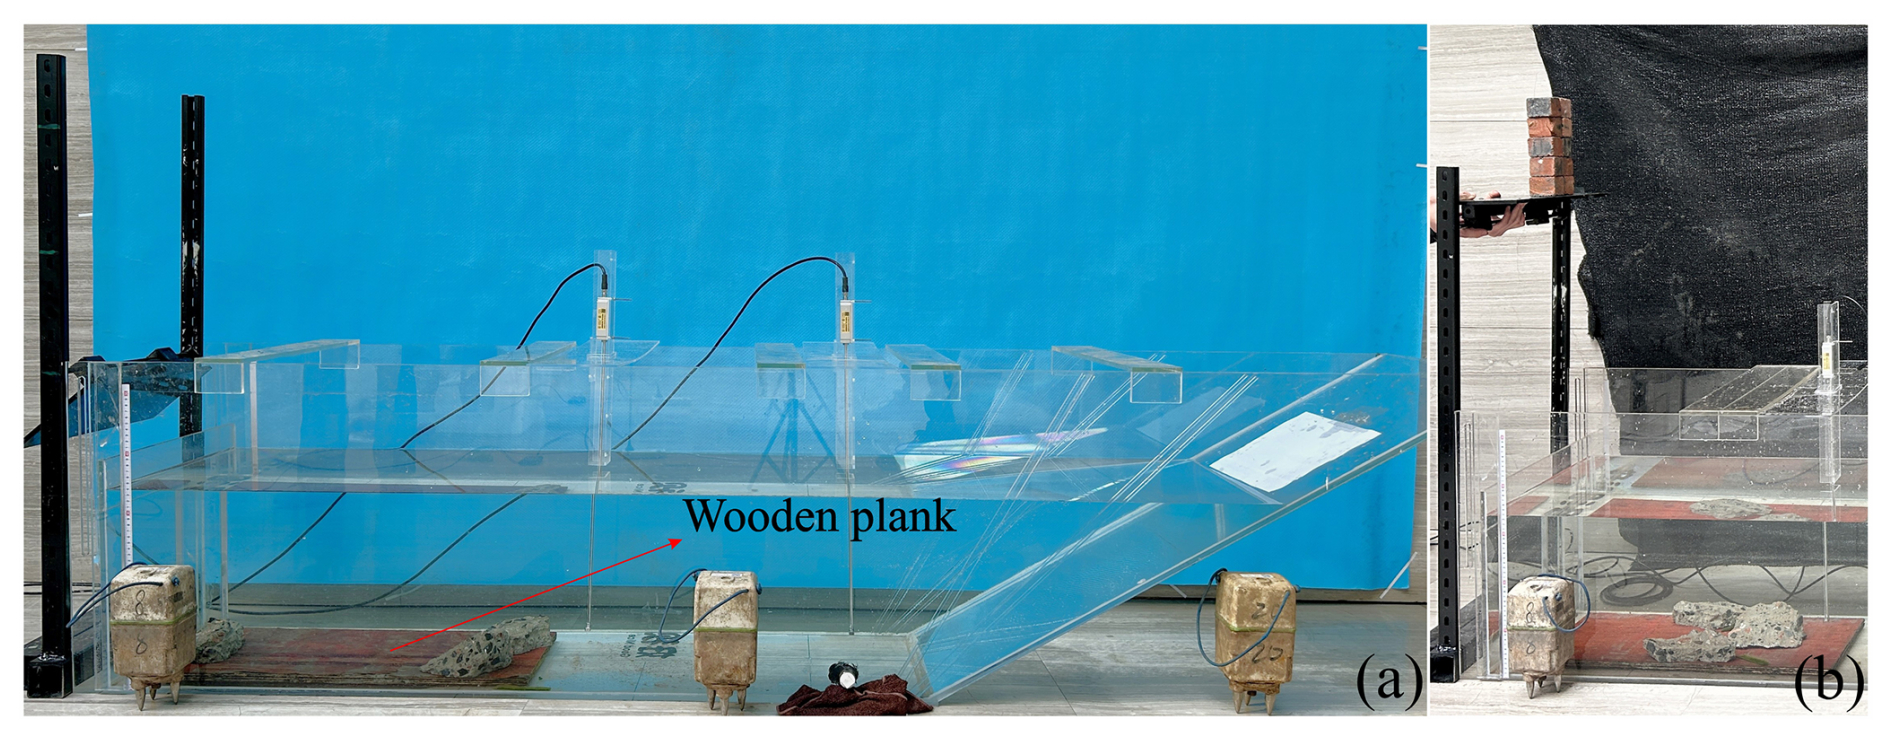
Figure 3Photographs of the setup, (a) Experimental flume, (b) platform for inducing rotational cliff collapse.
2.2 Test preparation and materials
Physical experiments were carried out by varying the water depth, fall height, number of fragments, bank slope angle, mass of falling rock, cliff height, and impact velocity. The tests were carried out for three water depths, i.e., 0.34, 0.27, and 0.20 m, and three fall heights, i.e., 0.64, 0.44, and 0.245 m from the surface of the water. Furthermore, the number of blocks was also varied, i.e., 6, 10, and 12 blocks having combined weights of 1.445, 2.29, and 2.82 kg, respectively. At the same time, the impact velocity changed by changing the fall height. The wave runup was measured by varying the bank slope angle, i.e., 30, 45, and 60°.
To replicate the field density of the rocks, red gutka bricks having a density of around 2000 kg m−3 were used. A singular block had a dimension of . The mass volume and dimension of all the blocks were unchanged to ensure consistency in the experiments. A combination of 6, 10, and 12 blocks of red gutka bricks was used to form a cliff and measure the wave amplitude and runup of induced waves. The blocks were joined together with the help of cement paste having a water–cement ratio 0.8 and cured for 2 h in front of an electric heater at 150 °C. To ensure the weak bond strength, several trials for bond strength were carried out after a curing period of 2 h, and it was found to be in the range of 0.42–0.5 MPa. In contrast, the inertial stresses at the time of impact were several times higher, such that they caused the fragmentation of the cliff. This condition was purposely designed to imitate naturally fractured cliff materials, confirming that the structure fragmented primarily along the joints upon impact with the water surface, consistent with field observations of rotational cliff collapses. The bonded blocks were placed on the rotational platform at specific heights, i.e., 0.64, 0.44, and 0.245 m from the water level, and were allowed to rotate under their own weight by pulling the hinge, such that the placed block falls in the water following rotation motion along its base Fig. 3b. To avoid the slippage of blocks and to ensure that it had sufficient frictional resistance needed for pure rotational motion of the simulated cliff, finely-grounded bricks of the same cliff material were pasted on the rotational platform, thereby preventing translational motion or vertical free fall into the water.
Furthermore, to reduce the impact of falling blocks on the base of the flume, a wooden plank weighing 2.69 kg and dimensions was placed at the point of impact inside the flume. Due to its large surface area and lighter density, it tends to float in the flume, so two blocks of concrete weighing 3.58 kg were placed on it, Fig. 3a. Since the fall height was small, no considerable local breakage was observed in the blocks, and the brief water contact minimised the water absorption effect.
The induced wave amplitude was measured by placing the wave measuring gauges at a distance of 0.65 and 0.135 m from the vertical face; the gauges were wired and connected to the laptop. At the same time, the runup was measured manually with the help of a scale by pasting a scaled paper on the slope. Furthermore, the experiments were also recorded with the help of a high-resolution camera for verification purposes.
2.3 Numerical Modeling
Simulating multi-phase flows is challenging due to the constant deformation of the liquid-gas interface. Various numerical methods have been developed to model these flows, each offering unique advantages depending on the specific flow regime and characteristics of interest. In this study, the Volume of Fluid (VOF) method is utilized for its effectiveness in handling significant interface distortions and topological changes. The VOF method offers superior mass conservation, which is critical in high velocity impact conditions where liquid fragmentation and wave generation are significant (Backbill et al., 1992; Hirt and Nichols, 1981). Alternative numerical schemes, such as the Front Tracking approach, are generally limited in handling complex topological changes (Tryggvason et al., 2001; Liu and Liu, 2010; Monaghan, 1994; Yang and Kong, 2018). Another approach is the Level Set method, but it suffers from mass conservation and convergence issues. The Lattice Boltzmann Method (LBM) is also common; however, its applicability to high velocity impact is rather limited (Aidun and Clausen, 2010). Given these trade-offs, the Volume of Fluid (VOF) method finds an optimal balance of computational efficiency, interface tracking capability, and proven reliability for modeling multiphase flow in the moderate-to-high velocity range relevant to this study. Therefore, a two-dimensional numerical model of a cliff, having the same properties as the experimental cliff mentioned previously, hitting the water surface is developed using the VOF method to accurately capture the liquid-gas interface.
In this approach, a volume fraction (α), ranging between 0 and 1, is applied across the entire computational domain. A value of α=1 indicates a control volume filled with liquid, while α=0 denotes a control volume filled with gas. The interface is represented by values where . In the Volume of Fluid (VOF) method, the momentum equation is solved across the entire computational domain, with the resulting velocity field shared by all phases. To account for surface tension effects, a continuum surface force (CSF) model is employed (Backbill et al., 1992). The normal vector n and interface mean curvature k are as follows, respectively:
and
The interface is maintained as sharp through the use of geometric reconstruction to ensure its clarity. The volume fraction (α) is discretised with the geo-reconstruct scheme, while the convective terms in the momentum equation are handled using a second-order upwind method. The PISO (Pressure-Implicit with Splitting of Operators) algorithm was employed for pressure-velocity coupling, which is well-suited for transient flows. Temporal discretisation employs a second-order implicit scheme, and spatial gradients are calculated using the Least Squares Cell-Based method.
The boundary conditions were defined as follows: the bottom boundary was modeled as a no-slip wall, while the top boundary was set as a pressure outlet at atmospheric conditions, and the lateral sides were modeled as stationary walls to confine the liquid film within the domain. For accurate simulation of the rotational motion of the cliff through the air-water interface in a multi-phase flow environment, dynamic meshing was implemented within the ANSYS Fluent framework. This approach facilitated the adaptation of the computational mesh to accommodate the cliff's movement while maintaining the integrity of the liquid-gas interface captured by the Volume of Fluid (VOF) method. Dynamic meshing was critical for modeling the complex interactions between the falling cliff and the surrounding air and water phases, allowing the mesh to deform and adapt in response to the cliff's trajectory. In ANSYS Fluent, the dynamic meshing strategy employed a combination of mesh deformation and local remeshing techniques to handle the cliff's motion. Mesh deformation was applied to adjust the existing mesh nodes smoothly as the cliff moved, preserving mesh quality in regions experiencing moderate displacement. For areas near the cliff where significant deformation could lead to poor mesh quality, local remeshing was utilized to regenerate mesh elements for better numerical stability and accuracy. The smoothing and remeshing algorithms were configured to maintain high mesh quality, with a skewness threshold set to prevent excessive element distortion.
The rotational cliff collapse was simulated using an in-house user-defined function (UDF). This UDF interfaced with ANSYS Fluent to dynamically update the rock's position and velocity. To enhance computational efficiency, a dynamic mesh zone was defined around the cliff, with a finer mesh resolution near its surface to capture the sharp gradients in the flow field and interface dynamics. The mesh was gradually coarsened away from the rock to reduce computational cost while maintaining sufficient resolution in the far-field regions. The dynamic meshing process was synchronised with the transient flow solver, using a time step size determined through a time step independence study to balance accuracy and computational efficiency. It is also worth mentioning that the numerical simulations were performed considering the rock as a unified mass. This approach describes the slight differences between the experimental and numerical results, which are nonetheless within the acceptable range.
2.4 Multi-expression programming
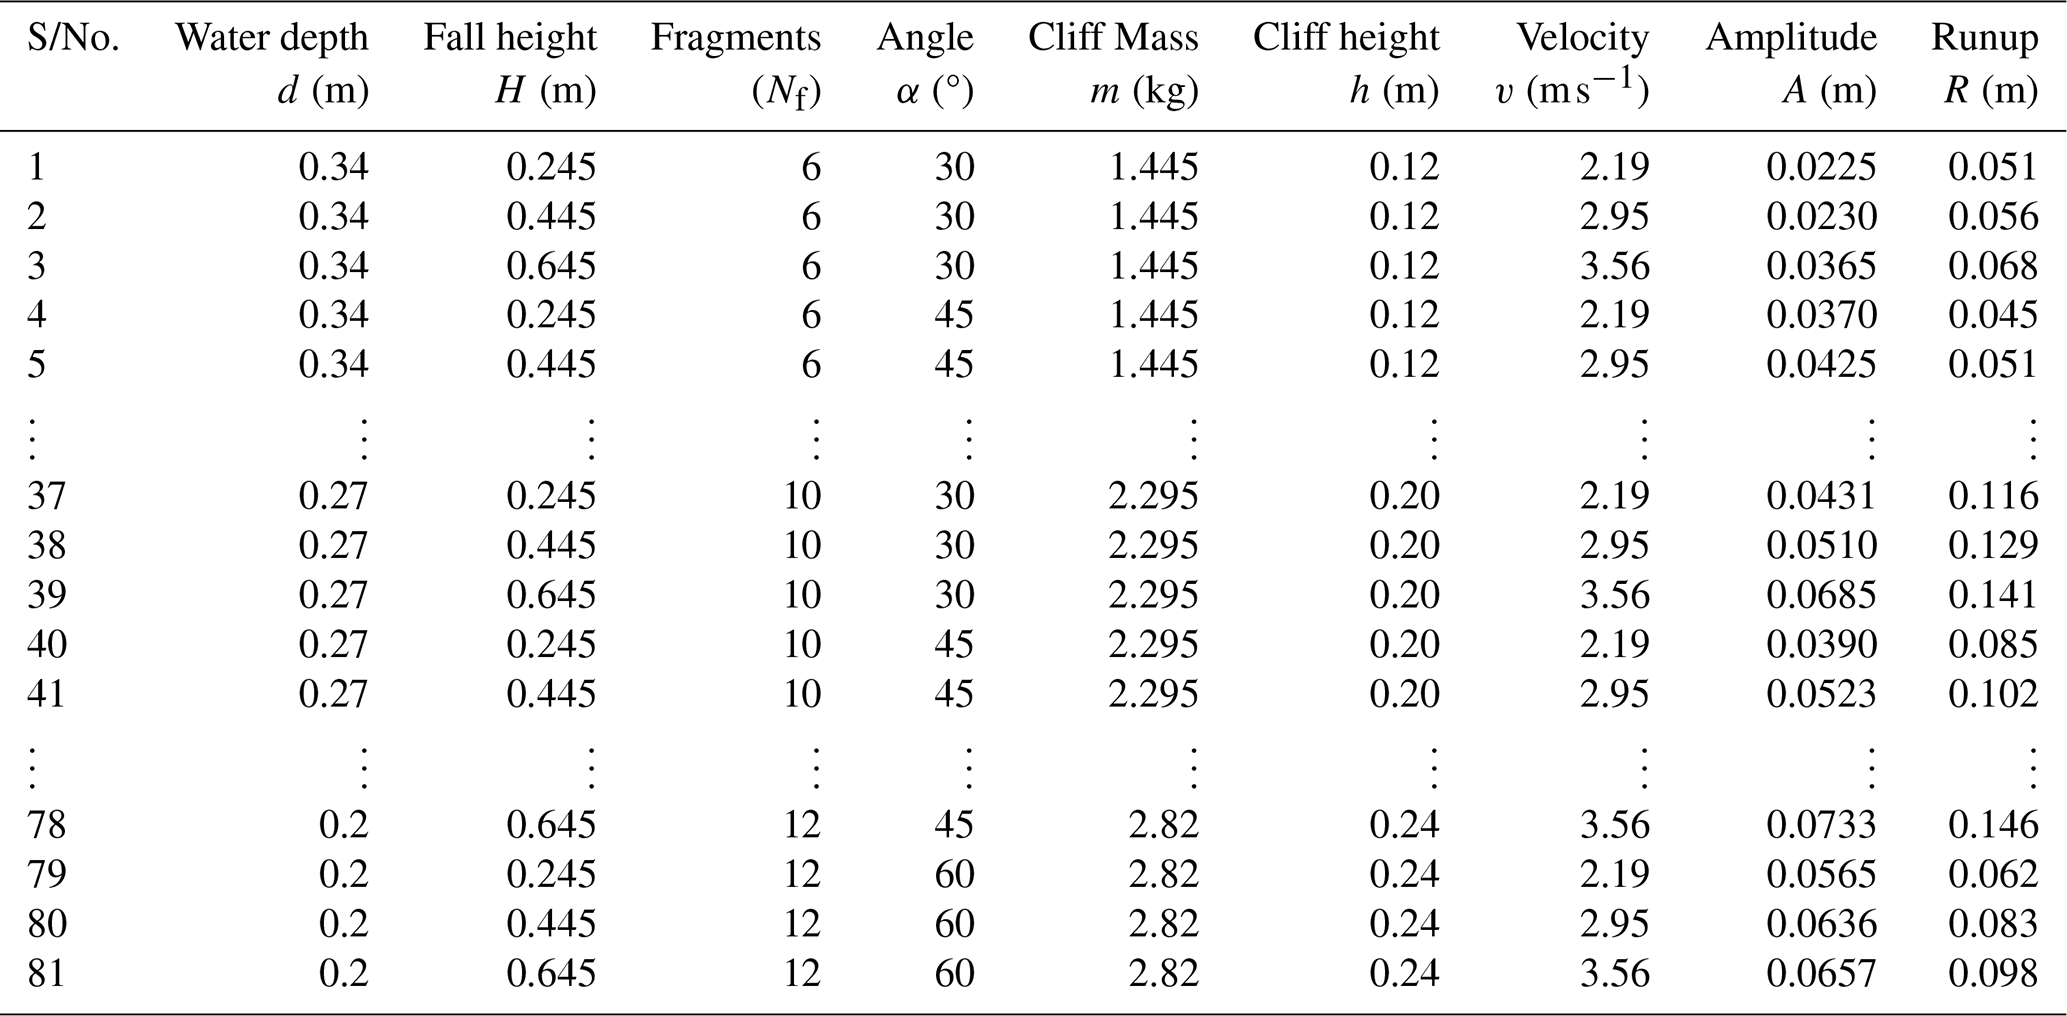
The MEP model was developed for predicting wave amplitude and runup using experimental data, as shown in Table 2. A dataset of 81 experimental results was used as an input to a machine learning model. Furthermore, the data was divided into ratios for training and validation purposes before developing the model. The model starts working by generating a random chromosome population, and it continues to generate the chromosomes until a terminal condition is achieved, generating an optimal expression from the data having input and output pairs over a certain number of generations, as shown in Fig. 4.
Table 2Experimental dataset used for training and validation of the machine learning model.
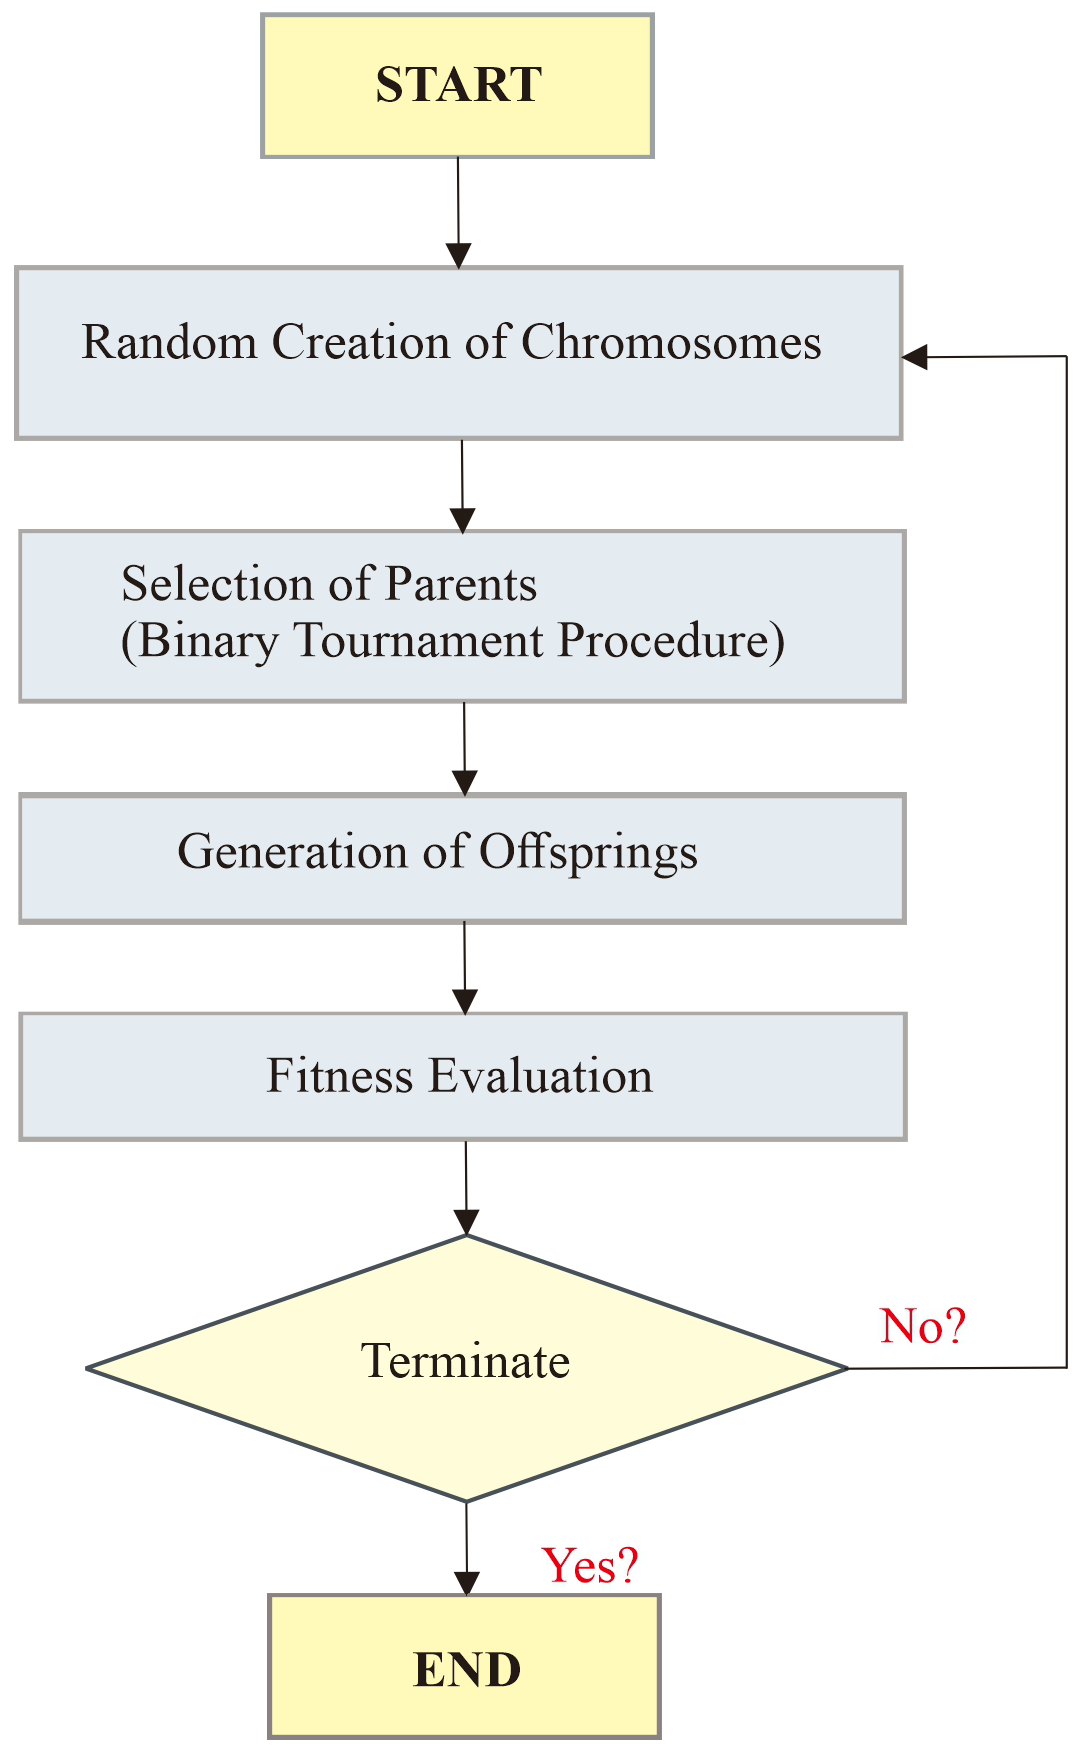
Based on a binary tournament process, parents are selected and then undergo a recombination process through a consistent crossover probability. This recombination produces two more offspring. These offspring go through mutation, and if these offspring perform better than the least fitting offspring in the current population, then the better offspring replace them. The illustrations used by MEP are similar to the ones used by C++ and Pascal compilers. The MEP chromosomes are comprised of numerous genes combined using various mathematical operators such as addition (+), subtraction (−), multiplication (×), and division (), and these genes create expression trees (ETs) (Cheng et al., 2020). Moreover, there are several hyperparameters such as code length, sub-population size and number, crossover probability, and other sets of various functions involved in in generation of MEP code, and they also govern the overall performance of the code. Among these parameters, the size of the population tells us about the number of programs being generated, whereas an increase or decrease in subpopulation size directly affects the complexity and computation time of the model. Moreover, the length of the developed model is controlled by varying the code length parameter. During model development, prerequisite tuning procedures were applied to optimize these hyperparameters. This careful selection minimized the risk of premature convergence or underfitting while ensuring computational efficiency.
3.1 Experimental results
The experimental results of the wave amplitude and runup, induced by rotational cliff collapse, reveal complex hydrodynamic processes. As shown in Fig. 5, the failure is initiated by the rotational fall of the cliff, leading to a significant amount of impact energy upon hitting the water surface. The impact induced a huge splash, which is evident from Fig. 5b, e and h. It was observed that the shape of the splash also varies with water depth for all the cases; higher water depths resulted in a mushroom-shaped splash, i.e., broader on the top, as the momentum dissipates before interacting with the bottom surface, resulting in a vertical jet and the formation of a mushroom-shaped splash. as can be seen in Fig. 5h. The observed phenomena perfectly align with the basic concepts of fluid dynamics, which state that greater depths absorb more impact energy compared to shallow waters. Shallow waters produced a vertically elongated splash as can be seen in Fig. 5b and e. It can be observed that as the depth decreases, the splash becomes more elongated, as shallower depths intensify the upward momentum transfer, thus resulting in a more elongated shape (Kubota and Mochizuki, 2009).
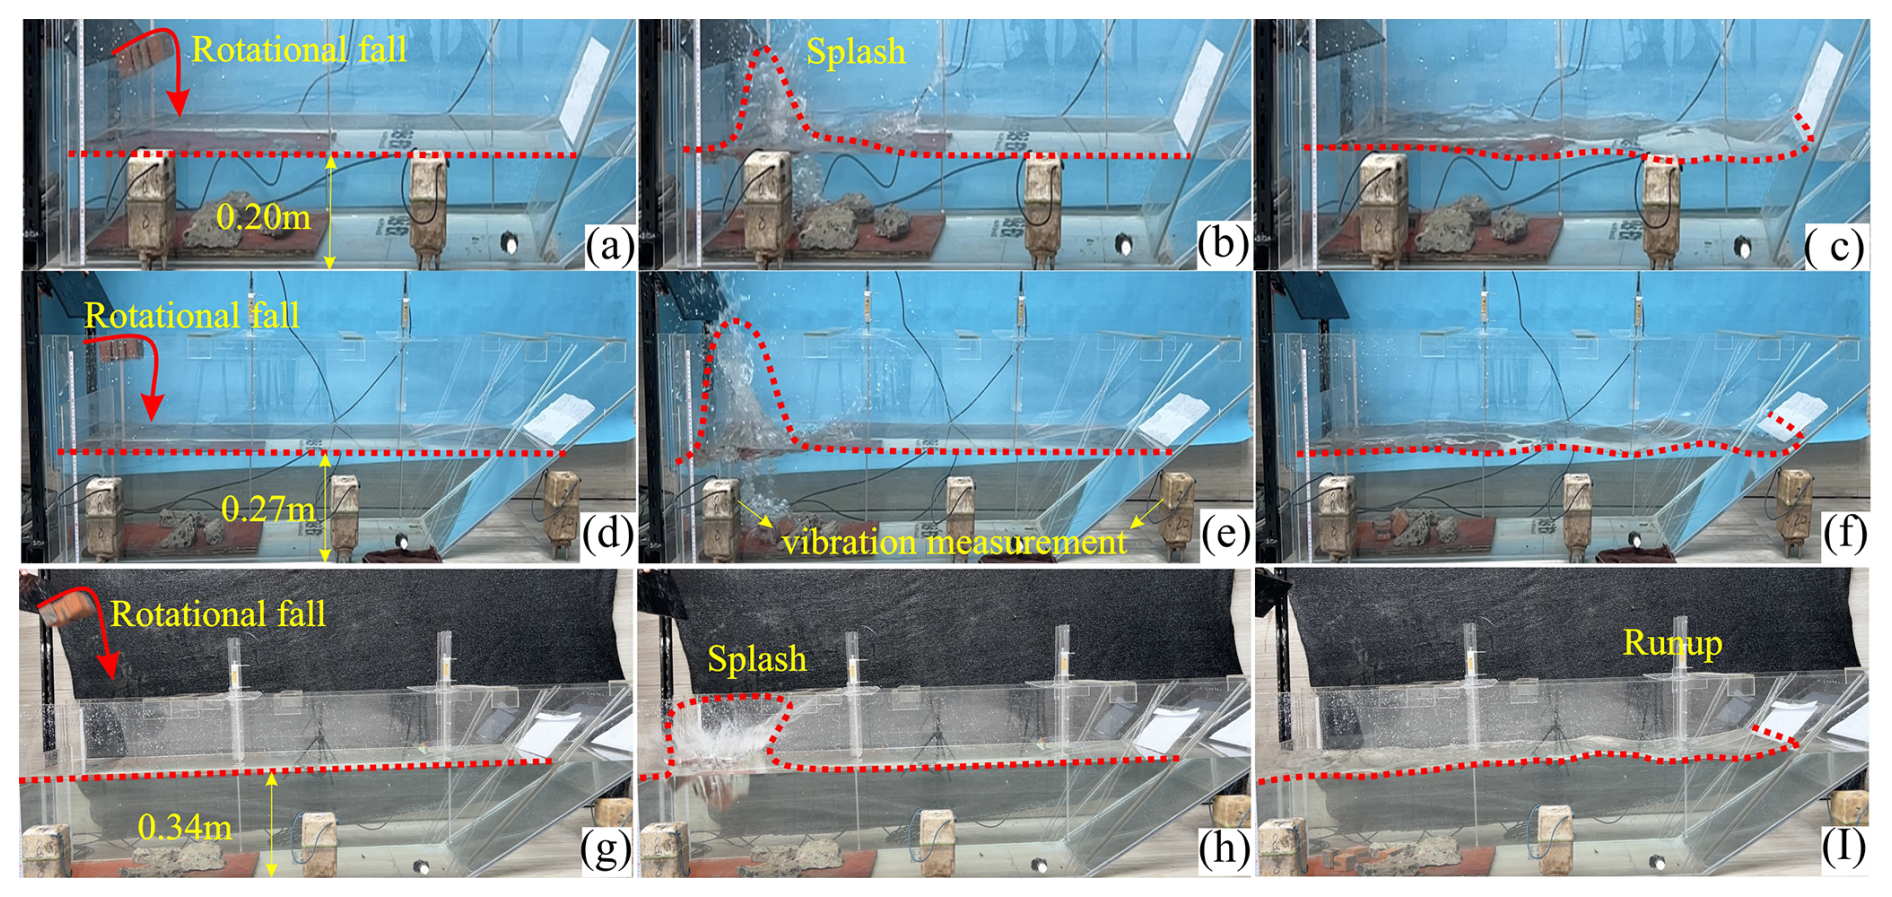
Figure 5A pictorial display of the experimental setup for various water depths, i.e., 0.20, 0.27, and 0.34 m. (a, d, g) indicate rotational fall of the cliff, (b, e, h) showing splash as a result of cliff impact, (c, f, i) formation and propagation of induced wave and runup at various slope angles.
3.1.1 Relation between energy and amplitude
Further, the relationship between impact energy and wave response was also investigated by establishing a dimensionless impact energy parameter (). Where K.E is the kinetic energy of the cliff, ρ is the density, and h is the water depth. The negative quadratic coefficient in Fig. 6a indicates a nonlinear response, such that at the start, the wave amplitude increases as the impact energy increases, but later it decreases, due to reduced energy transfer at higher impact values. At higher impact values, the released energy was not fully used in the wave formation and propagation; instead, a part of the energy was dissipated in the formation of splash, and in the formation of air pockets and their subsequent collapse. Moreover, the coefficient of determination was found to be 77 % indicating a good data fit.
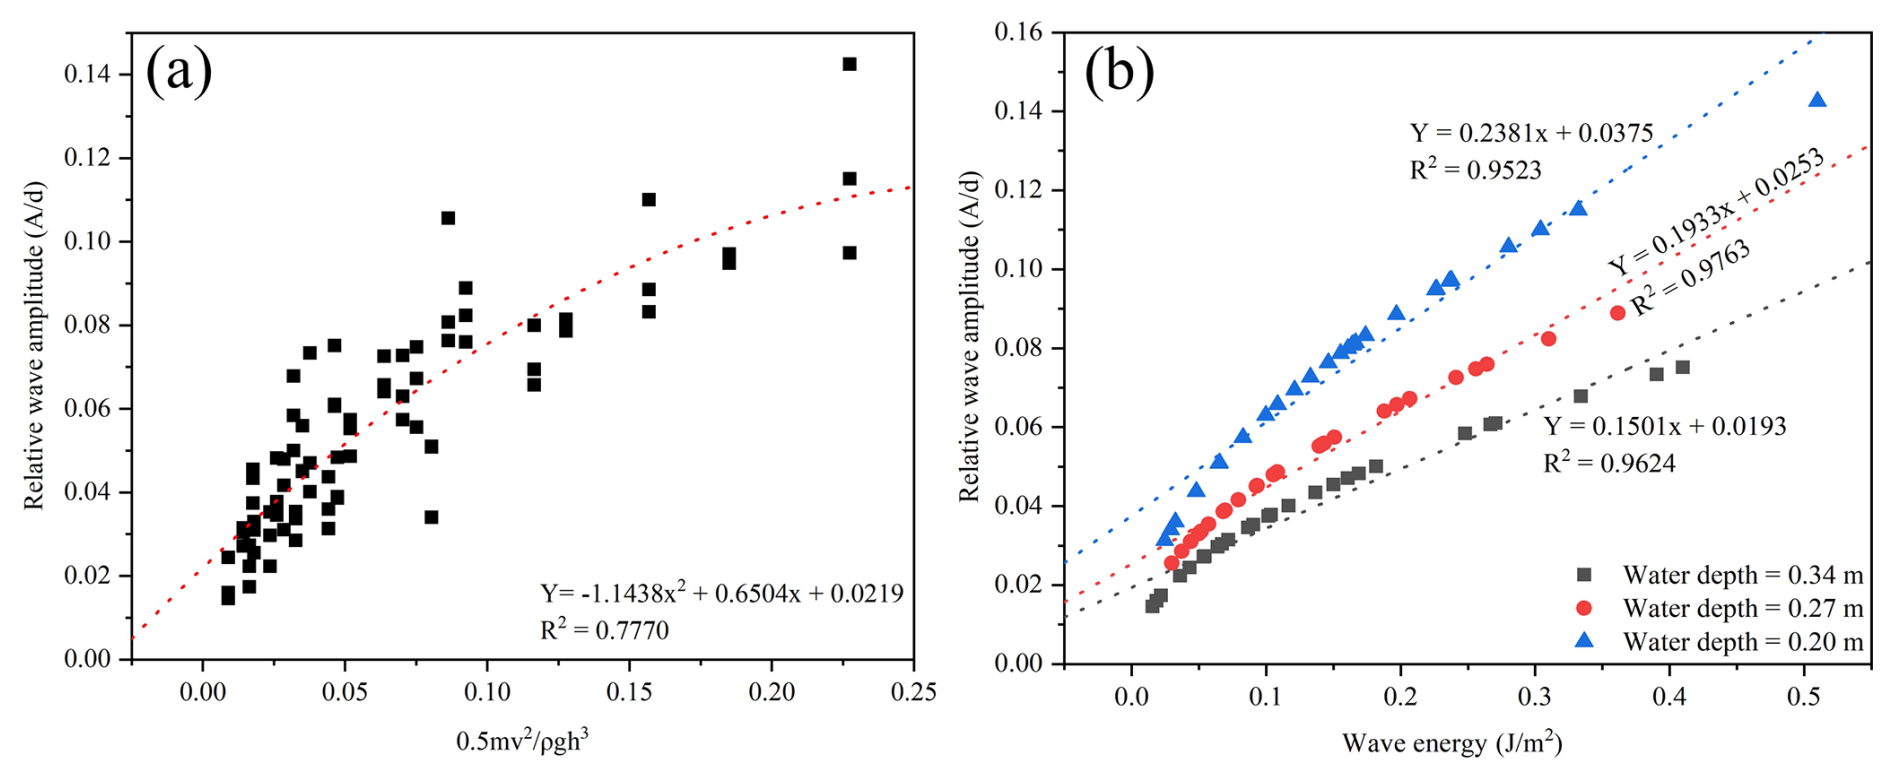
Figure 6(a) Dimensionless impact energy () vs. relative wave amplitude, indicating a nonlinear trend. (b) Wave energy vs. relative wave amplitude, indicating higher wave amplifications in shallow waters.
The results for the relative wave amplitude and wave energy were analyzed for three water depths, i.e., 0.34, 0.27, and 0.20 m., as shown in Fig. 6b. The results indicate a strong correlation for all three cases, with coefficients of determination around 0.96. The results indicate a direct relation between wave height and energy, whereas the decreasing slope values with the increasing water depth suggest that for deeper water the wave amplitude decreases at a slower rate with increasing wave energy, thus highlighting the impact of water depth on the wave dynamics, such that shallower water allows more amplification of waves for the same energy level, and this is due to the increased non-linear interactions and enhanced energy concentrations in shallower depths (Myrhaug and Lader, 2019).
The results for the relative wave height and runup for all three water depths and three runup slope angles are shown in Fig. 7. The relationship indicates a strong correlation between wave amplitude and runup for all three slope angles. The decreasing line-slope values with increasing runup slope angle indicate that wave runup increases at a slower rate for sharp slope angles compared to mild slopes. The trend highlights the effect of slope angle on the runup. The result also indicates that the mild slope angles help wave runup amplification, as they dissipate a very small amount of energy, whereas steeper angles result in lower runup heights because of higher energy losses (Wu et al., 2018).
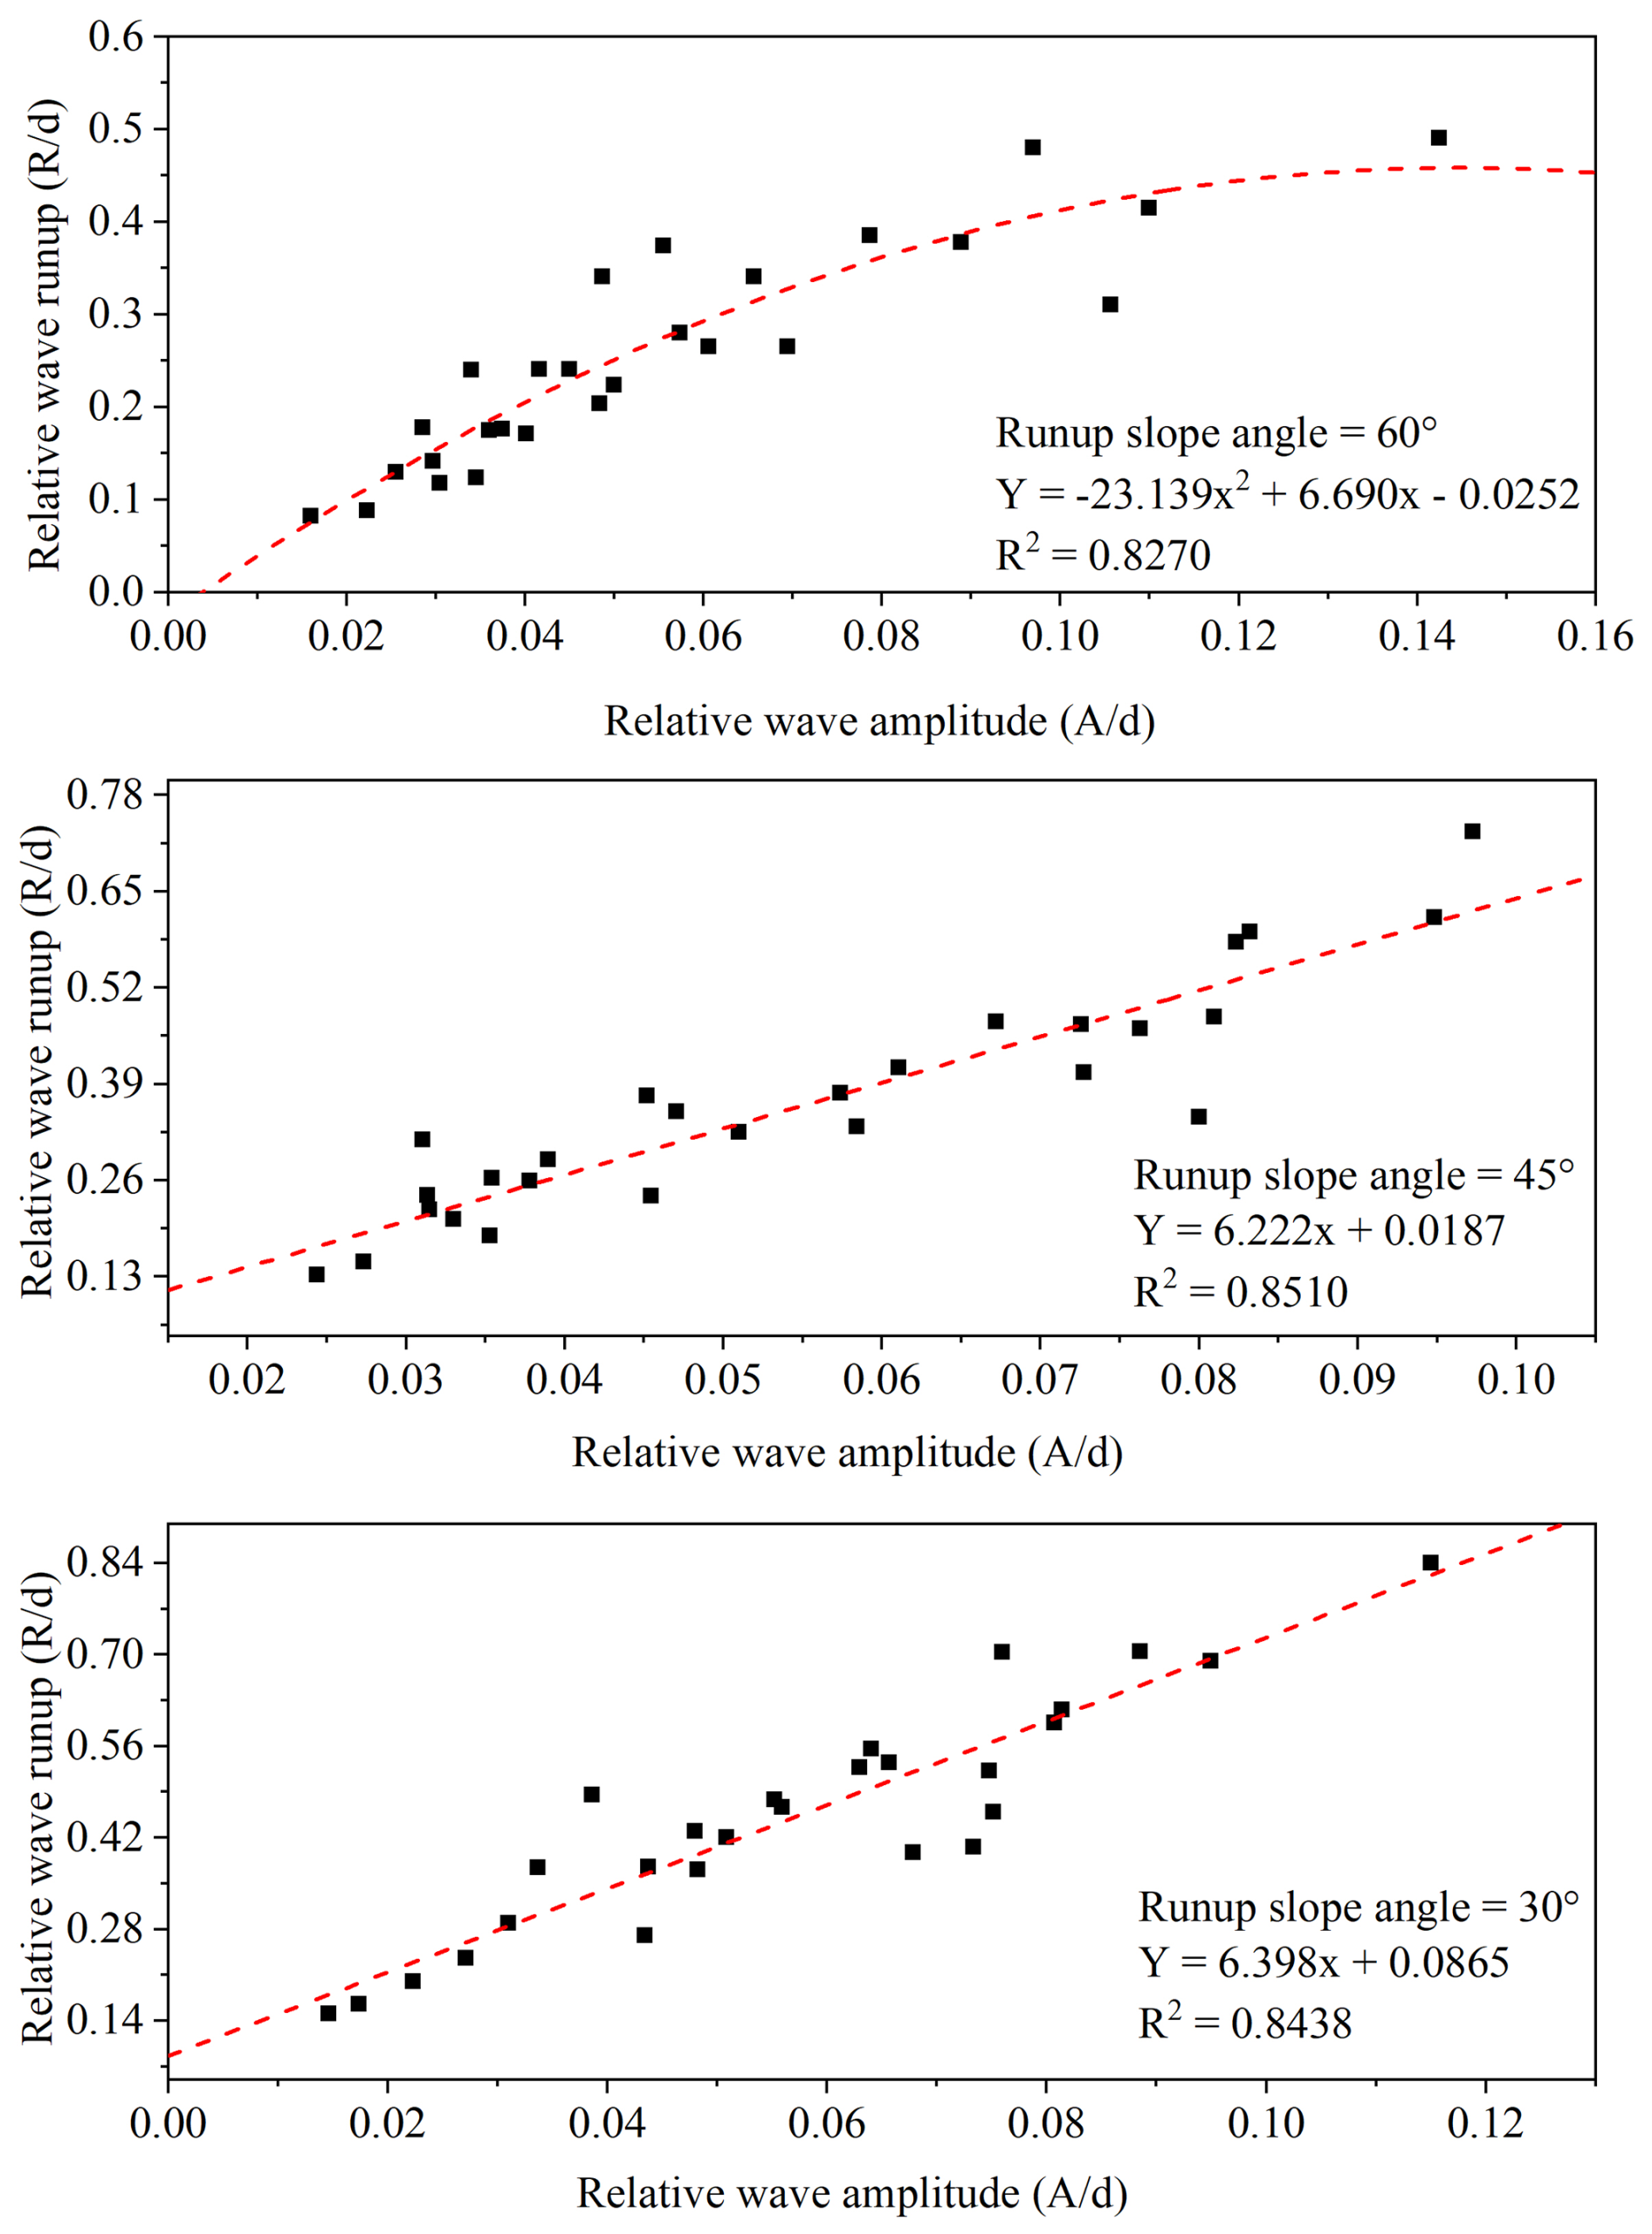
Figure 7Relative wave amplitude vs. relative wave runup at various slope angles and water depth.
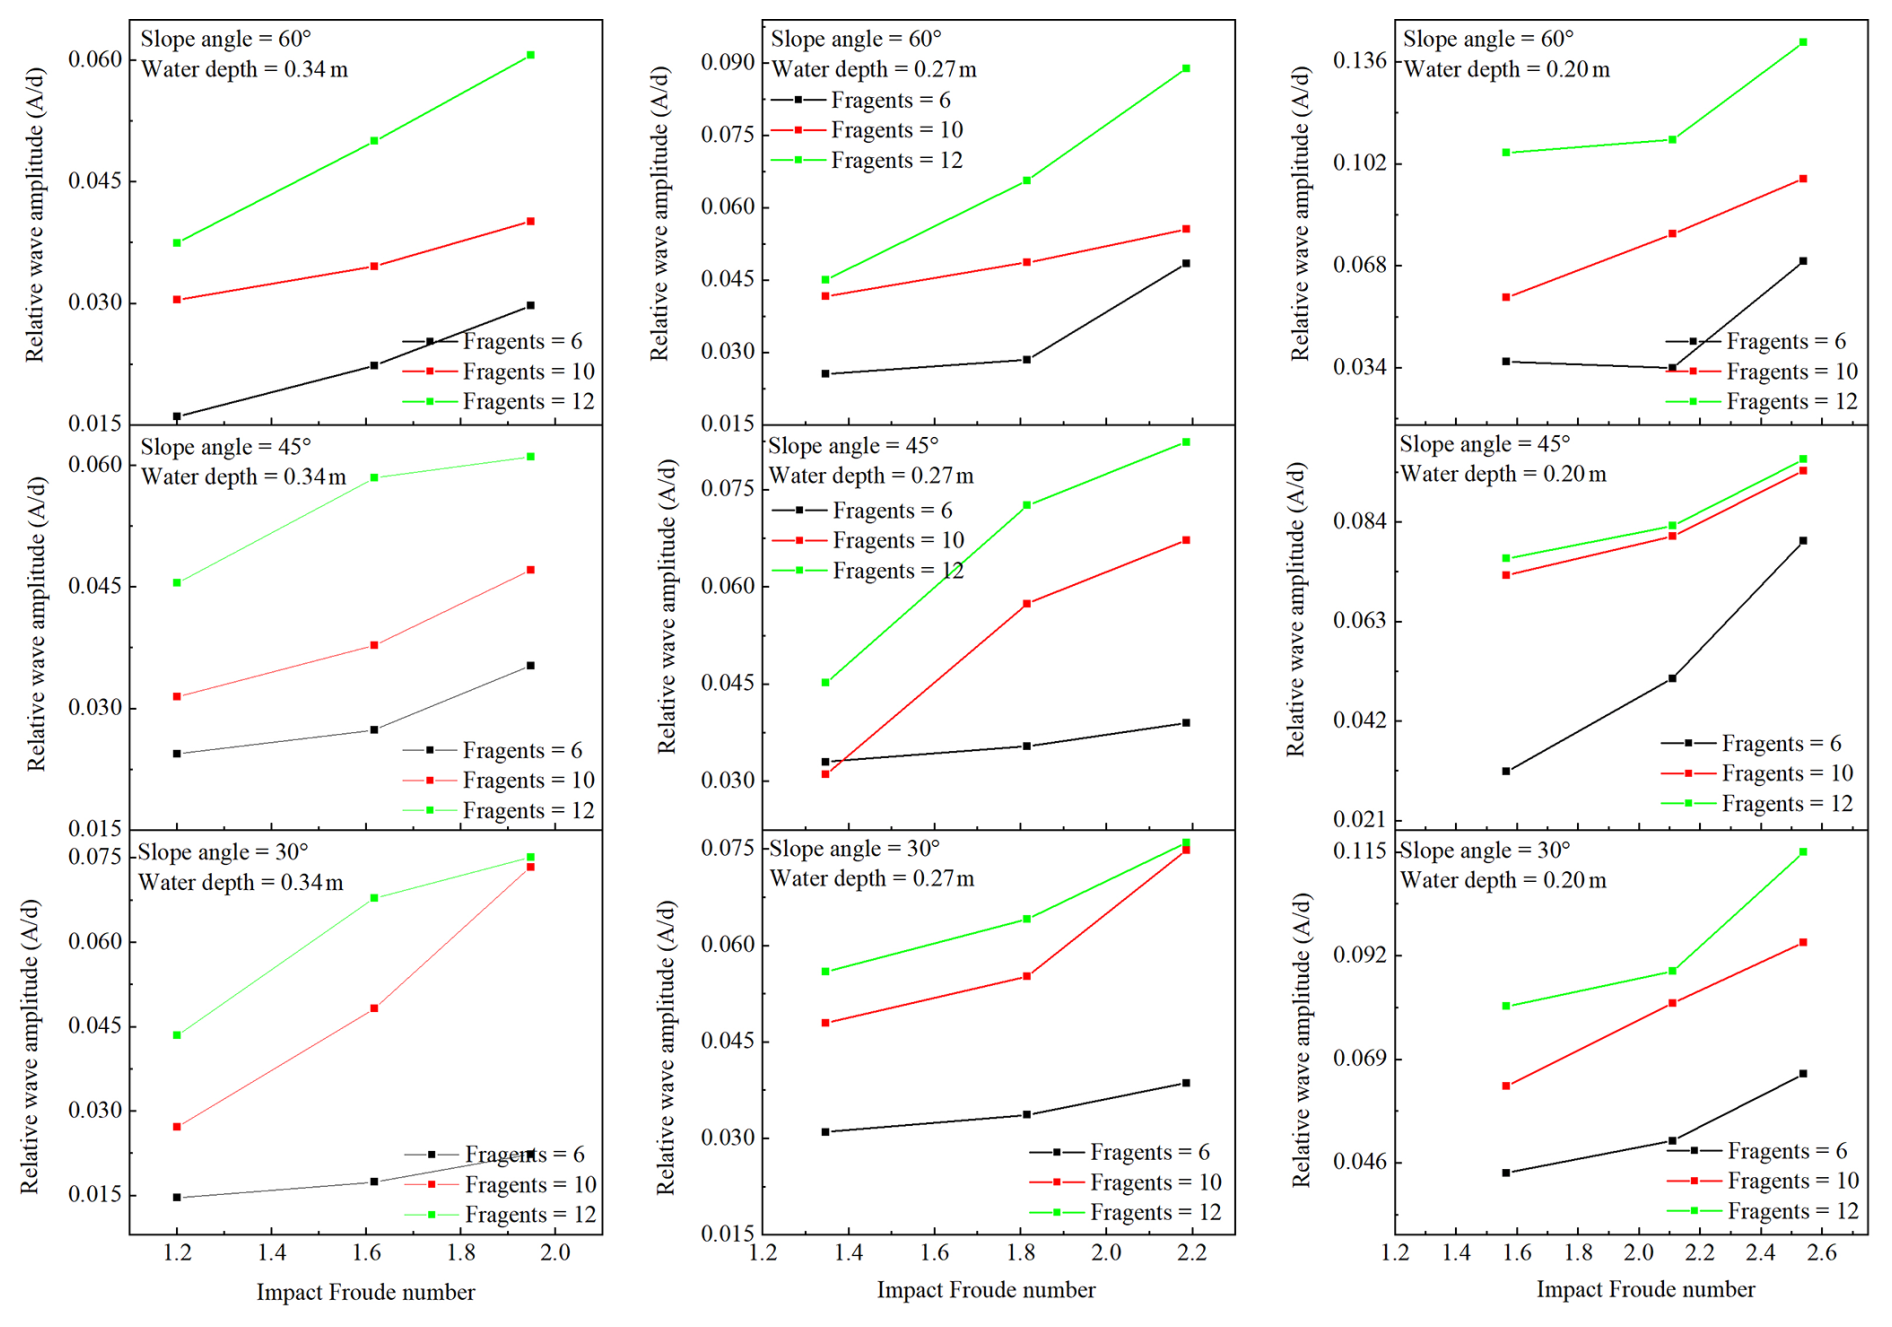
3.1.2 Impact Froude no vs. Relative wave amplitude
Figure 8 indicates the relationship between the impact Froude number and relative wave amplitude (), under varying experimental conditions for the first gauge, i.e., near the impact zone. Since we are interested in the immediate response of the wave influenced by the impact Froude number. The results indicate that as the water depth decreases, the relative wave amplitude and impact Froude number increase, indicating a reduction in the dissipation of impact energy, causing pronounced surface turbulence and increased wave height. Additionally, the decreased water depth also increased the value of the impact Froude number by reducing its characteristic velocity, resulting in stronger wave generation upon impact. The calculations for Reynolds number for the experiments resulted in very high values, thus indicating a strong turbulent flow, which is also evident from Fig. 5, so viscous effects are very, very small and can be ignored, thus indicating the Froude dynamics similarity. The experimental results indicate the complex interaction between wave propagation, impact dynamics, and bathymetrical effects in waves induced by rotational cliff collapse. Moreover, upon impact, the cliff fragmentation distributes impact energy over a larger area of water, thus increasing wave height by enhanced turbulence and water splashing effects.
3.1.3 Wave amplitude results
The results for the wave amplitude for various parameters are shown in Figs. 9–11. As mentioned earlier, two gauges were used to measure the induced wave amplitude. Figure 9 provides a detailed comparison of the wave amplitude recorded at both gauges for a 60° runup slope angle and a 0.445 m fall height. It can be observed that gauge-1, which is near to impact zone, has a higher relative amplitude compared to gauge-2. Furthermore, the results for the relative wave amplitude against the normalized time were also analysed for all the water depths (0.20, 0.27, and 0.34 m), fall height (0.245, 0.445, and 0.645 m), and cliff height (0.12, 0.20, and 0.24 m). The results indicate that the wave amplitude increases as the cliff height, impact velocity, and number of fragments increase for all the water depths, as can be observed in Fig. 10, thus demonstrating that the potential energy of the falling cliff plays a critical role in the magnitude of the resulting wave.
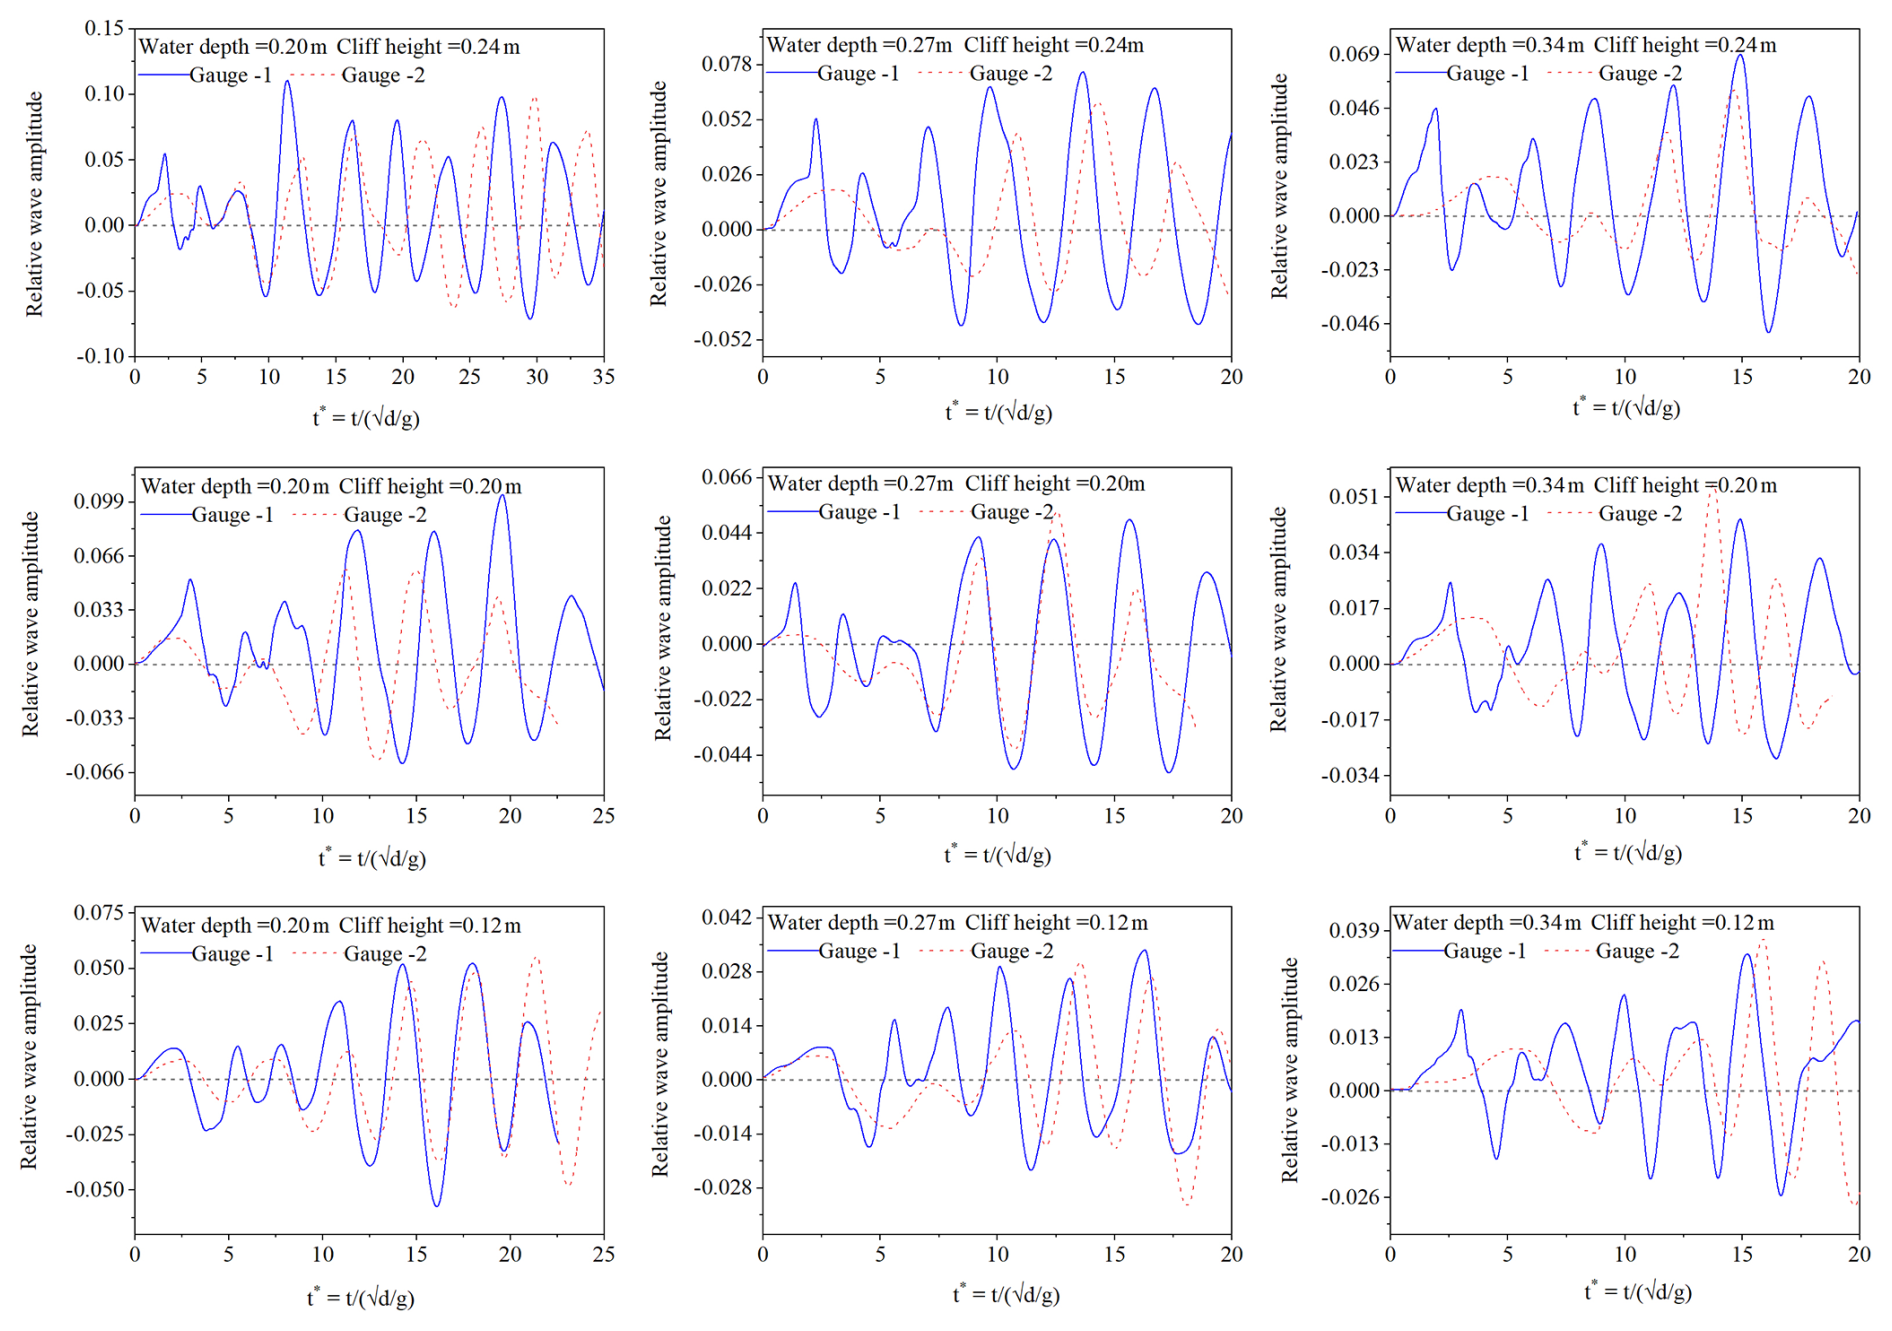
Figure 9A comparative display of the water waves recorded at gauge 1 and 2 for a 60° slope angle, and 0.445 m fall height.
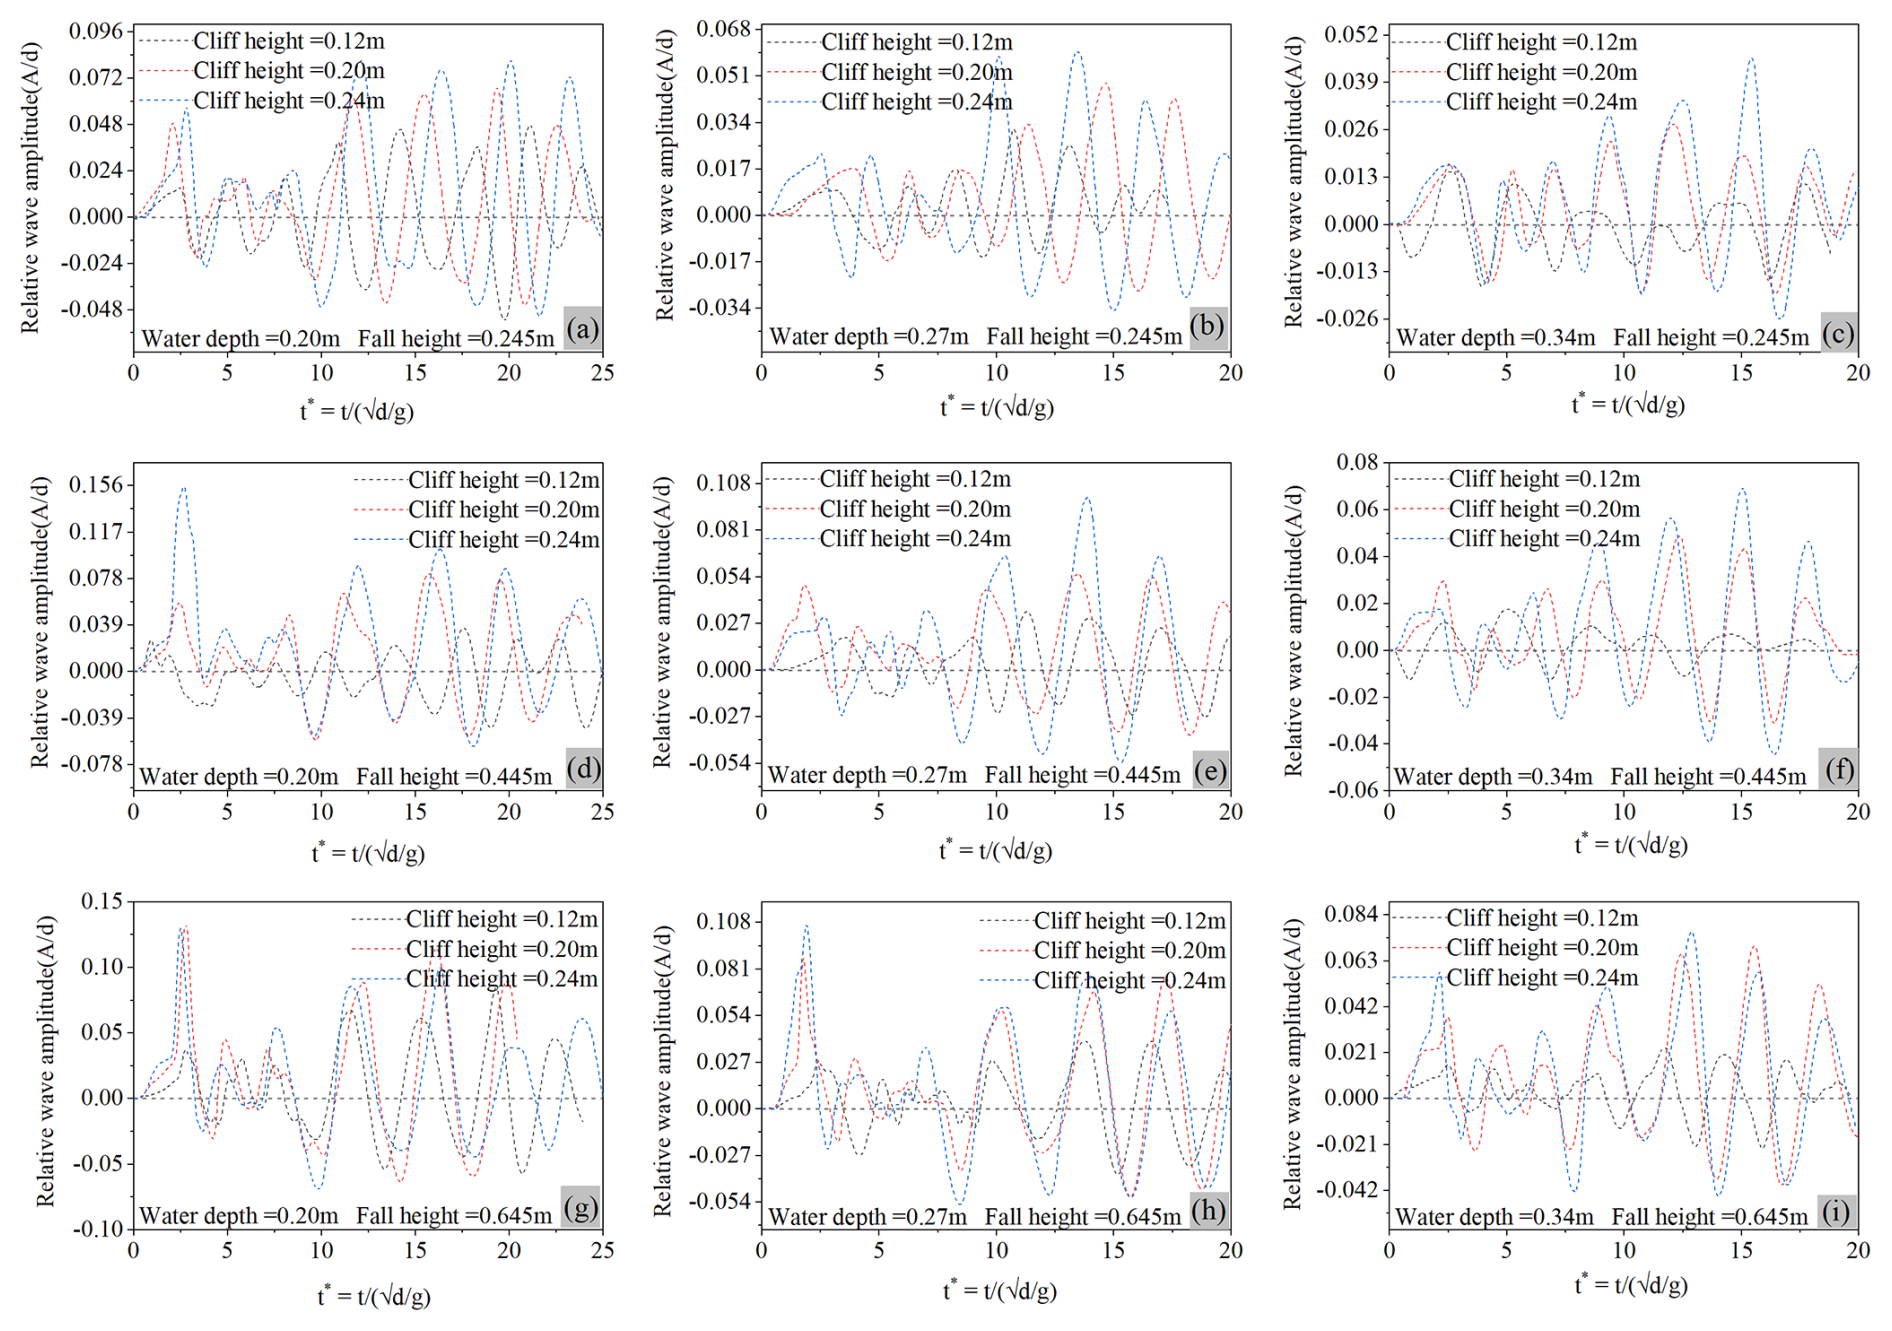
Figure 10Relative wave amplitude for various water depths, cliff height, and fall height at 30° runup slope angle, (a–c) relative wave amplitude induced by 0.245 m fall height, (d–f) relative wave amplitude induced by 0.445 m fall height, (g–i) relative wave amplitude induced by 0.645 m fall height.
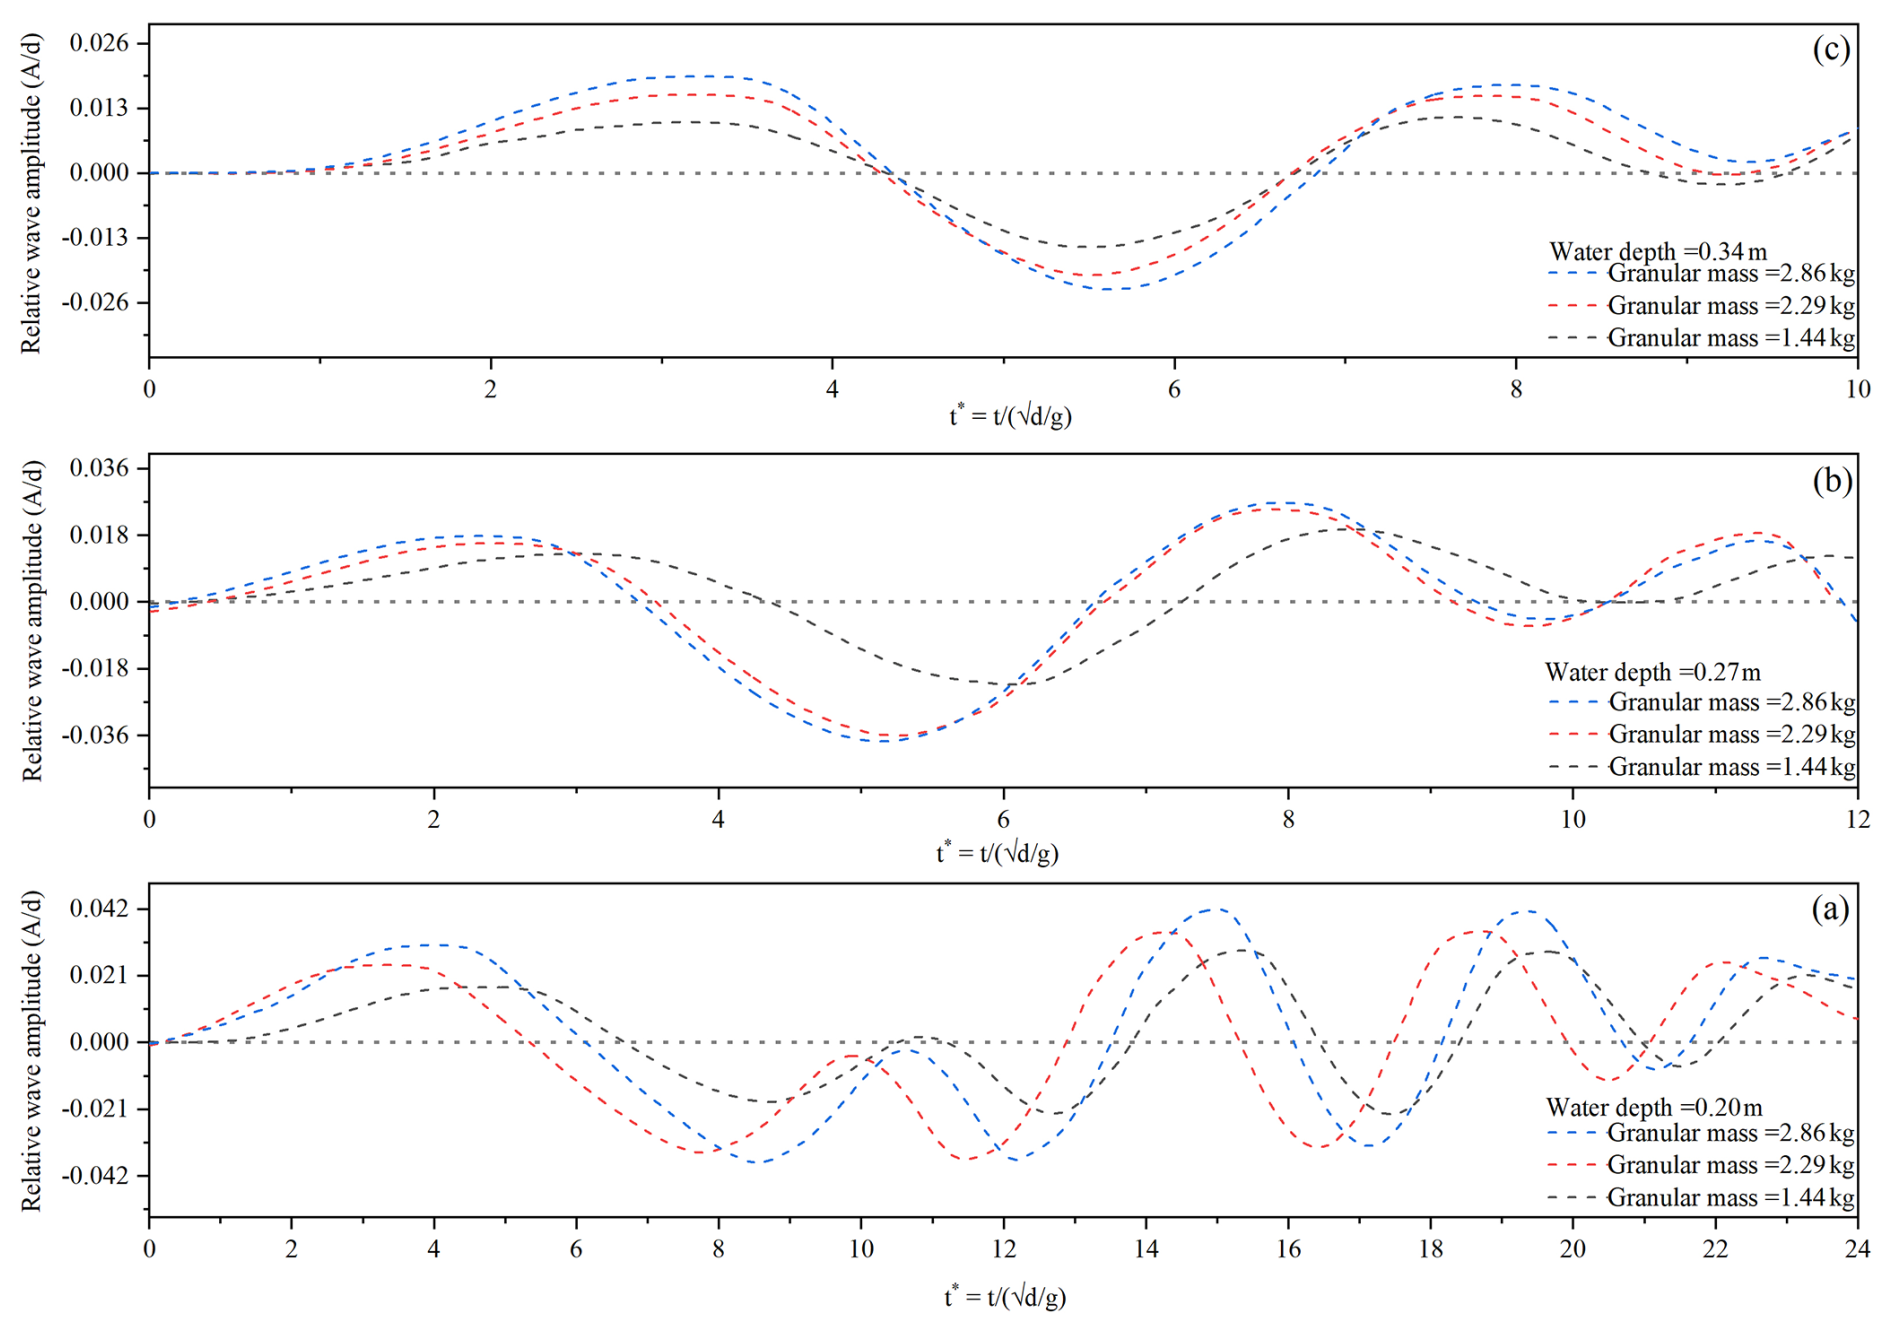
Interestingly, comparing the wave amplitude induced by cliffs of various heights falling from the same height revealed that the water depth and the wave have an inverse relationship. As shown in Fig. 10a–c, the average wave amplitude for various cliff heights and the same fall height of 0.245 m at 0.20 m water depth is 26 % more than the average wave amplitude induced by 0.27 m water depth and 50 % more than the 0.34 m water depth wave amplitude. Similarly, Fig. 10d–f indicates that the average wave amplitude for 0.445 m fall height at 0.20 m water depth is 18 % more than 0.027 m and 47 % more than 0.34 m water depth, whereas, for 0.645 m fall height wave amplitude induced by 0.20 m water depth is 25 % more than 0.27 m and 37 % more than 0.34 m water depth (Fig. 10g–i), thus suggesting that the deeper water dissipates the impact energy more effectively, as the deep water have more mass available to absorb and redistribute the impact energy, compared to shallower water thus reducing the overall amplitude of the induced wave. Moreover, a similar trend was observed for the wave amplitude involving 45 and 60° runup slope angle.
Later on, we performed another experiment by using granular material of equivalent mass as of cliff and slid it on a 30° slope, for all the water depths, and amplitude of the induced wave was measured as shown in Fig. 11. Figure 11a indicates that the wave amplitude for 0.20 m water depth and 1.445 kg granular mass (equivalent to 0.12 m cliff height) was 15 % more than 0.27 m water depth and 65 % more than wave amplitude induced by 0.34 m water depth. Whereas for 2.29 and 2.82 kg granular mass equivalent to 0.20 and 0.24 m cliff height similar trend was observed as shown in Fig. 11b and c, thus indicating that as the water depth increases, the wave amplitude decreases for all the equivalent granular masses, as happened in the case of cliff fall.
Furthermore, a comparison between the wave amplitude induced by a falling cliff and equivalent granular mass at various water depths indicates that the amplitude of the wave induced by an equivalent granular mass in 0.34, 0.27, and 0.20 m water depth was on average 28 %, 35 % and 42 % less than the wave amplitude induced falling cliff. The substantial difference in wave amplitude highlights the importance of energy transfer in wave formation. The falling cliff following a rotational motion imparts a more sudden and concentrated impact that allows an efficient energy transfer to water, leading to higher wave amplitudes. On the other hand, granular flows, being more deformable and flowing along a slope, result in gradual energy transfer over a wide area, thus resulting in lower wave amplitudes. The results highlight that it's not only the total impact energy that affects the behavior of the induced wave, but the mode of energy transfer also plays a critical role (Mohammed and Fritz, 2012; Wunnemann and Weiss, 2015). Based on the experimental results for wave amplitude and runup induced by rotational cliff collapse that fragments upon impact with the water surface, a novel prediction model was prepared using multi-expression programming. The justifications for the use of MEP have been well explained in the previous sections.
3.2 Numerical modeling results
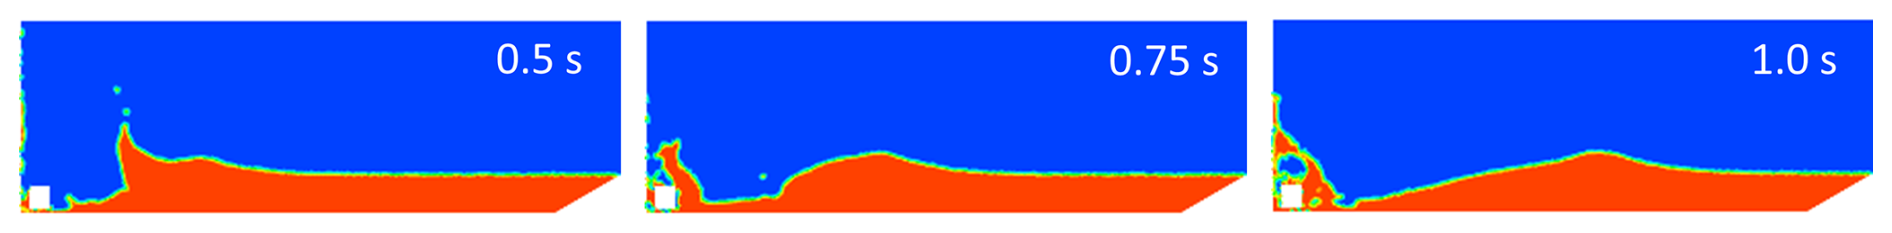
The numerical simulations conducted in this study successfully captured key dynamic characteristics of the wave generated by the rotational cliff collapse, specifically the wave amplitude and wave runup, across a range of test cases. Moreover, the front velocity of the incident wave was also measured. The simulations were also focused on verifying the results obtained from the rotational cliff collapse in the experiments. To quantify the wave amplitude, runup, and velocity, a post-processing technique was employed. To establish the reliability of the wave front velocity measurements, the velocity was calculated at 5–7 distinct locations along the wave's propagation path and at multiple time steps during the simulation. This multi-point sampling approach minimized errors due to spatial and temporal variations. Figure 12 shows a representative case of wave formation and propagation in a water tank at a depth of d=0.2 m at various time frames.
The wave amplitude was defined as the peak vertical displacement of the liquid surface relative to the undisturbed free surface level. Figure 13 illustrates a representative case, depicting the wave front propagation.
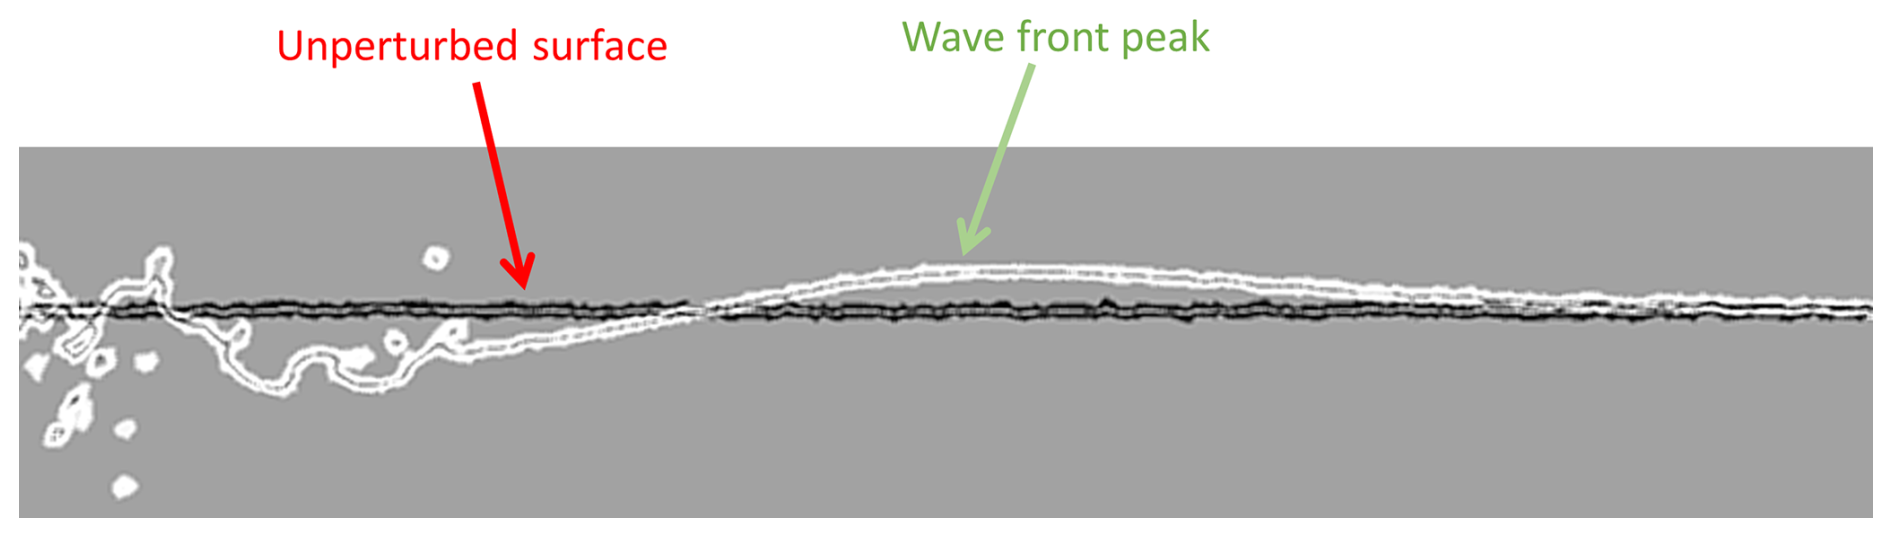
Figure 13Wave dynamics following a rotational cliff collapse in water depth d=0.34 m. Stable liquid surface before impact (black line); wave front propagating away from the point of impact (white line).
To validate the results of simulations, we compared the results of the runup height with the experimental values. Table 3 presents the runup values for various runup slope angles, i.e., 30, 45, and 60°, for a water depth of 0.27 m. The comparison of simulated values was performed at this depth, as it lies in the middle of the experimental test range of water depths. Numerical modeling results indicate that for a fixed water depth, the runup values consistently decrease as the runup slope angle increases from 30–60°. At a water depth of 0.27 m, the runup decreases from 0.2 m at 30–0.17 m at 45°, and further to 0.11 m at 60°. This reduction is attributed to the changing momentum transfer dynamics with increasing slope angle. At less steep angles (closer to horizontal, e.g., 30°), the rock's momentum generates a stronger radial splash and greater upslope displacement of the liquid along the cliff. As the angle increases toward 60°, a larger component of the momentum is directed parallel to the cliff, reducing the vertical impulse. The experimental and numerical results agree well, and the difference lies within the acceptable range of 4 %–5 %. The experimental results for the other two water depths also indicate similar behavior.
Table 3Peak runup values along the various slope angles at a water depth of 0.27 m.

Next, we measured the wave velocity through the numerical results, as it wasn't captured accurately through experimental images. Figure 14 illustrates the simulated wave fronts at a time instant of t=1 s following the impact of the solid rock on the liquid pool, for various water depths and a fixed slope angle of 30°. These visualizations highlight the propagation of the waves from the impact zone. The slope angle was varied across simulations to assess its influence on wave characteristics. It was observed that changes in the slope angle induced only minor variations in both the wave front velocity and wave amplitude for a given pool depth. These perturbations were typically within 1 %–2 % of the mean values. Consequently, to streamline the analysis and focus on dominant trends, the wave front velocity and height were averaged over the range of slope angles for each specific water depth.
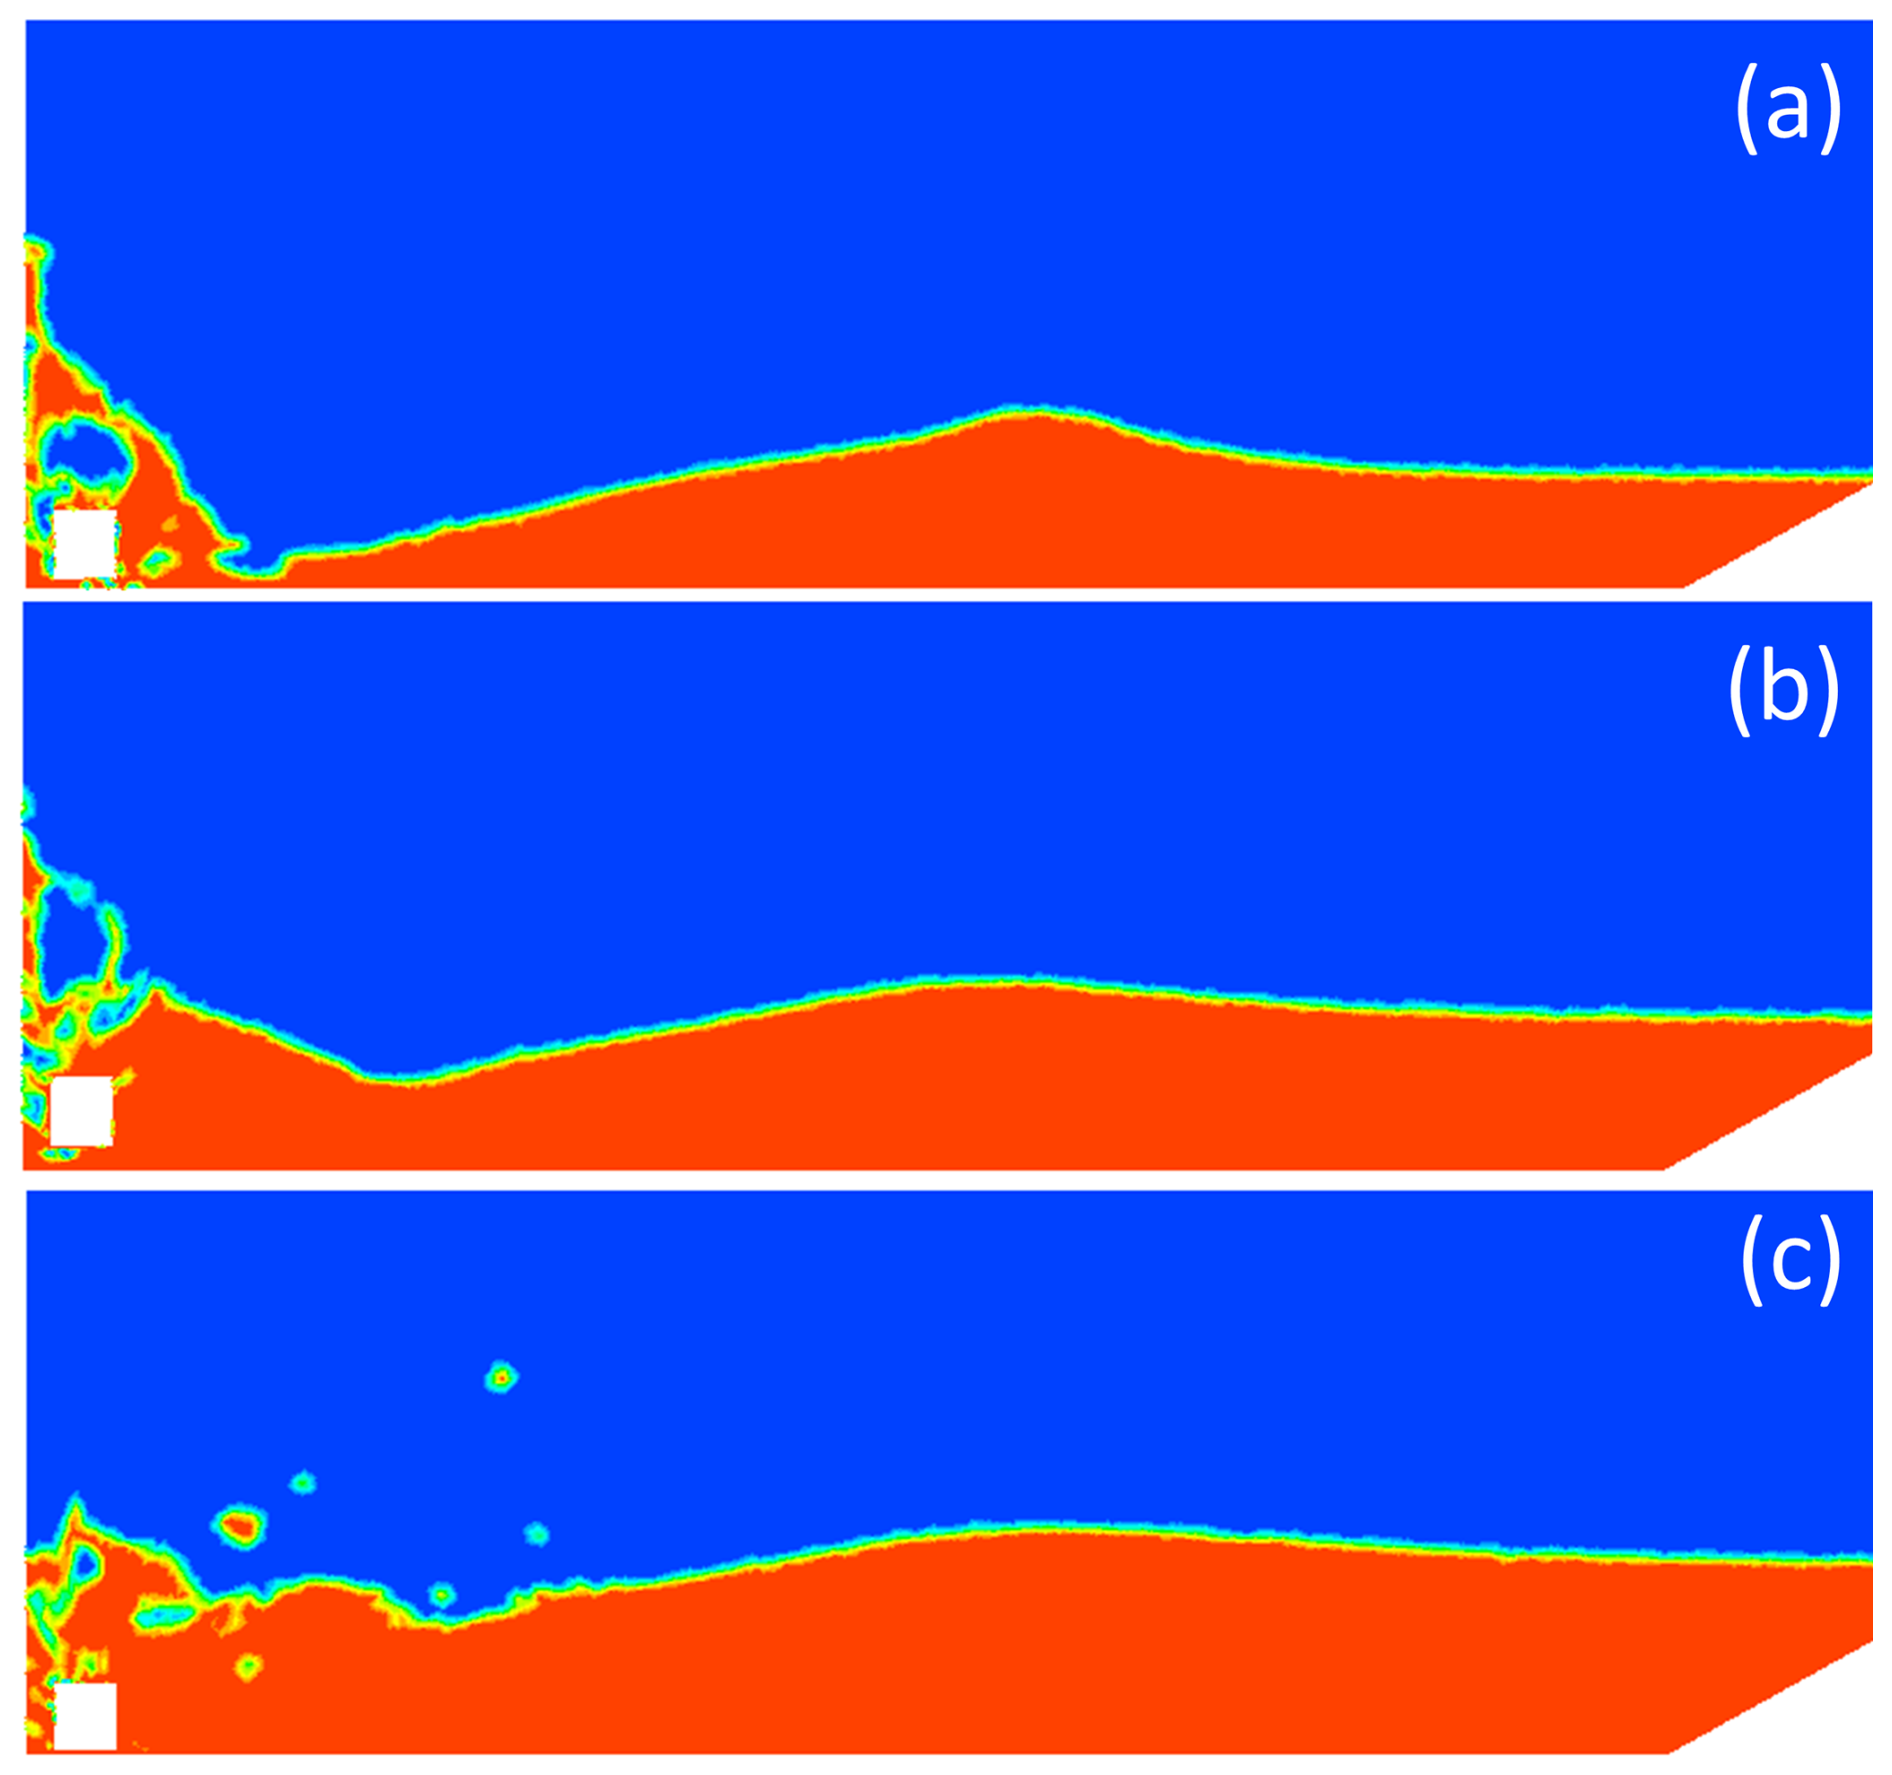
Figure 14Propagating wave fronts after the impact at time t=1 s for a slope angle of 30°. (a) d=0.2 m, (b) d=0.27 m, (c) d=0.34 m.
However, variations in water depth exerted a pronounced effect on the wave dynamics, leading to significant alterations in both the propagation velocity and amplitude of the generated waves. This depth-dependent behavior is quantified in Table 4, which presents the averaged results from the numerical simulations. For a shallow water depth of d=0.2 m, the average wave front velocity was computed as 1.48 m s−1, with a corresponding average wave height of 0.11 m. As the pool depth increased to d=0.27 m, the velocity rose to 1.58 m s−1, while the wave height decreased to 0.07 m. Further deepening to 0.34 m yielded a velocity of 1.74 m s−1 and a reduced wave amplitude of 0.06 m. These trends indicate an approximately linear increase in velocity with depth, accompanied by an inverse relationship for wave amplitude.
Table 4The average wave propagation velocity and amplitude for various water depths.
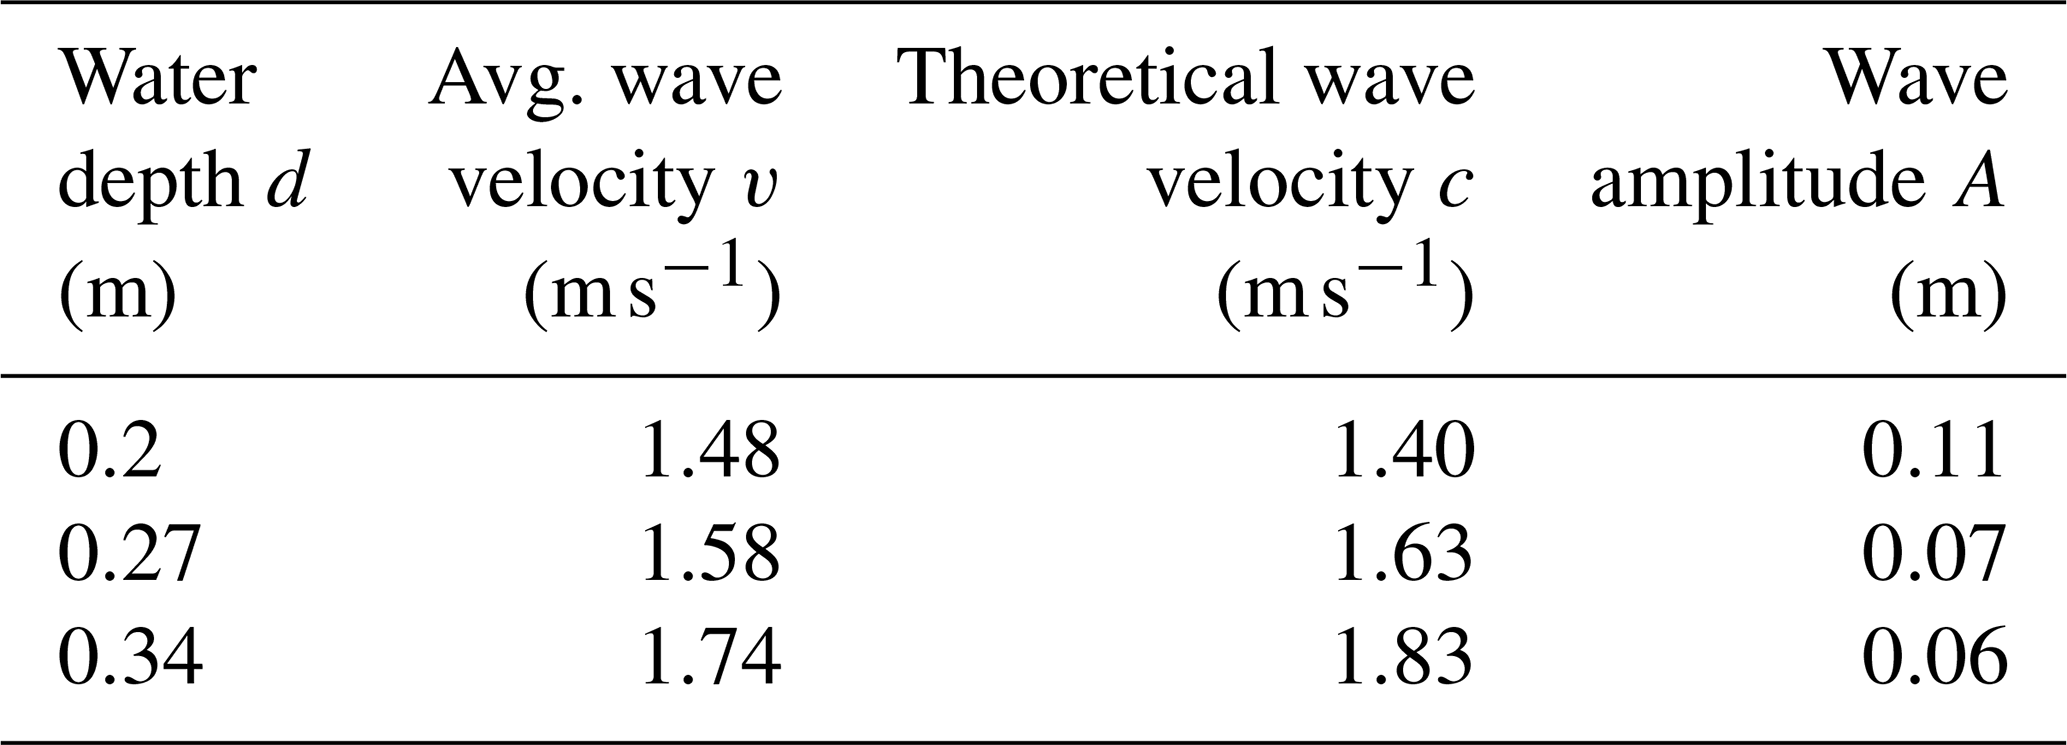
The observed depth dependence can be rationalized through fundamental principles of wave propagation in gravity-dominated, multi-phase flows. In the shallow water regime, given that the pool depths (0.2–0.34 m) are comparable to or smaller than the wavelengths of the generated waves, the phase velocity c of long gravity waves approximates , where g is the gravitational acceleration (9.81 m s−2), and h is the undisturbed water depth. This relation arises from the shallow water equations, where hydrostatic pressure balance and negligible vertical acceleration dominate, leading to a dispersionless incident wave speed that scales with the square root of depth. Substituting the water depths yields theoretical velocities of approximately 1.40 m s−1 for d=0.2 m, 1.63 m s−1 for d=0.27 m, and 1.83 m s−1 for d=0.34 m, which align closely with the simulated values (discrepancies of 7 %–10 % may stem from viscous dissipation, non-hydrostatic effects near the impact zone, or spreading of the wave front). A comparative analysis of the results is shown in Table 4.
Conversely, the decrease in wave amplitude with increasing water depth aligns with energy conservation and volume displacement considerations in impact-generated waves. The impact of rotational cliff collapse imparts a fixed kinetic energy and displaces a finite volume of liquid, creating an initial cavity and subsequent outflow that evolves into a propagating wave. In shallower pools, the displaced volume is confined to a smaller cross-sectional area, resulting in greater vertical amplification to accommodate the same mass redistribution. For deeper water depths, the energy is distributed over a larger water column, diluting the surface perturbation and yielding lower amplitudes. The trends observed in the numerical simulations for water waves induced by rotational cliff collapse are in good agreement with theoretical and experimental results, indicating that water depth has a direct effect on the wave velocity and an inverse effect on the wave amplitude and runup.
3.3 MEP model results
The purpose was to develop a precise model for wave amplitude and runup induced by rotational cliff collapse. The predicted model is a function of seven variables, i.e., water depth, fall height, cliff mass, impact velocity, cliff height, runup slope angle, and number of fragments, and can be described as follows,
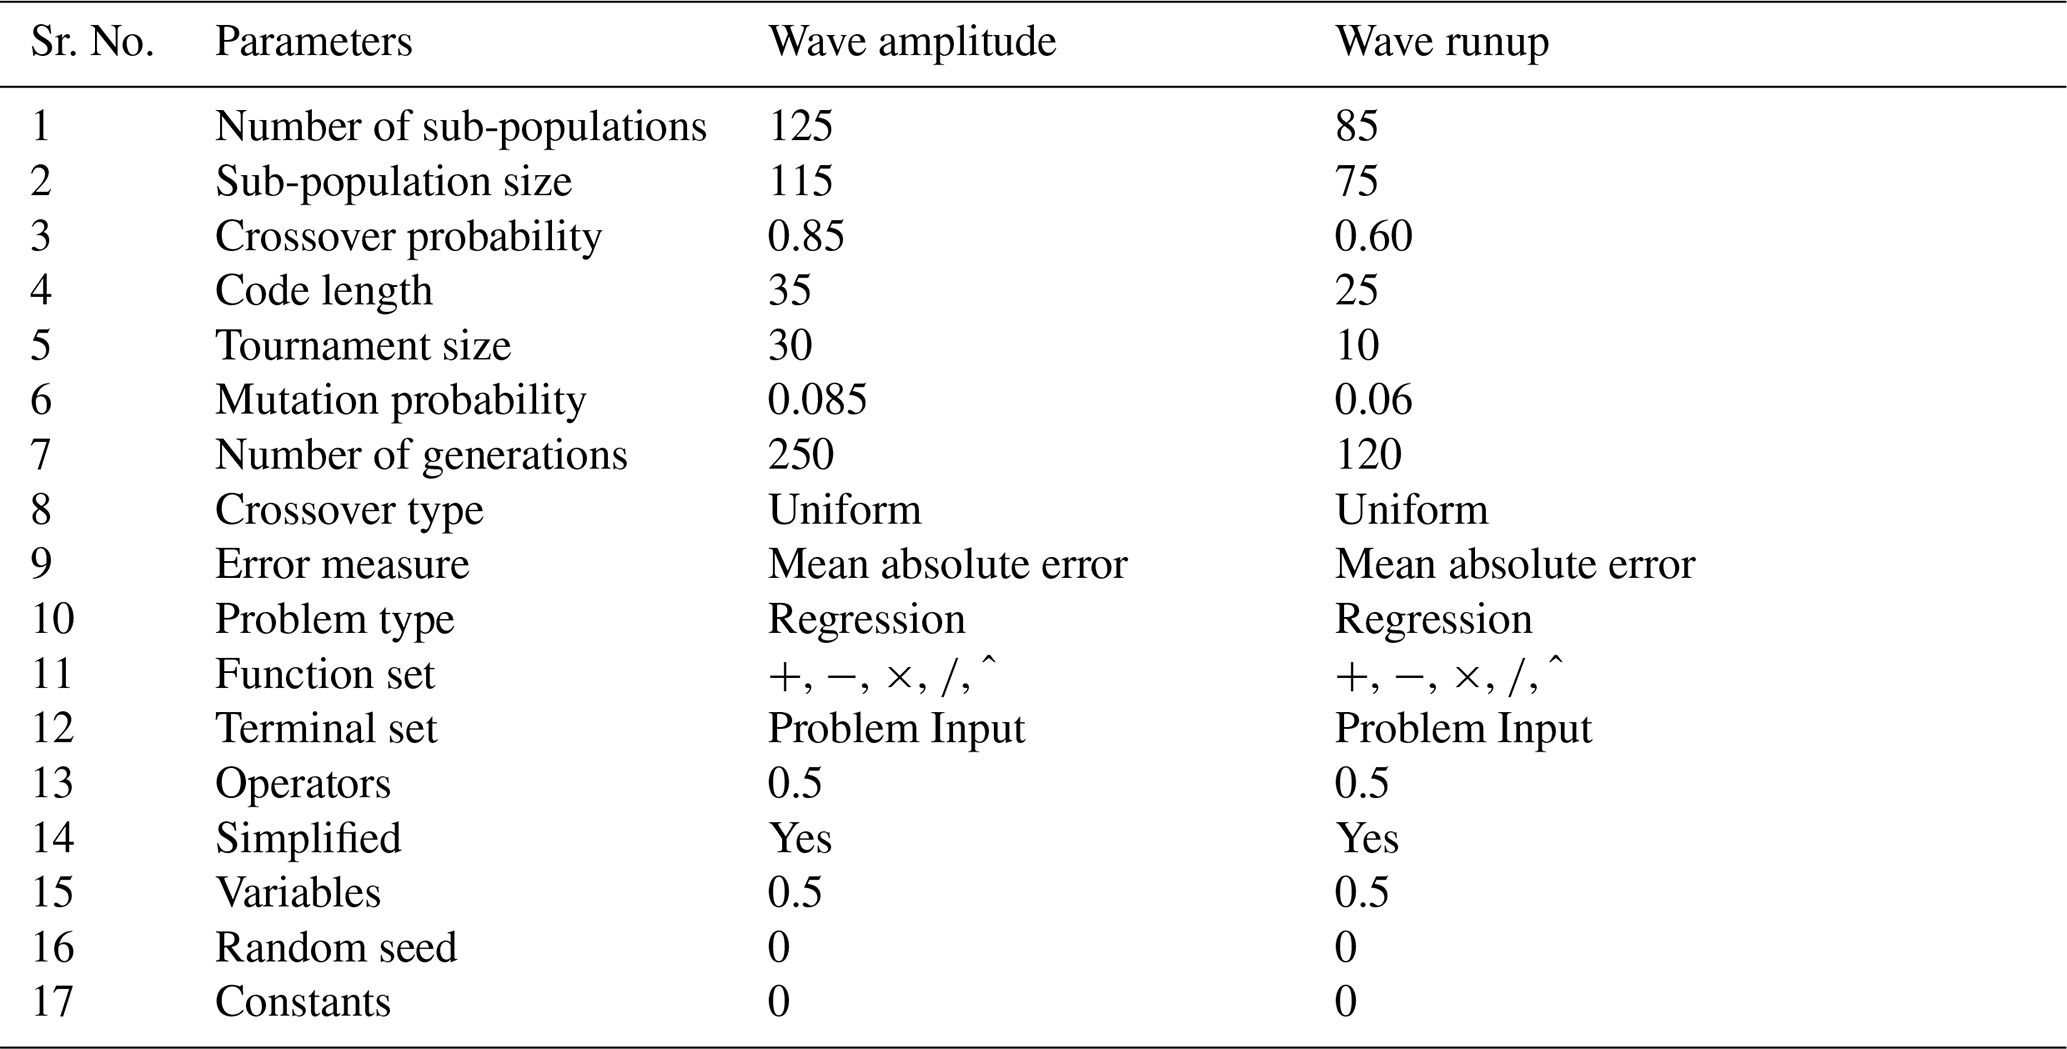
The relation among the parameters was evaluated using Pearson's correlation to analyze the multicollinearity and interdependency between the parameters, as they can obscure the interpretation of the developed model. The model was developed by splitting the data into two subsets, i.e., training (70 %) and testing (30 %). The randomization was done by MEP itself. Following the criteria, 70 % of the data, i.e., 57 data points, were taken as training data, whereas 30 % of the data, i.e., 24 data points, were considered for validation of the model. The mathematical expression for MEP is obtained by solving the C++ code and representing it as per optimized hyperparameter settings, as shown in Table 5. The prediction model for wave amplitude and runup was developed by analyzing the MEP code in MATLAB, as shown in Eqs. (4) and (5).
Whereas d is the water depth (m), m is the mass of the cliff (kg), v is the impact velocity (m s−1), h is the cliff height (m), α is the runup slope angle, and Nf is the number of fragments.
Table 5Parametric settings of the MEP algorithm for wave amplitude and runup.
3.3.1 Prediction performance of the developed model
The robustness of the proposed model was evaluated by comparing it with well-established statistical indices, i.e., mean absolute error (MAE), root mean square error (RMSE), correlation coefficient (Cr), Nash–Sutcliffe efficiency (NSE), and performance index (PI). The indices can be represented by Eqs. (6–10) (Khan et al., 2022).
Whereas, and are the average values of the experimental and predicted results, and ei and pi are ith values of the modeled and predicted results, for n total samples. It is good to consider the error indices while analyzing the predictive capability of complex models. The wave runup model demonstrated a robust performance for both training and testing datasets. The lower values of RMSE and MAE indicate little deviation from experimental values, while RSE and RMSE values confirm lower normalized error, as shown in Table 6. The higher values of NSE and Cr further validated the model reliability for the training phase. Whereas for the validation dataset, i.e., the unseen data model displays even stronger performance with lower RMSE and MAE values compared to the training dataset. Moreover, higher Cr and lower performance index values highlight enhanced model efficiency. This suggests that the model works well for unseen data, making it suitable for predicting the wave runup induced by rotational cliff collapse (Gardezi et al., 2024).
Table 6Performance index values for the MEP-based water wave amplitude and runup prediction model.
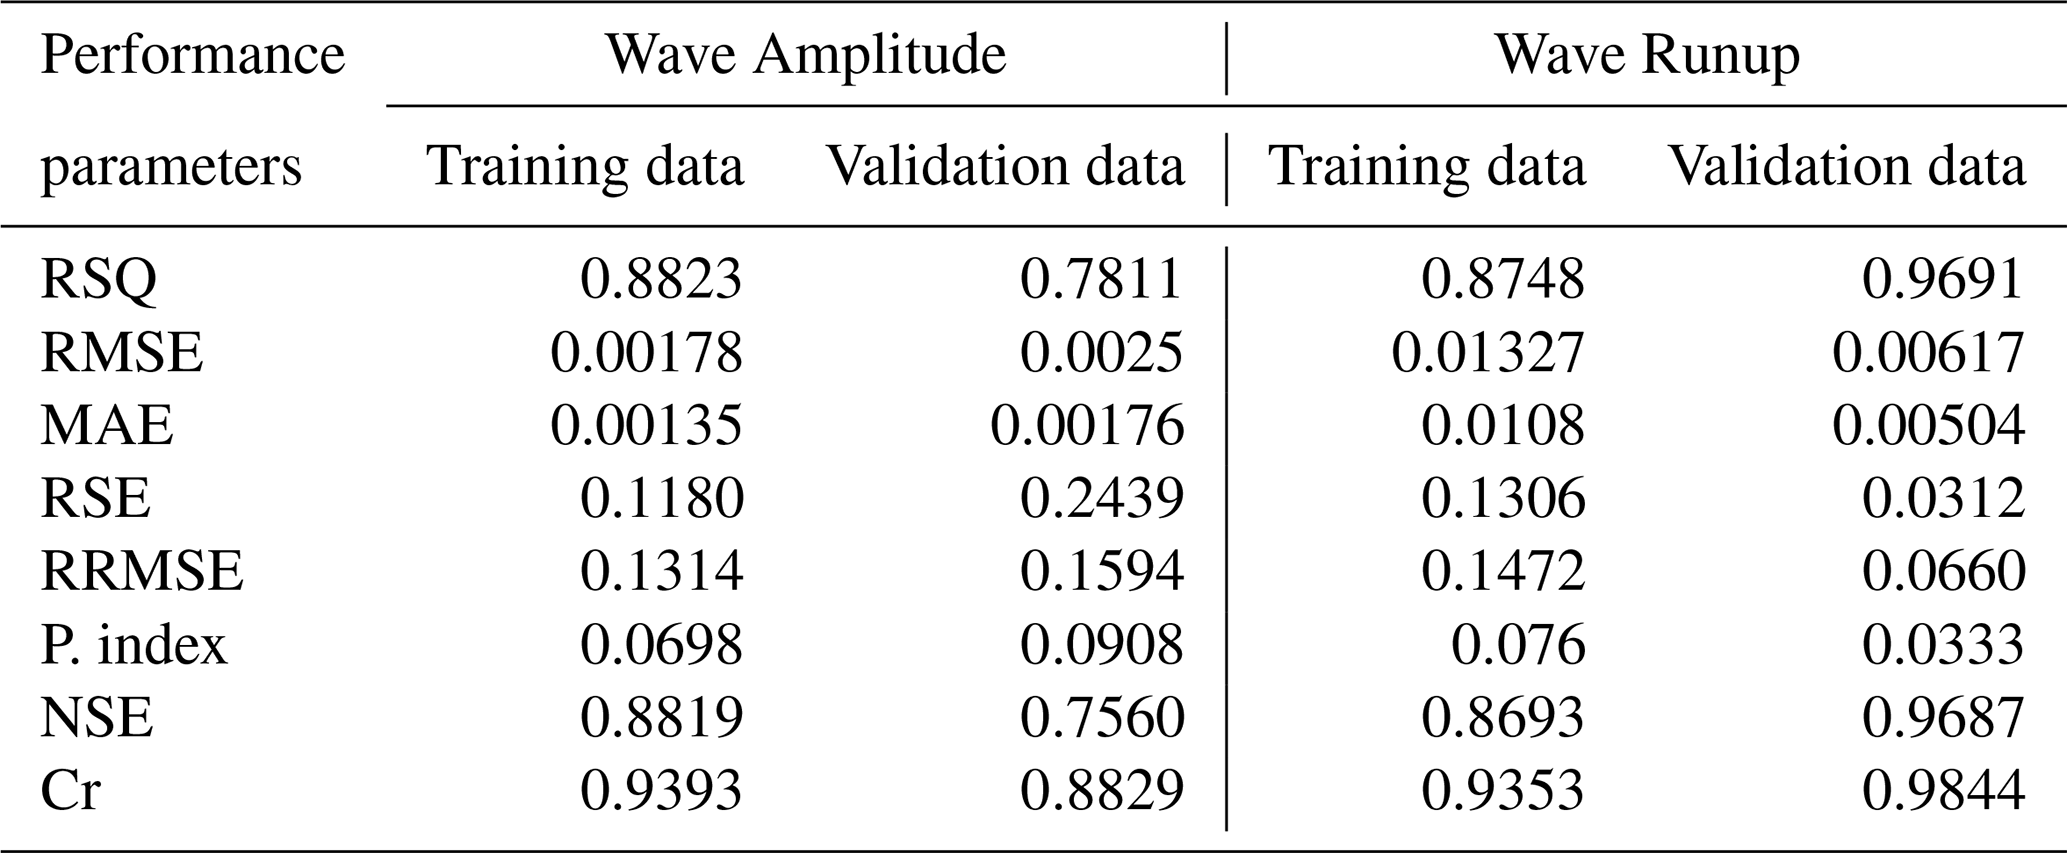
The predictive performance of the wave amplitude model in the case of training data demonstrated a strong correlation with high R2 values and low RMSE and MAE values corresponding to 13.14 % relative error, thus suggesting a good agreement between experimental and predicted values, as shown in Table 6. The higher NSE and Cr values further confirmed the model's reliability for the training dataset with minimal systematic bias. When the model was exposed to unseen data, it still maintained reasonable accuracy with an R2 value of 0.78. Though the values of error matrices, i.e., RMSE, MAE, and RRMSE, are a bit higher than the training data set, this is expected due to inherent generalization challenges. Similarly, the higher NSE and Cr values, though lower than the training dataset, indicate consistent predictive performance of the wave amplitude model with little increase in bias. Overall model exhibited strong predictive performance in the training and testing phase, with a little expected decline in the validation phase.
Previously, scientists have also used the slope of the regression line as a performance indicator for AI models, thus representing a correlation between experimental and predicted results. Figure 15a and b shows the regression line for our wave amplitude and runup model. For wave amplitude, the slope value for the training data set is 0.88, which is adequate, and 0.78 in validation, which is still greater than the minimum value of 0.7; it can happen as the model involving numerous parameters and complex phenomena usually performs slower for the unseen data (Yarkoni and Westfall, 2019). Whereas, for wave runup, the model performed very well for both training and validation data sets with an R2 value of 0.87 and 0.96, respectively.
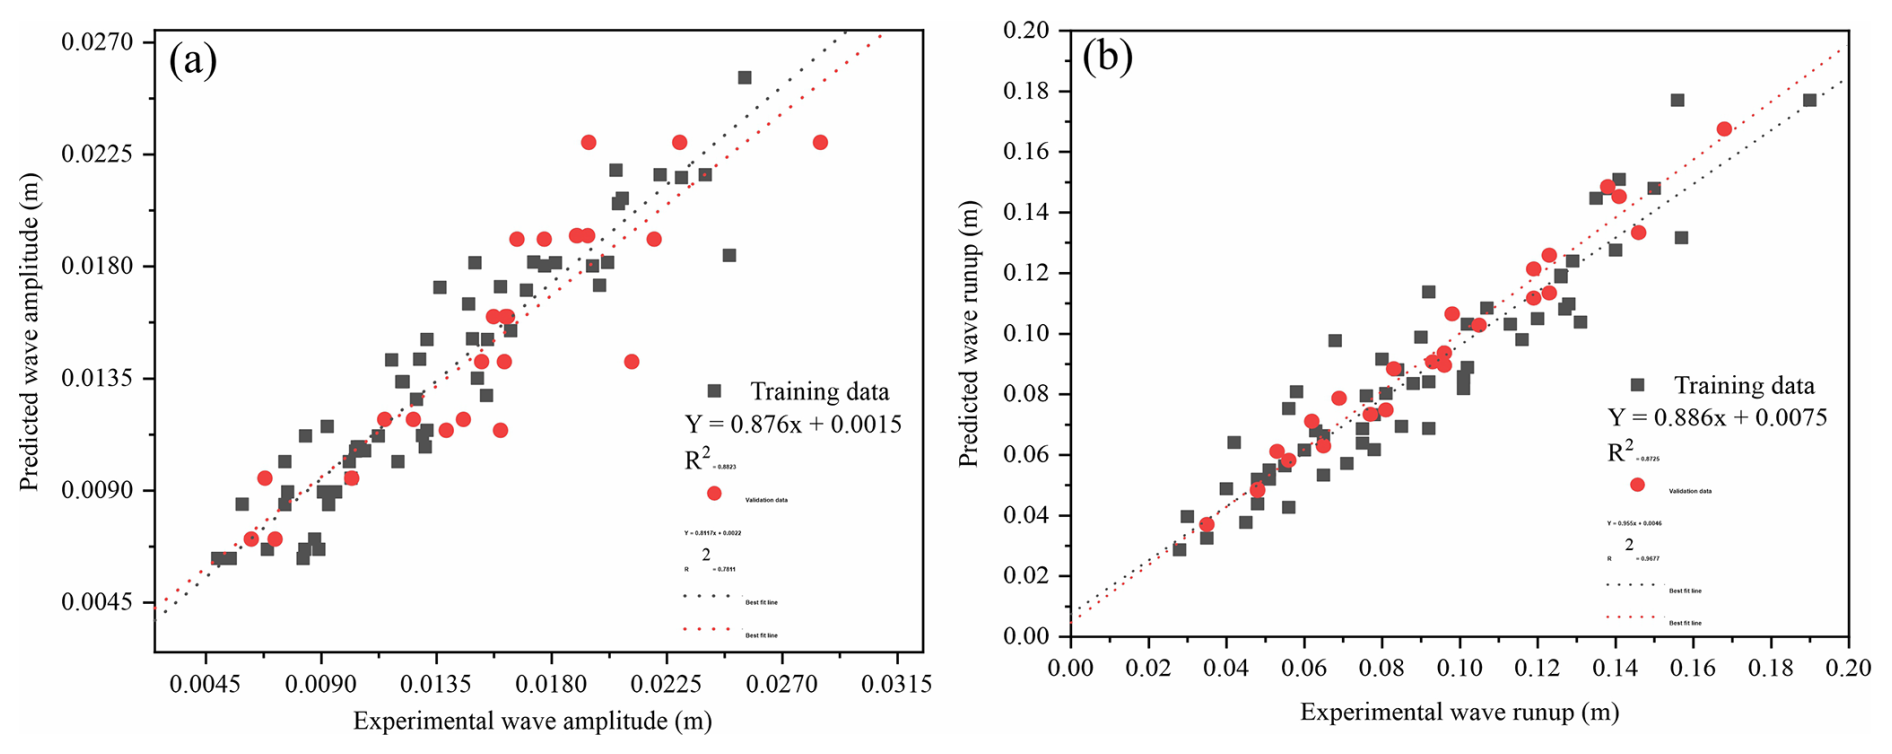
Figure 15Tracing the experimental results by predicted values, (a) wave amplitude and (b) wave runup.
The accuracy of the proposed model can also be checked using residual error plots, which are obtained by subtracting experimental and predicted values. The results indicate that the amplitude model has minimum and maximum values of −0.004 and 0.0065 m, as shown in Fig. 16a, whereas for wave runup the minimum and maximum values are −0.01875 and 0.024 (Fig. 16b). Moreover, it can also be observed that error values are populated along the x axis, therefore, showing low error frequency, and accuracy of both the models.
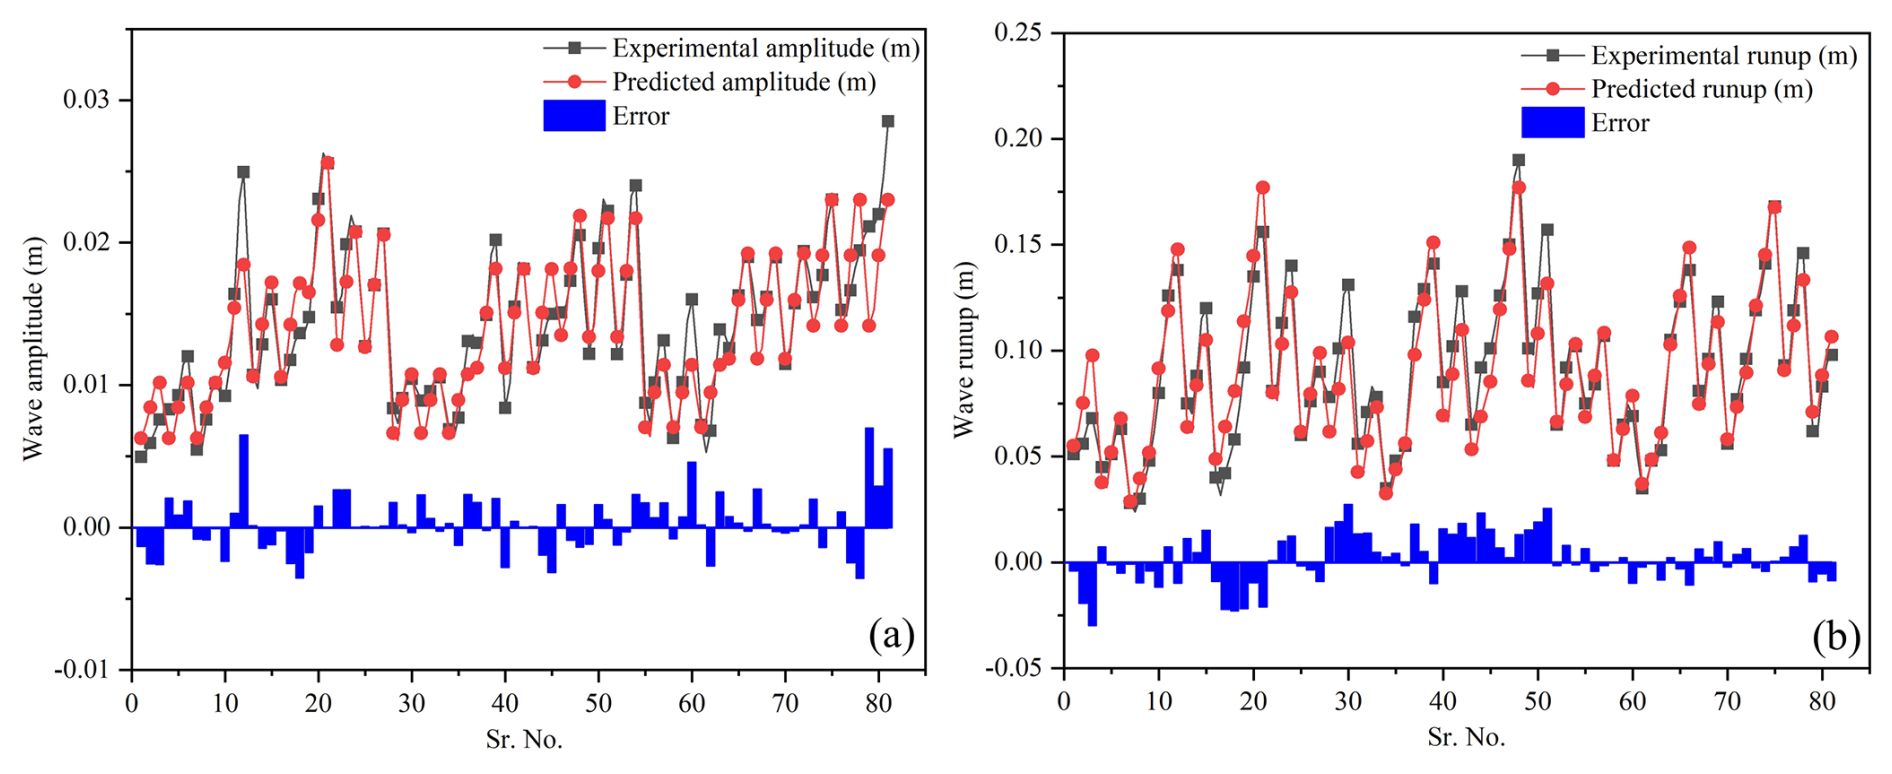
Figure 16Indicating error values between experimental and predicted model (a) wave amplitude, and (b) wave runup.
3.4 Validation of the developed model
The validation of the proposed model is an important feature in predictive modeling. It has been observed that sometimes the model performs very well for training data sets, but fails to perform during the validation stage for unseen data. So, the developed prediction model was further validated by conducting the sensitivity and parametric analysis for both the wave amplitude and runup.
3.4.1 Sensitivity analysis
Sensitivity and parametric analysis play a vital role in determining the robustness of the proposed model. The sensitivity analysis (SA) of the developed prediction model for the entire dataset tells us how sensitive the model is to any changes in input parameters. So, for an independent parameter Yi the SA can be calculated using Eqs. (11) and (12), which indicates that for any parameter, the values were varied between two extremes, and others were constant at their average, and the outcome was found in the form of Yi, and then the same process was repeated for all the remaining parameters.
Whereas, fmax(Yk) and fmin(Yk) represent the minimum and maximum values of the model-based results grounded on the kth domain of the input parameters in the above equation. Figure 17a and b shows the results of the sensitivity analysis of the developed prediction model for the wave amplitude and runup. Figure 17a indicates that the wave amplitude is greatly influenced by the height of the cliff (h) and has an effect of almost 51 %. The water depth (d) contributes 4.36 % to wave amplitude, cliff mass (m) contributes 4.69 %, and impact velocity (v) and number of fragments (Nf) contribute 18 % and 22 % to the induced wave amplitude. Whereas the fall height (H) and runup slope angle (α) do not affect the wave amplitude. Since the impact velocity parameters have already catered for the fall height that's why it is not visible in the proposed model. The model tells us that impact velocity, cliff height, and number of fragments contribute approximately 90 % to the wave amplitude induced by the rotational fall of the cliff. It can be concluded that the effect of on the induced wave amplitude.
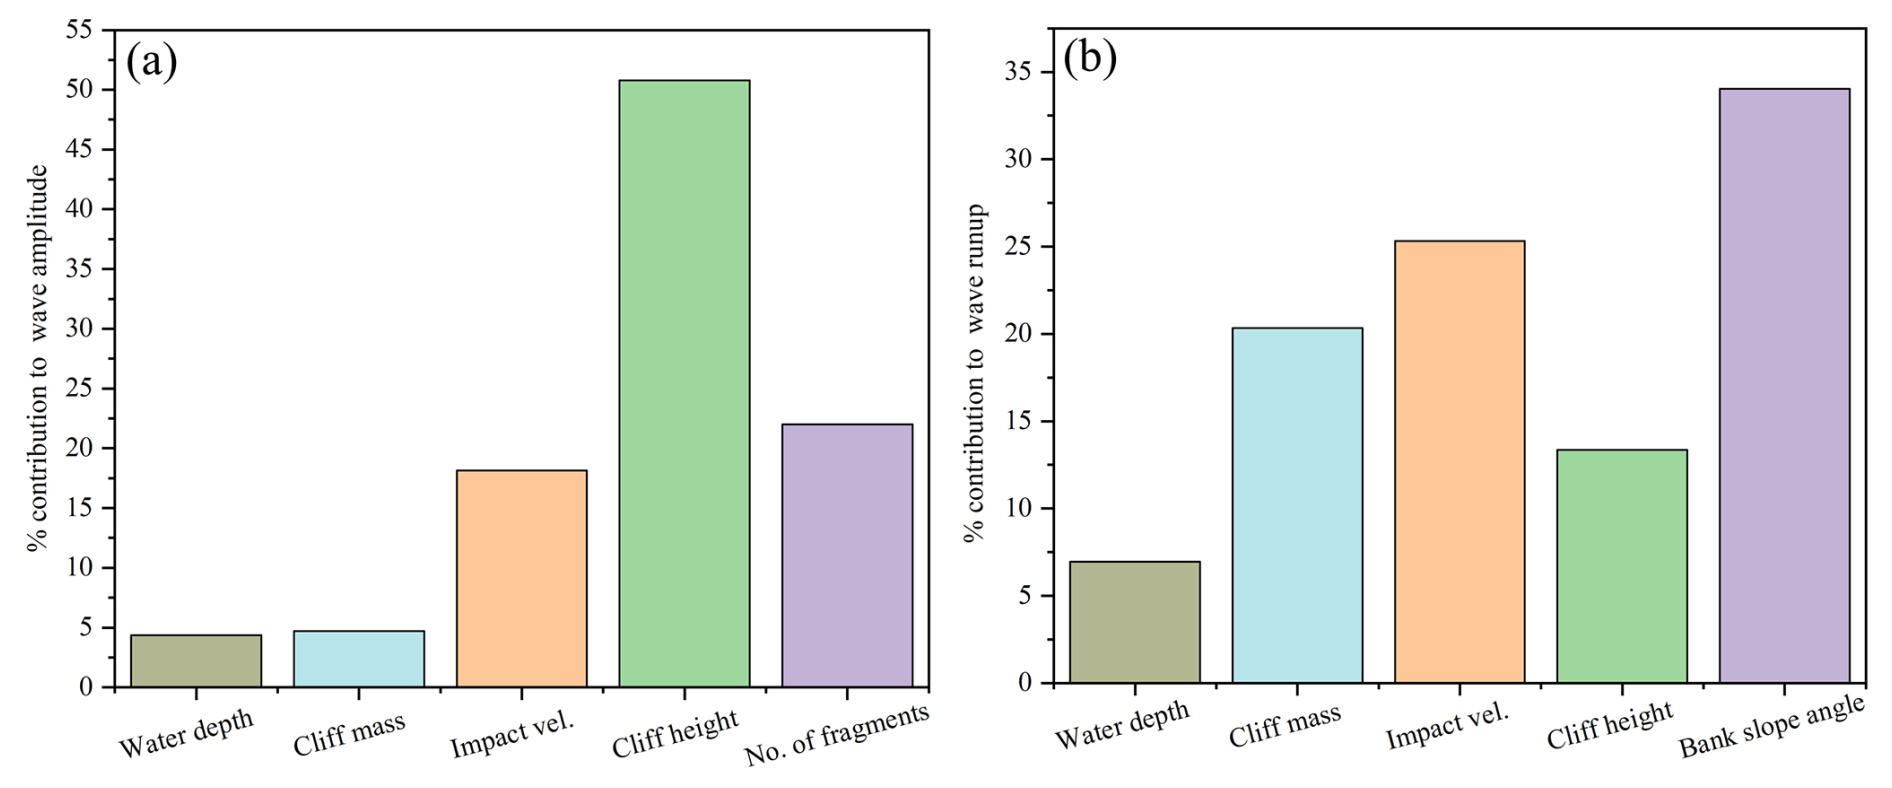
Similarly, the sensitivity analysis of wave runup (Fig. 17b) indicates that runup is greatly influenced by bank slope angle (α) and has an effect of 34 %. Impact velocity (v) contributes 25.3 %, cliff mass (m) 20.3 %, cliff height (h) 13.3 %, and water depth (d) contributes around 7 % to wave runup. Whereas, the number of fragments and fall height that have already been catered in impact velocity don't contribute to wave runup. This suggests that wave runup is primarily governed by coastal geometry, i.e., bank slope angle and cliff height, and hydrodynamic forces, i.e., impact velocity, whereas water depth contributes a little to wave runup. It can also be concluded as the effect of on the induced wave amplitude.
3.4.2 Parametric Analysis
Parametric analysis results for the input parameters for the wave amplitude used in this study are displayed in Fig. 18. The parametric analysis indicates that wave amplitude decreases as the water depth, number of fragments, and cliff mass increase, whereas it increases with the increase in cliff height and impact velocity. These trends are in line with the fundamental physics principles (Bougouin et al., 2020; Lipiejko et al., 2023). Deep waters dissipate more energy, and greater impact velocities and larger cliff heights impart more kinetic and potential energies to water bodies for wave generation. In contrast, the inverse relation between the number of fragments and wave amplitude proposes a potential threshold effect in which initial fragmentation contributes to wave formation, whereas excessive fragments contribute to energy dissipation owing to increased turbulence. The sensitivity analysis further quantified the effect of these parameters, classifying cliff height as a major contributing factor in wave amplitude variations, followed by impact velocity, number of fragments, water depth, and mass of cliff. The strong influence of cliff height indicates its direct effect in determining the potential energy for wave generation. Moreover, the larger sensitivity value of fragments regardless of their inverse parametric relation shows a complex relation, where fragment count plays a considerable but context-dependent role in wave generation and propagation. The dominance of cliff height, impact velocity, and fragment count suggests that these parameters should be prioritized in future prediction models. These findings are important for developing predictive models for wave generations due to rotational cliff collapse.
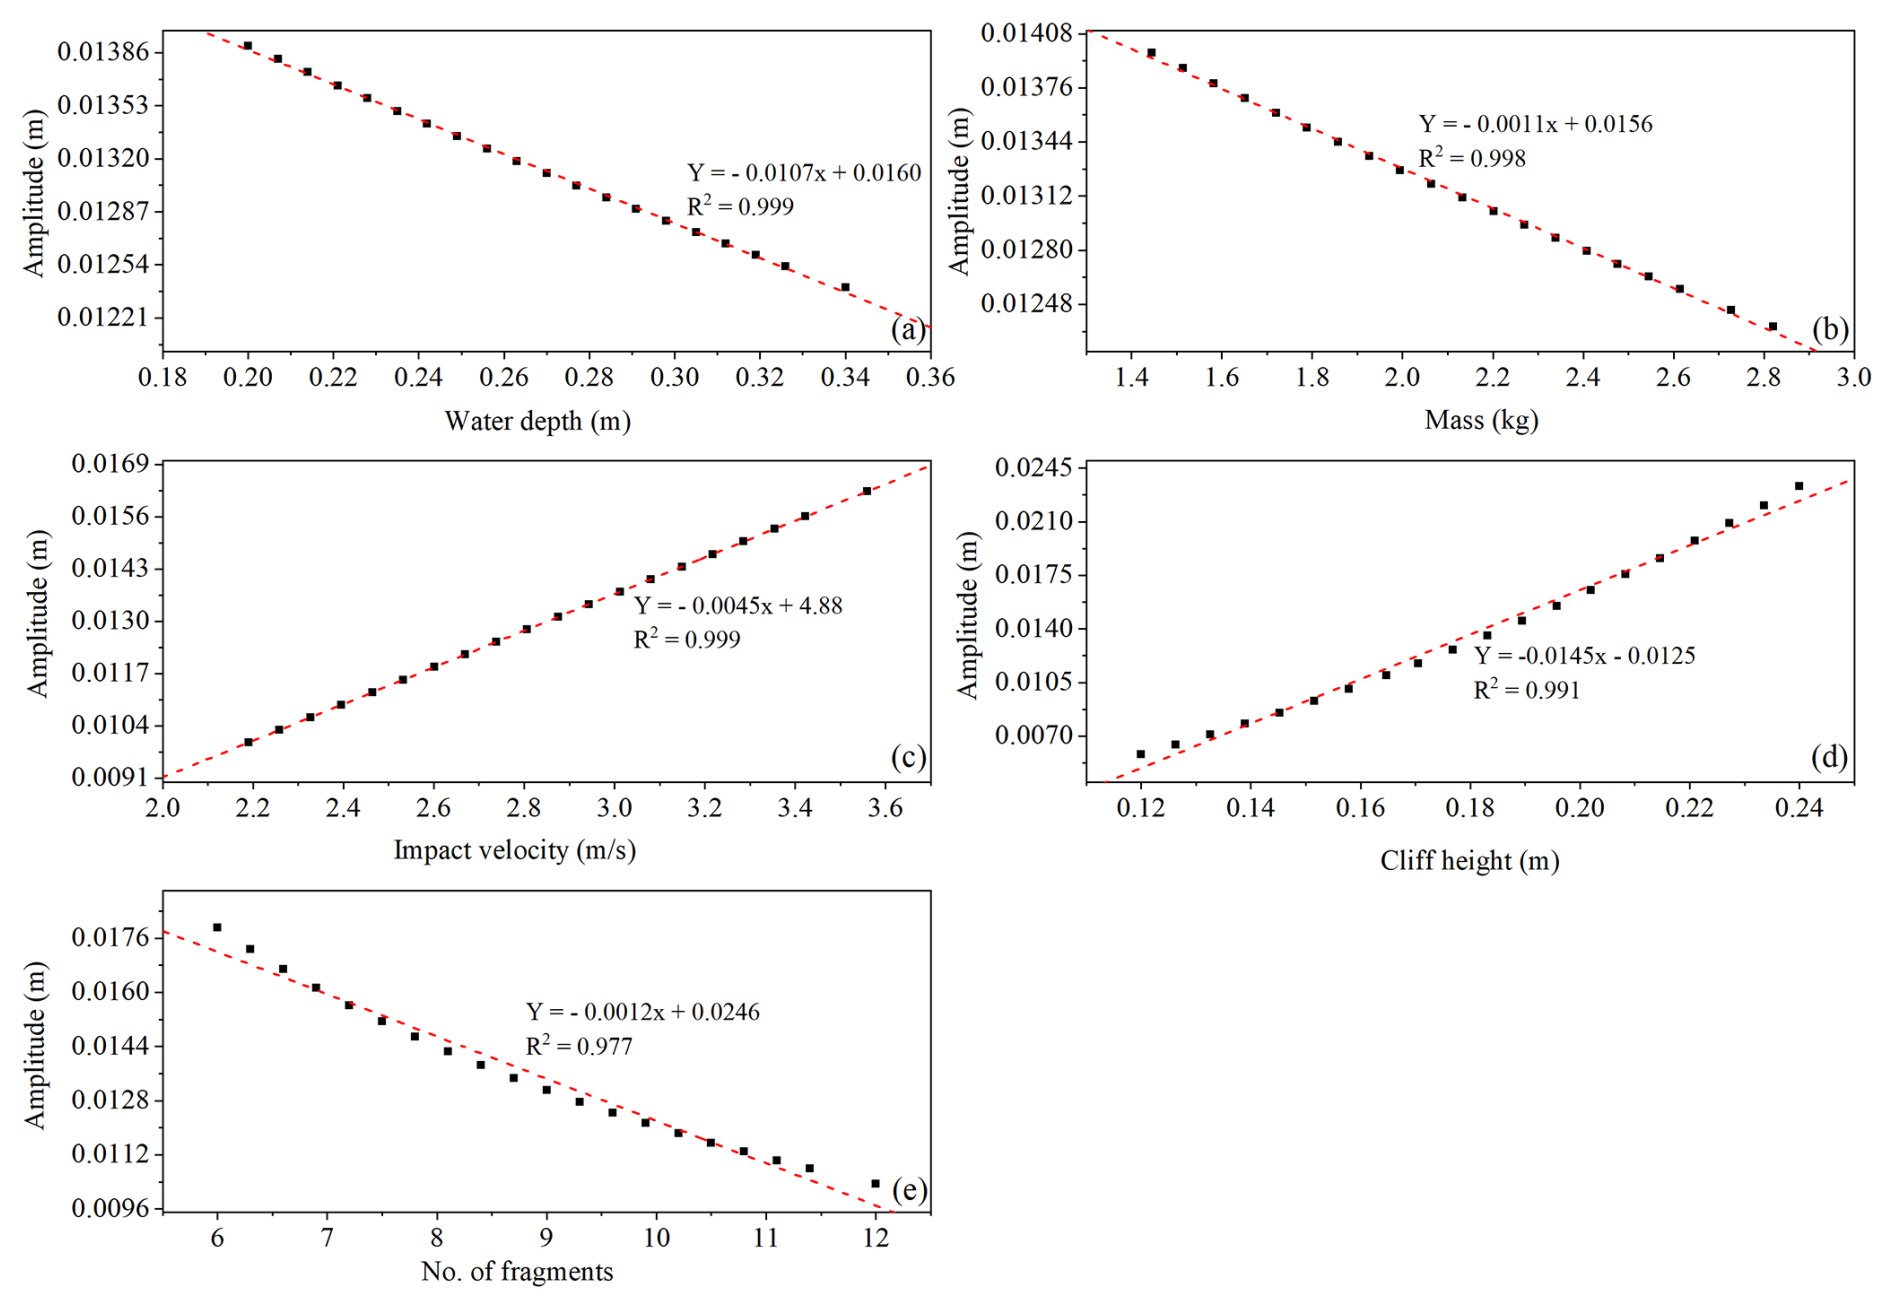
Figure 18Parametric analysis for wave amplitude (a) water depth, (b) cliff mass, (c) impact velocity, (d) cliff height, (e) number of fragments.
The developed model for wave amplitude provides valuable insights into fundamental physics governing wave formation and propagation induced because of rotational cliff collapse. The strong height dependence of the model confirms the classical principle of conservation of potential energy, whereas the fragment count dependence reveals energy partitioning mechanisms. The results of performance indices and sensitivity, and parametric analysis increase our understanding of how geometric and dynamic characteristics govern the wave characteristics, with relevance to hazard assessment and disaster mitigation in coastal regions prone to cliff collapse following rotational motion.
The results of the parametric analysis for wave runup are presented in Fig. 19. It can be observed from Fig. 19a and e that as the water depth and bank slope angle increase, the wave runup decreases, due to energy dissipation and different wave breaking dynamics. Conversely, as the cliff mass, cliff height, and impact velocity increase, the wave runup increases, as greater kinetic energy and inertia impart greater uprush. Notably, all the parameters present a strong correlation with the runup (more than 97 %), highlighting their statistical significance. The results agree with the general physics laws, where mild slopes and larger impact forces result in higher runups, whereas deep waters attenuate wave energy.
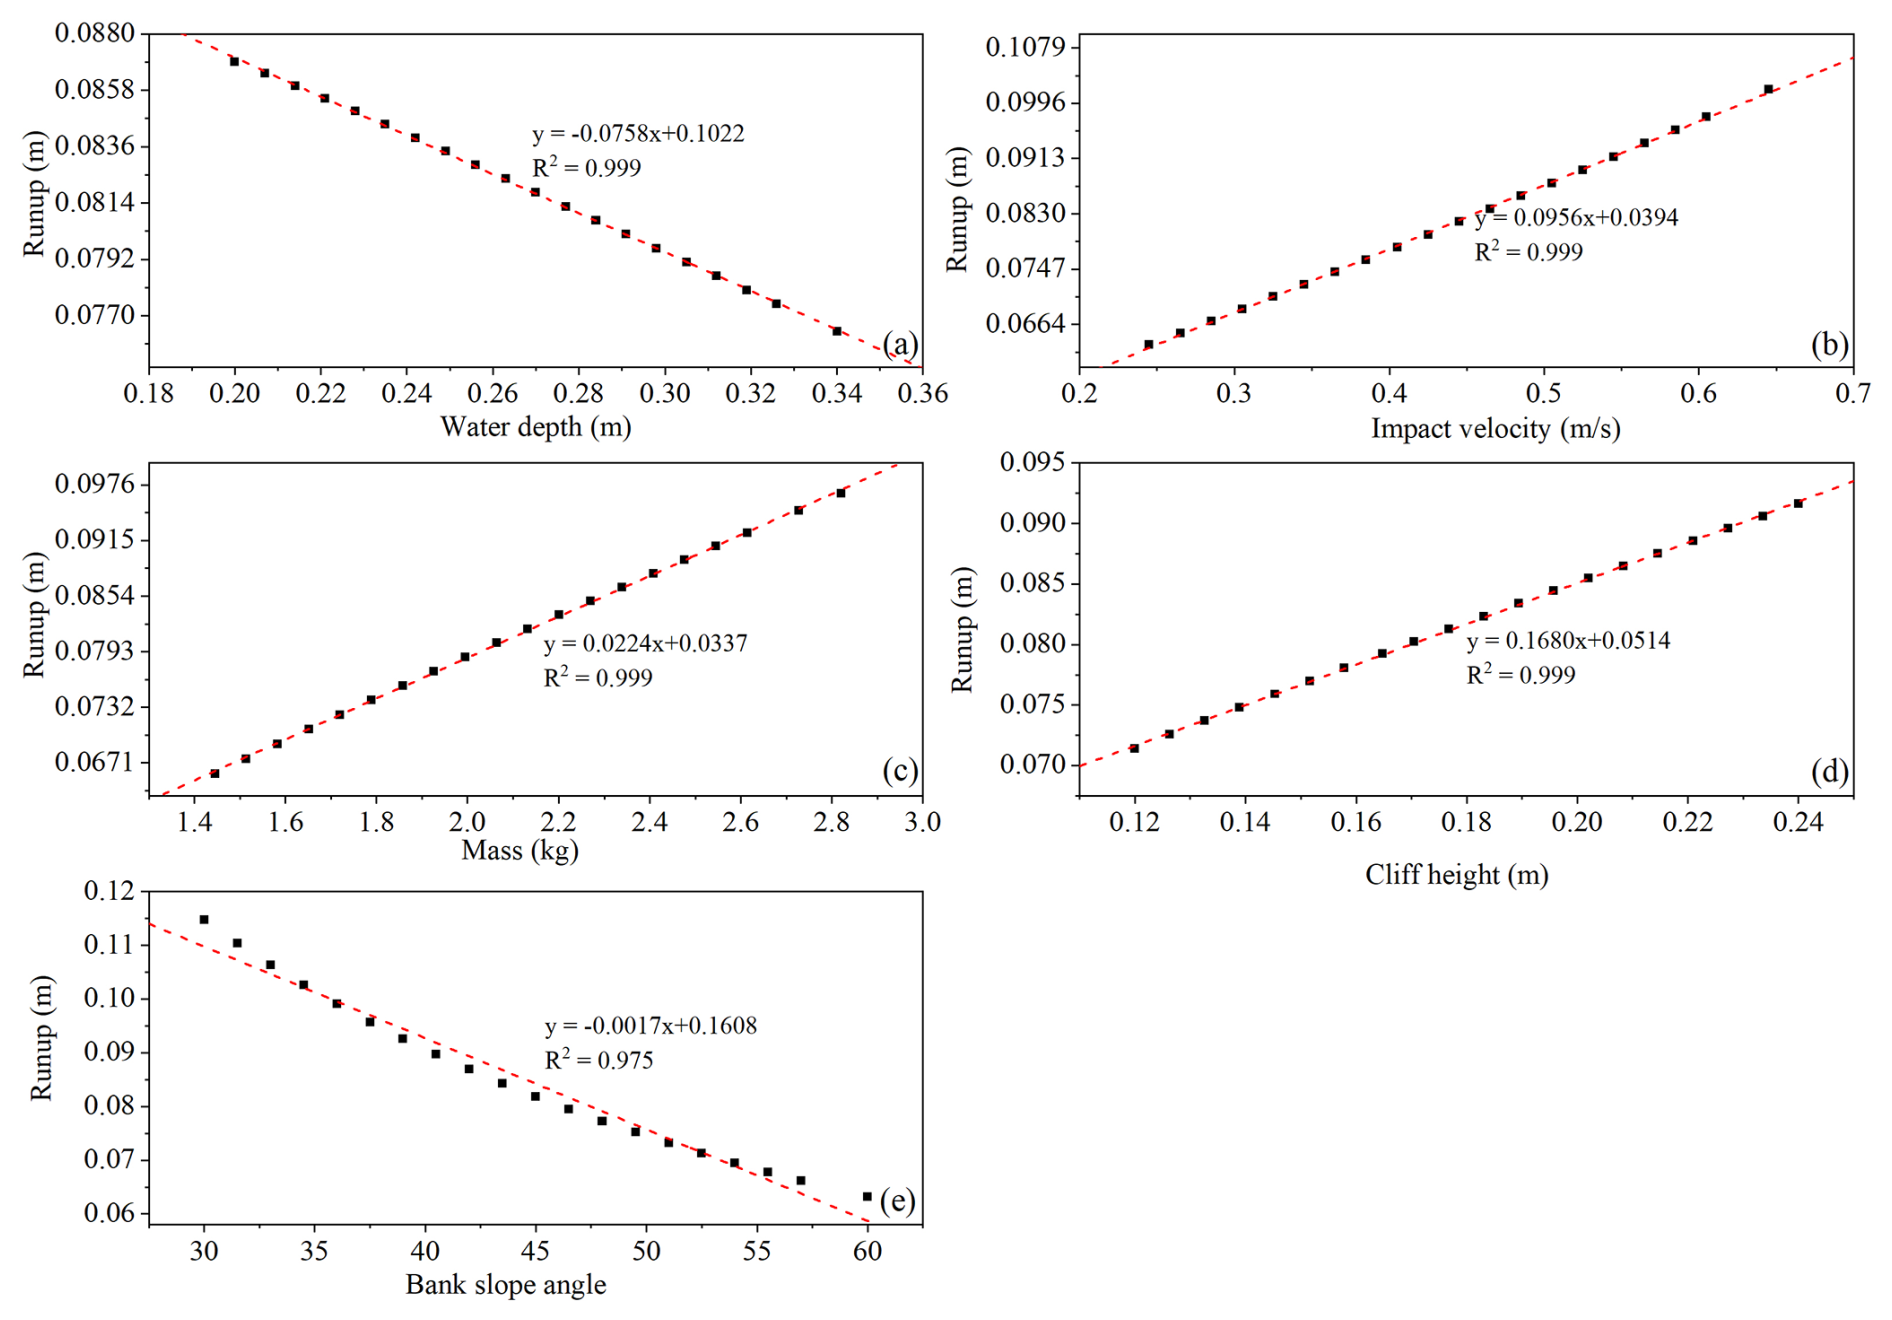
Figure 19Parametric analysis for wave runup (a) water depth, (b) impact velocity, (c) mass of the cliff, (d) cliff height, (e) bank slope angle.
An important observation from parametric analysis of wave amplitude and runup, as shown in Figs. 18b and 19c, indicates that cliff mass represents a nonlinear relation with wave amplitude and a linear relation with runup. This is due to the fact that the variations in wave amplitude are governed by a nonlinear energy dissipation, where hydrodynamic forces follow a quadratic dependence on the velocity. In the case of light cliff collapses, the dynamic responses result in complex absorption and distribution, whereas heavier cliff collapses promote wave reflection along with nonlinear effects of wave breaking and splash-induced turbulence, as can be observed in Fig. 5b, e, and h. Conversely, the wave runup exhibits a linear relation with cliff mass, and this is due to the law of conservation of momentum, such that the resisting inertial force is directly proportional to cliff mass. The greater resistance to motion of heavier cliffs allows more energy to be conserved and utilized for higher wave runups before dissipation. The main difference between the two trends is that the wave amplitude is controlled by localized energy losses, whereas runup is governed by bulk momentum transfer rather than localized losses.
While designing wave protection structures along the banks of reservoirs, it is common to use the empirical relations developed for granular flows, i.e., landslides and avalanches, to predict the amplitude and runup of the waves. However, the waves induced by various types of slides behave differently and should be treated accordingly. The dynamics of the waves induced by falling cliffs are entirely different from the waves induced by continuous granular flows. Similarly, the dynamics of the waves induced by falling cliffs following different types of motion (translational, rotational) are also different. This study aimed to develop a novel wave amplitude and runup prediction model for waves induced by rotational fall of the cliff using a combination of seven governing parameters, and then compare it with the dynamics of the wave induced by continuous granular flows. Based on the results and discussions, the study concludes as follows,
It was concluded that water depth strongly controls the shape of the induced splash and wave amplification. Shallow water induced elongated, tall splashes, and higher wave amplitudes; in contrast, deep water produced mushroom-shaped splashes with higher energy dissipation and lower wave amplitudes.
The higher values of Froude number (>1.2) for all the experiments indicate that the viscous effects were negligible, so the Froude number was selected as the most suitable dynamic scaling factor for describing the behaviour of the waves.
The wave amplitude was greatly influenced by cliff height (51 %), number of fragments (22 %), Impact velocity (18 %), cliff mass (4.69 %), and water depth (4.36 %). Whereas the wave runup was governed by the runup slope angle, impact velocity, and cliff mass.
The amplitude of the wave induced by equivalent granular mass sliding on a 30° slope was 28 %–42 % lower than the waves induced by rotational cliff collapse, thus concluding that the mode of energy transfer to the water body plays a critical role in wave dynamics.
A novel MEP-based prediction model was developed for wave amplitude and runup. The model showed great performance during the training and testing stage, and showed high sensitivity to the used parameters, thus confirming its reliability.
Research findings highlight that accurate hazard assessment of the cliff collapse requires models that account for the rotational failure mode and the fragmentation upon impact with the water surface. Traditional granular slide models may result in an underestimation of the initial wave amplitude and energy transferred.
Data will be made available upon reasonable request.
HG wrote the manuscript and performed the experiments, TK performed numerical modeling, XL designed the research, TMS helped in writing the manuscript, YH supervised the project, and ZC helped in conducting experiments.
The contact author has declared that none of the authors has any competing interests.
Publisher's note: Copernicus Publications remains neutral with regard to jurisdictional claims made in the text, published maps, institutional affiliations, or any other geographical representation in this paper. The authors bear the ultimate responsibility for providing appropriate place names. Views expressed in the text are those of the authors and do not necessarily reflect the views of the publisher.
This work was supported by the China Postdoctoral Science Foundation (Grant No. 2024M762420) and the National Natural Science Foundation of China (Grant No. 42120104008).
This research has been supported by the China Postdoctoral Science Foundation (grant no. 2024M762420) and the National Natural Science Foundation of China (grant no. 42120104008).
This paper was edited by Rachid Omira and reviewed by Aiguo Xing and Fazal E. Jalal.
Aidun, C. K. and Clausen, J. R.: Lattice-Boltzmann method for complex flows, Annu. Rev. Fluid Mech., 42, 439–472, https://doi.org/10.1146/annurev-fluid-121108-145519, 2010.
Backbill, J. U., Kothe, D. B., and Zemach, C.: A continuum method for modeling surface tension for Modeling Surface Tension, J. Comput. Phys., 100, 335–354, 1992.
Bougouin, A., Paris, R., and Roche, O.: Impact of Fluidized Granular Flows into Water: Implications for Tsunamis Generated by Pyroclastic Flows, J. Geophys. Res. Solid Earth, 1–17, https://doi.org/10.1029/2019JB018954, 2020.
Boultbee, N., Stead, D., Schwab, J., and Geertsema, M.: The Zymoetz River rock avalanche, June 2002, British Columbia, Canada. Eng. Geol., 83, 76–93, https://doi.org/10.1016/j.enggeo.2005.06.038, 2006.
Bujak, D., Ilic, S., and Mili, H.: Wave Runup Prediction and Alongshore Variability on a Pocket Gravel Beach under Fetch-Limited Wave Conditions, J. Mar. Sci. Eng., https://doi.org/10.3390/jmse11030614, 2023.
Cesario, E., Giampá, S., Baglione, E., Cordrie, L., Selva, J., and Talia, D.: Machine Learning for Tsunami Waves Forecasting Using Regression Trees, Big Data Research, 36, 100452, https://doi.org/10.1016/j.bdr.2024.100452, 2024.
Cheng, J. C. P., Chen, W., Chen, K., and Wang, Q.: Automation in Construction Data-driven predictive maintenance planning framework for MEP components based on BIM and IoT using machine learning algorithms, Autom. Constr., 112, 103087, https://doi.org/10.1016/j.autcon.2020.103087, 2020.
Dai, Z., Li, X., and Lan, B.: Three-Dimensional Modeling of Tsunami Waves Triggered by Submarine Landslides Based on the Smoothed Particle Hydrodynamics Method, J. Mar. Sci. Eng., 11, https://doi.org/10.3390/jmse11102015, 2023.
Das, M. M. and Wiegel, L. R.: Waves Generated by Horizontal Motion of a Wall, Journal of the Waterways, Harbors and Costal Engineering Divison, 98, 49–65, 1972.
Dignan, J., Hayward, M. W., Salmanidou, D., Heidarzadeh, M., and Guillas, S.: Probabilistic Landslide Tsunami Estimation in the Makassar Strait, Indonesia, Using Statistical Emulation, Earth and Space Science, 10, https://doi.org/10.1029/2023EA002951, 2023.
Esposti Ongaro, T., de' Michieli Vitturi, M., Cerminara, M., Fornaciai, A., Nannipieri, L., Favalli, M., Calusi, B., Macías, J., Castro, M. J., Ortega, S., González-Vida, J. M., and Escalante, C.: Modeling Tsunamis Generated by Submarine Landslides at Stromboli Volcano (Aeolian Islands, Italy): A Numerical Benchmark Study, Front Earth Sci. (Lausanne), 9, https://doi.org/10.3389/feart.2021.628652, 2021.
Franci, A., Cremonesi, M., Perego, U., Crosta, G., and Oñate, E.: 3D simulation of Vajont disaster, Part 1: Numerical formulation and validation, Eng. Geol., 279, 105854, https://doi.org/10.1016/j.enggeo.2020.105854, 2020.
Franco, A., Moernaut, J., Schneider-Muntau, B., Strasser, M., and Gems, B.: The 1958 Lituya Bay tsunami – pre-event bathymetry reconstruction and 3D numerical modelling utilising the computational fluid dynamics software Flow-3D, Nat. Hazards Earth Syst. Sci., 20, 2255–2279, https://doi.org/10.5194/nhess-20-2255-2020, 2020.
Fritz, H., Hager, W., and Minor, H.: Near field characteristics of landslide generated impulse waves, J. Waterway Port Coastal and Ocean Eng., 130, 287–302, 2004.
Fritz, H. M., Hager, W. H., and Minor, H. E.: Landslide generated impulse waves., 1. Instantaneous flow fields, Exp. Fluids., 35, 505–519, https://doi.org/10.1007/s00348-003-0659-0, 2003.
Gardezi, H., Ikrama, M., Usama, M., Iqbal, M., Jalal, F. E., Hussain, A., and Li, X.: Predictive modeling of rutting depth in modified asphalt mixes using gene-expression programming (GEP): A sustainable use of RAP, fly ash, and plastic waste, Constr. Build. Mater., 443, 137809, https://doi.org/10.1016/j.conbuildmat.2024.137809, 2024.
Grilli, S. T., Tappin, D. R., Carey, S., Watt, S. F. L., Ward, S. N., Grilli, A. R., Engwell, S. L., Zhang, C., Kirby, J. T., Schambach, L., and Muin, M.: Modelling of the tsunami from the December 22, 2018 lateral collapse of Anak Krakatau volcano in the Sunda Straits, Indonesia. Sci. Rep., 9, 1–13, https://doi.org/10.1038/s41598-019-48327-6, 2019.
Guan, X. and Shi, H.: Translational momentum of deformable submarine landslides off a slope, J. Fluid Mech., 960, 1–41, https://doi.org/10.1017/jfm.2023.177, 2023.
Gylfadóttir, S. S., Kim, J., Helgason, J. K., Brynjólfsson, S., Höskuldsson, Á., Jóhannesson, T., Harbitz, C. B., and Løvholt, F.: The 2014 Lake Askja rockslide-induced tsunami: Optimization of numerical tsunami model using observed data, J. Geophys. Res. Oceans, 122, 4110–4122, https://doi.org/10.1002/2016JC012496, 2017.
Heidarzadeh, M., Ishibe, T., Sandanbata, O., Muhari, A., and Wijanarto, A. B.: Numerical modeling of the subaerial landslide source of the 22 December 2018 Anak Krakatoa volcanic tsunami, Indonesia. Ocean Engineering, 195, 106733, https://doi.org/10.1016/j.oceaneng.2019.106733, 2020.
Heller, V.: Landslide Generated Impulse Waves: Prediction of Near Field Characteristics, Doctoral dissertation, ETH Zurich, https://doi.org/10.3929/ethz-a-005512384, 2007.
Heller, V. and Spinneken, J.: Improved landslide-tsunami prediction: Effects of block model parameters and slide model, J. Geophys. Res. Oceans, 118, 1489–1507, https://doi.org/10.1002/jgrc.20099, 2013.
Heller, V. and Spinneken, J.: On the effect of the water body geometry on landslide-tsunamis: Physical insight from laboratory tests and 2D to 3D wave parameter transformation, Coastal Engineering, 104, 113–134, https://doi.org/10.1016/j.coastaleng.2015.06.006, 2015.
Heller, V., Attili, T., Chen, F., Gabl, R., and Wolters, G.: Large-scale investigation into iceberg-tsunamis generated by various iceberg calving mechanisms, Coast. Eng., 163, 103745, https://doi.org/10.1016/j.coastaleng.2020.103745, 2021.
Higman, B., Shugar, D. H., Stark, C. P., Ekström, G., Koppes, M. N., Lynett, P., Dufresne, A., Haeussler, P. J., Geertsema, M., Gulick, S., Mattox, A., Venditti, J. G., Walton, M. A. L., McCall, N., Mckittrick, E., MacInnes, B., Bilderback, E. L., Tang, H., Willis, M. J., Richmond, B., Reece, R. S., Larsen, C., Olson, B., Capra, J., Ayca, A., Bloom, C., Williams, H., Bonno, D., Weiss, R., Keen, A., Skanavis, V., and Loso, M.: The 2015 landslide and tsunami in Taan Fiord, Alaska, Sci. Rep., 8, 1–12, https://doi.org/10.1038/s41598-018-30475-w, 2018.
Hirt, C. W. and Nichols, B. D.: Volume of Fluid (VOF) Method for the Dynamics of Free Boundaries, J. Comput. Phys., 225, 201–225, 1981.
Huber, A. and Hager, W.: Forecasting impulse waves in reservoirs, in: Proc. 19th Congrès des Grands Barrages, Florence C.31:993-1005, ICOLD, Paris, 1997.
Kamphuis, J. and Bowering, R.: Impulse waves generated by landslides, in: Coastal Engineering Proceedings, 1, 35, https://doi.org/10.9753/icce.v12.35, 1970.
Khan, K., Ashfaq, M., Iqbal, M., Khan, M. A., Amin, M. N., Shalabi, F. I., Faraz, M. I., and Jalal, F. E.: Multi Expression Programming Model for Strength Prediction of Fly-Ash-Treated Alkali-Contaminated Soils, Materials, 15, https://doi.org/10.3390/ma15114025, 2022.
Kim, G. B., Cheng, W., Sunny, R. C., Horrillo, J. J., McFall, B. C., Mohammed, F., Fritz, H. M., Beget, J., and Kowalik, Z.: Three Dimensional Landslide Generated Tsunamis: Numerical and Physical Model Comparisons, Landslides, 17, 1145–1161, https://doi.org/10.1007/s10346-019-01308-2, 2020.
Kubota, Y. and Mochizuki, O.: Splash Formation by a Spherical Body Plunging into Water, J. Vis (Tokyo) 12, 339–346, 2009.
Li, Y., Ding, Y., Yang, L., Liu, X., and Liu, Y.: A prediction model for the rockslide-generated wave amplitude under the condition of bedrock mass breakup, Ocean Engineering, 272, 113845, https://doi.org/10.1016/j.oceaneng.2023.113845, 2023.
Li, Y., Peng, T., Xiao, L., Wei, H., and Li, X.: Wave runup prediction for a semi-submersible based on temporal convolutional neural network, Journal of Ocean Engineering and Science, 9, 528–540, https://doi.org/10.1016/j.joes.2022.08.005, 2024.
Lindstrøm, E. K.: Waves generated by subaerial slides with various porosities, Coastal Engineering, 116, 170–179, https://doi.org/10.1016/j.coastaleng.2016.07.001, 2016.
Lindstrøm, E. K., Pedersen, G. K., Jensen, A., and Glimsdal, S.: Experiments on slide generated waves in a 1:500 scale fjord model, Coastal Engineering, 92, 12–23, https://doi.org/10.1016/j.coastaleng.2014.06.010, 2014.
Lipiejko, N., Whittaker, C. N., Lane, E. M., and Power, W. L.: Wave Generation by Fluidized Granular Flows: Experimental Insights Into the Maximum Near-Field Wave Amplitude, J. Geophys. Res. Oceans, https://doi.org/10.1029/2022JC019583, 2023.
Liu, J., Heller, V., Wang, Y., and Yin, K.: Investigation of subaerial landslide–tsunamis generated by different mass movement types using smoothed particle hydrodynamics, Eng. Geol., 352, https://doi.org/10.1016/j.enggeo.2025.108055, 2025.
Liu, M. B. and Liu, G. R.: Smoothed Particle Hydrodynamics (SPH): an Overview and Recent Developments, Archives of Computational Methods in Engineering, 17, 25–76, https://doi.org/10.1007/s11831-010-9040-7, 2010.
Maciel, G. D. F., Pereira, J. B., Sáo, Y. T., Ferreira, F. D. O., and Ferreira, L. G.: Impulse wave in the Brazilian Lake of Capitólio, RBRH 28, https://doi.org/10.1590/2318-0331.282320230036, 2023.
McFall, B. C. and Fritz, H. M.: Physical modelling of tsunamis generated by three-dimensional deformable granular landslides on planar and conical island slopes, Proceedings of the Royal Society A: Mathematical, Physical and Engineering Sciences, 472, https://doi.org/10.1098/rspa.2016.0052, 2016.
Miller, D. J.: Giant waves in Lituya Bay, Alaska, Geological Survey Professional Paper No. 354 C, US Governement Printing Office, Washington, DC, USA, 51–86, https://doi.org/10.1785/BSSA0500020253, 1960.
Mohammed, F. and Fritz, H. M.: Physical modeling of tsunamis generated by three-dimensional deformable granular landslides, J. Geophys. Res. Oceans, 117, 1–20, https://doi.org/10.1029/2011JC007850, 2012.
Monaghan, J. J.: Simulating free surface flows with SPH, J. Comput. Phys., 110, 399–406, 1994.
Montagna, F., Bellotti, G., Di and Risio, M.: 3D numerical modeling of landslide-generated tsunamis around a conical island, Natural Hazards, 58, 591–608, https://doi.org/10.1007/s11069-010-9689-0, 2011.
Mulligan, R. P., Franci, A., Celigueta, M. A., and Take, W. A.: Simulations of Landslide Wave Generation and Propagation Using the Particle Finite Element Method, J. Geophys. Res. Oceans, 125, 1–17, https://doi.org/10.1029/2019JC015873, 2020.
Myrhaug, D. and Lader, P. F.: Random wave-induced current in shallow water using deep water wind and wave statistics, Maritime Engineering, 174, 1–20, 2019.
Noda, E.: Water waves generated by landslides, J. Water Port Coastal Ocean Div., Am Soc. Civ. Eng., 96, 835–855, 1970.
Panizzo, A., De Girolamo, P., and Petaccia, A.: Forecasting impulse waves generated by subaerial landslides, J. Geophys. Res. Oceans, 110, 1–23, https://doi.org/10.1029/2004JC002778, 2005.
Paris, A., Heinrich, P., and Abadie, S.: Landslide tsunamis: Comparison between depth-averaged and Navier–Stokes models, Coastal Engineering, 170, 104022, https://doi.org/10.1016/j.coastaleng.2021.104022, 2021.
Rauter, M., Viroulet, S., Gylfadóttir, S. S., Fellin, W., and Løvholt, F.: Granular porous landslide tsunami modelling – the 2014 Lake Askja flank collapse, Nat. Commun., 13, https://doi.org/10.1038/s41467-022-28296-7, 2022.
Ró, G. and Cerkowniak, G.: Soft postglacial cliffs in Poland under climate change, Oceanologia, 66, https://doi.org/10.1016/j.oceano.2024.01.003, 2024.
Romano, A., Lara, J. L., Barajas, G., Di Paolo, B., Bellotti, G., Di Risio, M., Losada, I. J., and De Girolamo, P.: Tsunamis Generated by Submerged Landslides: Numerical Analysis of the Near-Field Wave Characteristics, J. Geophys. Res. Oceans, 125, 1–26, https://doi.org/10.1029/2020JC016157, 2020.
Romano, A., Lara, J. L., Barajas, G., Losada, and Í. J.: Numerical modeling of tsunamis generated by granular landslides in OpenFOAM®: A Coulomb viscoplastic rheology, Coastal Engineering, 186, 104391, https://doi.org/10.1016/j.coastaleng.2023.104391, 2023.
Romano, M., Romano, M., Liong, S., Vu, M. T., Zemskyy, P., Doan, C. D., Dao, M. H., and Tkalich, P.: Artificial neural network for tsunami forecasting, J. Asian. Earth Sci., 36, 29–37, https://doi.org/10.1016/j.jseaes.2008.11.003, 2009.
Ruffini, G., Heller, V., and Briganti, R.: Numerical modelling of landslide-tsunami propagation in a wide range of idealised water body geometries, Coastal Engineering, 153, 103518, https://doi.org/10.1016/j.coastaleng.2019.103518, 2019.
Sælevik, G., Jensen, A., and Pedersen, G.: Experimental investigation of impact generated tsunami; related to a potential rock slide, Western Norway, Coastal Engineering, 56, 897–906, https://doi.org/10.1016/j.coastaleng.2009.04.007, 2009.
Sun, S. W., Wen, Q., do Carmo Reis Cavalcanti, M., Yang, X. R., and Wang, J. Q.: Numerical and laboratory experiments on the toppling behavior of a massive single block: a case study of the Furnas Reservoir, Brazil, Landslides, 21, 2327–2347, https://doi.org/10.1007/s10346-024-02288-8, 2024.
Svennevig, K., Hicks, S. P., Forbriger, T., Lecocq, T., Widmer-Schnidrig, R., Mangeney, A., Hibert, C., Korsgaard, N. J., Lucas, A., Satriano, C., Anthony, R. E., Mordret, A., Schippkus, S., Rysgaard, S., Boone, W., Gibbons, S. J., Cook, K. L., Glimsdal, S., Løvholt, F., Van Noten, K., Assink, J. D., Marboeuf, A., Lomax, A., Vanneste, K., Taira, T., Spagnolo, M., De Plaen, R., Koelemeijer, P., Ebeling, C., Cannata, A., Harcourt, W. D., Cornwell, D. G., Caudron, C., Poli, P., Bernard, P., Larose, E., Stutzmann, E., Voss, P. H., Lund, B., Cannavo, F., Castro-Díaz, M. J., Chaves, E., Dahl-Jensen, T., De Pinho Dias, N., Déprez, A., Develter, R., Dreger, D., Evers, L. G., Fernández-Nieto, E. D., Ferreira, A. M. G., Funning, G., Gabriel, A. A., Hendrickx, M., Kafka, A. L., Keiding, M., Kerby, J., Khan, S. A., Dideriksen, A. K., Lamb, O. D., Larsen, T. B., Lipovsky, B., Magdalena, I., Malet, J. P., Myrup, M., Rivera, L., Ruiz-Castillo, E., Wetter, S., and Wirtz, B.: A rockslide-generated tsunami in a Greenland fjord rang Earth for 9 d, Science (1979), 385, 1196–1205, https://doi.org/10.1126/science.adm9247, 2024.
Tarwidi, D., Redjeki, S., Adytia, D., and Apri, M.: MethodsX An optimized XGBoost-based machine learning method for predicting wave run-up on a sloping beach, MethodsX, 10, 102119, https://doi.org/10.1016/j.mex.2023.102119, 2023.
Tian, L., Lei, J., Mao, P., and Xie, W.: Landslide-Induced Wave Run-Up Prediction Based on Large-Scale Geotechnical Experiment: A Case Study of Wangjiashan Landslide Area of Baihetan Reservoir, China, Water (Basel), 17, 304, https://doi.org/10.3390/w17030304, 2025.
Tryggvason, G., Bunner, B., Esmaeeli, A., Juric, D., Al-Rawahi, N., Tauber, W., Han, J., Nas, S., and Jan, Y. J.: A Front-Tracking Method for the Computations of Multiphase Flow, J. Comput. Phys., 169, 708–759, https://doi.org/10.1006/jcph.2001.6726, 2001.
Usama, M., Gardezi, H., Jalal, F. E., Ali Rehman, M., Javed, N., Janjua, S., and Iqbal, M.: Predictive modelling of compression strength of waste GP/FA blended expansive soils using multi-expression programming, Constr. Build. Mater., 392, 131956, https://doi.org/10.1016/j.conbuildmat.2023.131956, 2023.
Wang, J., Ward, S. N., and Xiao, L.: Numerical simulation of the December 4, 2007 landslide-generated tsunami in Chehalis Lake, Canada, Geophys. J. Int., 201, 372–376, https://doi.org/10.1093/gji/ggv026, 2015.
Wang, W., Chen, G., Yin, K., Wang, Y., Zhou, S., and Liu, Y.: Modeling of landslide generated impulsive waves considering complex topography in reservoir area, Environ. Earth Sci., 75, 1–15, https://doi.org/10.1007/s12665-016-5252-y, 2016.
Wang, Y., Liu, J., Li, D., and Yan, S.: Optimization model for maximum tsunami amplitude generated by riverfront landslides based on laboratory investigations, Ocean Engineering, 142, 433–440, https://doi.org/10.1016/j.oceaneng.2017.07.030, 2017.
Watts, P.: Wavemaker curves for tsunamis generated by underwater landslides. J. Waterw. Port, Coast. Ocean Eng., 124, https://doi.org/10.1061/(ASCE)0733-950X(1998)124:3(127), 1998.
Wiguna, E. A.: Development of Real-Time Tsunami Early Warning System Dashboard Based on Tunami-F1 and Machine Learning in Sunda Arc, Indonesia, in: 2022 IEEE Ocean Engineering Technology and Innovation Conference: Management and Conservation for Sustainable and Resilient Marine and Coastal Resources (OETIC), IEEE, 23–29, https://doi.org/10.1109/OETIC57156.2022.10176243, 2022.
Wu, Y., Liu, L.-F. P., Hwang, K., and Hwung, H.-H.: A unified runup formula for breaking solitary waves on a uniform beach, in: Costal Engineering Proceedings, https://doi.org/10.9753/icce.v36.currents.3, 2018.
Wunnemann, K. and Weiss, R.: The meteorite impact-induced tsunami hazard, Philosophical Transactions, https://doi.org/10.1098/rsta.2014.0381, 2015.
Yang, X. and Kong, S.: 3D Simulation of Drop Impact on Dry Surface, Int. J. Comput. Methods, 15, 1–23, https://doi.org/10.1142/S0219876218500111, 2018.
Yarkoni, T. and Westfall, J.: Choosing prediction over explanation in psychology: lessons from machine learning, Prospect Psychol. Science, 12, 1100–1122, https://doi.org/10.1177/1745691617693393, 2019.
Yin, Y., Huang, B., Liu, G., and Wang, S.: Potential risk analysis on a Jianchuandong dangerous rockmass-generated impulse wave in the Three Gorges Reservoir, China. Environ. Earth Sci., 74, 2595–2607, https://doi.org/10.1007/s12665-015-4278-x, 2015.
Young, A. P., Guza, R. T., Matsumoto, H., Merri, M. A., Reilly, W. C. O., and Swirad, Z. M.: Geomorphology Three years of weekly observations of coastal cliff erosion by waves and rainfall Mean Profile Change (m), Geomorphology, 375, https://doi.org/10.1016/j.geomorph.2020.107545, 2021.