
the Creative Commons Attribution 4.0 License.
the Creative Commons Attribution 4.0 License.
 | 31 Jul 2026
Impact of warming on rainfall changes in damaging Philippine typhoons using high-resolution convection-permitting models
Rafaela Jane Delfino
Gerry Bagtasa
Pier Luigi Vidale
Kevin Hodges
This study has investigated the changes in tropical cyclone (TC)-associated precipitation in the Philippines under past (pre-industrial) and future climate scenarios using the pseudo-global warming (PGW) technique and dynamical downscaling. The novelty of this work is in the use of high-resolution PGW simulations (3 and 5 km) and a multiple-experimental approach to directly quantify TC precipitation changes over the Philippines, as well as the decomposition of TC rainfall changes in thermodynamic and dynamic contributions. Future climate simulations project a significant increase in TC precipitation, consistent with Clausius-Clapeyron (CC) scaling expectations. However, small deviations from this expected scaling are noted, attributed to factors such as increased TC intensity and atmospheric warming. The simulated TC precipitation in the past climate is found to be lower than that in the current climate, with inner-core precipitation increases of ∼ 6 %–8 % from past to present conditions. Under future warming (SSP5-8.5), simulations indicate robust increases in TC rainfall rates for intense TCs such as Haiyan (2013), Bopha (2012), and Mangkhut (2018), with strongest amplification in the inner-core region. Extreme rainfall increases disproportionately (locally exceeding 30 %–40%), indicating a shift toward short-duration, high-intensity rainfall events rather than uniform rainfall enhancement. However, our results show that this increase is primarily driven by thermodynamic effects (≈ 20 %–30 %), while dynamical contributions are smaller (≈ −10 % to −30 %) and often partially offset the total rainfall response. Overall, the results demonstrate that TC rainfall scaling in a warming climate is primarily moisture-driven, with TC case-to-case dynamics modulating the TC associated rainfall response. Our study underscores that variations in TC intensity and structure play a crucial role in influencing the scaling relationship between sea surface temperatures and TC-associated precipitation in the Philippines.
- Article
(9907 KB) - Full-text XML
-
Supplement
(504 KB) - BibTeX
- EndNote


Tropical cyclones (TCs) make significant rainfall contributions in the Philippines (Bagtasa, 2017, 2022) and are a major source of freshwater (Ribera et al., 2005; Kubota and Chan, 2009; Yumul et al., 2012). The study of Kubota and Wang (2009) and Bagtasa (2017) showed that TC-induced precipitation (determined over a radial distance of 1000 km from TC centers) in certain regions of the Philippines contributes to more than 50 % of the annual total precipitation. TC precipitation rates are projected to increase with global warming, which will consequently exacerbate TC-associated floods and landslide risks (Knutson et al., 2021; Walsh et al., 2019; Liu et al., 2019). The Intergovernmental Panel on Climate Change (IPCC) 6th Assessment Report (AR6) has concluded that it is very likely that average TC rain rates will increase with warming, and peak TC rainfall rates will likely exceed the Clausius-Clapeyron scaling (CCS) rates in some regions (IPCC, 2021). In a multi-model assessment, Knutson et al. (2020) projected that TC rainfall could increase globally by +6 % to +22 % under +2 °C warming. In the Western North Pacific (WNP) Basin, increases of +5 % to +7 % per °C are consistently reported (Cha et al., 2020). Furthermore, an assessment by the Economic and Social Commission for Asia and the Pacific (ESCAP)/World Meteorological Organization (WMO) Typhoon Committee (Cha et al., 2020) found a median increase of 17 % in TC precipitation rates, with a 10th–90th percentile range of +6 % to +24 % in the WNP.
The CCS is commonly used to describe the relationship between air temperature and moisture-bearing capacity of air – about 7 % more water vapor per 1 °C of warming – leading to higher rainfall potential in a warmer world (Trenberth and Shea, 2005; Allen and Ingram, 2002; Held and Soden, 2006). However, TC-associated precipitation may increase at higher rates per degree change in temperature due to dynamical processes, such as increased latent heat fluxes and stronger convergence, which amplify rainfall beyond the thermodynamic expectations (Shi et al., 2024). Empirical studies have supported the application of CCS in explaining increases in TC precipitation (Trenberth et al., 2007; Bhatia et al., 2018). Nonetheless, regional discrepancies have been observed. Kossin (2018) and O'Gorman (2015) noted that observed precipitation changes in certain regions deviate from CCS, likely due to TC dynamics, moisture transport, and local atmospheric circulation.
Recent studies have explored the concept of Super-CCS has emerged in literature, referring to rainfall increases that exceed the expected 7 % per °C of CCS. For example, Liu et al. (2019) reported that average rainfall rates within a 100 km radius from the center of TCs with tropical storm intensity could increase by 13 %–17 % per °C under 21st-century warming. Huprikar et al. (2024) also found that future rainfall associated with Hurricane Irma exceeded CCS expectations. These findings suggest that TC inner-core intensification and structural changes, such as vertical expansion of the eyewall and enhanced updraft, play a critical role in amplifying precipitation beyond the CCS rate. Despite these findings, there is still a limited understanding of whether TC-associated rainfall in the Philippines conforms to CCS or exhibits Super-CCS properties, especially under changing climate conditions where TCs are projected to intensify (Delfino et al., 2023, 2024). While previous studies have examined TC intensity and precipitation changes (Villarini et al., 2014; Patricola and Wehner, 2018; Liu et al., 2019; Xi et al., 2023), detailed analyses that isolate rainfall scaling with warming remain sparse. Recent work by Yang and Toumi (2025) highlighted that the changes in TC rain due to global warming may arise through at least two distinct pathways: thermodynamic effects associated with the increased atmospheric moisture holding capacity and enhanced latent energy availability, and through dynamic effects associated with changes in TC circulation and vertical motion. Distinguishing between these two is important since thermodynamic forcing may yield very different rainfall characteristics depending on the TC structure and dynamics. As a result, CC scaling alone may not adequately represent event-scale changes in TC rainfall hazards. However, most previous studies have relied on basin-scale composites or coarse-resolution models, and even fewer studies have examined whether the CC scaling hold, and which pathway, applies for individual high-impact TCs in convection-permitting simulations. This study aims to fill this gap by analysing three highly damaging Philippine TCs – Haiyan (2013), Bopha (2012), and Mangkhut (2018) – under pre-industrial, present, and future climates. Applying the pseudo-global warming (PGW) technique, we investigate:
-
How does the TC-associated precipitation in the Philippines change under past and future climate scenarios, and to what extent do these changes align with the expectations of CCS?
-
How do variations in TC intensity and structure influence the scaling relationship between sea surface temperatures and TC-associated precipitation in the Philippines?
-
To what extent can we ascribe these precipitation changes to dynamical versus thermodynamic drivers?
A better understanding of these mechanisms is critical for anticipating current and future flood risks and improving disaster preparedness in the Philippines. The paper continues in Sect. 2 with discussion of the methods, Sect. 3 provides the results and discussion, and Sect. 4 highlights the conclusions.
2.1 Model Configuration
The Advanced Research Weather Research and Forecasting (WRF-ARW) model version 3.8.1 (Skamarock et al., 2008) was used to simulate TCs in the present study. The European Centre for Medium-Range Weather Forecasts (ECMWF) 5th generation Reanalysis dataset (ERA5) was utilized for the initial and lateral boundary conditions with two model domain configurations: (1) a two-way grid nesting of 25 km outer and 5 km inner domains, with the Kain-Fritsch cumulus parameterization (hereafter referred to as 5kmCU) turned on, and (2) a convection-permitting (no cumulus parameterization) single domain 3 km resolution (herafter referred to as 3kmNoCU), to account for the uncertainty in the use of cumulus parametrizations. Both model configurations have 44 vertical levels and use a sigma vertical coordinate from the surface up to the top of the atmosphere at 50 hPa. The details of the other model parameterization schemes (i.e., microphysics, boundary layer, etc.) used can be found in Delfino et al. (2023).
2.2 Experimental Design
Three TC cases are selected based on the region in the Philippines where the TCs made landfall, the month of occurrence, and associated damages – Typhoons Haiyan (2013), Bopha (2012), and Mangkut (2018). More detailed information on these three TC cases is described in Delfino et al. (2023). The three TC cases were simulated with four different initialization times to create an ensemble from a single driving reanalysis, thereby minimizing uncertainties from variations in the initial conditions. For tracking the simulated TCs, the simulated track and intensity values were obtained every 6 h using the TRACK algorithm (Hodges et al., 2017) as used in Hodges and Klingaman (2019) and Delfino et al. (2023).
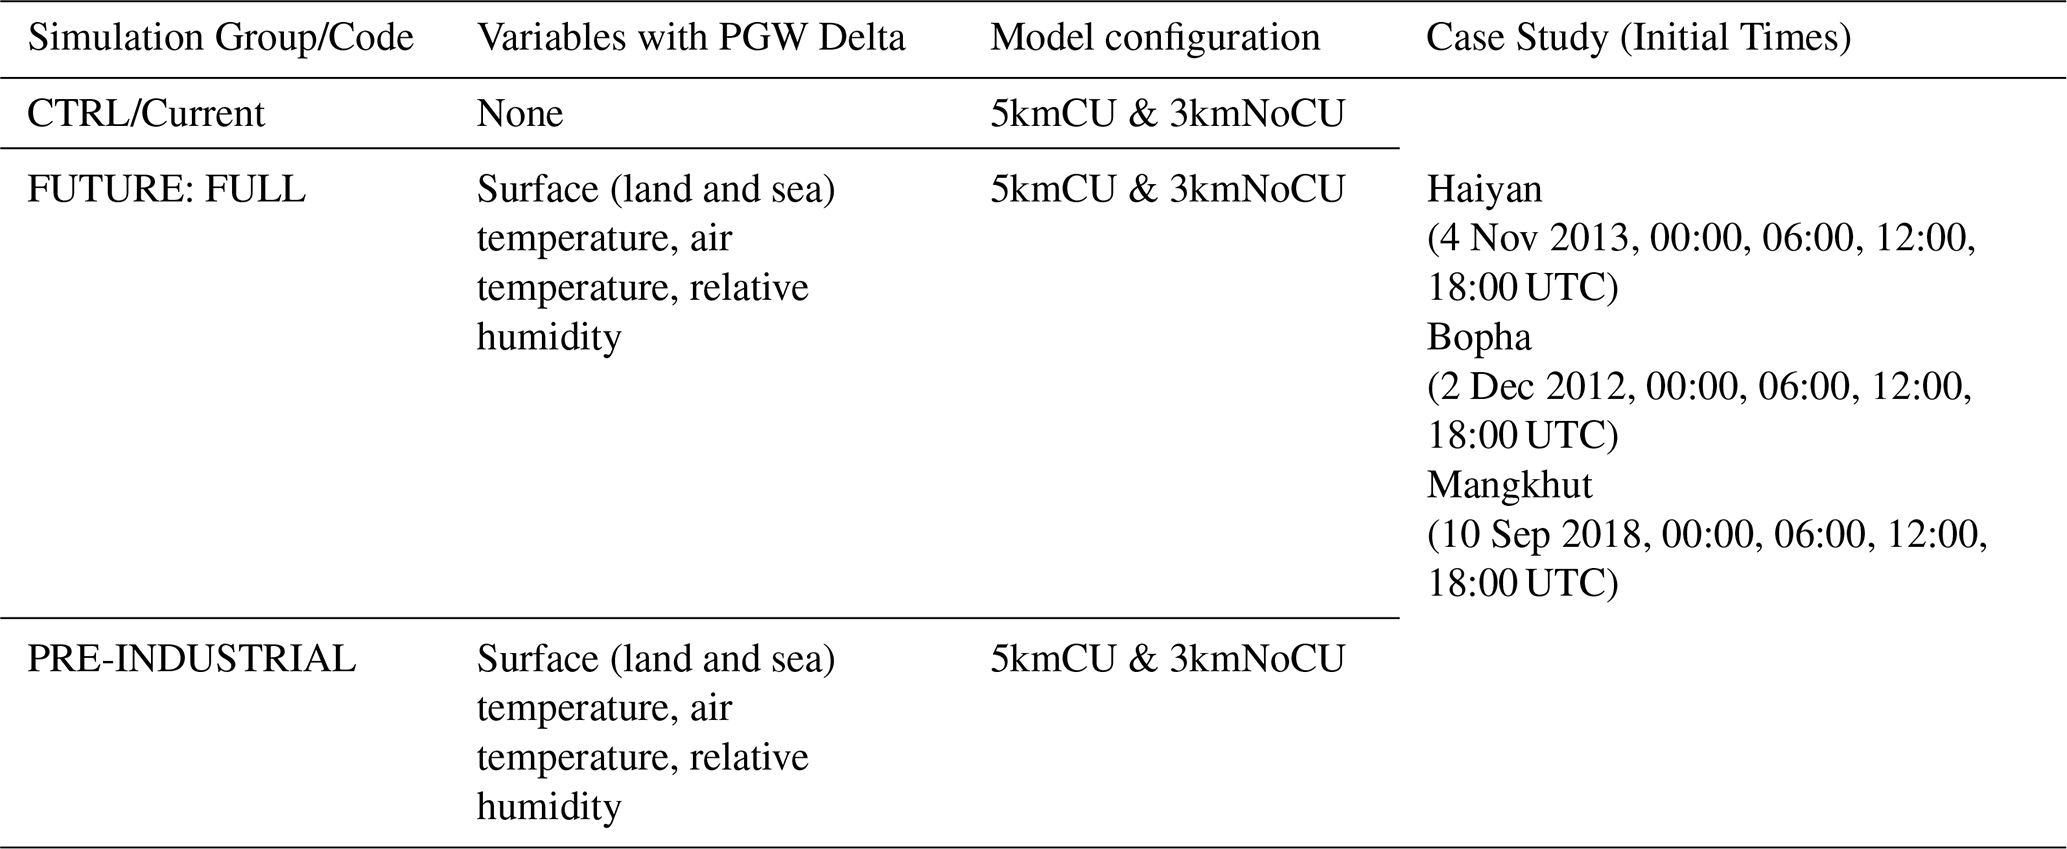
Multi-model datasets from the Coupled Model Intercomparison Project phase 6 (CMIP6) (Eyring et al., 2016) were used to apply the PGW method, introduced by Schär et al. (1996). The PGW technique simulates the same TC cases under pre-industrial, present, and future conditions by perturbing realistic atmospheric states with large-scale climate change signals, which enables a more consistent TC case/event-based comparison and allow a more physically consistent attribution of TC-associated rainfall changes. We simulated the TC cases under different climate conditions by primarily adjusting the following parameters: SST, atmospheric temperature, and relative humidity (RH) between current and future climate conditions. Four CMIP6 models were used to extract the climate change forcing, and results for all ensemble members were averaged for each of the CMIP6 models. The models – HadGEM3-C31-LL, CESM2, MIROC6, MPI-ESM1-2-HR – were chosen to represent different warming levels, under the Shared Socio-economic Pathways (SSP) 5-8.5 scenario. The PGW delta is calculated by subtracting the monthly means (i.e., November for Haiyan, December for Bopha, and September for Mangkhut) of the historical simulations (1970–2000) from the future projected climate (2070–2099) and the pre-industrial climate (1850–1899) The calculated PGW deltas for each variable (surface and atmospheric temperature, surface and sea-level pressure, geopotential height, and relative humidity) were then added to the 6-hourly ERA-5 initial and boundary conditions for the three TC cases to build the PGW conditions. For this study, we have included changes in relative humidity to further understand its effects on TC response (referred to as FULL experiments). Each of the experiments and typhoon cases was initialized at 00:00, 06:00, 12:00, and 18:00 UTC. A more detailed description of the methodology can be found in Delfino et al. (2023).
It is also important to note here that the PGW technique faces challenges related to spin-up and dynamical balance when simulating TCs. Spin-up issues arise because the initial conditions need time to adjust to imposed future climate anomalies, potentially leading to unrealistic results during the adjustment period. Additionally, altering these conditions can disrupt the dynamic balance of the atmospheric system, resulting in inaccuracies in the intensity and behavior of simulated TCs. These issues were explored and addressed in Delfino et al. (2024).
2.3 TC precipitation analysis
2.3.1 TC precipitation rate and total accumulated precipitation
We analysed the TC precipitation rate and total accumulated precipitation during the duration of the simulations. We also investigated the relationships between TC rain rate and TC wind speed, emphasizing how this relationship varies within the TC inner-core region (1° distance from the center). We also analysed the simulated reflectivity rates (in dbz) from the WRF simulations and vertical profiles of the averaged composites over multiple time steps (e.g., average reflectivity during peak intensity hours) of simulated reflectivity over a 1 and 2.5° radius in the forward direction of the storms for the simulations, since TCs typically have the highest precipitation rates and strongest reflectivity in their forward quadrant due to the combined effects of TC motion and cyclonic rotation. By focusing on this region, we can capture the most intense precipitation features and better understand the TC's impact. Reflectivity is particularly useful because it provides insight into the microphysical structure of convection within TCs. Higher reflectivity values typically correspond to deeper and more intense convective cores, which are closely linked to strong updrafts and heavy rainfall production. The profiling is done at peak intensity at height levels between 0 and 18 km, and the radial grid extends to 10° for each simulation.
2.3.2 Thermodynamic and dynamic decomposition on TC rainfall changes
Following Yang and Toumi (2025), the changes in rainfall were decomposed into thermodynamic and dynamic contributions. Analysis was initially done within a 500 km radius from the TC center for key rainfall metrics (as in Yang and Toumi, 2025) – azimuthally averaged maximum rainfall rate (Pm), total rainfall volume, and mean rainfall rate from each grid cells, along with rainfall intensity percentiles (P90, P95, P99). Each of these aspects of rainfall changes was then decomposed based on Yang and Toumi (2025); the total rainfall response was partitioned into thermodynamic and dynamic contributions based on the vertical integral of ascent acting on moisture stratification. Ensemble statistics were then summarized using the median and interquartile range. Additionally, we quantified the TC wind intensity vs. TC rainfall scaling based on Chen et al. (2025).
3.1 Changes in the total accumulated rainfall
Figure 1 illustrates the temporal evolution of accumulated rainfall within TC-centered radii of 1.0 and 2.5° for Typhoons Haiyan, Bopha, and Mangkhut under pre-industrial, present-day, and future climate. Across all TCs, accumulated rainfall increases progressively from pre-industrial to current and future climates, with divergence between simulations becoming evident during the primary rainfall accumulation phase between approximately 72 and 96 h of TC growth.
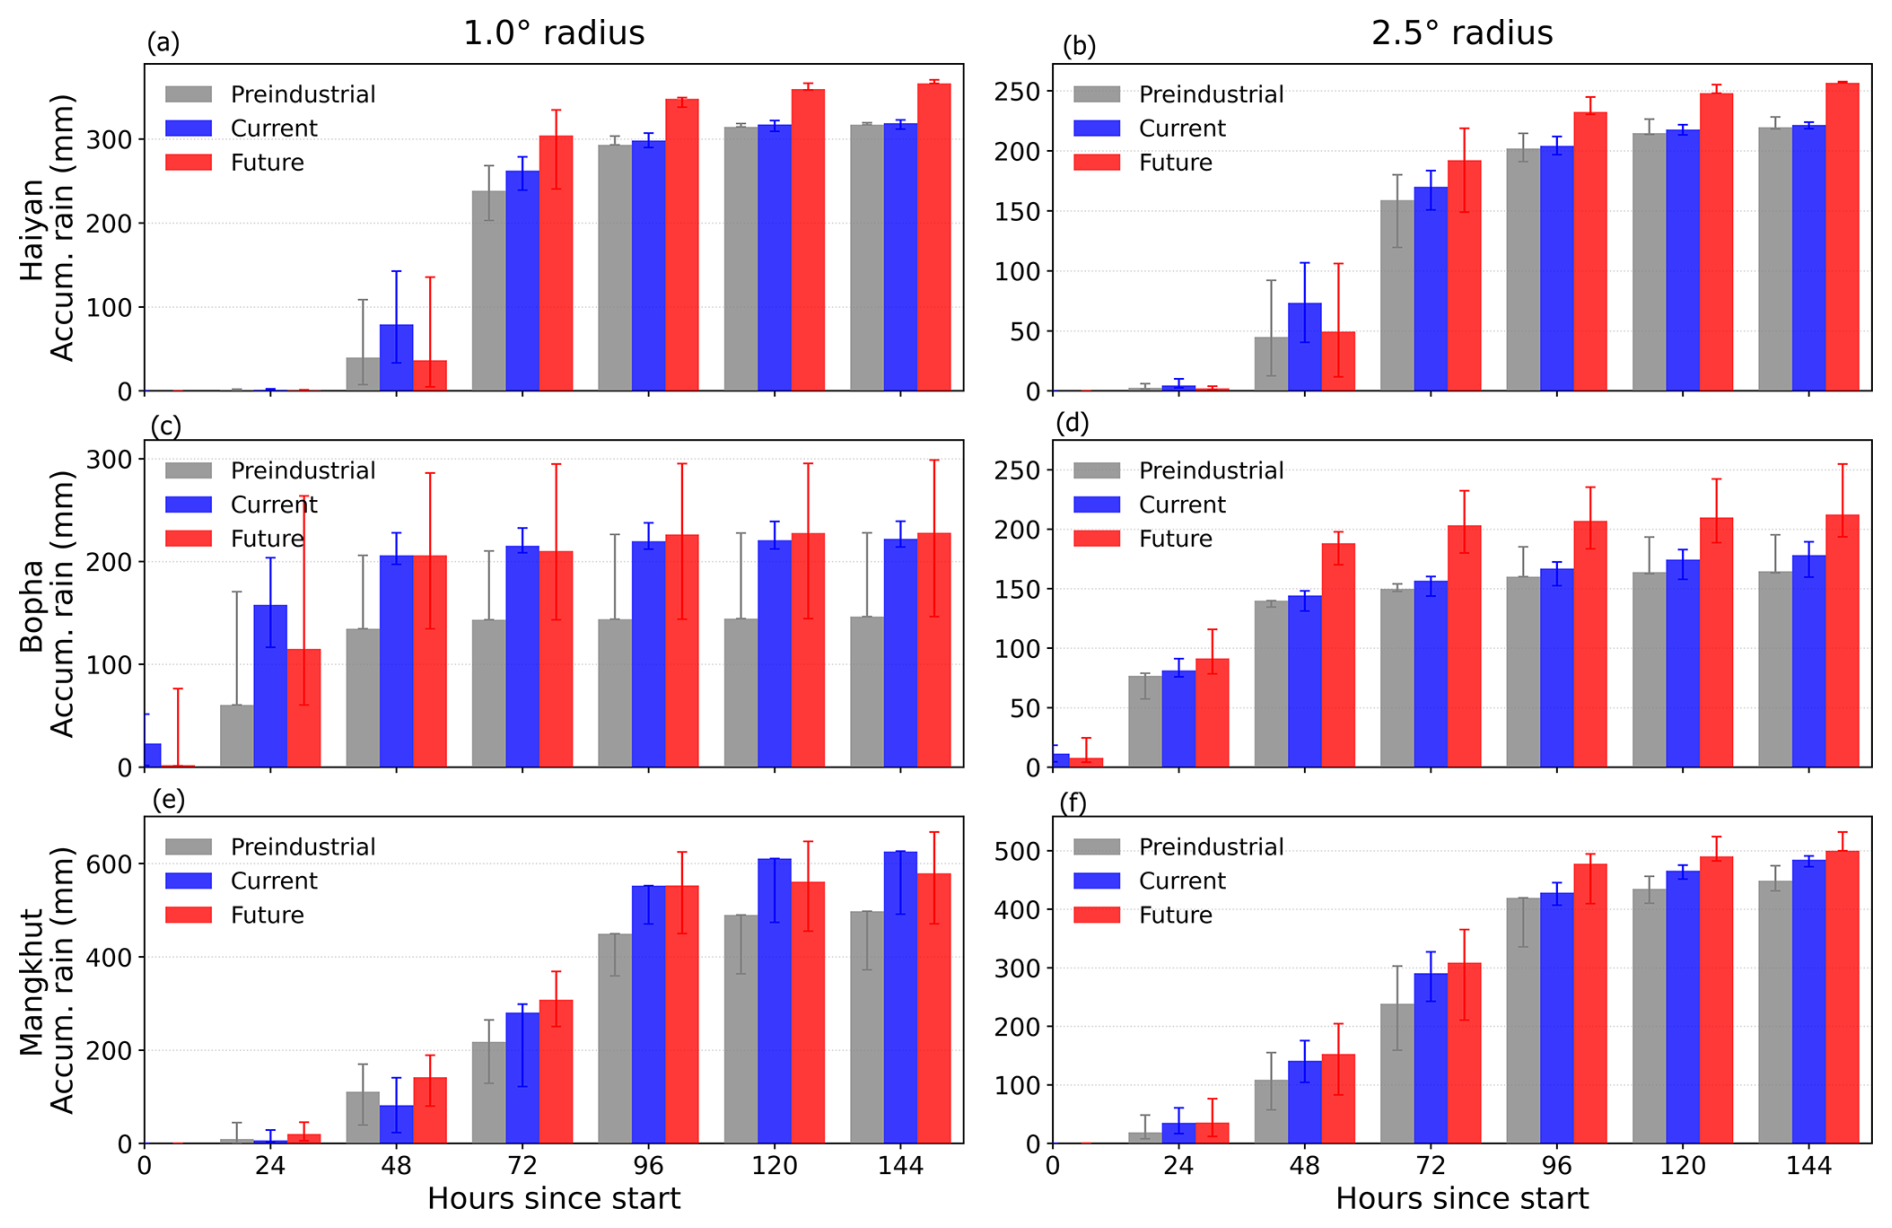
Figure 1Total accumulated precipitation rainfall within 1.0 (left column) and 2.5° (right column) radii from the TC center for Typhoons Haiyan, Bopha, and Mangkhut under pre-industrial (gray), current (blue), and future (red) thermodynamic conditions.
Within the 1.0° radius, future simulations consistently produce larger rainfall totals compared with present-day conditions. For Typhoon Haiyan, accumulated rainfall increases from approximately 295 mm in the pre-industrial simulations to about 320 mm in the current climate and reaches roughly 365–370 mm under future warming, corresponding to an increase of approximately 14 %–16 % relative to present-day conditions. Typhoon Bopha exhibits lower overall rainfall totals but similar behavior, with accumulation increasing from about 145 mm in the pre-industrial climate to nearly 220 mm in the current climate and approximately 230–240 mm in the future simulations, representing a more modest enhancement of about 5 %–8 % relative to current conditions. For Typhoon Mangkhut, which produces the largest rainfall totals among the three cases, accumulated rainfall increases from approximately 500 mm under pre-industrial conditions to about 630 mm in the present climate and exceeds 650 mm in the future environment, equivalent to an increase of roughly 5 %–7 %.
At the larger 2.5° radius, accumulated rainfall increases remain evident but display stronger inter-storm variability. Haiyan shows an increase from approximately 220 mm in the current climate to about 255–260 mm under future conditions, corresponding to an enhancement of roughly 15 %–18 %. The strongest relative response occurs for Bopha, where rainfall totals increase from approximately 170 mm to nearly 230 mm, representing an increase approaching 35 %–40 %. Mangkhut exhibits comparatively smaller fractional changes, with totals increasing from roughly 485 mm to about 505–520 mm, corresponding to increases of approximately 4 %–7 %. Ensemble spread is largest during periods of rapid increase in precipitation volume (cumulative precipitation), particularly between 48 and 96 h, although the ordering of rainfall totals among climate states remains consistent throughout TC lifespan.
Figure 2 shows the differences in total accumulated rainfall between Current minus Pre-industrial (upper panels) and Future minus Current (lower panels). Figure 2 shows that there is an overall statistically significant (p= 0.0066) increase, particularly in the central sections of the Philippines. Bopha exhibits moderate increases across parts of Mindanao and the Visayas, with a mean significant increase of 1.7 %. Mangkhut, on the other hand, shows a substantial total accumulated rainfall increase, especially over northern Luzon, with a mean increase of 14.2 mm (10.5 %), statistically significant at p< 0.0001. For the Future minus Current plots, Haiyan shows a notable increase in rainfall in the Visayas and central Mindanao, with a mean increase of 10.1 mm (7.4 %), also significant. Bopha shows the largest increase, particularly over Luzon and Visayas, with a 26.3 mm (24.3 %) increase. Mangkhut, in contrast, shows a very minimal increase in rainfall over northern Luzon and surrounding regions, with a mean increase of 3.9 %, primarily driven by the slight northward shift in the tracks of Mangkhut under future simulations.
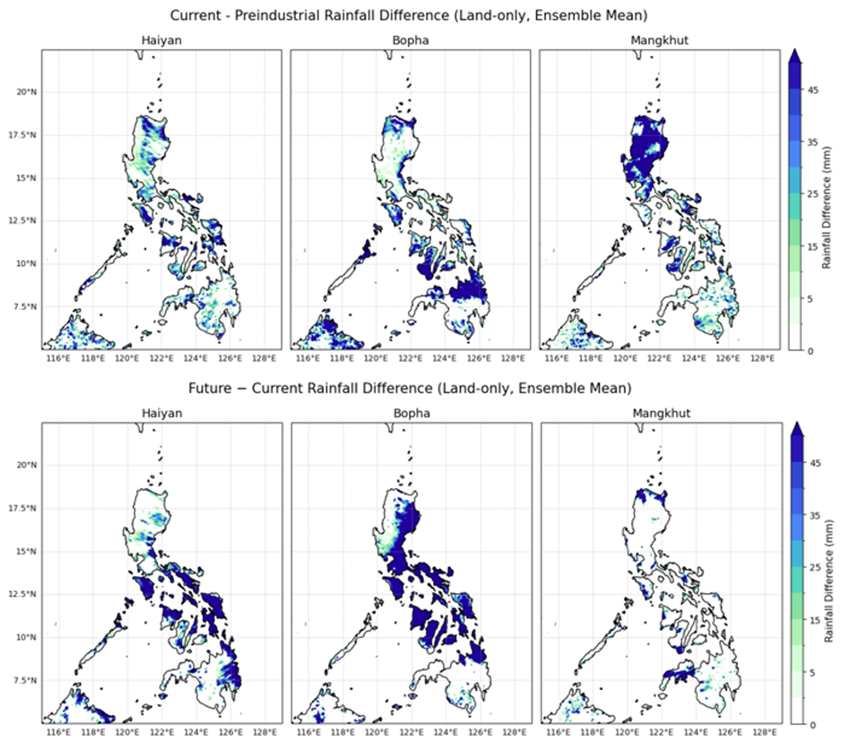
Figure 2Difference in the ensemble-mean accumulated precipitation (a–c) Current minus Pre-industrial; (d–f), Future minus Current for Typhoons Haiyan (left), Bopha (middle) and Mangkhut (right) under the 3kmNoCU simulations.
Figure 3 summarizes the total accumulated rainfall integrated over the full TC lifetime within 1.0 and 2.5° radii from the TC center. Consistent with the temporal evolution presented in Fig. 1, TC-total rainfall increases systematically from pre-industrial to current and future climates for all storms and spatial scales. Within the 1.0° radius, total accumulated rainfall for Haiyan increases from approximately 95 mm in the pre-industrial simulations to about 110 mm in the current climate and nearly 145–150 mm in the future simulations, corresponding to an increase of roughly 30 %–35 % relative to present-day conditions. Bopha shows an increase from approximately 85 mm to nearly 100 mm and subsequently to about 115–120 mm, representing a future enhancement of approximately 15 %–20 %. Mangkhut exhibits the strongest relative increase within the inner-core region, with totals rising from approximately 15–20 mm in the pre-industrial climate to about 25–30 mm in the current climate and reaching nearly 85–90 mm under future warming, corresponding to increases exceeding 200 % relative to present-day values, although accompanied by larger ensemble variability.
At the broader 2.5° radius, rainfall totals increase across all storms, with Haiyan increasing from approximately 95 mm to about 120 mm and further to nearly 140–145 mm under future conditions. Bopha exhibits an increase from roughly 120 mm in the pre-industrial simulations to approximately 165 mm in the current climate and more than 225–235 mm in the future climate, corresponding to increases of approximately 35 %–40 %. Mangkhut increases from approximately 20 to about 35 mm and exceeds 100 mm under future warming, indicating substantial amplification of storm-scale rainfall accumulation.
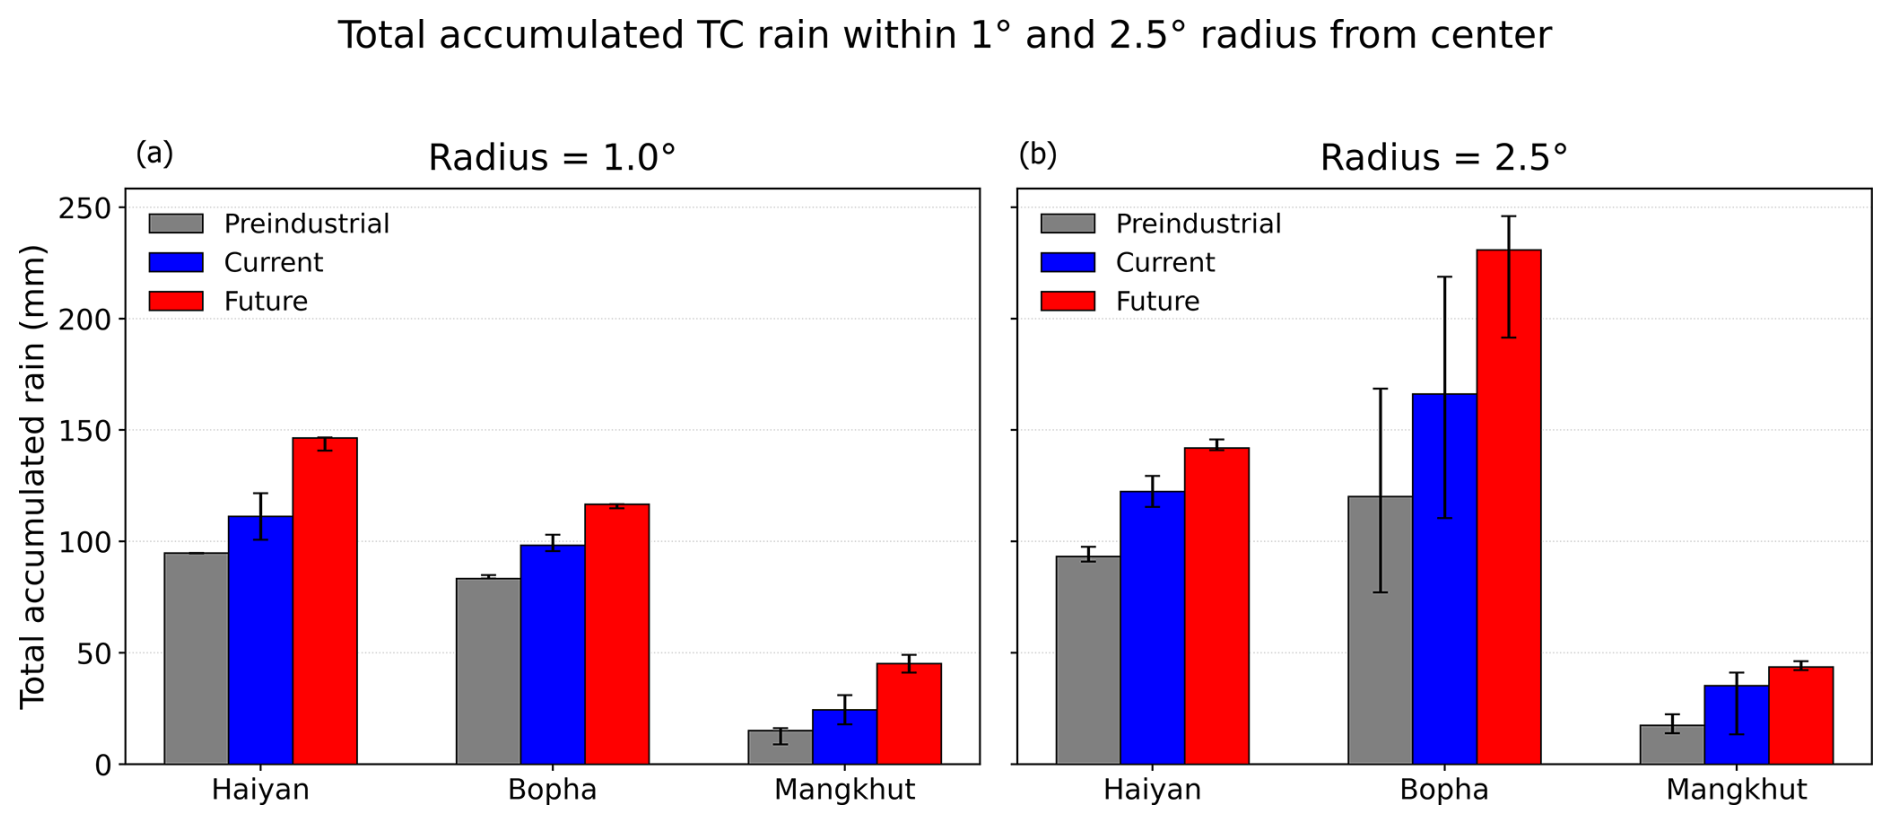
Figure 3Boxplots for the Total Accumulated Rainfall within 1 and 2.5° radius of the center of the track from the pre-industrial (gray), current (blue), and future (red) climate scenarios for Typhoons Haiyan, Bopha, and Mangkhut under the 3kmNoCU simulations using all ensemble members. Error bars represent ensemble interquartile range.
3.2 Changes in TC rain rate and intensity in the simulations
Figure 4 shows that the TCs under future climate simulations consistently produce higher median rain rates and larger ensemble spread, particularly within the inner-core (1.0° radius). This indicates stronger convective variability and episodic rainfall bursts under warming, while outer-region rainfall (2.5° radius) shows comparatively modest amplification.
Across all three TC cases, projected warming leads to a systematic intensification of rainfall extremes, although the magnitude of change varies by storm and percentile threshold (Fig. 4). Relative to the current climate, the future simulations show robust increases in extreme rain rates, particularly at the upper tail, indicating a disproportionate amplification of the most intense precipitation events. Haiyan exhibits the strongest sensitivity, with increases exceeding ∼ 40 % at P99, consistent with thermodynamic scaling associated with enhanced atmospheric moisture availability. In contrast, pre-industrial simulations generally show reduced or weakly positive changes, especially for Bopha, suggesting that present-day rainfall extremes already reflect substantial anthropogenic influence. The asymmetric response between pre-industrial cooling and future warming highlights nonlinear rainfall sensitivity to SST forcing and storm dynamics.
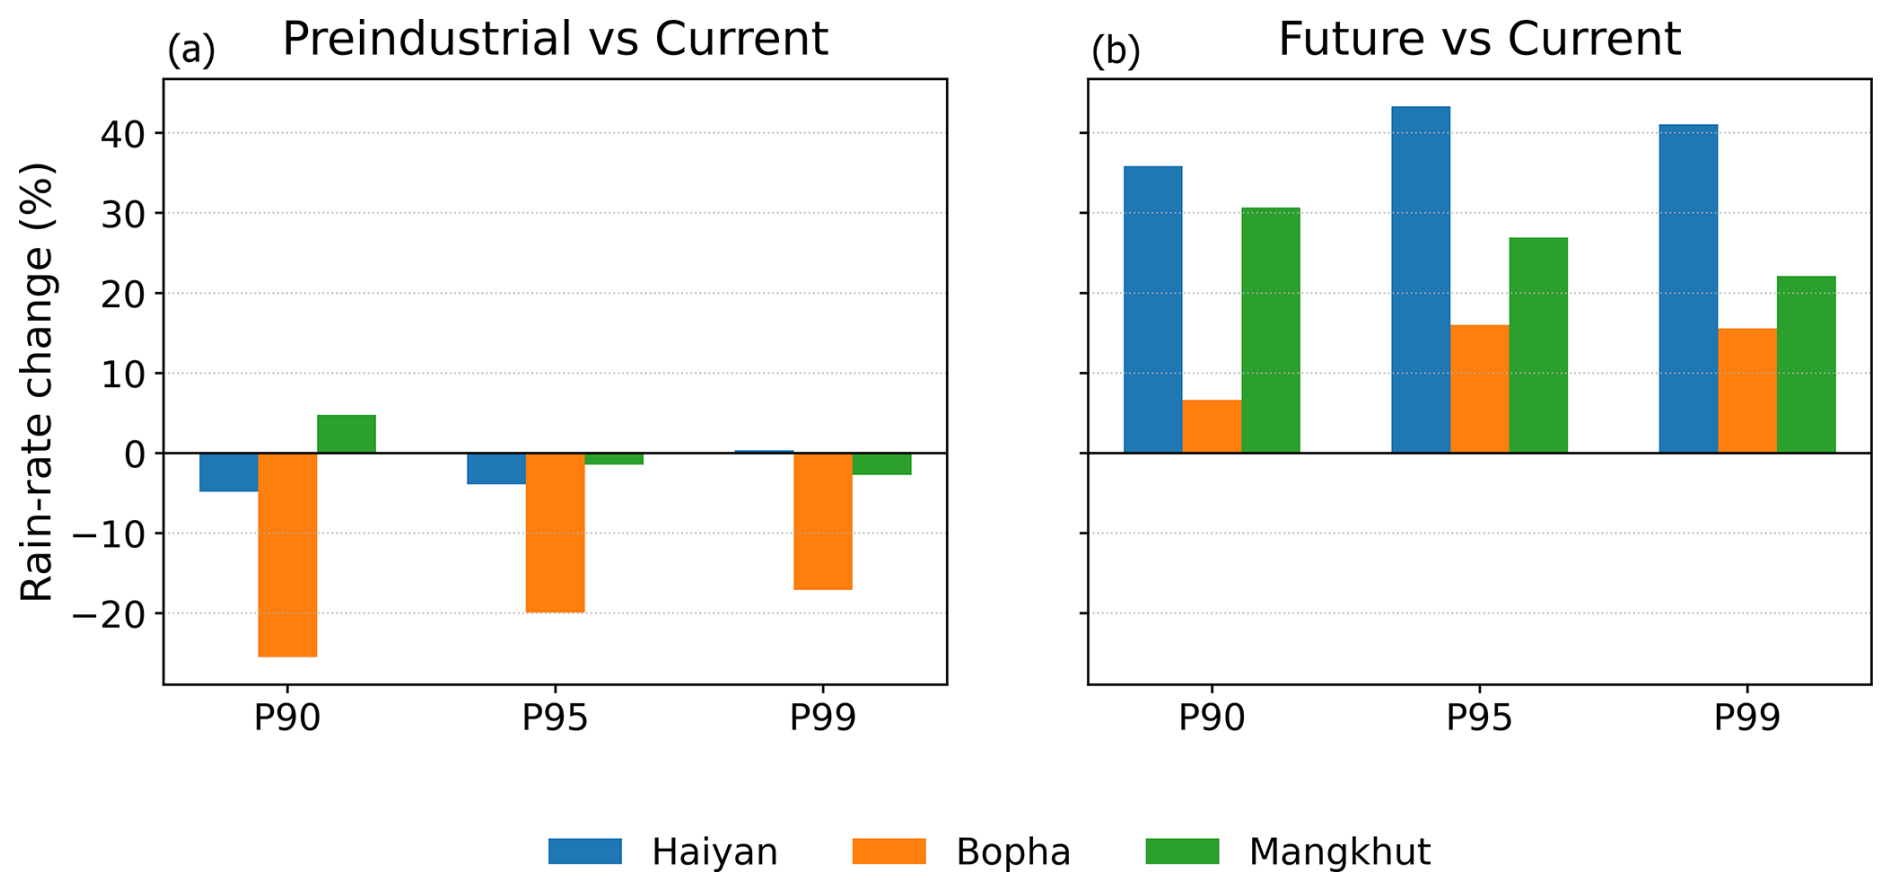
Figure 4Percent change in rainfall intensity at the P90, P95, and P99 thresholds for Typhoons Haiyan, Bopha, and Mangkhut under (a) pre-industrial and (b) future thermodynamic conditions relative to present-day simulations.
The fractional rainfall contribution analysis (Fig. 5) further demonstrates that warming shifts rainfall distributions toward higher rain-rate thresholds. Under future conditions, a larger fraction of total TC rainfall originates from intense precipitation (> 20–50 mm h−1), implying increasing dominance of short-duration, high-impact rainfall bursts rather than uniform TC-wide enhancement.
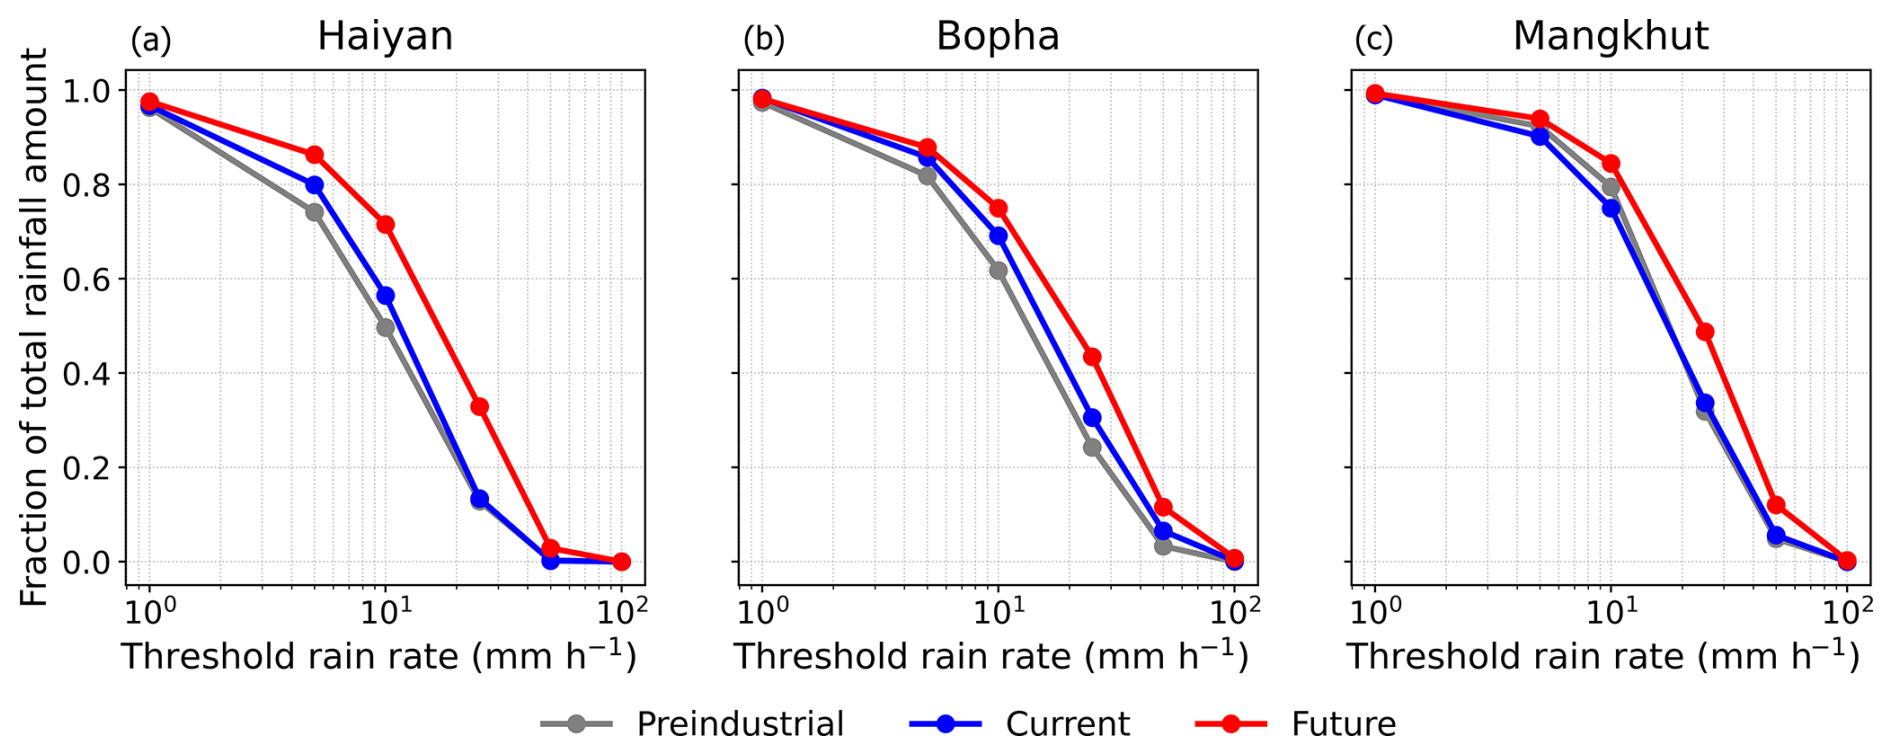
Figure 5Fraction of total storm rainfall contributed by precipitation exceeding increasing rain-rate thresholds for (a) Haiyan, (b) Bopha, and (c) Mangkhut under pre-industrial (gray), current (blue), and future (red) climates. Future simulations shift rainfall contributions toward higher intensities, indicating increasing dominance of extreme precipitation events.
A recent study by Macalalad et al. (2023) investigated the effects of historical warming on a different TC case, Typhoon Vamco (2020), and showed that the effects of historical warming are counteracted by additional factors such as orography/topography, resulting in comparable precipitation levels between past and present simulations within two river basins in the Philippines. To isolate the topographic effects of TC-associated precipitation, we analysed the TC precipitation rate at the time the simulated TCs reached peak intensity prior to landfall.
The spatial distribution of rainfall rate responses indicates that thermodynamic warming primarily modifies precipitation within the TC inner-core region across all three storms (Figs. 7–9). In both model configurations, increases in rainfall intensity are concentrated within the eyewall and immediately surrounding convective region (approximately within the inner 1.0° radius), where rainfall rates exceeding 20–25 mm h−1 become more spatially extensive under future conditions relative to both pre-industrial and present-day simulations.
For Typhoon Haiyan (Fig. 7), the future simulations show a clear expansion of high rain-rate regions within the eyewall in both dynamical configurations. In the 5 km convection-parameterized (5kmCU) simulations, areas exceeding ∼ 20 mm h−1 occupy a substantially larger fraction of the inner-core region compared with the pre-industrial case, accompanied by a more azimuthally continuous eyewall structure. The 3 km convection-permitting (3kmNoCU) simulations also show intensified TC inner-core rainfall; however, the response is characterized by localized convective enhancement rather than uniform radial expansion.
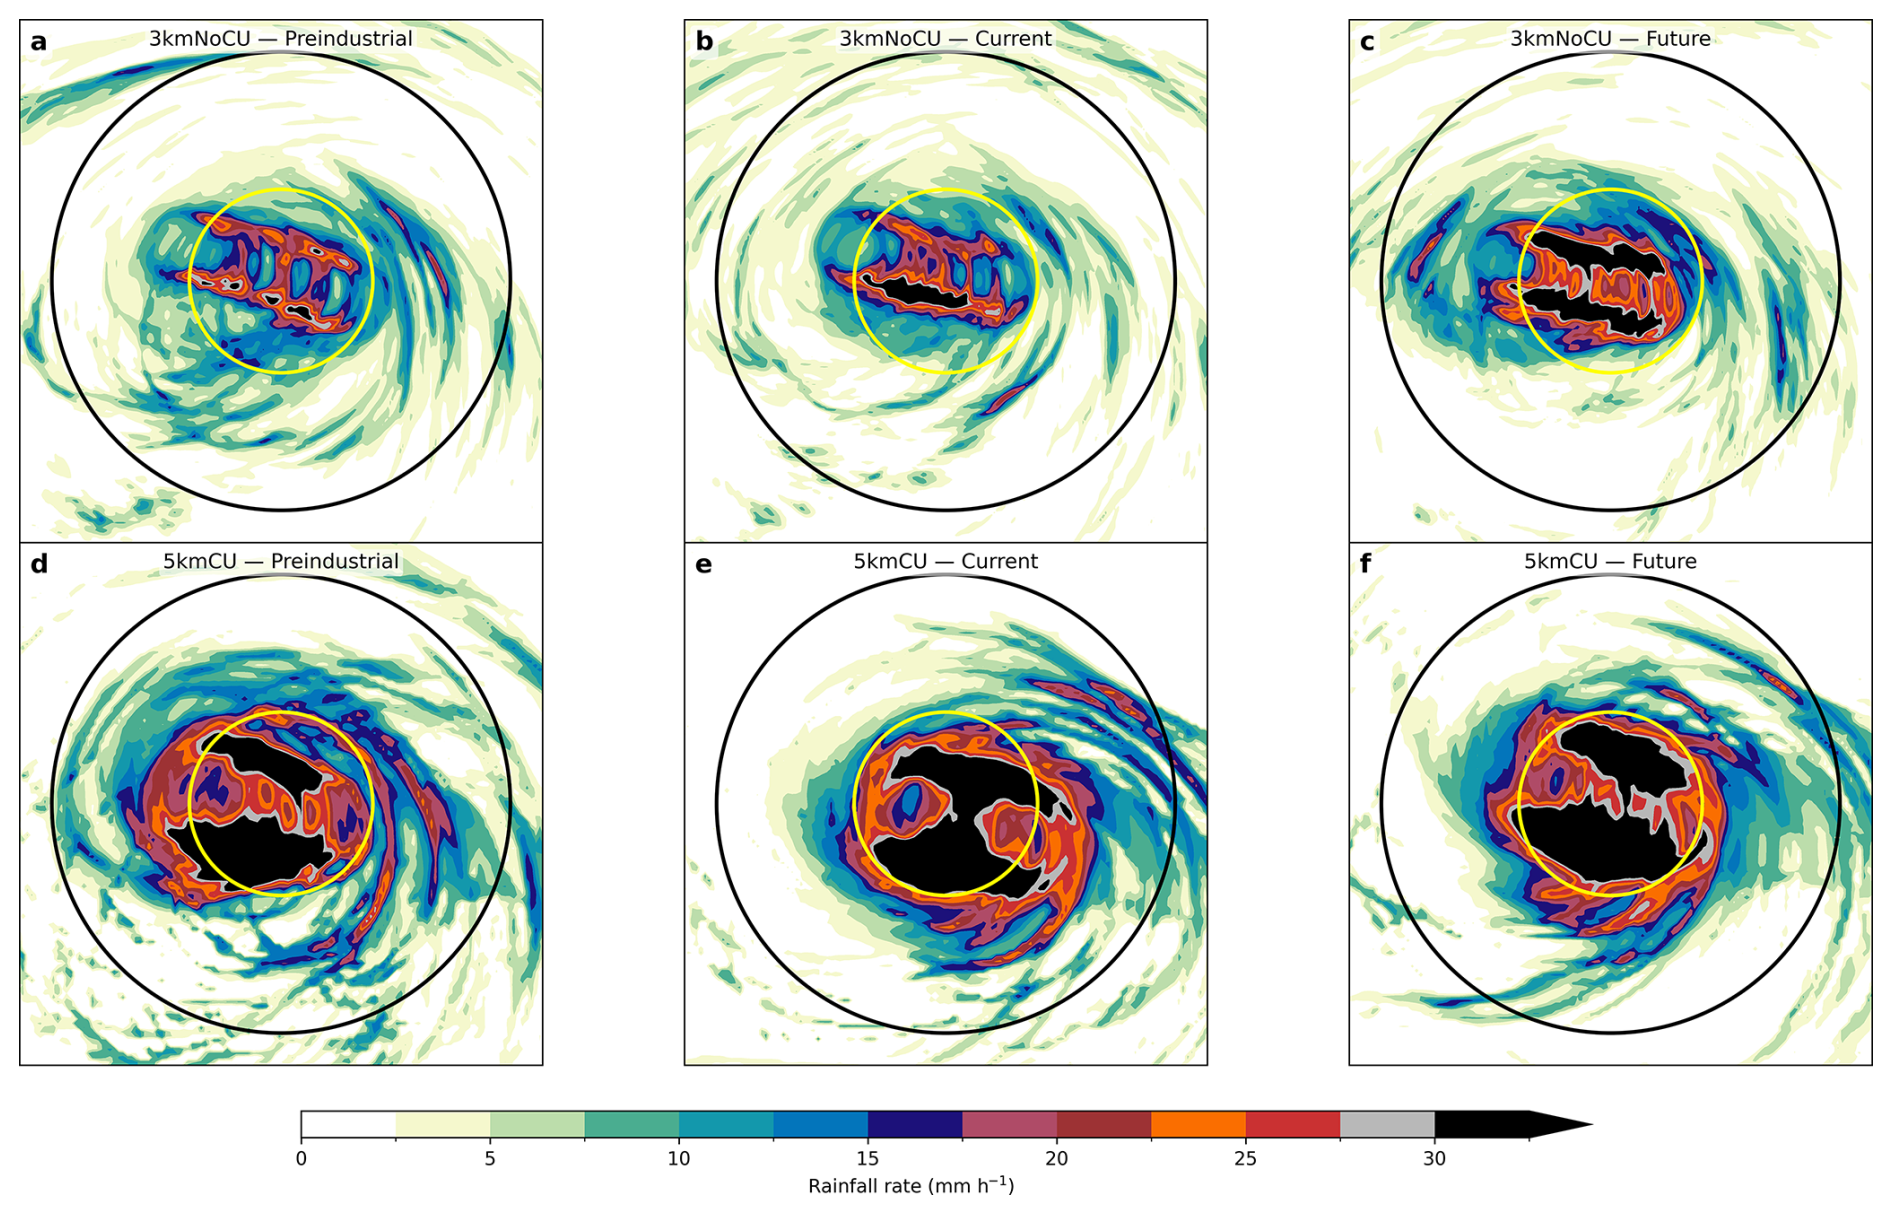
Figure 6Simulated precipitation rate (mm h−1) at simulated peak intensity for Haiyan on 7 November 2013 12 UTC for the 3kmNoCU runs (upper panel) and the 5kmCU runs (lower panel) under the pre-industrial (left), current (middle), and future climate conditions. The black circle indicates the 2.5° radius from the center, and the yellow circle indicates the 1° radius from the center.
For Typhoon Bopha (Fig. 8), the future rainfall response similarly exhibits strengthening of inner-core precipitation, although structural asymmetry remains pronounced. The increase in rainfall intensity is most evident along the primary rainband–eyewall transition region, where rainfall rates above ∼ 15–20 mm h−1 expand inward toward the storm center. Compared with Haiyan, outer rainband precipitation shows comparatively weaker enhancement, particularly in the 3kmNoCU simulations.
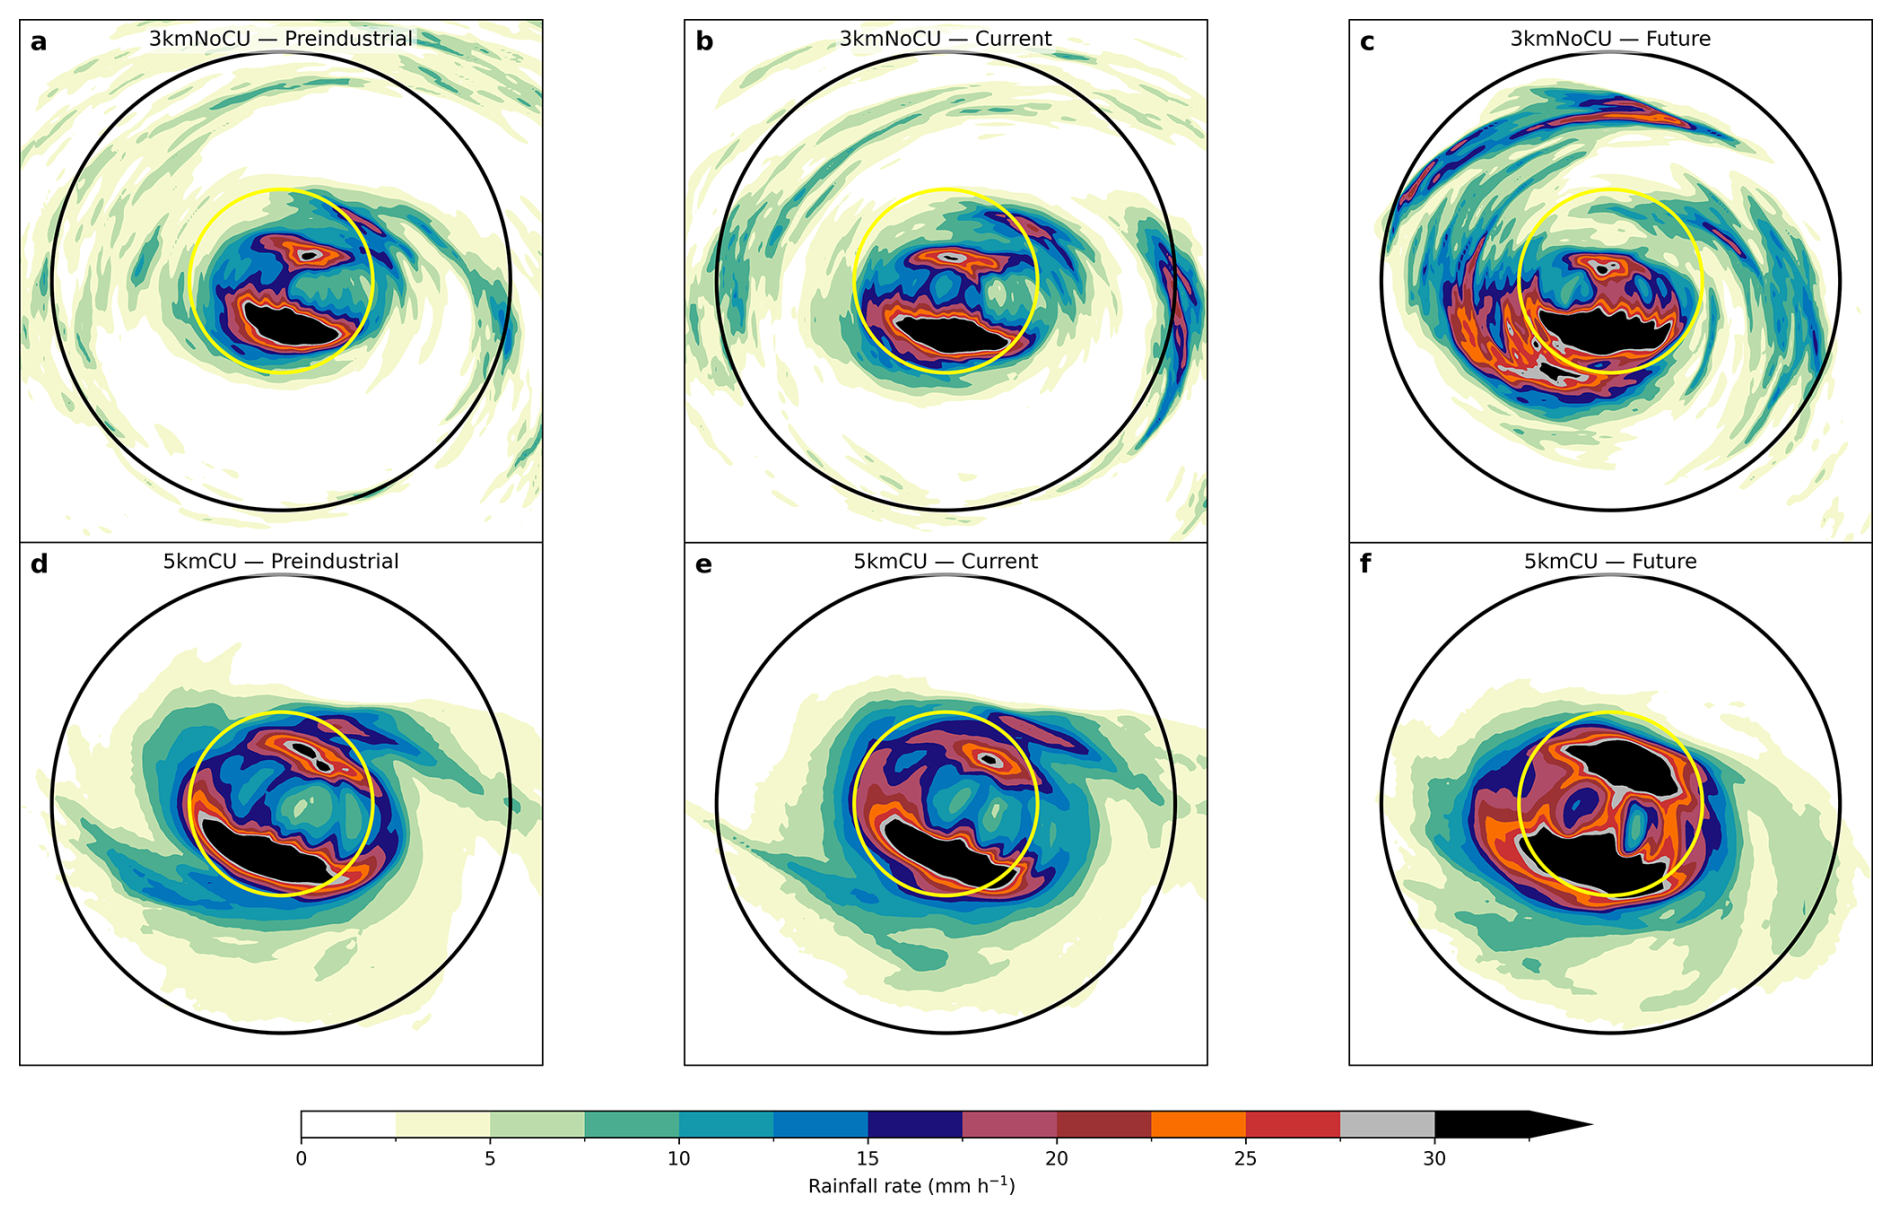
Typhoon Mangkhut (Fig. 9) displays the strongest structural reorganization among the three TCs. In the 5kmCU simulations, future conditions produce a markedly broader region of intense precipitation surrounding the eyewall, with rainfall rates exceeding 25 mm h−1 becoming nearly continuous around the inner-core region. In contrast, precipitation outside the inner-core radius weakens slightly relative to present-day simulations, indicating a redistribution of rainfall toward the TC center. A similar reduction in outer-core precipitation is evident in the 3kmNoCU simulations, suggesting partial drying beyond the eyewall region.
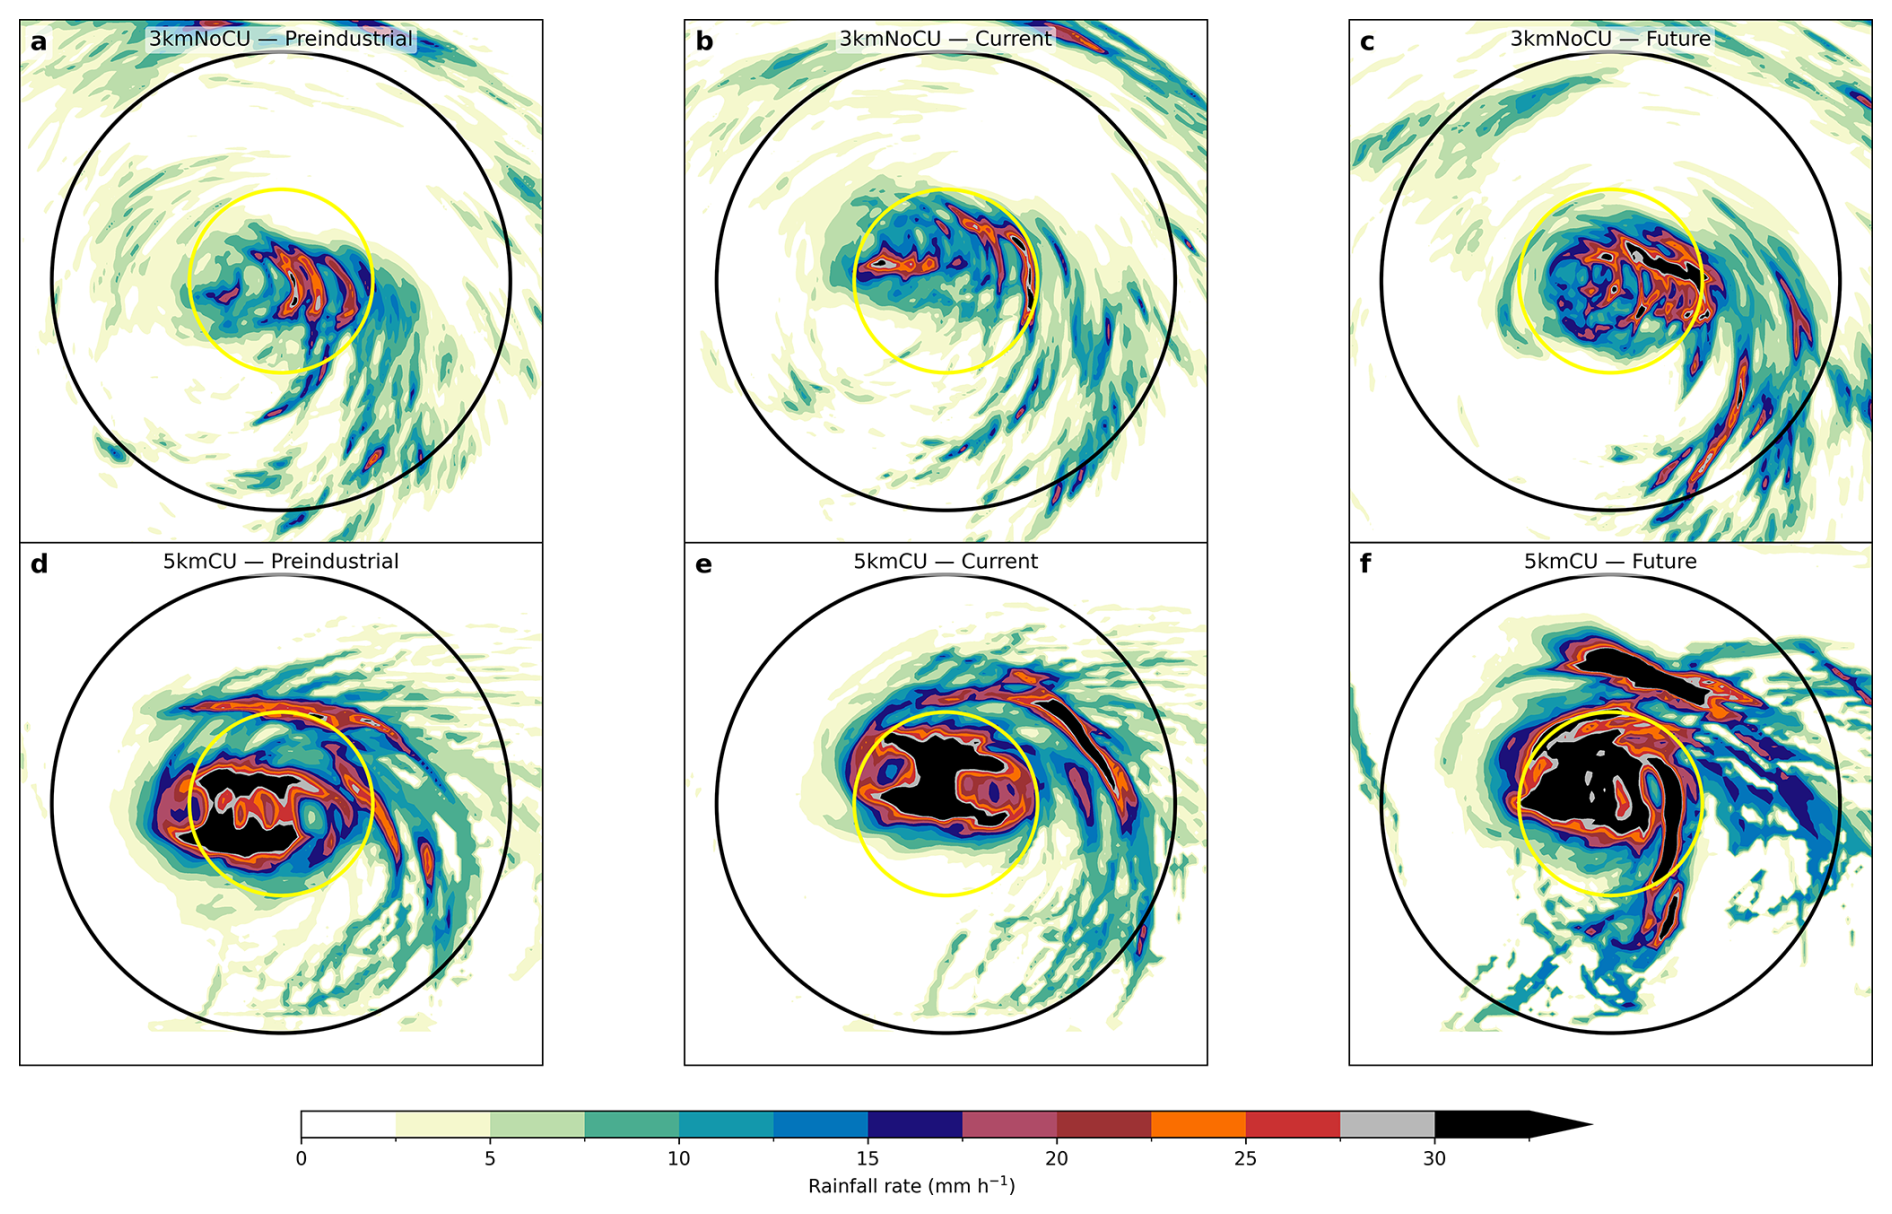
Across all TCs, increases in precipitation intensity are generally more spatially coherent in the 5kmCU simulations than in the convection-permitting 3kmNoCU runs. The latter exhibit stronger mesoscale variability, with localized convective maxima embedded within otherwise unchanged rainfall envelopes. The apparent reduction or weak response in outer-core precipitation under future conditions implies a radial contraction of rainfall toward the inner core in some cases, consistent with previously reported PGW experiments showing enhanced inner-core precipitation efficiency accompanied by relative outer-core drying (e.g., Patricola and Wehner, 2018), particularly for TCs with weaker large-scale rainband organization.
3.3 Changes in TC rain rate and Clausius-Clapeyron scaling
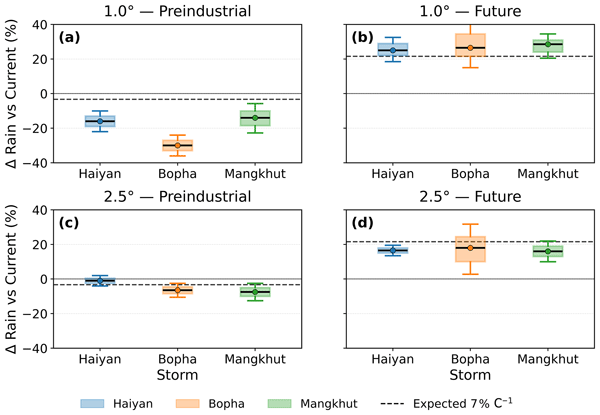
According to Liu et al. (2019), a projected increase in precipitation rate that is more than what is expected according to the CCS relation may be related to the projected increase in TC intensity that is associated with land surface and SST warming. As shown in Fig. 9a–c, under the pre-industrial climate, rainfall changes are negative across all TCs despite modest cooling (−0.4 to −0.6 °C) and the magnitude of decrease (−5 % to −30 %) falls below or near the CC scaling (dashed line). In contrast, under future warming (Fig. 9e–d), rainfall increases are consistently positive. (∼ 15% –30 %) for Δ SST ≈ 2.9–3.3 °C, broadly aligning with the expected ∼ 7 % °C−1 scaling, although some cases (e.g., Mangkhut and Bopha) slightly exceed this thermodynamic benchmark. This indicates that, while the bulk response is largely consistent with CC scaling, there is event-to-event variability that suggests contributions beyond purely thermodynamic control.
This aligns with the results from Stansfield and Reed (2023), who found that the apparent scaling of TC precipitation in response to SST warming is typically around 6 %–9 % per °C, consistent with the CCS rate, while the climate scaling – which accounts for long-term climate changes – is smaller, around 5 % per °C. They emphasized that the apparent scaling reflects short-term changes driven by SST alone, while climate scaling incorporates broader atmospheric changes like shifts in wind shear, which reduce the precipitation intensification seen in the SFC-only experiments of Liu et al. (2019).
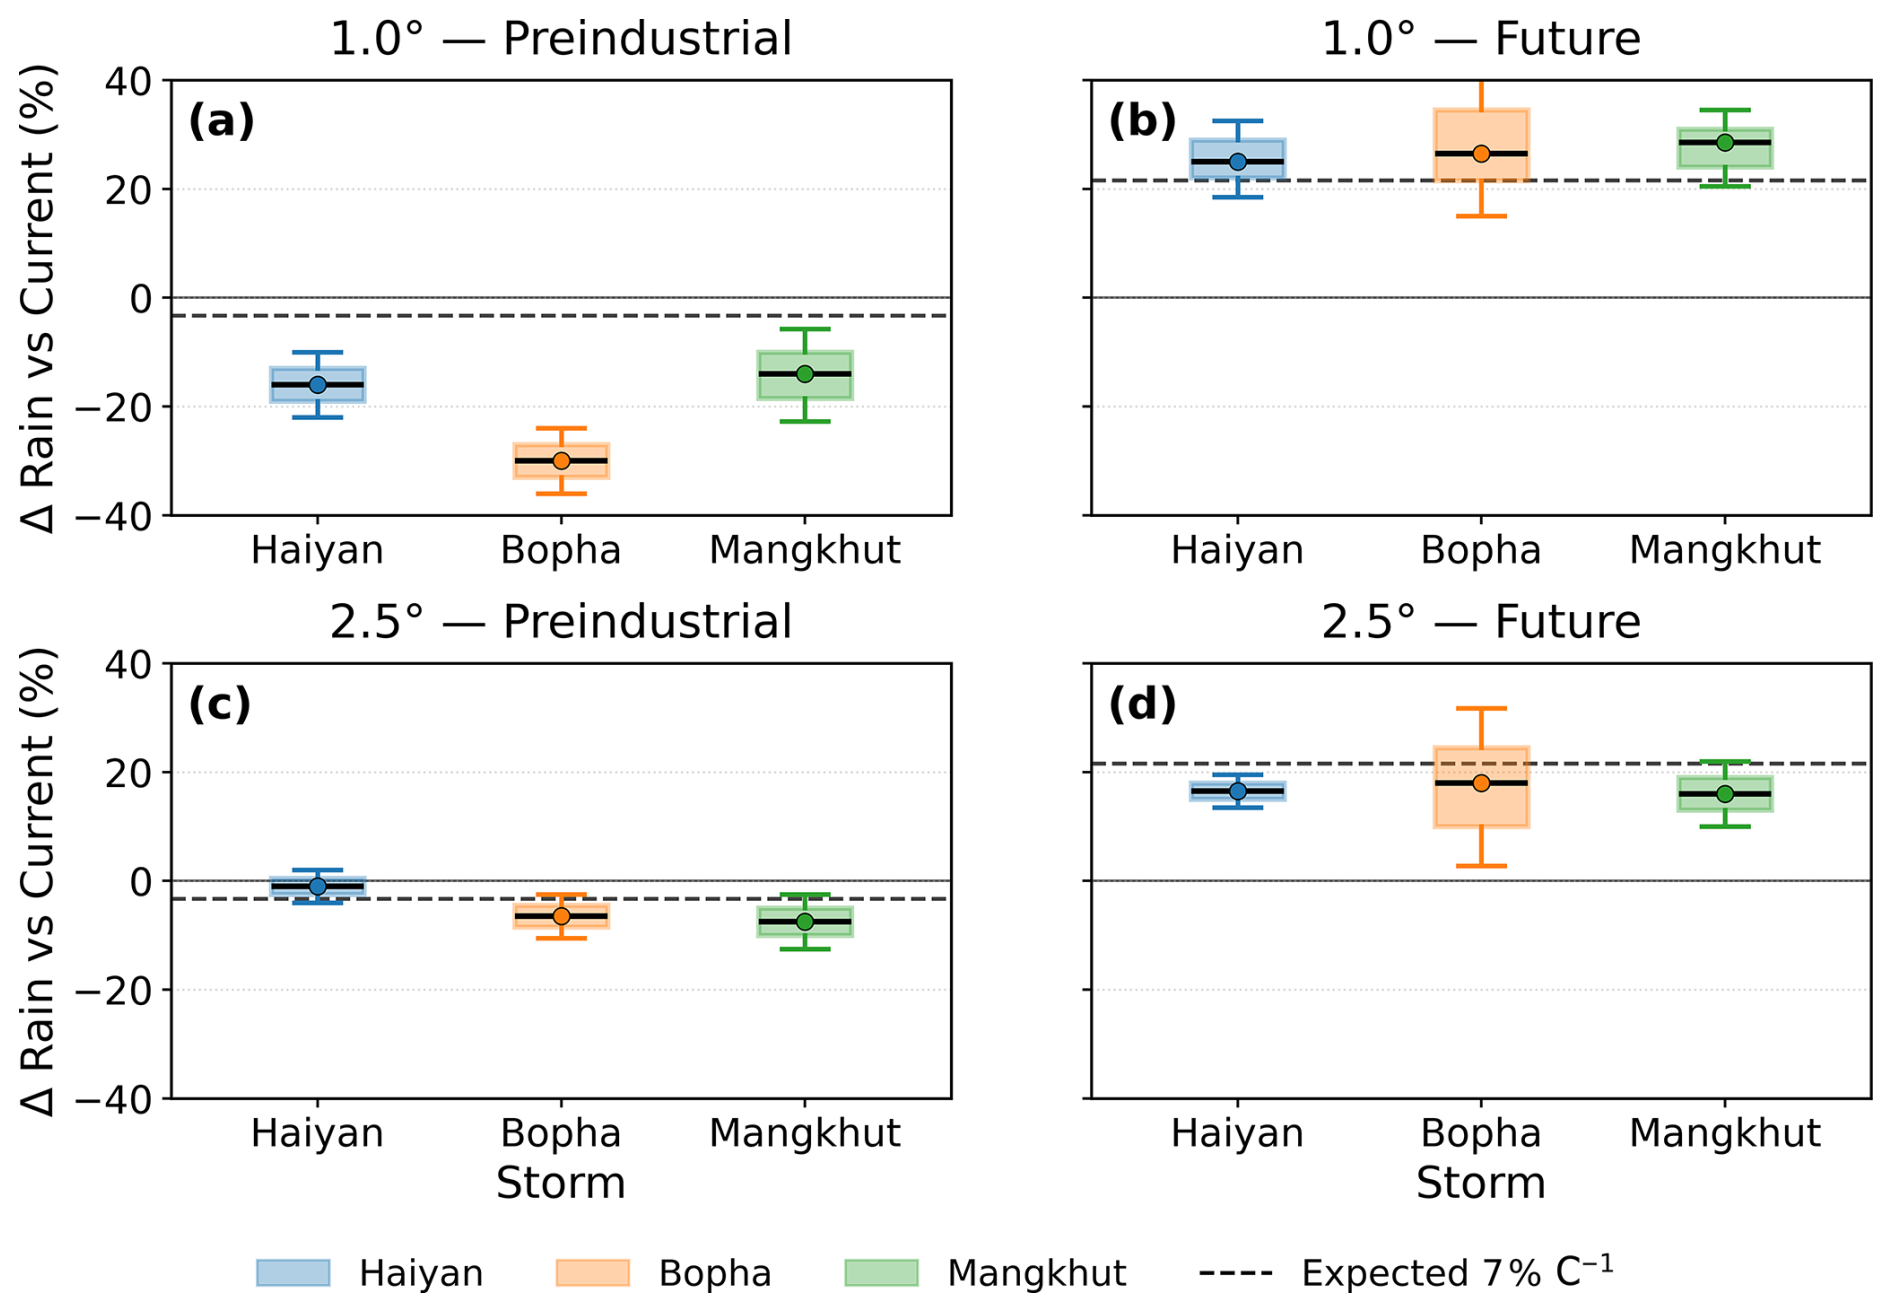
Figure 9Boxplot of the change in TC rain rates (a) within 1.0° radius of the TC for pre-industrial vs. current climate; (b) within 1.0° radius of the TC for future vs. current climate; (c) within 2.5° radius of the TC for pre-industrial vs. current climate; (d) within 2.5° radius of the TC for future vs. current climate simulations using different initializations. The black dotted lines show the Clausius-Clapeyron scaling.
3.4 Thermodynamic and dynamic decomposition of TC rainfall changes
Figure 10 quantifies the decomposition of the TC rainfall changes into full response (FULL), thermodynamic contribution (TH) and dynamic contribution (DY) for the three TCs under pre-industrial and future climate relative to present-day conditions. The decomposition is shown for the different rainfall metrics (azimuthally averaged maximum rainfall rate, rainfall volume, mean rainfall rate). Based on the decomposition, across all three TCs, the most robust signal in the future climate simulations is a positive thermodynamic contribution, ranging typically on the order of 20 %–30 %, irrespective of the rainfall metric. For example, TH is ∼ +25 %–30 % for Haiyan across Pm, volume, and mean rain, ∼ +22 %–27 % for Bopha, and ∼ +20 %–27 % for Mangkhut. This robust signal reflects enhanced moisture availability under warming and aligns with Clausius–Clapeyron expectations. In contrast, the dynamic contribution is smaller and more variable, ranging from about −15 % to +10 %, and often acts to partially offset the thermodynamic increase. As a result, the net (FULL) response depends strongly on the balance between these two terms. This balance leads to pronounced TC case-to-case differences. Haiyan shows the largest increases, with FULL reaching ∼ +50 % for Pm and ∼ +25 %–35 % for volume and mean rain; here, TH dominates while DY is weakly negative for Pm (∼ −10 %) and slightly positive (∼ +5 %–10 %) for both volume and mean rain metrics. In contrast, Bopha exhibits near-zero to weakly negative FULL changes (∼ −10 % to 0 %), as a positive TH (∼ +25 %) is nearly cancelled by a negative DY (∼ −10 % to −30 %). Mangkhut shows moderate behaviour, with FULL increases of ∼ +20 %–25 % for Pm and ∼ +10 % for mean rain, but near-zero or slightly negative changes in volume, again due to compensating negative DY (∼ −5 % to −15 %). In the pre-industrial (PI) experiments, TH is near-zero to slightly negative (≈ 0 % to −3 %), while DY largely controls the response: Haiyan shows positive FULL (∼ +20 %–25 %), Bopha negative (∼ −15 % to −25 %), and Mangkhut mixed signals. Overall, these results demonstrate that while thermodynamics sets a fairly uniform positive baseline under warming, dynamical changes determine whether and how strongly that moisture increase translates into rainfall. Our results show that under pre-industrial climate, the dynamical contributions are higher than the thermodynamic term, however, under future warming scenarios, the thermodynamic contribution provides the primary positive signal (∼ 20 %–30 %), while dynamics are smaller and often act to offset this increase (≈ −10 % to −30 %).
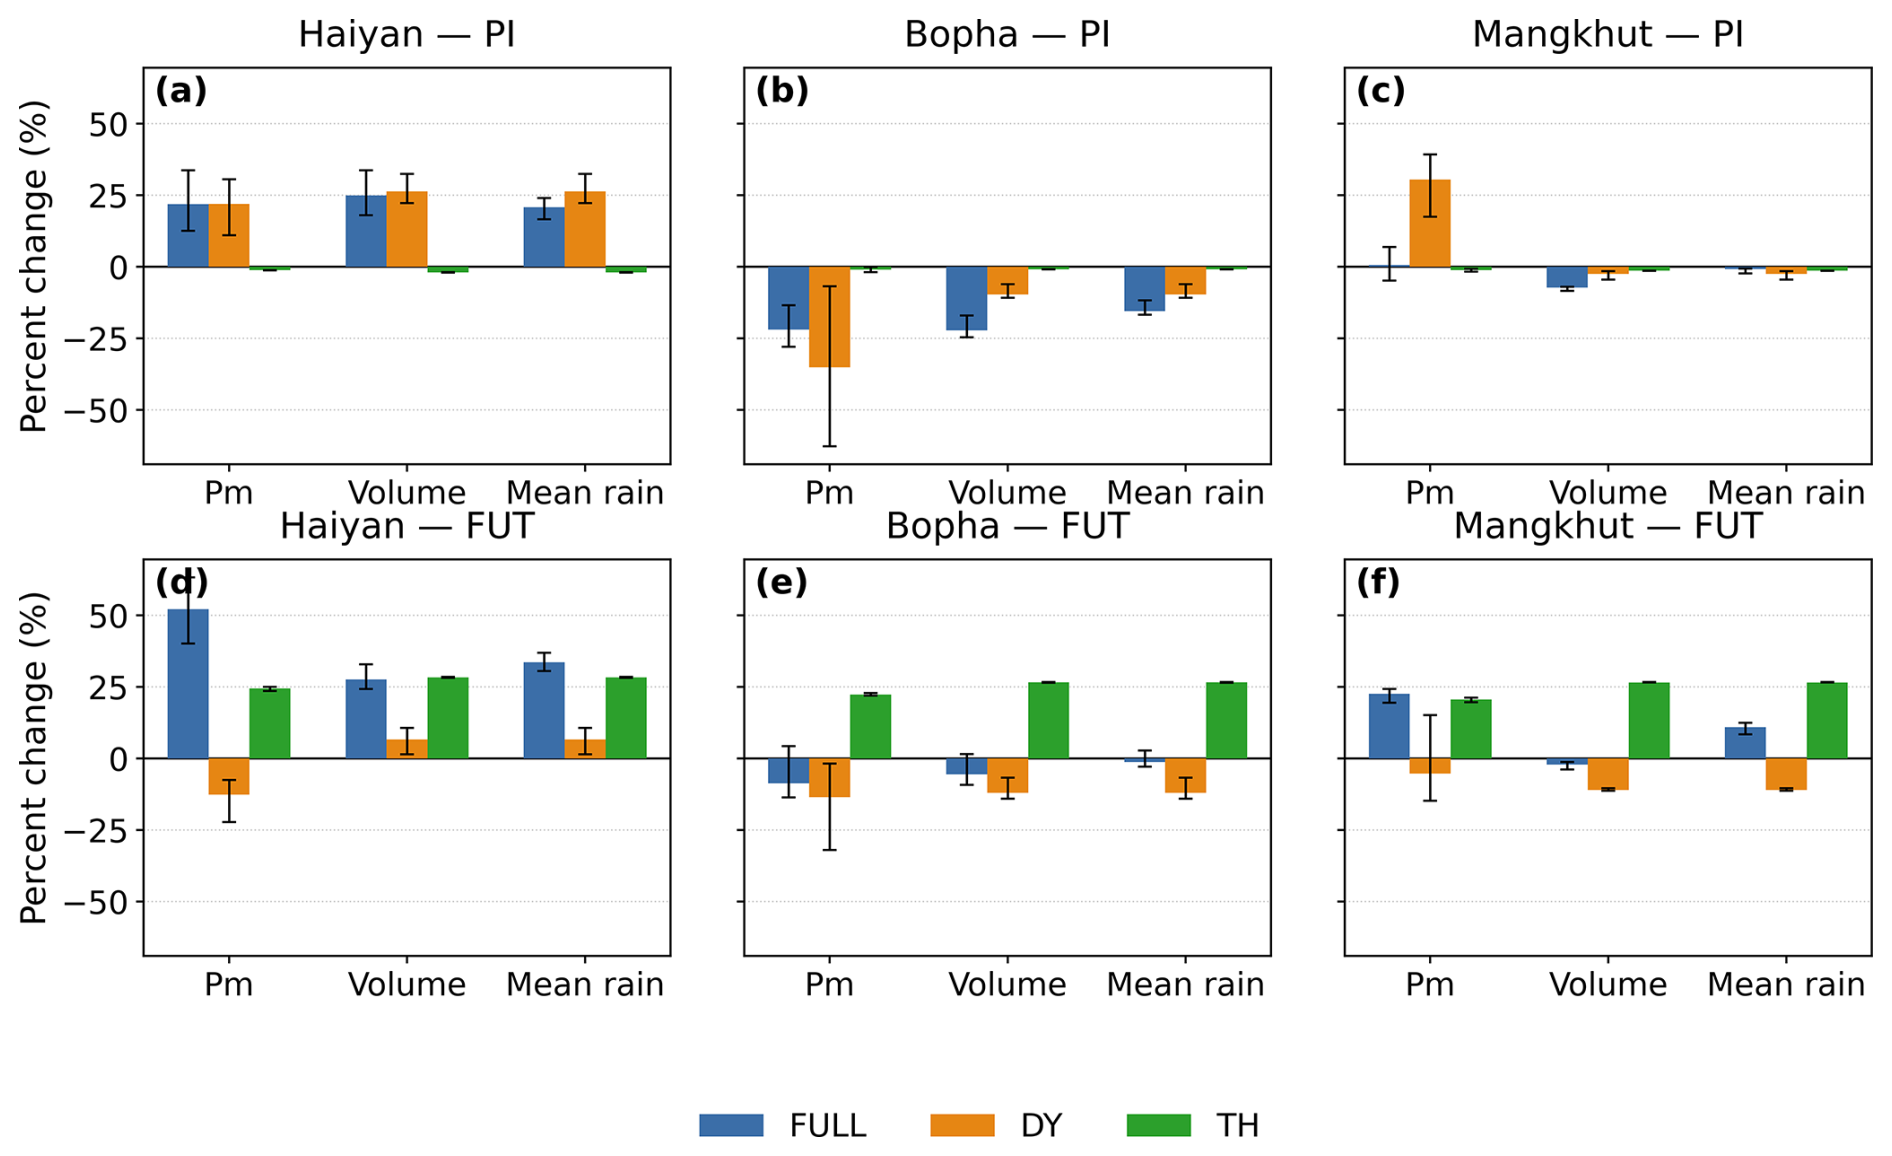
Figure 10Decomposition of tropical cyclone rainfall changes into full (FULL), thermodynamic (TH), and dynamic (DY) contributions for Haiyan, Bopha, and Mangkhut, shown for pre-industrial (PI) and future (FUT) climates relative to present-day conditions. Bars indicate percent changes in azimuthally averaged maximum rainfall rate (Pm), rainfall volume, and mean rainfall rate within 500 km of the storm centre; error bars denote ensemble spread (IQR).
3.5 Thermodynamic baseline shift and rainfall sensitivity to intensity change
Figure 11 illustrates the relationship between simulated TC intensity and precipitation rate with separate analysis of the pre-industrial and future climate. The figure indicates that the rainfall–intensity relationship remains positive in both climates, and for peak rainfall metrics such as Pm and P99 the future runs are broadly consistent with the mechanism proposed by Chen et al. (2025), namely that warming enhances the rainfall increase associated with a given intensity increase through greater moisture availability i.e. a 1 m s−1 increase in TC intensity produces a larger rainfall increase. Based on our simulations, the slope is 7.60 % increase in peak rainfall per m s−1 and 1.30 % increase in extreme rainfall (P99) per m s−1 in wind intensity. However, our simulations also reveal pronounced TC case-to-case variability, with some TCs showing substantial dynamic suppression of rainfall despite positive thermodynamic forcing. This suggests that the Chen et al. (2025) relationship holds as a first-order tendency, but its realized magnitude in individual TCs depends strongly on TC structure and dynamics. TC-specific regressions (Fig. S1 in the Supplement) reveal that warming does not uniformly increase the rainfall response to TC wind intensity changes. When averaged across TCs, the strongest enhancement occurs for azimuthally averaged maximum rainfall rate (Pm), where the future-climate sensitivity reaches 7.6 % per m s−1, compared with −2.4 % per m s−1 in the pre-industrial climate. A weaker enhancement is found for P99 rainfall extremes (1.30 % vs. 1.08 % per m s−1). In contrast, bulk metrics show little or no enhancement, with mean rainfall sensitivities nearly unchanged (2.18 % vs. 2.29 % per m s−1) and rainfall volume sensitivities lower in the future climate (2.03 % vs. 4.50 % per m s−1). These results indicate that the warming-enhanced rainfall–intensity relationship proposed by Chen et al. (2025) is most applicable to peak inner-core rainfall rather than total rainfall.
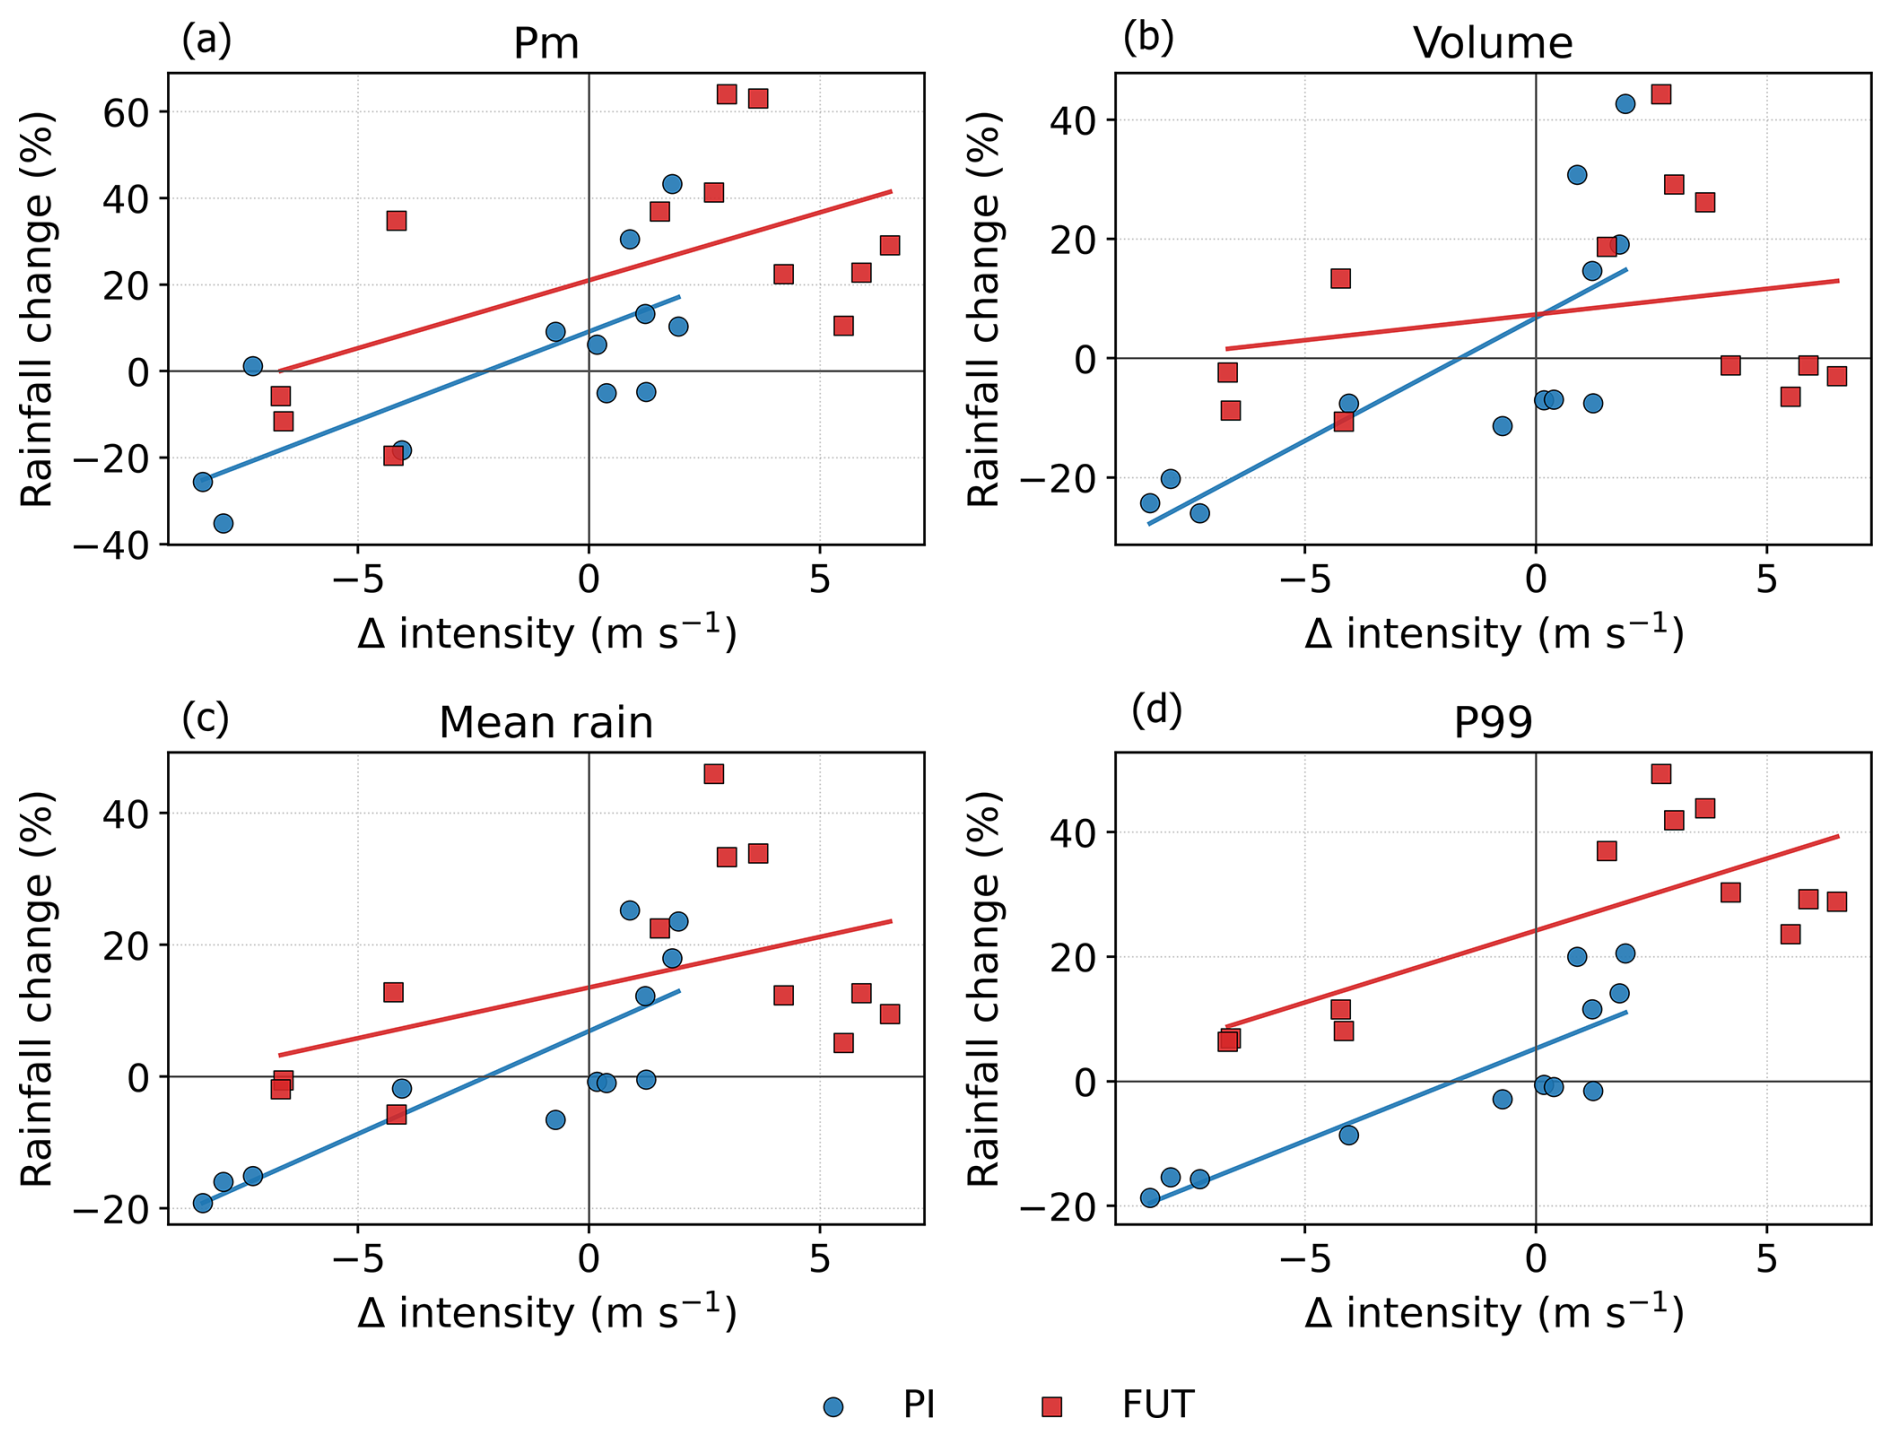
Figure 11Relationship between changes in tropical cyclone intensity (Δ intensity, m s−1) and rainfall response for pre-industrial (PI; blue) and future (FUT; red) simulations. Panels show percent changes in (a) azimuthally averaged maximum rainfall rate (Pm), (b) rainfall volume, (c) mean rainfall rate, and (d) extreme rainfall (P99). Solid lines indicate linear fits for each climate state, highlighting a stronger and more consistent positive scaling between intensity and rainfall under future warming compared to pre-industrial conditions.
3.6 Potential mechanisms driving TC-associated precipitation changes
Figure 12 shows the radius-height composites of simulated reflectivity (dBZ) within the 2.5° radius in the forward direction of the TCs at peak intensity for the 3kmNoCU simulations, the 5kmCU simulations (not shown) reveal similar results. The vertical expansion of the eyewall, the inner region of a TC characterized by intense convection and the strongest winds surrounding the eye, is consistent with the vertical cross-sections of composite azimuthally averaged winds reported by Delfino et al. (2023). As indicated by the increased reflectivity in Fig. 12, these changes provide insight into the evolving structure of TCs under the different climate conditions simulated in this study. Although the compositing was performed at the peak intensity of the storms, the results reveal substantial enhancements in reflectivity throughout the vertical extent and within a 2.5° radius in the forward sector of the TC circulation. The largest positive reflectivity anomalies in the future-minus-current simulations are concentrated near the eyewall and inner-core region, particularly through the mid- to upper troposphere, indicating deeper convection and stronger precipitation-producing clouds. In contrast, the pre-industrial-minus-current simulations generally show weaker reflectivity in the lower- to midlevel inner core, suggesting that present-day climates already favor stronger and more vertically developed precipitation structures than pre-industrial conditions.
This enhanced reflectivity implies a greater amount of precipitation within the TC inner core, with important consequences for storm dynamics. The explanation for the vertical expansion of the eyewall likely lies in the interaction between thermodynamic and dynamic atmospheric processes. Earlier scaling analyses in this study showed that projected rainfall increases cannot be explained solely by thermodynamic moisture increases associated with Clausius–Clapeyron scaling. If thermodynamic forcing alone dominated, changes would be more spatially uniform. Instead, Fig. 12 shows that the strongest increases are concentrated in dynamically active regions such as the eyewall slope and inner-core convective towers, indicating that structural changes in storm circulation also play a critical role. As TC intensity increases, precipitation rates within the storm also tend to increase (Alvey et al., 2015), reflecting and reinforcing internal dynamical processes critical to intensification. While environmental conditions such as warm sea surface temperatures, low vertical wind shear, and high low-level moisture are known to support TC development (DeMaria et al., 2005; Kaplan et al., 2010, 2015), they do not fully account for changes in TC intensity (Hendricks et al., 2010). This has led to a growing focus on internal TC processes, particularly precipitation and convection, as key drivers of TC intensification. Latent heat release from enhanced precipitation warms the TC core and contributes to further pressure falls, strengthening the cyclone (Rotunno and Emanuel, 1987; Pendergrass and Hartmann, 2014; Yamada et al., 2017). Observational studies using TRMM and passive microwave data have shown that more intense TCs are typically associated with broader and more symmetric precipitation coverage, especially in the inner core (Alvey et al., 2015). Stratiform and moderate-to-deep convective precipitation are particularly linked to rapid intensification (Tao and Jiang, 2015), suggesting that increasing precipitation is not just a result of intensification, but a contributor to it. Ruan and Wu (2018) also found that as TCs intensify, they exhibit increased precipitation and colder high cloud tops, and that widespread very deep convective clouds (IR BT < 208 K) are strong predictors of future intensity change, particularly rapid intensification (Tierra and Bagtasa, 2023).
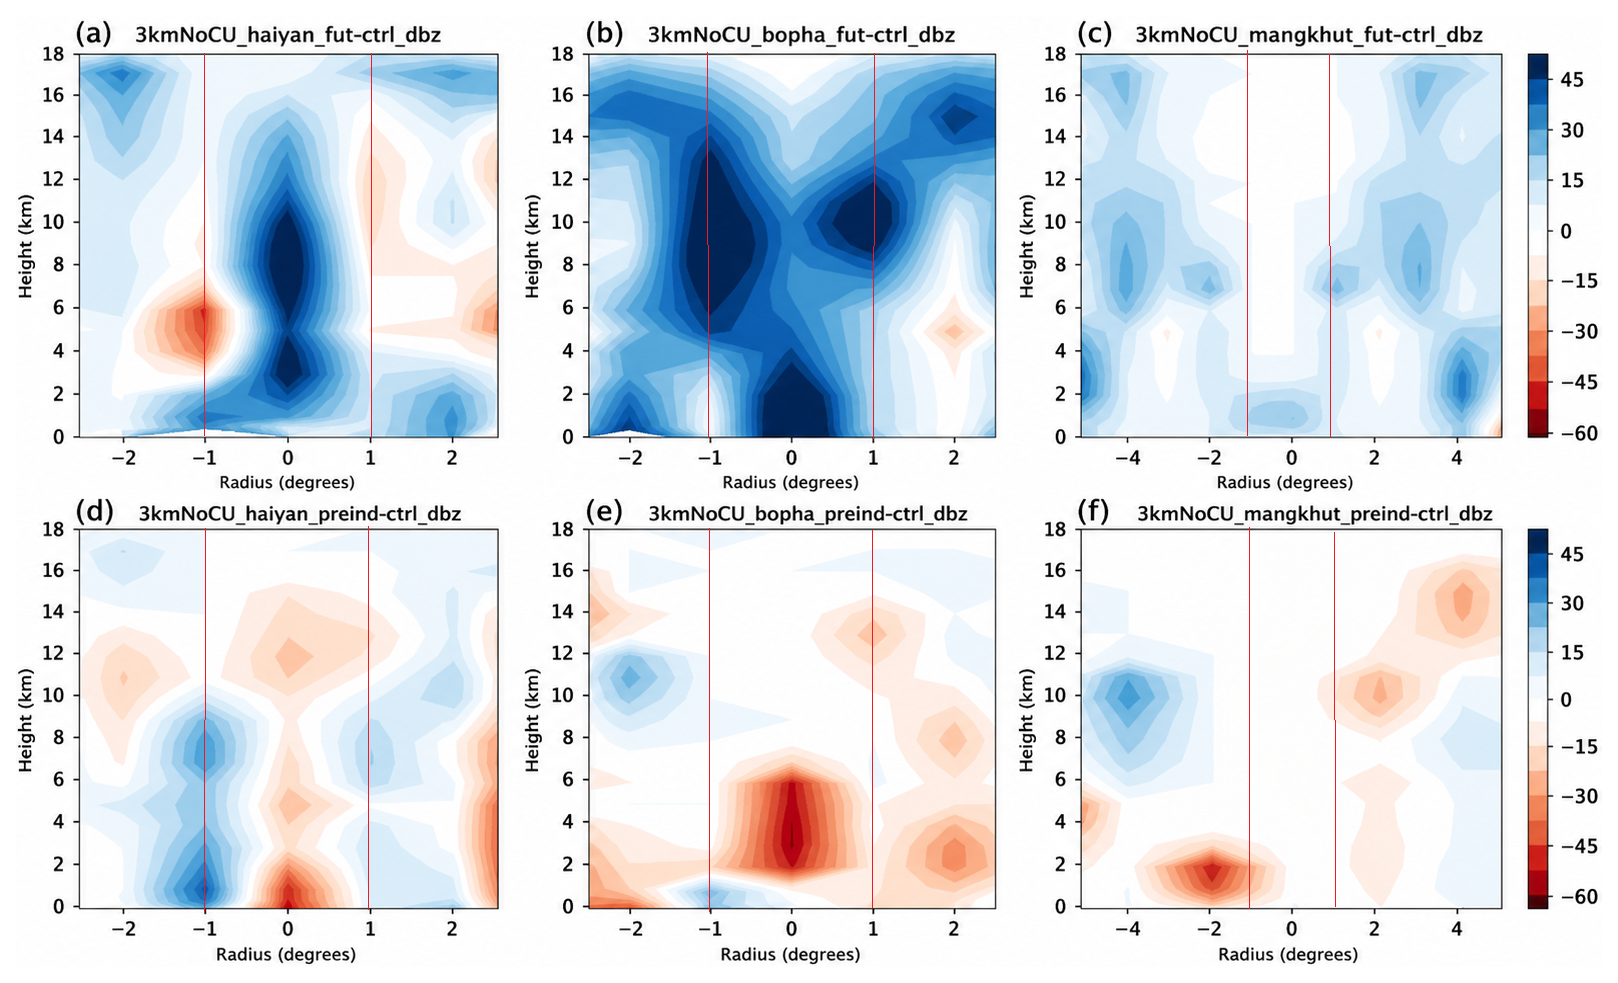
Figure 12Radius (in degrees) – height (in km) cross sections of simulated differences in reflectivity (dBZ) from future minus current, (a–c) and pre-industrial minus current, (d–f) from the 3kmNoCU experiments. All reflectivity fields are at peak intensity while precipitation rates are shown within a 2.5 × 2.5° from the center at peak intensity for Typhoon Haiyan (a, d), Bopha (b, e), and Mangkhut (c, f) with the red vertical lines delineating 1° radius from the center.
Vertical motion (omega) was investigated to better understand the detailed processes governing TC-associated precipitation intensification under different climate conditions (Fig. 13). Our analysis revealed significant regions of enhanced upward motion near the eyewall and along spiral rainbands of Typhoons Haiyan, Bopha, and Mangkhut, primarily within a 1 and 2.5° radius from the TC center. These regions are critical for intense convective activity and high precipitation rates because vigorous updrafts promote condensation and latent heat release. Comparisons between future and current climate simulations show stronger and deeper ascent around the TC core region, consistent with the enhanced reflectivity shown in Fig. 13a–c. The strongest omega anomalies are concentrated in the same regions where reflectivity increases are maximized, reinforcing the interpretation that dynamic strengthening of convection contributes substantially to future rainfall intensification.
Similarly, the pre-industrial-minus-current simulations reveal weaker and shallower ascent relative to the present climate, especially in the inner-core region. This corresponds closely with the weaker reflectivity anomalies in Fig. 13 and suggests that the present climate already supports stronger moisture convergence and more vigorous convection than the pre-industrial environment. Thus, the transition from pre-industrial to current to future climates indicates a progressive strengthening of the vertical overturning circulation and precipitation efficiency of intense TCs.
In our earlier study, Delfino et al. (2023) noted shifts in the vertical profiles of these TC cases that potentially led to intensified rainfall. Additionally, Shi et al. (2024) showed that TCs may evolve not simply through stronger localized updrafts, but through the expansion of deep convective cores while suppressing shallow cumulus and congestus clouds. This structural reorganization implies that, although localized hourly rainfall may scale close to Clausius–Clapeyron expectations, precipitation accumulation over broader storm areas could increase by as much as 18 % per degree of warming. Taken together, Figs. 12 and 13 show that projected TC rainfall increases arise from both thermodynamic and dynamic mechanisms. Increased moisture availability provides the thermodynamic basis for heavier precipitation, while stronger eyewall ascent, deeper convective towers, and broader precipitation cores determine where the largest rainfall intensification occurs. Therefore, the simulated precipitation response is best interpreted as a coupled thermodynamic–dynamic scaling process rather than a purely moisture-driven one.
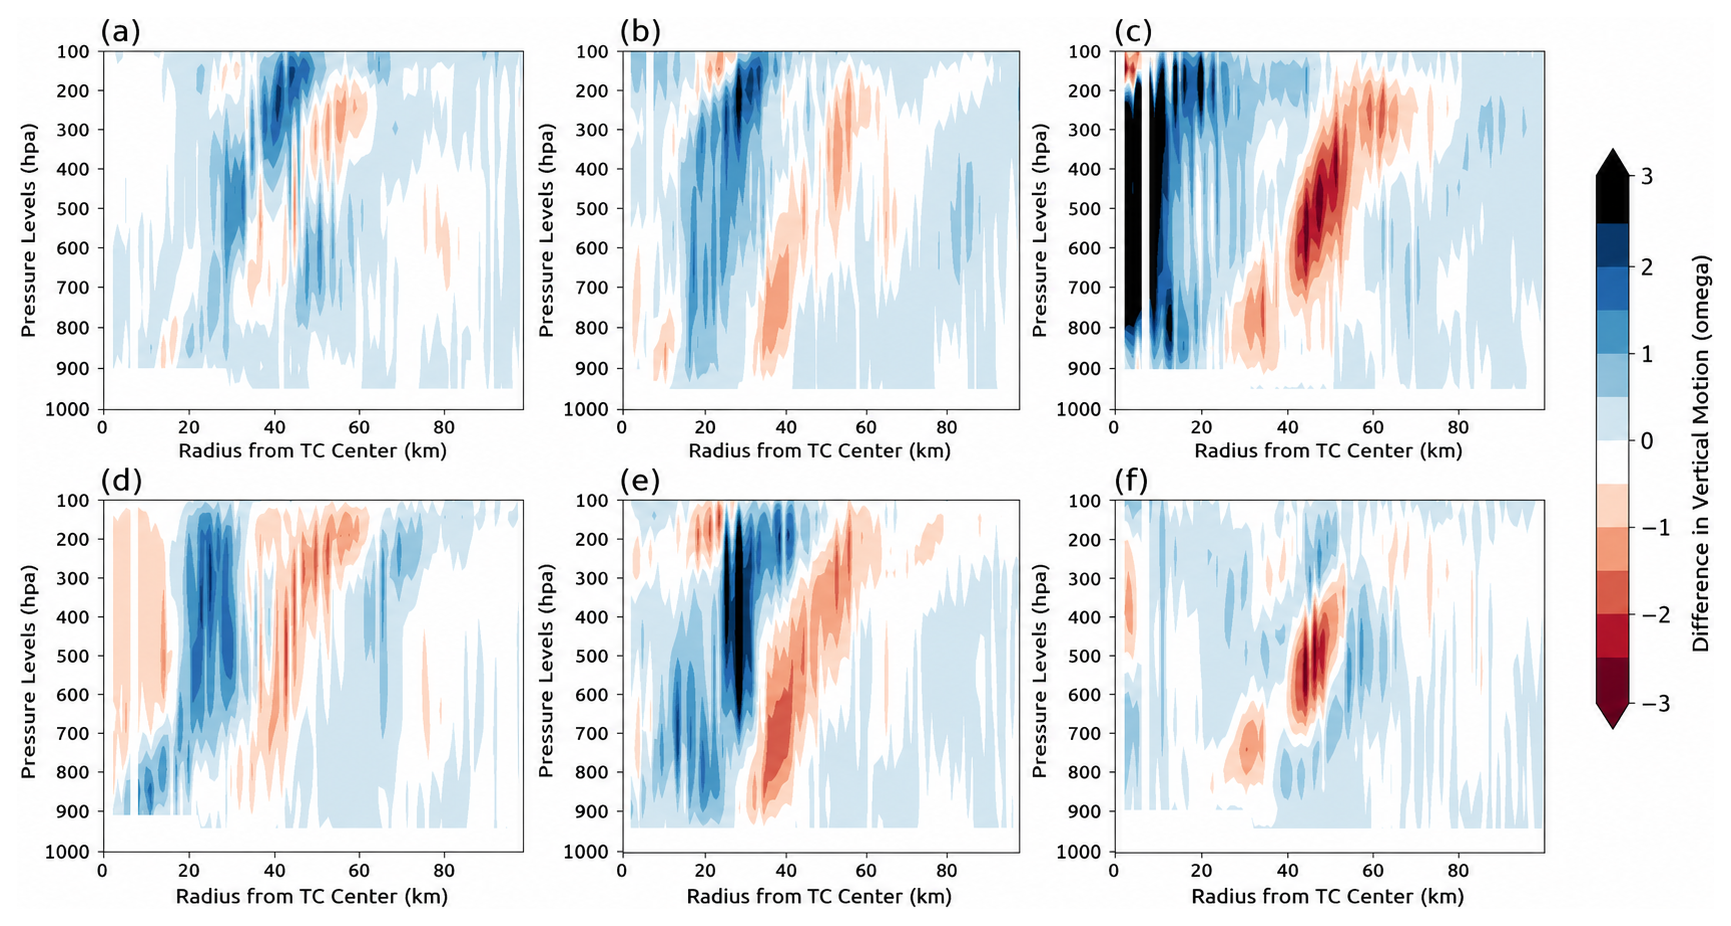
Figure 13Simulated difference in vertical velocity, Omega (hPa s−1) at several levels (1000–100 hPa) within 250 km radius from the TC center for the 3kmNoCU experiments difference between future and current climate (a–c), and difference between current and past climate (d–f) for Typhoons Haiyan (left), Bopha (center) and Mangkhut (right).
This study has investigated the changes in tropical cyclone (TC)-associated precipitation in the Philippines under past (pre-industrial) and future climate scenarios, using a hierarchy of convection-permitting simulations. A key component of this work is the use of the pseudo-global warming (PGW) technique, which is used to simulate the past, present, and future climate conditions by perturbing the TC cases with large scale climate change signals. This framework ensures that the same TC cases are consistently simulated across different climate states, rather than randomly sampling TCs from a climatological dataset. This allows a more physically consistent attribution of TC-associated rainfall changes to different climate forcing. Importantly, this is the first time that such extreme typhoons have been systematically simulated and compared using both convection-permitting and parameterised convection models. Some of the results show a sensitivity to the treatment of convection, while other experiments are relatively insensitive. Overall, the main findings are robust and largely insensitive to this model formulation choice. In alignment with the expectations from Clausius–Clapeyron scaling (CCS) for TCs, the future climate simulations project a robust increase in TC precipitation. Deviations from the expected CCS scaling are attributed to factors such as increased TC intensity, also driven by atmospheric warming.
Under past climate conditions, TC precipitation in the Philippines would have been generally less than that of current climate conditions, with an average change (current – past) in TC inner-core precipitation rates of 6 % and 8 % for the 5kmCU and 3kmNoCU experiments, respectively. The observed changes between the past and current climate align with expectations from CCS, indicating that the atmosphere holds approximately 7 % more water vapor per degree Celsius (°C) increase in surface temperature. Conversely, under future climate scenarios, the FULL simulations conducted under the SSP5-8.5 scenario indicate a robust rise – by approximately 6 % per 1 °C increase in SST in the mean precipitation rates for specific intense TCs, such as Haiyan, Bopha, and Mangkhut, in both the 5kmCU and 3kmNoCU experiments, consistent with CCS expectations.
Based on our simulations, the dynamic process is larger under pre-industrial simulations, and the thermodynamic processes dominate TC rainfall changes under warming. Decomposition analysis shows a robust positive thermodynamic contribution (∼ 20 %–30 %) across all TCs and rainfall metrics, while dynamical contributions are smaller and often negative (∼ −10 % to −30 %), partially offsetting the thermodynamic increase. This leads to substantial TC cases variability: Haiyan shows strong net increases, Bopha exhibits near-cancellation between thermodynamic and dynamical effects, and Mangkhut displays moderate increases with partial dynamic suppression. These results suggest that dynamical dominance indicate that moisture increases set the baseline rainfall response, with dynamics modulating its magnitude and spatial distribution.
Future warming also produces a systematic intensification of rainfall extremes. The upper tail of the rainfall distribution (P99) increases disproportionately, with enhancements exceeding 30 %–40 % in some cases. Additionally, the fractional contribution of heavy rainfall increases, indicating a shift toward more intense, short-duration precipitation events concentrated in the TC inner core. Spatial analyses show that rainfall increases are primarily concentrated within the inner-core region, with some cases exhibiting outer-core weakening or radial contraction of rainfall, particularly for structurally organized storms like Mangkhut. This suggests increased precipitation efficiency near the eyewall under warming.
The relationship between TC intensity and rainfall remains positive in both future and pre-industrial climates. However, warming preferentially enhances the sensitivity of peak rainfall (Pm) to intensity (∼ 7.6 % per m s−1), while bulk metrics (mean rainfall and volume) show little or no enhancement. This indicates that intensity–rainfall scaling strengthens mainly for extreme inner-core precipitation rather than total storm rainfall.
The analysis of simulated reflectivity profiles of the three TC cases reveals further insights into future climate conditions, with increases in both outward and vertical extent of maximum reflectivity indicating more intense and widespread precipitation. This is attributed to enhanced latent heating, which drives stronger updrafts and contributes to a deeper TC core. Mechanistically, the deeper cores lead to intensified updrafts that enhance the lift of moist air, promoting additional adiabatic warming within the TC and further enhancing TC-associated precipitation. This chain of causation aligns with previous studies (e.g., Yamada et al., 2017) that emphasize the role of latent heating in TC dynamics.
Our findings provide crucial insights into how variations in TC intensity and structure influence the scaling relationship between SST and TC-associated precipitation in the Philippines. The heightened intensity of simulated TCs under future climate conditions contributes to increased TC-associated precipitation rates within the inner core, diverging from expected CCS behavior. This supports the notion of the CCS, emphasizing the interplay between atmospheric moistening, TC dynamics, and evolving TC structures.
We recommend that future studies focus on (1) the climatological trends in TC precipitation i.e. effects of climate change and natural climate variabilities on TC precipitation needs to be done with simulations that are able to simulate TCs with good fidelity; (2) the specific impacts of changing TC tracks and the role of atmospheric moisture distribution, and (3) the influence of varying SST patterns and magnitude on TC-associated precipitation in the Philippines. Additionally, further research should investigate the potential effects of land-use changes and urbanization on TC rainfall patterns to provide a more comprehensive understanding of the local impacts of climate change on TCs.
Simulation data are stored at the JASMIN data storage facility and are available upon request from the corresponding author. Code for the WRF model is available at http://www.mmm.ucar.edu/wrf/users/downloads.html (last access: 12 June 2025). WPS geographical input data are available from https://www.mmm.ucar.edu/wrf/users/download/get_sources_wps_geog.html (last access: 23 December 2024). #mandatory.TRACK is available from https://gitlab.act.reading.ac.uk/track/track/-/releases (last access: 23 December 2024). The ERA5 reanalysis datasets used in this study are openly available from https://doi.org/10.24381/cds.adbb2d47 (Hersbach et al., 2023; Copernicus Climate Change Service, 2023). The CEDA-JASMIN facility was used in the analysis and storage of data. The analysis codes and simulation data are available upon request to the corresponding author.
The supplement related to this article is available online at https://doi.org/10.5194/nhess-26-3579-2026-supplement.
Rafaela Jane Delfino (RJD) conceptualized and designed the experiments. Data preparation, simulations and analysis were performed by RJD, with guidance and support particularly in the interpretation of results by Gerry Bagtasa (GB), Pier Luigi Vidale (PLV) and Kevin Hodges (KH). The first draft of the manuscript was written by RJD and all authors contributed to all versions of the manuscript. All authors read and approved the final manuscript.
The contact author has declared that none of the authors has any competing interests.
Publisher's note: Copernicus Publications remains neutral with regard to jurisdictional claims made in the text, published maps, institutional affiliations, or any other geographical representation in this paper. The authors bear the ultimate responsibility for providing appropriate place names. Views expressed in the text are those of the authors and do not necessarily reflect the views of the publisher.
The authors acknowledge JASMIN for providing access to the UK's collaborative data analysis environment (https://www.jasmin.ac.uk, last access: 24 April 2026). They also thank the two anonymous reviewers for their valuable comments and suggestions.
The portion of this study conducted as part of Rafaela Jane Delfino's PhD was supported by a scholarship from the Philippine Commission on Higher Education and the British Council through the Joint Development of Niche Programmes via Philippines–UK Linkages (JDNP) Dual PhD Programme. Kevin Hodges and Pier Luigi Vidale were funded by the UK Research and Innovation Natural Environment Research Council (NCAS grant R8/H12/83/007). The additional analyses conducted by Rafaela Jane Delfino and Gerry Bagtasaw were supported by the University of the Philippines Diliman Natural Sciences Research Institute (NSRI) under the project ESM-24-1-01.
This paper was edited by Joaquim G. Pinto and reviewed by two anonymous referees.
Allen, M. R. and Ingram, W. J.: Constraints on future changes in climate and the hydrologic cycle, Nature, 419, 224–232, https://doi.org/10.1038/nature01092, 2002.
Alvey III, G. R., Zawislak, J., and Zipser, E. J.: Precipitation properties observed during tropical cyclone intensity change, Mon. Weather Rev., 143, 4476–4492, https://doi.org/10.1175/MWR-D-15-0065.1, 2015.
Bagtasa, G.: Contribution of tropical cyclones to precipitation in the Philippines, J. Climate, 30, 3621–3633, https://doi.org/10.1175/JCLI-D-16-0150.1, 2017.
Bagtasa, G.: Variability of tropical cyclone precipitation volume in the Philippines, Int. J. Climatol., 42, 7573–7588, https://doi.org/10.1002/joc.7573, 2022.
Cha, E. J., Knutson, T. R., Lee, T. C., Ying, M., and Nakaegawa, T.: Third assessment on impacts of climate change on tropical cyclones in the Typhoon Committee Region – Part II: Future projections, Trop. Cyclone Res. Rev., 9, 75–86, https://doi.org/10.1016/j.tcrr.2020.04.005, 2020.
Chen, J., Toumi, R., Zhang, L., Lu, M., Xi, D., and Shi, X.: Radial rainfall pattern changes of intense over-ocean tropical cyclones under global warming: Insights from an MRI HighRes CMIP6 simulation, Geophys. Res. Lett., 52, https://doi.org/10.1029/2025GL116146, 2025.
Copernicus Climate Change Service: ERA5 hourly data on single levels from 1940 to present, Copernicus Climate Change Service (C3S) Climate Data Store (CDS) [data set], https://doi.org/10.24381/cds.adbb2d47, 2023.
DeMaria, M., Mainelli, M., Shay, L. K., Knaff, J. A., and Kaplan, J.: Further improvement to the Statistical Hurricane Intensity Prediction Scheme (SHIPS), Weather Forecast., 20, 531–543, https://doi.org/10.1175/WAF862.1, 2005.
Delfino, R. J. P., Vidale, P. L. V., Bagtasa, G., and Hodges, K.: Response of damaging tropical cyclone events in the Philippines to climate forcings from selected CMIP6 models using the pseudo global warming technique, Clim. Dynam., 61, 6743–6765, https://doi.org/10.1007/s00382-023-06742-6, 2023.
Delfino, R. J. P., Hodges, K., Vidale, P. L. V., and Bagtasa, G.: Sensitivity of Philippine historically damaging tropical cyclone events to surface and atmospheric temperature forcings, Reg. Stud. Mar. Sci., 69, 103595, https://doi.org/10.1016/j.rsma.2024.103595, 2024.
Eyring, V., Bony, S., Meehl, G. A., Senior, C. A., Stevens, B., Stouffer, R. J., and Taylor, K. E.: Overview of the Coupled Model Intercomparison Project Phase 6 (CMIP6) experimental design and organization, Geosci. Model Dev., 9, 1937–1958, https://doi.org/10.5194/gmd-9-1937-2016, 2016.
Held, I. M. and Soden, B. J.: Robust responses of the hydrological cycle to global warming, J. Climate, 19, 5686–5699, https://doi.org/10.1175/JCLI3990.1, 2006.
Hersbach, H., Bell, B., Berrisford, P., Biavati, G., Horányi, A., Muñoz Sabater, J., Nicolas, J., Peubey, C., Radu, R., Rozum, I., Schepers, D., Simmons, A., Soci, C., Dee, D., and Thépaut, J.-N.: ERA5 hourly data on single levels from 1940 to present, Copernicus Climate Change Service (C3S) Climate Data Store (CDS) [data set], https://doi.org/10.24381/cds.adbb2d47, 2023.
Hendricks, E. A., Peng, M. S., Fu, B., and Li, T.: Quantifying environmental control on tropical cyclone intensity change, Mon. Weather Rev., 138, 3243–3271, https://doi.org/10.1175/2010MWR3185.1, 2010.
Hodges, K., Cobb, A., and Vidale, P. L.: How well are tropical cyclones represented in reanalysis datasets?, J. Climate, 30, 5243–5264, https://doi.org/10.1175/JCLI-D-16-0557.1, 2017.
Hodges, K. I. and Klingaman, N. P.: Prediction errors of tropical cyclones in the western North Pacific in the Met Office global forecast model, Weather Forecast., 34, 1189–1209, https://doi.org/10.1175/WAF-D-19-0005.1, 2019.
Huprikar, A. S., Stansfield, A. M., and Reed, K. A.: A storyline analysis of Hurricane Irma's precipitation under various levels of climate warming, Environ. Res. Lett., 19, 014004, https://doi.org/10.1088/1748-9326/ad0c89, 2024.
Intergovernmental Panel on Climate Change (IPCC): Climate Change 2021: The Physical Science Basis, Cambridge University Press, https://doi.org/10.1017/9781009157896, 2021.
Kaplan, J., DeMaria, M., and Knaff, J. A.: A revised tropical cyclone rapid intensification index for the Atlantic and eastern North Pacific basins, Weather Forecast., 25, 220–241, https://doi.org/10.1175/2009WAF2222280.1, 2010.
Kaplan, J., Rozoff, C. M., DeMaria, M., Sampson, C. R., Kossin, J. P., Velden, C. S., Cione, J. J., Dunion, J. P., Knaff, J. A., Zhang, J. A., Dostalek, J. F., Hawkins, J. D., Lee, T. F., and Solbrig, J. E.: Evaluating environmental impacts on tropical cyclone rapid intensification predictability utilizing statistical models, Weather Forecast., 30, 1374–1396, https://doi.org/10.1175/WAF-D-15-0032.1, 2015.
Knutson, T. R., Camargo, S. J., Chan, J. C. L., Emanuel, K., Ho, C.-H., Kossin, J., Mohapatra, M., Satoh, M., Sugi, M., Walsh, K., and Wu, L.: Tropical cyclones and climate change assessment: Part II: Projected response to anthropogenic warming, B. Am. Meteorol. Soc., 101, E303–E322, https://doi.org/10.1175/BAMS-D-18-0194.1, 2020.
Knutson, T. R., Chung, M. V., Vecchi, G., Sun, J., Hsieh, T.-L., and Smith, A. J. P.: Climate change is probably increasing the intensity of tropical cyclones, ScienceBrief Review, in: Critical Issues in Climate Change Science, edited by: Le Quéré, C., Liss, P., and Forster, P., ScienceBrief, https://doi.org/10.5281/zenodo.4570334, 2021.
Kossin, J. P.: A global slowdown of tropical-cyclone translation speed, Nature, 558, 104–107, https://doi.org/10.1038/s41586-018-0158-3, 2018.
Kubota, H. and Chan, J. C. L.: Interdecadal variability of tropical cyclone landfall in the Philippines from 1902 to 2005, Geophys. Res. Lett., 36, L12802, https://doi.org/10.1029/2009GL038108, 2009.
Kubota, H. and Wang, B.: How much do tropical cyclones affect seasonal and interannual rainfall variability over the western North Pacific?, J. Climate, 22, 5495–5510, https://doi.org/10.1175/2009JCLI2646.1, 2009.
Liu, M., Vecchi, G. A., Smith, J. A., and Murakami, H.: Causes of large projected increases in hurricane precipitation rates with global warming, npj Clim. Atmos. Sci., 2, 38, https://doi.org/10.1038/s41612-019-0095-3, 2019.
Macalalad, R. V., Delfino, R. J. P., Badilla, R. A., Paat Jr., S. F., and Bagtasa, G.: Role of historical warming on the extreme flooding event due to Typhoon Vamco (Ulysses) 2020 in the Philippines, Philipp. J. Sci., 152, 197–212, 2023.
O'Gorman, P. A.: Precipitation extremes under climate change, Curr. Clim. Change Rep., 1, 49–59, https://doi.org/10.1007/s40641-015-0009-3, 2015.
Patricola, C. M. and Wehner, M. F.: Anthropogenic influences on major tropical cyclone events, Nature, 563, 339–346, https://doi.org/10.1038/s41586-018-0673-2, 2018.
Pendergrass, A. G. and Hartmann, D. L.: Two modes of change of the distribution of rain, J. Climate, 27, 8357–8371, https://doi.org/10.1175/JCLI-D-14-00182.1, 2014.
Ribera, P., García-Herrera, R., Gimeno, L., and Hernández, E.: Typhoons in the Philippine Islands, 1901–1934, Clim. Res., 29, 85–90, https://doi.org/10.3354/cr029085, 2005.
Rotunno, R. and Emanuel, K. A.: An air–sea interaction theory for tropical cyclones. Part II: Evolutionary study using a nonhydrostatic axisymmetric numerical model, J. Atmos. Sci., 44, 542–561, https://doi.org/10.1175/1520-0469(1987)044<0542:AAITFT>2.0.CO;2, 1987.
Ruan, Z. and Wu, Q.: Precipitation, convective clouds, and their connections with tropical cyclone intensity and intensity change, Geophys. Res. Lett., 45, 1098–1105, https://doi.org/10.1002/2017GL076611, 2018.
Schär, C., Frei, C., Lüthi, D., and Davies, H. C.: Surrogate climate-change scenarios for regional climate models, Geophys. Res. Lett., 23, 669–672, https://doi.org/10.1029/96GL00265, 1996.
Shi, X., Liu, Y., Chen, J., Chen, H., Wang, Y., Lu, Z., Wang, R.-Q., Fung, J. C.-H., and Ng, C. W. W.: Escalating tropical cyclone precipitation extremes and landslide hazards in South China under global warming, npj Clim. Atmos. Sci., 7, 107, https://doi.org/10.1038/s41612-024-00654-w, 2024.
Skamarock, W. C., Klemp, J. B., Dudhia, J., Gill, D. O., Barker, D. M., Duda, M. G., Huang, X.-Y., Wang, W., and Powers, J. G.: A description of the Advanced Research WRF version 3, NCAR Technical Note NCAR/TN-475+STR, National Center for Atmospheric Research, Boulder, Colorado, https://doi.org/10.5065/D68S4MVH, 2008.
Stansfield, A. M. and Reed, K. A.: Global tropical cyclone precipitation scaling with sea surface temperature, npj Clim. Atmos. Sci., 6, 60, https://doi.org/10.1038/s41612-023-00391-6, 2023.
Tao, C. and Jiang, H.: Distributions of shallow to very deep precipitation-convection in rapidly intensifying tropical cyclones, J. Climate, 28, 8791–8824, https://doi.org/10.1175/JCLI-D-14-00448.1, 2015.
Tierra, M. C. M. and Bagtasa, G.: Identifying the rapid intensification of tropical cyclones using the Himawari-8 satellite and their impacts in the Philippines, Int. J. Climatol., 43, 1–16, https://doi.org/10.1002/joc.7696, 2023.
Trenberth, K. E. and Shea, D. J.: Relationships between precipitation and surface temperature, Geophys. Res. Lett., 32, L14703, https://doi.org/10.1029/2005GL022760, 2005.
Villarini, G., Lavers, D. A., Scoccimarro, E., Zhao, M., Wehner, M. F., Vecchi, G. A., Knutson, T. R., and Reed, K. A.: Sensitivity of tropical cyclone rainfall to idealized global-scale forcings, J. Climate, 27, 4622–4641, https://doi.org/10.1175/JCLI-D-13-00780.1, 2014.
Walsh, K. J. E., Camargo, S. J., Knutson, T. R., Kossin, J., Lee, T.-C., Murakami, H., and Patricola, C.: Tropical cyclones and climate change, Trop. Cyclone Res. Rev., 8, 240–250, https://doi.org/10.1016/j.tcrr.2020.01.004, 2019.
Xi, D., Wang, S., and Lin, N.: Analyzing relationships between tropical cyclone intensity and rain rate over the ocean using numerical simulations, J. Climate, 36, 81–91, https://doi.org/10.1175/JCLI-D-22-0141.1, 2023.
Yamada, Y., Satoh, M., Sugi, M., Kodama, C., Noda, A. T., Nakano, M., and Nasuno, T.: Response of tropical cyclone activity and structure to global warming in a high-resolution global nonhydrostatic model, J. Climate, 30, 9703–9724, https://doi.org/10.1175/JCLI-D-17-0068.1, 2017.
Yang, Y. and Toumi, R.: Large dynamic contributions to tropical cyclone precipitation with increasing sea surface temperature, Environ. Res. Lett., 20, 074013, https://doi.org/10.1088/1748-9326/add753, 2025.
Yumul, G. P., Servando, N. T., Suerte, L. O., Magarzo, M. Y., Juguan, L. V. V., and Dimalanta, C. B.: Tropical cyclone–southwest monsoon interaction and the 2008 floods and landslides in Panay Island, central Philippines: meteorological and geological factors, Nat. Hazards, 62, 827–840, https://doi.org/10.1007/s11069-012-0109-5, 2012.