the Creative Commons Attribution 4.0 License.
the Creative Commons Attribution 4.0 License.
 | 16 Jan 2026
Deciphering the drivers of direct and indirect damages to companies from an unprecedented flood event: A data-driven, multivariate probabilistic approach
Guilherme Samprogna Mohor
Annegret H. Thieken
Meike Müller
Heidi Kreibich
Floods are among the most destructive natural hazards, causing extensive damage to companies through direct impacts on assets and prolonged business interruptions. The July 2021 flood in Germany caused unprecedented damage, particularly in North Rhine-Westphalia and Rhineland-Palatinate, affecting companies of all sizes. While the drivers of company damages from riverine flooding are well documented, the drivers of both direct and indirect damages during an extreme flash flood event have not yet been examined. This study addresses this gap using survey data from 431 companies affected by the July 2021 flood. Results show that 62 % of companies incurred direct damages exceeding EUR 100 000. Machine learning models and Bayesian network analyses identify water depth and flow velocity as the primary drivers of both direct damage and business interruption. However, company characteristics (e.g., size premise, number of employees) and preparedness also play critical roles. Companies that implemented precautionary measures experienced significantly shorter business interruption durations – up to 58 % for water depths below 1 m and 44 % for depths above 2 m. These findings offer important insights for policy development and risk-informed decision-making. Incorporation of behavioural indicators into flood risk management strategies and improving early warning systems could significantly enhance business preparedness.
- Article
(4073 KB) - Full-text XML
-
Supplement
(902 KB) - BibTeX
- EndNote


Understanding the damage processes of companies during unprecedented floods is essential to increase their resilience and avoid catastrophic economic disruption. Unprecedented floods are particularly destructive, as management measures often fail during events of a magnitude not experienced before by locals (Kreibich et al., 2022). In Europe, unprecedented flash floods caused EUR 14.36 billion of damage in Spain in October 2024 (Munich Re, 2025) and about EUR 33 billion of damage in Germany in July 2021 (Munich Re, 2022), additionally, such unprecedented floods are expected to become more frequent with increasing climate change (Blöschl et al., 2017; Hirabayashi et al., 2013; Merz et al., 2021).
Damages to companies constitutes a significant portion of the total flood loss (Schoppa et al., 2020). Direct damages arise from the immediate physical contact of the flood water with assets, such as damage to buildings, equipment, goods, and stock. The June 2013 flood in Germany revealed that 32.4 % of the total damage in Bavaria and 13.9 % of the total damage in Saxony were attributed to companies, respectively (Thieken et al., 2016). On the other hand, indirect damages stem from disruptions caused by the flooding, such as business interruptions and restrictions (Jongman et al., 2012). In surveys conducted after the floods, 88 % of affected companies reported that they had been significantly affected by business interruptions (Thieken et al., 2016). The severity of indirect damages can be equally significant and, in the case of rare and high-impact flood events, may even exceed direct damages (Koks et al., 2015; Pfurtscheller and Vetter, 2015; Sieg et al., 2019). For instance, Pfurtscheller and Vetter (2015) reported that indirect damages are often underestimated by companies. Using an Input-Output (IO) model, Li et al. (2018) showed that business interruptions and operational restrictions in Shanghai's manufacturing firms can propagate along interlinked value chains, with indirect damages under extreme storm flood scenarios reaching up to USD 60 billion. Similarly, Sieg et al. (2019) employed a supply-side IO model and identified the manufacturing, and financial sectors vulnerable to indirect damages. Altogether, these studies underscore that indirect damages, especially during low-probability, high-impact flood events, can be substantial and warrant systematic investigation to better understand the processes.
The process of understanding flood damage to companies is complex due to their heterogeneous nature and is influenced by several factors. Kreibich et al. (2010) examine factors such as water depth, sector, company size, precautionary measures, and contamination to assess direct flood damage. While the study provides valuable insights, it acknowledges that the impact of precautionary measures and contamination on flood damages is not fully understood. Seifert et al. (2010) estimated direct flood damage at the mesoscale and highlighted the need for a deeper understanding of damage processes in high water depth scenarios. Nafari et al. (2016), focusing on Australian commercial structures, demonstrated that considering building characteristics in addition to water depth led to improved model performance, with lower bias and mean absolute error. Schoppa et al. (2020) analyzed comprehensive survey datasets collected after major flood events between 2002 and 2013 in the Danube, Elbe, Oder, and Rhine catchments. Their study identified water depth and precautionary measures as primary factors for building damage, while damage to equipment, goods, and stock was strongly influenced by company characteristics such as sector, size, and precautionary measures. Schoppa et al. (2022) developed a socio-hydrological model using water depth and precautionary measures for estimating building damage. The study revealed that companies in Dresden, Germany reduced vulnerability through the implementation of precautionary measures. Significant progress has been made in identifying the variables that have explanatory power in estimating direct damages to companies. While both the 2002 and 2021 floods in Germany were considered unprecedented in different ways, the 2021 event stands out due to its exceptional event magnitude, rapid onset, and high death toll (Rhein and Kreibich, 2025; Thieken et al., 2023a). Given its rare nature and distinct damage dynamics, this study focuses specifically on the 2021 flood event to better understand the factors contributing to direct damages.
Deciphering the factors of indirect damages, such as business interruption and business restriction, is also crucial for mitigating their contribution to the overall economic consequences. Yang et al. (2016) modeled business interruption losses using water depth data collected from business surveys conducted after the Tokai Heavy Rain in Japan. The model showed a better fit for reported losses at lower inundation levels, but it overestimated losses in areas with deeper inundation. Sultana et al. (2018) highlighted that company-specific attributes, such as the number of employees and emergency measures, often play a more critical role in estimating business interruption costs than water depth. Endendijk et al. (2024) investigated the relationship between flood characteristics and business interruptions using post-disaster survey data from the 2021 flood in the Netherlands. They identified water depth, delayed compensation, and regional connectivity as critical factors affecting business interruption duration, while building-level mitigation measures were found to have limited influence, highlighting an area for further exploration. The study by Kabirzad et al. (2024) found that proximity to the river and the profitability of business premises were significant factors contributing to indirect flood damages to company buildings in Peninsular Malaysia. Sakai and Yao (2023) underscore the vulnerability of small companies, which suffer disproportionately higher damages relative to turnover compared to larger companies. Business interruption, largely driven by temporary closures and reduced sales, is identified as the most significant damage across sectors. Despite these advancements, a significant research gap persists in understanding the factors influencing indirect damages during unprecedented flood events.
Adaptation to flood risk encompasses a range of measures aimed at reducing vulnerability and exposure to flood impacts. These can be broadly categorized into short-term emergency responses, such as evacuation or temporary protection, and long-term precautionary strategies, including elevating buildings or relocating critical infrastructure (Neise and Revilla Diez, 2019). While emergency measures require a degree of preparedness, they are reactive and distinct from long-term adaptation strategies (Wutzler et al., 2022). Understanding the effectiveness of adaptation behaviors during unprecedented events is crucial in determining whether these measures can mitigate damages or fail. Kreibich et al. (2007) noted that the effectiveness of such measures depends on factors like prior flood experience, emergency plans, and early warning systems. Jehmlich et al. (2020) further investigated the drivers behind flood-adaptive behavior and reported that firsthand flood experience increases the likelihood of companies adopting precautionary measures. However, the lack of property ownership can hinder property-level adaptation, as companies are less inclined to invest in resilience measures for rented properties. In fact, Hudson et al. (2022) found only little difference between the adaptation of small and medium companies on the one hand and private households on the other hand. Leitold et al. (2021) examined adaptation strategies and found that the manufacturing sector tends to adopt reactive or temporary measures rather than long-term, proactive strategies. Wutzler et al. (2022) identified perceived low self-efficacy as a barrier to proactive adaptation. The study also noted that property ownership plays a significant role, with property owners more likely to adopt adaptive measures than tenants. Companies with extensive flood experience and low response costs are more likely to engage in proactive adaptation. Furthermore, Hudson and Thieken (2022) investigated the potential presence of moral hazard, suggesting that increased insurance coverage may discourage precautionary measures. Using German data between 2002 and 2013, it was found that there's an indication after 2005 that insurance coverage lowered businesses' intentions to employ more adaptation measures. Despite these findings, the interaction between adaptation strategies and flood damage remains unclear during rare events.
This study aims to build on existing advancements to gain a deeper understanding of the processes underlying both direct and indirect flood damages, particularly in the context of rare events. To achieve this, we analyze data collected in the aftermath of the 2021 flood in Germany. The objectives of this study are:
-
To assess the type and extent of flood damage across companies of varying sizes.
-
To identify the key factors influencing direct damages (to buildings, equipment, and goods and stock) and indirect damages (particularly business interruptions and restriction durations) using machine learning techniques (Random Forest, Elastic Net, and XGBoost).
-
To develop a multivariate probabilistic model using Bayesian networks to derive predictive density estimates of damages, including median values and uncertainty ranges, across a range of hazard and exposure scenarios.
2.1 Survey data
The July 2021 flood in Germany has been widely described as unprecedented in terms of its hydrological magnitude, spatial extent, exceeding the scale and severity of previously recorded floods in the affected regions (Mohr et al., 2023; Thieken et al., 2023b; Zander et al., 2023) and it caused an estimated EUR 33.1 billion in direct damages and EUR 7.1 billion in indirect damages (Trenczek et al., 2022). In the affected regions of North Rhine-Westphalia (NRW) and Rhineland-Palatinate (RLP), thousands of companies were severely impacted. According to BMI and BMF (2022), approximately 7000 companies in NRW and 3000 in RLP were affected by the flood. The German Insurance Association (GDV, 2023) reported 27 000 insured claims from companies, with claims expenditures totaling EUR 2.4 billion in NRW and EUR 0.9 billion in RLP.
To assess the impacts of the July 2021 flood on companies in NRW and RLP, a telephone survey was conducted between 8 November 2022 and 31 January 2023. The goal of the survey was to collect data on damages, influencing factors, the reconstruction process, and the preparedness and precautionary measures undertaken by the companies. The survey questionnaire was adapted from former surveys (Kreibich et al., 2007; Thieken et al., 2017) to ensure consistency in data collection. A total of 434 companies participated in the survey, with an average interview duration of 42 min. The response rate was approximately 14 %, with 608 refusals, 76 cancelled or unarranged surveys, and 1886 companies that could not be reached by telephone. Three responses, which were referred to multiple business locations, including educational institutions and administrative buildings, were excluded from the analysis, which ultimately included 431 valid responses. Of the companies surveyed, 258 (60 %) were located in NRW and 173 (40 %) were based in RLP.
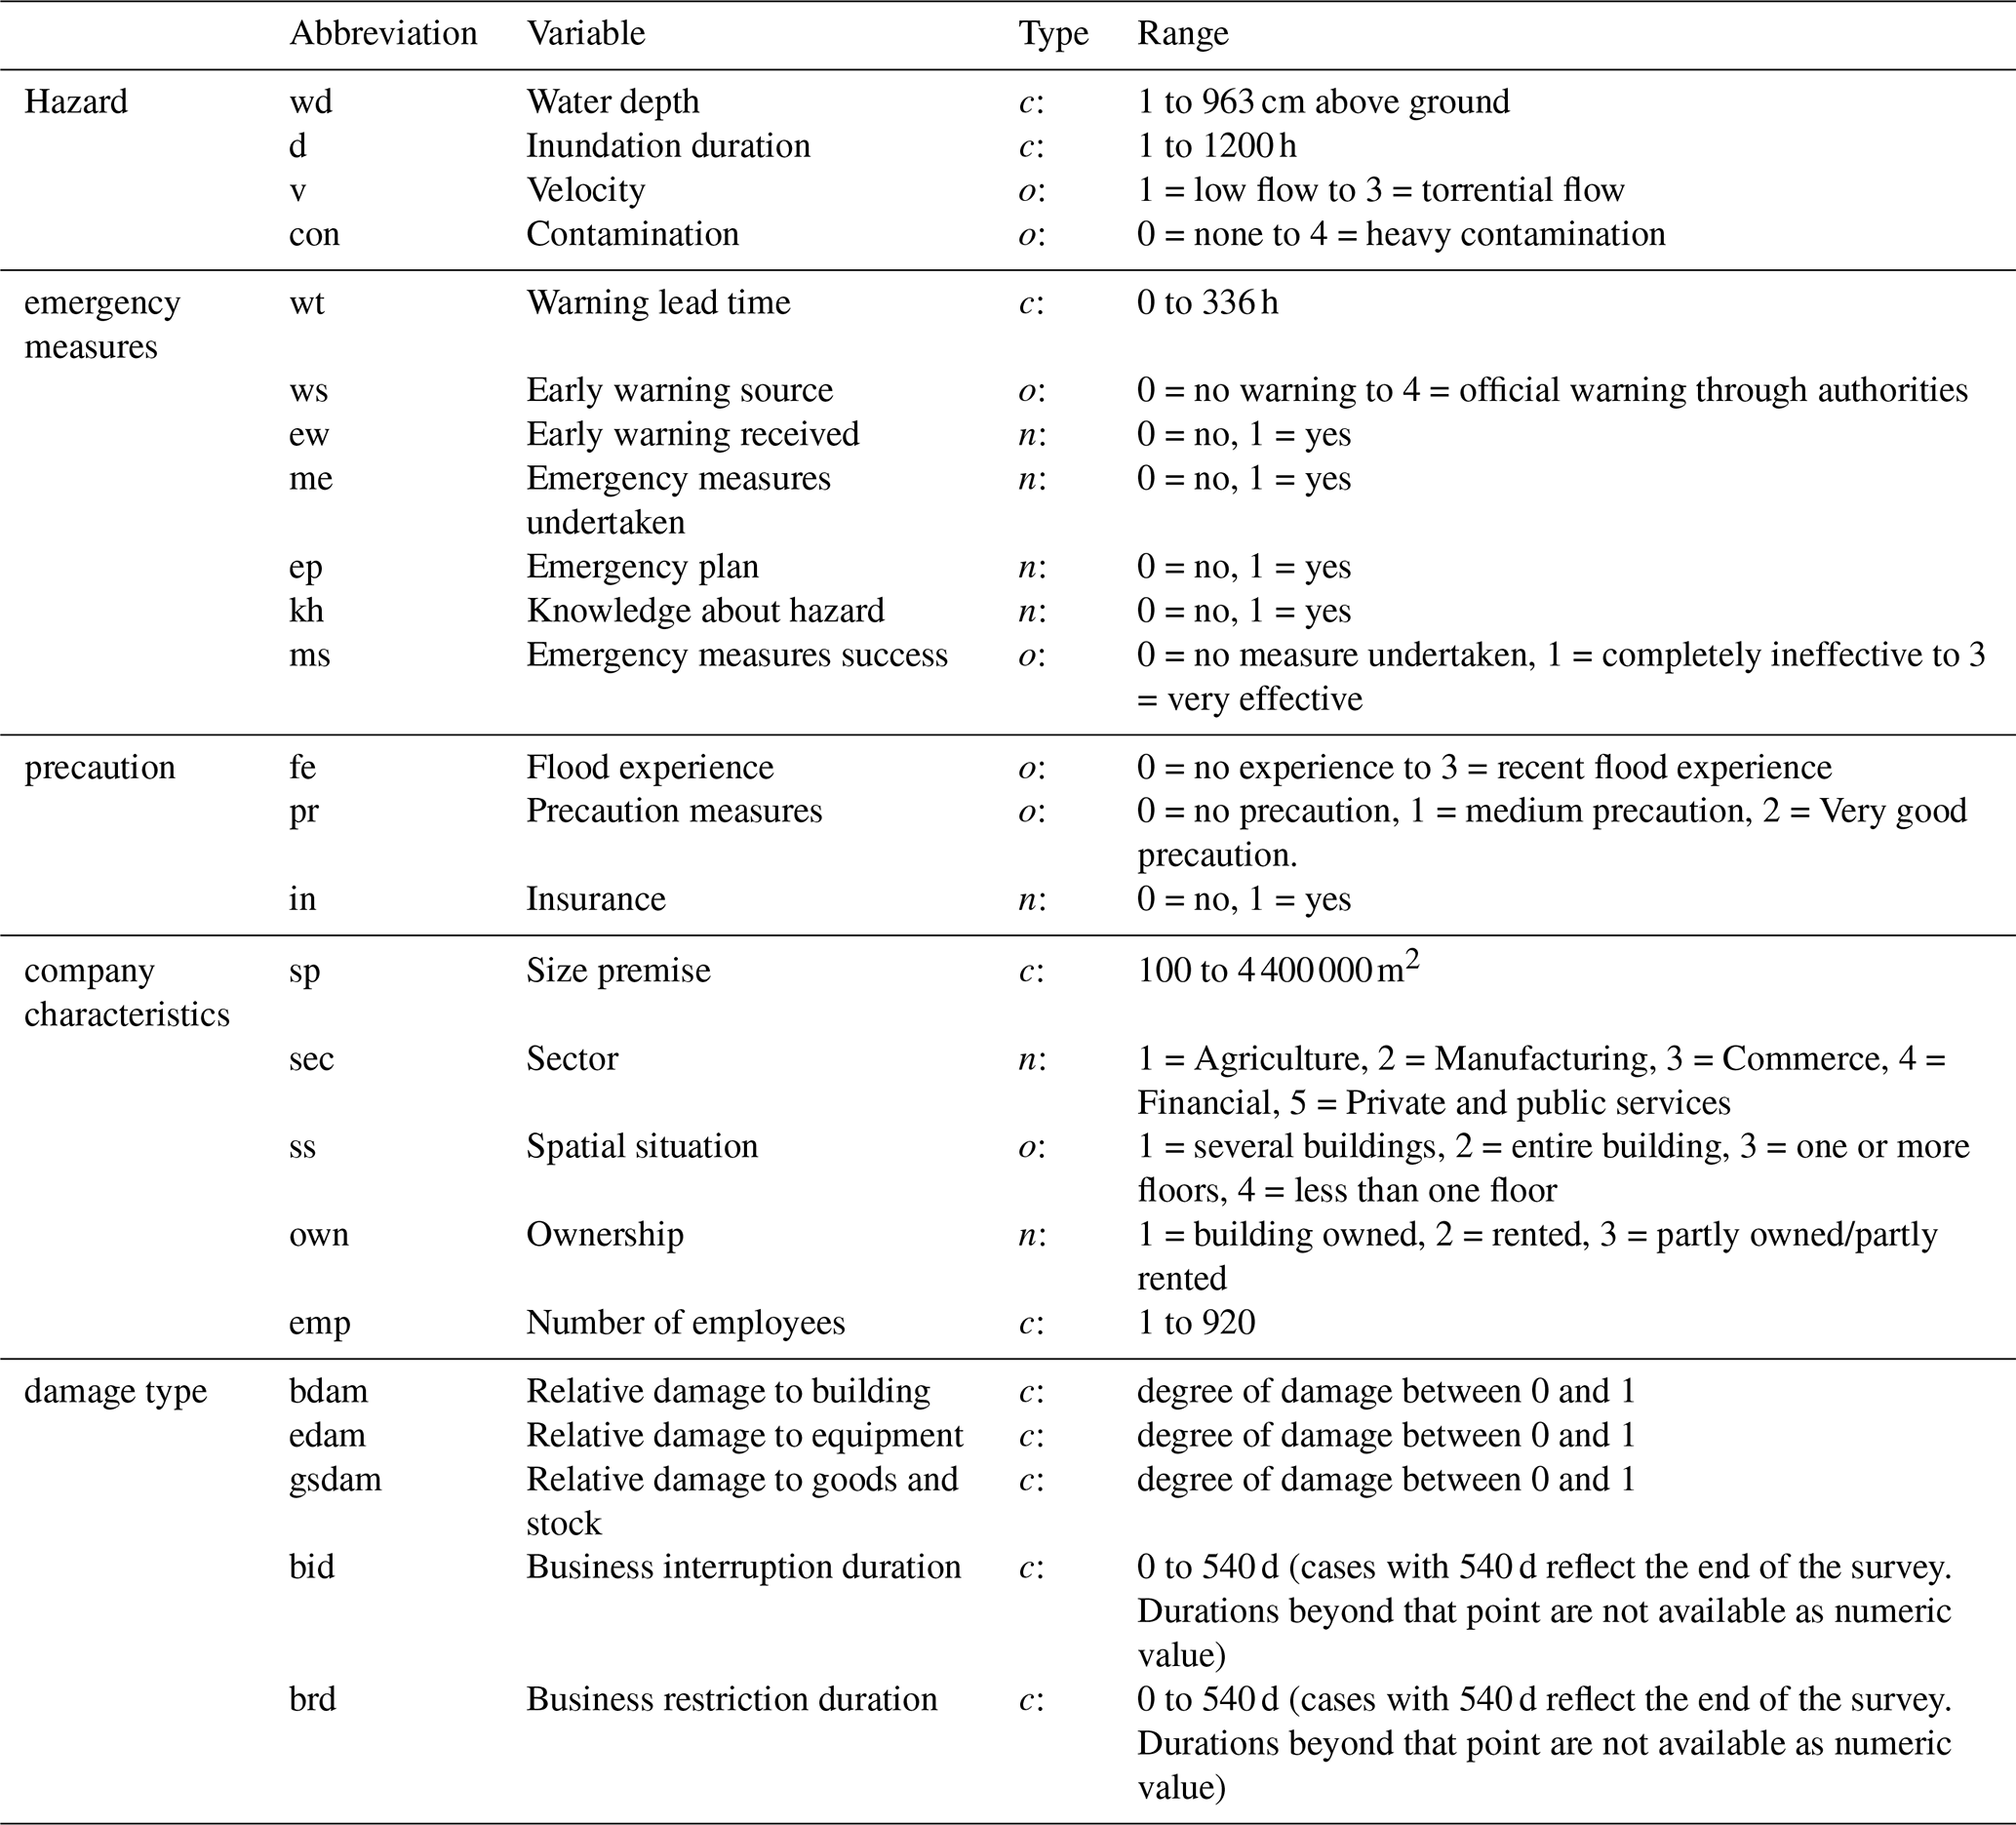
The surveyed variables were grouped into five categories: hazard, emergency measures, precaution, company characteristics, and damage type. The variable types and ranges are outlined in Table 1. Table A1 provides an overview of all variables, including survey questions, and response options. All variables were included in the data-driven analysis to identify the most influential factors for each damage type. We analyzed the damage types separately for two main reasons. First, this approach allowed us to capture asset-specific processes and identify distinct drivers for each category (e.g., buildings, equipment, goods and stock, business interruption), which can behave very differently during a rare flood event. Second, the dataset had varying levels of completeness across damage types: some companies reported only building damages, while others provided data on equipment or business interruption. By analyzing them separately, we were able to make use of larger and more reliable subsamples, rather than restricting the analysis to the smaller set of companies with complete data across all damage types. For each damage type, the percentage of missing values per variable was less than 10 %, as some companies did not provide responses (Fig. S1 in the Supplement). To avoid reducing the sample size, we employed the k-nearest neighbor technique with k=5 (Zhang and Tian, 2025) to impute the missing data across the dataset. We used the Gower distance to calculate similarity between observations, which is ideal for a dataset with different types of variables (continuous, nominal, and ordinal) (Kowarik and Templ, 2016). We calculated the average Gower distance between each row with missing data and its 5 nearest neighbors. The mean of these distances across all rows with missing values was approximately 0.09, indicating that imputation was performed among observations that were relatively similar in terms of their characteristics. Also, we conducted a sensitivity analysis using k values of 1, 3, 7, and 9, and the findings were insensitive to the choice of k.
Table 1List of factors influencing direct and indirect flood damages to companies. The variable type “c” stands for continuous, “o” for ordinal and “n” for nominal. The overview of all the variables is provided in Table A1.
2.2 Variable Selection
Flood damage processes vary by region, flood type, and asset type (Mohor et al., 2020; Sairam et al., 2019; Wagenaar et al., 2018). Since our analysis focuses on flash floods and covers five different asset types, we use a data-driven approach to identify which variables strongly influence these diverse outcomes. We adopt a feature selection approach that is robust to multicollinearity and capable of capturing nonlinear relationships and interactions. To this end, we employ three complementary machine learning techniques: Elastic Net (EN), Random Forest (RF), and Extreme Gradient Boosting (XGBoost). EN efficiently handles multicollinearity and performs variable selection through regularization; RF captures nonlinear relationships and complex interactions via ensemble decision trees; and XGBoost, a gradient boosting algorithm, provides high predictive accuracy and models intricate dependencies. By combining the strengths of these methods, we ensure a comprehensive assessment of variable importance. To mitigate potential biases from relying on a single model, we aggregate the variable importance scores across all three methods to derive a final ranking.
2.2.1 Elastic Net
Elastic Net (EN) balances variable selection and model fitting, making it suitable for handling multicollinearity (Tay et al., 2023). It combines the strengths of both Lasso and Ridge regression. Lasso promotes sparsity by driving less important coefficients to zero, effectively performing variable selection. Whereas, Ridge shrinks all coefficients to stabilize the model in the presence of highly correlated variables. The EN objective function is given by (Zou and Hastie, 2005):
Where n is the number of samples (excluding one fold for cross-validation), p is the number of variables (19 in this case), yi represents the response for ith sample, and Xi is the corresponding variable vector. The coefficient βj represents the effect of the jth variable. The hyperparameter α controls the strength of the regularization, while λ determines the balance between Ridge (λ=0) and Lasso (λ=1) regression. The regression coefficients β were obtained by minimizing the Obj(β). The optimal hyperparameters (α,λ) were selected based on the lowest mean absolute error (MAE) obtained from the nested cross validation (see S1 in the Supplement). The use of MAE as the objective function treats residuals symmetrically, ensuring that both small and large errors are proportionally considered. This metric is robust to outliers and provides an interpretable measure of error in the same units as the response variables i.e., relative loss (0–1) and duration (0–540 d). We implemented EN using the ElasticNet package from scikit-learn python library (Pedregosa et al., 2011). Predictions for the test dataset (Xt) were computed as:
Where yt represents the predicted values. Elastic Net is a powerful linear model that is effective in handling multicollinearity. However, in its standard application without explicit transformations, it primarily captures linear associations and cannot model complex nonlinear relationships directly.
2.2.2 Random Forest
Random Forest (RF) is an ensemble learning method that improves predictive performance and prevents overfitting by aggregating multiple decision trees (Breiman, 2001). Individual decision trees tend to have high variance due to their sensitivity to data variability. RF addresses this limitation by constructing multiple decision trees, each trained on a bootstrap sample of the data (Aria et al., 2021). Additionally, at each root node, RF selects a random subset of variables for splitting, reducing correlation among trees and enhancing generalization.
We implemented RF using the RandomForestRegressor package from scikit-learn python library (Pedregosa et al., 2011). A randomized search was conducted over predefined hyperparameter ranges, including the number of trees, maximum tree depth, and the number of variables per split (see S1). Using the optimal hyperparameters, predictions for the test dataset (Xt) were obtained by averaging predictions from all individual trees:
Where fr(Xt) is the prediction from tree r, and R is the total number of trees. RF is well-suited for heterogeneous data and often outperforms linear model (Schoppa et al., 2020; Sieg et al., 2017). However, it can be computationally expensive for large datasets with numerous variables and deep trees.
2.2.3 XGBoost
XGBoost (Extreme Gradient Boosting, XGB) is an optimized gradient boosting algorithm designed for speed and efficiency (Chen and Guestrin, 2016). XGB also handles missing values, whereas RF requires explicit imputation. The objective function for XGB is defined as (Chen and Guestrin, 2016):
Where is the loss function measuring the difference between the actual value yk, and the predicted value at boosting iteration B. The updated prediction for the kth sample after B iterations is:
Where, is the prediction for the kth sample after B−1 iterations. fB(xk) is the prediction made by the model at iteration B for the kth sample. Unlike RF, which constructs trees independently and in parallel, XGB builds trees sequentially, where each new tree corrects the residual errors of the previous ones (Narin, 2025). Additionally, XGB incorporates both Lasso and Ridge regularization to control overfitting (Ma et al., 2021). The regularization term Ω(fb) for the bth model is defined as:
Where T is the number of terminal nodes in the tree fb. γ is a regularization parameter that penalizes the number of leaves in the tree (encouraging simpler trees with fewer leaves). wm represents the weight associated with the mth leaf of the tree. Λ is a regularization parameter that penalizes the squared weights of the leaves. This term helps prevent overfitting by controlling the weights of the leaves. We implemented XGB using the XGBRegressor package from scikit-learn python library (Pedregosa et al., 2011). Predictions for test dataset (Xt) using optimal hyperparameter selection were computed as:
2.2.4 Variable importance
To assess the importance of each predictor across the three models, we used the Permutation Variable Importance (PVI) technique. PVI quantifies the contribution of each variable by measuring the change in model performance when its values are randomly permuted while keeping all others unchanged (Breiman, 2001). Variables that cause a greater increase in error upon shuffling are considered more important (Fisher et al., 2019). This approach is model-agnostic and provides a consistent framework for comparing variable importance across different predictive models.
Each model was developed using nested a cross-validation framework (). For each damage type, the median MAE from cross-validation was computed for each model, denoted as MAEEN, MAERF, and MAEXGB. PVI scores of all variables were rescaled to a range of 0 to 100 using min-max normalization. To account for differences in model performance, the PVI scores from each model were weighted according to the respective model weights as follows:
The final variable importance is the sum of the weighted PVI scores across all three models, ranging from 0–100. If all three models identify the same variable as the most important, its score reaches 100. Variables were then ranked according to these combined weighted scores (key variables are shown in Fig. 5).
2.3 Bayesian Networks for multivariate probabilistic modeling
Bayesian networks (BNs) are probabilistic graphical models that represent dependencies among multiple variables and enable multivariate predictive density estimation (Sucar, 2021). In this study, BNs are employed to complement the machine learning models by providing a probabilistic framework for analyzing multivariate dependencies and scenario-based inference. Whereas EN, RF, and XGBoost primarily emphasize predictive accuracy and variable ranking, BNs explicitly capture conditional dependencies among variables. This is particularly valuable in flood damage analysis, where damage outcomes result from complex interactions between hazard intensity, company characteristics, and preparedness measures. Moreover, BNs enable the estimation of posterior probabilities of damages given partial evidence (e.g., observed water depth or company preparedness), thereby offering a transparent and interpretable tool for risk assessment under uncertainty.
A BN is a directed acyclic graph (DAG), , where V denotes the set of variables and E represents the directed edges encoding conditional dependencies. The dataset comprises both continuous and categorical variables (see Table 1). BNs can theoretically handle both continuous and discrete variables. However, in practice, continuous BNs are often limited to normally distributed variables to preserve closed-form probability distributions (Kitson et al., 2023). Since our flood loss data include mixed variable types with some skewed distributions, we adopted discrete BNs for this study. Continuous variables are discretized using an equal-frequency binning approach, where the number of bins is determined iteratively to optimize network learning while preserving data characteristics. The network structure is learned through a data-driven approach based on the Tabu Search algorithm (Glover, 1986; Goudet et al., 2018), which iteratively explores possible network configurations by adding, removing, or reversing edges. The optimal structure is selected by maximizing the Bayesian Dirichlet Equivalent (BDe) score (Heckerman et al., 1995), which balances model complexity and goodness of fit while incorporating prior knowledge. We employed a uniform prior over the conditional probability tables. This corresponds to setting an equivalent sample size that distributes prior probability mass evenly across all states of each variable. This ensures that all parent–child configurations are treated equally a priori, and that the posterior distributions are driven primarily by the empirical data.
We developed five separate BNs corresponding to different damage types. During model development, we observed that for some damage types, the direct connections to the target variable (i.e., damage) involved up to four variables. To ensure consistency across BNs and to maintain model interpretability and parsimony, we selected the top four variables based on the combined weighted importance scores. The learned BN enables probabilistic inference, allowing computation of the posterior probability of any variable Xi given observed evidence E (Pearl, 1988):
Where P(E|Xi) is the likelihood of evidence given Xi, and P(Xi) is the prior probability of Xi. See S2 in the Supplement for a detailed step-by-step procedure of the BN learning process, Conditional Probability Tables (CPTs), and Bayesian inference. The posterior probability of flood damage given the observed evidence E is discrete in nature. However, this discrete representation is limited by the binning of the data and does not allow precise estimates or a meaningful characterization of predictive uncertainty. To address this, we derived a continuous distribution of direct and indirect damages by fitting a probability distribution based on weighted sampling of the empirical damage data, following the approach of Schoppa et al. (2020). This allows for a more precise representation of uncertainty and predictions at finer scales beyond the original bins.
3.1 Overview of affected companies in the 2021 flood event
This section provides an in-depth analysis of the affected companies, focusing on their demographic profiles, the types of damage sustained, the extent of business interruptions, and the financial implications across various damage categories. The companies range from micro-companies with up to nine employees to large companies with 250 and more employees, according to the European classification (Destatis, 2003). The majority of the companies surveyed are therefore classified as micro-companies (1–9 employees) followed by small companies with 10 to 49 employees and medium-sized companies with 50 to 249 employees (Fig. 1). Large companies with 250 and more employees rarely participated.
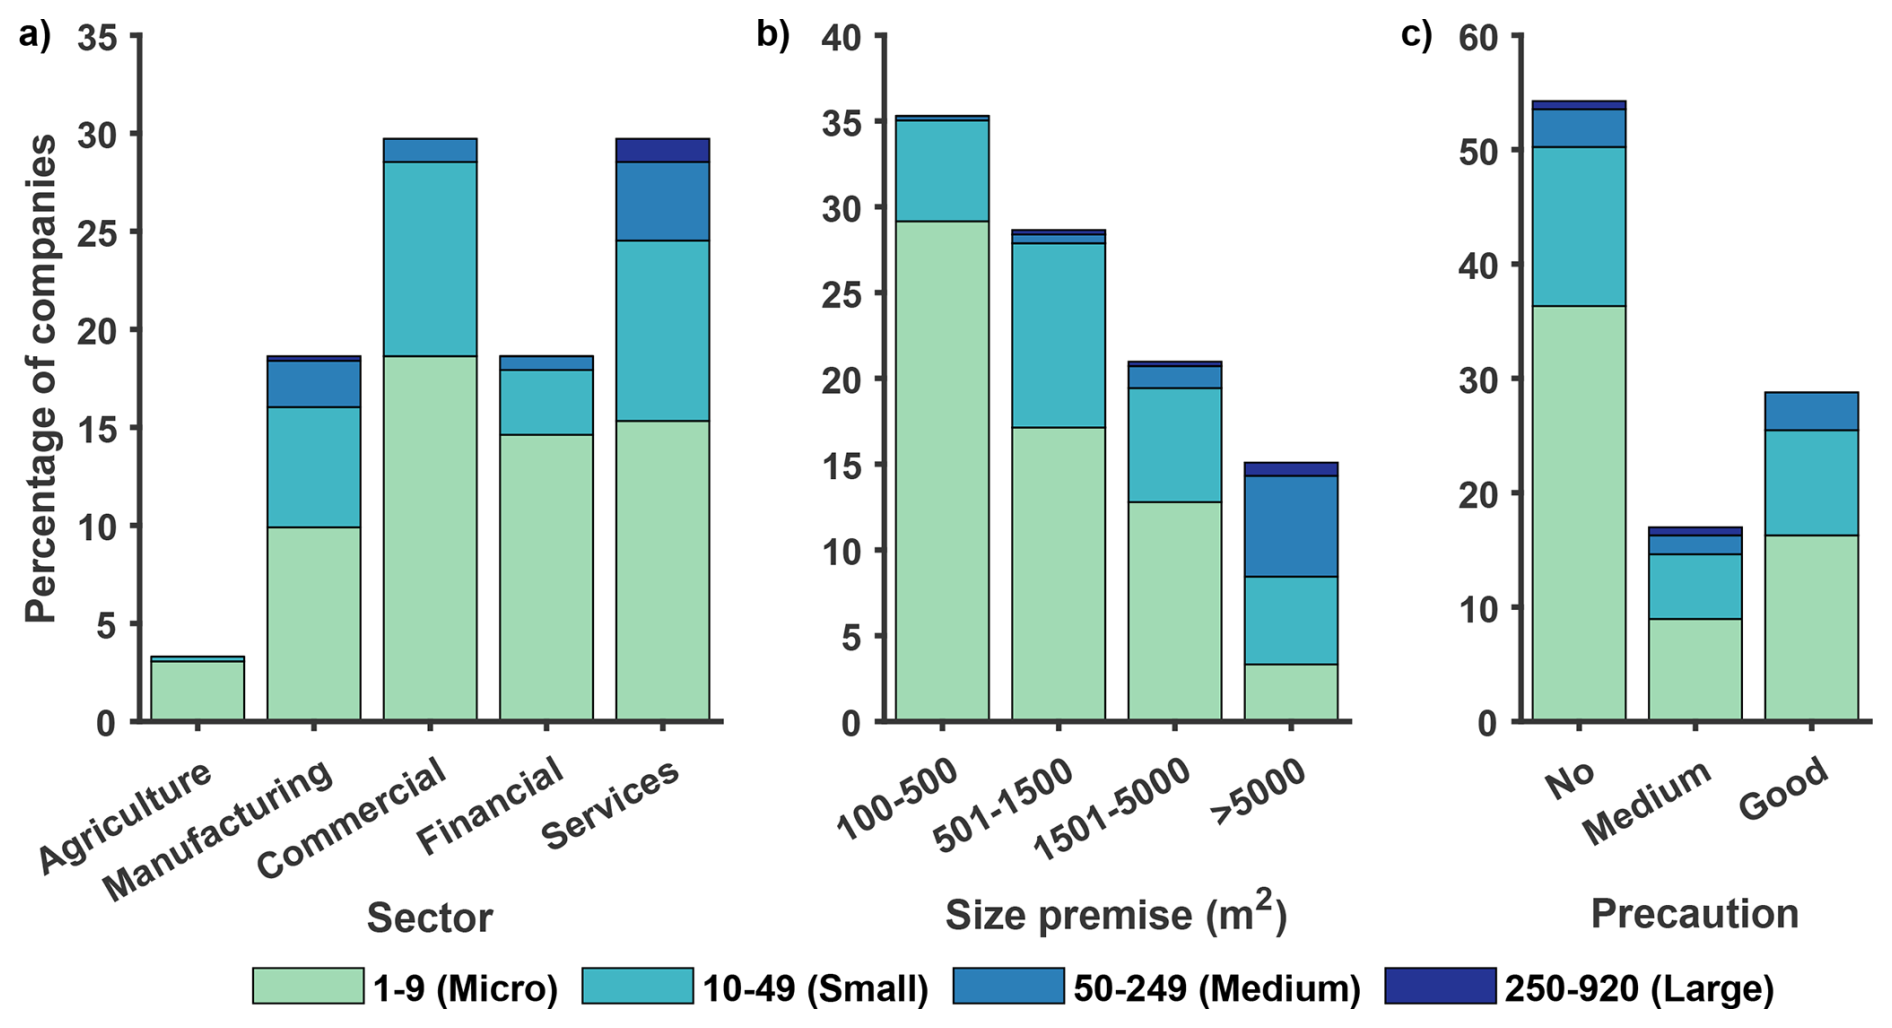
Figure 1Bar chart showing the percentage of companies with varying numbers of employees by (a) sector, (b) size premise, and (c) precaution.
Figure 1a illustrates the distribution of companies across sectors, showing a relatively balanced representation except for agriculture. Based on the WZ2008 economic classification (Destatis, 2008), all companies surveyed were assigned to one of five economic sectors: (1) agriculture (n=14); (2) manufacturing (n=81); (3) commercial (n=126); (4) corporate and financial services (further: financial) (n=81) and (5) public and private services (further: services) including educational, health and social services (n=129). Micro and small companies dominate the sample, which aligns with the typical business landscape of many European countries (Eurostat, 2024). Figure 1b indicates a clear relationship between company size and the size premise of the companies. Micro-companies predominantly operated from size premise ≤5000 m2, whereas medium and large companies were more likely to occupy a higher size premise >5000 m2. Large size premise inherently increased exposure to floodwaters, which partly explains the heightened damages among medium and large companies. A significant observation from Fig. 1c is the generally low implementation of precautionary measures, particularly among micro and small companies.
Floods not only cause damage to tangible assets through hydrodynamic forces and chemical contamination but also lead to significant disruptions in supply chains and transportation. Such disruptions can result in partial or complete business interruptions and, in extreme cases, bankruptcy Thieken et al., 2016). Figure 2 illustrates the percentage of companies affected by various types of impacts, categorized by company size, while Fig. S4 in the Supplement presents the same results by sectors. Since company size emerged as the dominant factor explaining variations in damages, our main emphasis in this study is on company size. To maintain focus and clarity, sectoral differences are not discussed in detailed here. The results reveal clear differences in vulnerability and exposure levels across different company sizes. Damage to buildings emerges as the most frequently reported impact, with nearly 100 % of companies across all size categories affected. Larger companies report the highest exposure to equipment damage (100 %) and loss of goods and stock (over 80 %), suggesting that companies with larger operational setups have more assets at risk. In contrast, the micro-companies report slightly lower, yet still significant, impacts in these categories, with equipment damage close to 90 % and goods and stock losses around 70 %.
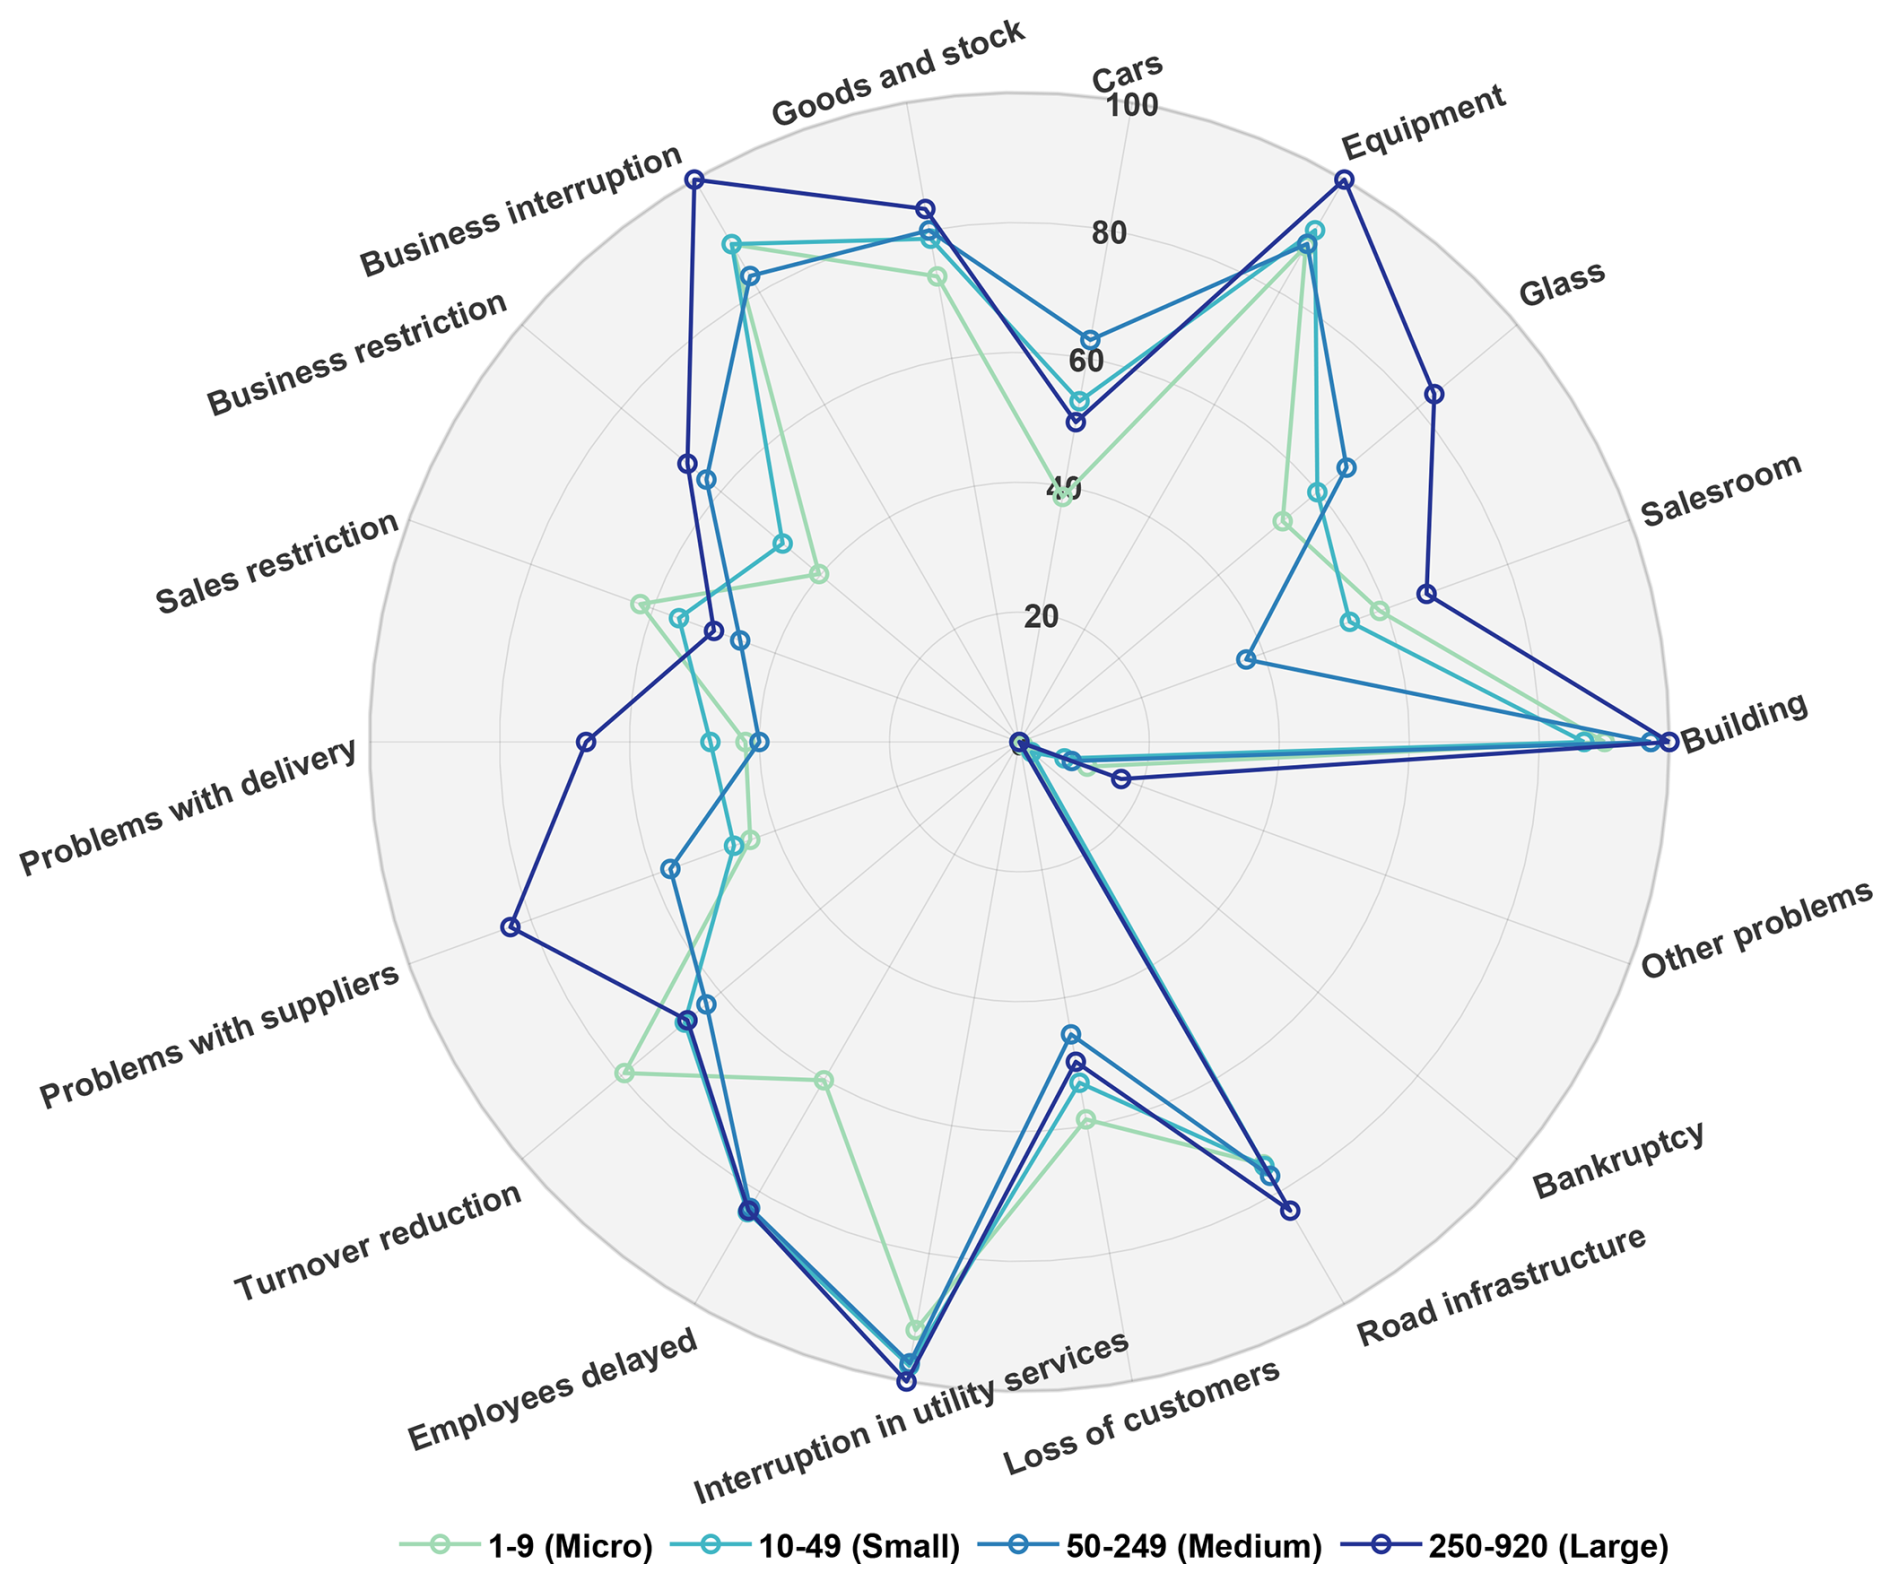
Figure 2Spider chart illustrating the percentage of companies experiencing different types of flood impacts, categorized by the number of employees.
Business interruption is another major consequence reported consistently across all company sizes, reaching 100 % among large companies (Fig. 2). This suggests that larger operational scales correlate with increased disruption potential. Business restrictions due to regulatory or environmental constraints are reported less frequently but remain relevant, particularly for medium and large companies, with a frequency exceeding 60 %. Interruptions in utility services are a widespread issue, affecting 90 % to 100 % of companies across all size categories. This finding highlights the universal dependency of businesses on essential services such as electricity, water, and telecommunications. Loss of customers and employee delays are also commonly reported impacts. Micro-companies experience customer losses of around 60 %, underlining the challenges to business continuity and client retention following flood events. In contrast, employee delays affect approximately 80 % of companies, except micro-companies, reflecting disruptions in workforce mobility. Regarding supply chain disruptions, problems with suppliers affect between 40 % and 80 % of companies, with the highest impacts reported by larger businesses (80 %; Fig. 2). This suggests greater vulnerability due to complex supply dependencies. Conversely, delivery problems are reported less frequently, with medium-sized companies experiencing the lowest impact (40 %).
Turnover reduction is moderately reported (60 %–80 %) without a distinct size-based pattern, although micro-companies appear more affected, with rates around 80 %. Damage or inaccessibility of road infrastructure is reported by approximately 80 % of companies, underscoring systemic exposure that affects businesses regardless of size. Car damage is less frequently reported but shows slightly higher percentages (above 60 %) among medium-sized companies. Sales restrictions exhibit variability, with micro-companies reporting higher percentages (over 60 %), possibly due to their greater dependence on physical sales venues. Glass damage is moderately reported across companies but is notably higher among larger companies (around 80 %), likely due to their larger commercial structures and exposure. Overall, the results illustrate the complex and diverse impacts of flooding on companies, varying by size and operational characteristics. Micro and small companies are more susceptible to supply chain disruptions and sales restrictions, while larger companies face higher asset-related risks. Accordingly, risk management and resilience strategies should be tailored to company size.
July 2021 flood event had long-lasting impacts on businesses, severely disrupting operations for months or even years. Figure 3 presents the distribution of business interruption duration and business restriction duration (both measured in days) across companies of varying sizes. The boxplots reveal clear differences in the duration of these impacts based on company size. For business interruption duration, micro-companies (1–9 employees) experienced the longest disruptions overall, with a median duration of approximately 40 d. However, the range of reported durations for this group was highly variable, with several extreme cases extending beyond 365 d, as reflected by numerous outliers. This finding underscores the particular vulnerability of micro-enterprises to prolonged operational disruptions following flood events, likely due to their limited resources and reduced adaptive capacity. In contrast, small, medium, and large companies reported comparatively shorter business interruption durations. The median interruption durations for these groups ranged between 10 and 30 d, with fewer extreme cases observed. Notably, medium-sized companies demonstrated shorter interruption periods overall, suggesting better resilience or recovery capacity. This may be attributed to diversified operations, greater financial buffers, or the presence of formal contingency plans that facilitate faster recovery. The number of outliers differs across company sizes because thresholds were determined using the standard 1.5× IQR rule. For business restriction duration, no outliers were detected, as the upper thresholds were consistently high (e.g., >650 d for micro and small companies) and all observations fell within these ranges.
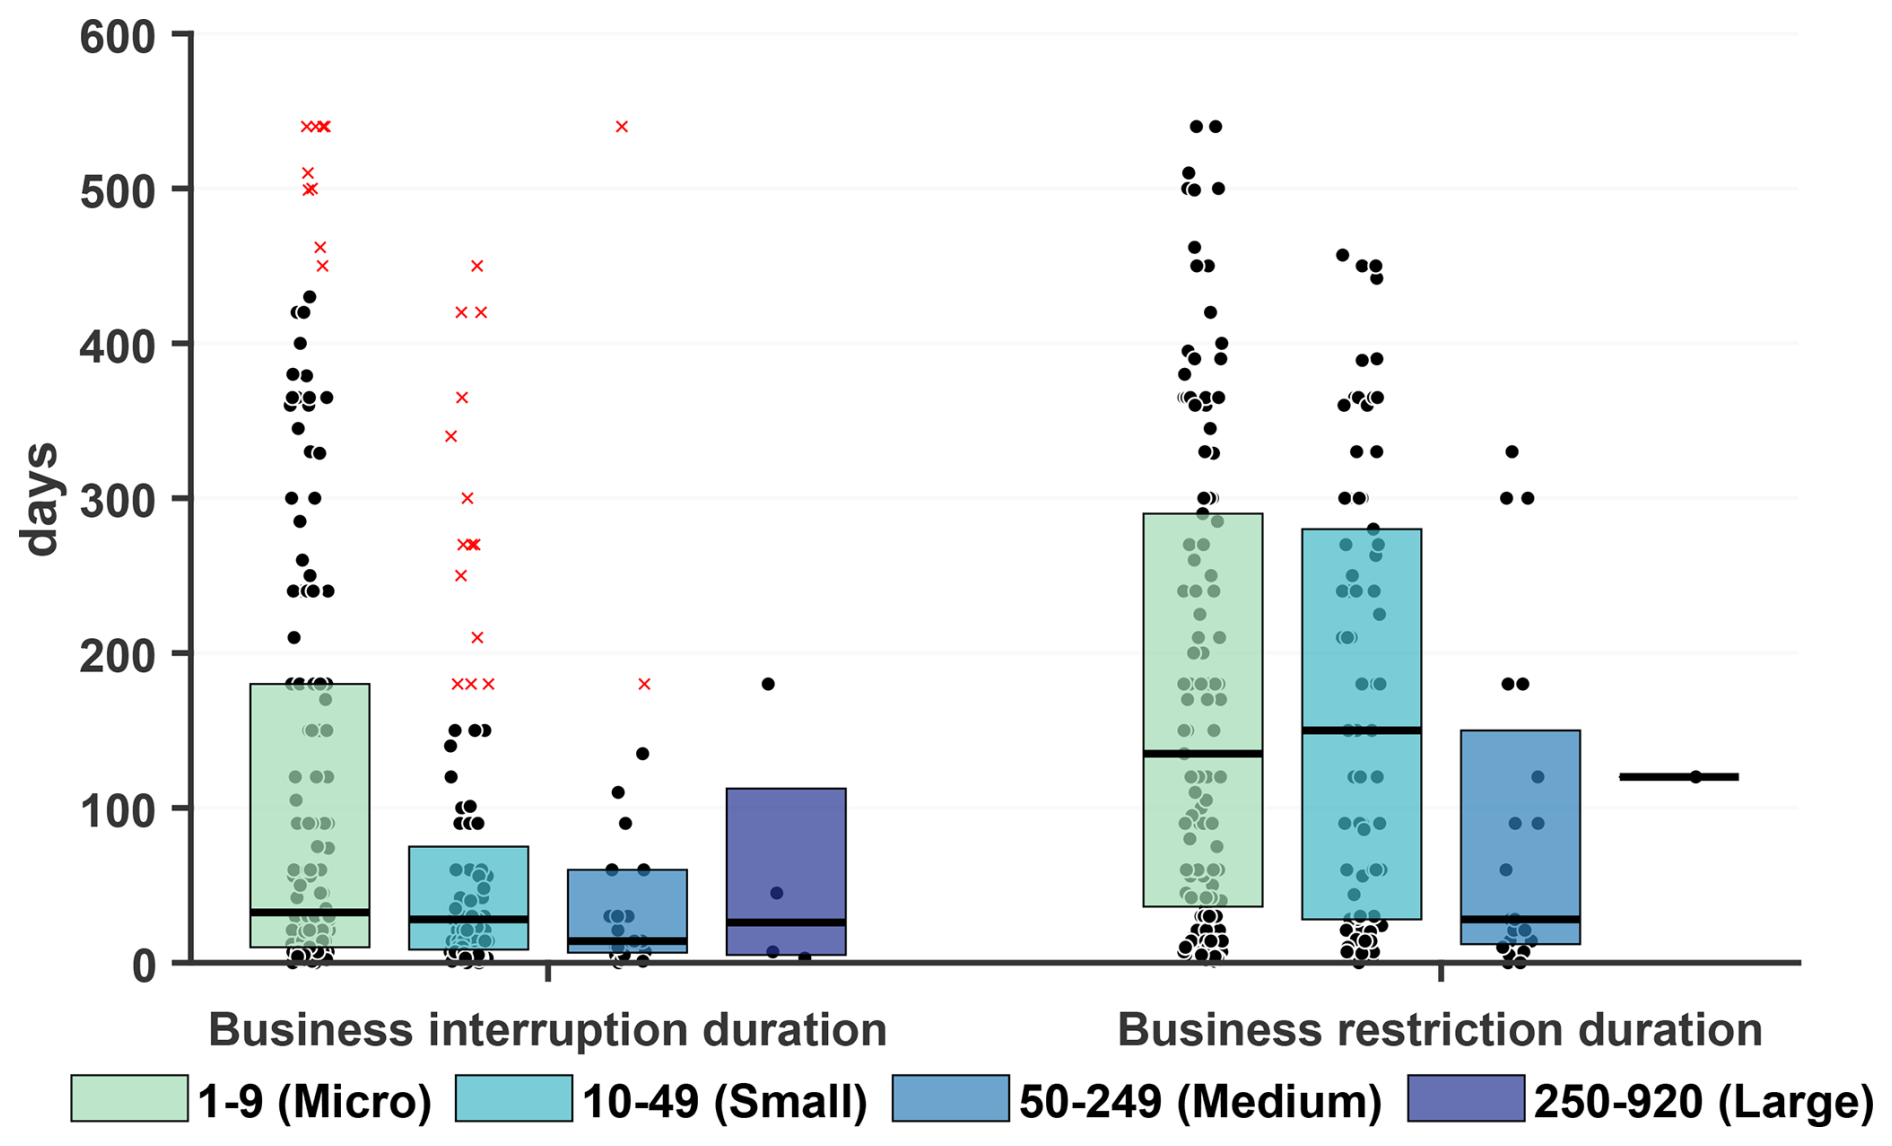
Figure 3Boxplot of (a) Business interruption duration (days) and (b) Business restriction duration (days) for companies categorized by the number of employees. Black circular markers represent individual data points, and red crosses indicate outliers.
The pattern shifts when examining the duration of business restrictions. Both micro and small companies reported significantly prolonged periods of business restrictions, with median durations exceeding 100 d. In some cases, restrictions extended up to 365 d, again marked by several extreme values. The persistence of these restrictions may reflect regulatory, environmental, or logistical hurdles encountered during the recovery phase, particularly by smaller companies that often lack the influence or flexibility to expedite resolution. Interestingly, medium-sized companies reported relatively shorter business restriction durations, with a median significantly lower than that of micro and small companies. Most data points for this group clustered below 100 d, indicating a more efficient recovery from regulatory or operational constraints. For large companies, only a few values were reported, which likely explains the narrower distribution observed. Overall, these results highlight that company size is a critical factor influencing the duration of operational disruptions following extreme events. Micro and small companies are particularly vulnerable to prolonged indirect impacts, such as extended business restrictions and interruptions. In contrast, medium and large companies tend to recover more quickly, likely because they benefit from diversified operations, and access to more substantial resources.
The survey recorded specific damage amounts across three categories of direct property damage: (1) building, (2) equipment, (3) goods and stock, as well as financial losses due to business interruptions. In most cases (approximately 62 %), the direct damages amounted to more than EUR 100 000 while around 24 % of companies reported damages reaching into the millions. The average costs (in euros) for each company size are presented in Table 2, alongside medians and the number of companies (n) contributing to each calculation. Building damages accounted for the highest average costs across all company sizes, particularly impacting medium and large companies. Micro companies reported average building damages of EUR 711 459, with a median of EUR 250 000. This wide gap between the mean and median suggests that while many small firms experienced moderate losses, a few outliers faced severe damages. For small companies, the average building damage increased to EUR 908 482 (median EUR 500 000). Medium companies faced substantial building-related losses, averaging EUR 2 838 103 with a median of EUR 1 350 000. Large companies, though represented by a very small sample (n=4), reported the highest average building damages of EUR 7 350 000, reflecting the scale of structures at risk within large industrial facilities.
Table 2Average financial costs (in euros) incurred for building, equipment, goods and stock, and business interruption categorized by the number of employees (values in brackets represent medians, and n denotes the number of companies included in the calculation of the means and medians)
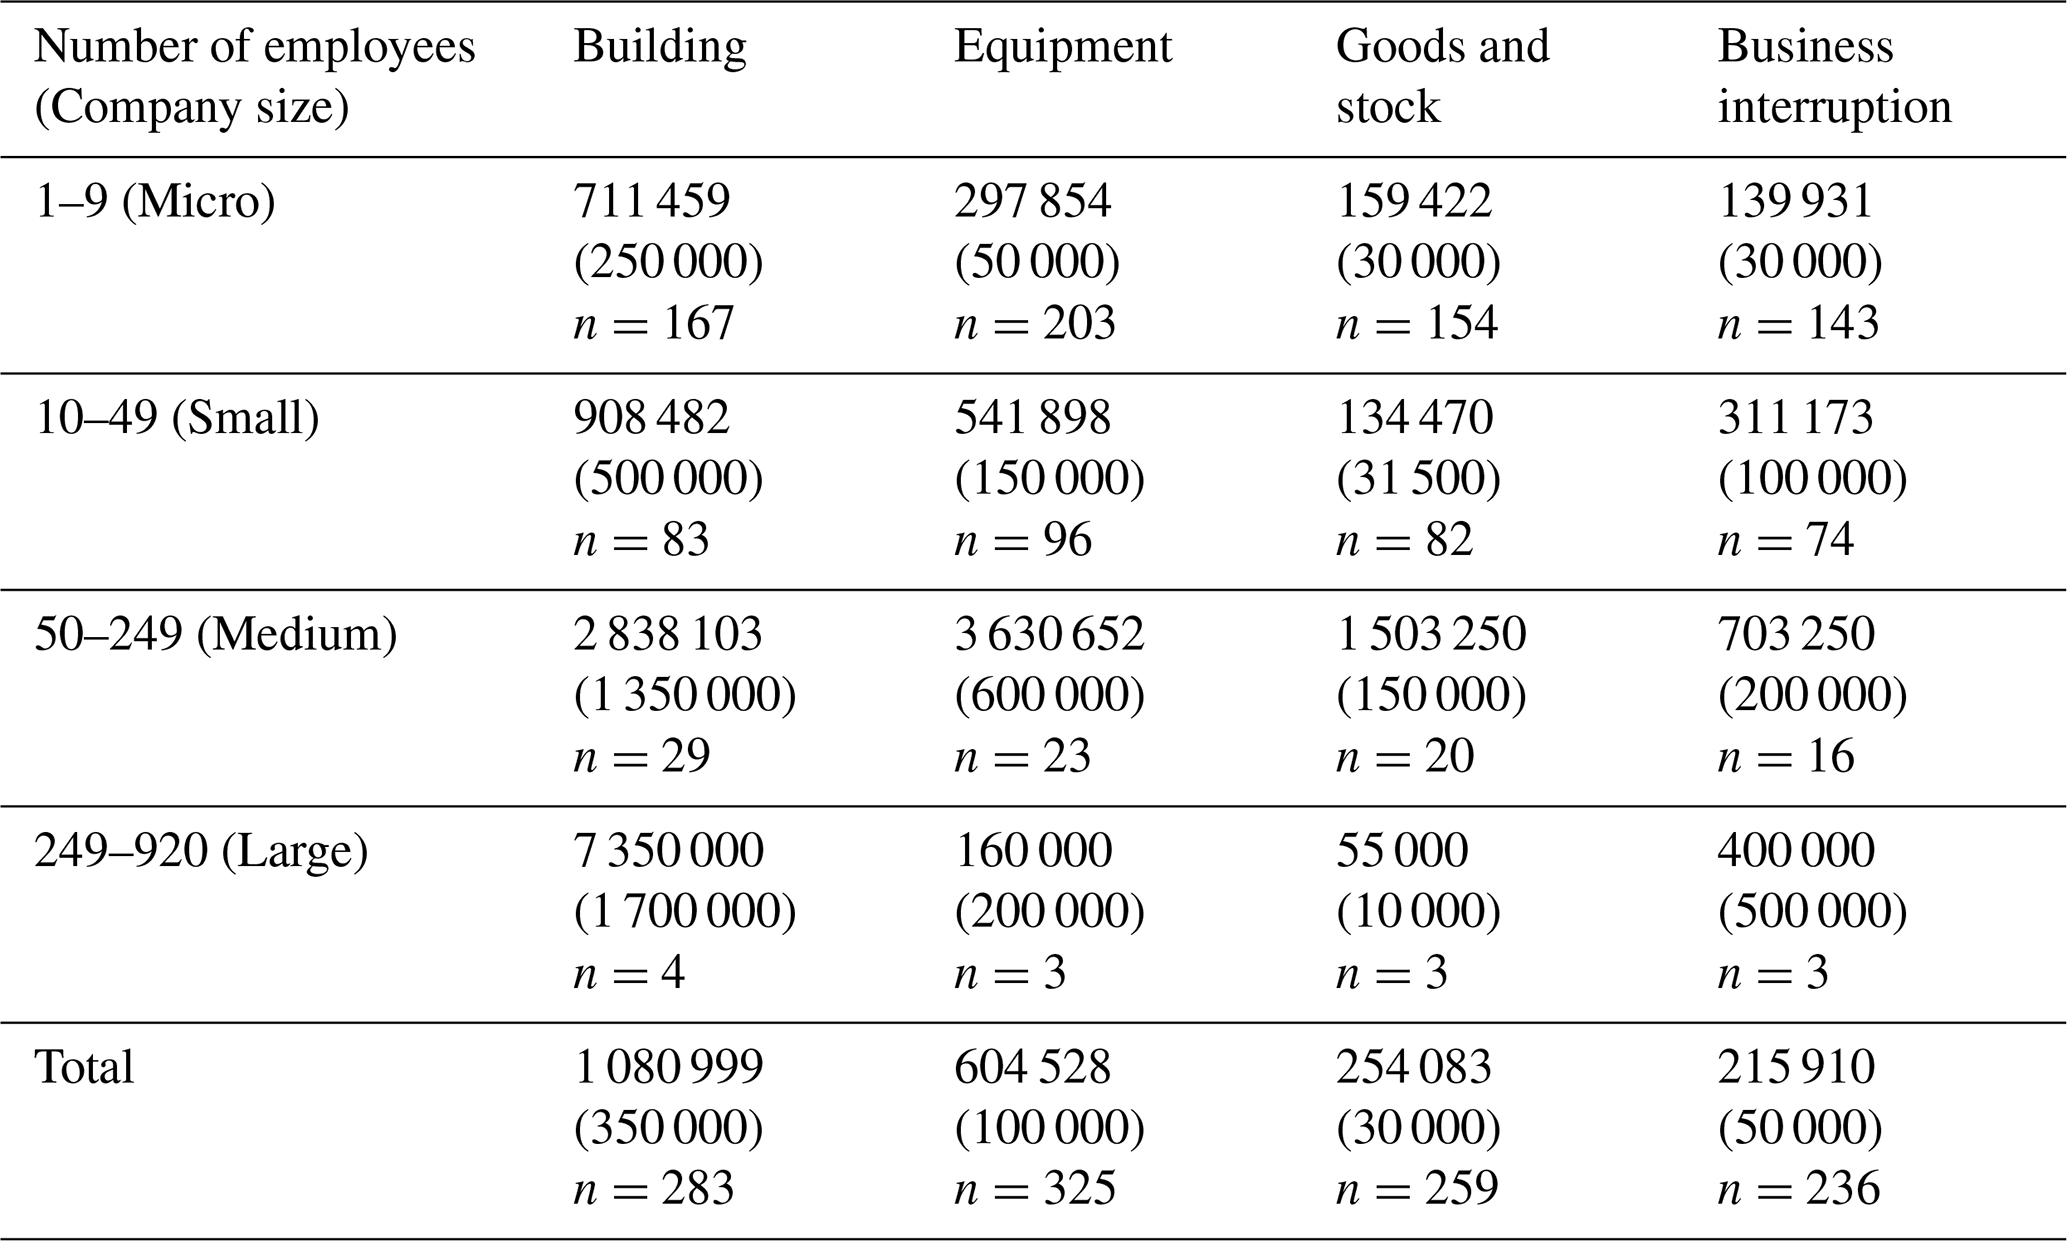
In terms of equipment damages, micro companies incurred an average loss of EUR 297 854, while small companies experienced significantly higher average costs of EUR 541 898. Medium companies reported the highest average equipment losses at EUR 3 630 652, likely driven by the presence of high-value machinery. Interestingly, large companies recorded a comparatively lower average equipment loss of EUR 160 000, though this is based on a very small sample size (n=3). Lower median values across groups suggest the presence of extreme cases skewing the mean, particularly among medium-sized companies. Goods and stock damages were generally lower across all company sizes (Table 2). Micro companies faced average losses of EUR 159 422, while small companies reported similar average damages of EUR 134 470. Medium companies experienced higher average losses of EUR 1 503 250, indicating greater inventory exposure. Large companies reported much smaller average losses of EUR 55 000. Lower median values that most companies incurred relatively less damages in this category, with a few outliers.
Business interruption losses also varied by company size. Micro companies faced average interruption costs of EUR 139 931, while small companies reported higher average losses of EUR 311 173. Medium companies were the most affected, with average losses of EUR 703 250. Large companies, despite the small sample size (n=3), recorded an average business interruption cost of EUR 400 000, with the median even higher at EUR 500 000, reflecting significant operational disruptions. Overall, the financial costs associated with building, equipment, goods and stock, and business interruption showed that larger companies typically incurred more significant costs. Importantly, the limited number of large companies surveyed suggests that these results should be interpreted cautiously, as they may not fully representative. However, due to the extremely limited number of large companies surveyed, these results cannot be generalized and should be interpreted with caution. These values are presented for illustration purposes only and cannot be considered representative of large companies in general.
3.2 Data-driven analysis of factors influencing direct and indirect flood damages
Understanding the complex processes driving flood damage is crucial for developing effective risk reduction measures for companies. To date, most insights into damage mechanisms stem from studies on private households affected by riverine floods (Gerl et al., 2016; Thieken et al., 2022). This analysis seeks to close the knowledge gap on the factors driving direct and indirect damages to companies during unprecedented flood events. Based on data availability, 19 potentially relevant influencing factors were selected, covering hazard characteristics, emergency measures, precautionary actions, and company characteristics (Table 1). The dataset exhibited less than 7 % missing data for 18 out of 19 variables (Fig. S1), which were imputed using the kNN technique with k=5 neighbors (Askr et al., 2024). The remaining variable, warning lead time (wt), had approximately 10 % missing data, which was also imputed using the same approach. Figure 4 presents the pairwise Spearman rank correlations between influencing factors and the five damage types – relative damage to buildings (bdam), equipment (edam), goods and stock (gsdam), business interruption duration (bid), and business restriction duration (brd).
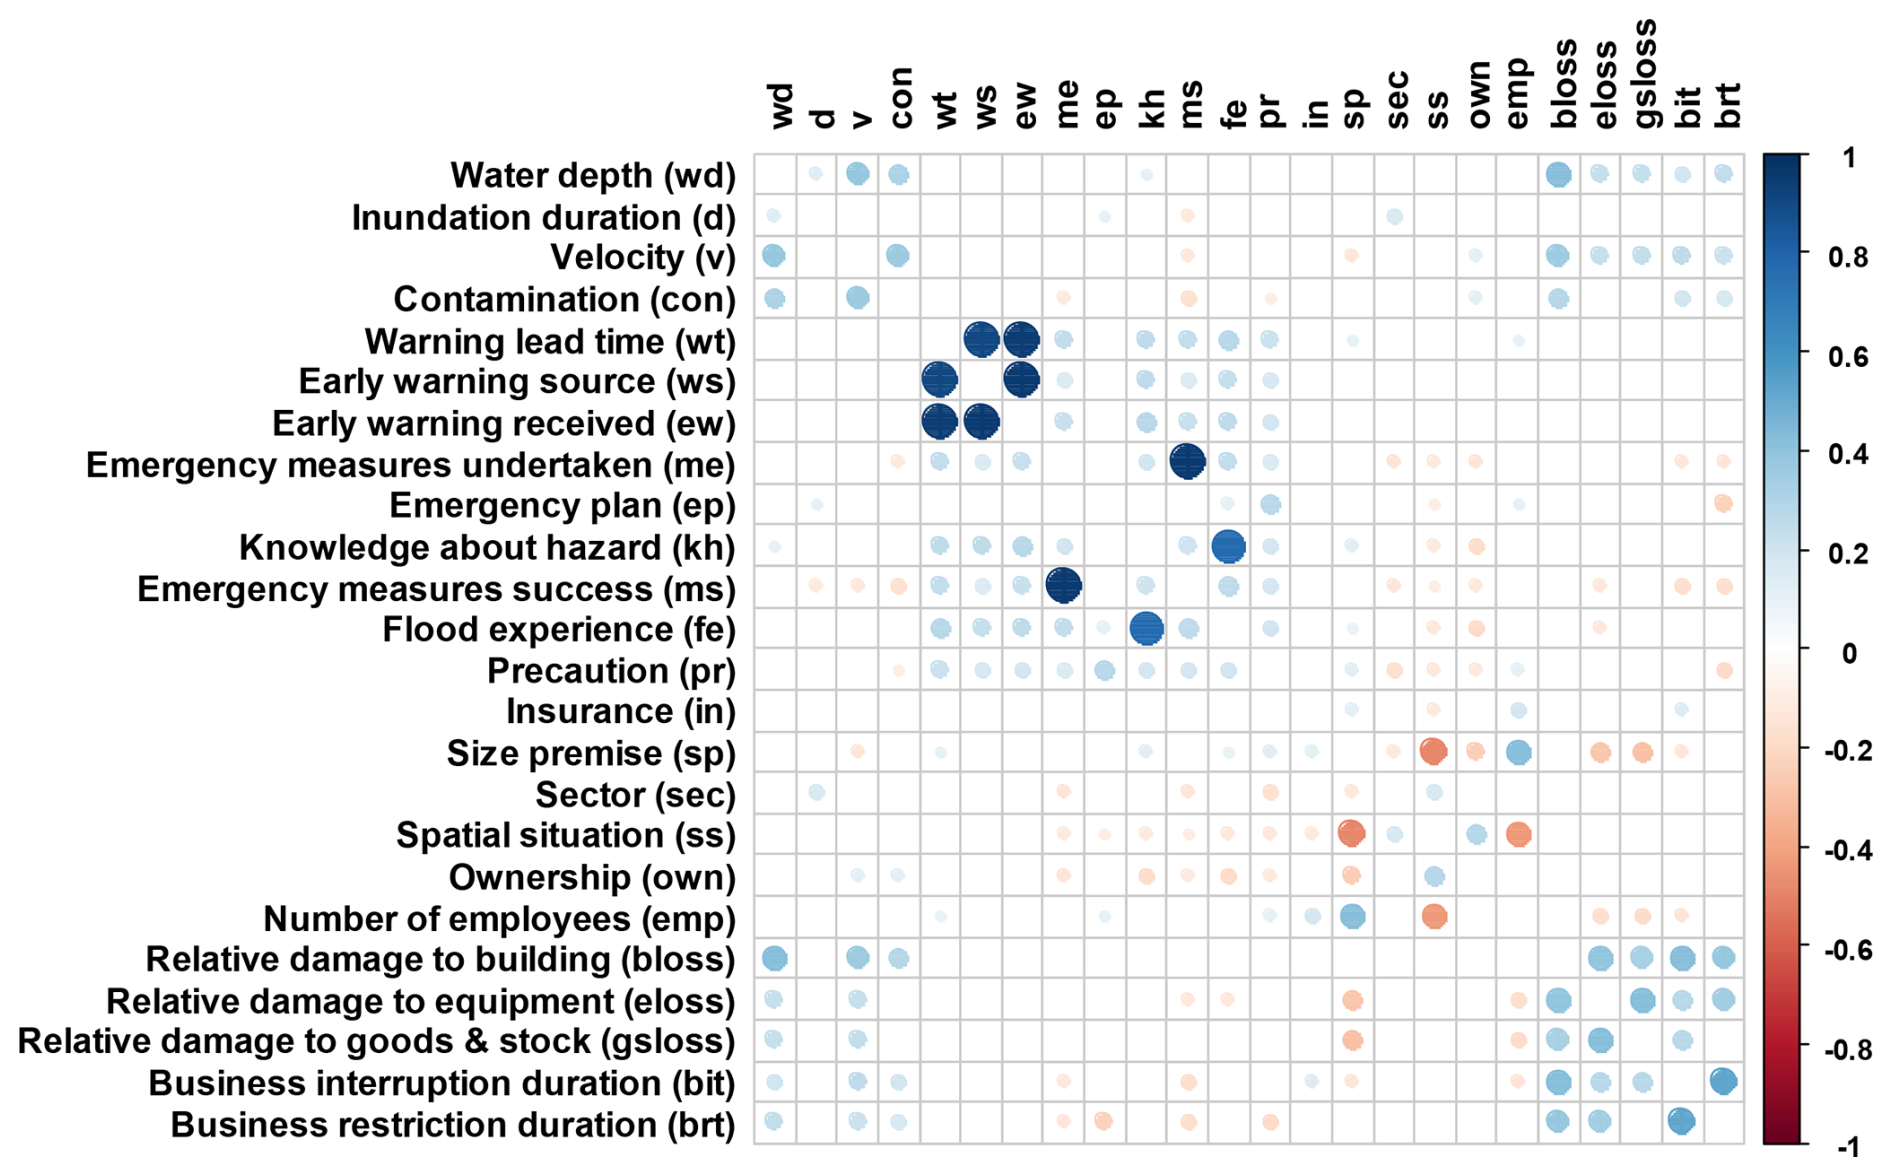
Figure 4Spearman rank correlation coefficients between 19 influencing factors and five damage types. Only significant correlations (p-value <0.05) are displayed, providing insights into key factor-damage relationships. See Table 1 for abbreviations.
High positive correlations exist between water depth (wd), flow velocity (v), and various damage types, highlighting the critical role of flood intensity in driving both direct and indirect damages. Interestingly, factors characterizing emergency response and preparedness exhibit negative correlations with business interruption and restriction durations. Specifically, the successful implementation of emergency measures (ms), and precaution (pr) are associated with reduced indirect impacts (Fig. 4). Additionally, company characteristics such as the size of the premises (sp) and the number of employees (emp) show negative correlations with equipment and goods and stock damages, as well as business interruption duration, reflecting the role of operational scale and exposure in shaping flood impacts. Furthermore, significant correlations exist between several influencing factors, underscoring the importance of a multivariate modelling approach.
To account for these interactions and robustly identify the most influential factors, a data-driven modelling framework was implemented. Three machine learning models (Random Forest, Elastic Net, and Extreme Gradient Boosting (XGBoost)) were trained on the empirical survey data. Ten repetitions of a ten-fold cross-validation based on random partitioning were carried out. In each model, the hyperparameter combination model yielding the lowest MAE was used to derive the variable importance. The combined variable importance scores from all three models are illustrated in Fig. 5. As expected, water depth (wd) consistently emerged as the most important driver across all damage types, aligning with previous findings (Schoppa et al., 2020; Sieg et al., 2017). Notably, flow velocity (v) ranked as the second or third most influential factor, particularly for the 2021 flood event. This prominence of velocity reflects the dynamic nature of the flood, contrasting with large-scale, slowly rising river floods where factors like contamination typically dominate damage (Kreibich et al., 2007; Sieg et al., 2017). In addition, company characteristics such as the size of the premises (sp) and the number of employees (emp) also played significant roles (Fig. 5). The success of emergency measures (ms) further influenced damage, ranking fourth or fifth in importance for direct damages (Fig. 5a–c). Interestingly, business restriction duration (brd) was primarily influenced by preparedness-related variables, i.e., amount of precaution taken (pr), prior knowledge about the hazard (kh), and the company's insurance status (Fig. 5e). This finding underscores the critical role of proactive risk management in minimizing operational disruptions, during unprecedented events like the 2021 flood.
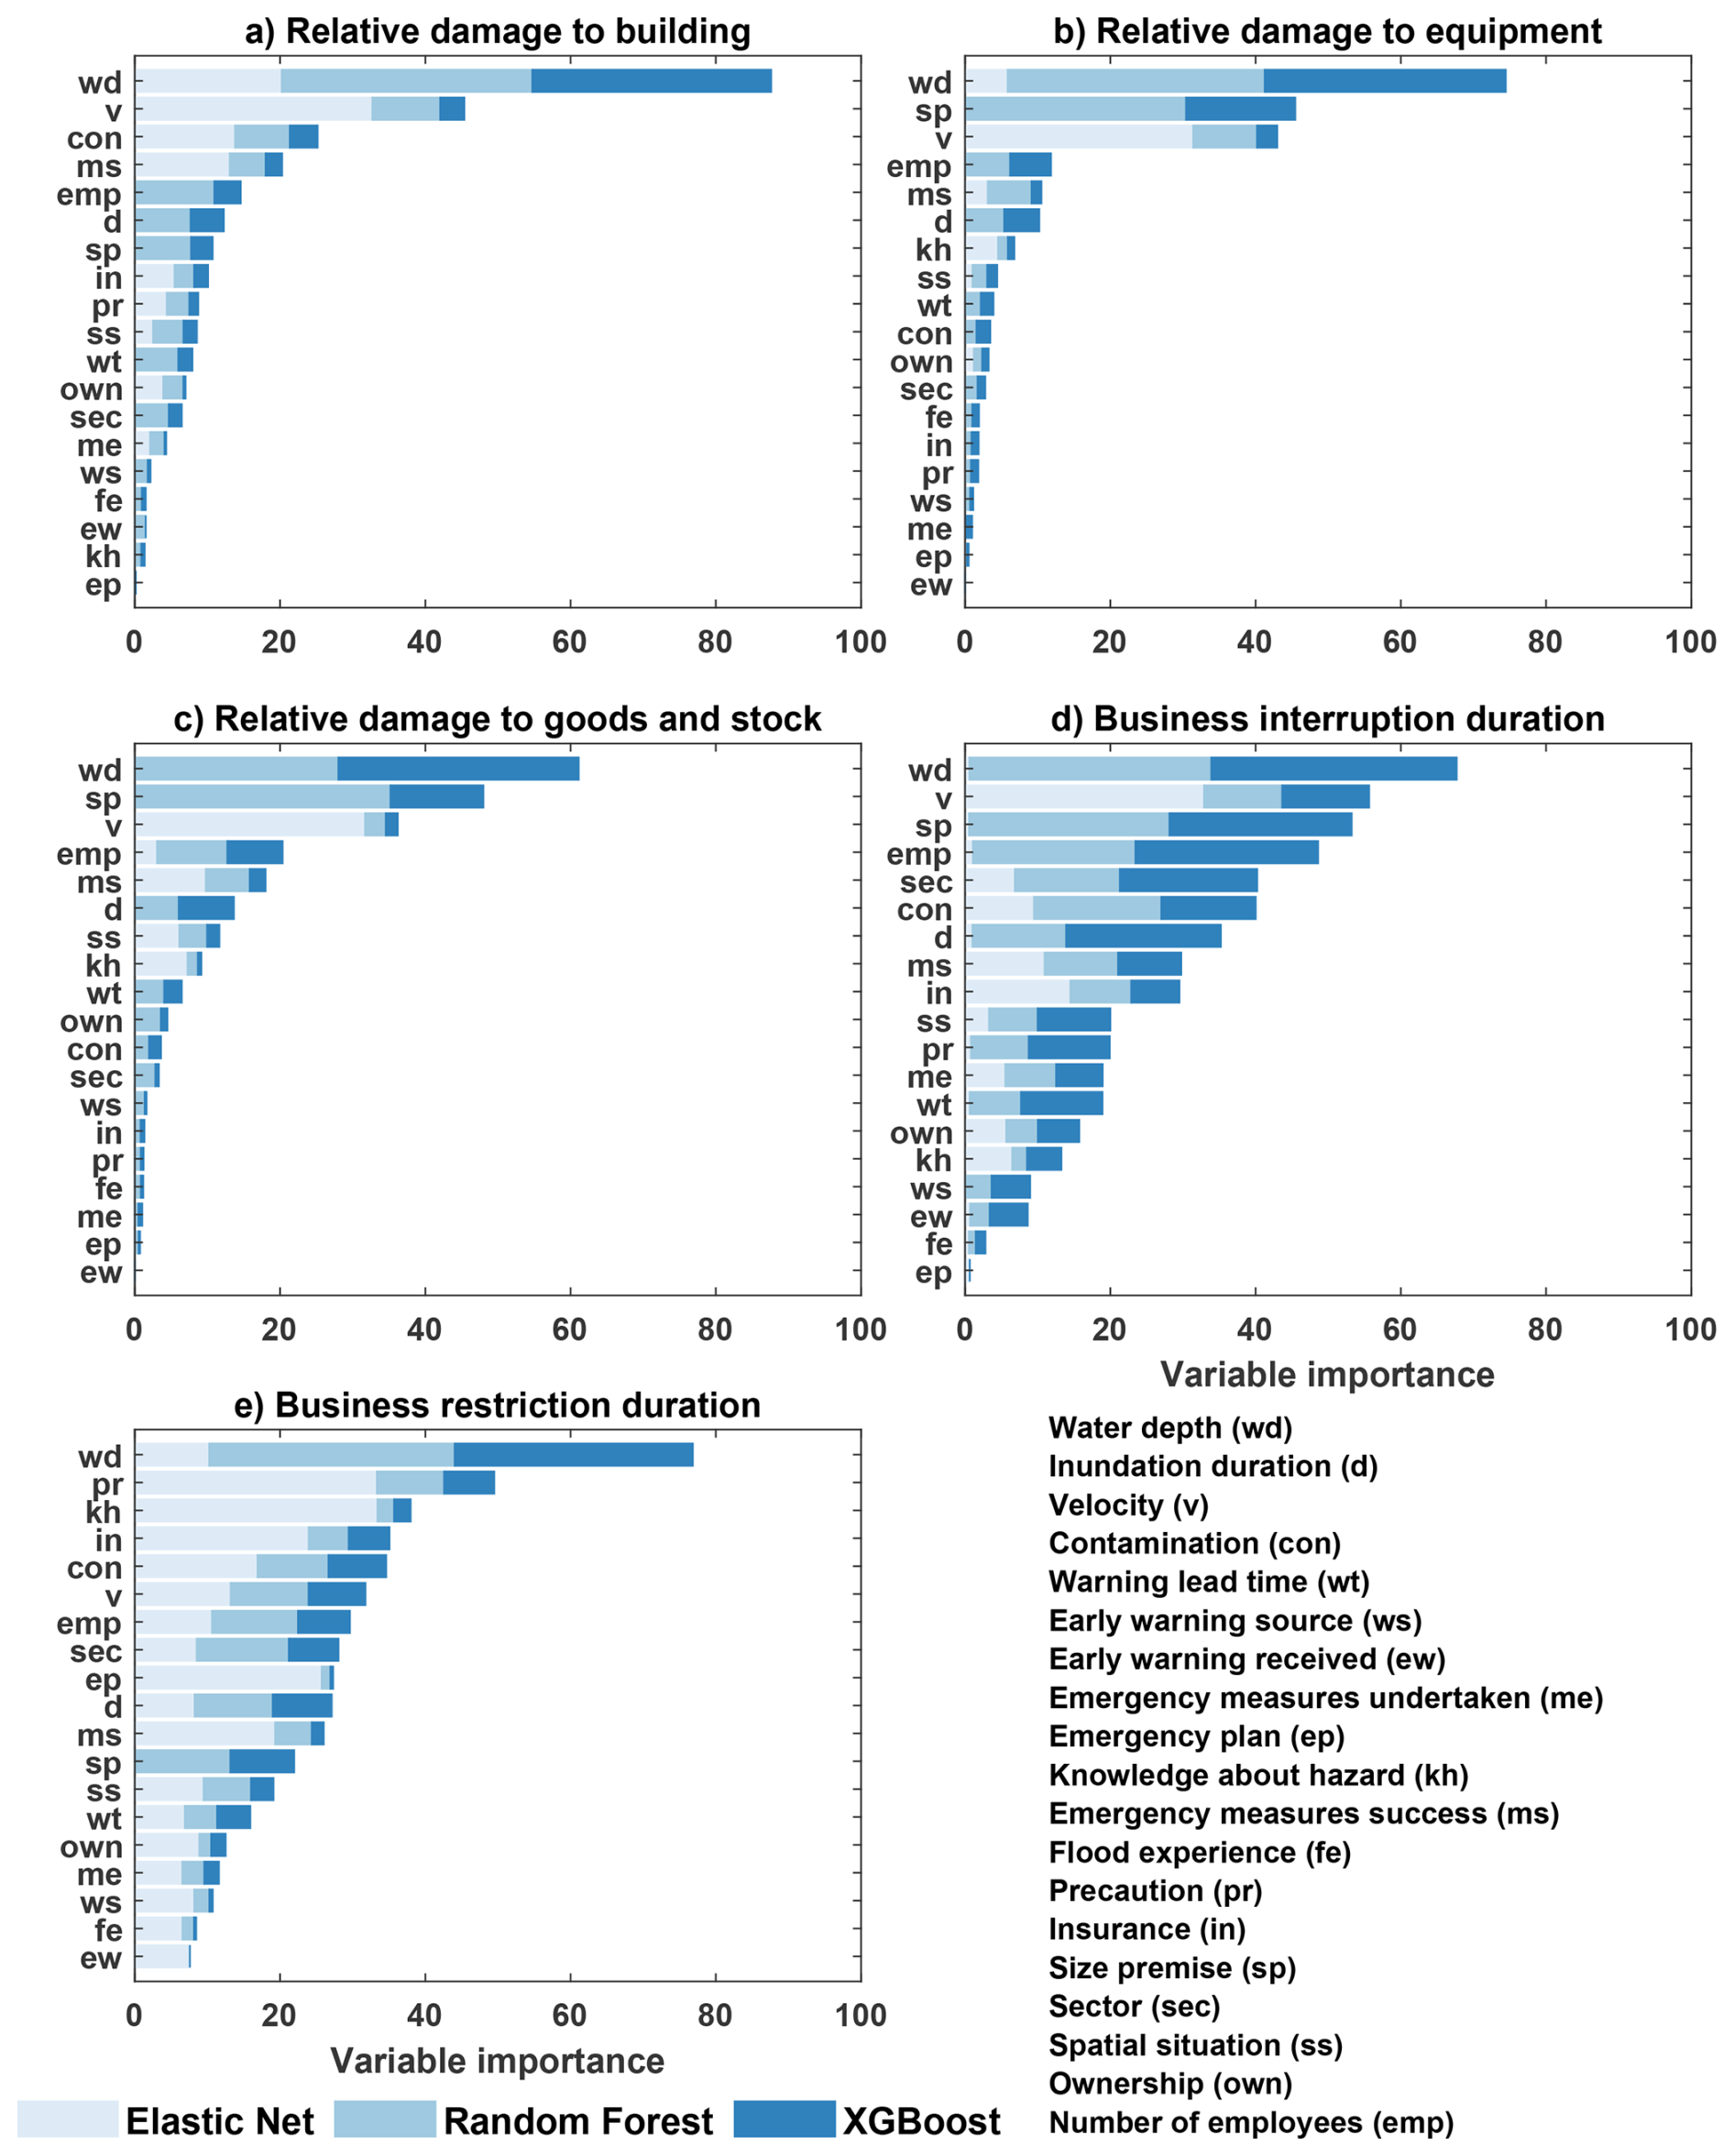
Figure 5Importance of influencing variables for damage types: (a) buildings, (b) equipment, (c) goods and stock, (d) business interruption duration, and (e) business restriction duration. The x axis shows the weighted importance of each variable, as determined by the three models (Random Forest, Elastic Net, and XGBoost).
3.3 Quantifying direct and indirect flood damages using multivariate probabilistic modelling
Understanding interdependencies among influencing factors and damage types is crucial for reliable flood damage estimation. Figure 6 presents the kernel density estimations of the top four influencing factors considered for multivariate probabilistic damage modelling across five different types of damage. The violin plots illustrate the probability density of scaled variables (ranging from 0 to 1), with quartile lines indicating central tendencies and variability. The presence of skewed distributions and multimodal characteristics highlights the complexity of flood damage relationships across different damage types.
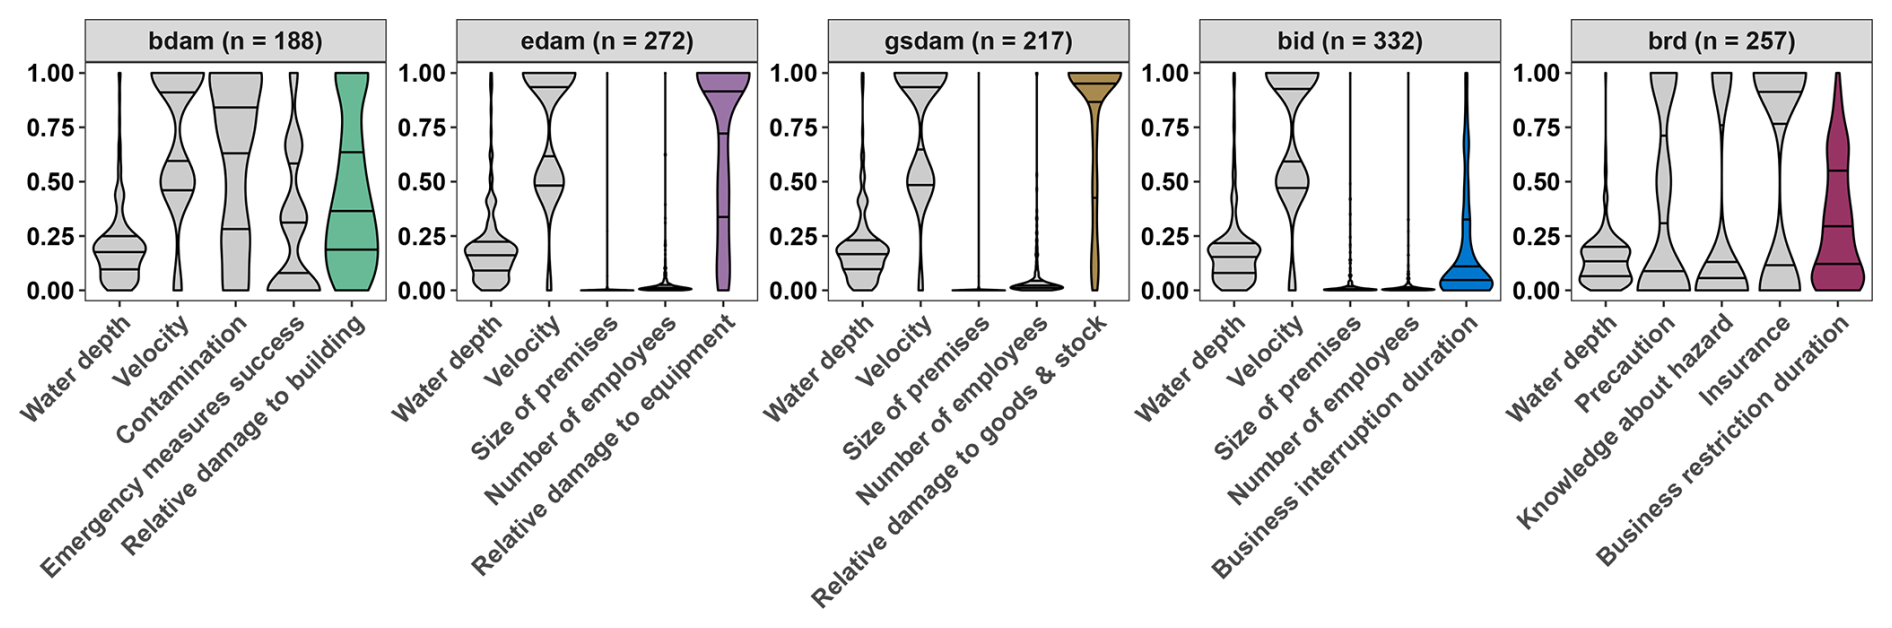
Figure 6Kernel density estimations of influencing factors and damage types, with all variables scaled between 0 and 1. The lines in the violin plots indicate the quartiles.
Bayesian networks (BN) provide a probabilistic framework for understanding the interdependencies between the top four influencing factors and damage outcomes. We developed data-driven BN models using a score-based structure learning algorithm. The BN structure (Fig. 7) provides a probabilistic representation of these relationships, allowing users to estimate both direct and indirect damages along with a quantification of uncertainty. The direction of the arrows represents conditional dependencies between variables but does not imply causality (Schröter et al., 2014). Some directions may appear unintuitive because the structure is derived from a score-based learning algorithm that optimizes the overall network fit to the data. The results align with previous studies while also offering new insights into key influencing factors.
Figure 7Bayesian network structure showing interdependencies among factors and damage types, derived from a score-based structure learning algorithm.
Consistent with prior research (Kreibich et al., 2010; Nafari et al., 2016; Schoppa et al., 2020, 2022; Seifert et al., 2010; Sieg et al., 2017), our results confirm that water depth (wd) and velocity (v) are strongly associated with direct damages, particularly for building damage (bdam). The direct link between these variables and bdam (Fig. 7a) underscores the predominant role of flood intensity in the network. The BN structure also identifies that contamination (con) is linked to building damage, consistent with Sieg et al. (2017). For equipment damage (edam) and goods and stock damage (gsdam), our results show that flow velocity and company characteristics such as size premises (sp) and number of employees (emp) are important nodes in the network (Fig. 7b and c). This aligns with Schoppa et al. (2020), who emphasized that company-specific characteristics play an important role in explaining non-structural damages. Unlike previous studies that primarily focused on hazard intensity variables (Nafari et al., 2016; Sieg et al., 2017), our results show that company exposure variables also appear as relevant variables in the inferred BN structures, indicating conditional dependencies with damage outcomes.
BN structure of business interruption duration (bid) (Fig. 7d) shows dependencies with water depth (wd), velocity (v), and number of employees (emp), which is in agreement with Sultana et al. (2018), who found that company-specific factors (e.g., emp) often outweigh hazard characteristics in estimating business interruption costs. Moreover, our findings complement those of Sakai and Yao (2023), who highlighted that small companies suffer disproportionately higher business interruption relative to turnover. Interestingly, the BN structure of business restriction duration (brd) (Fig. 7e) reveals that precautionary measures (pr), are conditionally linked to the knowledge about flood hazard (kh). This provides a leverage point for risk communication to shape proactive behavior. While previous studies have acknowledged the importance of preparedness (Kreibich et al., 2010; Schoppa et al., 2022), our BN results provides a quantitative depiction of how these variables co-occur within the inferred network. The dependency between precaution measures (pr) and business restriction duration (brd) indicates that proactive measures and restriction duration are closely associated within the network.
We used the BNs to estimate the damage under different hazard, exposure, and vulnerability scenarios. Figure 8 shows the distribution for five types of flood damage, where each damage type is probabilistically modelled using its respective Markov blanket. These distributions are derived from Conditional Probability Tables (Fig. S4). In all cases, horizontal solid lines represent the observed range of damage and business interruption/restriction durations (scaled 0 to 1), red dots indicate the median (50th percentile), and dotted vertical lines denote the interquartile range (25th–75th percentiles), providing an indication of uncertainty. Across many scenarios, the distributions overlap considerably, suggesting that the differences between categories should be interpreted with caution.
Figure 8Predictive density plots for damage types considering Markov blankets: Relative damage to (a) buildings, (b) equipment, and (c) goods and stock, as well as the duration of (d) business interruption and (e) business restriction. The horizontal solid line represents the range of damage/duration on a scale from zero to one. Circular markers indicate the expected damage/duration (median), and vertical dotted lines represent uncertainty (25th and 75th percentiles).
The relative damage to buildings is modeled as a function of water depth and flow velocity (Fig. 8a). As water depth increases, the median damage values generally rise, especially under moderate and torrential flow conditions. At low flow velocities, median damage remains relatively low across all depth levels, however the uncertainty increases with depth, suggesting various possible outcomes. Under moderate flow conditions, damage estimates increase slightly compared to low flow, with overlapping uncertainty bounds. In contrast, torrential flow conditions consistently lead to the highest damage estimates, particularly for water depths exceeding 2 m, where the 75th percentile approaches near-total destruction. Notably, the uncertainty in damage estimates increases with both rising water depth and flow velocity, indicating heightened variability (or uncertainty) in damage outcomes under extreme flood conditions.
The relative damage to equipment (edam) is assessed as a function of flow velocity and company size premises (Fig. 8b). Flow velocity categories (Low, Moderate, Torrential) are arranged as columns, while the size premises classes (75–500, 501–1500, >1500 m2) in rows. Under low flow conditions, median damage tends to decrease as size premises increases, especially for the largest category (>1500 m2). Under moderate and torrential flows, companies with size premises <500 m2 show damage values that often reach the maximum. Under torrential flow, high damage values are likely across all size classes. The relative damage to goods and stock is also modeled as a function of flow velocity and size premises (Fig. 8c). Even under low flow conditions, companies with smaller premises (<1500 m2) may experience high damage, whereas companies with premises >1500 m2 show median damage estimates of around 50 %. Under moderate and torrential flow conditions, the damage values concentrate around 1.0, indicating near-total damage to goods and stock under extreme flood conditions, largely irrespective of size premises. However, the companies with size premises >1500 m2 exhibit greater variability. Overall, the substantial overlap of uncertainty across scenarios indicates a wide range of possible outcomes, suggesting that these patterns should be interpreted as general tendencies rather than definitive outcomes.
The predicted business interruption duration (Fig. 8d) also shows overlapping distributions across company size and flow conditions. Micro-companies (1–9 employees) may experience a median interruption duration of around 22 d under low and moderate flow conditions. While under torrential flow conditions, the interruption duration tends to increase to nearly 60 d. Small companies (10–49 employees) exhibit a similar trend, although their modelled interruption duration under torrential flow may be slightly lower. For medium and large companies (>49 employees), the modelled interruption duration ranges from about 11 to 33 d across all flow conditions. The results indicate that small companies, particularly micro-companies, may have been disproportionately affected during the 2021 flood event. The analysis of business restriction duration (Fig. 8e) emphasizes the role of implementation of precautionary measures. The median restriction duration for companies without precaution is expected to be approximately 210 d for water depth >2 m. While for companies with very good precautionary measures, the median restriction durations may be below 150 d. This indicates that very good precautionary measures can help in reducing the restriction periods, however the overlapping distributions says the outcomes may not be uniform across scenarios.
3.4 Limitations and future scope
While the study combines a unique dataset with innovative machine learning methods, our approach does have some limitations. First, the sample size for some company categories, particularly large companies, was small, which is due to the fact that the fraction of large companies affected was low. Second, survey participation was voluntary, which may have introduced selection bias. Although 431 responses create a notable sample size given the challenges of post-disaster data collection, future studies should aim for a more diverse, representative sample across different company sizes and sectors. This would further strengthen the generalizability of the findings. Moreover, comparative analyses across multiple extreme flood events in different geographical regions and socio-economic contexts would allow for broader generalization of findings. Future work should also explore sector-specific analysis, given the heterogeneous nature of companies.
The machine-learning models (EN/RF/XGB) were trained entirely on empirical data, and the bounded nature of the response variables was not explicitly encoded in their objective functions. As our study focuses on the assessment of variable importance rather than on prediction, the lack of bound-preserving objective functions has limited impact on our findings. Nevertheless, future studies should consider incorporating a modelling framework that explicitly enforces response bounds, particularly when the primary goal is predictive accuracy. Finally, converting the discretized BN outputs into continuous probability distributions enables a finer representation of predictive uncertainty, however, this step introduces an additional approximation. Specifically, the uncertainty arising from fitting the continuous probability density function replaces the discretization uncertainty inherent in the BN. This additional imprecision should be considered when interpreting the predictive density distribution.
The July 2021 flood in Germany highlighted the significant vulnerability of companies to unprecedented floods, with both direct and indirect damage resulting in substantial financial costs. This reaffirms the need for a deeper understanding of how multiple interacting factors shape damage outcomes under extreme conditions. Our findings indicate that core hazard related variables, including water depth, flow velocity, and contamination, are predictors of damage consistently across the five damage types investigated. Company characteristics such as size of the premises and number of employees also play an important role. These findings strengthen the knowledge gained on basis of earlier flood events while revealing new information in respect to an unprecedented event. What sets the 2021 flood damage processes apart is the elevated importance of emergency preparedness and behavioural responses, particularly in influencing indirect damage such as business restriction duration. A novel insight from this study is the link between knowledge about flood hazard and amount of precaution taken, highlighting its relevance in reducing business restriction duration. Small and micro-companies that implemented very good precautionary measures experienced notably shorter restriction durations. Nonetheless, scenario-based analysis shows considerable overlap and variability across scenarios indicating that the resulting damage outcomes remain highly variable and uncertain. Overall, the results underscore the critical role of preparedness and emergency and risk communication, that support non-structural measures as essential complements to structural protection that may be less effective under unprecedented conditions. This also provide a leverage point for risk communication tailored to business owners.
Data analysis code is available upon request from the first author (Ravikumar Guntu).
The survey data can be partly accessible from the German flood damage database, HOWAS21 (https://doi.org/10.1594/GFZ.SDDB.HOWAS21, GFZ Helmholtz Centre for Geosciences, 2025).
The supplement related to this article is available online at https://doi.org/10.5194/nhess-26-163-2026-supplement.
All authors contributed to the design of the study. RKG conducted the analysis and wrote the first draft. All authors reviewed and edited the final paper.
At least one of the (co-)authors is a member of the editorial board of Natural Hazards and Earth System Sciences. The peer-review process was guided by an independent editor, and the authors also have no other competing interests to declare.
Publisher's note: Copernicus Publications remains neutral with regard to jurisdictional claims made in the text, published maps, institutional affiliations, or any other geographical representation in this paper. The authors bear the ultimate responsibility for providing appropriate place names. Views expressed in the text are those of the authors and do not necessarily reflect the views of the publisher.
We would like to thank the anonymous reviewers for their constructive feedback on the article.
This research has been supported by the Bundesministerium für Bildung und Forschung within the framework of the AVOSS project (grant no. FKZ 02WEE1629C) and the KAHR project (grant no. 01LR2102I). Collection of the 2021 company data was undertaken by Section Hydrology, GFZ and Deutsche Rückversicherung AG, funded by the GFZ-HART initiative and Deutsche Rückversicherung AG.
The article processing charges for this open-access publication were covered by the GFZ Helmholtz Centre for Geosciences.
This paper was edited by Robert Sakic Trogrlic and reviewed by two anonymous referees.
Aria, M., Cuccurullo, C., and Gnasso, A.: A comparison among interpretative proposals for Random Forests, Machine Learning with Applications, 6, 100094, https://doi.org/10.1016/j.mlwa.2021.100094, 2021.
Askr, H., Abdel-Salam, M., and Hassanien, A. E.: Copula entropy-based golden jackal optimization algorithm for high-dimensional feature selection problems, Expert Systems with Applications, 238, 121582, https://doi.org/10.1016/j.eswa.2023.121582, 2024.
Blöschl, G., Hall, J., Parajka, J., Perdigão, R. A. P., Merz, B., Arheimer, B., Aronica, G. T., Bilibashi, A., Bonacci, O., Borga, M., Čanjevac, I., Castellarin, A., Chirico, G. B., Claps, P., Fiala, K., Frolova, N., Gorbachova, L., Gül, A., Hannaford, J., Harrigan, S., Kireeva, M., Kiss, A., Kjeldsen, T. R., Kohnová, S., Koskela, J. J., Ledvinka, O., Macdonald, N., Mavrova-Guirguinova, M., Mediero, L., Merz, R., Molnar, P., Montanari, A., Murphy, C., Osuch, M., Ovcharuk, V., Radevski, I., Rogger, M., Salinas, J. L., Sauquet, E., Šraj, M., Szolgay, J., Viglione, A., Volpi, E., Wilson, D., Zaimi, K., and Živković, N.: Changing climate shifts timing of European floods, Science, 357, 588–590, https://doi.org/10.1126/science.aan2506, 2017.
BMI and BMF: Report on the 2021 flood disaster: disaster relief, reconstruction and evaluation processes, https://www.bmi.bund.de/SharedDocs/downloads/DE/veroeffentlichungen/2022/finalreport-hochwasserkatastrophe.html (last access: 16 September 2024), 2022.
Breiman, L.: Random Forests, Machine Learning, 45, 5–32, https://doi.org/10.1023/A:1010933404324, 2001.
Chen, T. and Guestrin, C.: XGBoost: A Scalable Tree Boosting System, in: Proceedings of the 22nd ACM SIGKDD International Conference on Knowledge Discovery and Data Mining, KDD '16: The 22nd ACM SIGKDD International Conference on Knowledge Discovery and Data Mining, San Francisco California USA, 785–794, https://doi.org/10.1145/2939672.2939785, 2016.
Destatis: Small and medium-sized enterprises (SME), https://www.destatis.de/EN/Themes/Economic-Sectors-Enterprises/Enterprises/Small-Sized-Enterprises-Medium-Sized-Enterprises/ExplanatorySME.html (last access: 24 March 2025), 2003.
Destatis: Klassifikation der Wirtschaftszweige, Ausgabe 2008 (WZ 2008), https://www.destatis.de/DE/Methoden/Klassifikationen/Gueter-Wirtschaftsklassifikationen/klassifikation-wz-2008.html (last access: 25 March 2025), 2008.
Endendijk, T., Botzen, W. J. W., De Moel, H., Slager, K., Kok, M., and Aerts, J. C. J. H.: Enhancing resilience: Understanding the impact of flood hazard and vulnerability on business interruption and losses, Water Resources and Economics, 46, 100244, https://doi.org/10.1016/j.wre.2024.100244, 2024.
Eurostat: Micro & small businesses make up 99 % of enterprises in the EU, https://ec.europa.eu/eurostat/web/products-eurostat-news/w/ddn-20241025-1 (last access: 25 March 2025), 2024.
Fisher, A., Rudin, C., and Dominici, F.: All Models are Wrong, but Many are Useful: Learning a Variable's Importance by Studying an Entire Class of Prediction Models Simultaneously, Journal of Machine Learning Research, 20, 1–81, 2019.
GDV: Facts and figures: Flood disaster “Bernd” July 2021, General Association of Insurers, Berlin, https://www.gdv.de/resource/blob/137346/c81a749e02503cb41a3e5a61966f3d31/pdf- Schadenbalance-data.pdf (last access: 16 September 2024), 2023.
Gerl, T., Kreibich, H., Franco, G., Marechal, D., and Schröter, K.: A Review of Flood Loss Models as Basis for Harmonization and Benchmarking, PLoS ONE, 11, e0159791, https://doi.org/10.1371/journal.pone.0159791, 2016.
GFZ Helmholtz Centre for Geosciences: HOWAS21, GFZ [data set], https://doi.org/10.1594/GFZ.SDDB.HOWAS21, 2025.
Glover, F.: Future paths for integer programming and links to artificial intelligence, Computers & Operations Research, 13, 533–549, https://doi.org/10.1016/0305-0548(86)90048-1, 1986.
Goudet, O., Kalainathan, D., Caillou, P., Guyon, I., Lopez-Paz, D., and Sebag, M.: Learning Functional Causal Models with Generative Neural Networks, in: Explainable and Interpretable Models in Computer Vision and Machine Learning, edited by: Escalante, H. J., Escalera, S., Guyon, I., Baró, X., Güçlütürk, Y., Güçlü, U., and Van Gerven, M., Springer International Publishing, Cham, 39–80, https://doi.org/10.1007/978-3-319-98131-4_3, 2018.
Heckerman, D., Geiger, D., and Chickering, D. M.: Learning Bayesian networks: The combination of knowledge and statistical data, Mach. Learn., 20, 197–243, https://doi.org/10.1007/BF00994016, 1995.
Hirabayashi, Y., Mahendran, R., Koirala, S., Konoshima, L., Yamazaki, D., Watanabe, S., Kim, H., and Kanae, S.: Global flood risk under climate change, Nature Clim. Change, 3, 816–821, https://doi.org/10.1038/nclimate1911, 2013.
Hudson, P. and Thieken, A. H.: The presence of moral hazard regarding flood insurance and German private businesses, Nat. Hazards, 112, 1295–1319, https://doi.org/10.1007/s11069-022-05227-9, 2022.
Hudson, P., Bubeck, P., and Thieken, A. H.: A comparison of flood-protective decision-making between German households and businesses, Mitig. Adapt. Strateg. Glob. Change, 27, 5, https://doi.org/10.1007/s11027-021-09982-1, 2022.
Jehmlich, C., Hudson, P., and Thieken, A. H.: Short contribution on adaptive behaviour of flood-prone companies: A pilot study of Dresden-Laubegast, Germany, Journal of Flood Risk Management, 13, https://doi.org/10.1111/jfr3.12653, 2020.
Jongman, B., Kreibich, H., Apel, H., Barredo, J. I., Bates, P. D., Feyen, L., Gericke, A., Neal, J., Aerts, J. C. J. H., and Ward, P. J.: Comparative flood damage model assessment: towards a European approach, Nat. Hazards Earth Syst. Sci., 12, 3733–3752, https://doi.org/10.5194/nhess-12-3733-2012, 2012.
Kabirzad, S. A., Rehan, B. M., Zulkafli, Z., Yusuf, B., Hasan-Basri, B., and Toriman, M. E.: Examining direct and indirect flood damages in residential and business sectors through an empirical lens, Water Science and Technology, 90, 142–155, https://doi.org/10.2166/wst.2024.202, 2024.
Kitson, N. K., Constantinou, A. C., Guo, Z., Liu, Y., and Chobtham, K.: A survey of Bayesian Network structure learning, Artif. Intell. Rev., 56, 8721–8814, https://doi.org/10.1007/s10462-022-10351-w, 2023.
Koks, E. E., Bočkarjova, M., de Moel, H., and Aerts, J. C. J. H.: Integrated Direct and Indirect Flood Risk Modeling: Development and Sensitivity Analysis, Risk Analysis, 35, 882–900, https://doi.org/10.1111/risa.12300, 2015.
Kowarik, A. and Templ, M.: Imputation with the R Package VIM, J. Stat. Soft., 74, https://doi.org/10.18637/jss.v074.i07, 2016.
Kreibich, H., Müller, M., Thieken, A. H., and Merz, B.: Flood precaution of companies and their ability to cope with the flood in August 2002 in Saxony, Germany, Water Resources Research, 43, 2005WR004691, https://doi.org/10.1029/2005WR004691, 2007.
Kreibich, H., Seifert, I., Merz, B., and Thieken, A. H.: Development of FLEMOcs – a new model for the estimation of flood losses in the commercial sector, Hydrological Sciences Journal, 55, 1302–1314, https://doi.org/10.1080/02626667.2010.529815, 2010.
Kreibich, H., Van Loon, A. F., Schröter, K., Ward, P. J., Mazzoleni, M., Sairam, N., Abeshu, G. W., Agafonova, S., AghaKouchak, A., Aksoy, H., Alvarez-Garreton, C., Aznar, B., Balkhi, L., Barendrecht, M. H., Biancamaria, S., Bos-Burgering, L., Bradley, C., Budiyono, Y., Buytaert, W., Capewell, L., Carlson, H., Cavus, Y., Couasnon, A., Coxon, G., Daliakopoulos, I., De Ruiter, M. C., Delus, C., Erfurt, M., Esposito, G., François, D., Frappart, F., Freer, J., Frolova, N., Gain, A. K., Grillakis, M., Grima, J. O., Guzmán, D. A., Huning, L. S., Ionita, M., Kharlamov, M., Khoi, D. N., Kieboom, N., Kireeva, M., Koutroulis, A., Lavado-Casimiro, W., Li, H.-Y., LLasat, M. C., Macdonald, D., Mård, J., Mathew-Richards, H., McKenzie, A., Mejia, A., Mendiondo, E. M., Mens, M., Mobini, S., Mohor, G. S., Nagavciuc, V., Ngo-Duc, T., Thao Nguyen Huynh, T., Nhi, P. T. T., Petrucci, O., Nguyen, H. Q., Quintana-Seguí, P., Razavi, S., Ridolfi, E., Riegel, J., Sadik, M. S., Savelli, E., Sazonov, A., Sharma, S., Sörensen, J., Arguello Souza, F. A., Stahl, K., Steinhausen, M., Stoelzle, M., Szalińska, W., Tang, Q., Tian, F., Tokarczyk, T., Tovar, C., Tran, T. V. T., Van Huijgevoort, M. H. J., Van Vliet, M. T. H., Vorogushyn, S., Wagener, T., Wang, Y., Wendt, D. E., Wickham, E., Yang, L., Zambrano-Bigiarini, M., Blöschl, G., and Di Baldassarre, G.: The challenge of unprecedented floods and droughts in risk management, Nature, 608, 80–86, https://doi.org/10.1038/s41586-022-04917-5, 2022.
Leitold, R., Garschagen, M., Tran, V., and Revilla Diez, J.: Flood risk reduction and climate change adaptation of manufacturing firms: Global knowledge gaps and lessons from Ho Chi Minh City, International Journal of Disaster Risk Reduction, 61, 102351, https://doi.org/10.1016/j.ijdrr.2021.102351, 2021.
Li, W., Wen, J., Xu, B., Li, X., and Du, S.: Integrated Assessment of Economic Losses in Manufacturing Industry in Shanghai Metropolitan Area Under an Extreme Storm Flood Scenario, Sustainability, 11, 126, https://doi.org/10.3390/su11010126, 2018.
Ma, M., Zhao, G., He, B., Li, Q., Dong, H., Wang, S., and Wang, Z.: XGBoost-based method for flash flood risk assessment, Journal of Hydrology, 598, 126382, https://doi.org/10.1016/j.jhydrol.2021.126382, 2021.
Merz, B., Blöschl, G., Vorogushyn, S., Dottori, F., Aerts, J. C. J. H., Bates, P., Bertola, M., Kemter, M., Kreibich, H., Lall, U., and Macdonald, E.: Causes, impacts and patterns of disastrous river floods, Nat. Rev. Earth Environ., 2, 592–609, https://doi.org/10.1038/s43017-021-00195-3, 2021.
Mohor, G. S., Hudson, P., and Thieken, A. H.: A Comparison of Factors Driving Flood Losses in Households Affected by Different Flood Types, Water Resources Research, 56, e2019WR025943, https://doi.org/10.1029/2019WR025943, 2020.
Mohr, S., Ehret, U., Kunz, M., Ludwig, P., Caldas-Alvarez, A., Daniell, J. E., Ehmele, F., Feldmann, H., Franca, M. J., Gattke, C., Hundhausen, M., Knippertz, P., Küpfer, K., Mühr, B., Pinto, J. G., Quinting, J., Schäfer, A. M., Scheibel, M., Seidel, F., and Wisotzky, C.: A multi-disciplinary analysis of the exceptional flood event of July 2021 in central Europe – Part 1: Event description and analysis, Nat. Hazards Earth Syst. Sci., 23, 525–551, https://doi.org/10.5194/nhess-23-525-2023, 2023.
Munich Re: Hurricanes, cold waves, tornadoes: Weather disasters in USA dominate natural disaster losses in 2021, https://www.munichre.com/en/company/media-relations/media-information-and-corporate-news/media-information/2022/natural-disaster-losses-2021.html (last access: 24 January 2025), 2022.
Munich Re: Climate change is showing its claws: The world is getting hotter, resulting in severe hurricanes, thunderstorms and floods, https://www.munichre.com/en/company/media-relations/media-information-and-corporate-news/media-information/2025/natural-disaster-figures-2024.html (last access: 15 January 2025), 2025.
Nafari, R. H., Ngo, T., and Lehman, W.: Development and evaluation of FLFAcs – A new Flood Loss Function for Australian commercial structures, International Journal of Disaster Risk Reduction, 17, 13–23, https://doi.org/10.1016/j.ijdrr.2016.03.007, 2016.
Narin, O. G.: Gap filling of water level time series with water area using remote sensing data: a comparative performance analysis of polynomial functions, XGBoost, Random Forest and Support Vector Machine, Hydrological Sciences Journal, 70, 750–760, https://doi.org/10.1080/02626667.2025.2458555, 2025.
Neise, T. and Revilla Diez, J.: Adapt, move or surrender? Manufacturing firms' routines and dynamic capabilities on flood risk reduction in coastal cities of Indonesia, International Journal of Disaster Risk Reduction, 33, 332–342, https://doi.org/10.1016/j.ijdrr.2018.10.018, 2019.
Pearl, J.: Probabilistic Reasoning in Intelligent Systems, Elsevier, https://doi.org/10.1016/C2009-0-27609-4, 1988.
Pedregosa, F., Varoquaux, G., Gramfort, A., Michel, V., Thirion, B., Grisel, O., Blondel, M., Prettenhofer, P., Weiss, R., Dubourg, V., Vanderplas, J., Passos, A., Cournapeau, D., Brucher, M., Perrot, M., and Duchesnay, É.: Scikit-learn: Machine Learning in Python, Journal of Machine Learning Research, 12, 2825–2830, 2011.
Pfurtscheller, C. and Vetter, M.: Assessing entrepreneurial and regional-economic flood impacts on a globalized production facility, J. Flood Risk Management, 8, 329–342, https://doi.org/10.1111/jfr3.12102, 2015.
Rhein, B. and Kreibich, H.: Causes of the exceptionally high number of fatalities in the Ahr valley, Germany, during the 2021 flood, Nat. Hazards Earth Syst. Sci., 25, 581–589, https://doi.org/10.5194/nhess-25-581-2025, 2025.
Sairam, N., Schröter, K., Lüdtke, S., Merz, B., and Kreibich, H.: Quantifying Flood Vulnerability Reduction via Private Precaution, Earth's Future, 7, 235–249, https://doi.org/10.1029/2018EF000994, 2019.
Sakai, P. and Yao, Z.: Financial losses and flood damages experienced by SMEs: Who are the biggest losers across sectors and sizes?, International Journal of Disaster Risk Reduction, 91, https://doi.org/10.1016/j.ijdrr.2023.103677, 2023.
Schoppa, L., Sieg, T., Vogel, K., Zöller, G., and Kreibich, H.: Probabilistic Flood Loss Models for Companies, Water Resources Research, 56, e2020WR027649, https://doi.org/10.1029/2020WR027649, 2020.
Schoppa, L., Barendrecht, M., Sieg, T., Sairam, N., and Kreibich, H.: Augmenting a socio-hydrological flood risk model for companies with process-oriented loss estimation, Hydrological Sciences Journal, 67, 1623–1639, https://doi.org/10.1080/02626667.2022.2095207, 2022.
Schröter, K., Kreibich, H., Vogel, K., Riggelsen, C., Scherbaum, F., and Merz, B.: How useful are complex flood damage models?, Water Resources Research, 50, 3378–3395, https://doi.org/10.1002/2013WR014396, 2014.
Seifert, I., Kreibich, H., Merz, B., and Thieken, A. H.: Application and validation of FLEMOcs – a flood-loss estimation model for the commercial sector, Hydrological Sciences Journal, 55, 1315–1324, https://doi.org/10.1080/02626667.2010.536440, 2010.
Sieg, T., Vogel, K., Merz, B., and Kreibich, H.: Tree-based flood damage modeling of companies: Damage processes and model performance, Water Resources Research, 53, 6050–6068, https://doi.org/10.1002/2017WR020784, 2017.
Sieg, T., Schinko, T., Vogel, K., Mechler, R., Merz, B., and Kreibich, H.: Integrated assessment of short-term direct and indirect economic flood impacts including uncertainty quantification, PLoS ONE, 14, e0212932, https://doi.org/10.1371/journal.pone.0212932, 2019.
Sucar, L. E.: Probabilistic Graphical Models: Principles and Applications, Springer International Publishing, Cham, https://doi.org/10.1007/978-3-030-61943-5, 2021.
Sultana, Z., Sieg, T., Kellermann, P., Müller, M., and Kreibich, H.: Assessment of Business Interruption of Flood-Affected Companies Using Random Forests, Water, 10, 1049, https://doi.org/10.3390/w10081049, 2018.
Tay, J. K., Narasimhan, B., and Hastie, T.: Elastic Net Regularization Paths for All Generalized Linear Models, J. Stat. Soft., 106, https://doi.org/10.18637/jss.v106.i01, 2023.
Thieken, A., Kreibich, H., Müller, M., and Lamond, J.: Data Collection for a Better Understanding of What Causes Flood Damage–Experiences with Telephone Surveys, in: Geophysical Monograph Series, edited by: Molinari, D., Menoni, S., and Ballio, F., Wiley, 95–106, https://doi.org/10.1002/9781119217930.ch7, 2017.
Thieken, A., Bubeck, P., and Zenker, M.-L.: Fatal incidents during the flood of July 2021 in North Rhine-Westphalia, Germany: what can be learnt for future flood risk management?, JCRFR, 2, https://doi.org/10.59490/jcrfr.2023.0005, 2023a.
Thieken, A. H., Bessel, T., Kienzler, S., Kreibich, H., Müller, M., Pisi, S., and Schröter, K.: The flood of June 2013 in Germany: how much do we know about its impacts?, Nat. Hazards Earth Syst. Sci., 16, 1519–1540, https://doi.org/10.5194/nhess-16-1519-2016, 2016.
Thieken, A. H., Samprogna Mohor, G., Kreibich, H., and Müller, M.: Compound inland flood events: different pathways, different impacts and different coping options, Nat. Hazards Earth Syst. Sci., 22, 165–185, https://doi.org/10.5194/nhess-22-165-2022, 2022.
Thieken, A. H., Bubeck, P., Heidenreich, A., von Keyserlingk, J., Dillenardt, L., and Otto, A.: Performance of the flood warning system in Germany in July 2021 – insights from affected residents, Nat. Hazards Earth Syst. Sci., 23, 973–990, https://doi.org/10.5194/nhess-23-973-2023, 2023b.
Trenczek, J., Lühr, O., Lukas, E., and Viktoria, L.: Damage from flash floods and floods in July 2021 in Germany. An ex-post analysis. Project report, Prognos AG, Düsseldorf, https://www.prognos.com/sites/default/files/2022-07/Prognos_ClimatechangeConsequencesDeutschland_Detailprobe Flut_AP2_3b_.pdf (last access: 25 October 2024), 2022.
Wagenaar, D., Lüdtke, S., Schröter, K., Bouwer, L. M., and Kreibich, H.: Regional and Temporal Transferability of Multivariable Flood Damage Models, Water Resources Research, 54, 3688–3703, https://doi.org/10.1029/2017WR022233, 2018.
Wutzler, B., Hudson, P., and Thieken, A. H.: Adaptation strategies of flood-damaged businesses in Germany, Frontiers in Water, 4, https://doi.org/10.3389/frwa.2022.932061, 2022.
Yang, L., Kajitani, Y., Tatano, H., and Jiang, X.: A methodology for estimating business interruption loss caused by flood disasters: insights from business surveys after Tokai Heavy Rain in Japan, Nat. Hazards, 84, 411–430, https://doi.org/10.1007/s11069-016-2534-3, 2016.
Zander, K. K., Nguyen, D., Mirbabaie, M., and Garnett, S. T.: Aware but not prepared: understanding situational awareness during the century flood in Germany in 2021, International Journal of Disaster Risk Reduction, 96, 103936, https://doi.org/10.1016/j.ijdrr.2023.103936, 2023.
Zhang, Z. and Tian, H.: Hybrid imputation-based optimal evidential classification for missing data, Appl. Intell., 55, 69, https://doi.org/10.1007/s10489-024-05950-9, 2025.
Zou, H. and Hastie, T.: Regularization and Variable Selection Via the Elastic Net, Journal of the Royal Statistical Society Series B: Statistical Methodology, 67, 301–320, https://doi.org/10.1111/j.1467-9868.2005.00503.x, 2005.