the Creative Commons Attribution 4.0 License.
the Creative Commons Attribution 4.0 License.
 | 13 Nov 2025
Assessing atoll island future habitability in the context of climate change using Bayesian networks
Mirna Badillo-Interiano
Jérémy Rohmer
Gonéri Le Cozannet
Virginie Duvat
Atoll islands are threatened by multiple climate change impacts, such as sea-level rise, extreme sea-level events, ocean warming, and acidification. A recent approach to assessing climate change risk to these islands is to use multi-criteria expert judgment methods. These approaches can serve as a basis for the development of Bayesian Networks (BNs) integrating expert knowledge and uncertainties to perform climate risk assessments. Here, we use the multi-criteria expert-based assessment of Duvat et al. (2021), who assessed future risk to habitability for four Indian and Pacific Oceans' atoll islands, in order to discuss the advantages and limitations of the BN model. Advantages of the approach include the explicit treatment of uncertainties and the possibility to query expert knowledge in a non-trivial manner. For example, expert knowledge can be used to assess risks to habitability and future uncertainties and to explore inverse problems such as which drivers can exceed specific risk thresholds. Our work suggests that BN, though requiring a certain level of implementation expertise, could be used to assess climate change risk and support climate adaptation.
- Article
(5874 KB) - Full-text XML
-
Supplement
(2182 KB) - BibTeX
- EndNote


Atoll islands are highly vulnerable to climate change. This vulnerability is mainly due to their low-lying elevation and limited land resources (Mycoo et al., 2022). The Intergovernmental Panel on Climate Change (IPCC) mentions in the Sixth Assessment Report (IPCC, 2022) that these islands are increasingly affected by multiple changes, including sea level rise, increased temperatures, impacts of tropical cyclones, droughts, storm surges, coral bleaching, and changes in rainfall. Impacts related to these changes have already been observed, such as flooding, coastal erosion, and loss of coral reefs and ecosystem services. Multiple studies have shown that these impacts vary between island types and regions (Duvat et al., 2021) and can be exacerbated by compound effects (Wadey et al., 2017) and human activities (Rey et al., 2017).
Multiple projected changes, such as increased temperature, extreme sea levels, and degradation of ecosystems, are expected to exacerbate sea-related hazards in atoll settings (Mycoo et al., 2022). For example, Vitousek et al. (2017) suggest that changes in wave climate combined with sea-level rise will increase the risk of flooding, especially in the tropical Pacific and Indian Oceans. In some regions, increased drought intensity could result in freshwater insecurities (Karnauskas et al., 2016; Schewe et al., 2014). Loss of coastal ecosystems and associated services resulting from the combination of global climate change and local anthropogenic disturbances will likely increase land loss, negatively impacting food and water supply as well as economic activities (Pratchett et al., 2008). In addition, other processes such as soil and groundwater salinization, changes in rainfall patterns, and increased temperatures are also expected to compromise resource availability and disrupt economic activities (Mycoo et al., 2022). This could challenge the ability of populations and ecosystems to recover and adapt in atoll settings.
In this context, integrated risk assessments become increasingly necessary to develop adaptation plans. However, such holistic assessments are complex mainly due to knowledge gaps, limited data, and uncertainties around climate change. Moreover, the complex interplay between climatic and non-climatic drivers turns on feedback loops and cumulative and cascading impacts (Simpson et al., 2021; Westra and Zscheischler, 2023) that are difficult to understand and predict. Recognizing this complexity, many previous integrated assessments assessed present-day or future climate risk following a three-step approach. In a first step, a conceptual model identifying the different components of the studied system and their interlinkages was developed. Then, knowledge was collected using a multicriteria analysis to characterize the severity and confidence level of each risk factor. These factors, such as sea level rise, population pressure, or extreme events, are the drivers that can negatively affect the components defined in the first step. In a final step, this knowledge was aggregated. In the area of coastal risk assessments, the “Coastal Vulnerability Index” of Gornitz et al. (1991) is a foundational example of such approaches. More recent examples include the burning embers (Zommers et al., 2020) for climate risk assessments used in the Working Group 2 reports of the IPCC and the integrated system approach to assessing future climate risk to atoll islands developed by Duvat et al. (2021).
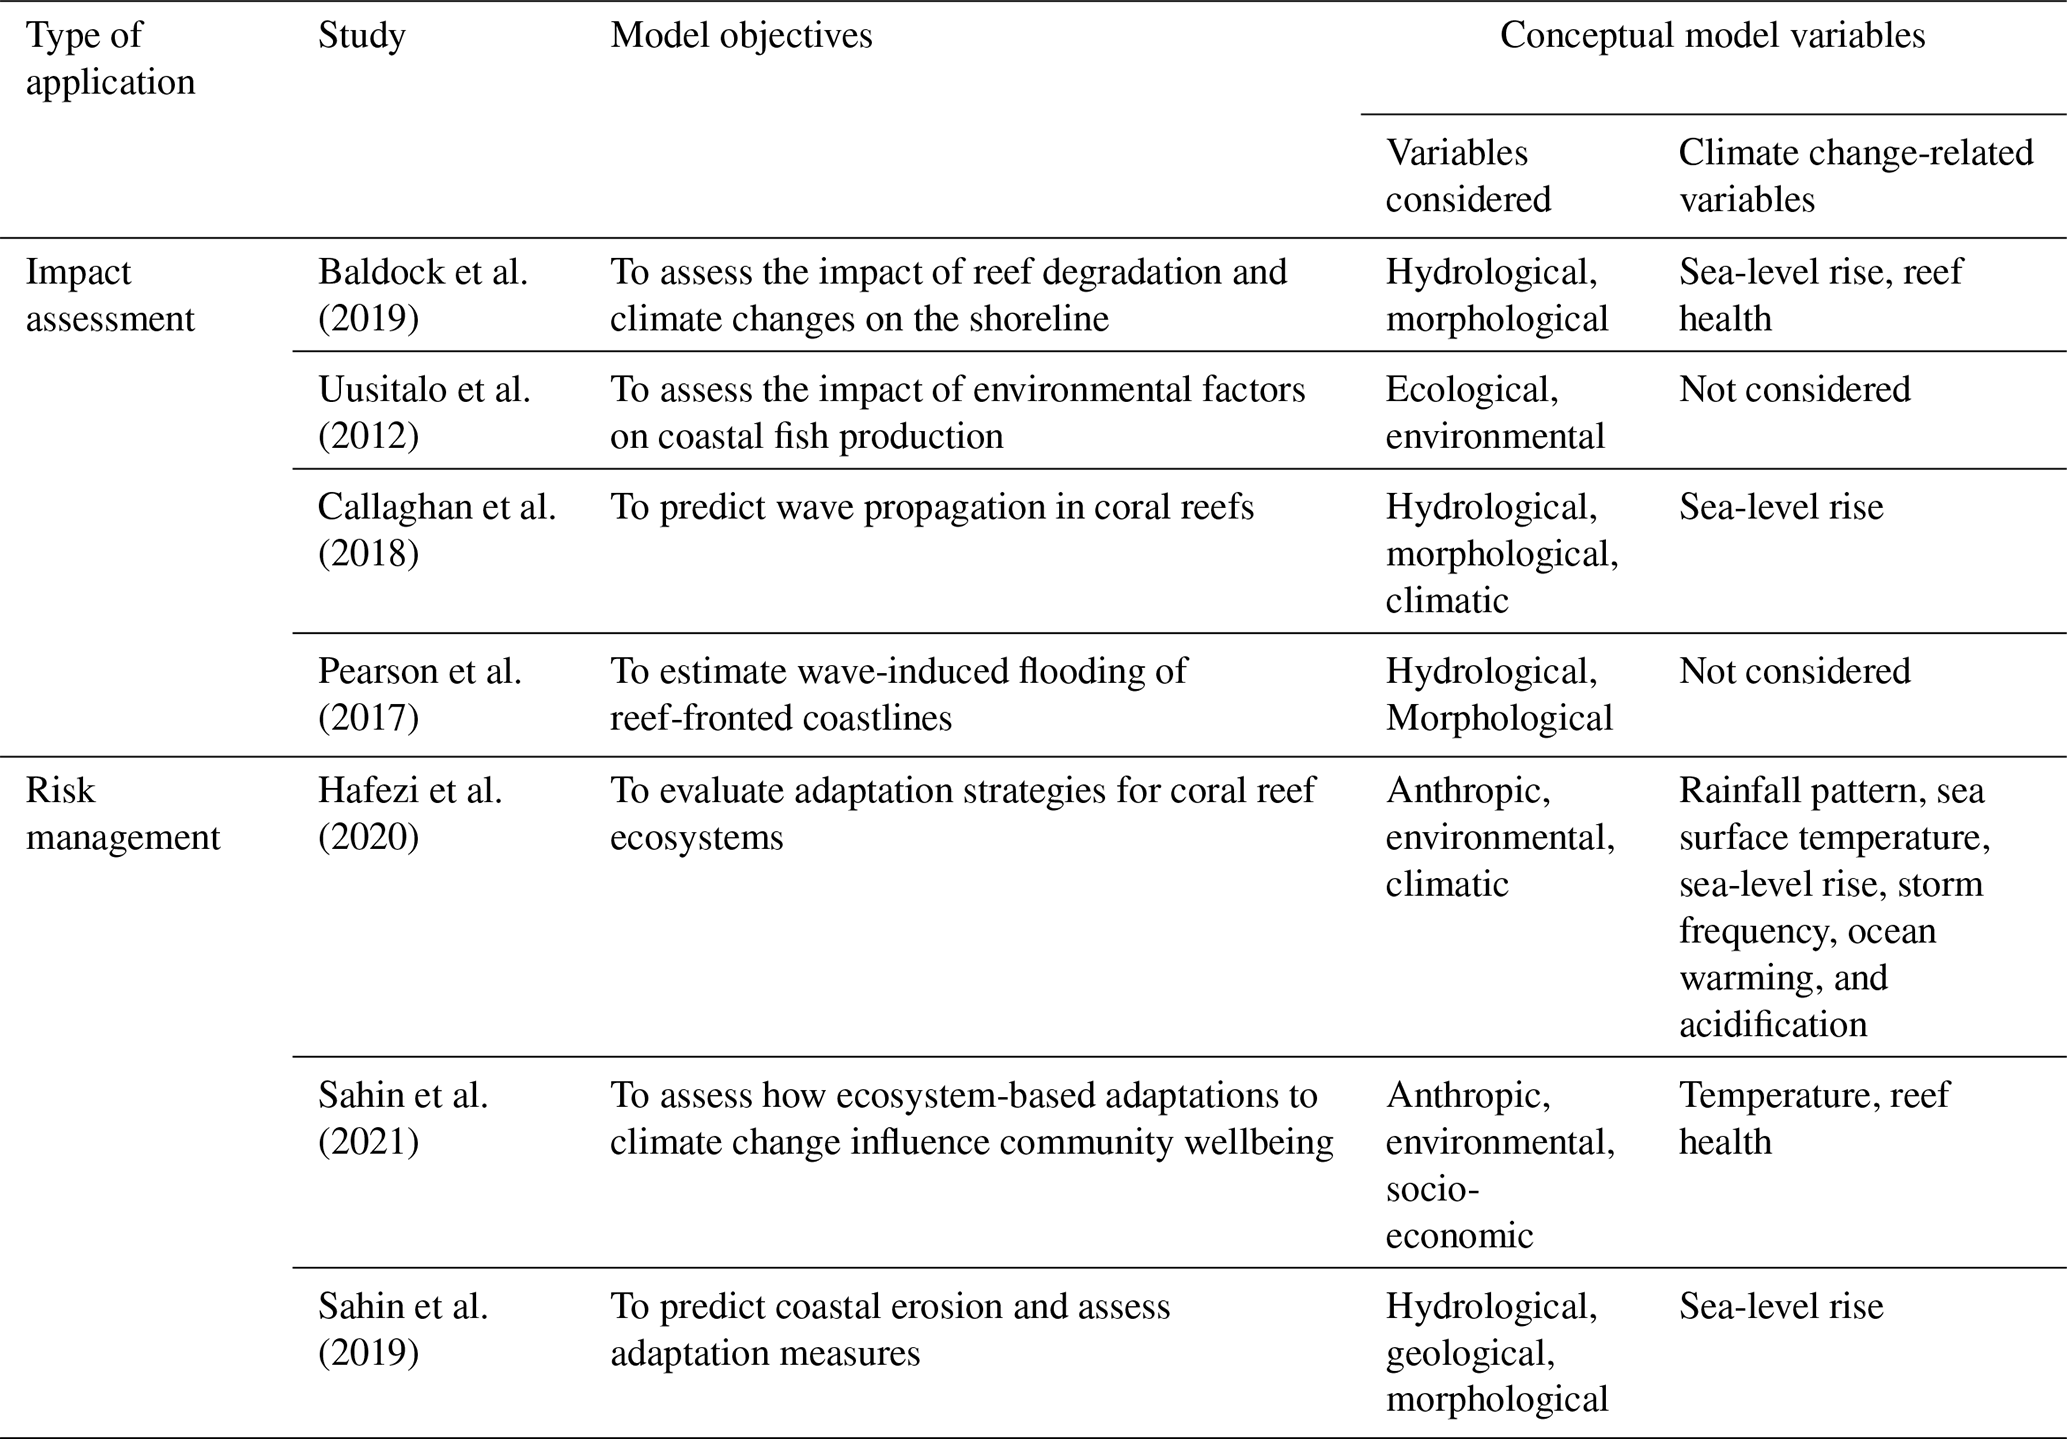
Other approaches, such as Bayesian Networks (BNs), have shown potential to address complex systems and uncertainties. A BN is a probabilistic graphical model that allows for representing and quantifying interactions between multiple variables. In coastal systems, BNs have been widely applied to understand physical processes such as coastal cliff erosion (Hapke and Plant, 2010), dune erosion due to extreme events (den Heijer et al., 2012), and surf zone processes (Plant and Holland, 2011). These models have also been successfully used for hazard assessment and risk management. With this aim, BNs have been developed to predict multiple coastal hazards (Narayan et al., 2015; Poelhekke et al., 2016), to assess hurricane damages (van Verseveld et al., 2015), and to evaluate the effectiveness of risk reduction measures (Banan-Dallalian et al., 2023; Ferreira et al., 2019; Jäger et al., 2018; Plomaritis et al., 2018; Sanuy et al., 2018). In small islands, there are few applications of BNs to assess hazards (Pearson et al., 2017) and the effectiveness of adaptation strategies (Sahin et al., 2021) (Table 2).
BNs explicitly integrate uncertainties, suggesting their potential to address climate change-related issues (Sperotto et al., 2017). Some applications include impact assessments of sea-level rise (Gutierrez et al., 2011; Yates and Le Cozannet, 2012) and coral reef degradation (Baldock et al., 2019), and evaluations of adaptation strategies (Hafezi et al., 2020; Phan et al., 2020). Despite their growing application to climate change-related issues, only a few focused on integrated climate risk assessments (Catenacci and Giupponi, 2013). For small island contexts, applications remain limited, and to our best knowledge, integrated risk assessments using Bayesian networks are not available or have not yet been conducted.
In this paper, we develop a BN model based on Duvat et al. (2021) to assess the climate risk to the habitability of four atoll islands in the Pacific and Indian Oceans (Fig. 1) under the Representative Concentration Pathways (RCP) 2.6 and 8.5 for the years 2050 and 2090. We aim to explore the potential and limitations of the BN for integrated climate risk assessments. Our objective is to focus on the methodological aspects and not on the collection of expert knowledge or the structuration of the problem. Therefore, we use the conceptual diagram of Duvat et al. (2021) as a BN structure on the one hand, and their expert-based assessment to inform the conditional probabilities in the network on the other hand. We converted expert judgments into probabilities (Sect. 2.4.2) using beta distributions, which were then incorporated into the model as prior knowledge. The BN analysis (Sect. 3) focuses on risk assessment, identification of major risk factors, identification of thresholds, and evaluation of the possible impact of risk reduction scenarios. To study these elements, we addressed the following research questions:
-
Risk assessment: What is the probability of risk to habitability given an RCP scenario and a time horizon? This question is addressed in Sect. 4.1.
-
Identification of critical thresholds: What levels of risk could lead to adaptation limits? This question is addressed in Sect. 4.2.
-
Identification of the major risk factors: Which risk factors are present when the risk to island habitability is high? This question is addressed in Sect. 4.3.
-
Evaluation of risk reduction scenarios: To what extent is the risk to habitability reduced if we act on the risk factors that contribute the most? This question is addressed in Sect. 4.4.
In the next sections, we present the framework and provide the fundamentals of BNs. This is followed by the description of BN development and the results of the BN analysis. Finally, we discuss the sensitivity test results and the potential and limits of the method.
To improve the readability of the content, Table 1 provides definitions of key terms.
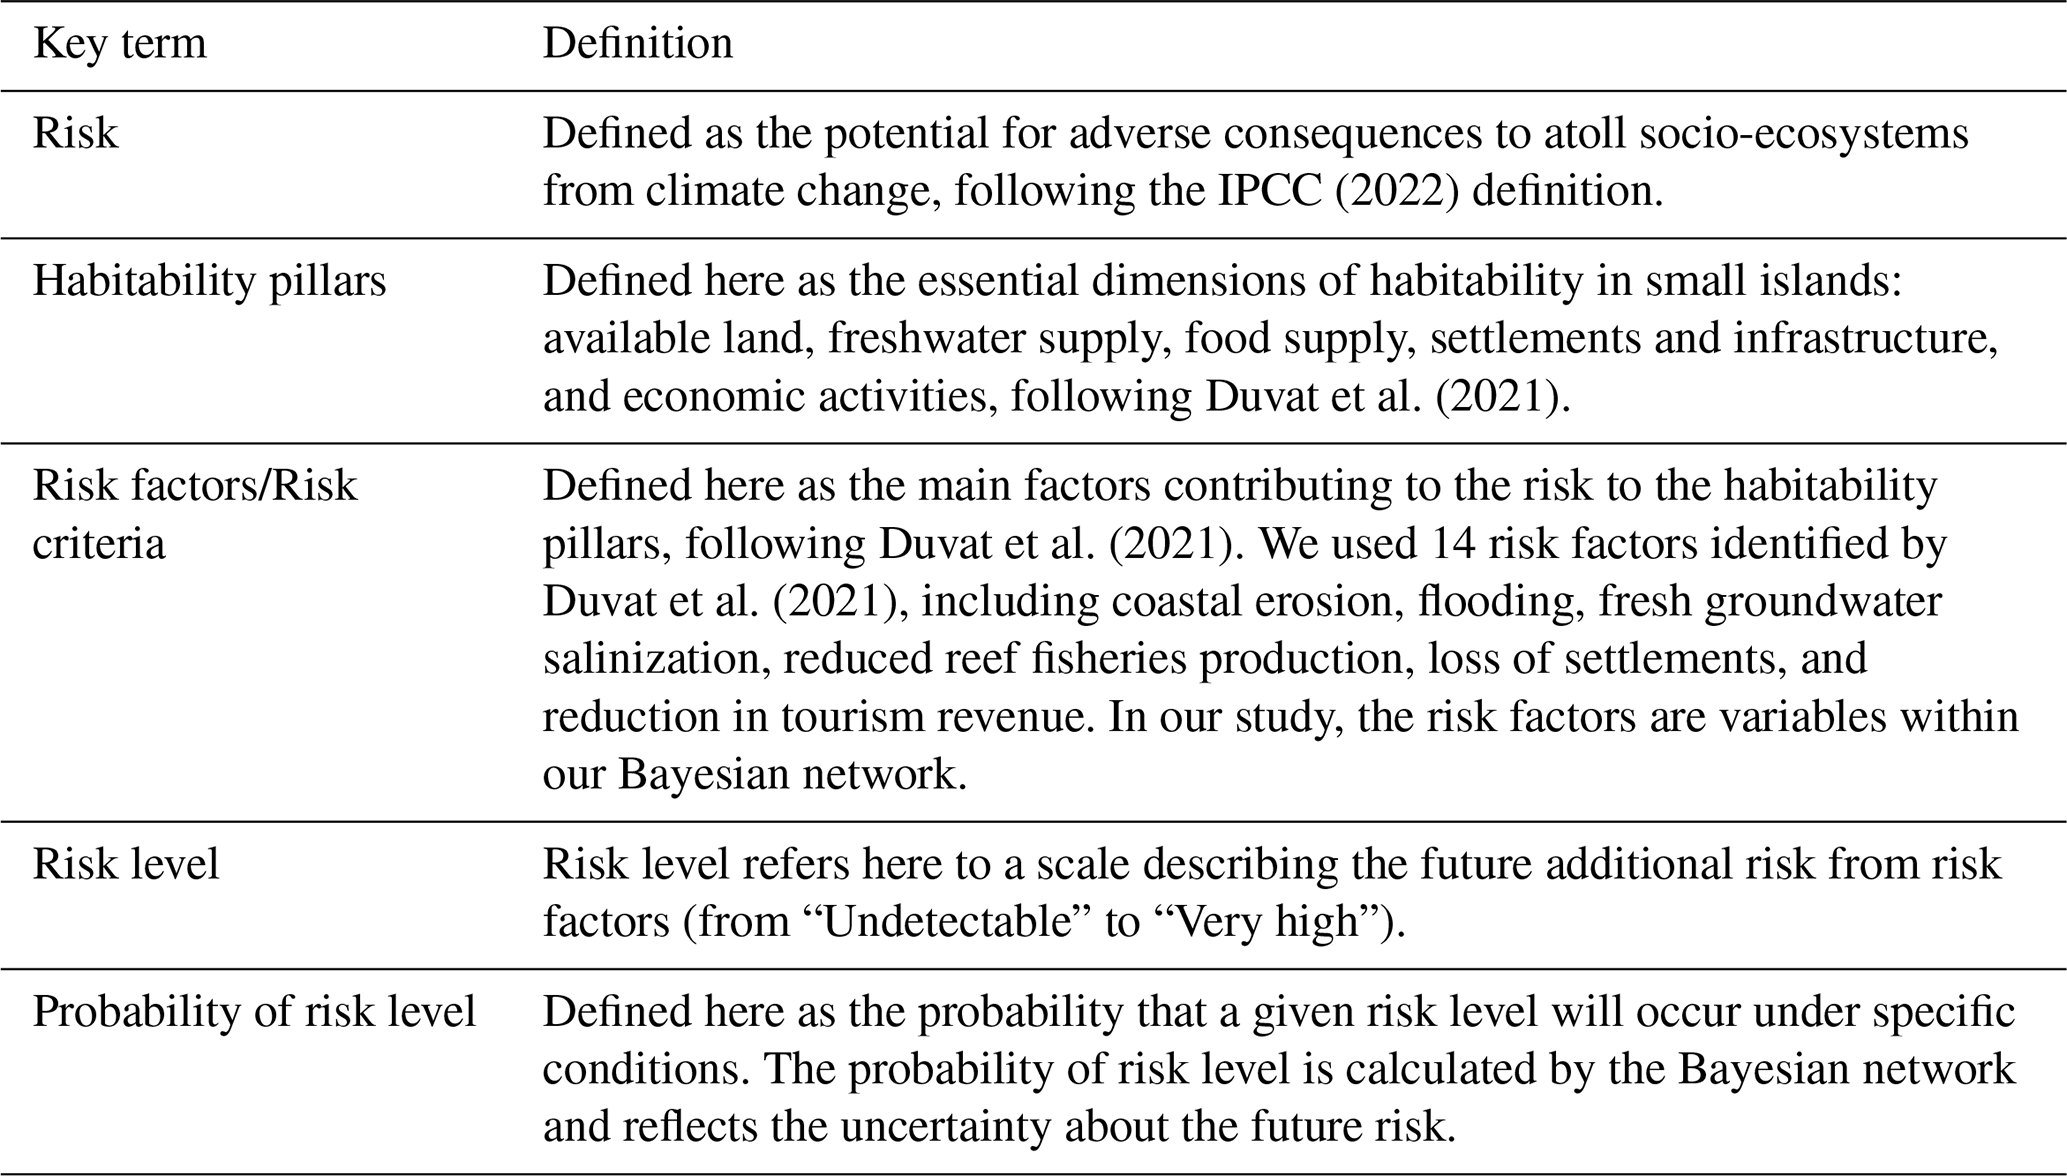
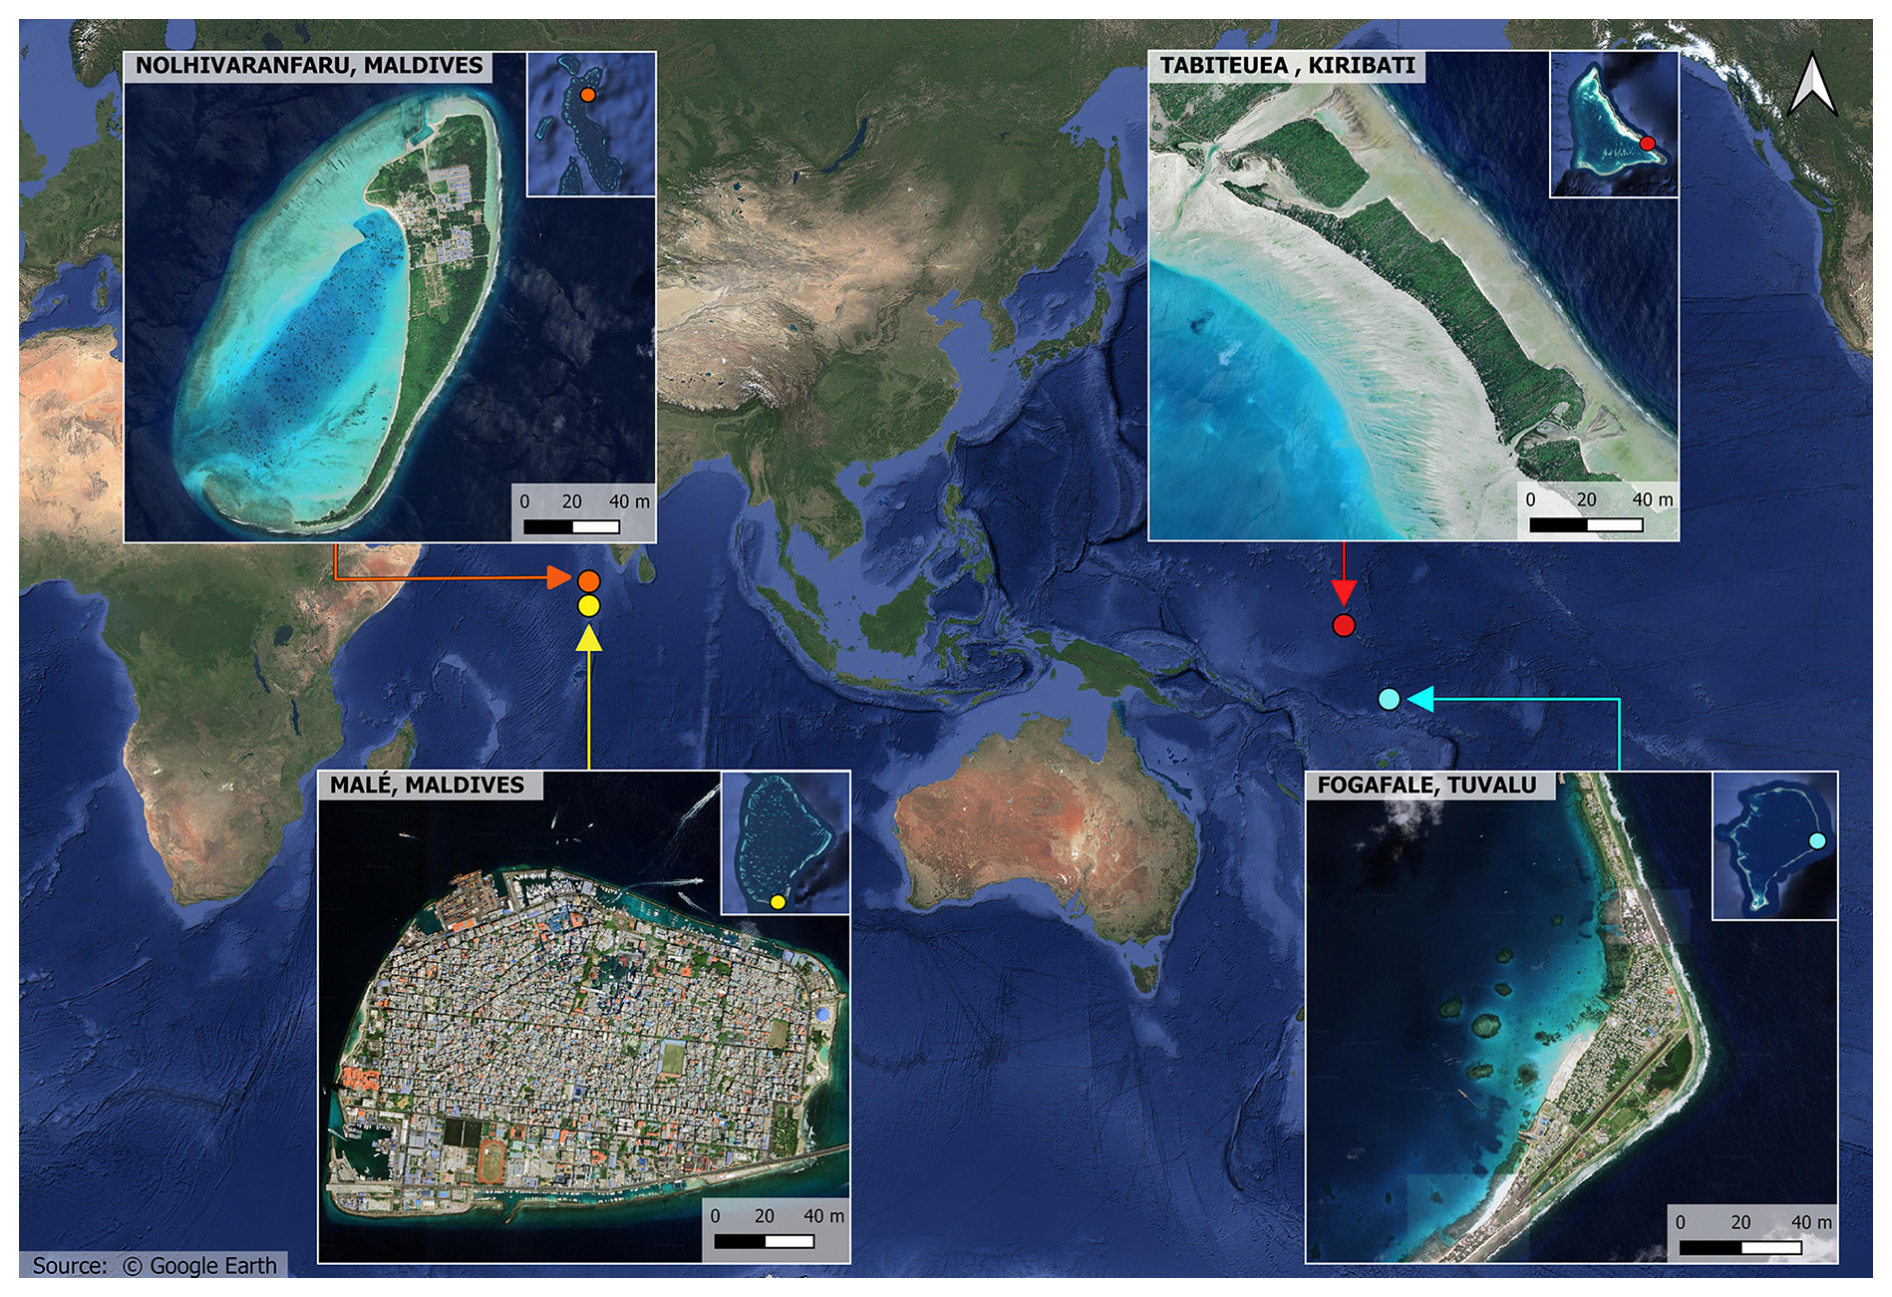
Figure 1Location of the atoll islands of interest: Malé (4°11′ N, 73°30′ E) and Nolhivaranfaru (6°41′ N, 73°07′ E) in the Indian Ocean, and Fogafale (8°31′ S, 179°12′ E) and Tabiteuea (1°25′ N, 173°06′ E) in the Pacific Ocean. © Google Earth.
Table 2List of reviewed studies of Bayesian network applications in small islands.
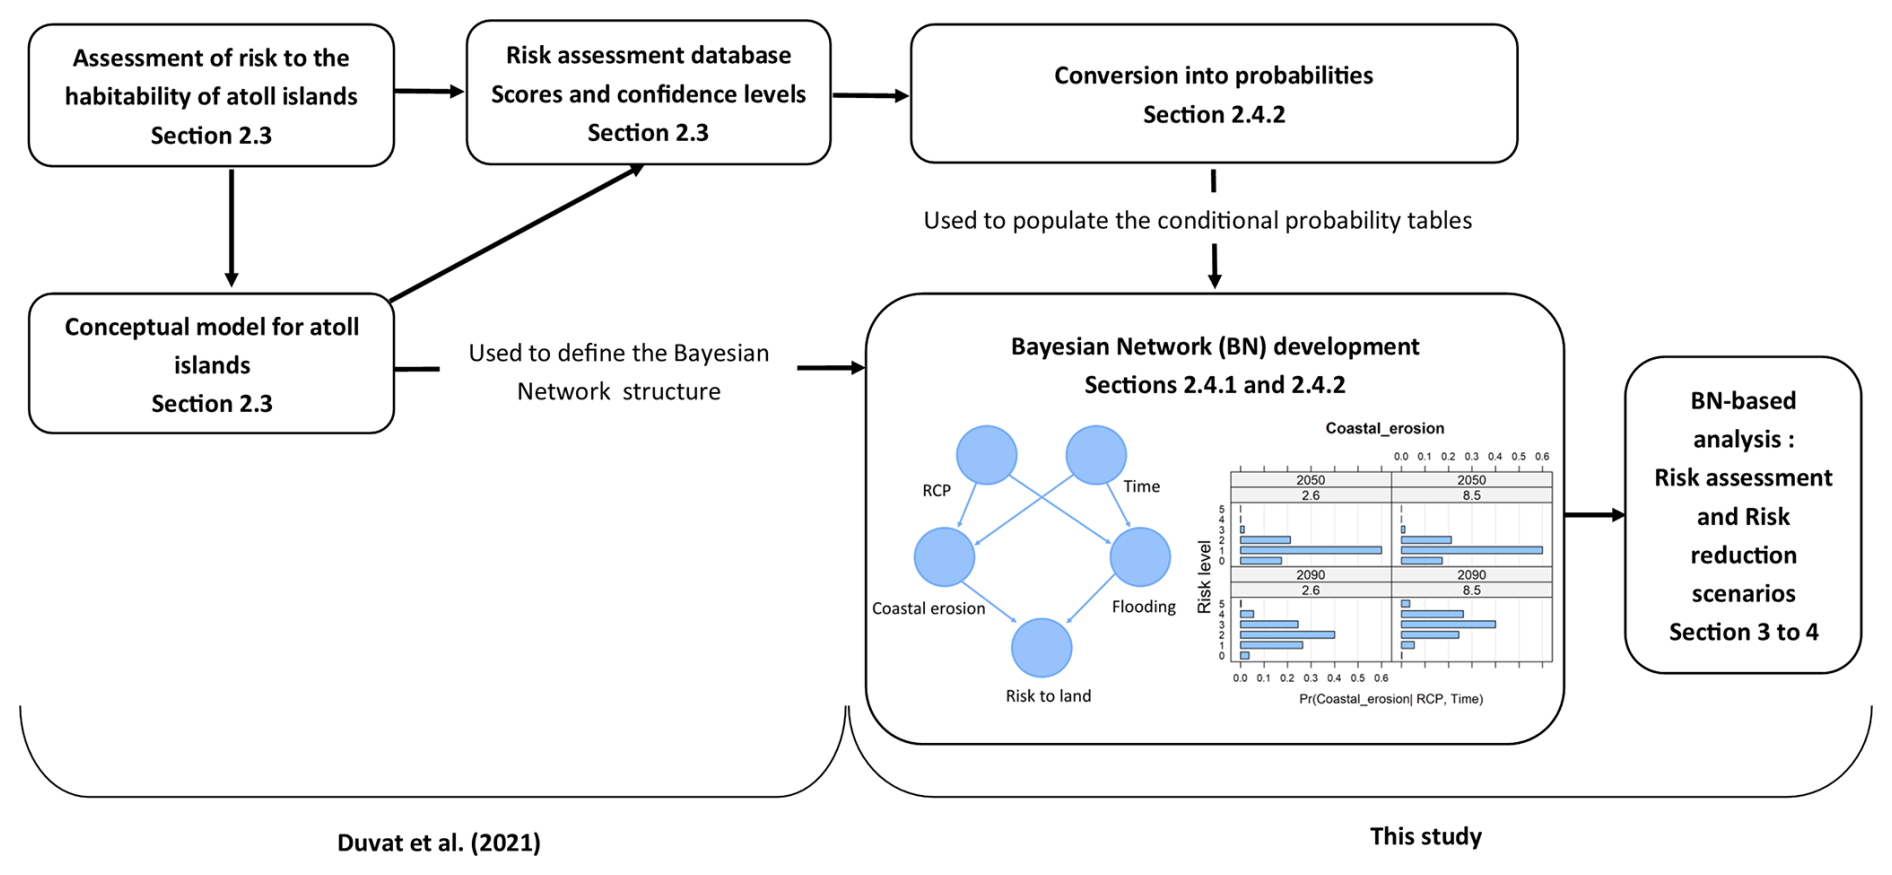
The proposed methodological framework is shown in Fig. 2. Based on Duvat et al. (2021), we present the BN model aimed at assessing the climate risk to the habitability of atoll islands and adaptation effectiveness under the RCP 2.6 and RCP 8.5 in 2050 and 2090. The network structure is based on the conceptual model of atoll habitability from Duvat et al. (2021). The geographical settings are presented in Sect. 2.2. The expert judgments and associated scores (our input data) are presented in Sect. 2.3 (the full risk assessment database is available in the supplement provided by Duvat et al., 2021). Thus, the key methodological inputs in this manuscript are the translation of scores and confidence levels assessed by Duvat et al. (2021) into probabilities on the one hand, and the development of the Bayesian network on the other hand.
2.1 Bayesian networks
A Bayesian network (BN) is a probabilistic graphical model representing probabilistic associations between random variables. The BN is defined by a structure and conditional probability tables (CPT). The structure is defined by nodes and arcs, representing the variables and the relationships between these variables, respectively (Fig. 3). The arrow indicates the influence direction from the parent node to the child node. Each node in the network is associated with a probability table. When a node has no parents, it is associated with a probability table containing a marginal probability distribution, since it is not conditioned on any other variables. When a node has parents, it is associated with a conditional probability table (CPT), which contains a conditional probability distribution that depends on the states of its parent nodes.
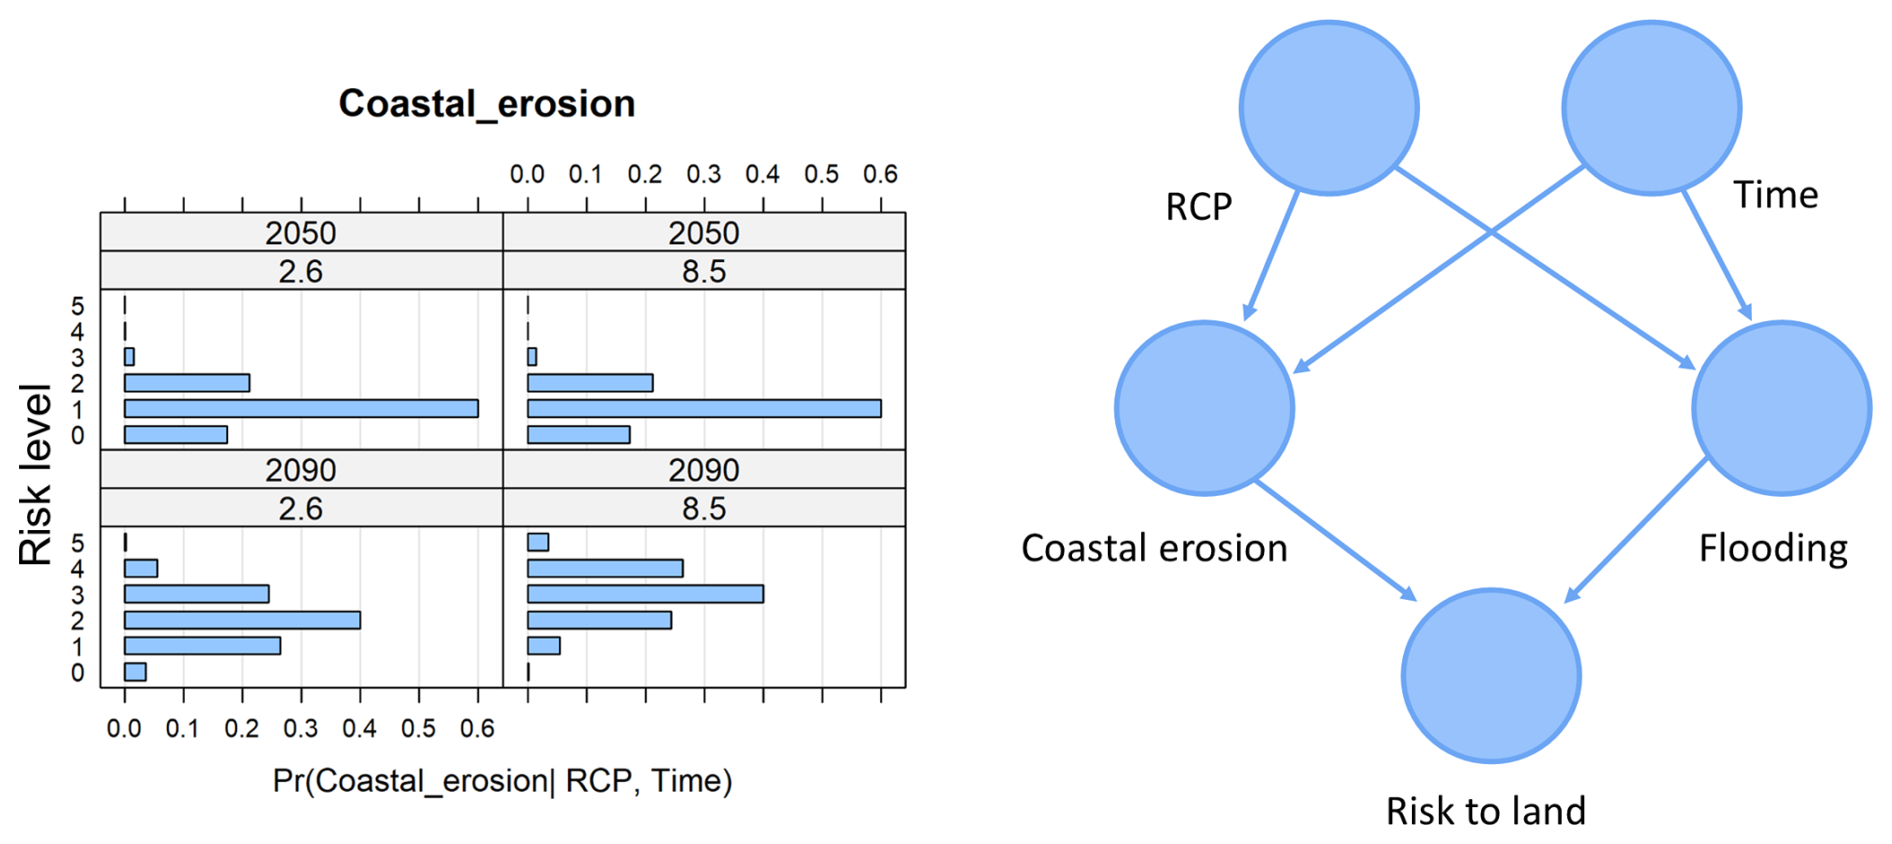
Figure 3Example of a BN structure composed of five nodes (right) and a CPT (left) containing the local conditional distribution of the variable Coastal erosion given its parents RCP and Time.
We focus on discrete BN, in which the product of the local probability distributions of each node results in the joint probability distribution function of all the variables X= { X1,…Xn in the graph Eq. (1):
Where pa(Xi) are the parent nodes of Xi (Pearl, 1988). In this equation, p(Xi|pa(Xi)) denotes the local conditional probability distribution of the variable Xi, given its parent nodes in the BN. The joint probability function links all the variables in the BN, therefore, any change can be propagated through the network. This means that the BN can be used in a forward mode where the changes are propagated from the child to parent nodes, but also in an inverse mode, from the parents to child nodes. This flexibility is very useful to explore multiple combinations of events.
Bayesian inference relies on Bayes' theorem to compute posterior probabilities. According to Bayes' theorem, the probability p of an event R given the evidence O is given by Eq. (2):
The first term of the numerator is the likelihood, which is the probability of seeing the evidence given the event. The second term is the prior probability, which is the probability of the event before the evidence. The denominator, known as the normalization factor, is the marginal probability of the evidence.
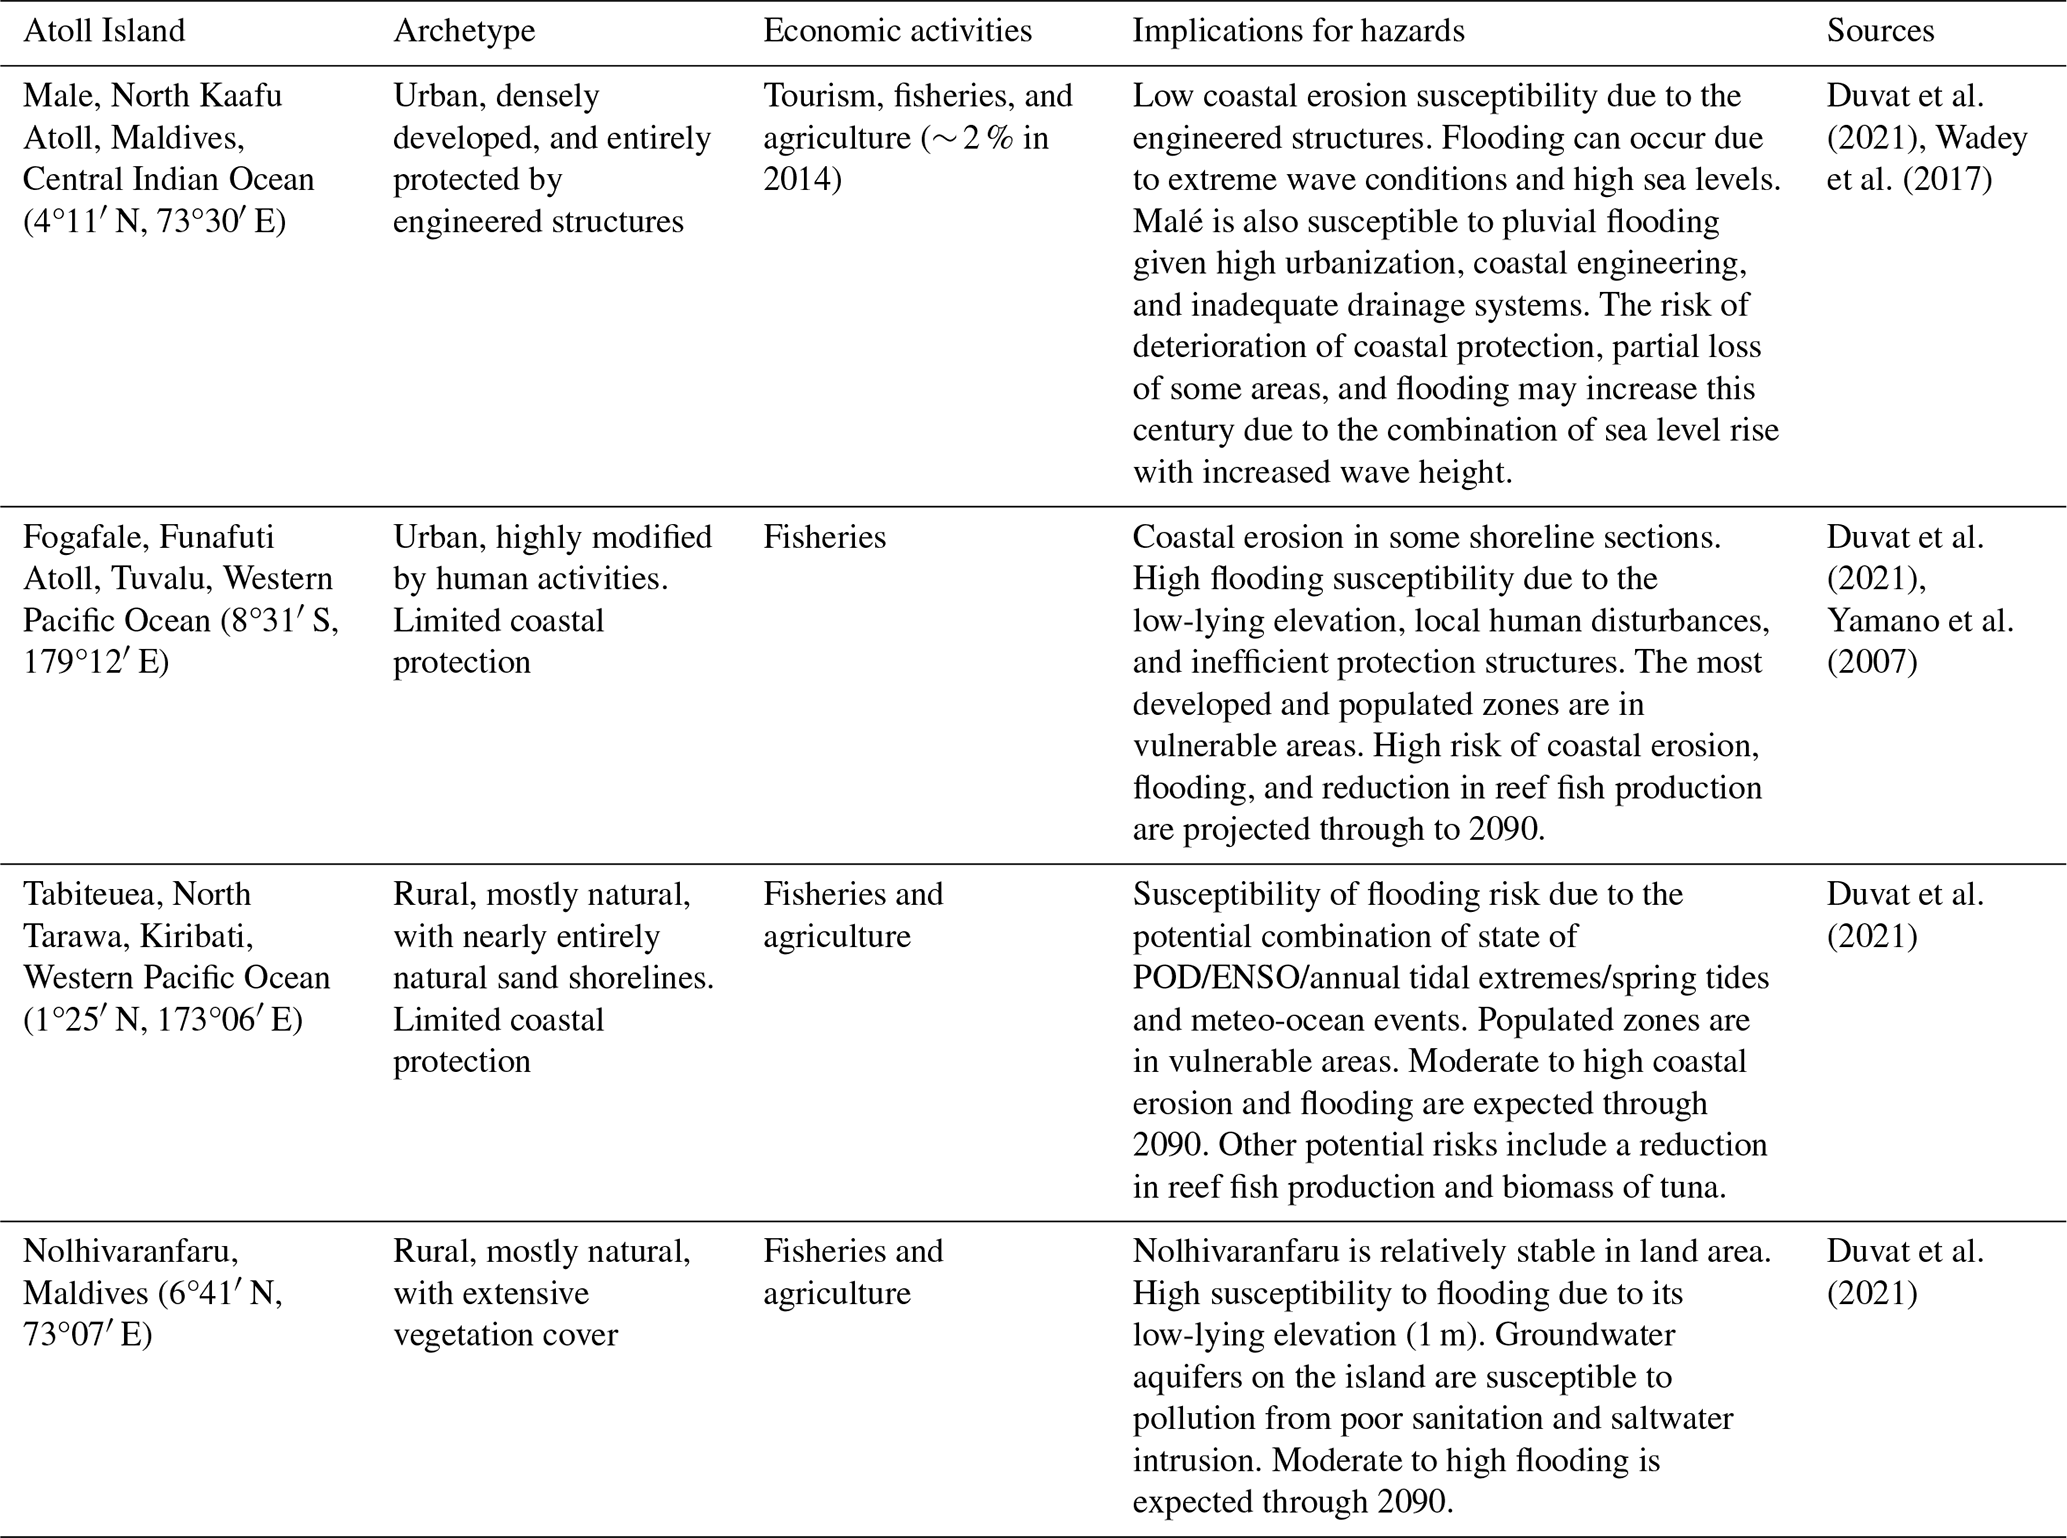
2.2 Study islands
Duvat et al. (2021) and the present study focused on four contrasting atoll islands of the Pacific and Indian Oceans (Fig. 1) Malé (Maldives), Fogafale (Tuvalu), Nolhivaranfaru (Maldives), and Tabiteuea (Kiribati). These islands were chosen to cover a contrasted range of geographical settings (Table 3). For example, they include the highly urbanized and densely populated island of Malé in the Maldives and the rural and mostly non-armored island of Tabiteuea in Kiribati.
The main climate change drivers affecting these islands include changes in atmospheric temperatures and rainfall patterns, sea-level rise, increasing sea surface temperature, coral bleaching, and ocean acidification. Other significant drivers are increased distant-source wave height, increased intensity of the most intense tropical cyclones and El Niño/La Niña events, and increased intensity and frequency of marine heat waves (Duvat et al., 2021).
2.3 Expert judgment and assessment database
Duvat et al. (2021) assessed the climate-related risk to future atoll habitability under two RCP scenarios. The assessment relied on a comprehensive literature review, available dataset analysis, and expert judgment. First, based on peer-reviewed scientific papers and recent IPCC reports, the authors identified five major Habitability Pillars (HPs): availability of sufficient land; supply of safe freshwater; supply of nutritious food from local and/or imported sources; access to safe settlements and infrastructure; and access to sustainable economic activities (Fig. 4). Then, they defined a set of Risk Criteria (RC) considered as the major factors contributing to the risk to Habitability Pillars in the study islands. For example, coastal erosion and flooding were identified as the main factors contributing to the risk to land.
After that, Duvat et al. (2021) scored from 1 to 5 each risk criterion based on the expected severity of additional climate risk under both RCP and time horizons. For example, if the risk of coastal erosion was expected to be low, the risk level was scored as 1. Conversely, if a low-lying island was expected to experience a high risk of flooding, the risk level was scored as 5. The authors provide a detailed rationale for each score in their supplement (Duvat et al., 2021). The overall risk to habitability was calculated by aggregating the scores of risk criteria and habitability pillars. Six risk levels were considered: undetectable (corresponding to no additional climate risk in the future compared to today's risk level), very low, low, moderate, high, and very high (corresponding to very high additional risk in the future compared to today's risk level). Moreover, each risk level was associated with a confidence level (very low to very high) based on evidence and the level of agreement (see Duvat et al., 2021 for details on the method).
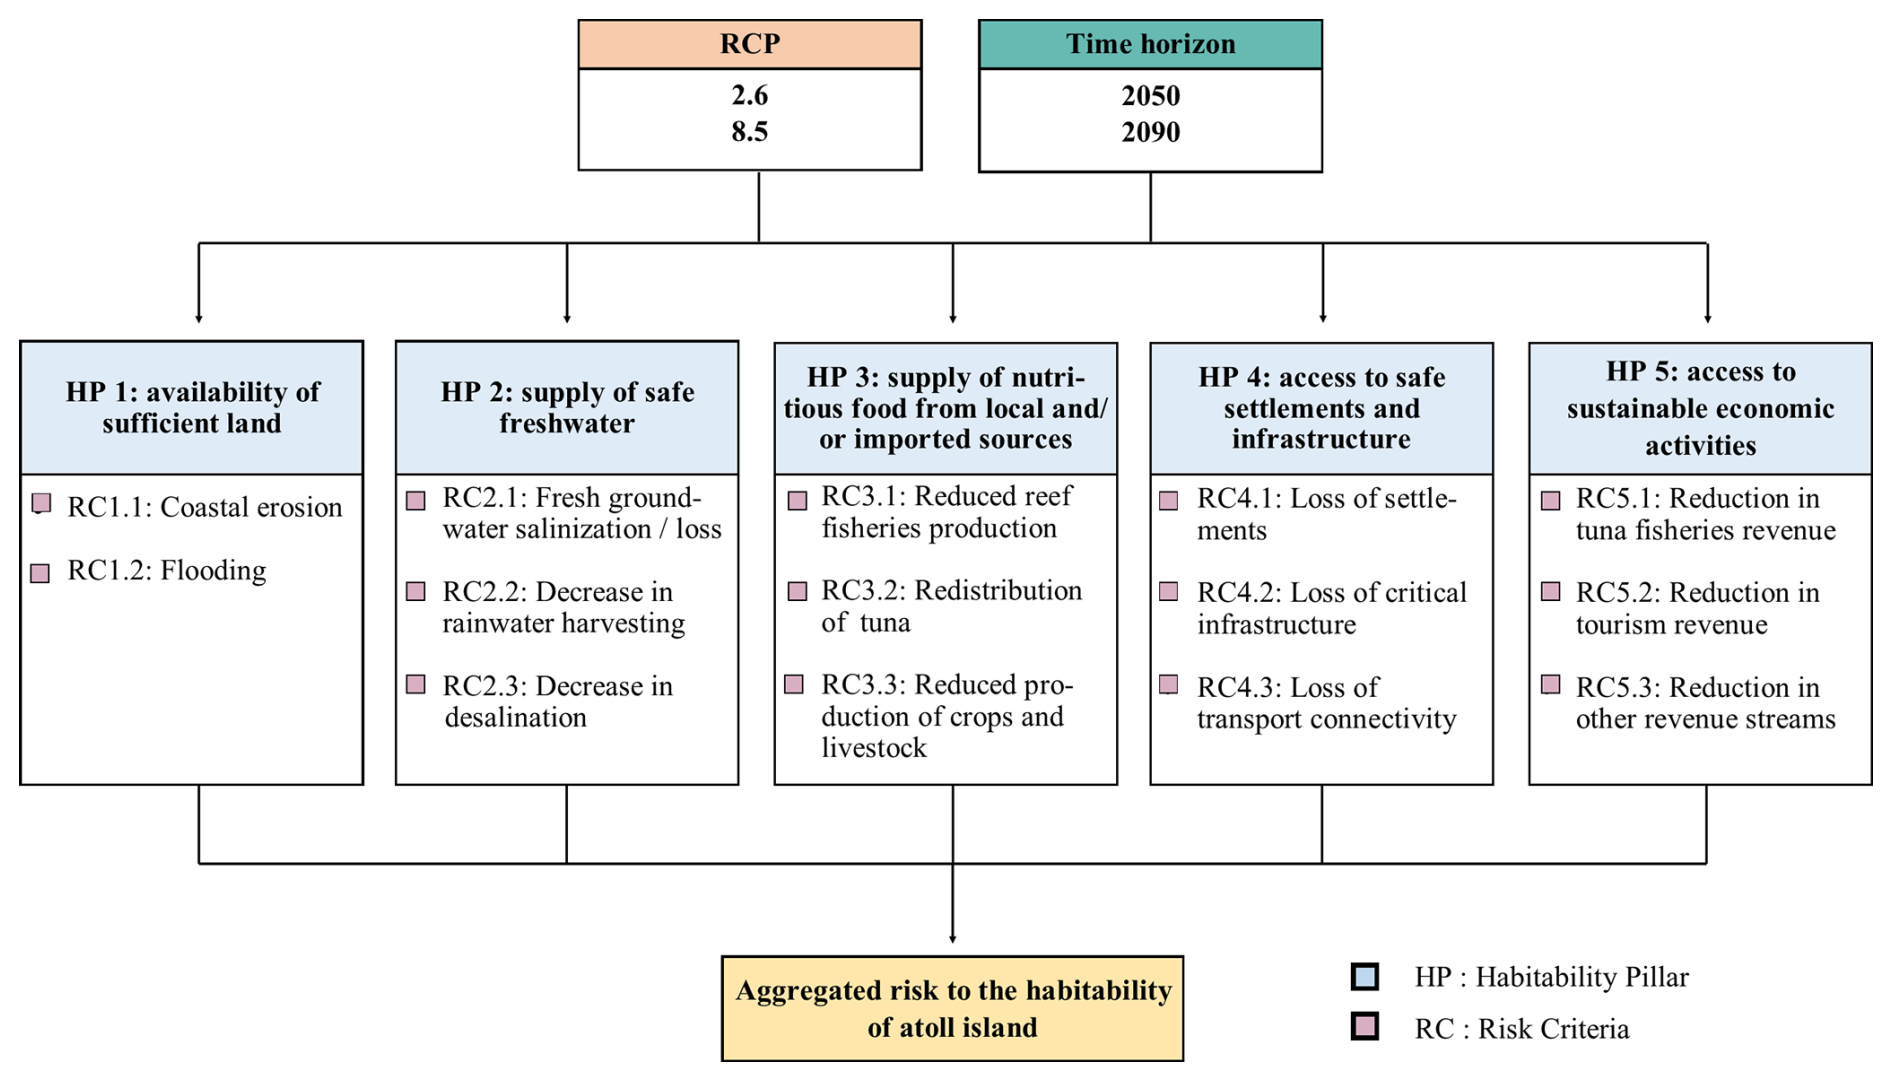
Figure 4Variables assessed by Duvat et al. (2021). The authors evaluated each Risk criterion based on the estimation of additional climate risk compared to today's risk level for the two RCP scenarios and time horizons. The risk for each habitability pillar results from the aggregation of risk criteria scores. The overall risk to island habitability results from the aggregation of the scores obtained for the five habitability pillars.
In this work, we use the risk assessment database, including the scores and confidence levels, as input data for the BN model. Data pre-processing is detailed in the following sections.
2.4 BN development
2.4.1 Network structure
The network structure (Fig. 5) is based on the conceptual model of atoll island habitability from Duvat et al. (2021). It is a simplified representation of the relationships between the main factors contributing to risk to habitability in atolls. It comprises two parent nodes representing the RCP scenarios and the time horizons, influencing the thirteen Risk Criteria (RC). The RCs are linked to their corresponding Habitability Pillar (HP) and the five pillars are associated with the risk to island habitability. The BN structure is the same for all islands.
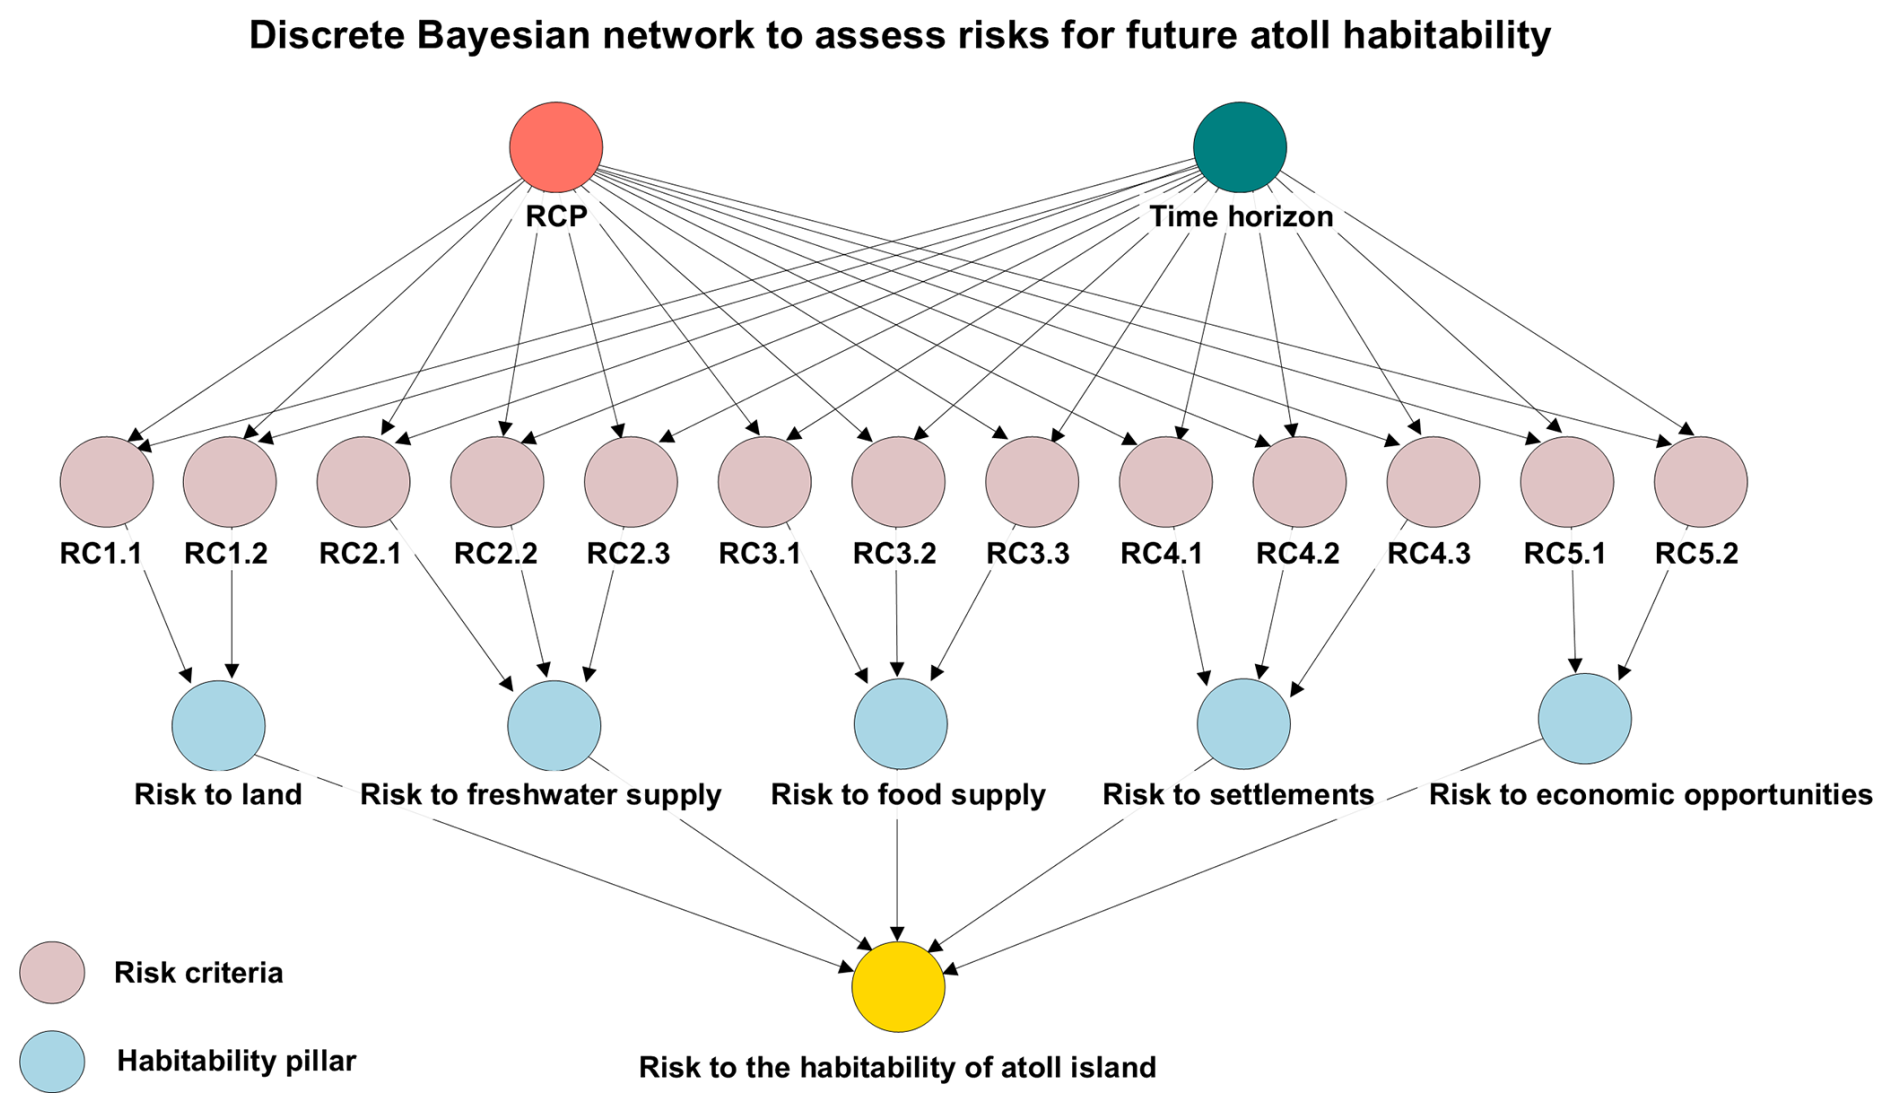
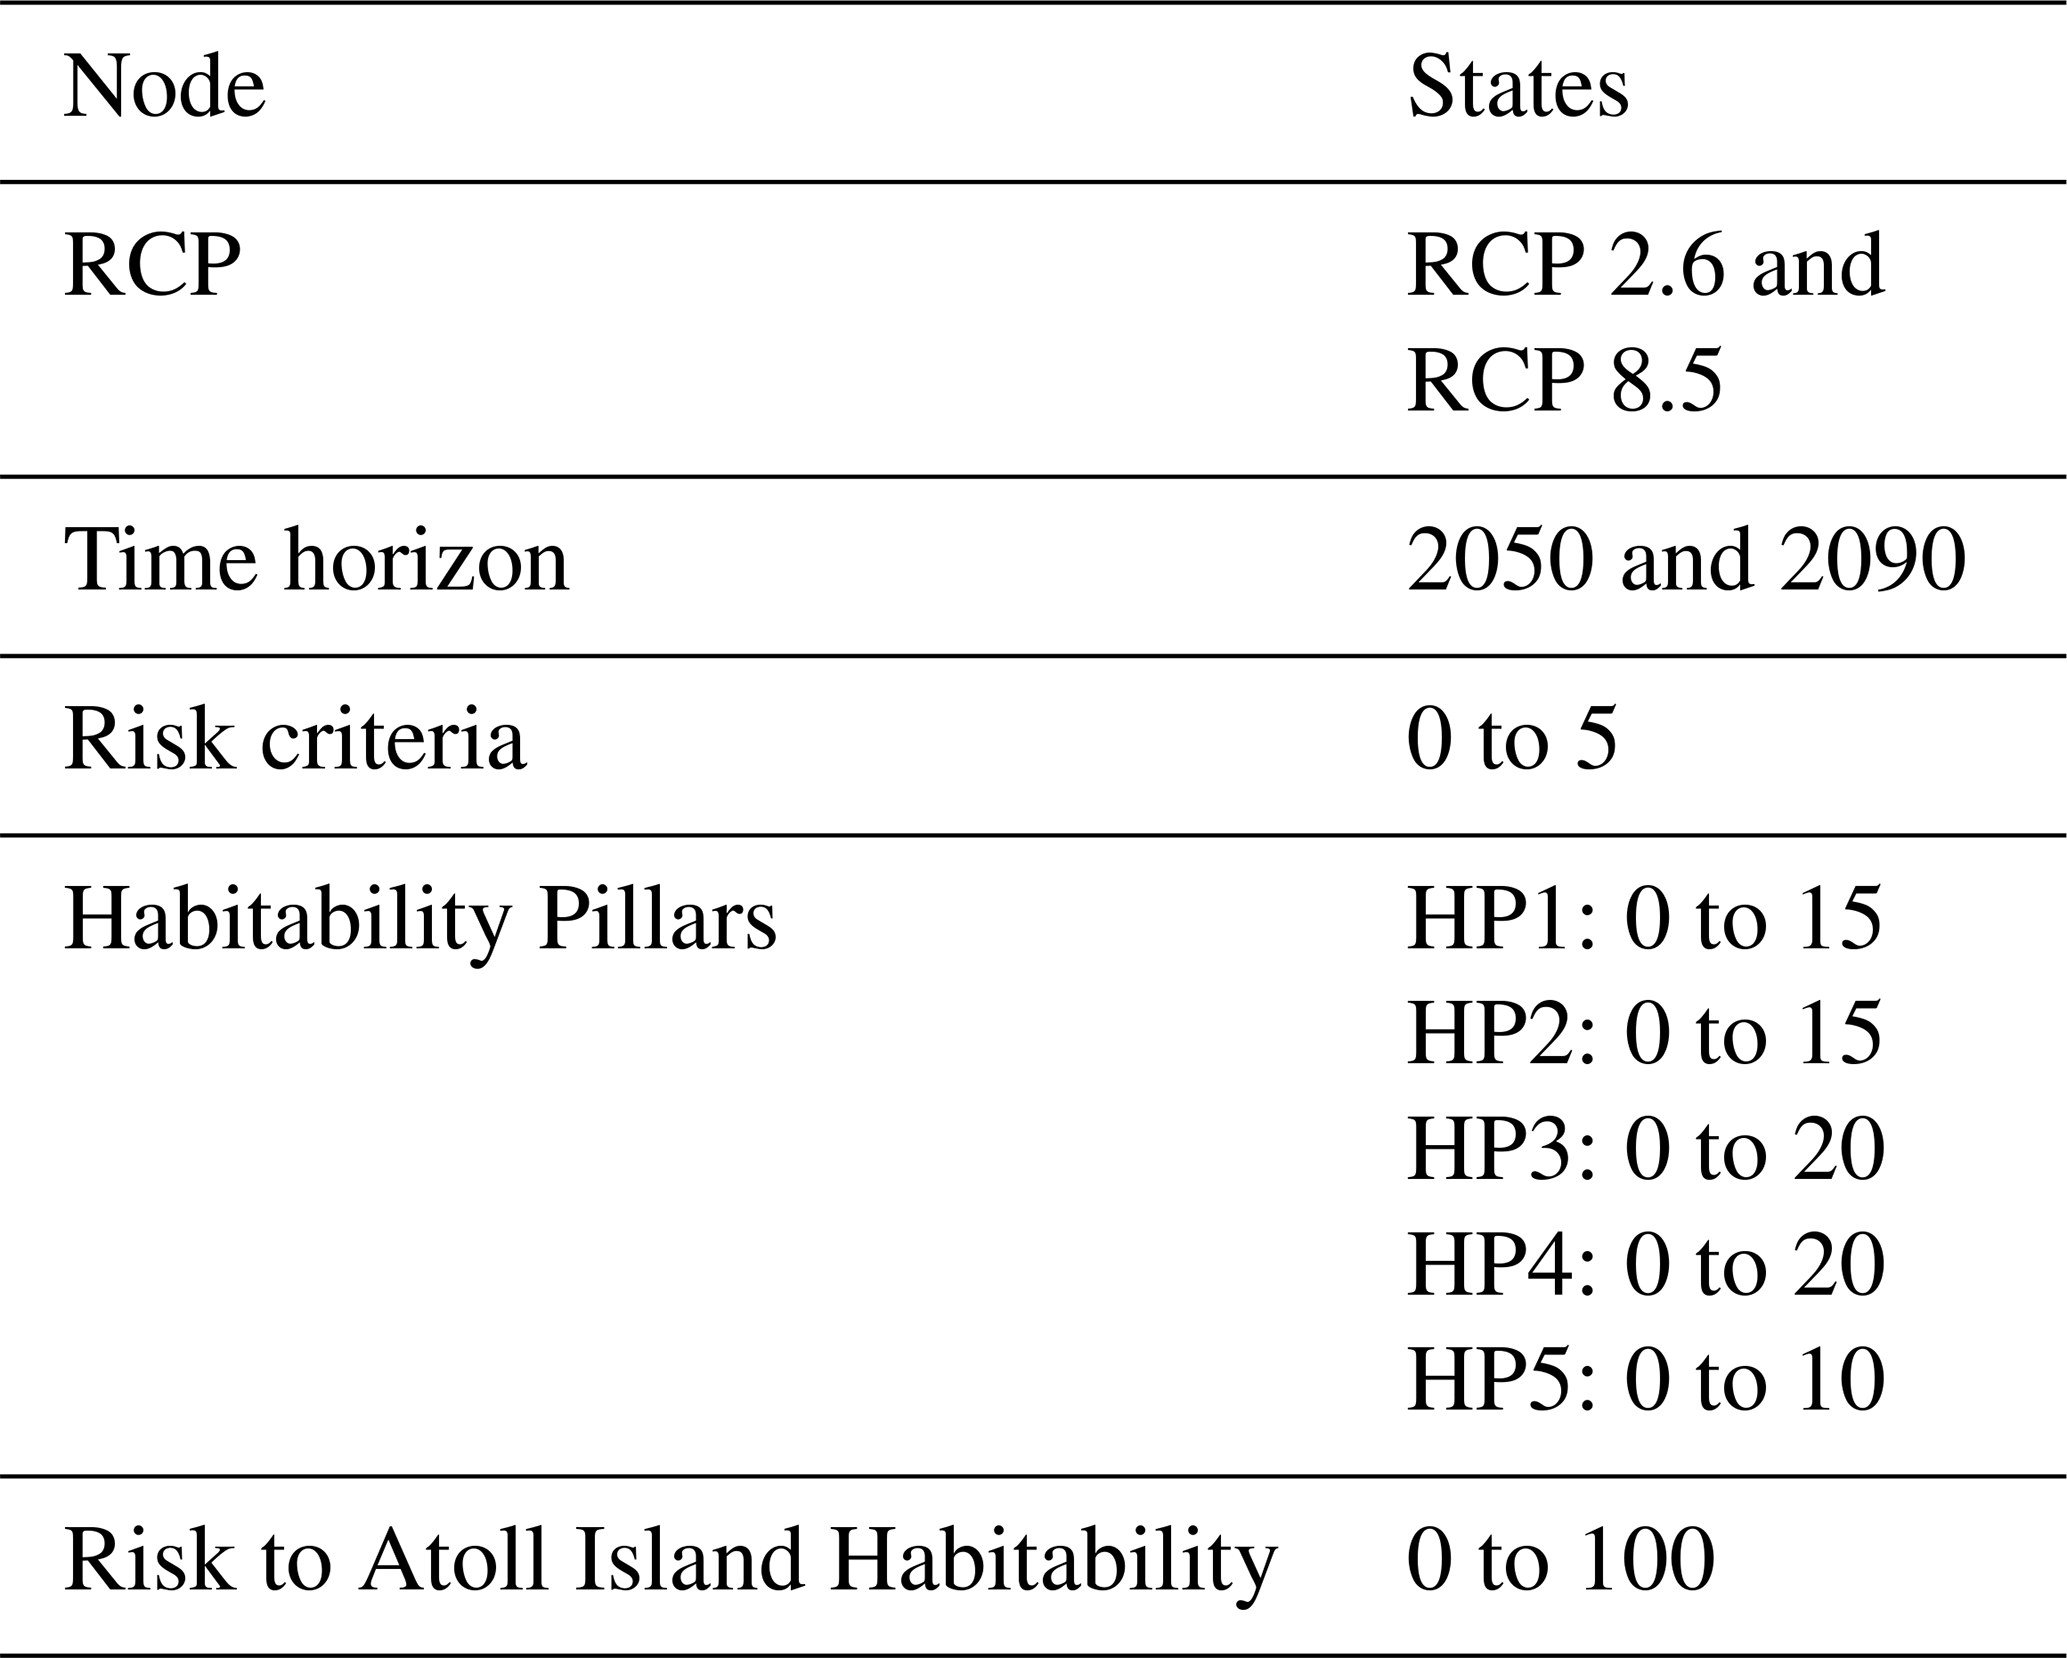
Table 4Variables in the BN model and the discretization applied to each node. The states of the nodes correspond to the aggregation of risk levels.
2.4.2 Conditional probability tables
We populated the conditional probability tables with the risk levels and associated confidence levels provided by the experts. To do this, we translated the expert judgments into conditional probabilities using Beta distributions. We selected the Beta distribution (Ferrari and Cribari-Neto, 2004) due to its flexibility, as its possible shapes cover a range of possibilities that span all potential cases that we considered in this study (Fig. 6). Specifically, we anticipate the mode of the distribution to correspond to the primary score provided by Duvat et al. (2021), with other scores associated with probabilities that decrease as they diverge from the main score. Additionally, as the confidence in the assessment decreases, we expect the probability distribution to become flatter. The Beta distribution effectively captures these characteristics, as illustrated in Fig. 6. To represent the maximum confidence level (5) we used a Dirac distribution to put all the probability on the assessed risk level.
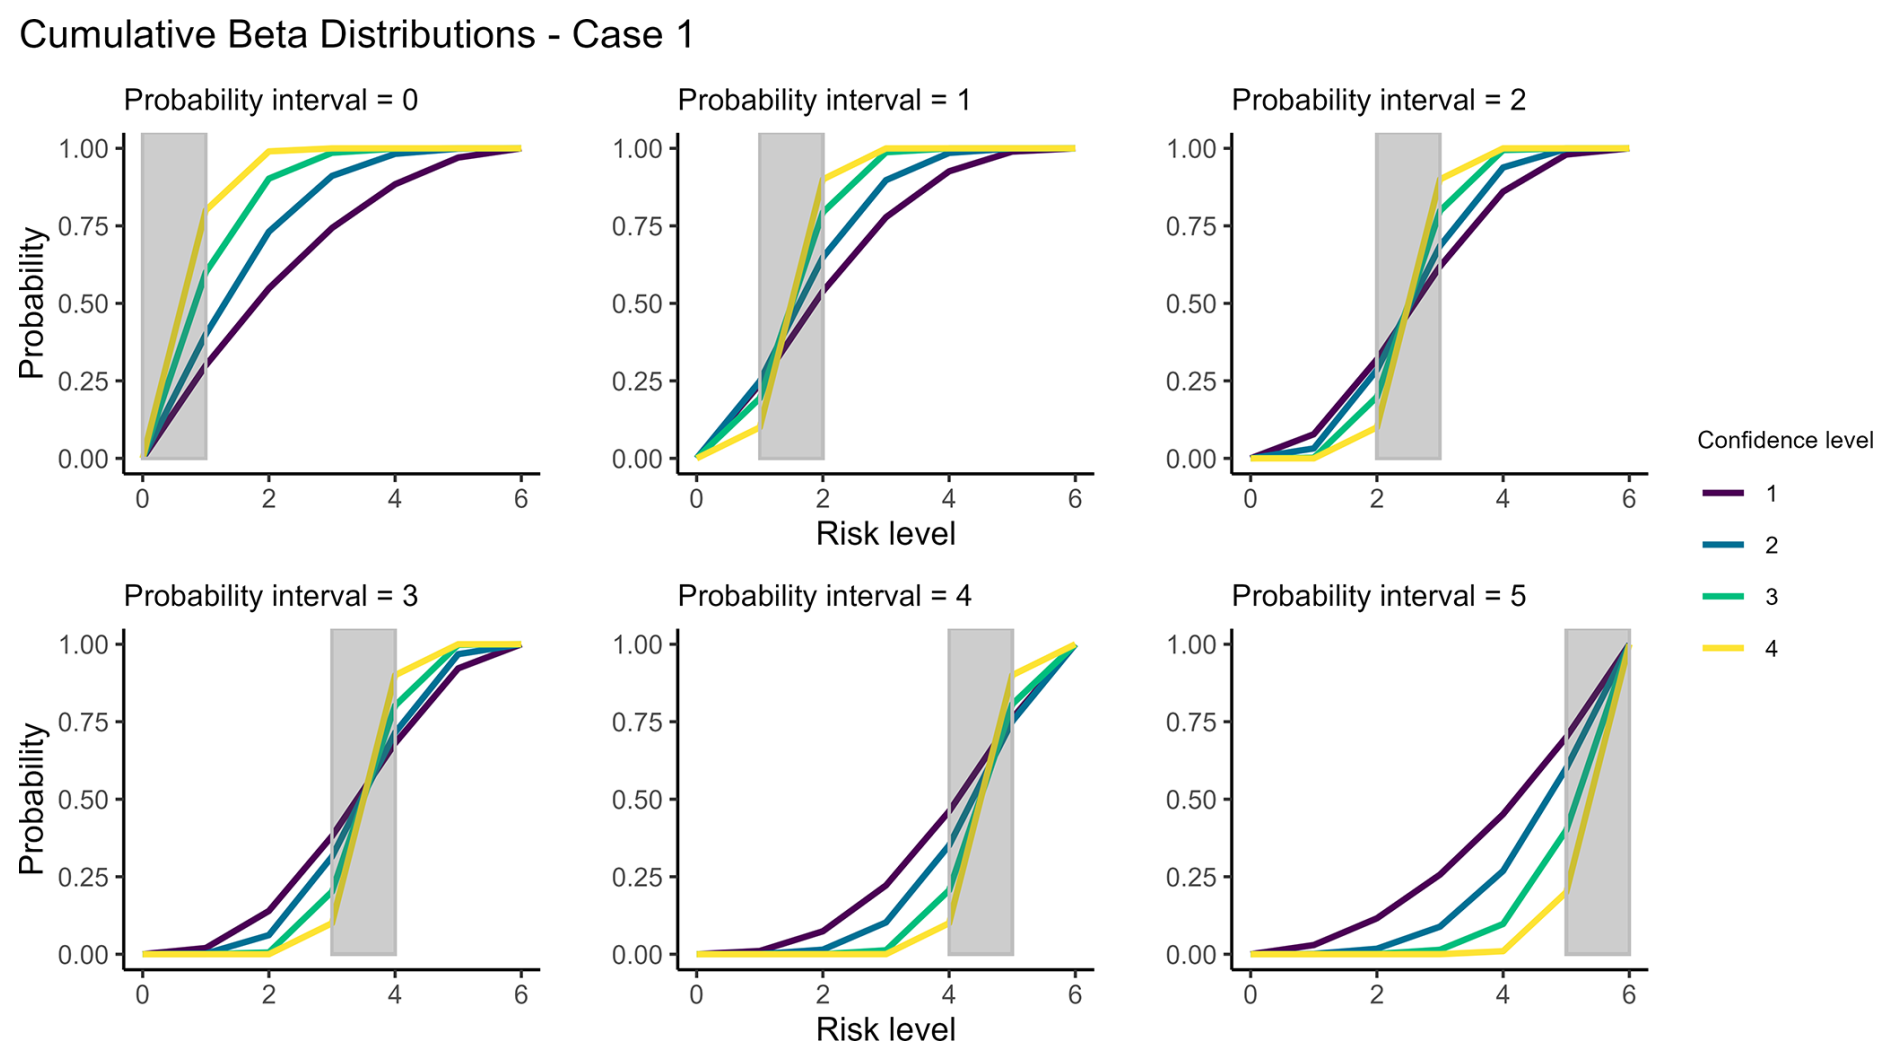
Figure 6Cumulative Beta distributions generated for each combination of risk and confidence levels. These distributions reflect the uncertainty in the expert risk assessment. A wider spread in the distribution indicates a lower confidence level. We used these distributions to populate the conditional probability tables. The support of the distribution was divided into 6 intervals, one for each risk level. The shaded area indicates the probability corresponding to each risk level.
The selection of a particular distribution involves some subjectivity. To evaluate the impact of this subjectivity on our results, we supplemented our primary set of distributions with an alternative set that provides a more conservative interpretation of the weights. This secondary set was used to conduct a sensitivity analysis, the results of which are discussed in the discussion section. More details about the conversion of the scores and confidence levels into probabilities are provided in the Supplement (Sect. S1.2).
We populated the conditional probabilities tables associated with the Habitability Pillars and the Risk to the Habitability nodes in a deterministic way. We associated a probability of one with the aggregated risk level and a probability of zero with the other levels. This approach allows us to remain consistent with the expert assessment and reduces computation time when making inferences.
2.4.3 BN model validation
We populated the BN model using expert knowledge and the assessment database from Duvat et al. (2021). We verified that the model structure, discretization of variables, and parametrization were consistent with expert knowledge and existing literature on atoll socio-ecosystems. To validate the model behaviour, we compared the most likely risk levels estimated by both the sub-networks and the entire network with the risk levels assessed by experts. This validation step confirmed that the BN model correctly reflects the expert-based evaluations. The validation process could be improved by integrating quantitative data such as measurements or numerical modeling results.
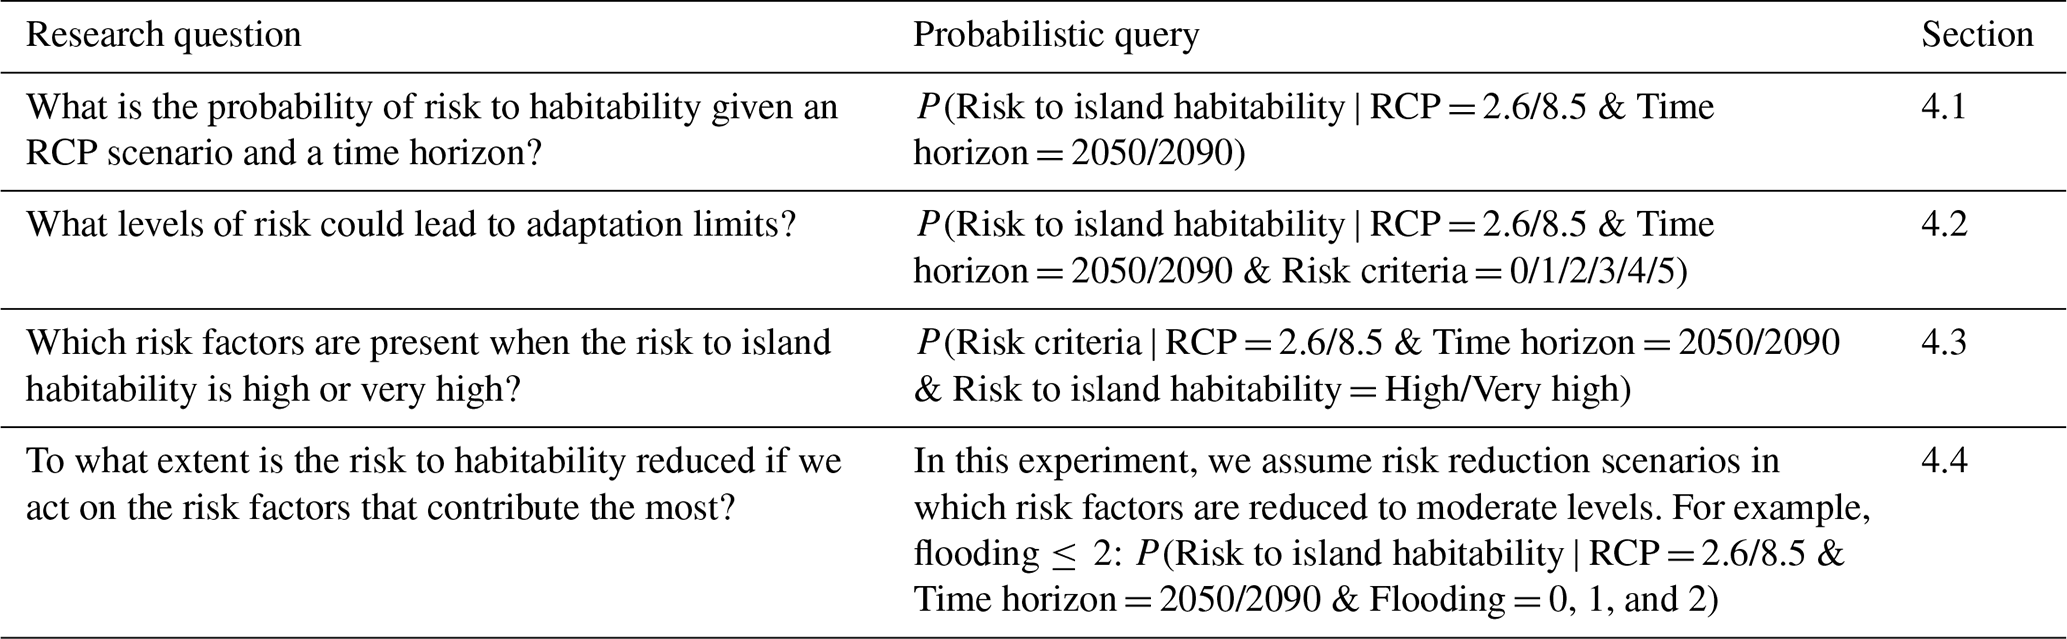
One of the main advantages of BNs is the possibility to interrogate the model in multiple ways and directions. The questions asked to the BN model are called probabilistic queries. These queries allow us to investigate multiple “what if” scenarios. To do this, we assume prior information and compute the probabilities of the variable of interest. Queries can be made in a direct way, this is, from the parent to the child, or in inverse mode, from the child node to the parent node. In this work, we focused on risk assessment, evaluation of risk criteria contribution, adaptation effectiveness, and identification of thresholds. We translated our research questions into probabilistic queries as shown in Table 5.
Table 5Research questions and their translation into probability queries.
We used the cpquery function from the bnlearn package (Scutari, 2010) to perform the queries. The inference algorithm used was the likelihood weighting method. We chose this method because it better handles low probabilities.
4.1 Risk assessment and validation
In this experiment, we interrogated the BN model about the probability of risk to island habitability given an RCP scenario and a time horizon. Figure 7 shows the probability of risk to habitability under the RCP 2.6 and 8.5 scenarios in 2050 and 2090 for the four islands. In 2050, the risk to habitability is similar in Malé, Tabiteuea, and Nolhivaranfaru. The probability distribution is slightly shifted toward higher levels for RCP 8.5 compared to RCP 2.6, the risk is low to moderate in both scenarios. On the other hand, the risk to habitability is higher for Fogafale compared to other islands, the most likely outcome being moderate risk levels. The contrast between RCP 2.6 and 8.5 is also more marked than in Malé and Tabiteuea. In 2090, the risk to habitability shows more contrast between the two RCP scenarios. In the RCP 2.6 scenario, Malé, Tabiteuea, and Nolhivaranfaru are expected to experience low to moderate risk, and Fogafale is likely to experience moderate to high risk. Under the RCP 8.5 scenario, all islands may experience moderate to high-risk levels.
As expected, these results are consistent with the aggregated risk to island habitability from Duvat et al. (2021) (yellow line), though small differences can be observed. These differences are due to the fact that the aggregated risk in Duvat et al. (2021) results from the combination of their best estimates and does not incorporate confidence levels. Conversely, our approach interprets confidence levels as probability distributions around these best estimates. As shown in Fig. 6, these distributions can be skewed, resulting in slight shifts in the aggregated risk levels. Figure 7 shows that these differences are small, and arguably smaller than the uncertainties resulting from the expert judgment itself. The results include a density curve to smooth the peaks in the histograms. These peaks may be due to deterministic relationships. We populated specific conditional probability tables in a deterministic way, associating a probability of one with the aggregated risk level and a probability of zero with the other levels. The combinations matching the aggregated risk will have a higher probability resulting in peaks in the distribution.
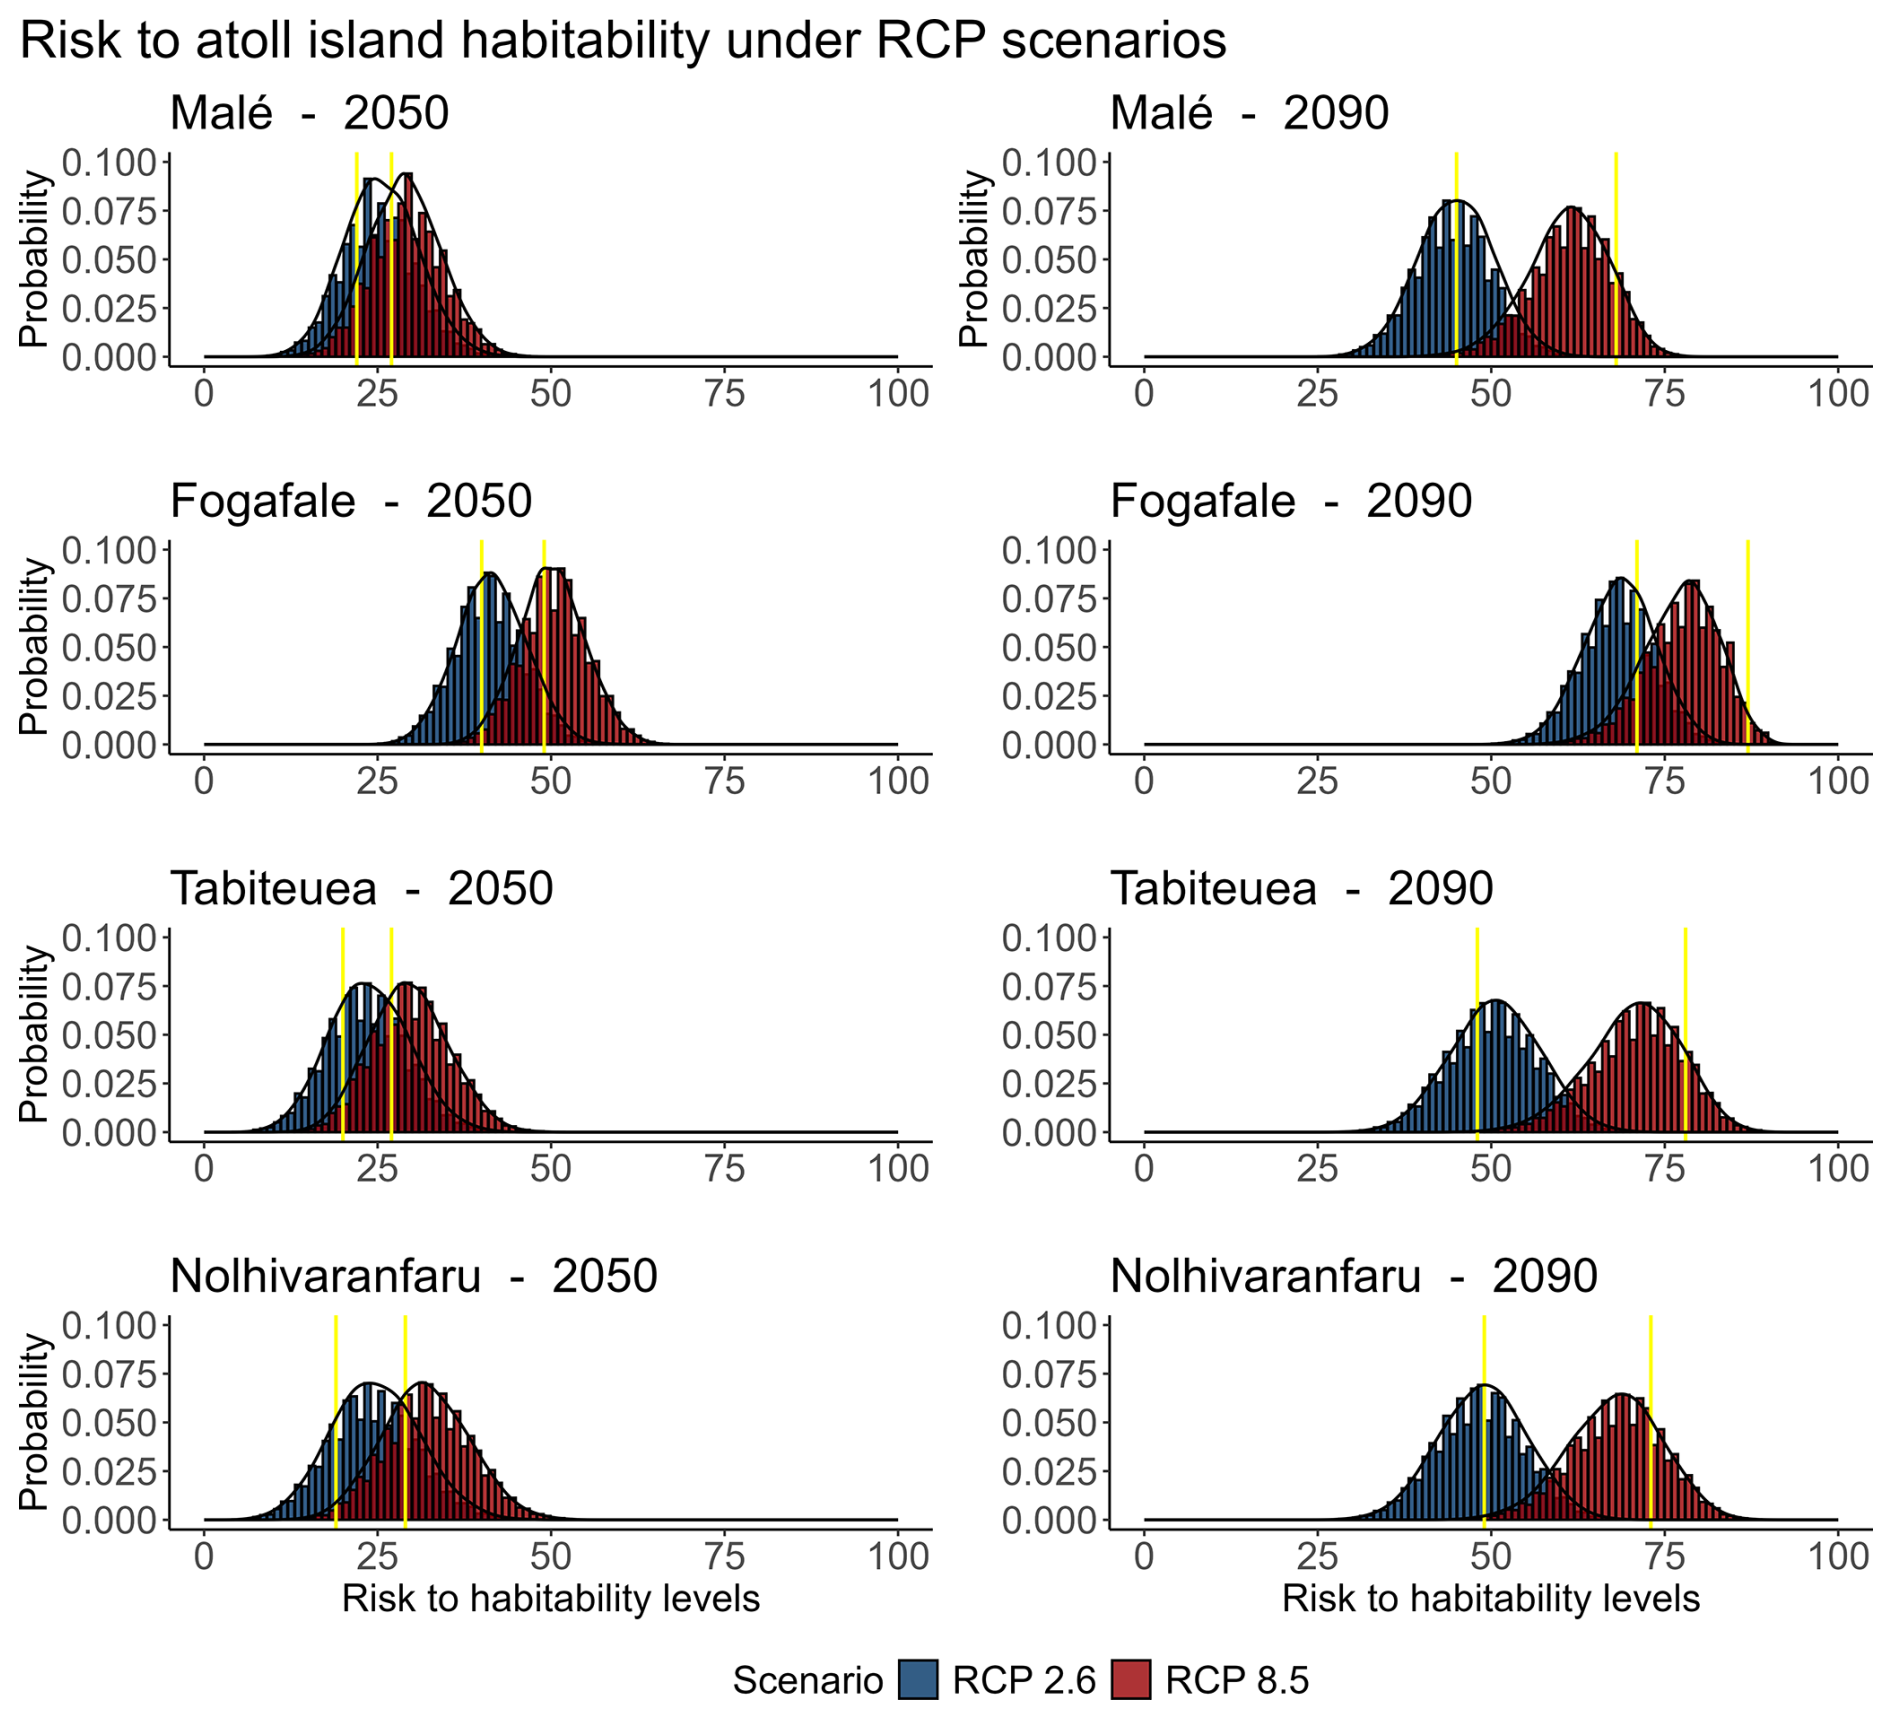
Figure 7Posterior probability distributions for the RCP 2.6 and 8.5 scenarios in 2050 and 2090 for each island. The yellow line represents the aggregated risk to habitability assessed by Duvat et al. (2021). The black curve is a smoothed version of the histograms.
4.2 Identifying critical thresholds
This experiment aims to identify which risk levels could lead to adaptation limits in some islands. Adaptation limits are defined as “the point at which an actor's objectives (or systems needs) cannot be secured from intolerable risks through adaptive actions” (IPCC, 2022). These limits are related to the purple zone on burning embers diagrams, which show the changes in risk to humans and ecosystems as a function of global mean temperature (Zommers et al., 2020). The purple zone in these diagrams indicates a very high risk that can cause irreversible impacts and exceedance of adaptation limits. The burning embers diagrams have four risk categories: undetectable, low, moderate, and very high. In this work, we used the six risk categories defined by Duvat et al. (2021) in which very high risk to habitability is > 80.
We explored the possibility for islands to reach adaptation limits thresholds. To do this, we interrogated the model about the probability of the risk to habitability under different risk criteria levels. Figure 8 illustrates the outcomes for Malé and Fogafale under RCP 8.5 in 2090. In Malé, the results suggest that no risk criteria level could lead to exceeding the adaptation limits threshold (purple line). Conversely, in Fogafale, severe risk criteria (levels 4 or 5) may lead to exceeding this threshold. Even at low risk criteria, the risk to habitability remains high. On this island, implementing adaptation measures that focus only on a specific risk reduction may not be sufficient.
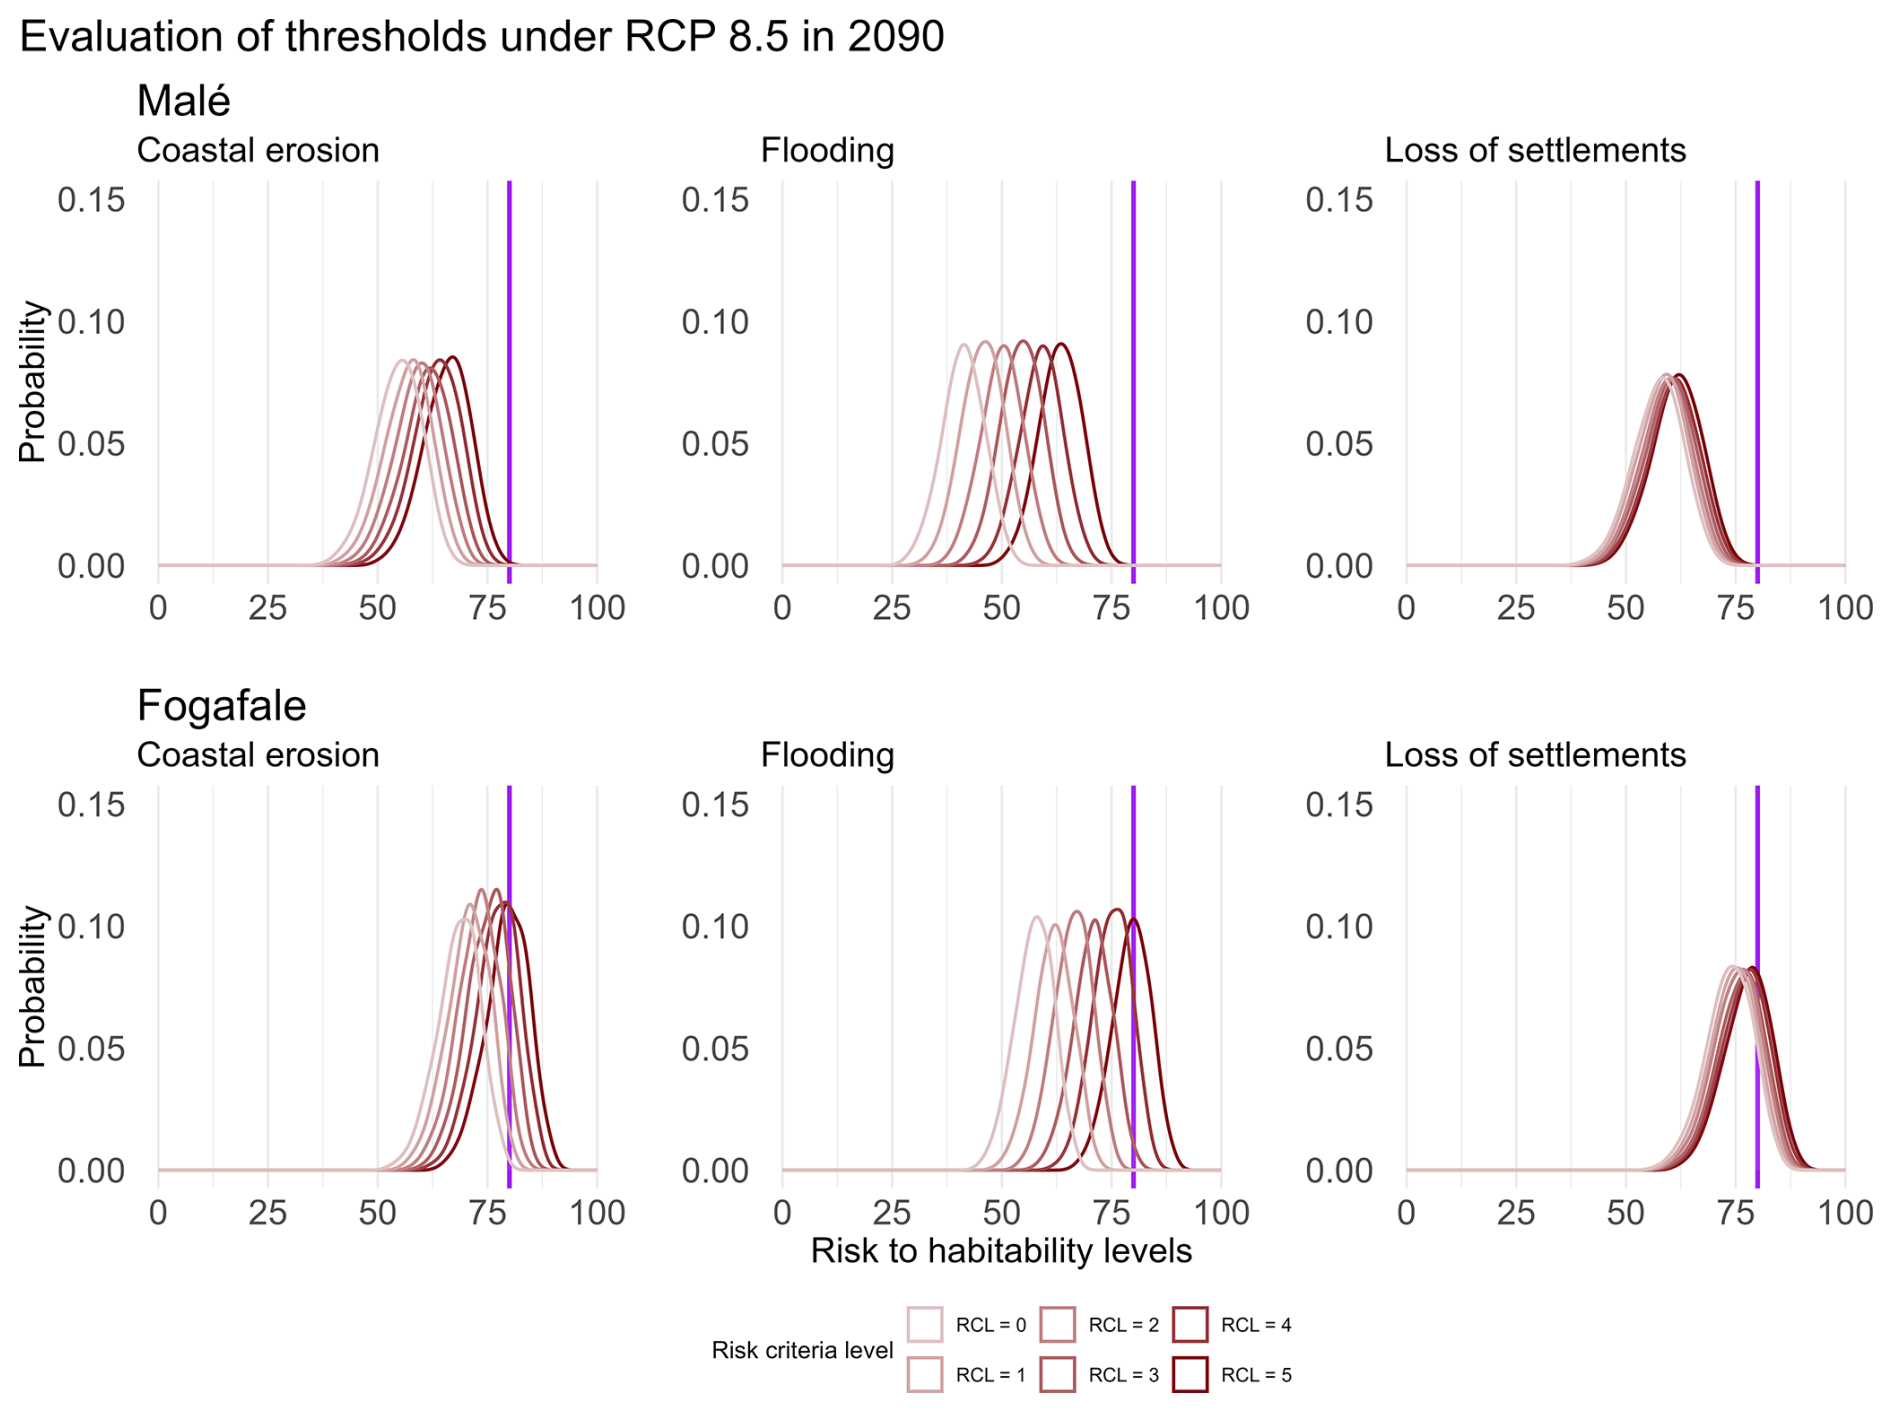
Figure 8Risk to Malé and Fogafale habitability under the RCP 8.5 in 2090. Each distribution represents the impact of different risk criteria levels. For example, for a flooding risk of 1, the query is written as P(Risk to habitability | RCP = 8.5 & Time = 2090 & Flooding = 1). In Malé, the adaptation limit (purple line) may not be exceeded under this scenario. In contrast, in Fogafale, severe risk criteria levels could lead to reaching adaptation limits.
This analysis also allows for identifying the risk criteria with the major contribution to the risk to habitability. This is reflected by the magnitude of the distribution shift. In Malé and Fogafale, variations on the risk level of loss of settlements generate a slight distribution shift and therefore a slight impact on habitability. In contrast, increments in the flooding risk level have a more important contribution. These outcomes could be useful to identify major drivers and target possible adaptation strategies. For example, for these islands, flooding appears as the factor with a major contribution to the risk to habitability. In these cases, flooding reduction measures could be privileged.
The results for the other atoll islands are presented in Sect. S2.1.
4.3 Identification of major drivers of risks
As mentioned in Sect. 4.2, a very high risk to habitability could be reached at specific risk criteria levels. In this section, we use the BN to perform inverse analysis. We explore the conditions that lead to a very high risk to habitability by calculating the probability of each risk criteria level when the risk to habitability is very high.
Figure 9 shows the results for Fogafale under RCP 8.5 scenario in 2090. The probability distributions with and without the constraint of very high risk to habitability are represented by red and gray bars respectively. Under a very high risk to habitability, the probability distributions shift towards levels 4 and 5, indicating a correlation with severe risk criteria. This is the case for multiple variables including decrease in rainwater harvesting and desalination, flooding, reduced fisheries production, and loss of settlements and transport connectivity. The variations between the distributions with and without the habitability constraint reflect the impact of the risk to habitability node on the risk criteria nodes and vice-versa. For example, when we constrain the risk to habitability to very high levels, there is a significant shift in the probability distribution of flooding. This reflects that a variation in habitability will significantly impact flooding and inversely, a variation in flooding will impact the risk to habitability.
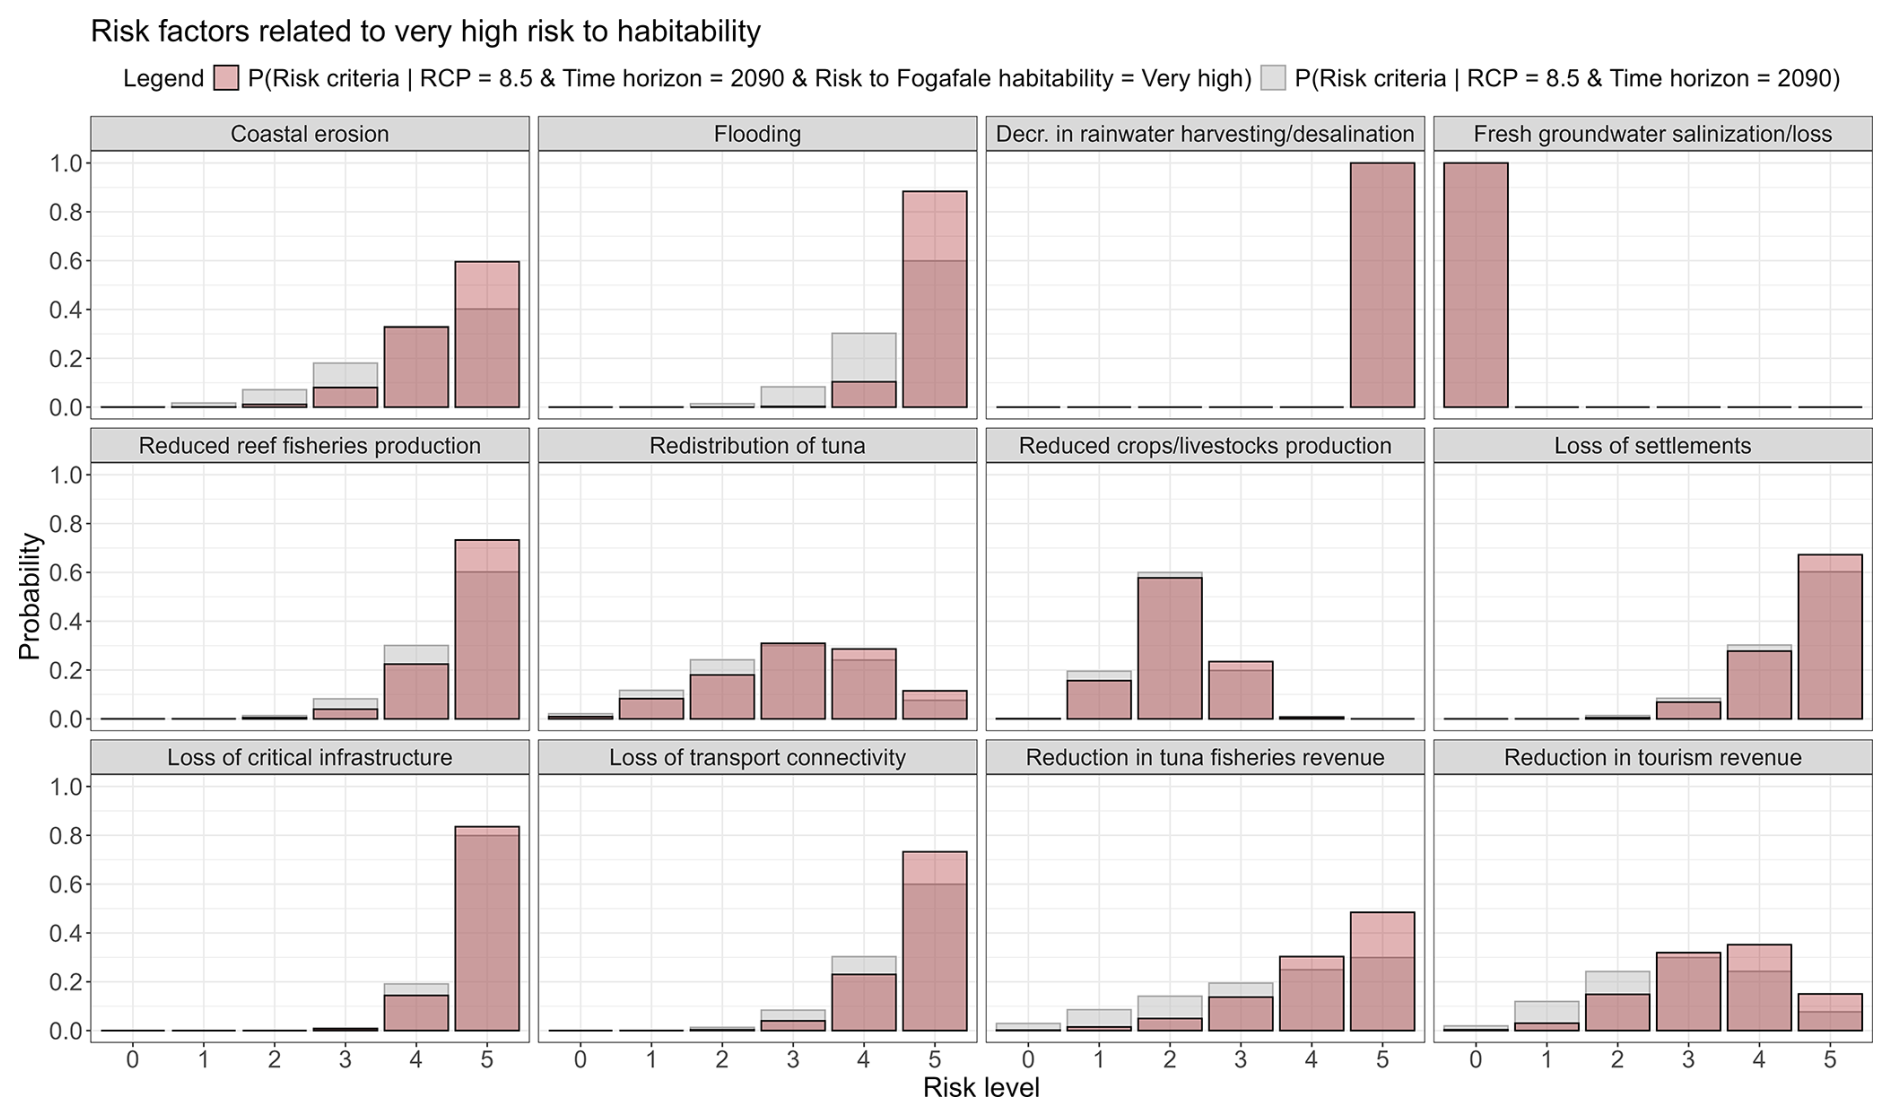
Figure 9Probability of risk criteria levels under the RCP 8.5 in 2090. The red bars represent the results when the risk to Fogafale habitability is very high (query: P(Risk criteria | RCP = 8.5 & Time horizon = 2090 & Risk to Fogafale habitability = Very high)). The grey bars represent the results without the habitability constraint (query: P(Risk criteria | RCP = 8.5 & Time horizon = 2090)). The results reflect which risk criteria are associated with high risk to Fogafale habitability. These include flooding, loss of critical infrastructure, reduced reef fisheries production and decrease in rainwater harvesting.
In all atoll islands, we observe the same correlation between high risk to habitability with severe risk criteria. These results are presented in Sect. S2.2.
4.4 Risk reduction scenarios
In this experiment, the objective is to assess how the risk to habitability decreases when the key risk factors are reduced, especially those previously identified as major contributors to risk to habitability. To explore this, we assume different risk reduction scenarios that could be achieved through adaptation, such as managed retreat and the implementation of measures to reduce flooding and coastal erosion. The impact of such reductions can be evaluated by calculating the probability of risk to habitability given a risk criterion level ≤ 2 under the RCP = 8.5 in 2090. In both islands, the results show that reducing flooding has a major impact on the risk to habitability Fig. 10. In Malé, reducing flooding to moderate levels could reduce the risk to habitability from high to moderate. These results suggest that an adaptation policy focused on reducing flood risk can already provide substantial benefits to preserve the habitability of Malé Island. Yet, focusing only on flood risk would not be sufficient in all contexts. For example, Fig. 10 shows that reducing multiple risks is necessary for Fogafale to keep the risk to habitability at a moderate level.
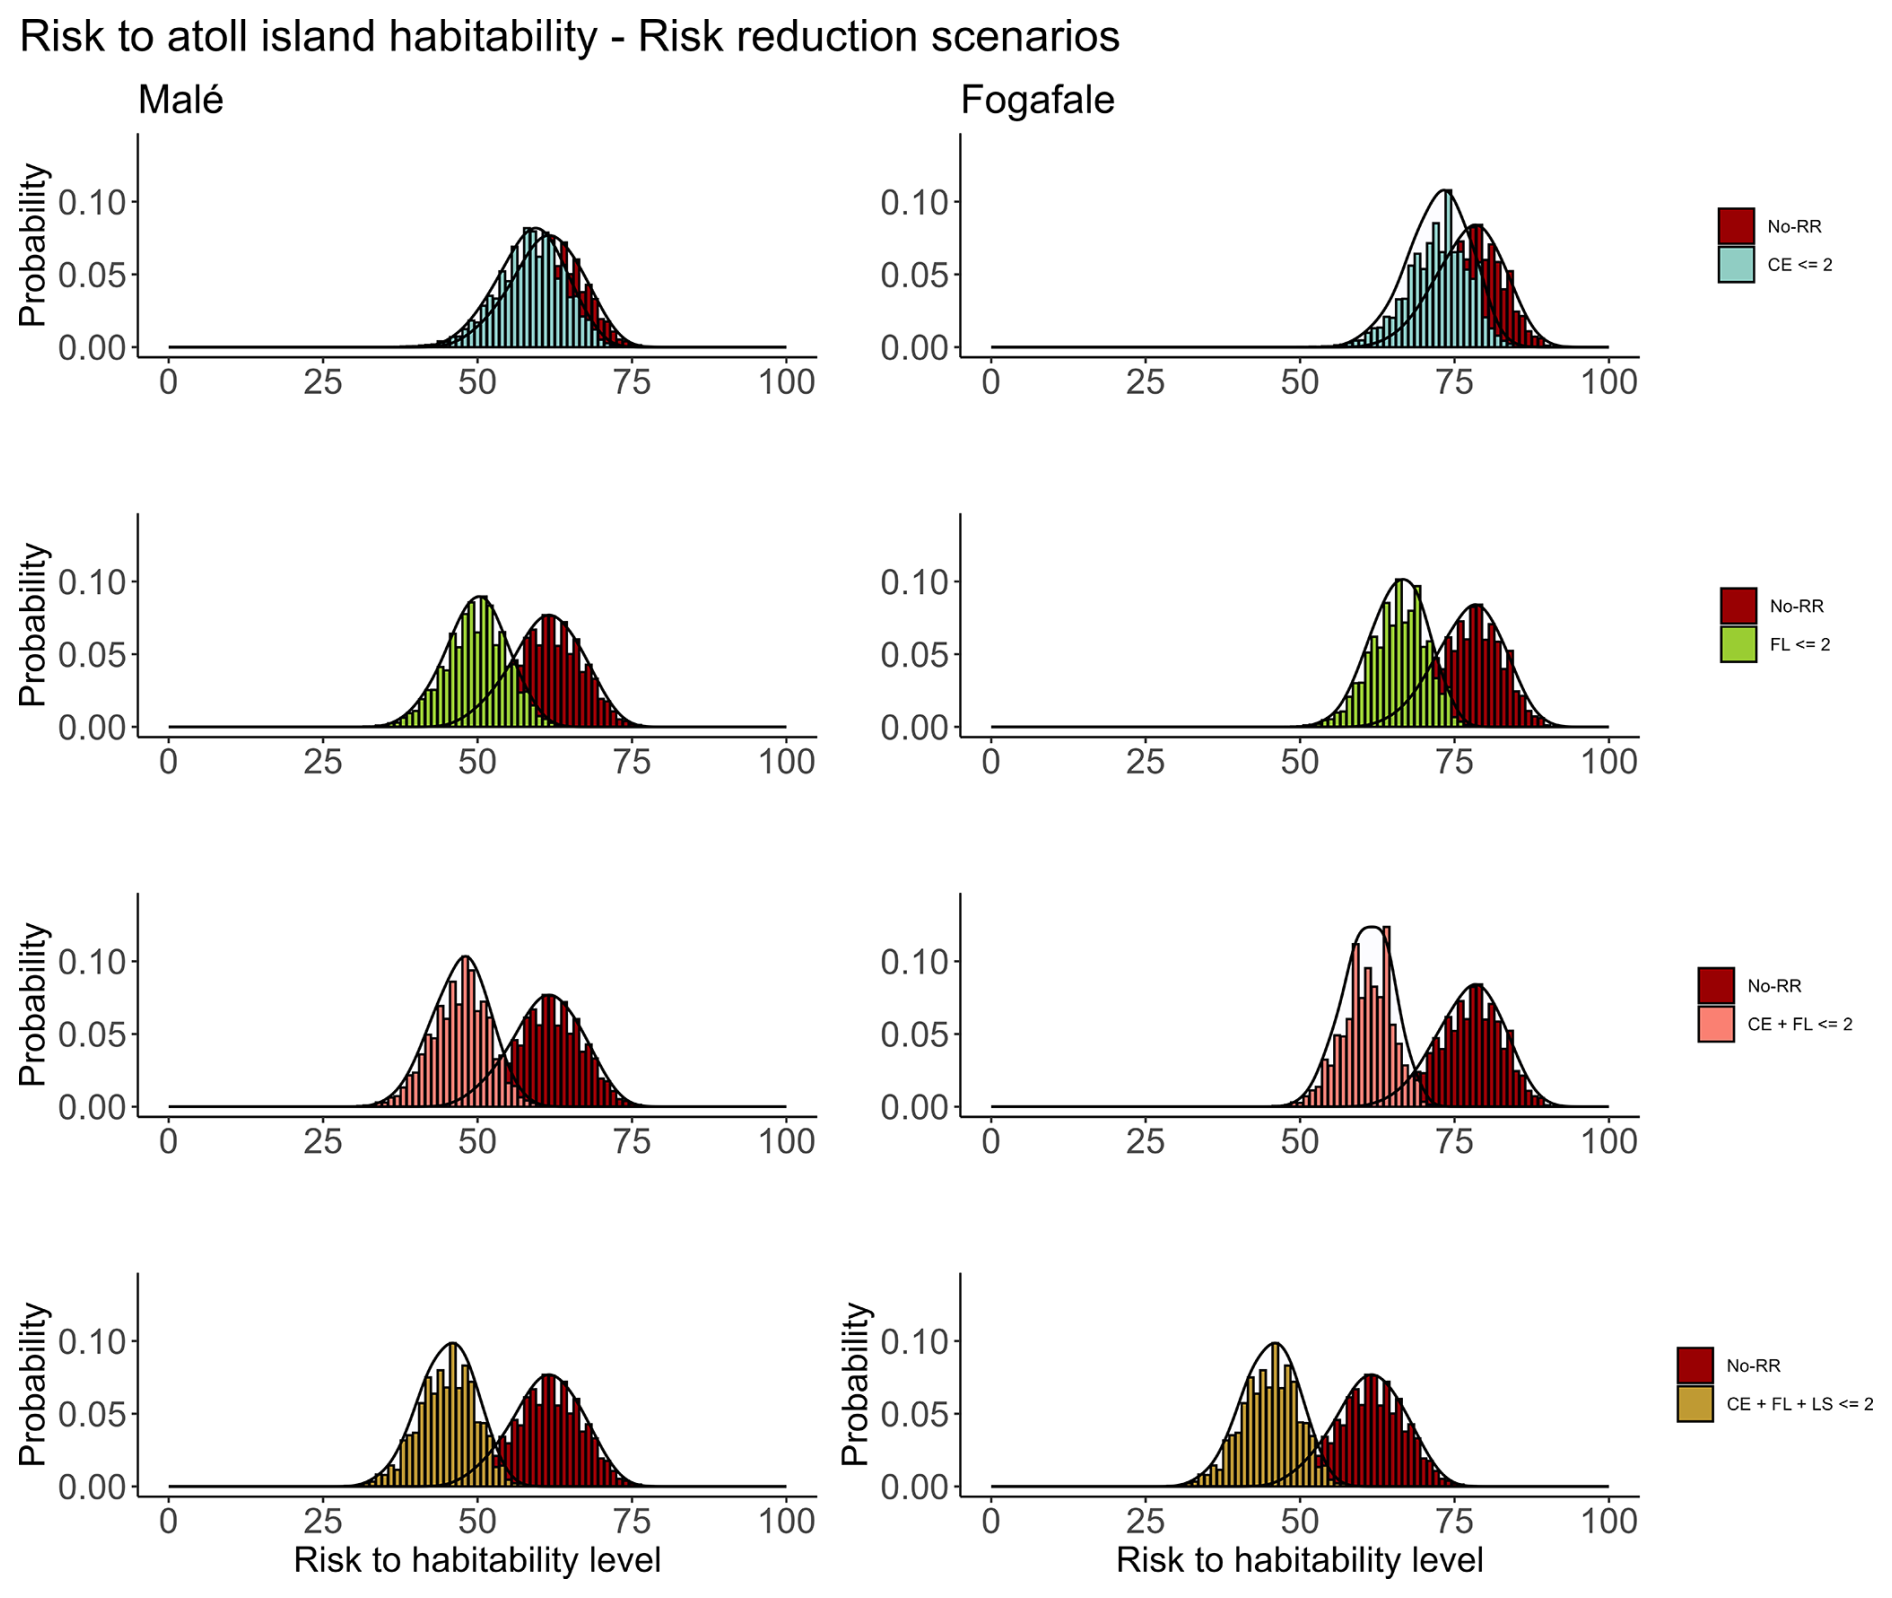
Figure 10Probability distributions of the risk to habitability under different risk reduction scenarios for RCP 8.5 in 2090 in Malé and Fogafale. The baseline scenario assumes no risk reduction (No-RR). The risk reduction scenarios considered in this analysis focus on reducing flooding (FL), coastal erosion (CE), and loss of settlements (LS). In both atoll islands, risk reduction efforts focused on flooding could significantly reduce the risk to habitability. In Malé, reducing flooding or coastal erosion could reduce the risk to habitability from a high to a moderate level. However, in Fogafale, the reduction of multiple risks is needed to reach a moderate risk to habitability.
The results for the other atoll islands are presented in Sect. S2.3.
The BN model was developed based on the conceptual model and expert risk assessment provided by Duvat et al. (2021). The model allowed for the integration of qualitative information and uncertainties associated with expert judgments (see Sect. S1.2). Expert judgments included various environmental, economic, physical, and climatic variables that we incorporated (explicitly or implicitly) into our BN model, allowing for integrated analysis. The BN allowed us to analyse multiple problems, including risk assessment, identification of major risk factors, evaluation of risk reduction scenarios, and identification of thresholds.
5.1 Risk to habitability assessment using the BN
BN allows us to derive a best estimate of the risk, but also to quantify the confidence by providing the 17th and 83rd percentile results (Fig. S9) interpreted as likely ranges (to refer to a probability of at least 66 %) according to the IPCC likelihood scale. By 2050, under RCP 2.6 and RCP 8.5 scenarios, the risk to habitability for Malé, Tabiteuea, and Nolhivaranfaru is likely to be low (Fig. 7). Conversely, in Fogafale, a higher risk is more likely. This is due to its very low elevation, limited coastal protection, and high exposure of habitats and critical infrastructures (Duvat et al., 2021). By 2090, the contrast between the RCP scenarios becomes more important. This is attributed to the divergence of climate projections during the second half of the 21st century, as well as the cumulative and cascading impacts of climate change (Duvat et al., 2021). Under the RCP 2.6 in 2090, the risk to habitability is likely to be low-to-moderate across all islands except Fogafale. In contrast, under the RCP 8.5, the risk to habitability is likely to increase from moderate to high or very high levels. In Malé, Duvat et al. (2021) attributed this increase to the expected increase of flooding and degradation of coastal protection. In rural islands, the expected high risk is associated with their high dependence on coastal ecosystem services for food (e.g., reef fish abundance), water supply (e.g., reduction of saltwater intrusion), land stabilization (e.g., sediment supply and wave impact reduction), and economic activities (e.g., tourism, fisheries, agriculture). Under the RCP 8.5, ecosystems are expected to decline due to the exceedance of critical thresholds, including the temperature threshold for tropical reef-building corals (Cooley et al., 2022), as well as regional bleaching thresholds. According to Duvat et al. (2021), risk to habitability is expected to be higher in rural islands due to their limited capacity to manage climate-related impacts through the implementation of coastal adaptation, technology, and imports, compared to urban islands.
5.2 Complex queries within the BN
The BN method has the advantage of enabling users to make complex requests. Typically, these complex requests involve queries that assume specific priors and compute the probabilities using the BN in reverse mode. In other words, the use of BN here simplifies the investigation of “what if” scenarios. The identification of major risk factors presented in Sect. 4.3 is an example of such inverse analysis, which could be useful to target high-risk factors and thereby identify potential adaptation measures. Figure 9 shows that severe flooding and loss of settlements are highly correlated with a very high risk to habitability. We used this information to target risk reduction scenarios that could potentially be achieved through adaptation measures proposed in the experiment 4.4. This analysis also highlights that a high risk to habitability can arise from the interaction of multiple factors. Therefore, integrated risk assessments and multi-risk adaptation strategies are needed.
Finally, the risk reduction scenario analysis highlights the potential of BNs as decision-support tools, as suggested by multiple authors (Ferreira et al., 2019; Jäger et al., 2018; Rachid et al., 2021). Duvat et al. (2021) evaluated climate risk considering the current level of adaptation, classified as moderate. Examples of currently implemented measures are food imports and water desalination to counter local resources decline, and hard protection to reduce flooding and coastal erosion. In our BN analysis, we explored different risk reduction scenarios that could potentially be achieved through context-specific adaptation measures. Examples include accommodation, vertical adaptation, ecosystem-based measures, and hard protections (Mycoo et al., 2022). However, we did not assess the effectiveness or the practicalities of their local implementation. Instead, this risk reduction analysis could be useful to target potential adaptation options. In future work, a wider range of local parameters including the elevation of the atoll island, and exposure to extreme events could be considered in the context of a wider framework involving social perception, economic feasibility, co-benefits, and trade-offs.
5.3 Limitations
The presented method has limitations. The first one was the translation of expert judgments into probabilities. To do this, we selected specific beta distributions that best reflect the expert knowledge (best estimate and confidence level). We conducted several tests to select beta distributions dispersed enough to represent the expert knowledge without overfitting the model. However, the selection of a specific distribution introduces a degree of subjectivity (in addition to that related to the nature of the data). To evaluate the impact of our choices, we carried out a sensitivity test using an alternative set of beta distributions (detailed in the supplement). For this alternative set, we associated a higher weight to the confidence level. This is reflected by a higher probability associated with the risk level assessed by experts. For example, an assessed risk level associated with low confidence was represented by a probability of 30 % in the initial set, and a probability of 40 % in the alternative set. The sensitivity test shows slight differences between the two sets. The BN analysis using the alternative set of beta distributions results in less dispersed distributions and slightly different median values. However, we obtained the same risk categories in both cases, suggesting that the results are relatively robust against the probabilistic interpretation of expert judgments.
Other limitations are related to (1) the BN structure, (2) the discretization of the variables, and (3) inference methods. Regarding (1), we used a structure similar to that of Duvat et al. (2021), where the scores are essentially added to compute an aggregated risk level. Duvat et al. (2021) did not consider interactions between habitability pillars, and therefore, we did not include these interactions in the structure of our BN. The habitability pillar Risk to land has an impact on local freshwater and food land-based supply, settlements and infrastructure, and economic activities. Not considering these interactions could result in an underestimation of the risk to habitability. In future work, we will consider these relationships, but it must be considered that since BNs are based on direct acyclic graphs, their structure cannot explicitly account for positive or negative feedback. This can be a limitation in our approach if risk or adaptation problems with large positive or negative feedback are considered. Concerning (2), the discretization of continuous variables could be another source of uncertainty. Depending on the states of the variables, the discretization could lead to a loss of information (Rohmer, 2020). For example, the use of too large or too short categories may overlook subtle variations in the system, reducing the accuracy and relevance of the results. The use of hybrid BNs including continuous and discrete variables (Beuzen et al., 2018) could be helpful to minimize these uncertainties. Regarding (3), in our BN analysis, we used the likelihood weighting method for inference. This method has some limitations, including low precision for estimating low-probability scenarios (Scutari, 2010), which were not in the scope of this study. To improve computational efficiency, alternative sampling methods will be considered in future research work (Yuan and Druzdzel, 2006).
The objective of this work is to present a reproducible methodological framework to develop a Bayesian network model based on expert judgments. We used the model structure and expert knowledge of Duvat et al. (2021), who previously assessed the risk to habitability for 2050 and 2100 under two contrasting RCP scenarios for four atoll islands in the Indian and Pacific Oceans. We performed the same risk assessment using a BN model. Our objectives were to integrate uncertainties in the risk assessment and analyse the potential and limitations of this approach. The BN reflects the expert knowledge consistently and takes into account the associated uncertainty. The model allowed us to analyze “what-if” scenarios that could be useful to assess the impact of climate change and to identify potential risk reduction measures.
Bayesian networks are usually developed using data to define their structure and conditional probability tables. In cases when limited data is available, these models can be fully parameterized using expert knowledge. We demonstrate that when expert risk assessments are available, they can serve as a basis for BNs. Our work gathers the detailed risk assessment and meaningful relationships between variables provided by the experts with the uncertainties integration and analysis of multiple scenarios offered by BNs. Further work will address the limitations of this approach, including the BN structure, the discretization of variables, and inference methods. However, this first attempt highlights the potential of BNs as a complementary tool for integrated risk evaluation in small islands and potentially in other adaptation problems involving complex socio-ecosystems and expert judgment.
| BN | Bayesian network |
| DAG | Directed acyclic graph |
| CPT | Conditional probability table |
| CL | Confidence level |
| HP | Habitability pillar |
| RC | Risk criteria |
| RTH | Risk to habitability |
The data and code used in this study are archived at Zenodo (https://doi.org/10.5281/zenodo.17531782, Badillo et al., 2025) and are also available on GitHub: https://github.com/MirnaBadillo/Bayesian_Network_Risk_to_Atoll_Island_Habitability (last access: 7 November 2025).
The supplement related to this article is available online at https://doi.org/10.5194/nhess-25-4527-2025-supplement.
Conceptualisation: MBI, JR, GLC, VD. Development of the method, implementation: MBI, JR, GLC. Analysis of the results: MBI, JR, GLC, VD. Writing – original draft: MBI. Writing – reviewing and editing: MBI, JR, GLC, VD.
The contact author has declared that none of the authors has any competing interests.
Publisher’s note: Copernicus Publications remains neutral with regard to jurisdictional claims made in the text, published maps, institutional affiliations, or any other geographical representation in this paper. While Copernicus Publications makes every effort to include appropriate place names, the final responsibility lies with the authors. Views expressed in the text are those of the authors and do not necessarily reflect the views of the publisher.
This article is part of the special issue “Methodological innovations for the analysis and management of compound risk and multi-risk, including climate-related and geophysical hazards (NHESS/ESD/ESSD/GC/HESS inter-journal SI)”. It is not associated with a conference.
We thank Marissa Yates and Stéphane Costa for their helpful comments. We acknowledge the assistance of AI language model ChatGPT in refining grammar of this manuscript.
This study was supported by the FUTURISKS project (Past-to-FUTURe coastal RISKS in Tropical French Overseas Island Territories: from impacts to solutions) funded by the French State under France 2030 under the reference ANR-22-POCE-0002.
This paper was edited by Silvia De Angeli and reviewed by two anonymous referees.
Badillo, M., Rohmer, J., Le Cozannet, G., and Duvat, V.: Bayesian network to assess the future risk to atoll island habitability (v1.0), Zenodo [code], https://doi.org/10.5281/zenodo.17531782, 2025.
Baldock, T. E., Shabani, B., and Callaghan, D. P.: Open access Bayesian Belief Networks for estimating the hydrodynamics and shoreline response behind fringing reefs subject to climate changes and reef degradation, Environmental Modelling & Software, 119, 327–340, https://doi.org/10.1016/j.envsoft.2019.07.001, 2019.
Banan-Dallalian, M., Shokatian-Beiragh, M., Golshani, A., and Abdi, A.: Use of a Bayesian Network for storm-induced flood risk assessment and effectiveness of ecosystem-based risk reduction measures in coastal areas (Port of Sur, Sultanate of Oman), Ocean Engineering, 270, 113662, https://doi.org/10.1016/j.oceaneng.2023.113662, 2023.
Beuzen, T., Marshall, L., and Splinter, K. D.: A comparison of methods for discretizing continuous variables in Bayesian Networks, Environmental Modelling & Software, 108, 61–66, https://doi.org/10.1016/j.envsoft.2018.07.007, 2018.
Callaghan, D. P., Baldock, T. E., Shabani, B., and Mumby, P. J.: Communicating physics-based wave model predictions of coral reefs using Bayesian belief networks, Environmental Modelling & Software, 108, 123–132, https://doi.org/10.1016/j.envsoft.2018.07.021, 2018.
Catenacci, M. and Giupponi, C.: Integrated assessment of sea-level rise adaptation strategies using a Bayesian decision network approach, Environmental Modelling & Software, 44, 87–100, https://doi.org/10.1016/j.envsoft.2012.10.010, 2013.
Cooley, S., Schoeman, D., Bopp, L., Boyd, P., Donner, S., Ghebrehiwet, D. Y., Ito, S.-I., Kiessling, W., Martinetto, P., Ojea, E., Racault, M.-F., Rost, B., and Skern-Mauritzen, M.: Oceans and Coastal Ecosystems and Their Services. In: Climate Change 2022: Impacts, Adaptation and Vulnerability. Contribution of Working Group II to the Sixth Assessment Report of the Intergovernmental Panel on Climate Change, editeb by: Pörtner, H.-O., Roberts,D. C., Tignor, M., Poloczanska, E. S., Mintenbeck, K., Alegría, A., Craig, M., Langsdorf, S., Löschke, S., Möller, V., Okem, A., and Rama, B., Cambridge University Press, 379–550, https://doi.org/10.1017/9781009325844.005, 2022.
den Heijer, C. (Kees), Knipping, D. T. J. A., Plant, N. G., van Thiel de Vries, J. S. M., Baart, F., and van Gelder, P. H. A. J. M.: Impact assessment of extreme storm events using a Bayesian network, Coastal Engineering Proceedings, 1, management.4, https://doi.org/10.9753/icce.v33.management.4, 2012.
Duvat, V. K. E., Magnan, A. K., Perry, C. T., Spencer, T., Bell, J. D., Wabnitz, C. C. C., Webb, A. P., White, I., McInnes, K. L., Gattuso, J.-P., Graham, N. A. J., Nunn, P. D., and Le Cozannet, G.: Risks to future atoll habitability from climate-driven environmental changes, WIREs Climate Change, 12, e700, https://doi.org/10.1002/wcc.700, 2021.
Ferrari, S. and Cribari-Neto, F.: Beta Regression or Modeling Rates and Proportions, Journal of Applied Statistics, 31, 799–815, https://doi.org/10.1080/0266476042000214501, 2004.
Ferreira, Ó., Plomaritis, T. A., and Costas, S.: Effectiveness assessment of risk reduction measures at coastal areas using a decision support system: Findings from Emma storm, Science of The Total Environment, 657, 124–135, https://doi.org/10.1016/j.scitotenv.2018.11.478, 2019.
Gornitz, V., White, T. W., and Cushman, R. M.: Vulnerability of the US to future sea level rise, Oak Ridge National Lab, TN, USA, http://www.osti.gov/biblio/5875484 (last access: 5 November 2025), 1991.
Gutierrez, B. T., Plant, N. G., and Thieler, E. R.: A Bayesian network to predict coastal vulnerability to sea level rise, Journal of Geophysical Research: Earth Surface, 116, https://doi.org/10.1029/2010JF001891, 2011.
Hafezi, M., Sahin, O., Stewart, R. A., Connolly, R. M., Mackey, B., and Ware, D.: Adaptation strategies for coral reef ecosystems in Small Island Developing States: Integrated modelling of local pressures and long-term climate changes, Journal of Cleaner Production, 253, 119864, https://doi.org/10.1016/j.jclepro.2019.119864, 2020.
Hapke, C. and Plant, N.: Predicting coastal cliff erosion using a Bayesian probabilistic model, Marine Geology, 278, 140–149, https://doi.org/10.1016/j.margeo.2010.10.001, 2010.
IPCC: Climate Change 2022 – Impacts, Adaptation and Vulnerability: Working Group II Contribution to the Sixth Assessment Report of the Intergovernmental Panel on Climate Change, editeb by: Pörtner, H.-O., Roberts, D. C., Tignor, M., Poloczanska, E. S., Mintenbeck, K., Alegría, A., Craig, M., Langsdorf, S., Löschke, S., Möller, V., Okem, A., and Rama, B., Cambridge University Press, https://doi.org/10.1017/9781009325844, 2022.
Jäger, W. S., Christie, E. K., Hanea, A. M., Den Heijer, C., and Spencer, T.: A Bayesian network approach for coastal risk analysis and decision making, Coastal Engineering, 134, 48–61, https://doi.org/10.1016/j.coastaleng.2017.05.004, 2018.
Karnauskas, K. B., Donnelly, J. P., and Anchukaitis, K. J.: Future freshwater stress for island populations, Nature Clim. Change, 6, 720–725, https://doi.org/10.1038/nclimate2987, 2016.
Mycoo, M., Wairiu, M., Campbell, D., Duvat, V. K. E., Golbuu, Y., Maharaj, S., Nalau, J., Nunn, J., Pinnegar, J., and Warrick, O.: Small Islands, in: Climate Change 2022: Impacts, Adaptation and Vulnerability. Contribution of Working Group II to the Sixth Assessment Report of the Intergovernmental Panel on Climate Change, edited by: Pörtner, H.-O., Roberts, D. C., Tignor, M., Poloczanska, E. S., Mintenbeck, K., Alegría, A., Craig, M., Langsdorf, S., Löschke, S., Möller, V., Okem, A., and Rama, B., Cambridge University Press, 2043–2121, https://doi.org/10.1017/9781009325844.017, 2022.
Narayan, S., Simmonds, D., Nicholls, R., and Clarke, D.: A Quasi-2D Bayesian network model for assessments of coastal inundation pathways and probabilities, Journal of Flood Risk Management, https://doi.org/10.1111/jfr3.12200, 2015.
Pearl, J.: Probabilistic Reasoning in Intelligent Systems: Networks of Plausible Inference, Morgan-Kaufmann, San Francisco (CA), https://doi.org/10.5555/534975, 1988.
Pearson, S. G., Storlazzi, C. D., van Dongeren, A. R., Tissier, M. F. S., and Reniers, A. J. H. M.: A Bayesian-Based System to Assess Wave-Driven Flooding Hazards on Coral Reef-Lined Coasts, Journal of Geophysical Research: Oceans, 122, 10099–10117, https://doi.org/10.1002/2017JC013204, 2017.
Phan, T. D., Smart, J. C. R., Sahin, O., Stewart-Koster, B., Hadwen, W. L., and Capon, S. J.: Identifying and prioritising adaptation options for a coastal freshwater supply and demand system under climatic and non-climatic changes, Reg. Environ. Change, 20, 88, https://doi.org/10.1007/s10113-020-01678-7, 2020.
Plant, N. G. and Holland, K. T.: Prediction and assimilation of surf-zone processes using a Bayesian network: Part I: Forward models, Coastal Engineering, 58, 119–130, https://doi.org/10.1016/j.coastaleng.2010.09.003, 2011.
Plomaritis, T. A., Costas, S., and Ferreira, Ó.: Use of a Bayesian Network for coastal hazards, impact and disaster risk reduction assessment at a coastal barrier (Ria Formosa, Portugal), Coastal Engineering, 134, 134–147, https://doi.org/10.1016/j.coastaleng.2017.07.003, 2018.
Poelhekke, L., Jäger, W. S., van Dongeren, A., Plomaritis, T. A., McCall, R., and Ferreira, Ó.: Predicting coastal hazards for sandy coasts with a Bayesian Network, Coastal Engineering, 118, 21–34, https://doi.org/10.1016/j.coastaleng.2016.08.011, 2016.
Pratchett, M., Munday, P., Wilson, S., Graham, N., Cinner, J., Bellwood, D., Jones, G., Polunin, N., and Mcclanahan, T.: Effects Of Climate-Induced Coral Bleaching On Coral-Reef Fishes: Ecological And Economic Consequences, Oceanography and Marine Biology: An Annual Review, 46, 251–296, https://doi.org/10.1201/9781420065756, 2008.
Rachid, G., Alameddine, I., Najm, M. A., Qian, S., and El-Fadel, M.: Dynamic Bayesian Networks to Assess Anthropogenic and Climatic Drivers of Saltwater Intrusion: A Decision Support Tool Toward Improved Management, Integrated Environmental Assessment and Management, 17, 202–220, https://doi.org/10.1002/ieam.4355, 2021.
Rey, T., Le De, L., Frédéric, L., and Gilbert, D.: An integrative approach to understand vulnerability and resilience post-disaster: The 2015 cyclone Pam in urban Vanuatu as case study, Disaster Prevention and Management: An International Journal, 26, https://doi.org/10.1108/DPM-07-2016-0137, 2017.
Rohmer, J.: Uncertainties in conditional probability tables of discrete Bayesian Belief Networks: A comprehensive review, Engineering Applications of Artificial Intelligence, 88, 103384, https://doi.org/10.1016/j.engappai.2019.103384, 2020.
Sahin, O., Hadwen, W. L., Buckwell, A., Fleming, C., Ware, D., Smart, J. C. R., Dan, A., and Mackey, B.: Assessing how ecosystem-based adaptations to climate change influence community wellbeing: a Vanuatu case study, Reg. Environ. Change, 21, 90, https://doi.org/10.1007/s10113-021-01809-8, 2021.
Sahin, O., Stewart, R. A., Faivre, G., Ware, D., Tomlinson, R., and Mackey, B.: Spatial Bayesian Network for predicting sea level rise induced coastal erosion in a small Pacific Island, Journal of Environmental Management, 238, 341–351, https://doi.org/10.1016/j.jenvman.2019.03.008, 2019.
Sanuy, M., Duo, E., Jäger, W. S., Ciavola, P., and Jiménez, J. A.: Linking source with consequences of coastal storm impacts for climate change and risk reduction scenarios for Mediterranean sandy beaches, Nat. Hazards Earth Syst. Sci., 18, 1825–1847, https://doi.org/10.5194/nhess-18-1825-2018, 2018.
Schewe, J., Heinke, J., Gerten, D., Haddeland, I., Arnell, N., Clark, D., Dankers, R., Eisner, S., Fekete, B., Colón-González, F. J., Gosling, S., Kim, H., Liu, X., Masaki, Y., Portmann, F., Satoh, Y., Stacke, T., Tang, Q., Wada, Y., and Kabat, P.: Multimodel assessment of water scarcity under climate change, Proceedings of the National Academy of Sciences of the United States of America, 111, 3245–3250, https://doi.org/10.1073/pnas.1222460110, 2014.
Scutari, M.: Learning Bayesian Networks with the bnlearn R Package, Journal of Statistical Software, 35, 1–22, https://doi.org/10.18637/jss.v035.i03, 2010.
Simpson, N. P., Mach, K. J., Constable, A., Hess, J., Hogarth, R., Howden, M., Lawrence, J., Lempert, R. J., Muccione, V., Mackey, B., New, M. G., O'Neill, B., Otto, F., Pörtner, H.-O., Reisinger, A., Roberts, D., Schmidt, D. N., Seneviratne, S., Strongin, S., van Aalst, M., Totin, E., and Trisos, C. H.: A framework for complex climate change risk assessment, One Earth, 4, 489–501, https://doi.org/10.1016/j.oneear.2021.03.005, 2021.
Sperotto, A., Molina, J.-L., Torresan, S., Critto, A., and Marcomini, A.: Reviewing Bayesian Networks potentials for climate change impacts assessment and management: A multi-risk perspective, Journal of Environmental Management, 202, 320–331, https://doi.org/10.1016/j.jenvman.2017.07.044, 2017.
Uusitalo, L., Kuikka, S., Kauppila, P., Söderkultalahti, P., and Bäck, S.: Assessing the roles of environmental factors in coastal fish production in the northern Baltic Sea: A Bayesian network application, Integrated Environmental Assessment and Management, 8, 445–455, https://doi.org/10.1002/ieam.180, 2012.
van Verseveld, H. C. W., van Dongeren, A. R., Plant, N. G., Jäger, W. S., and den Heijer, C.: Modelling multi-hazard hurricane damages on an urbanized coast with a Bayesian Network approach, Coastal Engineering, 103, 1–14, https://doi.org/10.1016/j.coastaleng.2015.05.006, 2015.
Vitousek, S., Barnard, P. L., Fletcher, C. H., Frazer, N., Erikson, L., and Storlazzi, C. D.: Doubling of coastal flooding frequency within decades due to sea-level rise, Sci. Rep., 7, 1399, https://doi.org/10.1038/s41598-017-01362-7, 2017.
Wadey, M., Brown, S., Nicholls, R. J., and Haigh, I.: Coastal flooding in the Maldives: an assessment of historic events and their implications, Nat. Hazards, 89, 131–159, https://doi.org/10.1007/s11069-017-2957-5, 2017.
Westra, S. and Zscheischler, J.: Accounting for systemic complexity in the assessment of climate risk, One Earth, 6, 645–655, https://doi.org/10.1016/j.oneear.2023.05.005, 2023.
Yamano, H., Kayanne, H., Yamaguchi, T., Kuwahara, Y., Yokoki, H., Shimazaki, H., and Chikamori, M.: Atoll island vulnerability to flooding and inundation revealed by historical reconstruction: Fongafale Islet, Funafuti Atoll, Tuvalu, Global and Planetary Change, 57, 407–416, https://doi.org/10.1016/j.gloplacha.2007.02.007, 2007.
Yates, M. L. and Le Cozannet, G.: Brief communication “Evaluating European Coastal Evolution using Bayesian Networks”, Nat. Hazards Earth Syst. Sci., 12, 1173–1177, https://doi.org/10.5194/nhess-12-1173-2012, 2012.
Yuan, C. and Druzdzel, M. J.: Importance sampling algorithms for Bayesian networks: Principles and performance, Mathematical and Computer Modelling, 43, 1189–1207, https://doi.org/10.1016/j.mcm.2005.05.020, 2006.
Zommers, Z., Marbaix, P., Fischlin, A., Ibrahim, Z. Z., Grant, S., Magnan, A. K., Pörtner, H.-O., Howden, M., Calvin, K., Warner, K., Thiery, W., Sebesvari, Z., Davin, E. L., Evans, J. P., Rosenzweig, C., O'Neill, B. C., Patwardhan, A., Warren, R., van Aalst, M. K., and Hulbert, M.: Burning embers: towards more transparent and robust climate-change risk assessments, Nature Reviews Earth & Environment, 1, 516–529, https://doi.org/10.1038/s43017-020-0088-0, 2020.