the Creative Commons Attribution 4.0 License.
the Creative Commons Attribution 4.0 License.
 | 17 Jan 2023
How uncertain are precipitation and peak flow estimates for the July 2021 flooding event?
Mohamed Saadi
Carina Furusho-Percot
Alexandre Belleflamme
Ju-Yu Chen
Silke Trömel
Stefan Kollet
The disastrous July 2021 flooding event made us question the ability of current hydrometeorological tools in providing timely and reliable flood forecasts for unprecedented events. This is an urgent concern since extreme events are increasing due to global warming, and existing methods are usually limited to more frequently observed events with the usual flood generation processes. For the July 2021 event, we simulated the hourly streamflows of seven catchments located in western Germany by combining seven partly polarimetric, radar-based quantitative precipitation estimates (QPEs) with two hydrological models: a conceptual lumped model (GR4H) and a physically based, 3D distributed model (ParFlowCLM). GR4H parameters were calibrated with an emphasis on high flows using historical discharge observations, whereas ParFlowCLM parameters were estimated based on landscape and soil properties. The key results are as follows. (1) With no correction of the vertical profiles of radar variables, radar-based QPE products underestimated the total precipitation depth relative to rain gauges due to intense collision–coalescence processes near the surface, i.e., below the height levels monitored by the radars. (2) Correcting the vertical profiles of radar variables led to substantial improvements. (3) The probability of exceeding the highest measured peak flow before July 2021 was highly impacted by the QPE product, and this impact depended on the catchment for both models. (4) The estimation of model parameters had a larger impact than the choice of QPE product, but simulated peak flows of ParFlowCLM agreed with those of GR4H for five of the seven catchments. This study highlights the need for the correction of vertical profiles of reflectivity and other polarimetric variables near the surface to improve radar-based QPEs for extreme flooding events. It also underlines the large uncertainty in peak flow estimates due to model parameter estimation.
- Article
(7712 KB) - Full-text XML
- BibTeX
- EndNote


1.1 Old questions in the light of new extremes
Many parts of the world will face an increase in the frequency and intensity of heavy summer precipitation events under a warmer climate as a result of the enhanced moisture-holding capacity of the atmosphere (Fowler et al., 2021; Kendon et al., 2014; Trenberth, 2011). This implies more frequent flash flooding events (Dougherty and Rasmussen, 2020), hence increasing damage to infrastructure and loss of human life (Dottori et al., 2018; Nissen and Ulbrich, 2017). The flooding events of July 2021 in Europe resulted in more than 220 deaths (Deutsche Welle, 2021), large-scale damage to infrastructure (Koks et al., 2022), and costs of up to EUR 8.2 billion in insured losses (GDV, 2021) and up to EUR 32.05 billion in total losses in Germany alone (BMI, 2022), making them the most severe natural disaster caused by heavy rain and flooding in Germany (Mohr et al., 2022). Predicting such never-before-seen extremes challenges our forecasting chains (Hapuarachchi et al., 2011) and gives a new opportunity to re-examine persistent questions. How accurate are new, state-of-the-art radar-based precipitation estimates for this event? Given the recent developments in radar-based precipitation estimation and hydrological modeling, which of these sources of uncertainty is predominant in extreme peak flow estimation?
1.2 Precipitation estimates and hydrological modeling approaches
Rain gauges are often used as a reference source of quantitative precipitation estimates (QPEs; Boushaki et al., 2009; Derin et al., 2019; Dumont et al., 2022; Schleiss et al., 2020). However, they are sparse and may miss the spatial variability in precipitation, especially of convective precipitation fields that can generate extreme flooding events in high-elevation, complex terrain configurations (Anquetin et al., 2005; Emmanuel et al., 2017; Sokol et al., 2021; Tetzlaff and Uhlenbrook, 2005). Alternatively, operational radar-based QPEs provide better coverage and characterization of precipitation dynamics with higher spatial and temporal resolutions, which is particularly useful for flooding events (Anagnostou et al., 2010; Zhou et al., 2017). Traditionally, radar-based QPEs are derived from horizontal reflectivity (Z) using Marshall–Palmer-type formulae (Marshall and Palmer, 1948). However, these are highly sensitive to the variability in the raindrop size distribution, and in some cases, QPEs based on Z only tend to underestimate heavy precipitation (Harrison et al., 2000; Park et al., 2019; Schleiss et al., 2020). In addition, they are affected by radar calibration, attenuation, partial beam blockage, and the radome effect (Berne and Krajewski, 2013; Borga et al., 2007; Chen et al., 2021; Diederich et al., 2015a, b; Ryzhkov et al., 2014). These limitations can be overcome by using additional variables from dual-polarimetric radars, which provide a better characterization of the shape and the concentration of hydrometeors and are less sensitive to raindrop size distribution (Gourley et al., 2010; Ryzhkov et al., 2005). Phase-based observables from polarimetric radars, such as specific differential phase (KDP) and specific attenuation at horizontal or vertical polarization (A), help improve QPEs especially for heavy, convective, and hail-contaminated rainfall events (Anagnostou et al., 2018; Berne and Krajewski, 2013; Chen et al., 2021; Ryzhkov et al., 2014, 2022). However, including these variables may only lead to better spatial correlations with limited improvements in biases (Cunha et al., 2015). Improving these biases may require the vertical gradients in radar variables and/or precipitation and their evolution near the ground to be accounted for (Chen et al., 2020; Reinoso-Rondinel and Schleiss, 2021), especially when the rain formation is dominated by strong collision–coalescence processes that lead to changes in the vertical precipitation intensity (Porcacchia et al., 2017). The evaluation of radar-based QPEs has been commonly done with regards to point-scale ground-based measurements from rain gauges, but when the ultimate goal is to provide an accurate estimation of flood severity, a catchment-scale hydrological evaluation is needed.
Precipitation is the main driving factor of land-surface hydrological processes at the event-scale. Consequently, uncertainties in the input QPEs strongly control the uncertainties of hydrological model outputs (Oudin et al., 2006; Renard et al., 2011) and are found to be larger than the structural uncertainties of the models (Kuczera et al., 2006; Zappa et al., 2011). Previous studies evaluated the added value of improved spatial and temporal resolutions of QPEs using hydrological models. Cole and Moore (2009) showed the benefits of gauge-corrected radar-based QPEs for ungauged locations using a distributed hydrological model. Lobligeois et al. (2014) found that using high-resolution, spatially distributed precipitation was mainly beneficial in regions with high spatial variability in precipitation and topography fields. For flash flood applications, several studies (e.g., Borga et al., 2007; Braud et al., 2010; Emmanuel et al., 2017; Lin et al., 2018) concluded that QPEs are the major controlling factor of flash flood dynamics and of hydrological model performances. However, they found that the extent to which uncertainties in QPEs impacted model outputs is dependent on the strength of the storage behavior of the catchment, which may hide the benefit of using high-resolution QPEs (Pokhrel and Gupta, 2011). Yet, fewer studies (e.g., Gourley et al., 2010; He et al., 2018) assessed the added value of polarimetric radar measurements in predicting hydrological extremes. Additionally, the reliability of calibrated models for predicting unprecedented extreme hydrological events is questionable as they depend on historical observations (Poméon et al., 2020). In this respect, little attention has been drawn to how highly contrasted model formulations (lumped, conceptual vs. distributed, physically based) are affected by uncertainties in QPE inputs for the case of extreme precipitation events.
1.3 Insights from the disastrous July 2021 event in western Germany
This study investigates the influence of improved QPEs and different representations of hydrological processes on the uncertainties in simulating extreme flooding events. The novelties of our study consist in (1) using new QPE products from vertical-profile-corrected, phase-based observables of C-band and X-band radars, (2) examining contrasting hydrological modeling approaches (conceptual vs. partial differential equation (PDE)-based model), and (3) proposing an evaluation framework of the hydrometeorological prediction chain for unprecedented extreme events with unavailable discharge measurements. Since no peak flow measurements are available (partly due to destroyed monitoring systems), our analysis focused on the probability that the simulated peak flow exceeds the highest historically observed peak flow. This is relevant because hydrological models are often evaluated based on their ability to detect the probability of flows exceeding catchment-specific critical thresholds for flood warning applications (Anctil and Ramos, 2017).
This paper is structured as follows: Sect. 2 presents the study region, Sect. 3 explains the methodology, Sects. 4 and 5 show and discuss our results, and Sect. 6 summarizes our conclusions.
Our study focused on a set of seven catchments located in western Germany (Fig. 1b), draining parts of the Eifel low mountain range, with areas ranging between 140 and 1670 km2 (Table 1). Four of the seven stream gauges are located on the Ahr and the Kyll rivers in the federal state of Rhineland-Palatinate. The remaining three stream gauges are located on the Erft and Rur rivers in the federal state of North Rhine-Westphalia. The hypsometry of the catchments shows a rolling plateau at mild elevations (300 to 700 m a.s.l.) except for the catchments drained by the Erft river (Fig. 1c). The region is characterized by sedimentary rocks interbedded with volcanic rocks, with relatively shallow soils characterized by low water-holding capacity (Kreienkamp et al., 2021) and dominated by sand (catchment averages: 34 %–41 %) and silt (catchment averages 29 %–38 %; Panagos, 2006). The land cover of the catchments is dominated by agricultural and forest areas, with a relatively small proportion of artificial areas (Table 1). Average precipitation depths range from 700 to 1080 mm yr−1, and corresponding aridity indices are between 0.5 and 0.9, which reflects a region with a temperate climate under oceanic influence.
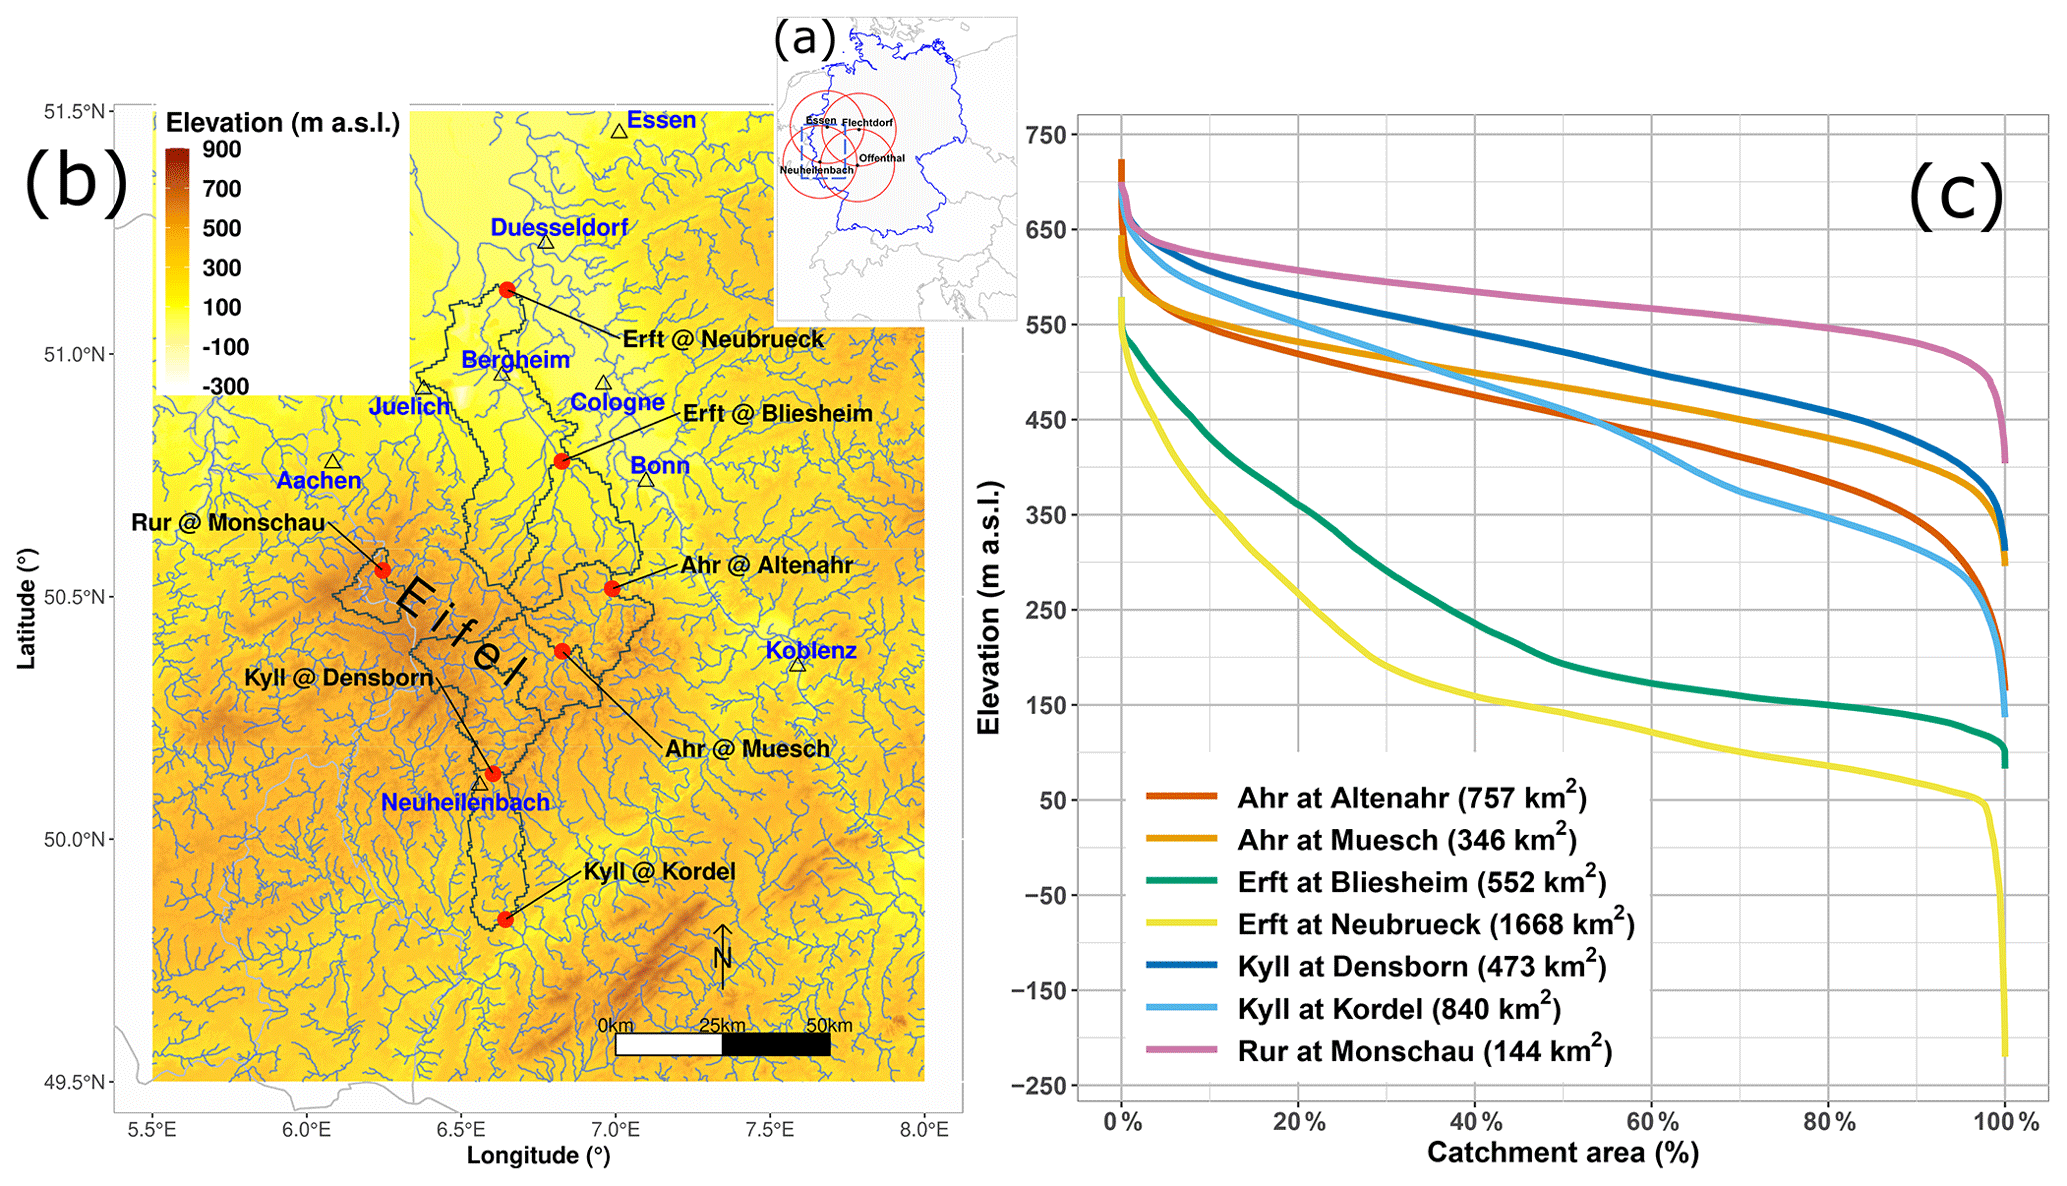
Figure 1(a) Location of the four C-band radars (Essen, Flechtdorf, Neuheilenbach, and Offenthal) operated by the German Weather Service (DWD) and used to derive the radar-based QPE products, (b) location of study region and catchment polygons, and (c) hypsometric curves of the seven catchments. Negative elevations are due to open-pit mines in the region.
Table 1Hydroclimatic and landscape characteristics of the seven studied catchments. Data sources are detailed in Sect. 3.3.

a All catchments are regulated, i.e., contain at least one reservoir or dam at the upstream of the
catchment outlet, according to the non-exhaustive database at https://dewiki.de/Lexikon/Liste_von_Talsperren_in_Deutschland
(last access: 20 December 2022, in German).
b These percentages were computed based on the CORINE Land Cover
classification of the Copernicus Land Monitoring Service (Langanke et al., 2016).
They correspond to the proportion of the catchment that is occupied by the classes
belonging to (1) “Artificial Surfaces” for Artificial, (2) “Agricultural areas” for Agricultural,
(3) “Forest and seminatural areas” for Forest, and (4) “Wetlands” and “Water bodies” for Water bodies.
See https://land.copernicus.eu/user-corner/technical-library/corine-land-cover-nomenclature-guidelines/html (last access: 20 December 2022).
c Average precipitation depths were estimated over the period 2006–2021 from RADOLAN.
d Aridity index was estimated as the ratio of average potential evapotranspiration to average precipitation.
3.1 The lumped conceptual hydrological modeling approach
We selected GR4H (Ficchì et al., 2019) as a representative of the lumped, conceptual modeling approach. GR4H inputs consist of catchment-average precipitation and potential evapotranspiration at the hourly time step. Potential evapotranspiration was estimated using a formula based on catchment-average temperature (Oudin et al., 2005). GR4H estimates net precipitation from input precipitation using an interception with a soil moisture accounting reservoir. Then, the net precipitation is split into 10 % routed through the quick-flow routing branch (via a unit hydrograph) and 90 % routed through the slow-flow branch (via a unit hydrograph and a nonlinear routing reservoir). On both branches, exchanges between surface water and groundwater are enabled. Detailed equations can be found in Ficchì et al. (2019) and Perrin et al. (2003).
We calibrated GR4H parameters using historical observations of discharge and a gradient-descent-based algorithm (Coron et al., 2017; Edijatno et al., 1999). Since hourly discharge values for all stream gauges were unavailable, hourly model simulations were aggregated into daily time steps to be compared to the daily discharge observations. Because we are interested in simulating high discharge values, we looked for optimal parameters θopt that maximized the following objective function OF(θ):
where θ are model parameters, Qsim(θ) and Qobs are, respectively, simulated and observed discharges, C(Qsim(θ),Qobs) is a calculated error criterion over the whole period of calibration, and is the same error criterion calculated using only the periods when the observed discharge is above the threshold Qobs,th, which intends to emphasize high flows. To account for the uncertainties in parameter estimation, we split the available time series into two distinct and length-equivalent sub-periods (2007–2013 and 2014–2020), over which we calibrated the model with regards to two criteria C: the Nash–Sutcliffe efficiency (Nash and Sutcliffe, 1970) and the Kling–Gupta efficiency (Gupta et al., 2009). For the threshold Qobs,th, we chose three values: the minimum discharge value (i.e., no explicit emphasis on high flows), the 90th percentile, and the 99th percentile of daily discharge values. Combining these choices yielded 12 optimal parameter sets (from 2 periods of calibration ×2 evaluation criteria ×3 discharge thresholds) for each catchment. During calibration, the first year of records (2006) was used for model spin-up to minimize the impact of model initialization on model calibration and simulation results.
3.2 The distributed PDE-based hydrological modeling approach
In addition to GR4H, we used the hydrological model ParFlow with its internal land-surface module CLM (Common Land Model), hereafter ParFlowCLM (Kollet and Maxwell, 2006; Kuffour et al., 2020; Maxwell, 2013), implemented on a 611 m resolution grid with 15 depth layers down to 60 m below the surface, with geometrically increased thickness. CLM resolves the energy budget at the land surface, as well as the water exchange at the atmosphere–land–soil interface, which helps discern the net precipitation from interception, soil evaporation, plant transpiration, and infiltration. ParFlow resolves the 3D Richards' equation for variably saturated subsurface and groundwater flow, coupled with the kinematic wave model for the overland flow routing. Assuming the continuity of pressure at the ground surface, the boundary fluxes for Richards' equation are estimated from the kinematic wave model, and vice versa (Kollet and Maxwell, 2006). The model represents both the Hortonian and the Dunne runoff processes, and it accounts for exfiltration and re-infiltration at the downstream hydraulic pathway.
ParFlowCLM was forced at the hourly time step with a spin-up period starting from 2007. Slopes were estimated from the ASTER (Advanced Spaceborne Thermal Emission and Reflection Radiometer; https://lpdaac.usgs.gov/products/astgtmv003, last access: 9 January 2023) DEM (digital elevation model) combined with the hydrologically enhanced DEM MERIT (Multi-Error-Removed Improved-Terrain) Hydro (Yamazaki et al., 2019). Soil and subsoil types are defined from the SoilGrids250m (Hengl et al., 2017) reclassified into 12 USDA (United States Department of Agriculture) texture types. The hydraulic parameters for each soil type (hydraulic conductivity, residual and saturated water content, and van Genuchten parameters) were obtained from the ROSETTA model (Schaap et al., 2001). Below the depth to bedrock (given by SoilGrids250m), the typology of the International Hydrogeological Map of Europe IHME1500 (scale 1:1 500 000) was used (Duscher et al., 2015). Land cover was characterized using the CORINE Land Cover database of the Copernicus Land Monitoring Service for the year 2018 (Langanke et al., 2016), whose land cover classification was converted into the 18 IGBP (International Geosphere–Biosphere Programme) categories. To account for the uncertainty in Manning's roughness coefficient, which highly impacts the peak flow simulations (Lumbroso and Gaume, 2012), different scenario simulations with spatially homogeneous and distributed roughness values were performed. In total, three spatially homogeneous values were tested for the whole domain: a default value of 0.2 s m (HMann, i.e., high roughness, from Schalge et al., 2019) and two additional values of 0.1 s m (MMann, i.e., medium roughness) and 0.03 s m (LMann, i.e., low roughness). These three values cover the whole range of Manning's coefficient values reported by Lumbroso and Gaume (2012), but adopting a uniform spatial distribution (although simple to implement and to interpret) is unrealistic given the differences in roughness values between land cover types. Therefore, a fourth simulation was performed using distributed Manning's coefficients (DMann) based on land cover types (and following Table 2 in Asante et al., 2008), with low values for water bodies (0.02 s m) and urban and barren surfaces (0.03 s m), mild values for croplands (0.033 s m), natural vegetation mosaics (0.037 s m), shrublands, grasslands, snow/ice, and permanent wetlands (0.05 s m), and high values for forests (0.1–0.12 s m).
3.3 Atmospheric forcing and streamflow data
Eight atmospheric variables were needed for the runs of ParFlowCLM, namely 2 m air temperature, precipitation, surface pressure, downward solar and thermal radiation, specific humidity, and eastward and northward components of the 10 m wind. Precipitation was obtained from the operational-radar-based RADOLAN product of the DWD (Deutsche Wetterdienst, German Weather Service; Winterrath et al., 2018), which is gauge-adjusted and available at 1 km resolution. The remaining atmospheric variables were obtained from the ERA5-Land dataset (Muñoz-Sabater et al., 2021), available at 9 km resolution. All variables were regridded to the model resolution using a bicubic interpolation. For GR4H, data demand is limited to precipitation and 2 m air temperature, which were catchment-averaged using the Thiessen polygon method, and discharge data for model calibration, which were obtained for the period 2007–2021 from the state offices for environment of North Rhine-Westphalia (LANUV, https://www.elwasweb.nrw.de, last access: 20 September 2021) and Rhineland-Palatinate (https://wasserportal.rlp-umwelt.de, last access: 20 September 2021).
3.4 Evaluation of QPE products and modeling choices for the July 2021 events
For 14 July 2021, we tested seven radar-based, 1 km gridded QPE products as detailed in Table 2. In addition to the gauge-adjusted RADOLAN, three products were derived from the measurements of four polarimetric, C-band radars operated by the DWD (located in Essen, Flechtdorf, Neuheilenbach, and Offenthal; Fig. 1a). These state-of-the-art products were derived using algorithms that exploit horizontal reflectivity (Z), specific differential phase (KDP), and specific attenuation at horizontal polarization (A; see Chen et al., 2021), without correction of vertical profiles (RZ, RZKDP, and RAKDP). Three additional, similar products (RZ-VPC, RZKDP-VPC, and RAKDP-VPC) were derived by exploiting information on the vertical variability in the radar variables, namely through (Chen et al., 2022)
-
the inclusion of the observations from an X-band radar located near Jülich (JuXPol, Fig. 1b) of the Laboratory for Clouds and Precipitation Exploration (CPEX-LAB, http://www.cpex-lab.de, last access: 9 January 2023) to provide lower-altitude observations and fill the gaps between the C-band radars located at Essen and Neuheilenbach,
-
the derivation of new rainfall relations at the lowest altitudes from the simulated radar variables based on raindrop size distributions (DSDs) observed by the two micro rain radars (MRRs) located at Bonn and Bergheim (Fig. 1b), and
-
the application of a vertical profile correction (VPC) to Z and KDP based on the approach by Chen et al. (2020) using real-time range-defined quasi-vertical profiles (RD-QVPs; Tobin and Kumjian, 2017) as a vertical profile reference (note that the specific attenuation A was not included in this procedure).
Table 2Summary of QPE products used for 14 July 2021 for the study region. MRR refers to micro rain radar. JuXPol is an X-band radar located near Jülich (Fig. 1b).
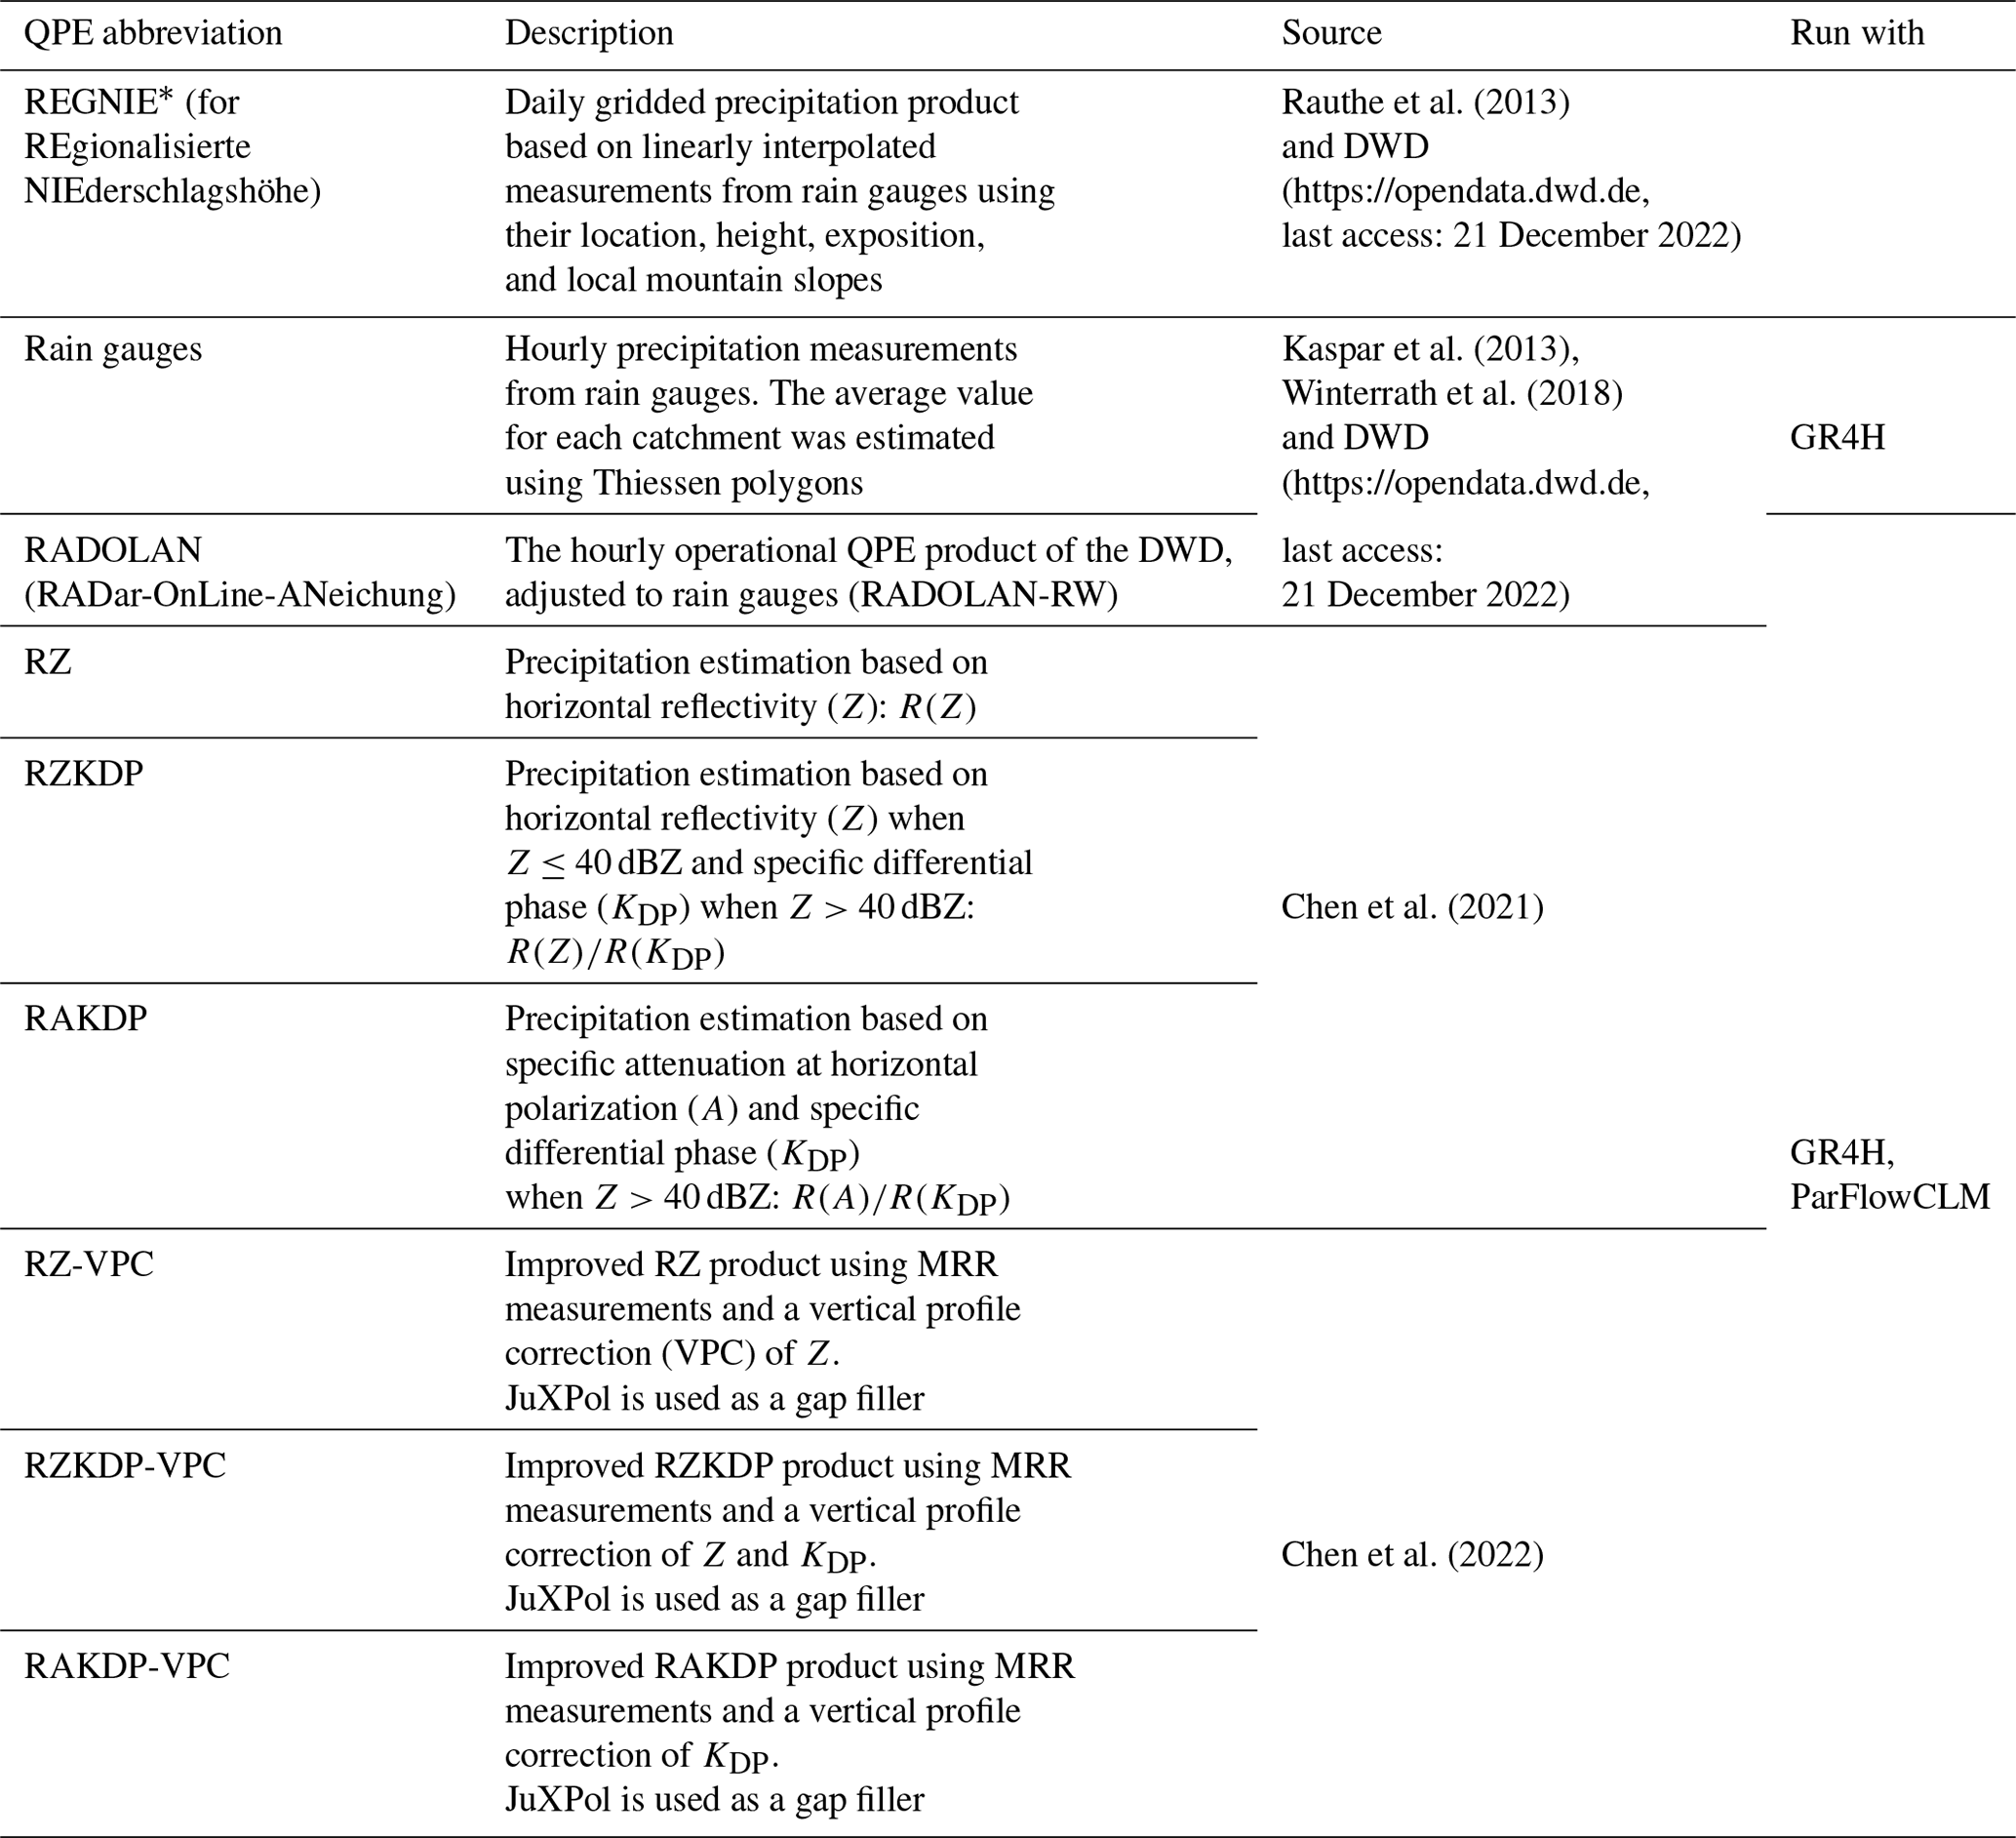
* REGNIE covers most of the studied catchments, except for the Rur at Monschau, where it covers only ∼50 % of its area. Only the covered area is used to estimate the average precipitation from REGNIE for this catchment.
We evaluated the radar-based QPEs first with respect to their agreement with rain gauges both at the point scale and at the catchment scale and then with respect to their effect on simulated peak flows by GR4H and ParFlowCLM. First, total rainfall depths for 14 July 2021 (between 14 July 2021 00:00 UTC and 15 July 2021 00:00 UTC) of the radar-based QPEs are compared at the point scale with the rain gauges using the normalized root-mean-square error (nRMSE), the normalized mean bias (NMB), and Pearson's correlation coefficient (CC), expressed as
where PRG,i is the total rainfall depth for 14 July 2021 measured at the ith rain gauge, and Pradar,i is the total rainfall depth given by the radar-based QPE radar (Table 2) and averaged over the raster cell containing the ith rain gauge and its 8 neighboring cells. This averaging was applied to account for differences in location between radar cells and rain gauges due to wind, motion, and vertical variability (Schleiss et al., 2020; Dai and Han, 2014). and are the averages of total rainfall depths of the considered N rain gauges and their corresponding N averages from neighboring raster cells of the radar-based QPEs, respectively. nRMSE and NMB both have a perfect score of 0, and CC has a perfect score of 1. Positive NMB values indicate that the radar-based QPE overestimates the total rainfall depth for 14 July 2021 compared to rain gauges, and vice versa.
At the catchment scale, the spatial average QPE derived from radar observations for 14 July 2021 is compared with that from rain gauges (based on Thiessen polygons) using the relative error:
which is positive (negative) when the radar-based QPE overestimates (underestimates) the total catchment-average precipitation depth with respect to rain gauges and equals zero for a perfect match. Acknowledging the uncertainties that may arise from using Thiessen polygons to compute catchment-scale precipitation depths, we compared these to catchment-scale precipitation estimates from the daily gridded product REGNIE (1 km resolution), which accounts for the position, the height, the exposition, and the slope of the gauge stations in the interpolation of the precipitation fields from rain gauges (Rauthe et al., 2013).
Second, we examined the effect of QPEs on the frequency of exceeding the highest historically observed peak flow for each catchment (Table 1) by simulated peak flows for the July 2021 event. Both GR4H and ParFlowCLM were initialized using a long spin-up period starting from 2006 for GR4H and 2007 for ParFlowCLM. This allowed the whole available record period of climatic forcing to be exploited to yield the best estimates of antecedent soil moisture conditions. Then, each radar-based QPE was used as input for both models to obtain 12 peak flow simulations from GR4H and 4 peak flow simulations from ParFlowCLM (i.e., a total of 16 peak flow simulations for each catchment). These peak flows are compared with the highest historically measured peak flow. Although GR4H simulations predominate, this will still illustrate the effect of QPE input on how well a model can issue a warning of an upcoming event that has never occurred.
Third, for each catchment and for each model, we analyzed the effect of the choice of QPE input using the relative error in simulated peak flows attributed to replacing RADOLAN with another QPE product, such as the following:
which is positive (negative) if using QPE products other than RADOLAN leads to higher (lower) simulated peak flows. Similarly, agreement across all QPE products between GR4H and ParFlowCLM is quantified using
where and are simulated peak flows by GR4H and ParFlowCLM, respectively. Perfect agreement is obtained with a relative error equal to zero, whereas positive (negative) values indicate that GR4H overestimates (underestimates) peak flows compared to ParFlowCLM. This relative error is estimated using all possible combinations of the 12 estimated peak flows by GR4H and the 4 estimated peak flows by ParFlowCLM.
4.1 Point-scale and catchment-scale differences between the QPE products
The different radar-based QPEs show a relatively similar spatial pattern to rain gauges and REGNIE, as can be seen in Fig. 2. Heavy precipitation depths have fallen over the highest altitudes, namely the Eifel range on the left bank of the Rhine river and the Bergisches Land on the right bank. These rainfall depths were a result of long-lasting intense stratiform rain connected to a cut-off low-pressure system (Junghänel et al., 2021), which locally broke historical precipitation records (Kreienkamp et al., 2021). For the rain gauge measurements, precipitation depths reached up to 162 mm, which is equivalent to what would fall in 2–3 months on average (i.e., by assuming a uniform distribution of rainfall and dividing 162 mm by the annual averages in Table 1). Conversely, the radar products significantly differ in terms of total precipitation depth for 14 July 2021. QPEs with vertical profile correction and gap-filling (RAKDP-VPC, RZKDP-VPC, and RZ-VPC) showed higher-precipitation depths compared to gauge-adjusted RADOLAN, especially when specific attenuation was used (RAKDP-VPC). Without vertical profile correction, radar-based QPEs (RAKDP, RZKDP, and RZ) showed significantly low precipitation depths.
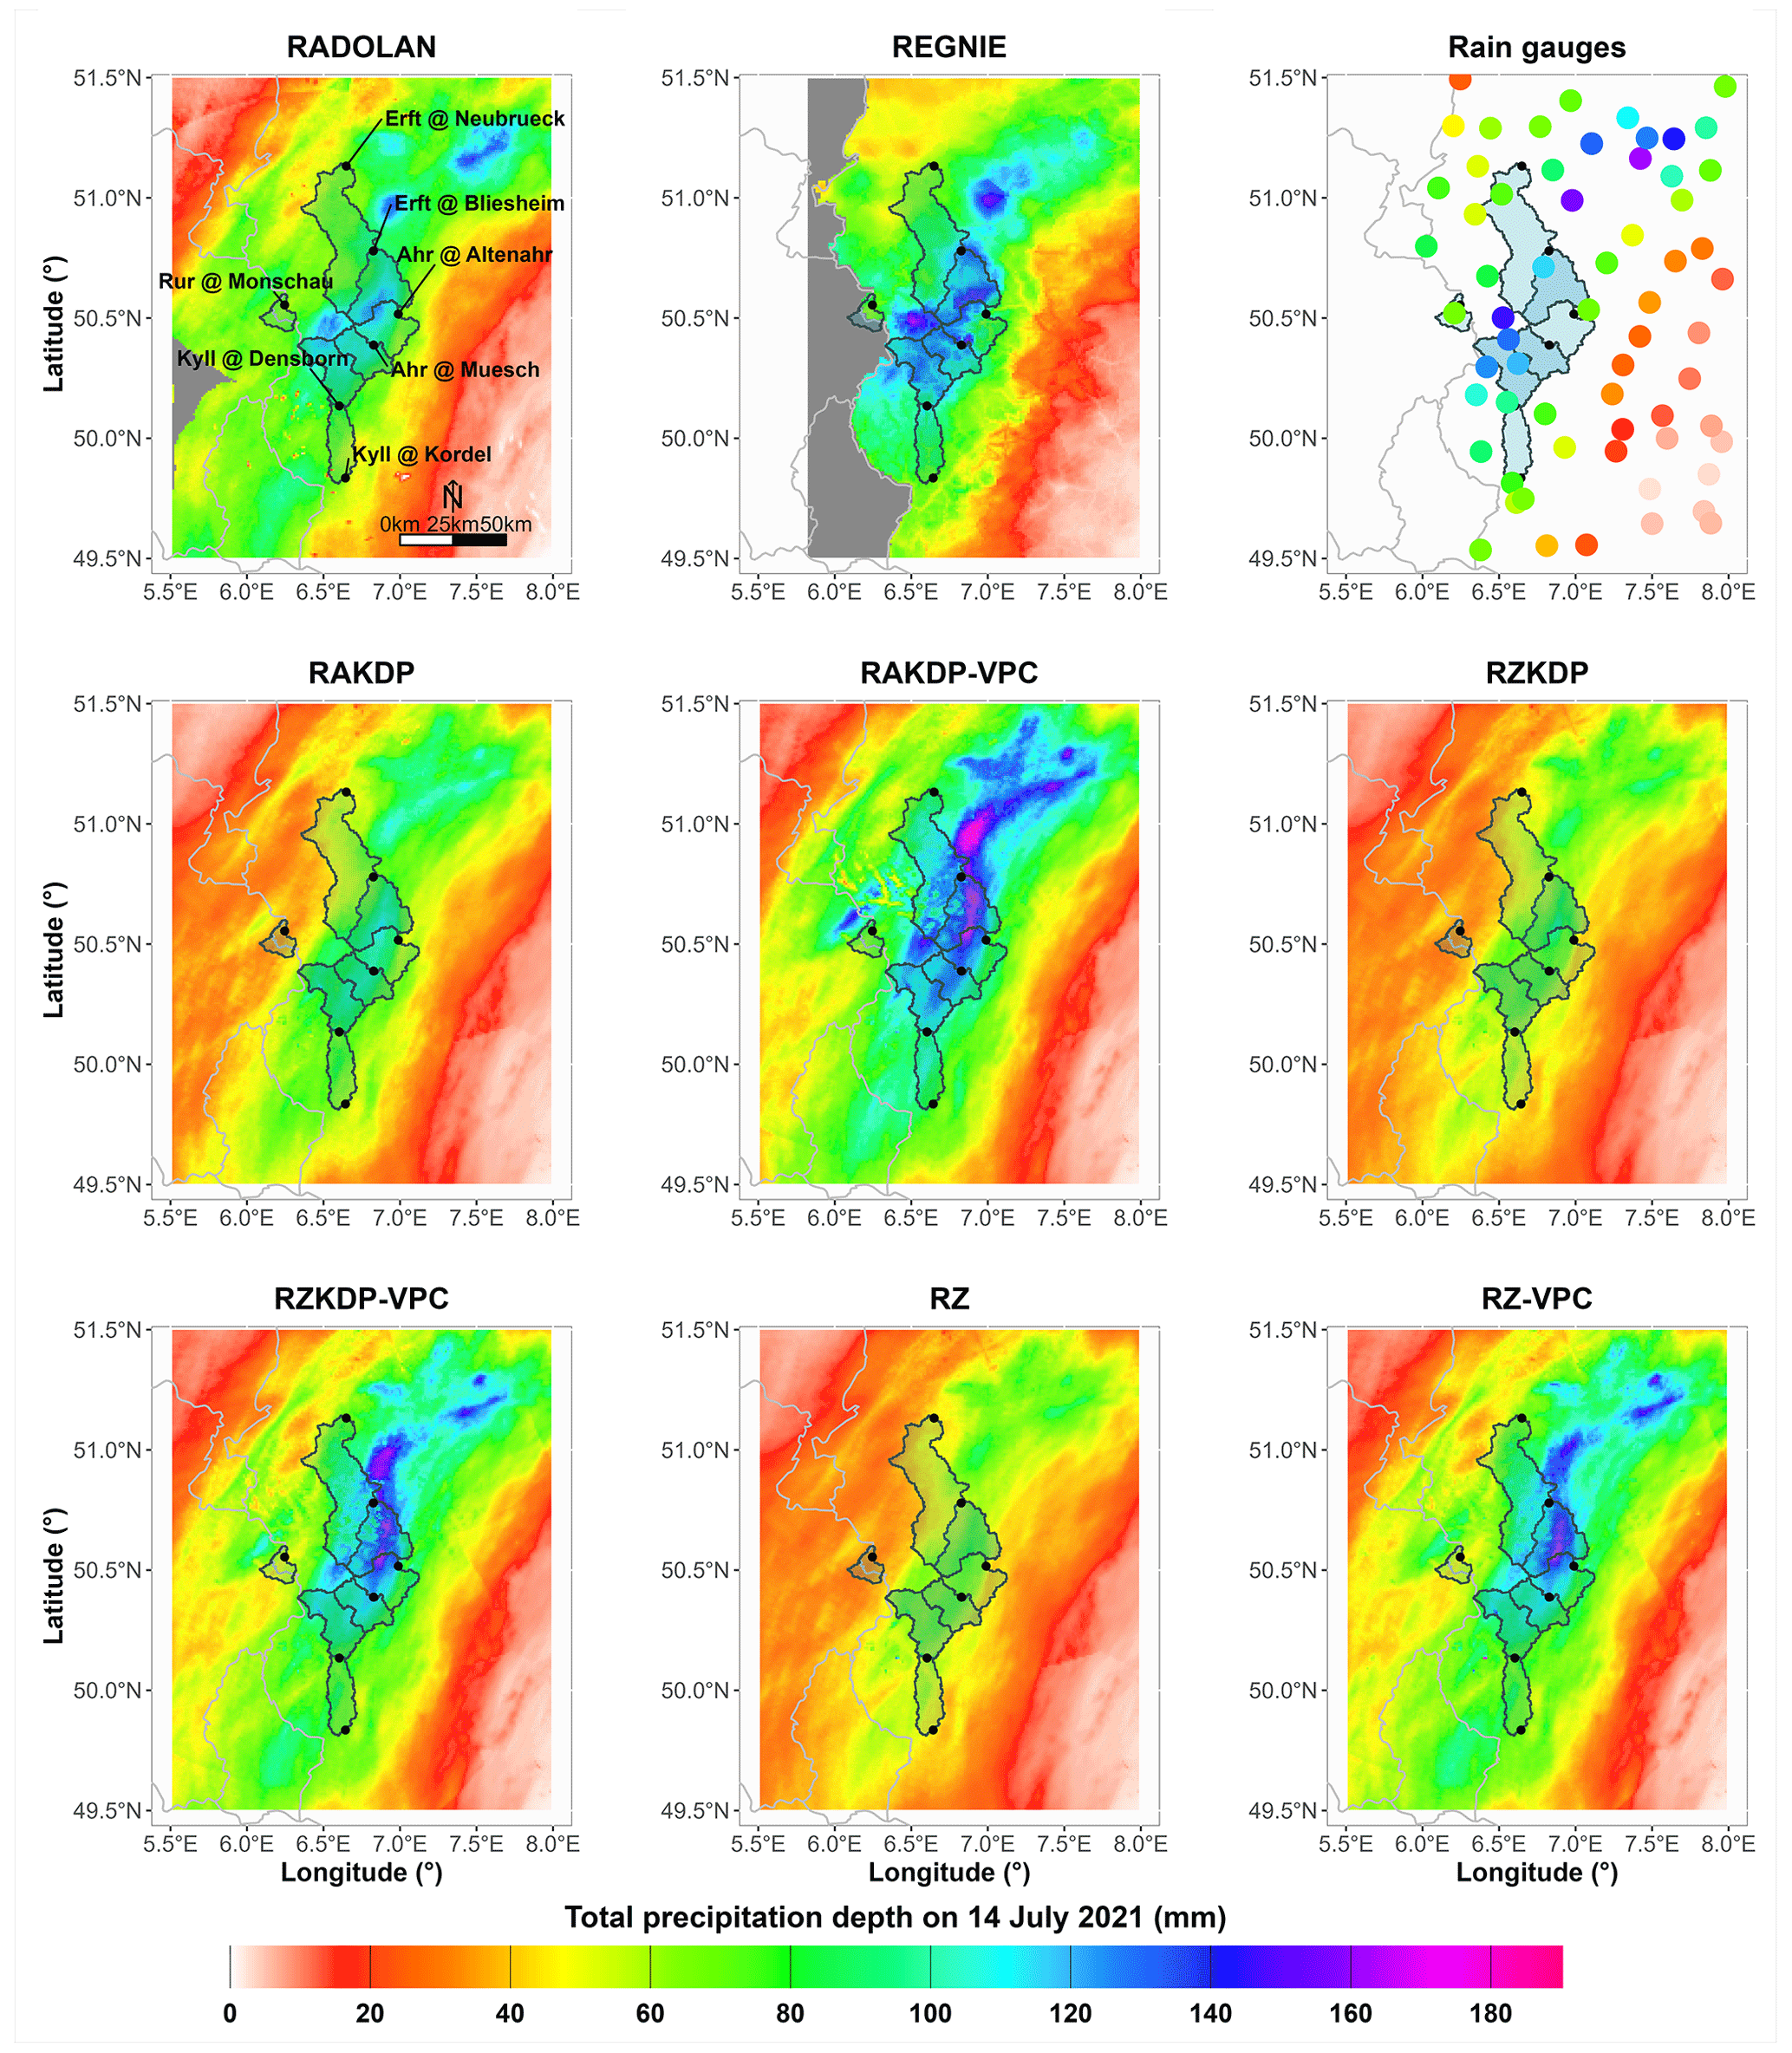
Figure 2Total precipitation depths for 14 July 2021 (between 14 July 2021 00:00 UTC and 15 July 2021 00:00 UTC) from nine QPE products (Table 2) over the study region. Note that REGNIE is available only at the daily time step and that it covers only ∼50 % of the area of the catchment drained by the Rur at Monschau.
At the point scale, the comparison with N=63 rain gauges over the region shows that the radar-based QPEs with vertical profile correction and gap-filling are the ones that agreed most with the rain gauges (Fig. 3). Values of nRMSE varied from 18 % for RAKDP-VPC to 32 %–35 % for RADOLAN and the two products based on horizontal reflectivity with a vertical profile correction and gap-filling (RZKDP-VPC and RZ-VPC), and they then jumped to 60 %–81 % for the remaining radar-based QPEs without vertical profile correction (RAKDP, RZKDP, and RZ). The negative NMB values show that QPE products underestimated the precipitation amounts compared to rain gauges when the vertical gradients of the radar variables were not accounted for. Thanks to the vertical profile correction, NMB values were kept between −10 % and +3 % (RAKDP-VPC, RZKDP-VPC, and RZ-VPC). Nevertheless, the high CC values confirm that all products captured well the spatial pattern of the ground-based precipitation measurements.
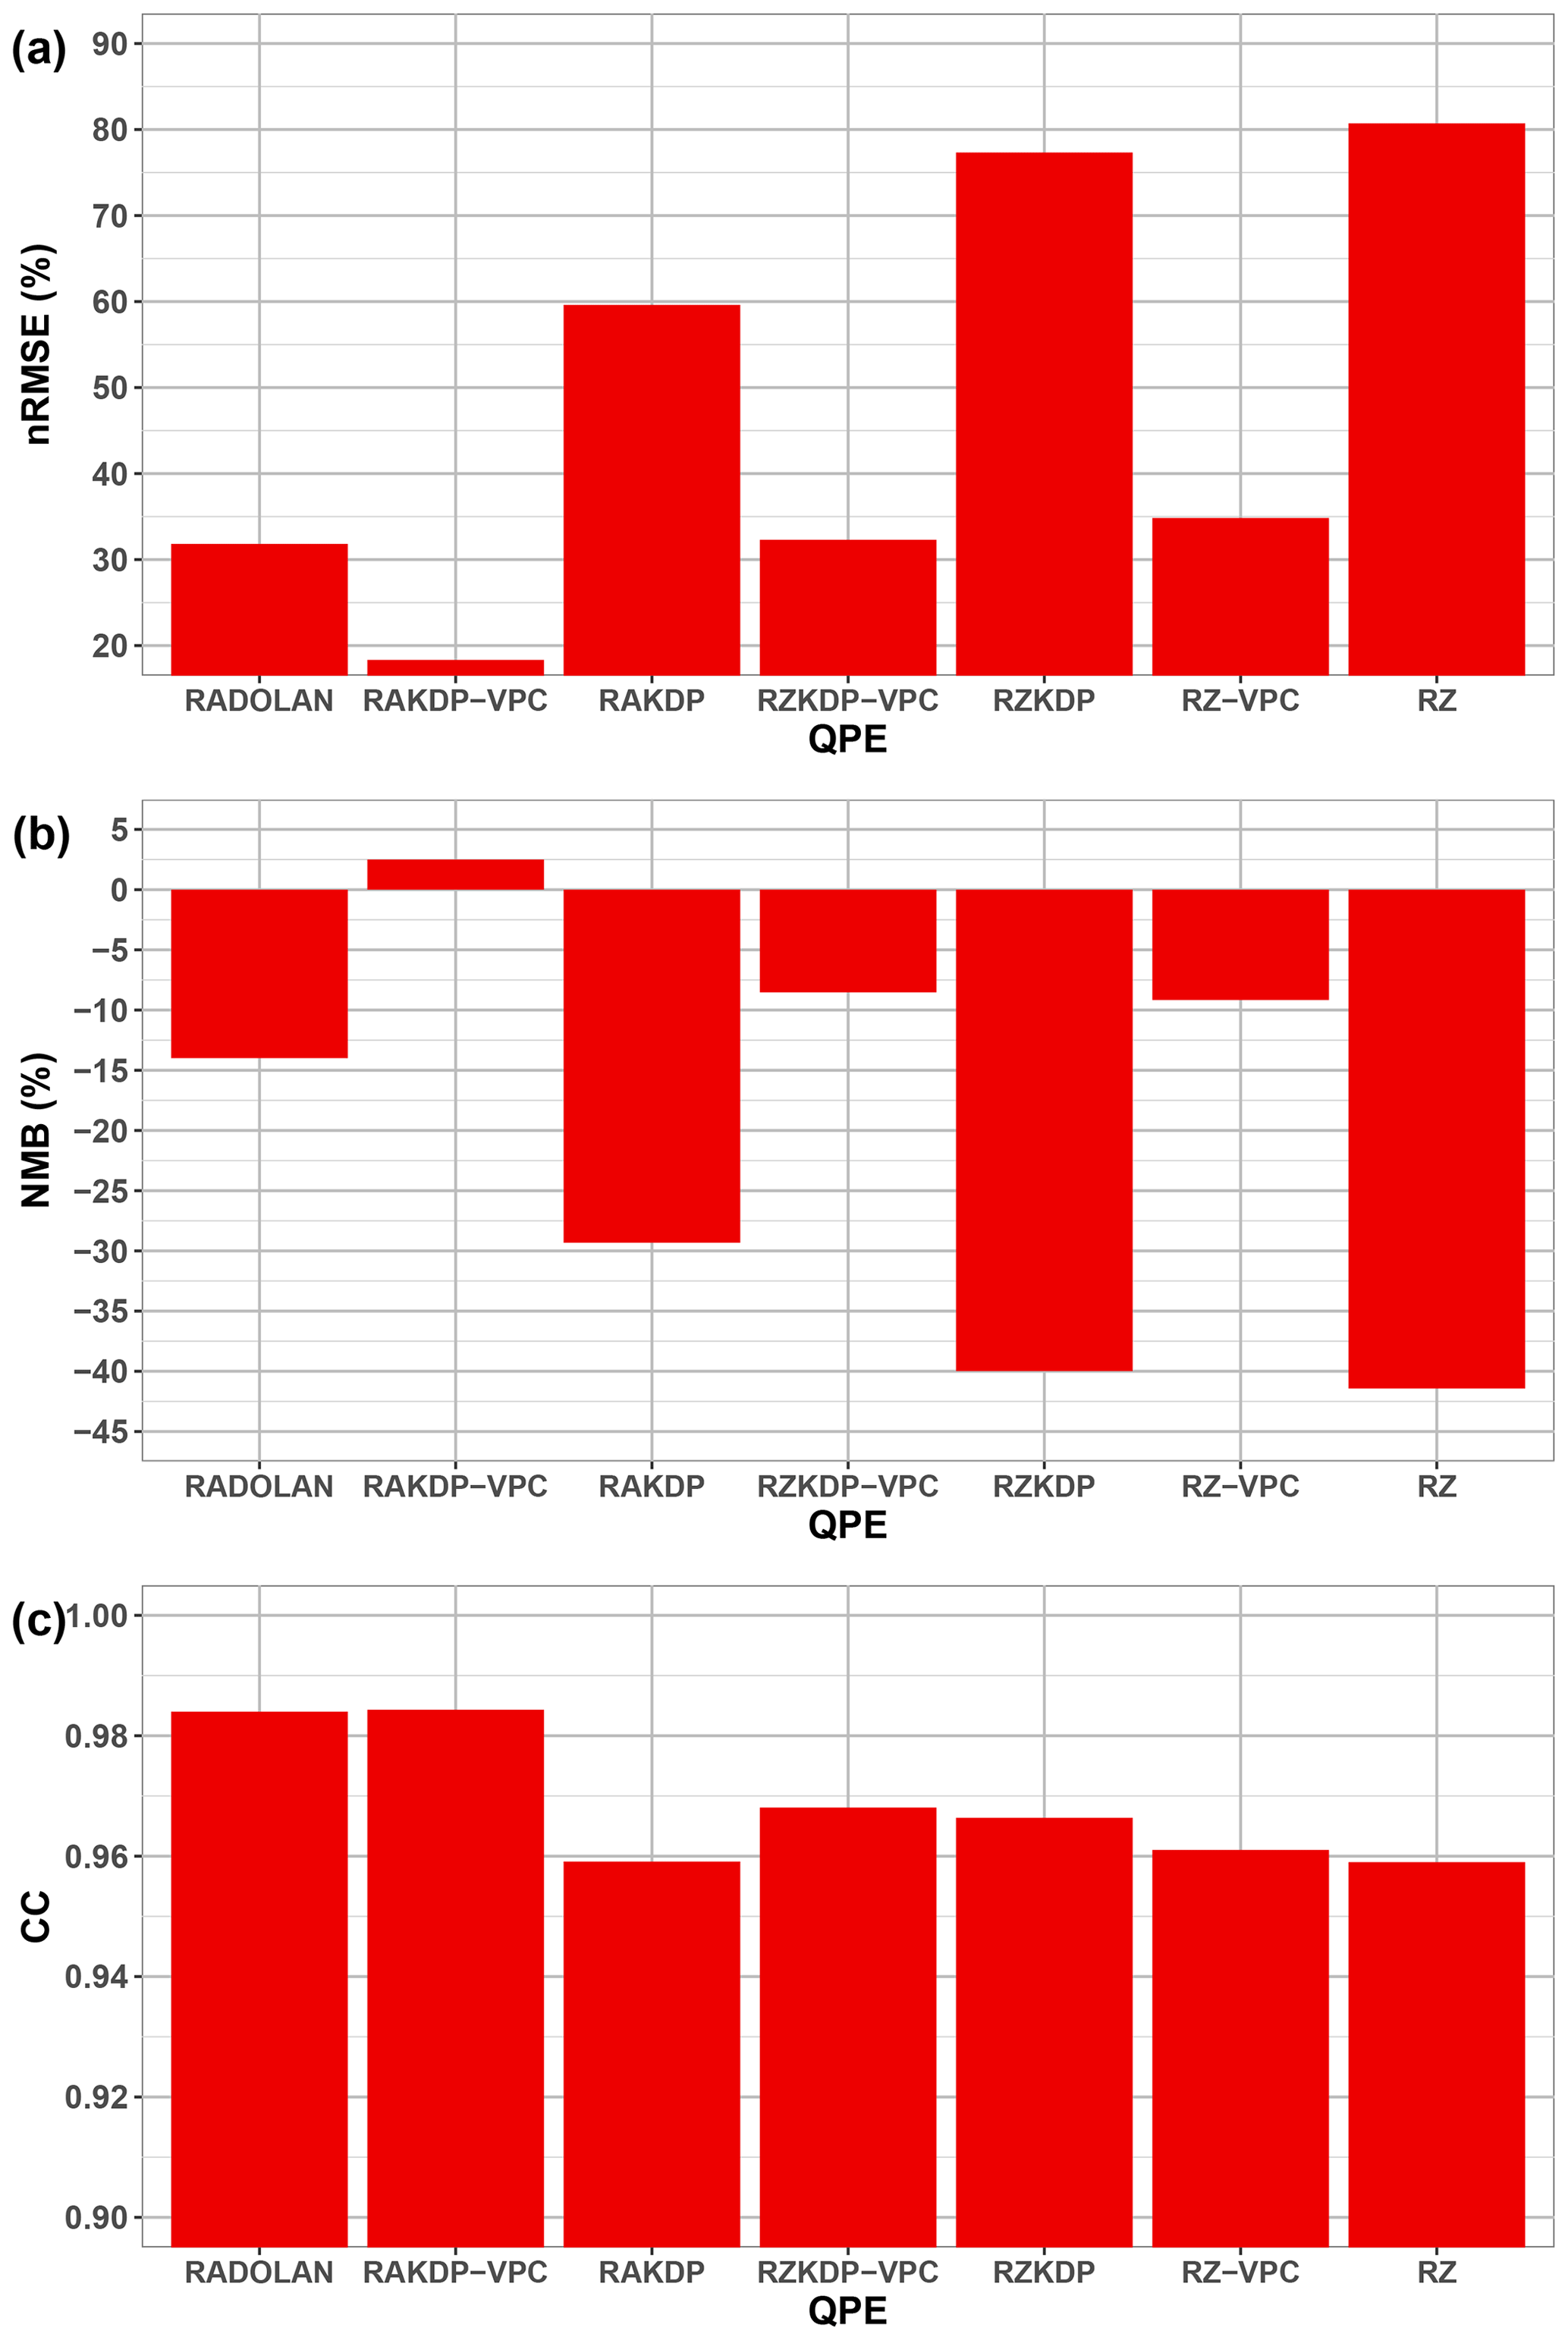
Figure 3Point-scale evaluation scores of radar-based QPEs with respect to measurements from 63 rain gauges (Fig. 2) of total precipitation depth of 14 July 2021.
Conclusions about the agreement between QPE products and rain gauges are similar when we look at the catchment-scale evaluation. Specifically, QPEs based on specific attenuation (A) with corrected vertical profiles for KDP (RAKDP-VPC) outperformed RADOLAN in reproducing estimates from rain gauges (using Thiessen polygons) across the seven catchments (Fig. 4) and reduced relative error from a median of −18 % for RADOLAN to +2 %. With the exception of RAKDP-VPC, radar-based QPE products tended to underestimate catchment-scale precipitation with respect to rain gauges in most cases, confirming the point-scale results (see NMB scores in Fig. 3). However, this comparison underlines the fact that the assessment of QPE products is catchment-dependent. RAKDP-VPC outperformed RADOLAN (with respect to rain gauges) for the catchments drained by the Ahr and the Kyll, whereas they both agreed for the Rur at Monschau. For the catchments drained by the Erft, RAKDP-VPC overestimated precipitation depths with respect to rain gauges, whereas RADOLAN underestimated the total precipitation depth. Finally, using the Thiessen polygon method led to similar catchment-scale precipitation depths compared to the regionalized REGNIE product, except for the Erft at Bliesheim where the Thiessen polygon method underestimated the total precipitation depth with respect to REGNIE.
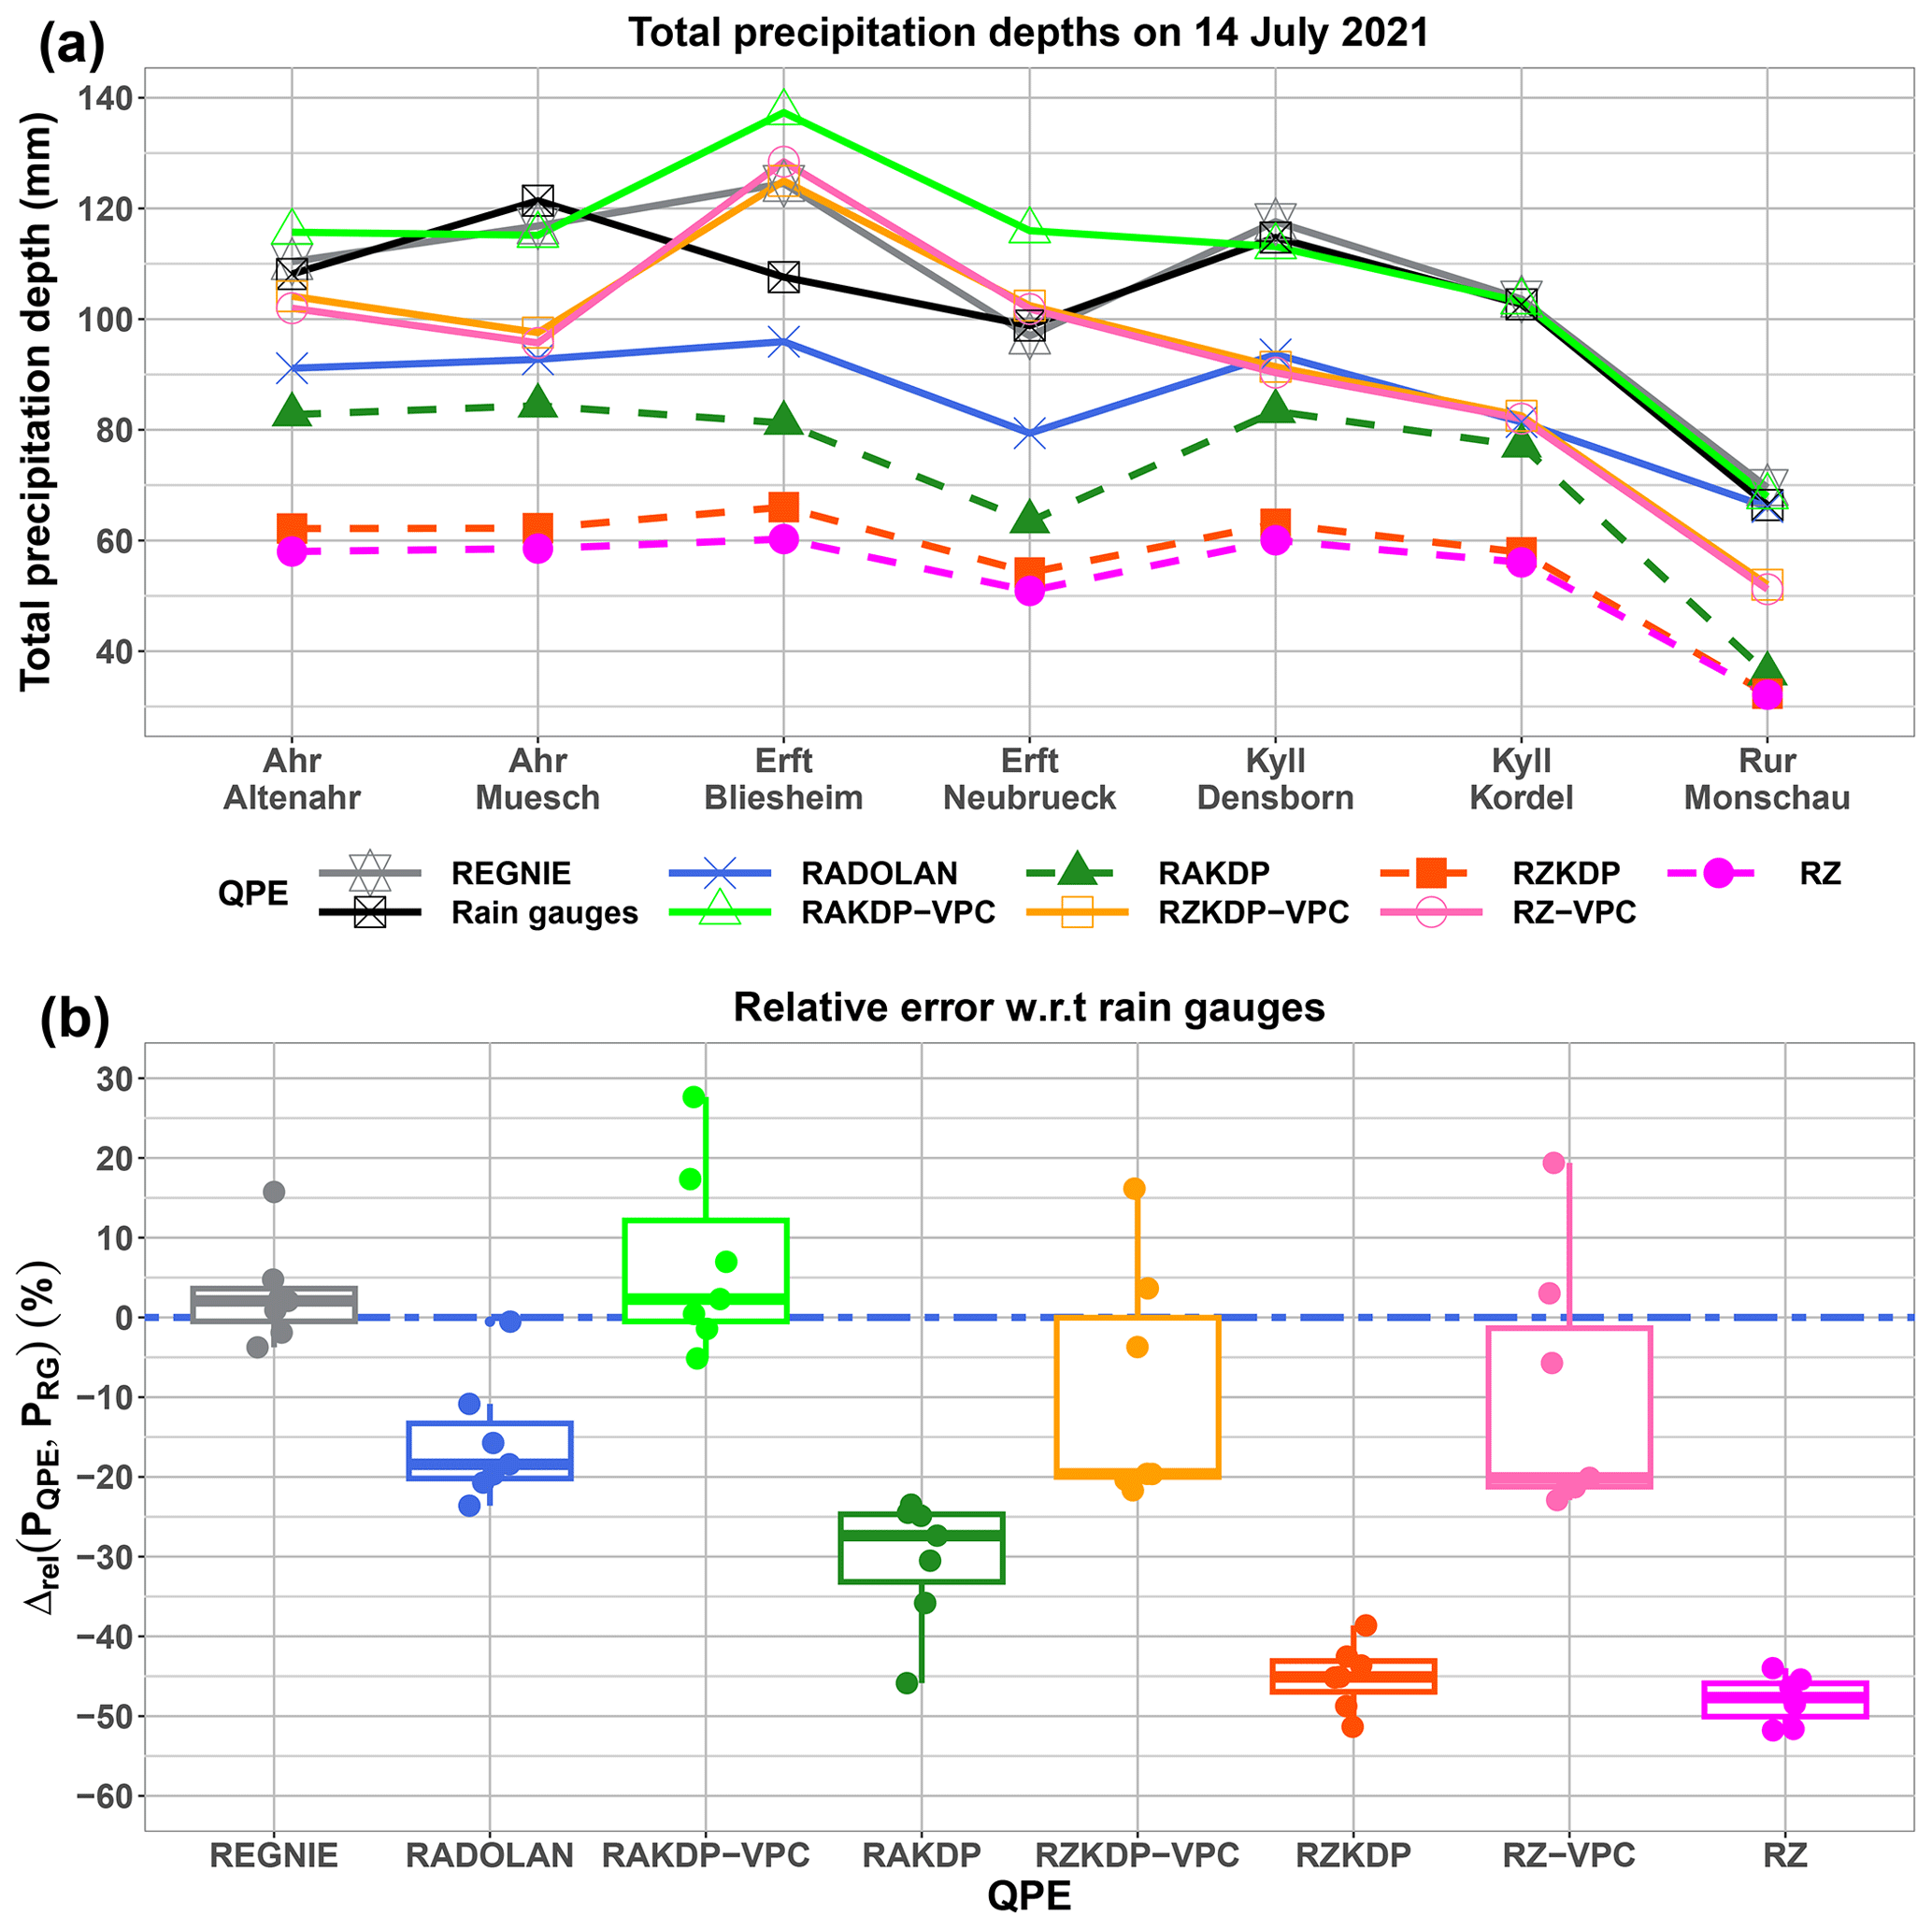
Figure 4(a) Total precipitation depths for 14 July 2021 estimated by rain gauges, REGNIE, and radar-based QPE products. (b) Relative errors in REGNIE and radar-based QPEs with respect to (w.r.t) estimates from rain gauges using Thiessen polygons of the total catchment-scale precipitation depth for 14 July 2021.
4.2 Effect of QPEs and modeling choices on simulated peak flows
The QPE inputs significantly impacted both GR4H and ParFlowCLM model simulations, as illustrated in Fig. 5 for the Ahr at Altenahr. Changing from RADOLAN to RAKDP-VPC led to increased peak flow simulations, which is in line with the catchment-scale comparison (Fig. 4). For this catchment, a relative agreement was reached between the two models as GR4H simulations bracketed peak flow simulations from ParFlowCLM, except for the case when Manning's coefficient was the lowest (LMann). Both the choices of GR4H calibration and Manning's coefficient for ParFlowCLM led to high uncertainty of peak flow simulations. With a high Manning's coefficient, ParFlowCLM succeeded in estimating both the timing and the magnitude of the last recorded peak flow at the catchment outlet (∼330 m3 s−1 at ∼ 19:00 on 14 July), whereas the median simulation of GR4H was delayed with respect to simulated hydrographs by ParFlowCLM. Using a distributed Manning's coefficient (DMann) led to similar ParFlowCLM simulations as when using a uniformly distributed, median Manning's value (MMann) for the Ahr at Altenahr. Finally, all model simulations with both RADOLAN and RAKDP-VPC illustrate how the heavy precipitation event resulted in a record-breaking flood for the Ahr at Altenahr.

Figure 5Simulated hydrographs by GR4H (in green) and ParFlowCLM (with low Manning's coefficient LMann in black, medium Manning's MMann coefficient in grey, high Manning's HMann coefficient in blue, and distributed Manning's coefficient DMann in violet) using (a) RADOLAN and (b) RAKDP-VPC as precipitation input for the Ahr at Altenahr. The green shaded area is delimited by the minimum and maximum values of estimated discharge by GR4H for each time step. The dashed orange line indicates the highest measured peak flow before July 2021. The dashed horizontal red line indicates the last measured flow before measurement devices became unavailable and the dashed vertical red line its timing.
Overall, the ranking of QPE products with respect to the total precipitation depth for the 14 July event was preserved by model simulations for all catchments, as shown in Fig. 6. Model simulations with RADOLAN as input barely reached reported estimates by Mohr et al. (2022) based on relationships between water level and streamflow (dashed red lines in Fig. 6). Using RAKDP-VPC as input, simulations of ParFlowCLM bracketed well the estimates based on hydraulic approaches, with the best estimates obtained with a median or distributed Manning's coefficient (MMann and DMann). GR4H also succeeded in bracketing these estimates except for the Erft at Bliesheim, but most of GR4H peak flow estimates for this catchment were lower than the ones based on hydraulic approaches. Comparing both models, ParFlowCLM simulations with high, medium, and (to a lesser extent) distributed Manning's values were bracketed by those of GR4H except for the largest catchment (Erft at Neubrueck) and the smallest catchment (Rur at Monschau). However, both the distributions of simulated peak flows by GR4H and ParFlowCLM revealed a large uncertainty due to model parameter estimation. For instance, simulated peak flows by GR4H for the Ahr at Altenahr varied between 70 and 420 m3 s−1 using RZ as input, whereas they varied between 390 and 1500 m3 s−1 using RAKDP-VPC as input. For GR4H, analyzing the effect of calibration choices (not shown here) showed that the choice of the calibration period had the greatest impact on the simulated peak flows across the catchments, with higher peak flows obtained when the latest period in time was used for calibration.
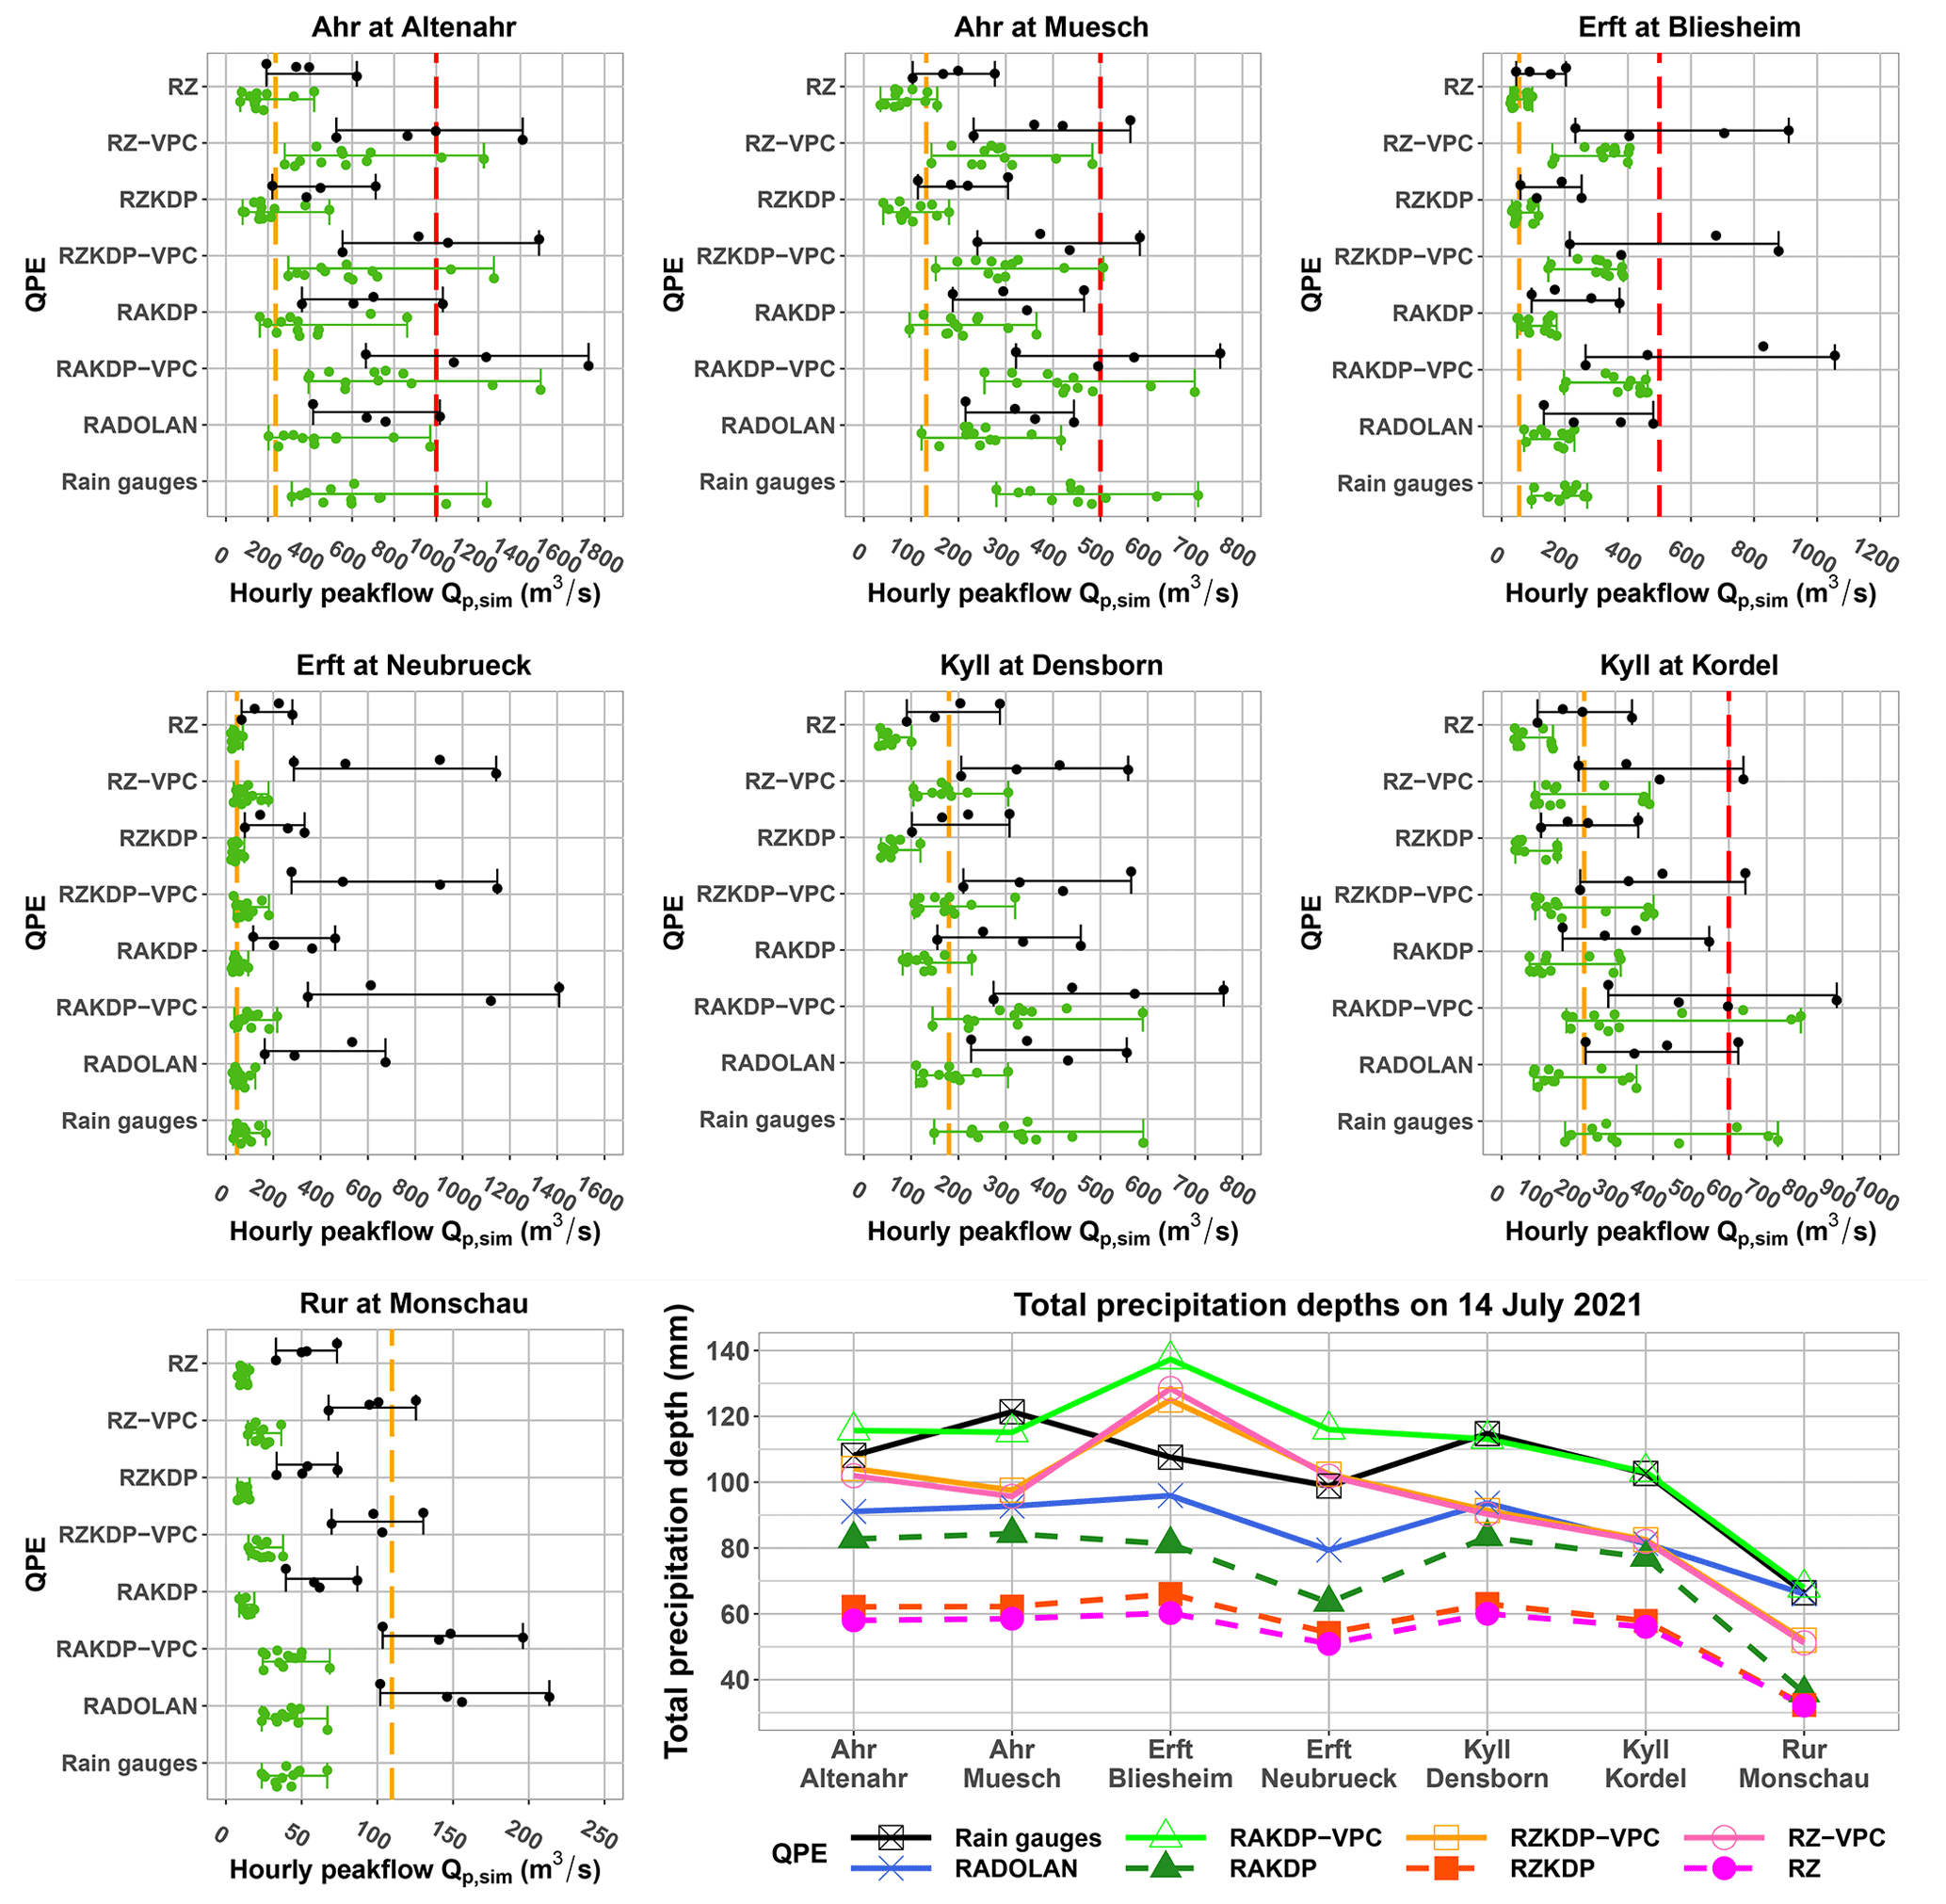
Figure 6Distributions of simulated peak flows by GR4H (in green) and ParFlowCLM (in black) using eight QPE inputs (on y axis) for the seven catchments. Dashed orange lines indicate the highest measured peak flow before July 2021. When available, dashed red lines indicate the peak flow estimates based on relationships between water level depths and discharge taken from Mohr et al. (2022).
The probability of exceeding the highest peak flow ever measured (dashed orange lines in Fig. 6) by model simulations was impacted by QPE inputs for all catchments (Fig. 7). The Ahr catchments and the Erft at Bliesheim showed high probabilities of breaking the records except when using QPE products based on horizontal reflectivity or specific differential phase with no correction of vertical profiles (RZKDP and RZ). Conversely, for the Rur at Monschau, all model simulations from the different QPE products agreed that the event was not heavy enough to surpass the highest measured peak flow. The Kyll catchments and the Erft at Neubrueck showed more conflicting answers to whether there was a high probability (i.e., more than 50 %) that the event peak flow would surpass the highest measured peak flow before the event. This subset of catchments underlines the crucial impact of the input QPE on our interpretation of the severity of the event.
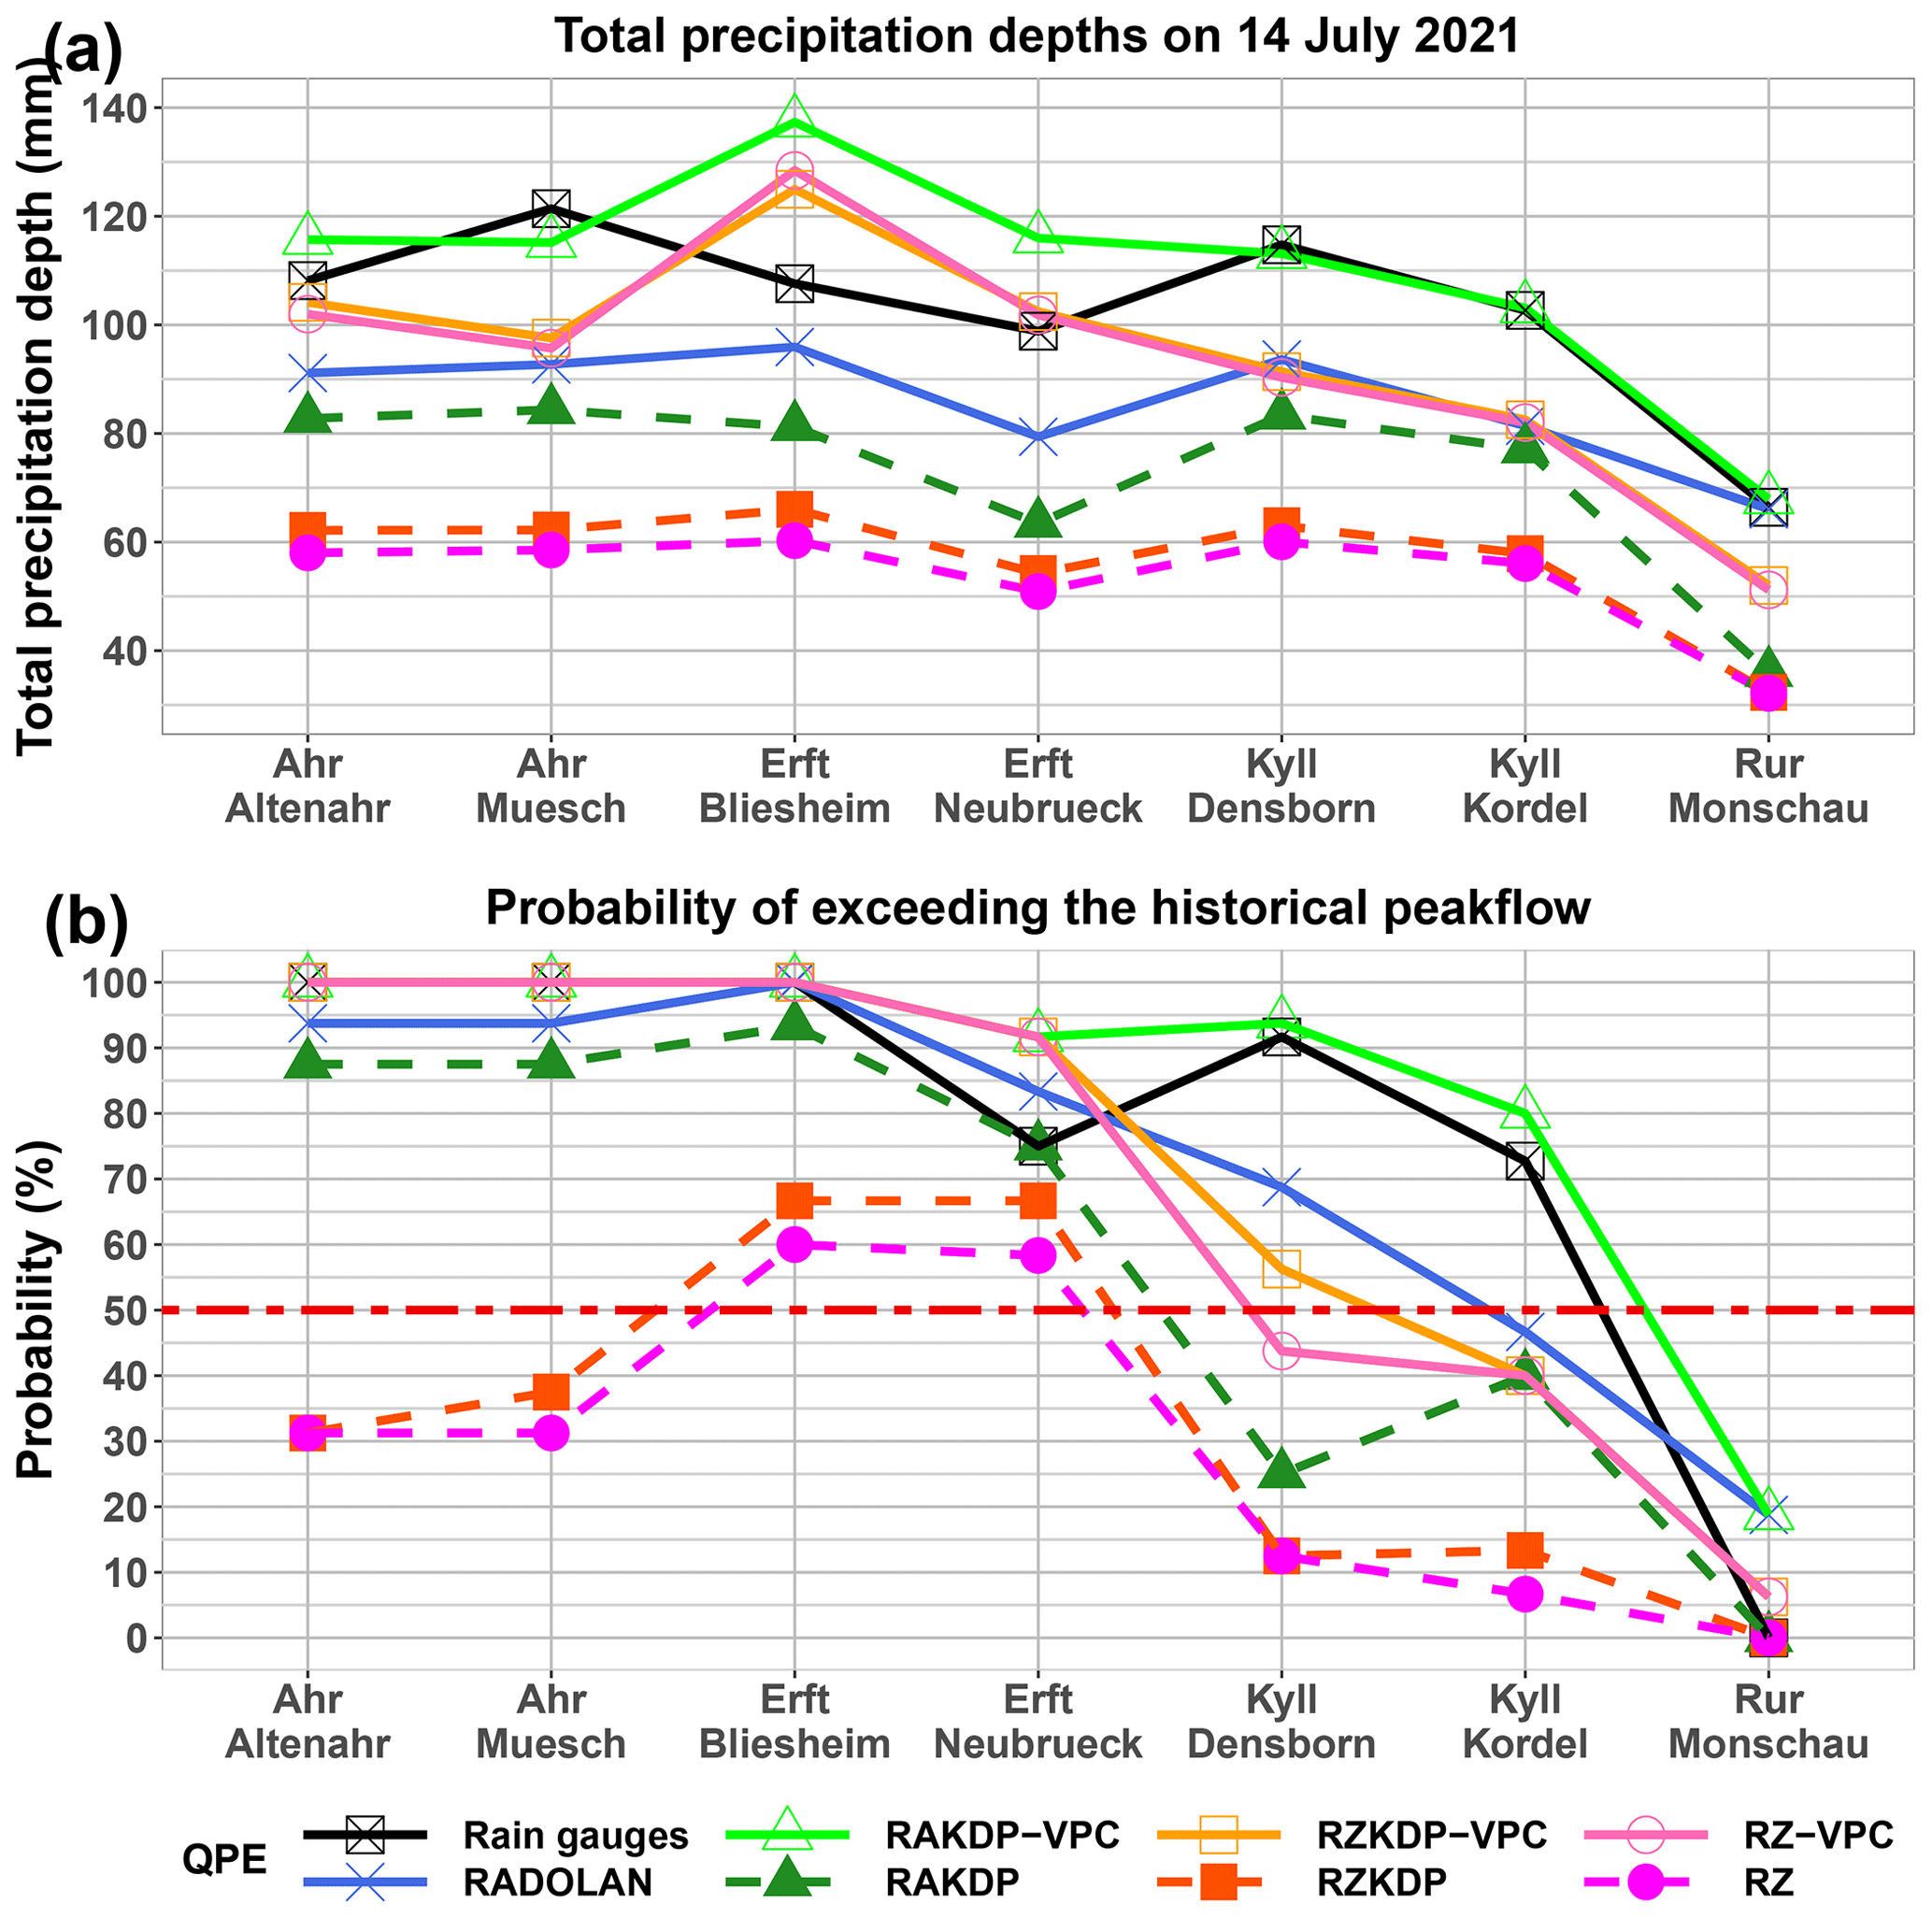
Figure 7(a) Total precipitation depth for 14 July 2021 from the eight QPE products for each of the seven catchments and (b) resulting probabilities of overpassing the highest measured peak flow prior to July 2021.
In general, the differences between simulated peak flows appeared to be more influenced by the choice of the hydrological model than the choice of the QPE input, as shown in Fig. 8. GR4H tended to systematically underestimate the event peak flow relative to ParFlowCLM, and both models disagreed most in the Erft at Neubrueck and the Rur at Monschau. The differences between GR4H and ParFlowCLM were generally independent of the QPE input (Fig. 8a). Conversely, replacing RADOLAN with any other QPE led to increases in simulated peak flows for all catchments except for the Rur at Monschau and the catchments drained by the Kyll, with median errors closer to zero compared to the distributions of errors between GR4H and ParFlowCLM (Fig. 8b). Both hydrological models showed similar median errors due to differences between RADOLAN and the other QPE products, with a larger variability in peak flows estimated by GR4H compared to ParFlowCLM, except for the Erft at Neubrueck.
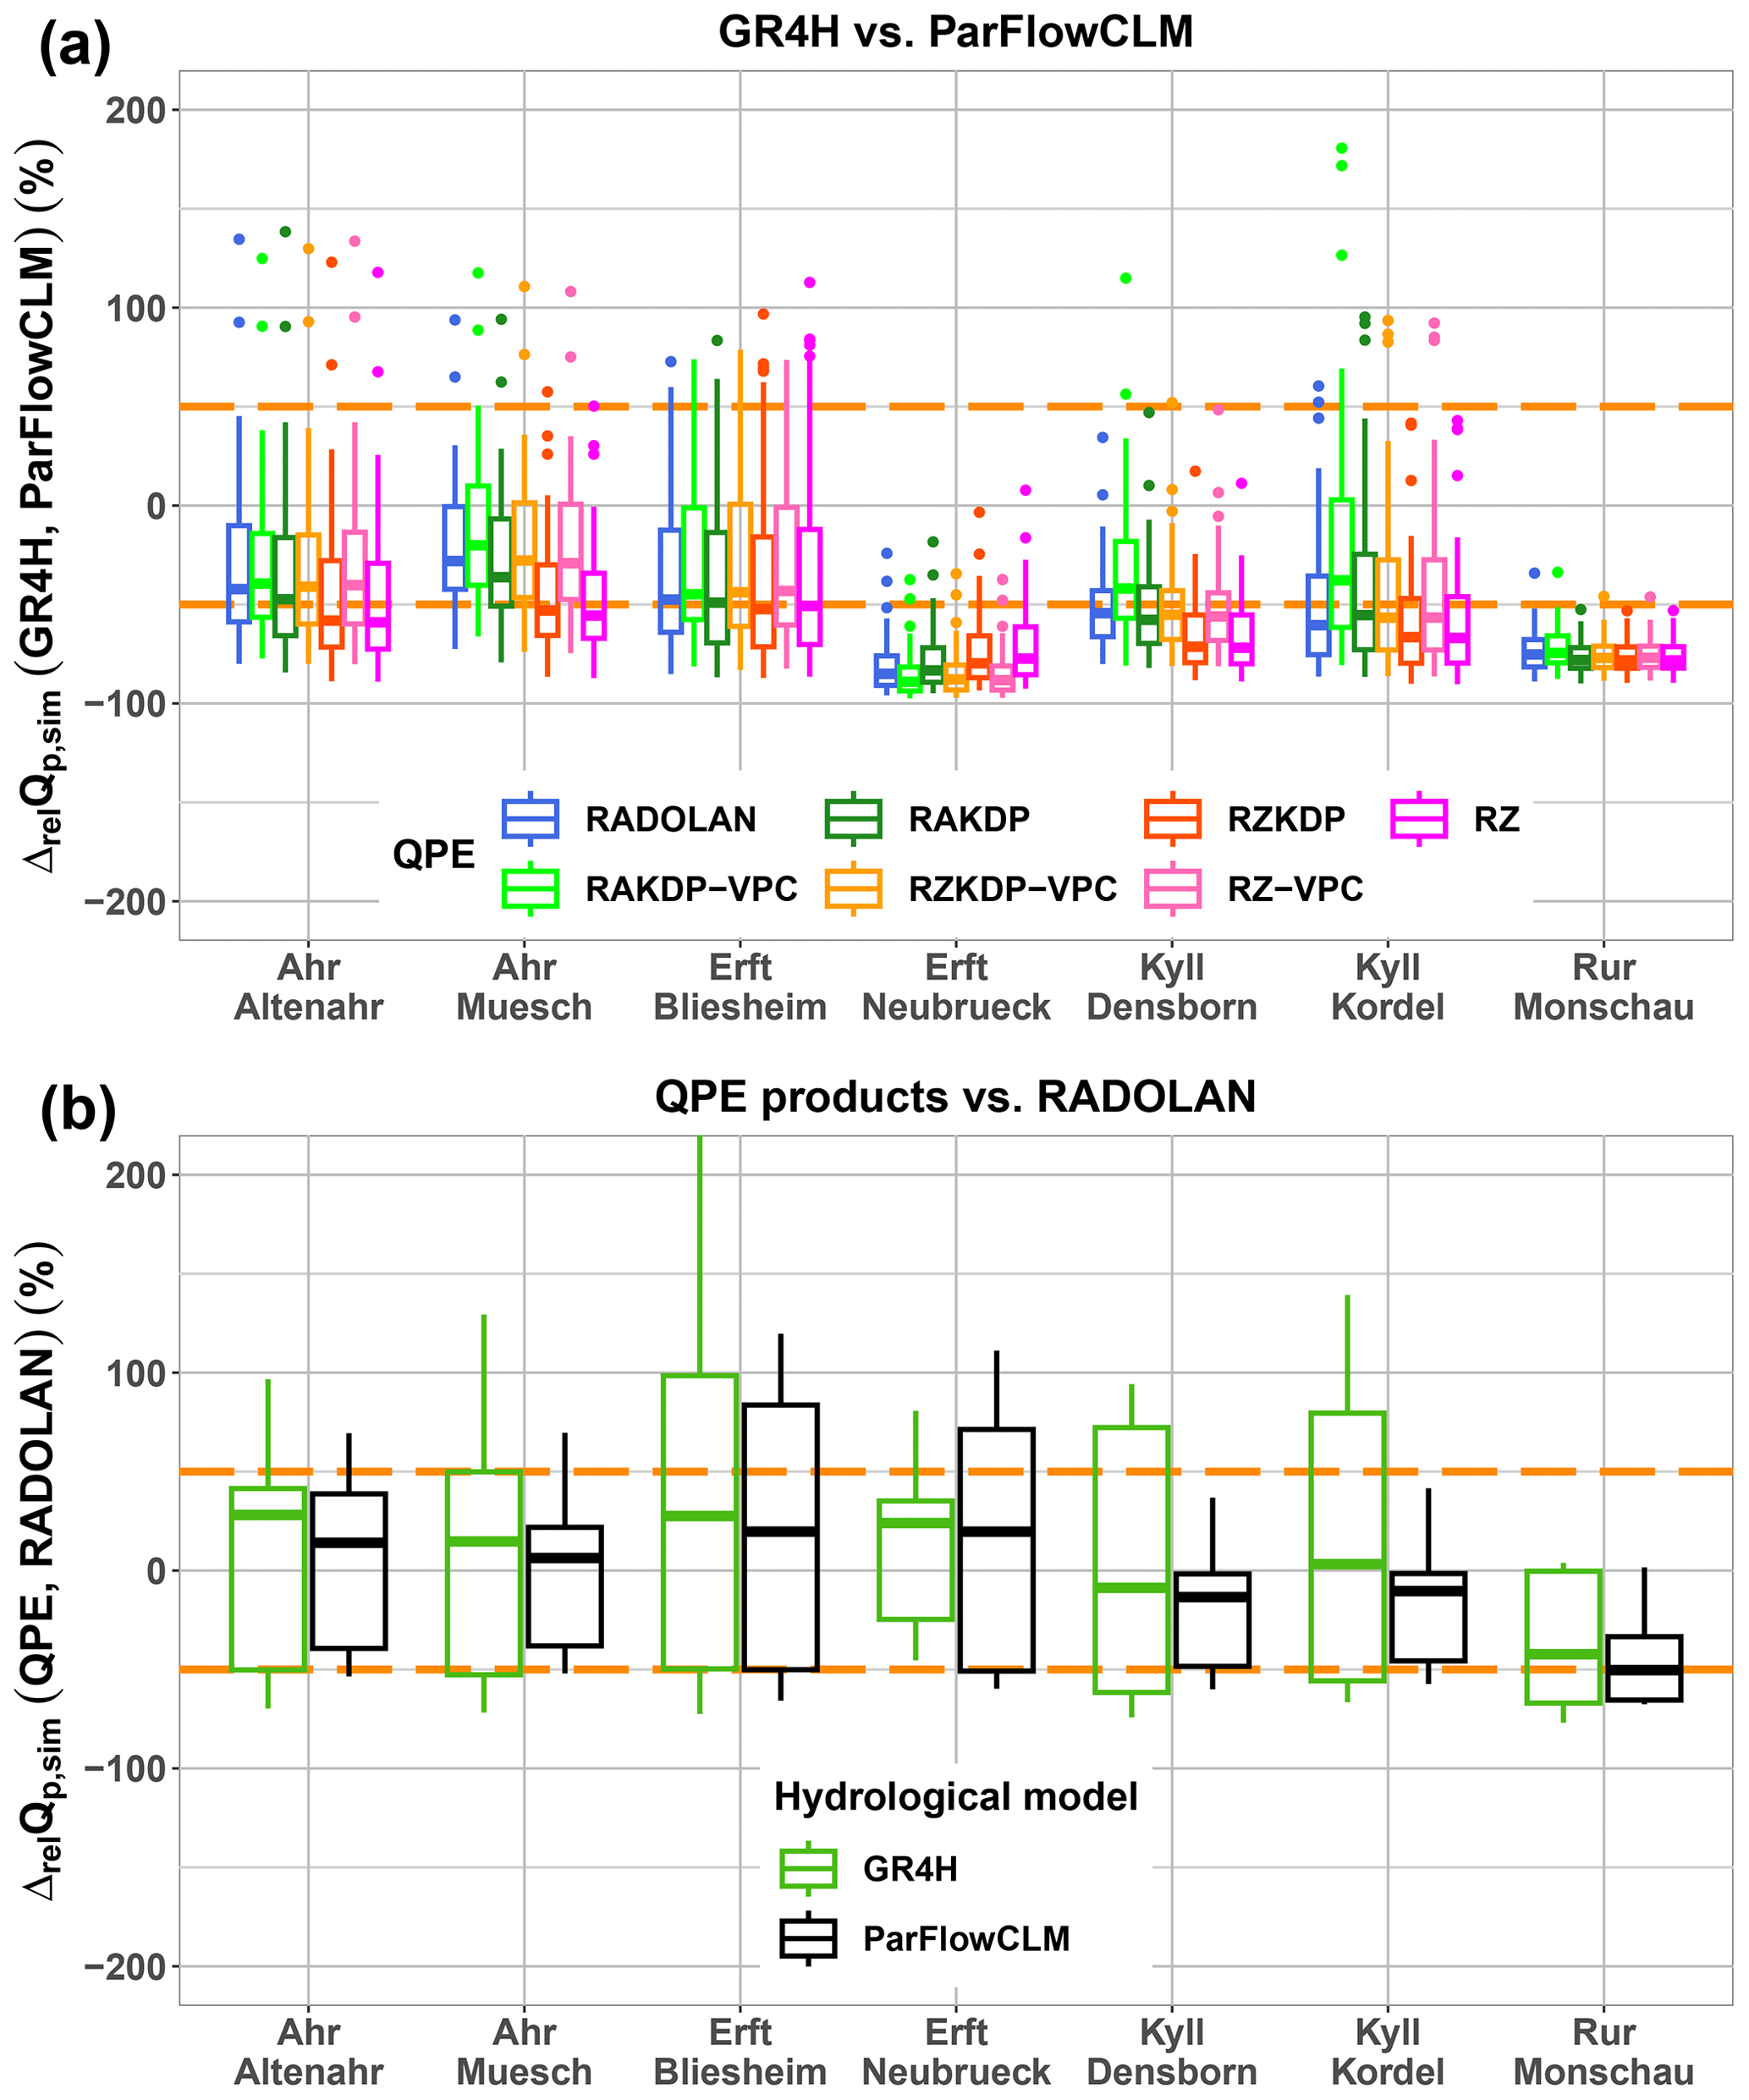
Figure 8Relative errors in simulated peak flow due to (a) applying GR4H instead of ParFlowCLM across all radar-based QPE products and (b) replacing RADOLAN by any of the remaining seven (or six for ParFlowCLM) hourly QPE products (Table 2) as precipitation input for the July 2021 event. Dashed orange lines limit the 50 % relative error region.
5.1 Importance of hydrological, catchment-scale evaluation of QPE products
Our evaluation shows that the radar-based QPEs agreed with rain gauges in terms of spatial pattern (Fig. 2, CC values in Fig. 3), which demonstrates that their use for a denser spatial characterization of precipitation fields is useful. Conversely, all radar-based QPEs still suffer from the important underestimation of heavy precipitation relative to rain gauges for which no vertical profile correction is applied, in particular for QPEs relying only on horizontal reflectivity Z. In a study over four countries, Schleiss et al. (2020) found that radar-based QPE products underestimated heavy rain compared to rain gauges by up to 44 %, and Park et al. (2019) found that the pan-European radar composites OPERA systematically underestimated daily precipitation compared to rain gauges. For the 14 July 2021 event, this underestimation may be explained by intense collision–coalescence processes taking place close to the surface, i.e., mostly below the height levels monitored by the radars. With increasing distance from the site, radars scan at increasing heights. As a consequence, a nearly complete vertical profile of radar-measured variables is available in the vicinity of the different radar sites but not area-wide. Exploiting the spatiotemporal variability in radar profiles using additional information from MRRs, methods of vertical profile correction, and gap-filling observations from an X-band radar helped overcome the deficiencies of radar-based QPEs for our case study, as can be seen in Figs. 2, 3, and 4.
Apart from the need for the correction of vertical profiles, Figs. 2–4 demonstrate the benefit of using polarimetric radar variables, such as specific attenuation and specific differential phase, to improve the QPEs with respect to rain gauges, especially in extreme rainfall events (Gourley et al., 2010). Model simulations by GR4H and especially by the distributed ParFlowCLM (Figs. 5–7) are coherent with the catchment-scale evaluation of Fig. 4, which agreed in our case with the widely applied point-scale evaluation (e.g., Chen et al., 2021; Derin et al., 2019; Schleiss et al., 2020).
The sensitivity of model simulations confirms the dominant impact of QPEs on the performances of the hydrological models (Braud et al., 2010; Oudin et al., 2006), underlining the need for reliable precipitation estimates especially for extreme flooding events. However, the effect of QPEs seemed relatively smaller (but still important) than that of model parameterizations (Fig. 8), and it was variable from one catchment to another for the 14 July event (Figs. 6–7). The large differences between model estimates for a single QPE input reflect how uncertain peak flow estimates can be for such an extreme event (see Table 2 for the Ahr at Altenahr in Kreienkamp et al., 2021). The stronger effect of model parameterizations with respect to QPEs may be due to the inclusiveness of our approach that did not exclude ill-performing parameterizations, especially in the case of ParFlowCLM. Removing these would lead to lower differences due to hydrological models, but this removal needs streamflow measurements for the event, which are unavailable or highly uncertain for our catchment set. The variability in the impact of errors in the QPEs on peak flow simulations indicates that the differences (particularly the improvements) may be filtered out depending on the catchment properties (size and shape), the spatial variability in antecedent moisture conditions, and the precipitation fields (Lin et al., 2018; Pechlivanidis et al., 2016; Pokhrel and Gupta, 2011; Saulnier and Le Lay, 2009). Antecedent soil moisture conditions may be a high factor in the variability in the impact of QPEs on the severity of the floods from one catchment to another, as the 10 d (5 d) antecedent precipitations varied from 40 to 66 mm (20 to 44 mm) over the seven catchments. Antecedent soil moisture conditions that are high enough can indeed lead to extreme flooding events even when the precipitation amount is not relatively extreme (with respect to historical events), as shown by Schröter et al. (2015) for the exceptional June 2013 flooding event in Germany.
5.2 (Dis-)agreement of contrasting modeling approaches
Earlier studies focused on the difference between a distributed and a lumped approach while retaining the same complexity of process representation (e.g., Cole and Moore, 2009; Huang et al., 2019; Lobligeois et al., 2014). Our study compared contrasting modeling approaches in terms of both spatial and process representation. This follows the study of Poméon et al. (2020) that compared the 3D distributed ParFlow with the calibrated HBV model for flash flood events in Germany. Poméon et al. (2020) found that parameter estimation of HBV was highly dependent on extreme flooding events in the calibration period to achieve similar performances to ParFlow. In our study, all previous extreme floods were kept in the calibration time series, but the strongest peak flow obtained with ParFlowCLM was still higher than the range of peak flows simulated with GR4H. The non-bracketed, high ParFlowCLM simulations associated with a low Manning's coefficient (LMann) may suggest that the tested value is too low, but it is still within the range of Manning's values from guidance documents (Lumbroso and Gaume, 2012). In addition, using a coarse model resolution should be compensated by lower Manning's coefficient values (Schalge et al., 2019). The large uncertainty due to Manning's coefficient is perhaps accentuated by the nature of the relationship between the coefficient and the discharge, but it is still here a lower bound since uncertainty for other parameters (hydraulic conductivity, van Genuchten parameters) was not included. This underlines that even the physically based approach does not completely overcome the issue of parameter estimation, particularly for extreme and record-breaking floods. Finally, the use of distributed Manning's roughness led to simulations that were all bracketed by the ParFlowCLM simulations with uniformly distributed values.
GR4H peak flows were delayed compared to the ones simulated by ParFlowCLM, which is perhaps related to the delaying effect of the unit hydrographs of GR4H. The base time of these unit hydrographs is lumped (i.e., catchment-averaged) and calibrated on long-term discharge records, which implies that it reflects a smoother response than the exceptional development of the July 2021 flooding event. Moreover, GR4H significantly underestimated peak flow relative to ParFlowCLM for the Erft at Neubrueck and the Rur at Monschau. In the case of the Erft at Neubrueck, we suspect that these differences are related to the strong anthropogenic intervention (flood protection systems, dominant agricultural activity, or the existence of large mining pits with significant water-holding capacity; see Table 1 and Staatliches Umweltamt Köln, 2005) which could be learned by GR4H from the calibration process on historical observations, in contrast to ParFlowCLM that does not explicitly account for such anthropogenic effects. For the Rur at Monschau, the differences between simulated hydrographs by ParFlowCLM and GR4H may be due to the existence of small reservoirs at the upstream. These differences would be better understood if GR4H parameters had been estimated using information from hourly discharge measurements. Finally, the analysis of the effect of the calibration choices on GR4H simulations (not shown here) highlighted the effect of the hydroclimatic specificities of the calibration period on the model simulations for unprecedented or future events (Brigode et al., 2013).
Accounting for the 3D soil and subsoil heterogeneities in the representation of hydrological processes allows ParFlowCLM to represent well the runoff generation by overland flow and increased interflow in the upstream steep part of the study catchments, but it would be improved by including anthropogenic effects on hydrological processes that had a large impact on the flood generation mechanisms for this event (Mohr et al., 2022). The structure of ParFlowCLM allows us to couple the complex hydrological and morphodynamic processes (sediment and debris transport, bank erosion, and developing landslides) that nonlinearly interacted with the flood propagation and river morphology, increasing the destructiveness of the event.
Due to the low computational cost of the GR4H implementation, estimating the uncertainty of its peak flow simulations was less demanding than with ParFlowCLM. However, using the extreme, physically possible values of Manning's parameter allowed ParFlowCLM to simulate higher peak flows than the calibrated model, suggesting that it could provide a more accurate range of possible peak flow values for unprecedented events, unlike the calibrated GR4H. One could combine both models by running a few ParFlowCLM simulations, use GR4H with various calibration approaches to map the uncertainty in peak flow estimation from different behavioral model parameters and different climatic inputs, and then transfer this uncertainty to ParFlowCLM simulations. This would, however, require exhaustive analysis of the agreement between ParFlowCLM and GR4H for a wide variety of catchments.
5.3 Study limitations
Our study has several limitations. First, focusing on only one event for a few catchments makes our conclusions event- and location-dependent. A large sample approach (such as in Raimonet et al., 2017; Singh and Reza Najafi, 2020) would help analyze the interplay between QPEs and contrasting modeling philosophies not only for extreme event purposes but also for overall long-term hydrological needs. Second, the absence of reliable discharge measurements for the catastrophic event limits our model evaluation, but our model simulations could be used as estimates of the severity of the flooding event despite the large uncertainty in simulated peak flows. Third, our study overlooked the effect of distributed antecedent saturation on the evaluation of QPEs, which would help explain the differences between the catchments under humid antecedent conditions. Fourth, the accuracy of the parameter estimation in our study could be improved by investigating the uncertainty related to other distributed parameters (such as hydraulic conductivity; Poméon et al., 2020) or using hourly discharge streamflows for the GR4H calibration.
The July 2021 events in western Germany questioned the ability of our current methods of precipitation estimation and hydrological modeling to correctly anticipate the severity of the floods. We compared state-of-the-art radar-based QPEs and two contrasting hydrological models, the conceptual and lumped GR4H with the 3D-distributed and physically based ParFlowCLM, to analyze how the choices of QPEs or hydrological modeling approach impacted the simulated peak flows. We concluded the following.
-
Better characterization of the vertical profiles of radar variables led to significant improvements in radar-based QPEs for the extreme event of 14 July 2021 with respect to rain gauges. These improvements were confirmed at both the point scale and the catchment scale.
-
Errors in the QPEs impacted both GR4H and ParFlowCLM peak flow estimates, but their impact on the severity of the flood (i.e., surpassing the highest historically measured peak flow) varied from one catchment to another.
-
A large uncertainty characterized the peak flow simulations by both GR4H and ParFlowCLM, but they agreed in detecting the historical thresholds in most catchments with low anthropogenic influence.
As future work, a larger time span with more extreme events are to be considered to confirm these conclusions. A correction of vertical profiles of radar variables is to be implemented for further improvements in the accuracy of the QPE products. A modeling framework that combines ParFlowCLM and GR4H to better anticipate never-before-seen events is to be designed to benefit from the advantages of both modeling philosophies.
Both ParFlowCLM (https://doi.org/10.5281/zenodo.3555297; Smith et al., 2019) and GR4H (https://hydrogr.github.io/airGR/, last access: 9 January 2023; Coron et al., 2017; https://doi.org/10.1016/j.envsoft.2017.05.002) codes are available in public repositories. All original data are public, except for the QPE products generated for the study, which can be made available upon reasonable request to the authors.
MS co-designed and conducted all of the experiments, produced all of the figures, and carried out the writing of the original manuscript and its revision. CFP closely supervised and co-designed the experiments. AB designed the ParFlowCLM setup and assisted MS in its application for this study. JYC produced the state-of-the-art QPE products under the supervision of ST. CFP, ST, and SK acquired the project funding. All authors participated in the analysis and critique of the results and the revision of the manuscript.
The contact author has declared that none of the authors has any competing interests.
Publisher's note: Copernicus Publications remains neutral with regard to jurisdictional claims in published maps and institutional affiliations.
The authors gratefully acknowledge the Earth System Modelling Project (ESM) for funding this work by providing computing time for ParFlowCLM runs on the ESM partition of the supercomputer JUWELS at the Jülich Supercomputing Centre (JSC).
This study is part of the RealPEP (Near-Realtime Quantitative Precipitation Estimation and Prediction
https://www2.meteo.uni-bonn.de/realpep/doku.php, last access: 9 January 2023) P4 project (Evaluation of QPE and QPN improvements in a flash flood nowcasting framework with data assimilation), funded by the Deutsche Forschungsgemeinschaft (German Research Foundation; grant no. 2589).
The article processing charges for this open-access publication were covered by the Forschungszentrum Jülich.
This paper was edited by Heidi Kreibich and reviewed by two anonymous referees.
Anagnostou, M. N., Kalogiros, J., Anagnostou, E. N., Tarolli, M., Papadopoulos, A., and Borga, M.: Performance evaluation of high-resolution rainfall estimation by X-band dual-polarization radar for flash flood applications in mountainous basins, J. Hydrol., 394, 4–16, https://doi.org/10.1016/j.jhydrol.2010.06.026, 2010.
Anagnostou, M. N., Nikolopoulos, E. I., Kalogiros, J., Anagnostou, E. N., Marra, F., Mair, E., Bertoldi, G., Tappeiner, U., and Borga, M.: Advancing Precipitation Estimation and Streamflow Simulations in Complex Terrain with X-Band Dual-Polarization Radar Observations, Remote Sens., 10, 1258, https://doi.org/10.3390/rs10081258, 2018.
Anctil, F. and Ramos, M.-H.: Verification Metrics for Hydrological Ensemble Forecasts, in: Handbook of Hydrometeorological Ensemble Forecasting, edited by: Duan, Q., Pappenberger, F., Thielen, J., Wood, A., Cloke, H. L., and Schaake, J. C., Springer, Berlin, Heidelberg, 1–30, https://doi.org/10.1007/978-3-642-40457-3_3-1, 2017.
Anquetin, S., Yates, E., Ducrocq, V., Samouillan, S., Chancibault, K., Davolio, S., Accadia, C., Casaioli, M., Mariani, S., Ficca, G., Gozzini, B., Pasi, F., Pasqui, M., Garcia, A., Martorell, M., Romero, R., and Chessa, P.: The 8 and 9 September 2002 flash flood event in France: a model intercomparison, Nat. Hazards Earth Syst. Sci., 5, 741–754, https://doi.org/10.5194/nhess-5-741-2005, 2005.
Asante, K. O., Artan, G. A., Pervez, M. S., Bandaragoda, C., and Verdin, J. P.: Technical Manual for the Geospatial Stream Flow Model (GeoSFM), Technical Manual for the Geospatial Stream Flow Model (GeoSFM), U.S. Geological Survey, Open-File Report 2007-1441, https://doi.org/10.3133/ofr20071441, 2008.
Berne, A. and Krajewski, W. F.: Radar for hydrology: Unfulfilled promise or unrecognized potential?, Adv. Water Resour., 51, 357–366, https://doi.org/10.1016/j.advwatres.2012.05.005, 2013.
BMI: Bericht zur Hochwasserkatastrophe 2021: Katastrophenhilfe, Wiederaufbau und Evaluierungsprozesse, Bundesministerium des Innern und für Heimat, Berlin, Germany, https://www.bmi.bund.de/SharedDocs/downloads/DE/veroeffentlichungen/2022/abschlussbericht-hochwasserkatastrophe.pdf;jsessionid=98D3F1ADE38213E64E2F569C09B5F923.1_cid332?__blob=publicationFile&v=1 last access: 21 December 2022.
Borga, M., Boscolo, P., Zanon, F., and Sangati, M.: Hydrometeorological Analysis of the 29 August 2003 Flash Flood in the Eastern Italian Alps, J. Hydrometeorol., 8, 1049–1067, https://doi.org/10.1175/JHM593.1, 2007.
Boushaki, F. I., Hsu, K.-L., Sorooshian, S., Park, G.-H., Mahani, S., and Shi, W.: Bias Adjustment of Satellite Precipitation Estimation Using Ground-Based Measurement: A Case Study Evaluation over the Southwestern United States, J. Hydrometeorol., 10, 1231–1242, https://doi.org/10.1175/2009JHM1099.1, 2009.
Braud, I., Roux, H., Anquetin, S., Maubourguet, M.-M., Manus, C., Viallet, P., and Dartus, D.: The use of distributed hydrological models for the Gard 2002 flash flood event: Analysis of associated hydrological processes, J. Hydrol., 394, 162–181, https://doi.org/10.1016/j.jhydrol.2010.03.033, 2010.
Brigode, P., Oudin, L., and Perrin, C.: Hydrological model parameter instability: A source of additional uncertainty in estimating the hydrological impacts of climate change?, J. Hydrol., 476, 410–425, https://doi.org/10.1016/j.jhydrol.2012.11.012, 2013.
Chen, H., Cifelli, R., and White, A.: Improving Operational Radar Rainfall Estimates Using Profiler Observations Over Complex Terrain in Northern California, IEEE T. Geosci. Remote, 58, 1821–1832, https://doi.org/10.1109/TGRS.2019.2949214, 2020.
Chen, J.-Y., Trömel, S., Ryzhkov, A., and Simmer, C.: Assessing the Benefits of Specific Attenuation for Quantitative Precipitation Estimation with a C-Band Radar Network, J. Hydrometeorol., 22, 2617–2631, https://doi.org/10.1175/JHM-D-20-0299.1, 2021.
Chen, J.-Y., Reinoso-Rondinel, R., Trömel, S., Simmer, C., and Ryzhkov, A.: A radar-based quantitative precipitation estimation algorithm to overcome the impact of vertical gradients of warm-rain precipitation: the flood in western Germany on 14 July 2021, J. Hydrometeorol., online first, https://doi.org/10.1175/JHM-D-22-0111.1, 2022.
Cole, S. J. and Moore, R. J.: Distributed hydrological modelling using weather radar in gauged and ungauged basins, Adv. Water Resour., 32, 1107–1120, https://doi.org/10.1016/j.advwatres.2009.01.006, 2009.
Coron, L., Thirel, G., Delaigue, O., Perrin, C., and Andréassian, V.: The suite of lumped GR hydrological models in an R package, Environ. Modell. Softw., 94, 166–171, https://doi.org/10.1016/j.envsoft.2017.05.002, 2017 (code available at: https://hydrogr.github.io/airGR/, last access: 9 January 2023).
Cunha, L. K., Smith, J. A., Krajewski, W. F., Baeck, M. L., and Seo, B.-C.: NEXRAD NWS Polarimetric Precipitation Product Evaluation for IFloodS, J. Hydrometeorol., 16, 1676–1699, https://doi.org/10.1175/JHM-D-14-0148.1, 2015.
Dai, Q. and Han, D.: Exploration of discrepancy between radar and gauge rainfall estimates driven by wind fields, Water Resour. Res., 50, 8571–8588, https://doi.org/10.1002/2014WR015794, 2014.
Derin, Y., Anagnostou, E., Anagnostou, M., and Kalogiros, J.: Evaluation of X-Band Dual-Polarization Radar-Rainfall Estimates from OLYMPEX, J. Hydrometeorol., 20, 1941–1959, https://doi.org/10.1175/JHM-D-19-0097.1, 2019.
Deutsche Welle: German floods: Climate change made heavy rains in Europe more likely, https://www.dw.com/en/german-floods-climate-change/a-58959677 (last access: 21 December 2022), 2021.
Diederich, M., Ryzhkov, A., Simmer, C., Zhang, P., and Trömel, S.: Use of Specific Attenuation for Rainfall Measurement at X-Band Radar Wavelengths. Part I: Radar Calibration and Partial Beam Blockage Estimation, J. Hydrometeorol., 16, 487–502, https://doi.org/10.1175/JHM-D-14-0066.1, 2015a.
Diederich, M., Ryzhkov, A., Simmer, C., Zhang, P., and Trömel, S.: Use of Specific Attenuation for Rainfall Measurement at X-Band Radar Wavelengths. Part II: Rainfall Estimates and Comparison with Rain Gauges, J. Hydrometeorol., 16, 503–516, https://doi.org/10.1175/JHM-D-14-0067.1, 2015b.
Dottori, F., Szewczyk, W., Ciscar, J.-C., Zhao, F., Alfieri, L., Hirabayashi, Y., Bianchi, A., Mongelli, I., Frieler, K., Betts, R. A., and Feyen, L.: Increased human and economic losses from river flooding with anthropogenic warming, Nat. Clim. Change, 8, 781–786, https://doi.org/10.1038/s41558-018-0257-z, 2018.
Dougherty, E. and Rasmussen, K. L.: Changes in Future Flash Flood–Producing Storms in the United States, J. Hydrometeorol., 21, 2221–2236, https://doi.org/10.1175/JHM-D-20-0014.1, 2020.
Dumont, M., Saadi, M., Oudin, L., Lachassagne, P., Nugraha, B., Fadillah, A., Bonjour, J.-L., Muhammad, A., Hendarmawan, Dörfliger, N., and Plagnes, V.: Assessing rainfall global products reliability for water resource management in a tropical volcanic mountainous catchment, J. Hydrol. Reg. Stud., 40, 101037, https://doi.org/10.1016/j.ejrh.2022.101037, 2022.
Duscher, K., Günther, A., Richts, A., Clos, P., Philipp, U., and Struckmeier, W.: The GIS layers of the “International Hydrogeological Map of Europe 1:1,500,000” in a vector format, Hydrogeol. J., 23, 1867–1875, https://doi.org/10.1007/s10040-015-1296-4, 2015.
Edijatno, Nascimento, N. de O., Yang, X., Makhlouf, Z., and Michel, C.: GR3J: a daily watershed model with three free parameters, Hydrolog. Sci. J., 44, 263–277, https://doi.org/10.1080/02626669909492221, 1999.
Emmanuel, I., Payrastre, O., Andrieu, H., and Zuber, F.: A method for assessing the influence of rainfall spatial variability on hydrograph modeling. First case study in the Cevennes Region, southern France, J. Hydrol., 555, 314–322, https://doi.org/10.1016/j.jhydrol.2017.10.011, 2017.
Ficchì, A., Perrin, C., and Andréassian, V.: Hydrological modelling at multiple sub-daily time steps: Model improvement via flux-matching, J. Hydrol., 575, 1308–1327, https://doi.org/10.1016/j.jhydrol.2019.05.084, 2019.
Fowler, H. J., Lenderink, G., Prein, A. F., Westra, S., Allan, R. P., Ban, N., Barbero, R., Berg, P., Blenkinsop, S., Do, H. X., Guerreiro, S., Haerter, J. O., Kendon, E. J., Lewis, E., Schaer, C., Sharma, A., Villarini, G., Wasko, C., and Zhang, X.: Anthropogenic intensification of short-duration rainfall extremes, Nat. Rev. Earth Environ., 2, 107–122, https://doi.org/10.1038/s43017-020-00128-6, 2021.
GDV: 2021 teuerstes Naturgefahrenjahr für die Versicherer, Gesamtverband der Deutschen Versicherungswirtschaft (GDV), Berlin, Germany, https://www.gdv.de/de/medien/aktuell/2021-teuerstes-naturgefahrenjahr-fuer-die-versicherer-74092 (last access: 21 December 2022), 2021 (in German).
Gourley, J. J., Giangrande, S. E., Hong, Y., Flamig, Z. L., Schuur, T., and Vrugt, J. A.: Impacts of Polarimetric Radar Observations on Hydrologic Simulation, J. Hydrometeorol., 11, 781–796, https://doi.org/10.1175/2010JHM1218.1, 2010.
Gupta, H. V., Kling, H., Yilmaz, K. K., and Martinez, G. F.: Decomposition of the mean squared error and NSE performance criteria: Implications for improving hydrological modelling, J. Hydrol., 377, 80–91, https://doi.org/10.1016/j.jhydrol.2009.08.003, 2009.
Hapuarachchi, H. A. P., Wang, Q. J., and Pagano, T. C.: A review of advances in flash flood forecasting, Hydrol. Process., 25, 2771–2784, https://doi.org/10.1002/hyp.8040, 2011.
Harrison, D. L., Driscoll, S. J., and Kitchen, M.: Improving precipitation estimates from weather radar using quality control and correction techniques, Meteorol. Appl., 7, 135–144, https://doi.org/10.1017/S1350482700001468, 2000.
He, X., Koch, J., Zheng, C., Bøvith, T., and Jensen, K. H.: Comparison of Simulated Spatial Patterns Using Rain Gauge and Polarimetric-Radar-Based Precipitation Data in Catchment Hydrological Modeling, J. Hydrometeorol., 19, 1273–1288, https://doi.org/10.1175/JHM-D-17-0235.1, 2018.
Hengl, T., de Jesus, J. M., Heuvelink, G. B. M., Gonzalez, M. R., Kilibarda, M., Blagotić, A., Shangguan, W., Wright, M. N., Geng, X., Bauer-Marschallinger, B., Guevara, M. A., Vargas, R., MacMillan, R. A., Batjes, N. H., Leenaars, J. G. B., Ribeiro, E., Wheeler, I., Mantel, S., and Kempen, B.: SoilGrids250m: Global gridded soil information based on machine learning, PLOS ONE, 12, e0169748, https://doi.org/10.1371/journal.pone.0169748, 2017.
Huang, Y., Bárdossy, A., and Zhang, K.: Sensitivity of hydrological models to temporal and spatial resolutions of rainfall data, Hydrol. Earth Syst. Sci., 23, 2647–2663, https://doi.org/10.5194/hess-23-2647-2019, 2019.
Junghänel, T., Bissolli, P., Daßler, J., Fleckenstein, R., Imbery, F., Janssen, W., Lengfeld, K., Leppelt, T., Rauthe, M., Rauthe-Schöch, A., Rocek, M., Walawender, E., and Weigl, E.: Hydro-klimatologische Einordnung der Stark- und Dauerniederschläge in Teilen Deutschlands im Zusammenhang mit dem Tiefdruckgebiet “Bernd” vom 12. bis 19. Juli 2021, Deutscher Wetterdienst (DWD), Offenbach, Germany, https://www.dwd.de/DE/leistungen/besondereereignisse/niederschlag/20210721_bericht_starkniederschlaege_tief_bernd.html (last access: 21 December 2022), 2021.
Kaspar, F., Müller-Westermeier, G., Penda, E., Mächel, H., Zimmermann, K., Kaiser-Weiss, A., and Deutschländer, T.: Monitoring of climate change in Germany – data, products and services of Germany's National Climate Data Centre, Adv. Sci. Res., 10, 99–106, https://doi.org/10.5194/asr-10-99-2013, 2013.
Kendon, E. J., Roberts, N. M., Fowler, H. J., Roberts, M. J., Chan, S. C., and Senior, C. A.: Heavier summer downpours with climate change revealed by weather forecast resolution model, Nat. Clim. Change, 4, 570–576, https://doi.org/10.1038/nclimate2258, 2014.
Koks, E. E., van Ginkel, K. C. H., van Marle, M. J. E., and Lemnitzer, A.: Brief communication: Critical infrastructure impacts of the 2021 mid-July western European flood event, Nat. Hazards Earth Syst. Sci., 22, 3831–3838, https://doi.org/10.5194/nhess-22-3831-2022, 2022.
Kollet, S. J. and Maxwell, R. M.: Integrated surface–groundwater flow modeling: A free-surface overland flow boundary condition in a parallel groundwater flow model, Adv. Water Resour., 29, 945–958, https://doi.org/10.1016/j.advwatres.2005.08.006, 2006.
Kreienkamp, F., Philip, S. Y., Tradowsky, J. S., Kew, S. F., Lorenz, P., Arrighi, J., Belleflamme, A., Bettmann, T., Caluwaerts, S., Chan, S. C., Ciavarella, A., De Cruz, L., de Vries, H., Demuth, N., Ferrone, A., Fischer, E. M., Fowler, H. J., Goergen, K., Heinrich, D., Henrichs, Y., Lenderink, G., Kaspar, F., Nilson, E., Otto, F. E. L., Ragone, F., Seneviratne, S. I., Singh, R. K., Skålevåg, A., Termonia, P., Thalheimer, L., van Aalst, M., Van den Bergh, J., Van de Vyver, H., Vannitsem, S., van Oldenborgh, G. J., Van Schaeybroeck, B., Vautard, R., Vonk, D., and Wanders, N.: Rapid attribution of heavy rainfall events leading to the severe flooding in Western Europe during July 2021, World Weather Attribution (WWA), https://www.worldweatherattribution.org/heavy-rainfall-which- led-to-severe-flooding-in-western-europe-made-more-likely- by-climate-change (last access: 21 December 2022), 2021.
Kuczera, G., Kavetski, D., Franks, S., and Thyer, M.: Towards a Bayesian total error analysis of conceptual rainfall-runoff models: Characterising model error using storm-dependent parameters, J. Hydrol., 331, 161–177, https://doi.org/10.1016/j.jhydrol.2006.05.010, 2006.
Kuffour, B. N. O., Engdahl, N. B., Woodward, C. S., Condon, L. E., Kollet, S., and Maxwell, R. M.: Simulating coupled surface–subsurface flows with ParFlow v3.5.0: capabilities, applications, and ongoing development of an open-source, massively parallel, integrated hydrologic model, Geosci. Model Dev., 13, 1373–1397, https://doi.org/10.5194/gmd-13-1373-2020, 2020.
Langanke, T., Steidl, M., Schleicher, C., and Sannier, C.: Copernicus Land Monitoring Service – High Resolution Layer Imperviousness: Product Specifications Document, European Environment Agency, https://land.copernicus.eu/user-corner/technical-library/hrl-imperviousness-technical-document-prod-2015 (last access: 21 December 2022), 2016.
Lin, P., Hopper, L. J., Yang, Z.-L., Lenz, M., and Zeitler, J. W.: Insights into Hydrometeorological Factors Constraining Flood Prediction Skill during the May and October 2015 Texas Hill Country Flood Events, J. Hydrometeorol., 19, 1339–1361, https://doi.org/10.1175/JHM-D-18-0038.1, 2018.
Lobligeois, F., Andréassian, V., Perrin, C., Tabary, P., and Loumagne, C.: When does higher spatial resolution rainfall information improve streamflow simulation? An evaluation using 3620 flood events, Hydrol. Earth Syst. Sci., 18, 575–594, https://doi.org/10.5194/hess-18-575-2014, 2014.
Lumbroso, D. and Gaume, E.: Reducing the uncertainty in indirect estimates of extreme flash flood discharges, J. Hydrol., 414–415, 16–30, https://doi.org/10.1016/j.jhydrol.2011.08.048, 2012.
Marshall, J. S. and Palmer, W. M. K.: The distribution of raindrops with size, J. Atmos. Sci., 5, 165–166, https://doi.org/10.1175/1520-0469(1948)005<0165:TDORWS>2.0.CO;2, 1948.
Maxwell, R. M.: A terrain-following grid transform and preconditioner for parallel, large-scale, integrated hydrologic modeling, Adv. Water Resour., 53, 109–117, https://doi.org/10.1016/j.advwatres.2012.10.001, 2013.
Mohr, S., Ehret, U., Kunz, M., Ludwig, P., Caldas-Alvarez, A., Daniell, J. E., Ehmele, F., Feldmann, H., Franca, M. J., Gattke, C., Hundhausen, M., Knippertz, P., Küpfer, K., Mühr, B., Pinto, J. G., Quinting, J., Schäfer, A. M., Scheibel, M., Seidel, F., and Wisotzky, C.: A multi-disciplinary analysis of the exceptional flood event of July 2021 in central Europe. Part 1: Event description and analysis, Nat. Hazards Earth Syst. Sci. Discuss. [preprint], https://doi.org/10.5194/nhess-2022-137, in review, 2022.
Muñoz-Sabater, J., Dutra, E., Agustí-Panareda, A., Albergel, C., Arduini, G., Balsamo, G., Boussetta, S., Choulga, M., Harrigan, S., Hersbach, H., Martens, B., Miralles, D. G., Piles, M., Rodríguez-Fernández, N. J., Zsoter, E., Buontempo, C., and Thépaut, J.-N.: ERA5-Land: a state-of-the-art global reanalysis dataset for land applications, Earth Syst. Sci. Data, 13, 4349–4383, https://doi.org/10.5194/essd-13-4349-2021, 2021.
Nash, J. E. and Sutcliffe, J. V.: River flow forecasting through conceptual models part I – A discussion of principles, J. Hydrol., 10, 282–290, https://doi.org/10.1016/0022-1694(70)90255-6, 1970.
Nissen, K. M. and Ulbrich, U.: Increasing frequencies and changing characteristics of heavy precipitation events threatening infrastructure in Europe under climate change, Nat. Hazards Earth Syst. Sci., 17, 1177–1190, https://doi.org/10.5194/nhess-17-1177-2017, 2017.
Oudin, L., Hervieu, F., Michel, C., Perrin, C., Andréassian, V., Anctil, F., and Loumagne, C.: Which potential evapotranspiration input for a lumped rainfall–runoff model?: Part 2 – Towards a simple and efficient potential evapotranspiration model for rainfall–runoff modelling, J. Hydrol., 303, 290–306, https://doi.org/10.1016/j.jhydrol.2004.08.026, 2005.
Oudin, L., Perrin, C., Mathevet, T., Andréassian, V., and Michel, C.: Impact of biased and randomly corrupted inputs on the efficiency and the parameters of watershed models, J. Hydrol., 320, 62–83, https://doi.org/10.1016/j.jhydrol.2005.07.016, 2006.
Panagos, P.: European Soil Database, GeoConnexion, 5, 32–33, 2006.
Park, S., Berenguer, M., and Sempere-Torres, D.: Long-term analysis of gauge-adjusted radar rainfall accumulations at European scale, J. Hydrol., 573, 768–777, https://doi.org/10.1016/j.jhydrol.2019.03.093, 2019.
Pechlivanidis, I. G., McIntyre, N., and Wheater, H. S.: The significance of spatial variability of rainfall on simulated runoff: an evaluation based on the Upper Lee catchment, UK, Hydrol. Res., 48, 1118–1130, https://doi.org/10.2166/nh.2016.038, 2016.
Perrin, C., Michel, C., and Andréassian, V.: Improvement of a parsimonious model for streamflow simulation, J. Hydrol., 279, 275–289, https://doi.org/10.1016/S0022-1694(03)00225-7, 2003.
Pokhrel, P. and Gupta, H. V.: On the ability to infer spatial catchment variability using streamflow hydrographs, Water Resour. Res., 47, W08534, https://doi.org/10.1029/2010WR009873, 2011.
Poméon, T., Wagner, N., Furusho, C., Kollet, S., and Reinoso-Rondinel, R.: Performance of a PDE-Based Hydrologic Model in a Flash Flood Modeling Framework in Sparsely-Gauged Catchments, Water, 12, 2157, https://doi.org/10.3390/w12082157, 2020.
Porcacchia, L., Kirstetter, P. E., Gourley, J. J., Maggioni, V., Cheong, B. L., and Anagnostou, M. N.: Toward a Polarimetric Radar Classification Scheme for Coalescence-Dominant Precipitation: Application to Complex Terrain, J. Hydrometeorol., 18, 3199–3215, https://doi.org/10.1175/JHM-D-17-0016.1, 2017.
Raimonet, M., Oudin, L., Thieu, V., Silvestre, M., Vautard, R., Rabouille, C., and Moigne, P. L.: Evaluation of Gridded Meteorological Datasets for Hydrological Modeling, J. Hydrometeorol., 18, 3027–3041, https://doi.org/10.1175/JHM-D-17-0018.1, 2017.
Rauthe, M., Steiner, H., Riediger, U., Mazurkiewicz, A., and Gratzki, A.: A Central European precipitation climatology – Part I: Generation and validation of a high-resolution gridded daily data set (HYRAS), Meteorol. Z., 22, 235–256, https://doi.org/10.1127/0941-2948/2013/0436, 2013.
Reinoso-Rondinel, R. and Schleiss, M.: Quantitative Evaluation of Polarimetric Estimates from Scanning Weather Radars Using a Vertically Pointing Micro Rain Radar, J. Atmos. Ocean. Tech., 38, 481–499, https://doi.org/10.1175/JTECH-D-20-0062.1, 2021.
Renard, B., Kavetski, D., Leblois, E., Thyer, M., Kuczera, G., and Franks, S. W.: Toward a reliable decomposition of predictive uncertainty in hydrological modeling: Characterizing rainfall errors using conditional simulation, Water Resour. Res., 47, W11516, https://doi.org/10.1029/2011WR010643, 2011.
Ryzhkov, A., Diederich, M., Zhang, P., and Simmer, C.: Potential Utilization of Specific Attenuation for Rainfall Estimation, Mitigation of Partial Beam Blockage, and Radar Networking, J. Atmos. Ocean. Tech., 31, 599–619, https://doi.org/10.1175/JTECH-D-13-00038.1, 2014.
Ryzhkov, A., Zhang, P., Bukovčić, P., Zhang, J., and Cocks, S.: Polarimetric Radar Quantitative Precipitation Estimation, Remote Sens., 14, 1695, https://doi.org/10.3390/rs14071695, 2022.
Ryzhkov, A. V., Schuur, T. J., Burgess, D. W., Heinselman, P. L., Giangrande, S. E., and Zrnic, D. S.: The Joint Polarization Experiment: Polarimetric Rainfall Measurements and Hydrometeor Classification, B. Am. Meteorol. Soc., 86, 809–824, https://doi.org/10.1175/BAMS-86-6-809, 2005.
Saulnier, G.-M. and Le Lay, M.: Sensitivity of flash-flood simulations on the volume, the intensity, and the localization of rainfall in the Cévennes-Vivarais region (France), Water Resour. Res., 45, W10425, https://doi.org/10.1029/2008WR006906, 2009.
Schaap, M. G., Leij, F. J., and van Genuchten, M. Th.: rosetta: a computer program for estimating soil hydraulic parameters with hierarchical pedotransfer functions, J. Hydrol., 251, 163–176, https://doi.org/10.1016/S0022-1694(01)00466-8, 2001.
Schalge, B., Haefliger, V., Kollet, S., and Simmer, C.: Improvement of surface run-off in the hydrological model ParFlow by a scale-consistent river parameterization, Hydrol. Process., 33, 2006–2019, https://doi.org/10.1002/hyp.13448, 2019.
Schleiss, M., Olsson, J., Berg, P., Niemi, T., Kokkonen, T., Thorndahl, S., Nielsen, R., Ellerbæk Nielsen, J., Bozhinova, D., and Pulkkinen, S.: The accuracy of weather radar in heavy rain: a comparative study for Denmark, the Netherlands, Finland and Sweden, Hydrol. Earth Syst. Sci., 24, 3157–3188, https://doi.org/10.5194/hess-24-3157-2020, 2020.
Schröter, K., Kunz, M., Elmer, F., Mühr, B., and Merz, B.: What made the June 2013 flood in Germany an exceptional event? A hydro-meteorological evaluation, Hydrol. Earth Syst. Sci., 19, 309–327, https://doi.org/10.5194/hess-19-309-2015, 2015.
Singh, H. and Reza Najafi, M.: Evaluation of gridded climate datasets over Canada using univariate and bivariate approaches: Implications for hydrological modelling, J. Hydrol., 584, 124673, https://doi.org/10.1016/j.jhydrol.2020.124673, 2020.
Smith, S., reedmaxwell, i-ferguson, FabianGasper, Engdahl, N., Condon, L., xy124, Kulkarni, K., Beisman, J., basileh, geouke, cswoodward, Fonseca, J. A., and Thompson, D.: parflow-350/parflow: ParFlow Version 3.5.0, Zenodo [code], https://doi.org/10.5281/zenodo.3555297, 2019.
Sokol, Z., Szturc, J., Orellana-Alvear, J., Popová, J., Jurczyk, A., and Célleri, R.: The Role of Weather Radar in Rainfall Estimation and Its Application in Meteorological and Hydrological Modelling–A Review, Remote Sens., 13, 351, https://doi.org/10.3390/rs13030351, 2021.
Staatliches Umweltamt Köln: Ergebnisbericht Erft. Wasserrahmenrichtlinie in NRW – Bestandsaufnahme, Ministerium fuer Umwelt und Naturschutz, Landwirtschaft und Verbraucherschutz des Landes Nordrhein-Westfalen, https://www.flussgebiete.nrw.de/system/files/atoms/files/erf_bestandsaufnahme_2004_erft.pdf (last access: 9 January 2023), 2005 (in German).
Tetzlaff, D. and Uhlenbrook, S.: Significance of spatial variability in precipitation for process-oriented modelling: results from two nested catchments using radar and ground station data, Hydrol. Earth Syst. Sci., 9, 29–41, https://doi.org/10.5194/hess-9-29-2005, 2005.
Tobin, D. M. and Kumjian, M. R.: Polarimetric Radar and Surface-Based Precipitation-Type Observations of Ice Pellet to Freezing Rain Transitions, Weather Forecast., 32, 2065–2082, https://doi.org/10.1175/WAF-D-17-0054.1, 2017.
Trenberth, K.: Changes in precipitation with climate change, Clim. Res., 47, 123–138, https://doi.org/10.3354/cr00953, 2011.
Winterrath, T., Brendel, C., Hafer, M., Junghänel, T., Klameth, A., Lengfeld, K., Walawender, E., Weigl, E., and Becker, A.: Radar climatology (RADKLIM) version 2017.002; gridded precipitation data for Germany: Radar-based gauge-adjusted one-hour precipitation sum (RW), Deutscher Wetterdienst (DWD) [data set], https://doi.org/10.5676/DWD/RADKLIM_RW_V2017.002, 2018.
Yamazaki, D., Ikeshima, D., Sosa, J., Bates, P. D., Allen, G. H., and Pavelsky, T. M.: MERIT Hydro: A High-Resolution Global Hydrography Map Based on Latest Topography Dataset, Water Resour. Res., 55, 5053–5073, https://doi.org/10.1029/2019WR024873, 2019.
Zappa, M., Jaun, S., Germann, U., Walser, A., and Fundel, F.: Superposition of three sources of uncertainties in operational flood forecasting chains, Atmos. Res., 100, 246–262, https://doi.org/10.1016/j.atmosres.2010.12.005, 2011.
Zhou, Z., Smith, J. A., Yang, L., Baeck, M. L., Chaney, M., Veldhuis, M.-C. T., Deng, H., and Liu, S.: The complexities of urban flood response: Flood frequency analyses for the Charlotte metropolitan region, Water Resour. Res., 53, 7401–7425, https://doi.org/10.1002/2016WR019997, 2017.