the Creative Commons Attribution 4.0 License.
the Creative Commons Attribution 4.0 License.
 | 05 Apr 2023
A multi-disciplinary analysis of the exceptional flood event of July 2021 in central Europe – Part 2: Historical context and relation to climate change
Florian Ehmele
Mário J. Franca
Susanna Mohr
Alberto Caldas-Alvarez
James E. Daniell
Uwe Ehret
Hendrik Feldmann
Marie Hundhausen
Peter Knippertz
Katharina Küpfer
Michael Kunz
Bernhard Mühr
Joaquim G. Pinto
Julian Quinting
Andreas M. Schäfer
Frank Seidel
Christina Wisotzky
Heavy precipitation over western Germany and neighboring countries in July 2021 led to widespread floods, with the Ahr and Erft river catchments being particularly affected. Following the event characterization and process analysis in Part 1, here we put the 2021 event in the historical context regarding precipitation and discharge records and in terms of the temporal transformation of the valley morphology. Furthermore, we evaluated the role of ongoing and future climate change on the modification of rainfall totals and the associated flood hazard, as well as implications for flood management.
The event was among the five heaviest precipitation events of the past 70 years in Germany. However, consideration of the large LAERTES-EU regional climate model (RCM) ensemble revealed a substantial underestimation of both return levels and periods based on extreme value statistics using only observations. An analysis of homogeneous hydrological data of the last 70 years demonstrated that the event discharges exceeded by far the statistical 100-year return levels. Nevertheless, the flood peaks at the Ahr river were comparable to the reconstructed major historical events of 1804 and 1910, which were not included in the flood risk assessment so far. A comparison between the 2021 and past events showed differences in terms of the observed hydro-morphodynamic processes which enhanced the flood risk due to changes in the landscape organization and occupation.
The role of climate change and how the 2021 event would unfold under warmer or colder conditions (within a −2 to +3 K range) was considered based on both a pseudo global warming (PGW) model experiments and the analysis of an RCM ensemble. The PGW experiments showed that the spatial mean precipitation scales with the theoretical Clausius–Clapeyron (CC) relation, predicting a 7 % to 9 % increase per degree of warming. Using the PGW rainfall simulations as input to a hydrological model of the Ahr river basin revealed a strong and non-linear effect on flood peaks: for the +2 K scenario, the 18 % increase in areal rainfall led to a 39 % increase of the flood peak at gauge Altenahr. The analysis of the high-resolution convection-permitting KIT-KLIWA RCM ensemble confirmed the CC scaling for moderate spatial mean precipitation but showed a super CC scaling of up to 10 % for higher intensities. Moreover, the spatial extent of such precipitation events is also expected to increase.
- Article
(7611 KB) - Full-text XML
- Companion paper
-
Supplement
(9756 KB) - BibTeX
- EndNote


In mid-July 2021, heavy precipitation over 2 d exceeding 150 mm affected a large area covering western Germany with the adjacent regions in the Netherlands, Belgium, Luxembourg, and France, triggering widespread flooding (e.g., Schäfer et al., 2021; Junghänel et al., 2021; Dewals et al., 2021; MeteoLux, 2021). Especially areas in the German federal states of North Rhine-Westphalia (NRW) and Rhineland-Palatinate (RP), Luxembourg, and eastern Belgium were heavily affected by floods, in particular the river catchments of the Ahr and Erft (Fig. 1a). The area of these two is characterized by the low mountain ranges of the Eifel and the Ardennes. Both the Ahr and the Erft rivers are tributaries of the Rhine river, the former with a catchment area of approx. 900 km2 and the latter with approx. 1800 km2. On 14 July 2021, precipitation totals reached values of more than 75 mm in 24 h (locally even over 100 mm; Fig. 1b), with most of the precipitation even falling within 15 h (Mohr et al., 2022). Severe damage to buildings, infrastructure, and industry as well as the loss of over 200 lives (Tradowsky et al., 2022) with more than 180 fatalities in Germany alone (Kreienkamp et al., 2021) was the result. The event was one of the five costliest disasters in Europe in the last 50 years (Mohr et al., 2022), with Munich Re (2022) estimating a total loss of EUR 46 billion and 33 billion in Germany alone. Even 1 year later, reconstruction work is still ongoing, and it will take years until all infrastructure is back in place (BMDV, 2021, 2022).
The first part of this study (Mohr et al., 2022; hereafter referred to as Part 1) focused on the characterization and analysis of the event itself, encompassing the interlink of meteorological, hydrological, and hydro-morphological processes and effects. The synoptic large-scale conditions that led to the heavy precipitation event were characterized by a quasi-stationary, large-scale trough and an associated low-pressure system over the region, which was sustained by a blocking event over the eastern North Atlantic. These synoptic patterns were well predicted by the numerical weather prediction models operated by the Deutscher Wetterdienst (DWD) or the European Centre for Medium-Range Weather Forecasts (ECMWF). Such large-scale situations foster extreme weather events like the one discussed here (e.g., Woollings et al., 2018; Kautz et al., 2022). The predicted and observed rainfall totals were extreme for that particular region, exceeding high return periods and affecting an uncommonly large area (cf. Part 1). Likewise, the recorded and reconstructed flood peaks were extraordinary and were exacerbated by the morphological characteristics of the catchments and river channel network and by the landscape occupation and organization. Both aspects were responsible for widespread inundation of the valley; the generalized occurrence of erosion and scouring processes; deposition; clogging and damming of channel network bottlenecks such as bridges, streets, and narrow river sections; or eventually the collapse of the structure of the channel network with the observation of flow bypasses and riverbank collapses.
A key aspect is a deeper analysis of the 2021 flood event based on a long-term climatological perspective. For example, the Ahr catchment had been affected by two severe flood events in 1804 and 1910 (Roggenkamp and Herget, 2014a, b). In spite of the limited data available, evidence is given that the 1804 event was comparable to the July 2021 event in terms of peak discharge (Part 1; Roggenkamp and Herget, 2022). However, these events were not considered for the official estimation of the 100-year return periods of discharge (HQ100) by the Landesamt für Umwelt (LfU) of RP, as the continuous time series of observations only starts in 1946. Thus, Vorogushyn et al. (2022) recently estimated the return period of the 2021 flood at gauge Altenahr (Ahr) based only on the recorded data from 1946 to 2019 to be more than 108 years, which is very unrealistic and clearly shows the limits of extreme value statistics for rare events. In contrast, taking into account reconstructed historical floods since 1804, the return period of the 2021 flood is reduced to an order of magnitude of HQ10 000. In addition, the consequences such as inundation areas and depths in the valley during the past and the 2021 floods differ dramatically in some cases. This can also be attributed to changes in the landscape or in landscape use and newly emerging process connections and feedbacks (see Part 1; Dietze et al., 2022).
Because the dimensions of the July 2021 event were somehow surprising and unexpected, the role of ongoing and future climate change (IPCC, 2021a, 2022) on the evolution and characteristics of such extreme events is an important issue to be addressed. According to the Clausius–Clapeyron (CC) relationship, the intensity and probability of precipitation events are affected by an increase in moisture content of 7 % per degree temperature increase (e.g., Allen and Ingram, 2002; Pall et al., 2007). In fact, on the global scale, the general circulation models (GCMs) project an increase in heavy precipitation over large areas of the globe which, however, scales not necessarily with the CC rate (magnitude varies between 4 % per 1 K and 8 % per 1 K of surface warming; IPCC, 2021a). One possible reason is the resolution of GCMs used for the future projections (ScenarioMIP; usually 80 to 250 km; IPCC, 2021b), which is too coarse to fully capture the local characteristics and intensities of (heavy) precipitation events contributing to the total amounts. A possible approach to overcome this shortcoming is the consideration of regional climate model (RCM) simulations with typical horizontal resolutions of 12 to 25 km or even down to convection-permitting resolutions below 3 km (e.g., Vergara-Temprado et al., 2021). A good overview of the advantages of large RCM ensembles is given in Maher et al. (2021). For example, for the historical period, the LAERTES-EU data set (Ehmele et al., 2020, 2022) with over 12 000 years at 25 km horizontal resolution provides an excellent basis to estimate how uncommon precipitation values are in the scope of recent climate conditions. Moreover, the examination of convection-permitting ensemble simulations (Prein et al., 2015; Ban et al., 2021) further improves the basis for such an evaluation, given that such models exhibit a largely reduced bias in terms of precipitation intensities compared to lower resolution (12 to 25 km) climate models (Prein et al., 2015; Caldas-Alvarez et al., 2022b).
While conventional climate model simulations are used to assess the general evolution of precipitation characteristics, so-called attribution studies elaborate on how climate change affects specific events. Such studies consider a very large number of climate model simulations with and without anthropogenic forcing (probabilistic event attribution). By comparing the statistics of both types of simulation, it is possible to estimate whether the probability of occurrence of a specific event has changed in recent decades or not (Allen and Ingram, 2002; Stott et al., 2004, 2016; Otto, 2017). Furthermore, climate model simulations can also be used for conditional event attribution investigations as complementary to the above-described probabilistic approach (Stott et al., 2016). The conditional approach is often referred to as the “storyline” approach (e.g., Shepherd, 2016; Shepherd et al., 2018; Shepherd, 2019), which assesses the extent to which recent climate change and future projected conditions could affect the magnitude of a specific historical event (e.g., Trenberth et al., 2015; Sillmann et al., 2021; Sánchez-Benítez et al., 2022). The storyline approach can be useful to individually investigate the thermodynamic (e.g., increase in moisture) and the dynamic component (changes in atmospheric circulation) for a specific event. As stated by Shepherd (2016), the thermodynamic aspects of climate change are generally robust in theory and their impacts, particularly on precipitation, and can thus be studied by keeping the dynamics constant, e.g., by spectral nudging (van Garderen et al., 2021). A variant of this approach is to assess climate change and its impact on extreme events with a pseudo global warming (PGW) analysis (e.g., Schär et al., 1996; Michaelis et al., 2017). In this case, the thermodynamic modifications are imprinted to the initial and lateral boundary forcing data of RCM simulations, such as temperature changes corresponding to a fixed warming level (e.g., +2 K) or by considering the mean changes from the background environmental conditions from GCMs under a given scenario (e.g., Aalbers et al., 2022). For the July 2021 event, a study from the World Weather Attribution initiative (e.g., Otto, 2017) estimated an increase in the probability of occurrence already by a factor between 1.2 and 9 compared to a 1.2 K colder climate (Kreienkamp et al., 2021; Tradowsky et al., 2022). Examples of similar work have already been performed for other severe flood events (e.g., Lackmann, 2013; Lenderink et al., 2021).
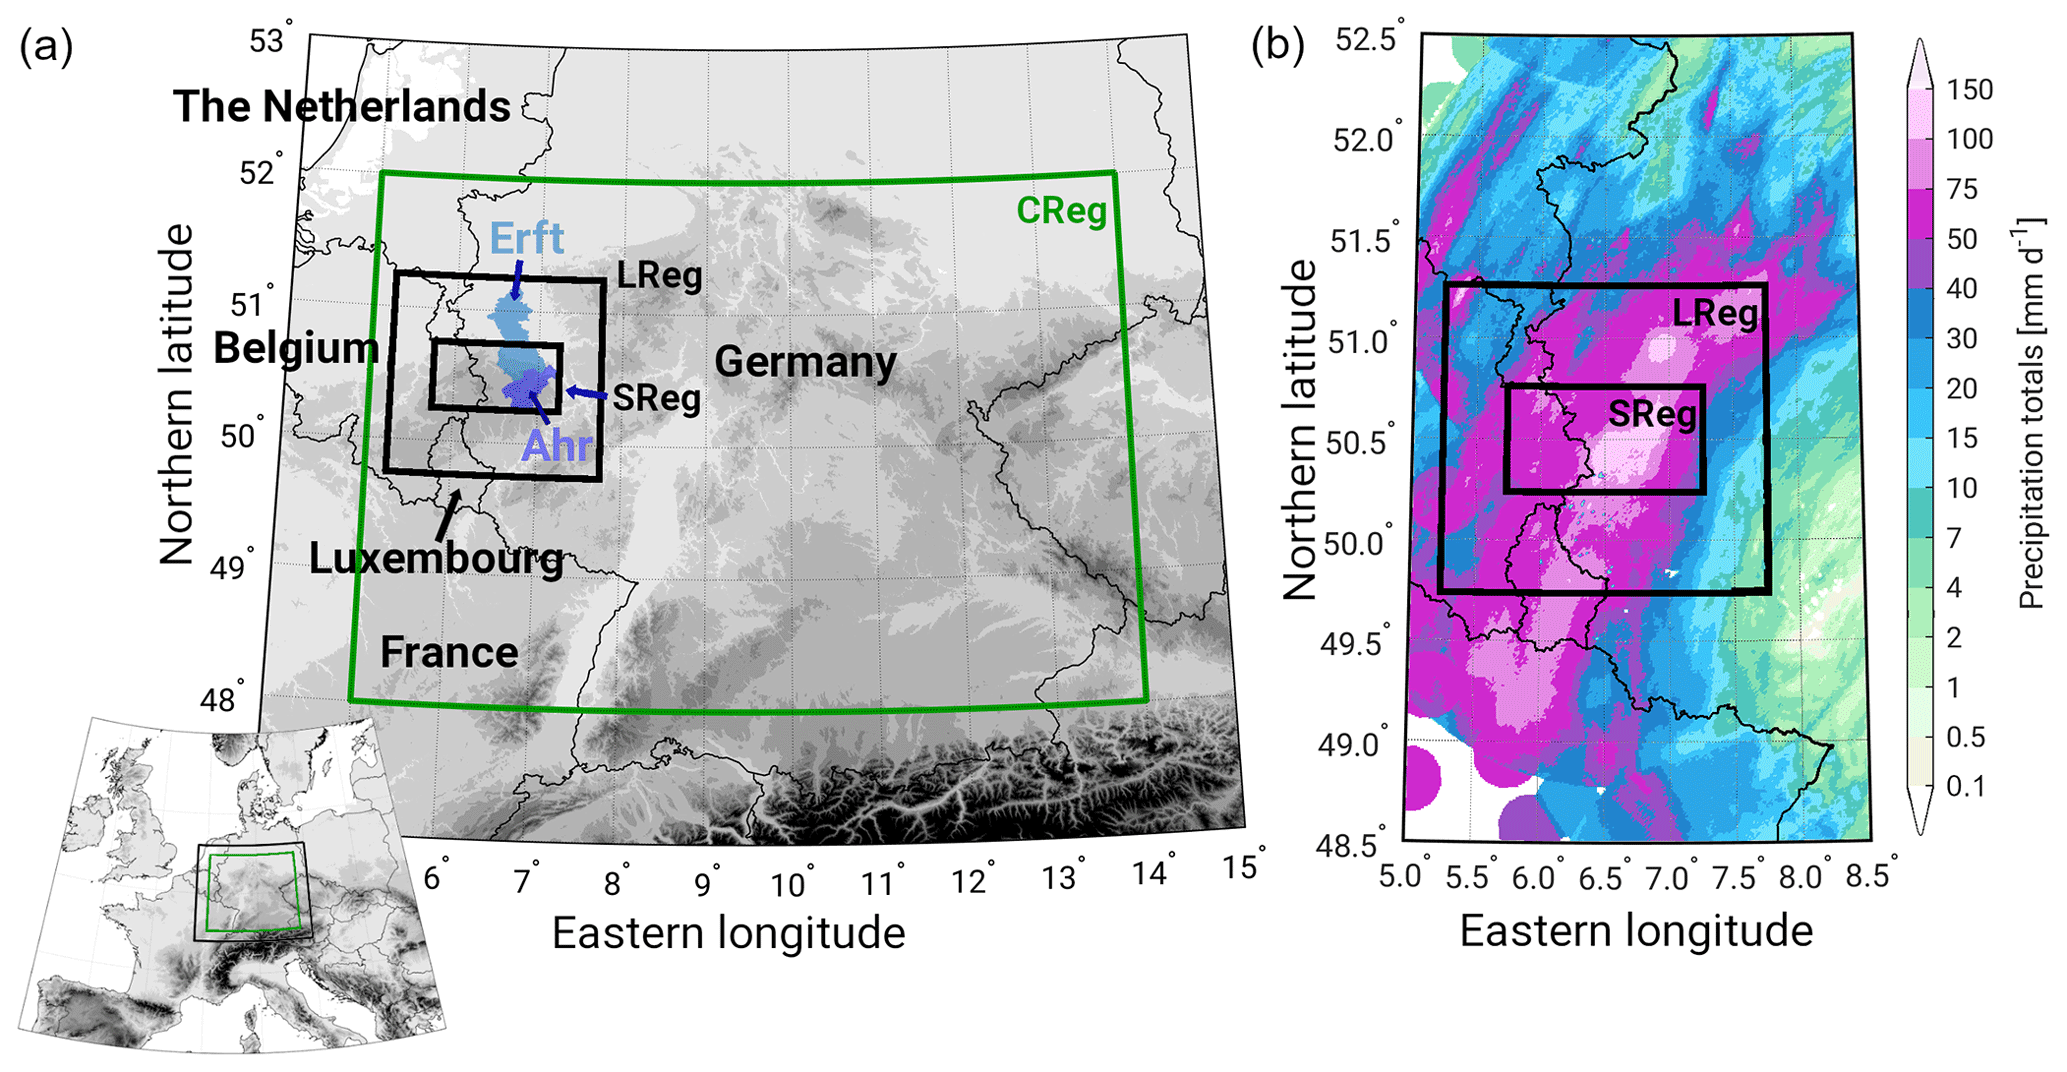
Figure 1(a) Overview map of central and western Europe (bottom left) with a zoom-in on the region of interest and (b) 24 h precipitation totals of 14 July 2021 based on RADOLAN (cf. Part 1). Two regions (LReg, SReg; black rectangles) covering the main precipitation area and the affected river catchments of the Ahr (dark blue) and the Erft (light blue) are defined to derive specific event characteristics (e.g., spatial means). Analyses in a statistical and climatological context are performed over the greater central Germany region (CReg, green box). Topographic data (gray) were provided by NOAA National Geophysical Data Center (Amante and Eakins, 2008).
In the present study (hereafter referred to as Part 2), we put the July 2021 event into a historical context using both observational and the LAERTES-EU data sets. Regarding climate change, we consider an ensemble of convection-permitting climate simulations and novel PGW simulations that were performed specifically for this event. The following research questions are addressed.
- I.
How does the event classify within the historical context of precipitation and flood events?
- II.
In which way did the historical transformation of river valleys (e.g., landscape occupation and organization) change the 2021 flood hazard in comparison to past events in this region?
- III.
How would the specific extreme event of July 2021 unfold under different past and future climatic conditions and what implications do these scenarios have on flood events?
- IV.
How are precipitation characteristics (e.g., intensity, extent, frequency) projected to change in general under future climate conditions?
The structure of Part 2 is as follows: the data sets, models, and methods are described in Sect. 2. The classification into the historical context is presented in Sect. 3. Section 4 focuses on the possible role of climate change for the event and future projections. Finally, the discussion, summary, conclusions, and outlook are presented in Sect. 5.
In Part 2, three rectangular geographical domains are defined for both the event characterization and the statistical analysis. For a long-term climatological and statistical analysis, we define the CReg area (green rectangular in Fig. 1a) as covering central Germany and parts of neighboring countries between 5 and 14∘ E and between 48 and 52∘ N with about 285 000 km2. Although the July 2021 event primarily affected western Germany, our intention is to identify comparable heavy precipitation events across Germany in terms of spatio-temporal extent, precipitation totals, and antecedent conditions. CReg is characterized by similar topographic features such as low mountain ranges, resulting in similar orographic forcing during precipitation formation or intensification. Furthermore, CReg is a region with hydroclimatic conditions comparable to the Ahr and Erft river basins such that analyses of both extreme rainfall and flood events can serve as a comprehensive spatio-temporal context for the 2021 flood event.
To characterize the July 2021 event more specifically, two additional smaller regions are defined based on the precipitation observations and most affected areas of the Ahr and Erft river catchments: the larger event area (LReg, see Fig. 1) ranges between 5.25 and 7.75∘ E and from 49.75 to 51.25∘ N, covering an area of approx. 30 000 km2. The smaller event area (SReg) ranges between 5.75 and 7.25∘ E and from 50.25 to 50.75∘ N, with a covered area of approx. 6000 km2.
The investigated period, in general, is determined by the length of the used data sets (see below). For the historical classification, all available data are used; the July 2021 event itself is characterized temporally using the 24 h from 14 July 2021 05:50 UTC to 15 July 2021 05:50 UTC.
2.1 Observational data
2.1.1 Precipitation data
In line with Part 1, two different gridded precipitation data sets provided by the Deutscher Wetterdienst (DWD) are used in this study: daily HYRAS data (Hydrometeorologische Rasterdatensätze; Rauthe et al., 2013) and hourly RADOLAN data (Radar-Online-Aneichung; Weigl and Winterrath, 2009; Winterrath et al., 2018). HYRAS includes daily precipitation totals at a 5×5 km2 grid resolution covering Germany and its relevant river basin in neighboring countries for the period from 1951 to 2015 (update in preparation by the DWD). HYRAS is based on station measurements interpolated to the regular grid considering local characteristics such as elevation or exposition. A sub-sample of HYRAS is the HYRAS-DE data, formerly known as REGNIE (Regionalisierte Niederschlagshöhen), covering only Germany but with a higher resolution of 1 km2 and continuous updates on a daily basis. While HYRAS, with its larger spatial extent, was used for the bias correction of the high-resolution regional climate simulations (see Sect. 2.2.1), HYRAS-DE is used to find comparable historical events in Germany due to the longer time period covered.
RADOLAN is a radar-based near-real-time precipitation data set covering Germany and parts of the neighboring countries with roughly 1 km2 horizontal and hourly temporal resolution available since 2001. To account for uncertainties and typical radar artifacts, the radar-based precipitation rates are calibrated using hourly data from over 1000 ground-based observational stations. RADOLAN is used to derive the precipitation totals of the July 2021 event due to its spatio-temporal availability.
2.1.2 River gauge data
In this study, we analyze river gauge data with the two objectives of, first, assessing the rarity of the 2021 flood event by comparing it to a large number of historical flood recordings from catchments in a similar hydroclimate and, second, assessing how the 2021 flood event might unfold under a further changing climate. For the first, we collected three data sets from the Global Runoff Data Center (GRDC), the Landesanstalt für Umwelt Baden-Württemberg (LUBW), and peak flow estimates of historical floods at gauge Altenahr (Ahr). For the second, we fed rainfall from PGW scenarios into the hydrological model LARSIM to generate streamflow scenarios in a changing climate. For both objectives, we used observed and reconstructed streamflow data of the 2021 flood event for comparison. The data sets are explained in the following.
As described in detail in Part 1, we collected water level and streamflow data of 10 river gauges for the 2021 flood event covering the study area LReg (see Fig. 1) from the river Wupper in the east to the river Prüm in the west. These gauges cover a range of basin sizes from 31.9 km2 at gauge Schönau (river Erft) to 816 km2 at gauge Kordel (river Kyll). The gauge locations are shown in Part 1, Fig. 1; water level and streamflow time series during the 2021 event are shown in Part 1, Fig. 5. Please note that a considerable portion of the streamflow values are reconstructions rather than observations, as many gauges were destroyed during the flood. Further information on the gauge data and gauge properties, such as basin size and historical extremes, are listed in Part 1 (Table 1). Henceforth, we refer to these data as the 2021 gauge data (2021GD). All data were provided by the water administrations of Rhineland-Palatinate (LfU), the Erftverband, and the Wupperverband.
The GRDC data set is a collection of all streamflow data in the greater central Germany region (CReg, see Fig. 1) available from the Global Runoff Data Center (GRDC). To ensure comparability with the 2021GD, we restricted our sample to basin sizes up to 1000 km2. The 124 gauge time series available from GRDC fulfilling this criterion covers 69 years on average, adding up to 9799 years of observations in total. From each time series of mean daily streamflow in m3 s−1, we extracted the maximum value, i.e., the highest flood on record for each gauge. These maxima serve as an empirical upper bound for peak streamflow as a function of basin size. Henceforth, we refer to this data set as GRDC data.
The LUBW data set was collected to classify the peak flows observed in 2021 in terms of statistical return periods. We used peak discharge magnitudes for statistical return periods of 100, 200, 500, 1000, 5000, and 10 000 years (henceforth HQ100, HQ200, etc.) provided by the Landesanstalt für Umwelt Baden-Württemberg (LUBW) for all river gauges in the federal state of Baden-Württemberg. Ideally, such gauge data should have been used from the entire CReg region rather than from Baden-Württemberg only. However, as the CReg region extends over several federal states, it is impossible to gather consistent flood return periods for all gauges in the CReg region based on the same approach of extreme value statistics due to the water administration in Germany being under the responsibility of the federal states with varying technical and statistical approaches. As Baden-Württemberg has a large spatial overlap with the CReg region, we considered this data set comprising 355 gauges overall as a suitable basis to derive robust estimates of the relation between the magnitude of the 100-year flood and floods of higher return periods. Please note that while the GRDC data set is based on daily averaged data, the LUBW data are based on hourly data. For this reason, we derive daily averages of the 2021GD for comparison with the GRDC data and hourly values for comparison with the LUBW data. As mentioned in Part 1, we do not attempt to assign a particular return period to the event as the related uncertainties are very large. Nevertheless, we think there is an added value in using both the LUBW and GRDC data for a better classification of the July 2021 event in the historical context.
The third data set contains peak discharge values of major floods between 1804 and 2021 at gauge Altenahr (Ahr) – one of the basins most severely affected by the 2021 flood (Roggenkamp and Herget, 2022). The data are based on gauge recordings since 1946 and on reconstructions before. We use this data set to put the 2021 flood at the Ahr river into a larger historical perspective of local floods.
2.2 Model simulations
2.2.1 The regional climate model COSMO-CLM
Two ensemble data sets using the non-hydrostatic model of the Consortium for Small-scale Modeling (COSMO) in climate mode COSMO-CLM (CCLM; Sørland et al., 2021; Baldauf et al., 2011) were considered. One of them, the LAERTES-EU large regional ensemble (Ehmele et al., 2020) consists of CCLM simulations at a resolution of 0.22∘ (≈25 km). The simulations were performed within the MiKlip project (Marotzke et al., 2016), which developed an operational decadal prediction system based on the Max Planck Institute of Meteorology coupled Earth System Model (MPI-ESM) with a regional downscaling component (Feldmann et al., 2019). Several ensemble generations of initialized decadal hindcast simulations with a consistent model chain were combined into the LAERTES-EU ensemble, which consists of about 12 500 simulation years covering the present-day climate (the 20th century and the beginning of the 21st century). Regarding the limited intrinsic predictability of the atmosphere of about 12 to 15 d (e.g., Lorenz, 1982; Dalcher and Kalnay, 1987; Zhang et al., 2019), the individual members of LAERTES-EU can be considered independent as each member has an unaccounted spin-up of a few days to about 2 months. A positive precipitation bias of LAERTES-EU compared to observations was identified by Ehmele et al. (2020); hence, Ehmele et al. (2022) applied a bias correction via monthly quantile mapping using E-OBS (Haylock et al., 2008) as a reference, which reduced the bias significantly. By applying the bias-corrected LAERTES-EU ensemble to hydrologic modeling of major central European river basins, Ehmele et al. (2022) showed that LAERTES-EU enables statistically robust estimations of extreme events with very high return periods.
To assess the effect of climate change on extreme precipitation intensities and their return levels over complex topography, very high-resolution climate simulations are needed (Feldmann et al., 2013; Prein et al., 2015). For this purpose, an ensemble of regional climate simulations with CCLM at convection-permitting (CPM) resolution of 2.8 km was produced and applied in the context of the KLIWA (Klimaveränderung und Wasserwirtschaft) project (Schädler et al., 2018; Hackenbruch et al., 2016) at KIT (hereafter referred to as KIT-KLIWA). The KIT-KLIWA ensemble consists of transient simulations covering the time period from 1971 to 2100. Four general circulation models (GCMs) from the Coupled Model Intercomparison Project Phase 5 (CMIP5) (Taylor et al., 2012) using the representative concentration pathway emission scenario 8.5 (RCP8.5; Meinshausen et al., 2011) provided the boundary conditions for a three-step downscaling with CCLM, first to 50 km over Europe, second to 7 km over Germany, and finally to 2.8 km over southern Germany south of 52∘ N. Subsequently, a bias correction via monthly quantile mapping (Berg et al., 2012) was applied to the daily precipitation totals using the HYRAS data as a reference. An overview of the driving GCMs and realizations used for KIT-KLIWA can be found in Table S1 in the Supplement. The KIT-KLIWA simulations are analyzed regarding the extreme precipitation in a present-day reference period (1971 to 2000) and their changes under a global warming level (GWL) of +2 and +3 K (hereafter GWL2 and GWL3) with respect to pre-industrial (1881 to 1910) climate conditions. The method was adopted from Teichmann et al. (2018), who defined the GWL as a 30-year period centered around the year in which a GCM reaches the GWL for the first time. Consequently, this time period varies between the different GCMs used, but as a result, they represent similar climatic conditions. The GWL time periods in the respective GCMs can be found in Table S1. Note that the GWL refers to a global average and that regional warming levels might deviate from this.
2.2.2 Pseudo global warming experiments with WRF
To assess how the 2021 event would potentially unfold in the context of climate change, a storyline approach is applied (Shepherd, 2016). This approach complements the above-described probabilistic concept based on ensembles of (regional) climate model simulations to cope with the uncertainty in physical aspects of climate change. Additionally, this approach allows us to estimate the precipitation scaling for this specific event when increasing/decreasing the temperature and humidity (based on the CC scaling) in the initial and forcing data. However, the precipitation scaling does not necessarily have to follow the CC scaling, as a physical process (e.g., latent heat release feedback; Lenderink et al., 2017) can modify the moisture conversion, thus leading to super CC scaling behavior. With that, a series of PGW experiments with the WRF model (version 4.3; Skamarock et al., 2019) were performed. A control simulation at a CPM horizontal grid spacing of 0.0275∘ (≈2.8 km) driven by the fifth generation European Centre for Medium-Range Weather Forecasts (ECMWF) atmospheric reanalysis data (ERA5; Hersbach et al., 2020) was conducted to test the capability of the WRF model to simulate the precipitation event appropriately. All WRF simulations were initialized on 14 July 2021, 00:00 UTC and ran for 30 h until 15 July 2021, 06:00 UTC, with boundary conditions being updated hourly. To ensure that the simulated flood-triggering cyclone remains over the affected area, spectral nudging (von Storch et al., 2000) was applied to the large-scale wind fields above the planetary boundary layer. To account for the physical processes that are not explicitly resolved by the model, we used the following parameterization schemes: the rapid radiative transfer model RRTMG for shortwave and longwave radiations (Iacono et al., 2008), the Thompson microphysics scheme (Thompson et al., 2008), Zhang et al. (2011), the Mellor–Yamada–Janjic (MYJ) planetary boundary layer scheme (Janjić, 1994), the Noah land surface model (Chen et al., 1997), and the MYJ surface layer scheme (Janjić, 1994). For the PGW experiments, the control simulation was repeated with changes in the ERA5 initial and boundary conditions. In total, we performed 10 additional PGW experiments, with the temperatures of the initial and boundary data from ERA5 being either reduced to −2 K or increased to +3 K at an interval of 0.5 K. The control run (±0 K) uses the present-day conditions, which represent a global warming level of already +1.09 K (GWL1) according to IPCC (2022). Thus, a reduction of 1 K would represent temperatures as in the pre-industrial period (GWL0), while an increase of 2 K corresponds to GWL3. The relative humidity was kept constant by reducing or increasing the specific humidity of the initial and boundary data based on the Clausius–Clapeyron (CC) relationship, which describes that for every 1 K increase in temperature, there is an increase in humidity of 7 %.
2.2.3 Hydrological simulations with LARSIM
The results of the PGW simulations described in the previous section are used for additional hydrological modeling and analyses. Therefore, the operational flood forecasting model based on the hydrological Large Area Runoff Simulation Model (LARSIM) (Ludwig and Bremicker, 2006) for RP is used, which is operated by the water administration of RP. LARSIM is a semi-distributed, physics-based conceptual water balance model that captures all relevant processes related to the terrestrial water cycle and operates in hourly resolution. In Germany, it is in widespread use for operational flood forecasting and water balance modeling. For the PGW-based studies, the LARSIM model is used for the Ahr river upstream of gauge Altenahr (hereafter LARSIM-Ahr). The LARSIM-Ahr model consists of 561 subbasins, with an average area of 1.6 km2 per subbasin.
Three different simulations are performed with LARSIM-Ahr. The first run was forced with a spatially distributed rainfall product as presented by Bardossy et al. (2022). It is based on a comprehensive post-event collected set of rain gauge recordings from both public and private weather stations and rainfall estimates based on the signal attenuation in mobile phone networks. A comparison with radar-based rainfall estimates and estimates from public rain gauges only (Regenauer et al., 2022) demonstrated that this product allowed the most accurate simulation of the reconstructed flood peak at Altenahr. Hence, this reference was used as a basis for the hydrological PGW experiments. For the other two LARSIM-Ahr simulations, the PGW relations for −1 K (pre-industrial) and +2 K (GWL3) are used.
2.3 Methods
2.3.1 Return levels and periods
For both observations and model data, the return period (RP) TRP(x) of a precipitation event x or, vice versa, the return level (RL) for a given return period xRL(T) is derived using extreme value statistics. In line with Part 1, we used the three-parameter generalized Pareto distribution (GPD) and applied it to the KIT-KLIWA climate model ensemble (see Sect. 2.2.1) using the peaks-over-threshold (POT) approach (e.g., Wilks, 2006). The scale and shape parameters of the GPD were estimated using maximum likelihood estimation (MLE), while the 95 % percentile of the considered data series was used as the location parameter. After estimating the parameters, the statistical relation between the cumulative density function of the GPD FGPD and the corresponding return period T can be expressed as (e.g., Madsen et al., 1997; Brabson and Palutikof, 2000), where λ is the crossing rate (average number of events per year).
Adjusting such a statistical distribution function to a data series allows for extrapolating short data sets to higher return periods and also reduces the statistical uncertainty compared to an empirical return period estimation such as the block maximum method (e.g., Grieser et al., 2007; Bezak et al., 2014). Following Früh et al. (2010), reasonable results can be obtained for return periods up to one-third of the length of the time series.
In contrast to adjusting a statistical distribution, the empirical approach was applied to the LAERTES-EU data to determine return levels and periods up to 1000 years, which is adequate due to the large data amount of about 12 500 years. In this case, the return period estimation simplifies to , where L is the length of the data series and N is the number of occurrences (Gumbel, 1941).
2.3.2 Precipitation indices
In addition to the antecedent precipitation index (API) used in Part 1, the empirical heavy precipitation event criterion HPEcrit is applied to the HYRAS-DE data for the classification of precipitation events, which combines thresholds for magnitude and extension based on daily precipitation totals. A special feature of the July 2021 event was the rather wide area with high precipitation totals exceeding the 50-year return level according to the KOSTRA data (see the Supplement and cf. Part 1, Fig. S3). For HPEcrit, first, the 50-year return level of a KOSTRA grid cell (8×8 km2) is assigned to all HYRAS-DE grid cells (1×1 km2) that are geographically located in the same KOSTRA grid cell. Second, all contiguous HYRAS-DE grid cells exceeding the threshold are counted (area A). An event fulfilling HPEcrit is then defined when daily rainfall totals exceed the 50-year return level on a contiguous area A of at least 1000 km2, representing roughly medium-size river catchments like the Ahr and the Erft. Thus, comparable precipitation events in terms of magnitude and the affected area can be identified and characterized.
As demonstrated in Part 1, the disastrous nature of the July 2021 event originated from interactions of atmospheric, hydrological, and hydro-morphological processes and mechanisms that have interacted “optimally” at different spatial and temporal scales. In this section, we put these aspects of the event in a historical and statistical context to evaluate its rarity and to elaborate on probabilities of occurrence.
3.1 Meteorological perspective
For the classification of the July 2021 precipitation event in the historical context, we used (i) different thresholds and indices to identify similar historical events from observational data sets and (ii) the 12 500 years of the LAERTES-EU data to derive more comprehensive precipitation statistics under present-day climate conditions.
3.1.1 Event-based analyses
Applying the HPEcrit (Sect. 2.3.2) to the HYRAS-DE data set, in total 26 heavy precipitation events between 1951 and 2021 in Germany turned out to fulfill the criterion (see Table S2). The rainfall distributions of the eight most intense events are illustrated in Fig. 2, and the events ranked 9th to 26th are displayed in Fig. S1 (see the Supplement).
Among the list of HPEcrit events, there are a few prominent ones that had a severe impact: the precipitation event that led to the great Elbe flood in August 2002 (ranked 3rd; e.g., Ulbrich et al., 2003); the Elbe and Danube floods from July 1954 (e.g., Schröter et al., 2015), with the related precipitation events ranked 9th and 23rd; the flood events in the Alpine region and along the river Rhine in May 1999 (e.g., Frei et al., 2000), which is ranked 15th; the Berlin event in June 2017 (ranked 4th; e.g., Caldas-Alvarez et al., 2022a); or a precipitation event leading to flooding in the Oder river basin in August 1978 (ranked 1st; Marx, 1980).
The July 2021 event is ranked fifth (Fig. 2e), with approx. 8000 km2 above the 50-year return level. Regarding the spatial mean precipitation averaged over the HPEcrit area A (100.2 mm) and the maximum grid point precipitation (154.3 mm), the July 2021 is in the upper third of the events. Please note that the actual total event area and precipitation might not be fully captured by HYRAS-DE when the event is extended outside Germany. Hence, the position of the driving low-pressure system is crucial for the precipitation event reaching into the study area (namely Germany). This is the case for precipitation events close to the border such as 8 August 1978 (ranked 1st) or 12 August 2002 (ranked 3rd). Especially in the latter, significant precipitation totals were registered outside Germany (namely in the Czech Republic; e.g., Ulbrich et al., 2003), but also in the case of the July 2021 with widespread high precipitation totals mainly in the riparian countries Belgium and Luxembourg (e.g., Schäfer et al., 2021; Junghänel et al., 2021; Dewals et al., 2021; MeteoLux, 2021).
It is striking that almost all events took place during the warm season between May and September and that 11 of these 26 events occurred in the last 20 years, with three events in 2002 and three in 2021 alone (Table S2). For the nine top-ranked events, the affected area (within Germany) covers between 6500 and 21 000 km2, while the spatial coverage of the lower-ranked events is below 4000 km2. Furthermore, the majority of events (20 out of 26; 77 %) affected regions in northern, eastern, or southern Germany with some regions being affected multiple times (Figs. 2 and S1). Hence, the July 2021 event was unique for that particular western part of Germany.
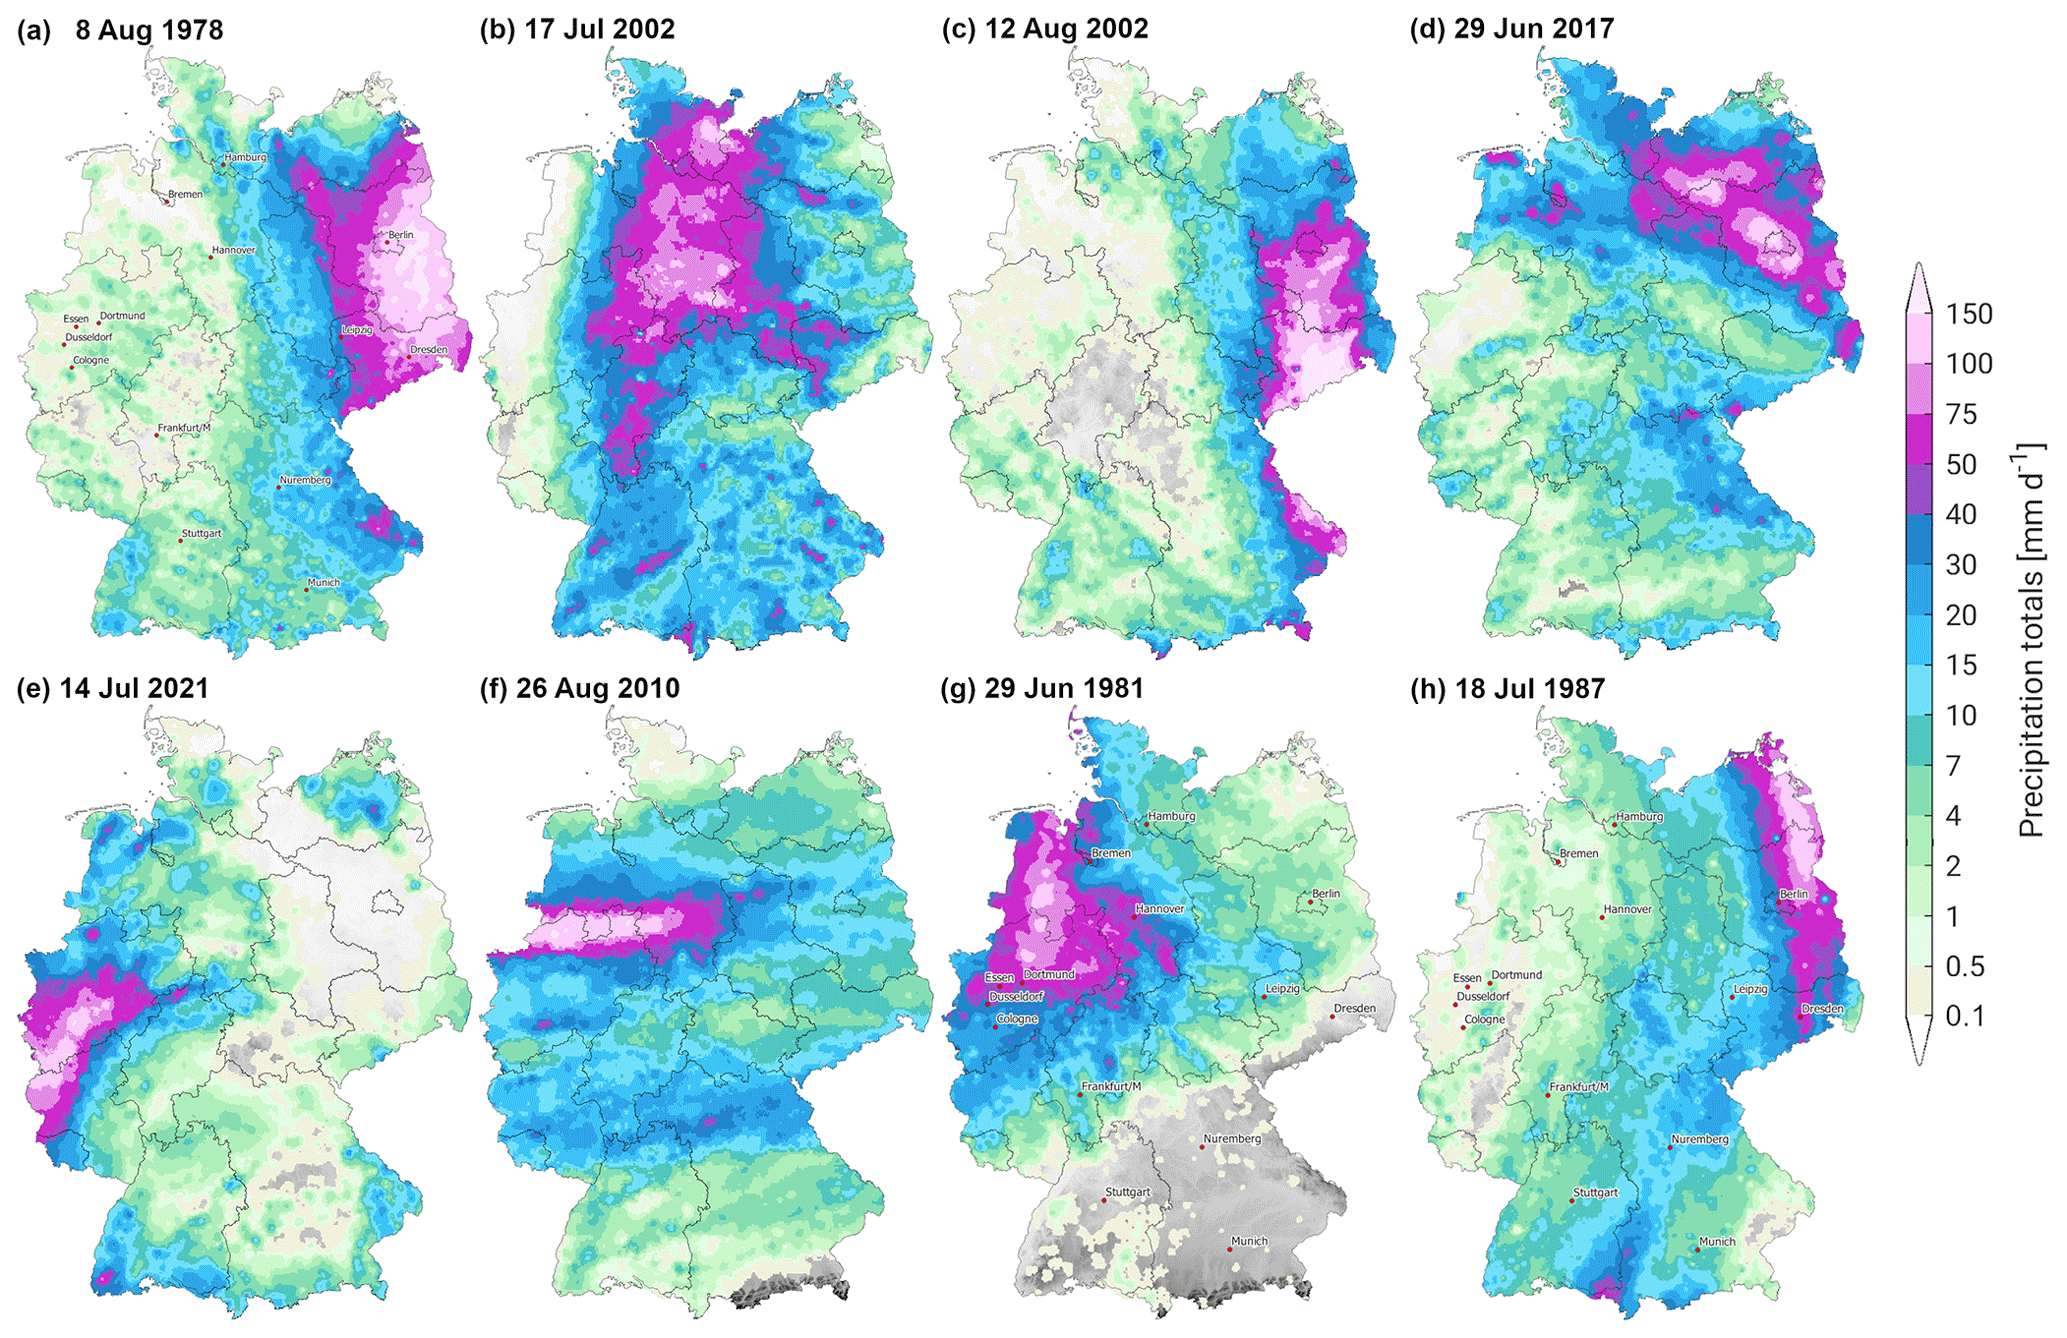
Figure 2The most intense precipitation events in Germany ranked first (a) to eighth (h) according to the HPEcrit criterion based on daily (05:50 to 05:50 UTC) HYRAS-DE data from 1951 to 2021. The July 2021 event is ranked fifth (e). See also Table S2 for further statistics of the events.
For the same list of events, the normalized antecedent precipitation index (NAPI; see the Supplement) was additionally calculated over the HPEcrit area A in order to better capture the preconditions of the events and their possible role in the impacts. Figure 3 shows the NAPI (bubble size) in relation to the spatial mean and the maximum grid point precipitation also calculated over A. The majority of the events (about 65 %) have a NAPI between 0 and 2, meaning that the events occurred after normal or slightly too wet periods compared to the climatology. Furthermore, most events show a linear relation between spatial mean and maximum intensity, indicating a more homogeneous distribution of precipitation intensities within A. Some of the most extreme events according to HPEcrit (namely rank 2 to 5, 7, and 9 including the July 2021 event) show an emphasis towards higher locally enhanced precipitation maximums and, therefore, are located more to the right in Fig. 3. This intensification can often be related to embedded convection initiated by orography (e.g., Fuhrer and Schär, 2005; Cannon et al., 2012) or frontal systems (e.g., Trier et al., 1991; Weckwerth and Parsons, 2006).
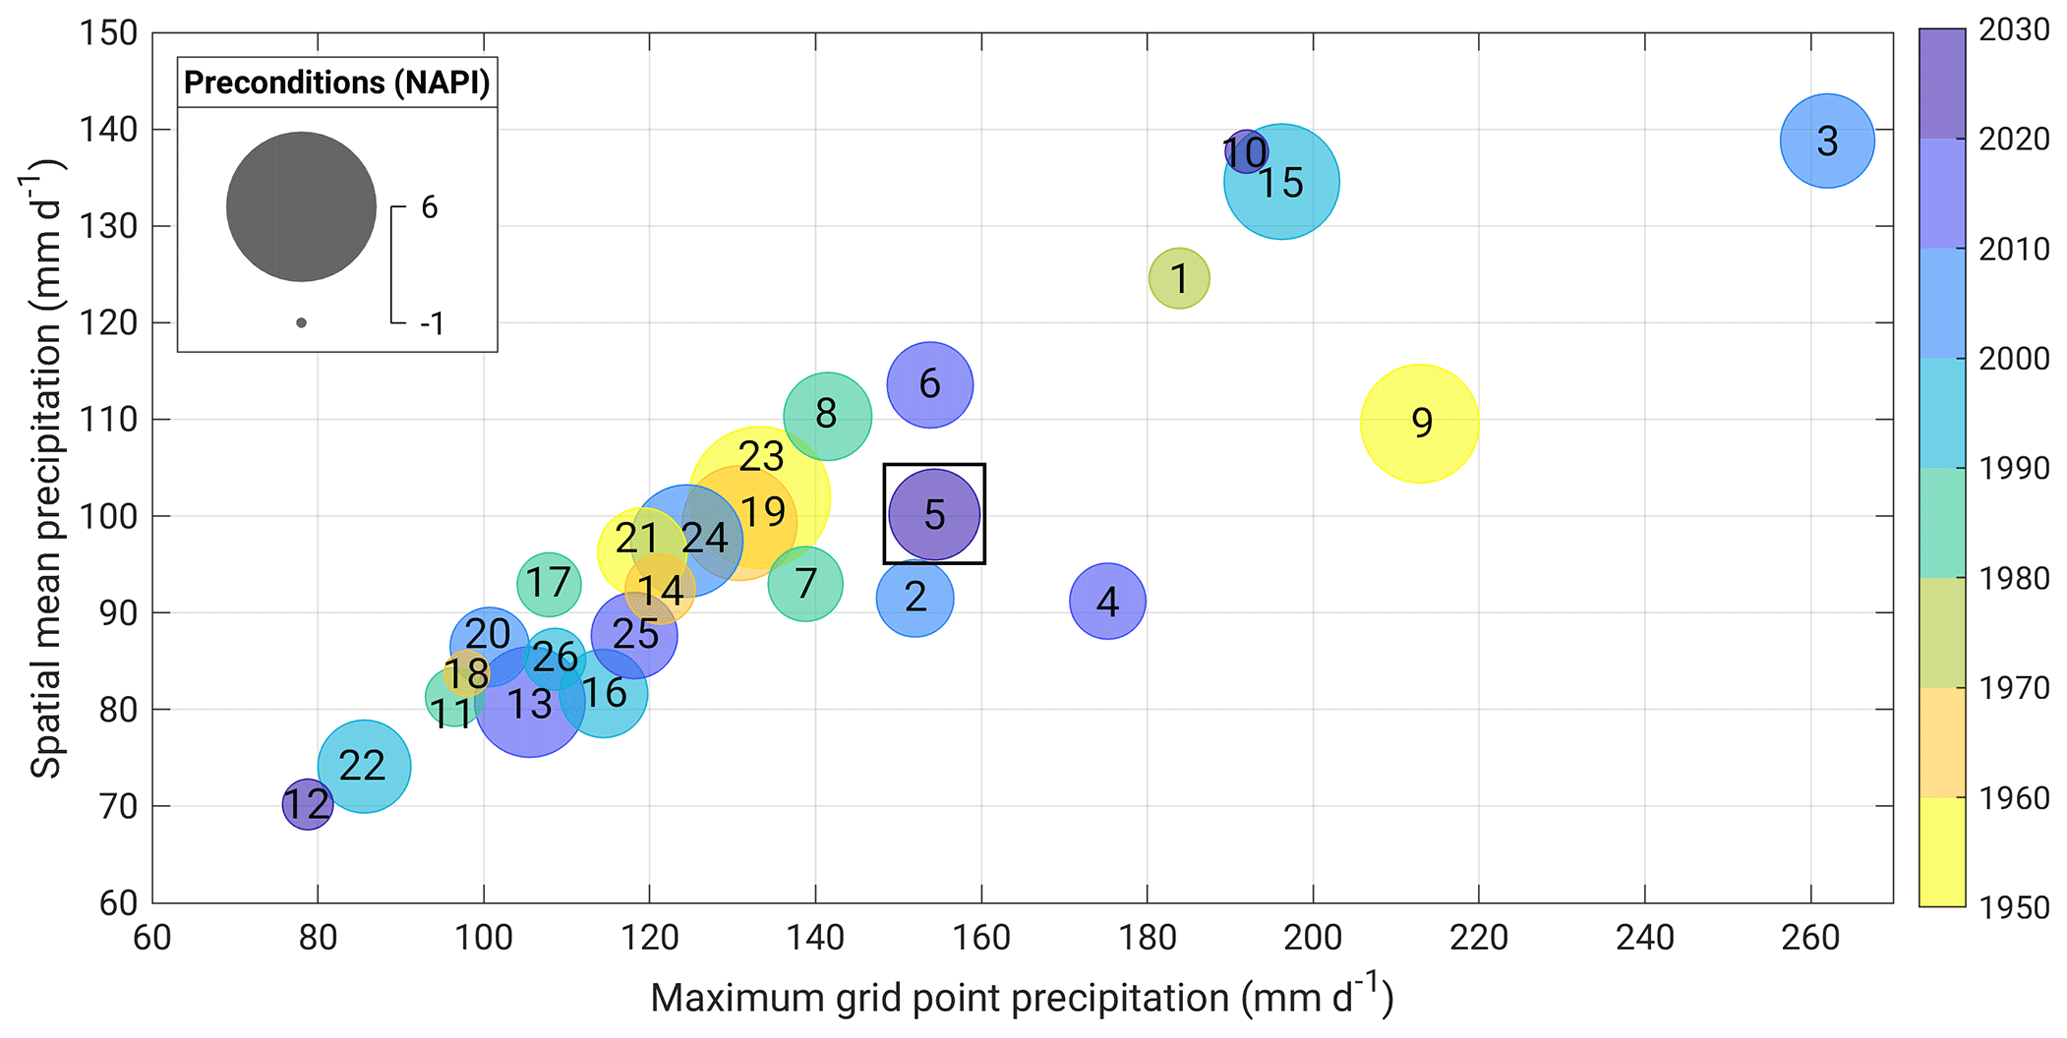
Figure 3Bubble plot of the most extreme precipitation events in Germany according to the HPEcrit based on daily HYRAS-DE data (1951 to 2021). The maximum 24 h grid point intensity within the HPEcrit area A is given on the x axis; the y axis represents the spatially averaged 24 h precipitation over A. The size of the bubbles (small inset legend at the top left) represents the preconditions using the normalized antecedent precipitation index (NAPI, see the Supplement), while the color indicates the decade of occurrence. The numbers give the ranking according to the HPEcrit (see Table S2). The July 2021 event (ranked fifth) is marked with a rectangle.
The aforementioned results pointed out a higher level of diversity among the top events in Germany regarding mean and maximum intensity and affected area. The relation between intensity and extent is now analyzed, determining the spatial mean daily precipitation totals on different area dimensions based on HYRAS-DE (Fig. 4). Therefore, we continuously increased the precipitation threshold from 0 mm to event maximum and determined the area of contiguous grid cells that exceeded this threshold. The majority of events accumulate in a band ranging from 95 to 130 mm d−1 on an area of 100 km2, and 75 to 110 mm d−1 on 1000 km2 to a range of 40 to 80 mm d−1 on 10 000 km2 (Fig. 4, gray-shaded area). The top eight events are mostly located above this band (Fig. 4, colored lines). The top-ranked event (according to the HPEcrit) of 8 August 1978, for example, is placed well above this band up to area dimensions of 50 000 km2 (Fig. 4, black line). For smaller areas below 4000 km2, the event of 12 August 2002 (HPEcrit rank 3) is outstanding. The July 2021 event (Fig. 4, blue line) is also located above the majority band for areas up to 10 000 km2 and within this band for extensions above. For areas above approx. 30 000 km2, the July 2021 event is even placed at the lower boundary of the majority band. Figure 4 underpins the previously shown results in the sense that the July 2021 event was special but not exceptional on small to medium spatial scales regarding the precipitation intensities compared to other historical events.
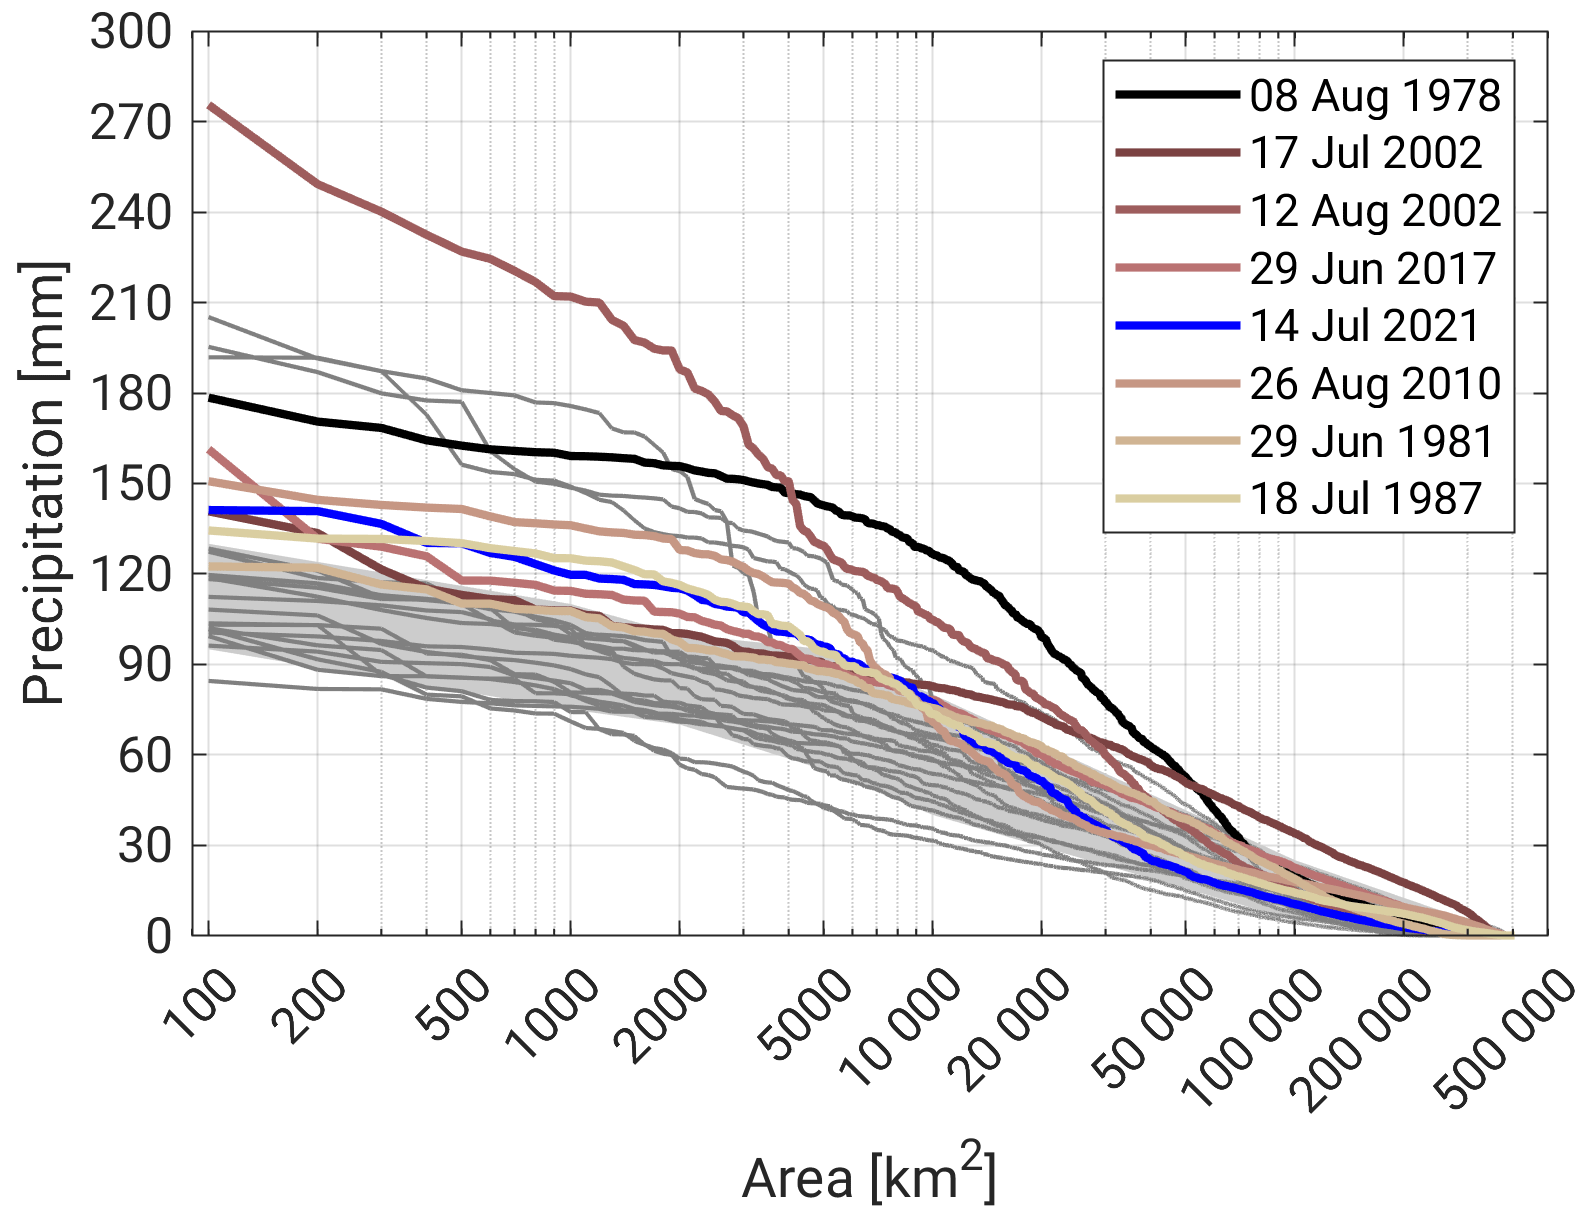
Figure 4Relationship between precipitation totals and affected area (contiguous grid cells) for the 26 strongest precipitation events in Germany based on HYRAS-DE (1951 to 2021), applying the HPEcrit criterion (see Table S2). The colored lines represent the top eight events (same as in Fig. 2), with the blue line indicating the July 2021 event. The shaded area marks the range in which more than 50 % of the events are located.
3.1.2 Statistical analyses
In order to derive more comprehensive statistics of precipitation events, the 12 500 years of bias-corrected LAERTES-EU data were used considering the total area CReg. In doing so, the spatial representativeness of the derived statistics is increased, and the influence of events occurring randomly at a specific local position is limited. The observed values of the July 2021 event were taken from RADOLAN, which in this context was interpolated to the 0.22∘ grid of LAERTES-EU for better comparison.
The relation between precipitation intensity and the affected area for 24 h precipitation totals and different return periods within LAERTES-EU is shown in Fig. 5. Similar to Fig. 4, we continuously increased the precipitation threshold and determined the area of contiguous grid cells exceeding this threshold. In a second step, the number of occurrences of each area–intensity combination within the 12 500 years of LAERTES-EU is counted, which can then be converted to return periods. The maximum return period of roughly 10 years was reached for a contiguous area of approx. 15 000 km2, with all grid points having 60 mm or more (Fig. 5, blue line). Most of the other size ranges are below the 2-year return level. Using the fixed-sized SReg and LReg areas (Fig. 5, blue marks), the spatial mean precipitation according to RADOLAN during the July 2021 event was 78.4 mm in 24 h for SReg, corresponding to a return period of 5 years according to LAERTES-EU. For the larger LReg, the observed spatial mean of 55.4 mm corresponds to a return period of 20 years. Considering only LAERTES-EU data for LReg or SReg, the return periods are between 100 and 200 years (not shown), which confirms the result of the previous section that most of the events took place in eastern and southern Germany (Sect. 3.1.1).
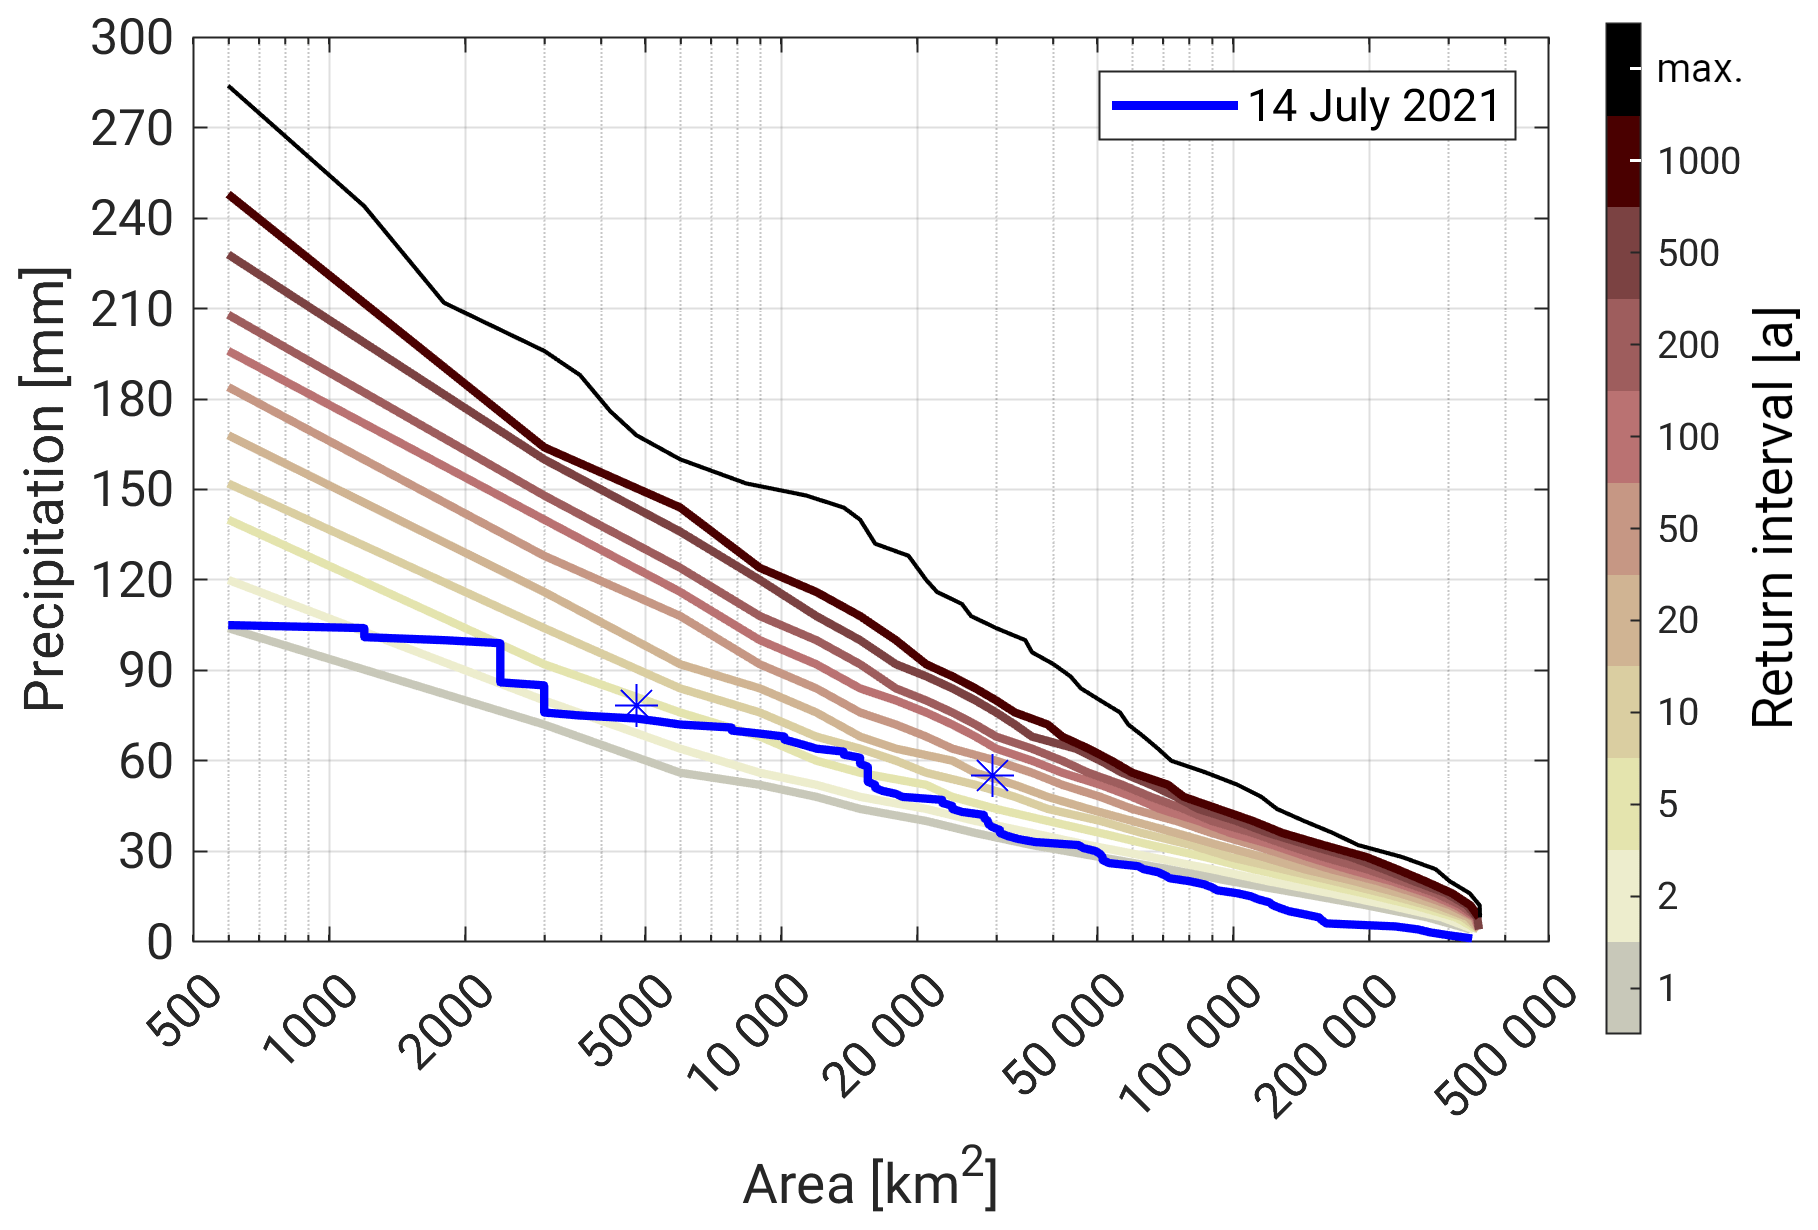
Figure 5Empirical return periods (colored curves) estimated from the bias-corrected LAERTES-EU data set for precipitation clusters (affected area of contiguous grid points, x axis) above certain precipitation thresholds (y axis) for 24 h totals. The uppermost solid black line represents the maximum values within LAERTES-EU equivalent to a return period of one in 12 500 years. The blue curve represents the July 2021 event (based on RADOLAN interpolated to the 0.22∘ grid); the two blue marks indicate the spatial means for LReg and SReg.
The results of the spatial analysis are in line with those of Part 1 and the findings of the previous section that the location of the extended precipitation field of the July 2021 event was special. Furthermore, Part 1 illustrated that some members of the DWD weather forecast ensemble ICON-D2-EPS predicted even higher precipitation totals in the LReg region (cf. Part 1, Fig. 4). The maximum predicted spatial mean precipitation amount for LReg was 78.4 mm in 24 h, which has an equivalent return period even in LAERTES-EU of 500 to 1000 years when considering the total CReg area (3000 years when considering LReg data only), indicating the hazardous potential of the atmospheric conditions.
In order to also classify and contextualize the above-mentioned results in the context of the 2021 event, the 26 top-ranked historical events analyzed in the previous section were also put into the statistical LAERTES-EU context deriving the maximum precipitation return period and the affected area by this return level (see Table S2, last two columns). The top events show diverse characteristics with return periods between less than 1 year and more than 1000 years for areas between 500 and 80 000 km2. Compared to the July 2021 event, there were historical events for which a lower maximum return period was reached at larger affected areas and vice versa. However, only two other events (8 August 1978, HPEcrit ranked first, and 17 July 2002, HPEcrit ranked eighth) reached the same order of return period (50 or more years) over a comparable order of area size (10 000 to 20 000 km2), emphasizing that this combination of occurrence probability and extent was exceptional during the July 2021 event.
3.2 Hydrological perspective
In this section, different discharge gauging data sets are used to first classify the July 2021 flood event in a statistical context in the greater CReg region. In the second step, historical records for the mainly affected Ahr valley are used to specify the flood in this particular region.
3.2.1 Comparison to GRDC data
In Fig. 6, the daily mean peak streamflows of the 2021GD (in red) and the GRDC data (in blue) are shown as a function of basin size (up to 1000 km2). For the latter, the maximum daily mean value in the data set for each gauge is used. Both data sets show a linear dependency between peak streamflow and basin size. The 2021GD values clearly appear at the upper envelope of the GRDC data. For an objective assessment of the placement of the 2021GD data in the GRDC data, we first calculated for each gauge the specific peak streamflow by dividing the peak streamflow by the upstream catchment size and then ordered the gauges in descending order. Out of the overall 152 values, the 2021GD data received an average rank of 22.8, which is clearly above the mean rank of . At several gauges, even the daily mean streamflow (Table 1) exceeded the statistical 100-year return level (HQ100). Overall, this underlines the exceptional nature of the 2021 flood event, especially when bearing in mind that the total number of observations in the GRDC data sets cover almost 10 000 years of observations.
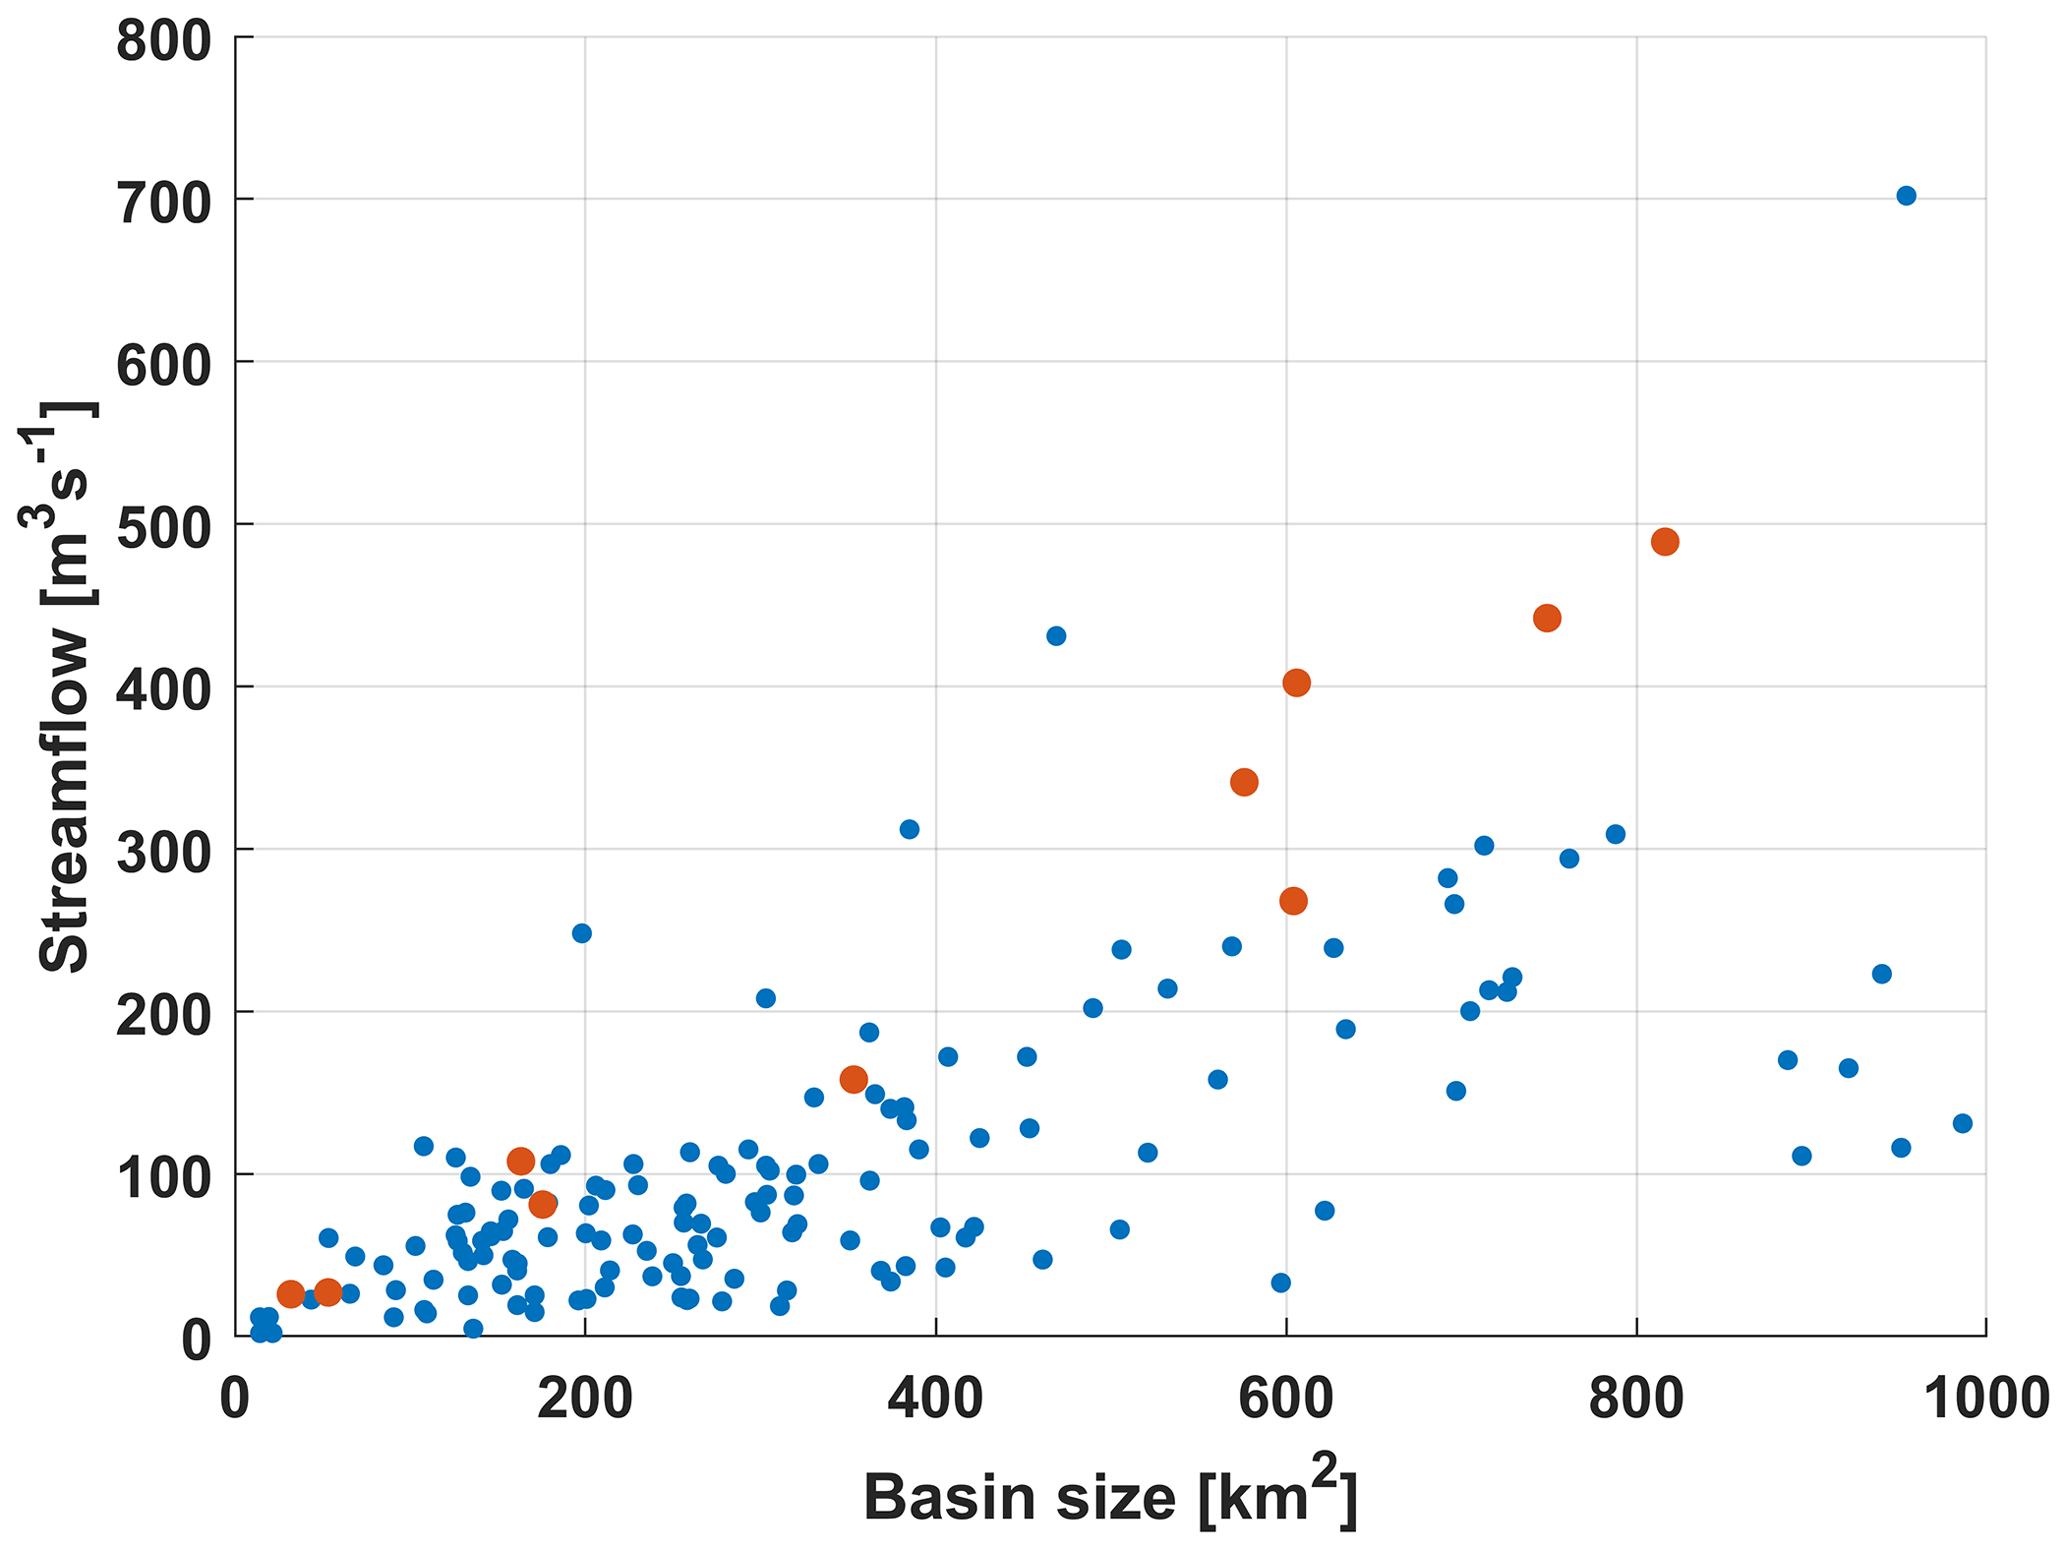
Figure 6Relation between basin size and daily mean streamflow for the 124 gauges in the CReg region (GRDC data set; blue dots) and the estimated maximum values of the 2021 flood event at 10 gauges in the LReg area (2021GD; red dots). For GRDC, the maximum daily mean streamflow for each gauge in the data set is used (see also Table 1). The location of the 2021GD stations is shown in Part 1, Fig. 1, and additional information is given in Part 1, Table 1.
3.2.2 Comparison to LUBW data
In this section, we put the 2021GD set into the perspective of floods with given return periods. To do so, we first calculated for each 2021GD gauge the ratio between the 2021 peak flow and the gauge-specific HQ100 value (cf. also Part 1, Table 1). We used the HQ100 value as a reference as it (i) is a widely used design value (e.g., LUBW, 2005) and (ii) should be a relatively robust statistical measure given the on average 51 years of observation at the gauges. The peak factors are shown in Table 1. Please note that we use the estimate of 900 to 1000 m3 s−1 provided by the water administration of RP (cf. Part 1, Sect. 3.2) rather than the estimate of 1000 to 1200 m3 s−1 based on hydraulic considerations by Roggenkamp and Herget (2022) for the peak discharge and peak factor calculation at gauge Altenahr (Ahr).
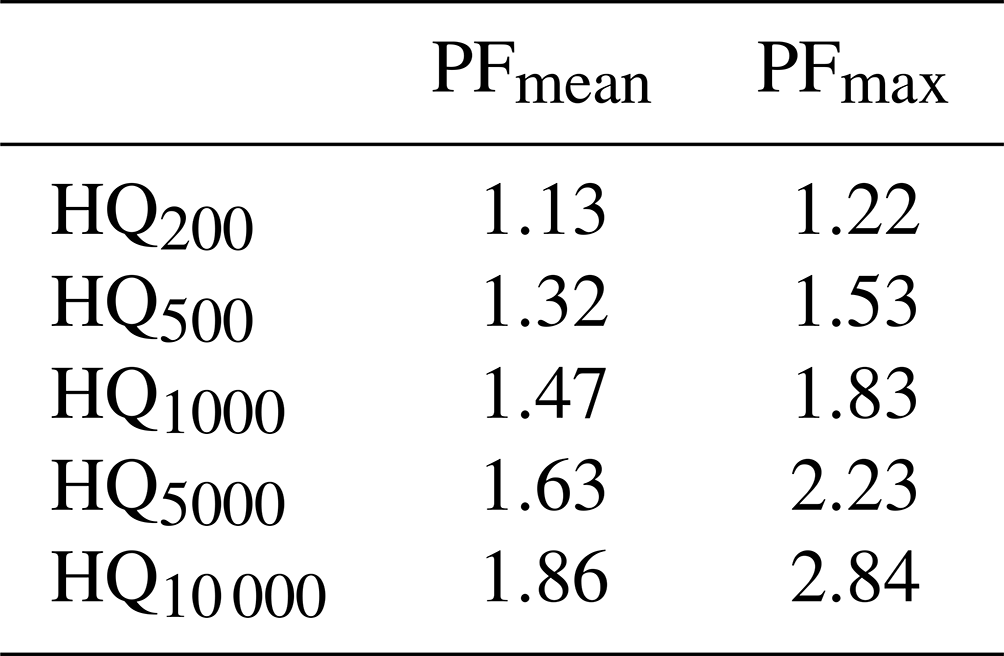
At all 2021GD gauges, the 2021 flood clearly exceeded the HQ100, indicated by all peak factors exceeding the value of one, ranging from 1.7 at gauge Jünkerath (river Kyll) to 7.3 at gauge Bliesheim (Erft) (Table 1). To put these factors into a larger statistical perspective, we calculated a similar peak factor for all gauges in the LUBW data set, but this time between the HQ100 and all other return periods. In Table 2, for each return period both the mean and the maximum statistical peak factors from all 355 gauges are shown. The values in Table 2 thus provide a robust reference to broadly classify the 2021GD in terms of a few other return periods.
Table 1Gauges of the 2021GD data set in the LReg area (adopted from Part 1, Table 1): indicates the daily mean streamflow, and is the peak discharge of the July 2021 flood event (values are estimates); HQ100 indicates a flood with a statistical 100-year return period. The peak factor PF is defined as divided by HQ100. Additionally, the upstream catchment size Aupstream is given.
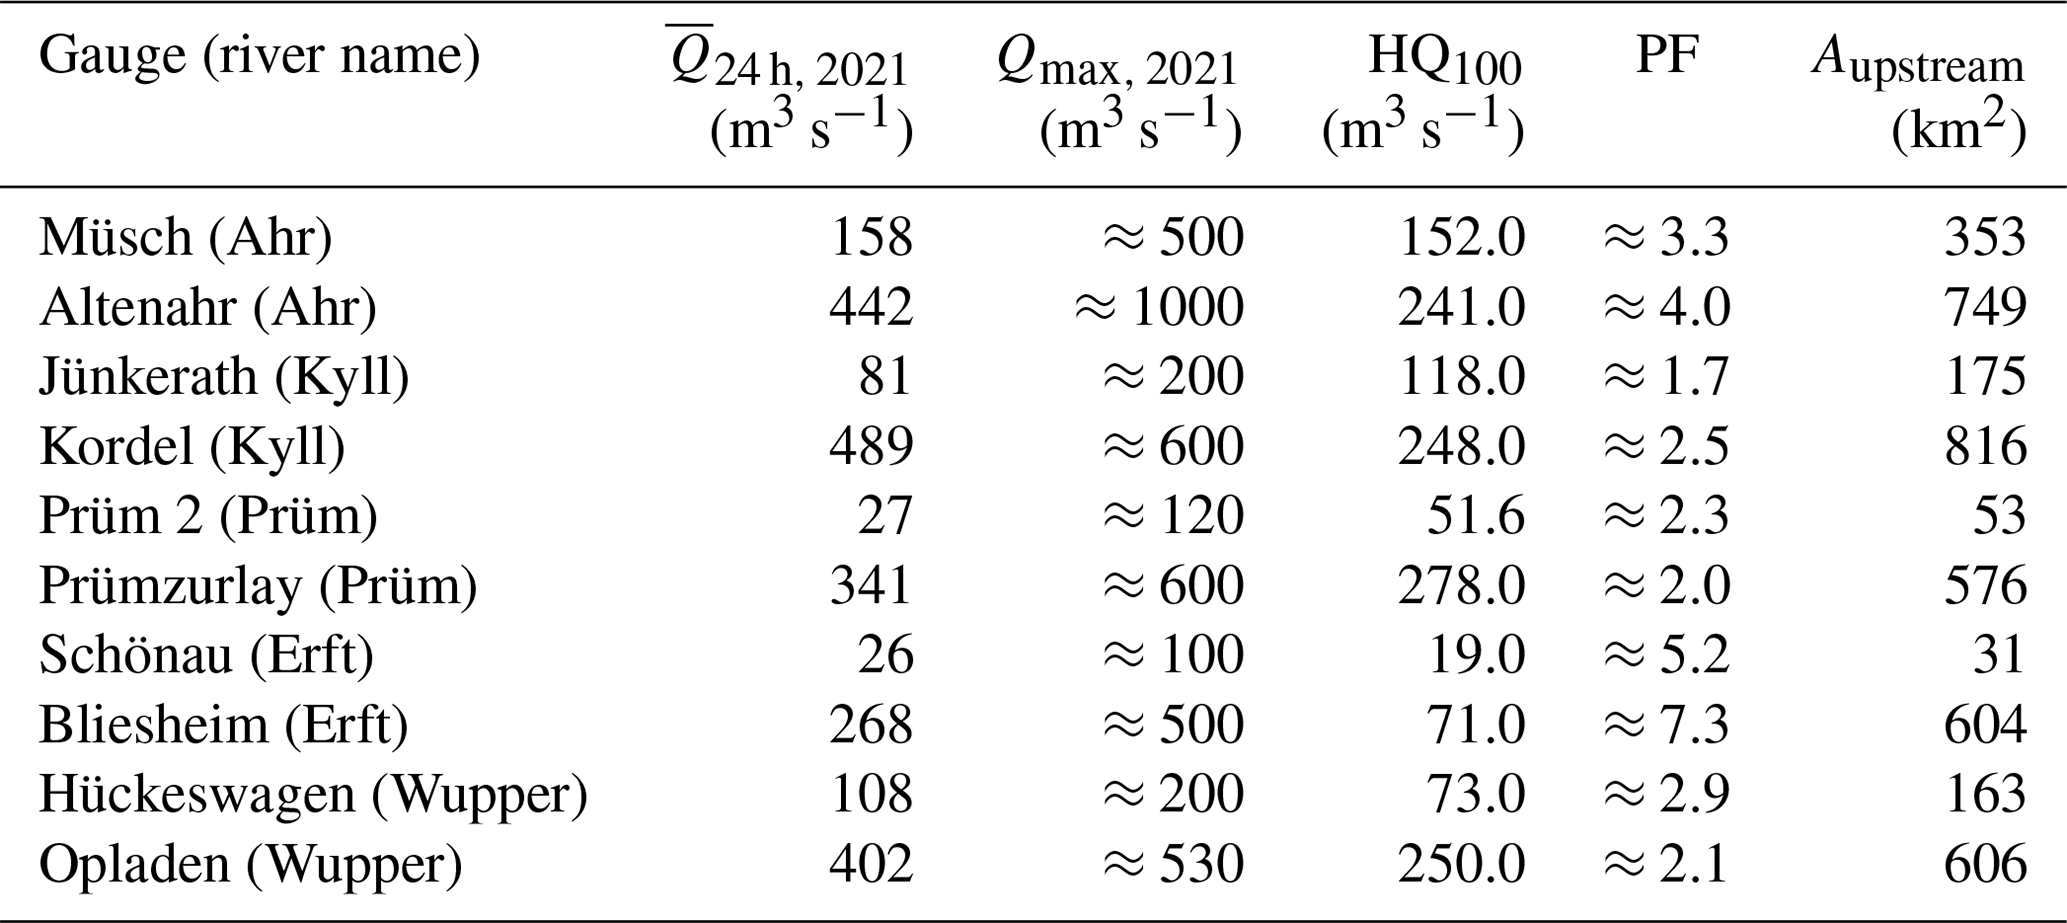
Table 2Statistical peak factors (PFs) for the LUBW data set. The statistical peak factor is defined as HQX (X= 200, 500, 1000, 5000, 10 000) divided by HQ100, separately for each gauge in the data set. PFmean is the mean peak factor of all 355 gauges, and PFmax is the largest factor.
Even the smallest peak factor of 1.7 from Table 1 places the 2021 flood into the order of magnitude of HQ5000 to HQ10 000 compared to the mean and HQ500 to HQ1000 compared to the maximum. The average peak factor of 3.3 (mean of all values in the PF column of Table 1) places the 2021 flood well beyond an HQ10 000, both for mean and maximum. Similar to the comparison with the GRDC data, this underlines the exceptional nature of the 2021 flood. Finally, the maximum peak factor of 7.3 from Table 1 is so far beyond the peak factors in Table 2 and, hence, so far beyond an HQ10 000 that it raises doubts about the validity of evaluating the 2021 flood in terms of statistical return periods using short-run flow data. We will further investigate this matter in the next subsection.
3.2.3 Comparison to historical data
In this section, we focus on gauge Altenahr (river Ahr), which is selected for two reasons: first, it is placed in a region that is among the most severely affected by the 2021 flood (see Part 1); second, long-term historical records are available for this gauge, which are helpful to illuminate the problem of estimating return periods of exceptional flood events.
Figure 7 shows the available flood events at gauge Altenahr. The events in orange are the 10 largest flood events in the gauge recordings starting in 1946. The gauge recordings from 1947–2016 were the basis for the HQ100 estimate (241 m3 s−1) by the water administration of RP. The blue dots are historical floods, notably the 1804 and 1910 events, for which peak discharge estimates are provided by Roggenkamp and Herget (2014a, b, 2022). The red dots indicate the range of the 2021 flood peak estimated by the water authority of RP, and the black crosses indicate the range of the 2021 flood peak estimated by Roggenkamp and Herget (2022) based on gauge recordings and reconstructions. It is clearly visible that the gauge recordings since 1946 do not cover the entire range of the historical flood events, which renders the HQ100 based only on these values non-representative. Acknowledging this, the water authority of RP recently provided an updated HQ100 estimate of 434 m3 s−1 based on the entire time series from 1804 to 2021 (including the 2021 flood) as shown in Fig. 7 (Yvonne Henrichs, Water Administration of Rhineland-Palatinate, LfU, personal communication in the context of flood hazard maps, 2022). Based on the updated HQ100, the peak factor for gauge Altenahr of the 2021 event reduces from approx. 4.0 (see Table 1) to approx. 2.3. Comparing the updated value to the values in Table 2 still places the 2021 event at Altenahr in the order of magnitude of an HQ10 000 compared to the mean and an HQ5000 to HQ10 000 compared to the maximum.
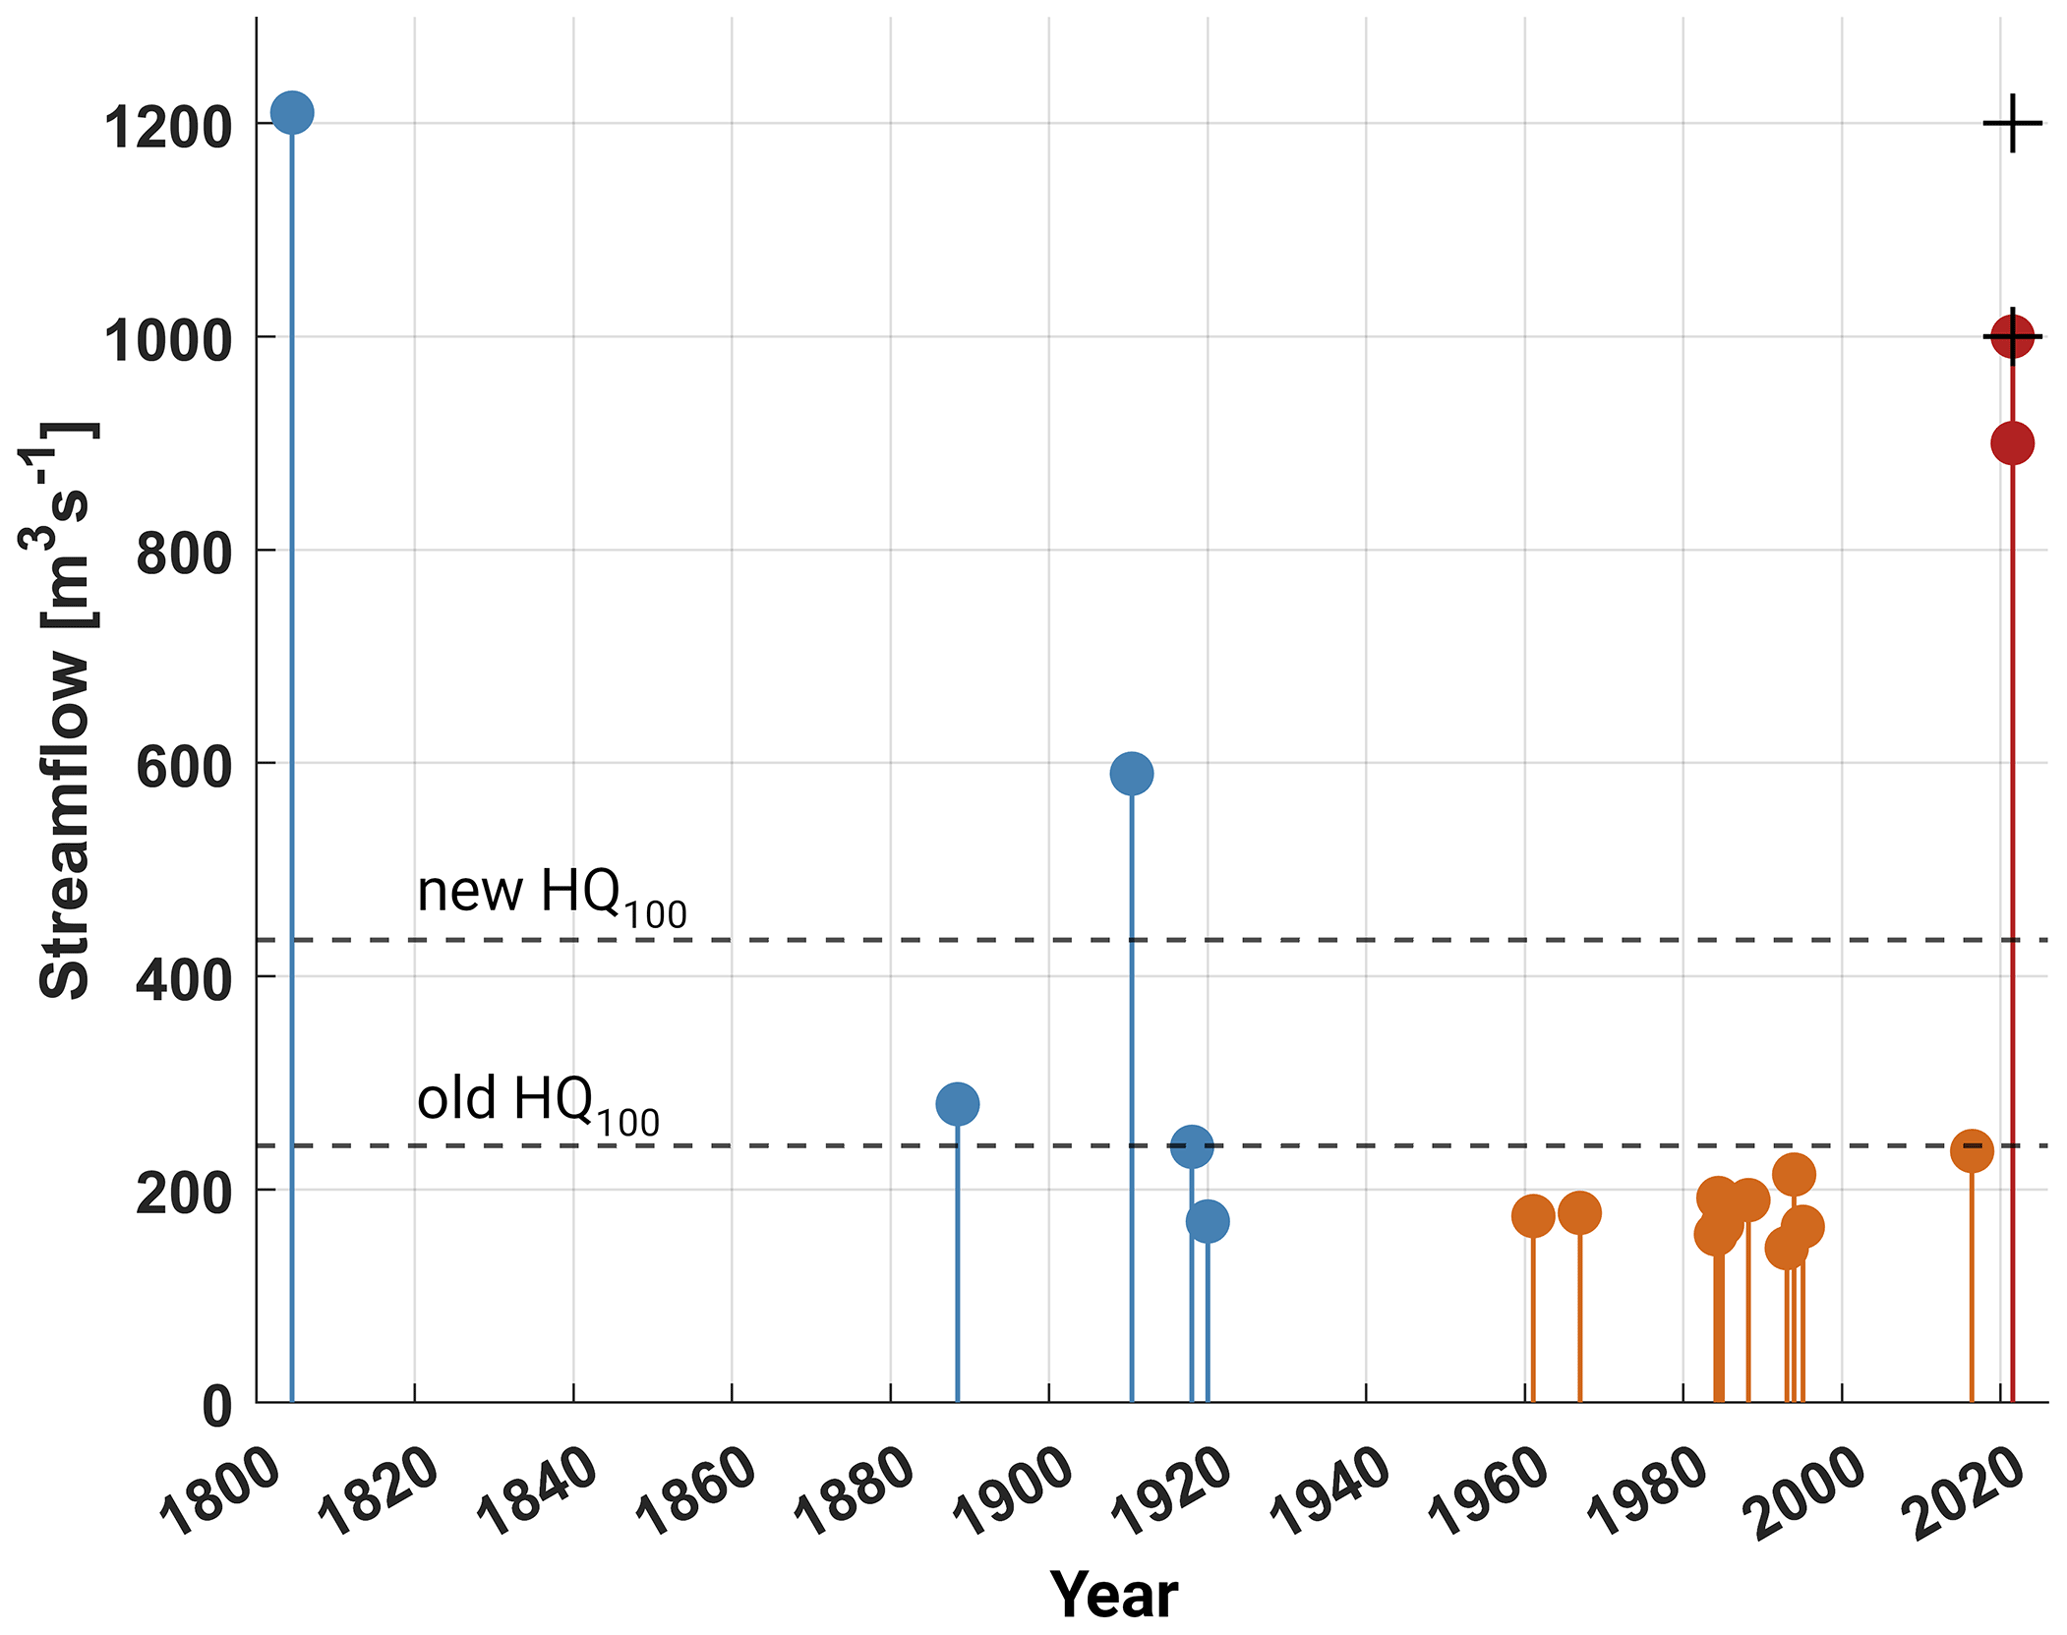
Figure 7Time series of selected flood peaks at gauge Altenahr (Ahr). The blue dots are reconstructions (modified from Roggenkamp and Herget, 2022); the orange dots are the 10 largest floods in the gauge recordings (starting 1946), provided by the water authority of Rhineland-Palatinate; the red dots indicate the range of the 2021 flood peak estimated by the water authority of Rhineland-Palatinate; and the black crosses indicate the range of the 2021 flood peak estimated by Roggenkamp and Herget (2022) based on gauge recordings and reconstructions. The two dashed lines indicate the official HQ100 estimates using only instrumental recordings (since 1946; old HQ100=241 m3 s−1) and a new approach including historical sources (new HQ100=434 m3 s−1).
With the purpose of showing the limitations of extreme value statistics based on non-representative samples, Vorogushyn et al. (2022) also estimated the return period of the 2021 flood at gauge Altenahr based on recorded data from 1949 to 2019 only, which means without considering the historical and 2021 floods. The resulting return period of over 108 years is very unrealistic. Including historical floods since 1804, the same authors again estimated the return period of the 2021 flood to be in the order of magnitude of an HQ10 000, and the HQ100 to be about 300 m3 s−1. Note that the authors did not include the 2021 flood into their pool of events, while Yvonne Henrichs(Water Administration of Rhineland-Palatinate, LfU, personal communication in the context of flood hazard maps, 2022) did, which partly explains the differences between the two HQ100 estimates. Using the HQ100 estimate by Vorogushyn et al. (2022), the peak factor of the 2021 flood is about 3.0.
It is noteworthy that Vorogushyn et al. (2022) reported difficulties when fitting a generalized extreme value distribution to the data and suggest the existence of a mixed rather than a single distribution, where the extreme floods of 1804, 1910, and 2021 come from a separate distribution. A possible explanation for such a mixed flood distribution could be the existence of rare but extreme weather situations responsible for unusually large floods and/or the onset of special rainfall-runoff mechanisms only in the case of extreme rainfall. Again, this underlines the challenges of extreme value statistics and the large uncertainties when estimating return periods for the 2021 event. It also indicates the need for even longer historical time series and reconstructions as far as possible and/or the examination of the completeness of the events between 1804 and 1946 as well as before 1804, where there is evidence that over 70 floods occurred in the Ahr river basin since the year 1500, including the large 1601 event (Seel, 1983). In addition, 1818 and 1848 were also large events with currently no reconstructed streamflows.
3.3 Hydro-morphodynamical perspective
In this section, we analyze hydrodynamic and morphodynamic processes which occurred in both the Ahr and the Erft valleys, with the main focus on the following aspects that condition the downstream hazard: (i) the anthropogenic influence on the hydro-morphodynamic processes in rivers that occurred in the last century, (ii) large debris and sediment which enhance the flood hazard, and (iii) landscape modifications due to urbanization. For the location of the discussed cases, we refer to maps given in Part 1, Figs. 1 and 10.
Regarding (i), an example of the consequences of the anthropogenic transformation of the morphology of the valley over time is the case of Dernau (see Part 1). As discussed in Part 1, the construction of a valley bottleneck increased substantially the flood levels recorded in July 2021 when compared to the flood event with a similar discharge in 1804. The changes in valley morphology due to the construction of the railroad (Ahrtalbahn) in the 1880s with several bridges that created bottlenecks downstream of the town of Dernau may be the reason for more severe inundation levels during the 2021 flood event.
The road tunnel in Altenahr (see Part 1) is another example of an anthropogenic modification of the valley. It bypassed the flood which, to a limited extent, is expected to have increased the downstream peak discharge when compared to the prior situation. However, the main observable effect of the tunnel was the sediment deposition that occurred in the bypassed meander due to the reduction of flow within it. This road tunnel was constructed in 1834, and notably, the same flow bypassing happened already in the past during the 1910 flood (Fig. 8). The final configuration of the slope and the tunnel toe after the passage of both floods shows striking similarities. An uncomfortable sensation of déjà vu suggests the importance of considering historical records and information in the preparation and planning for future flood events.
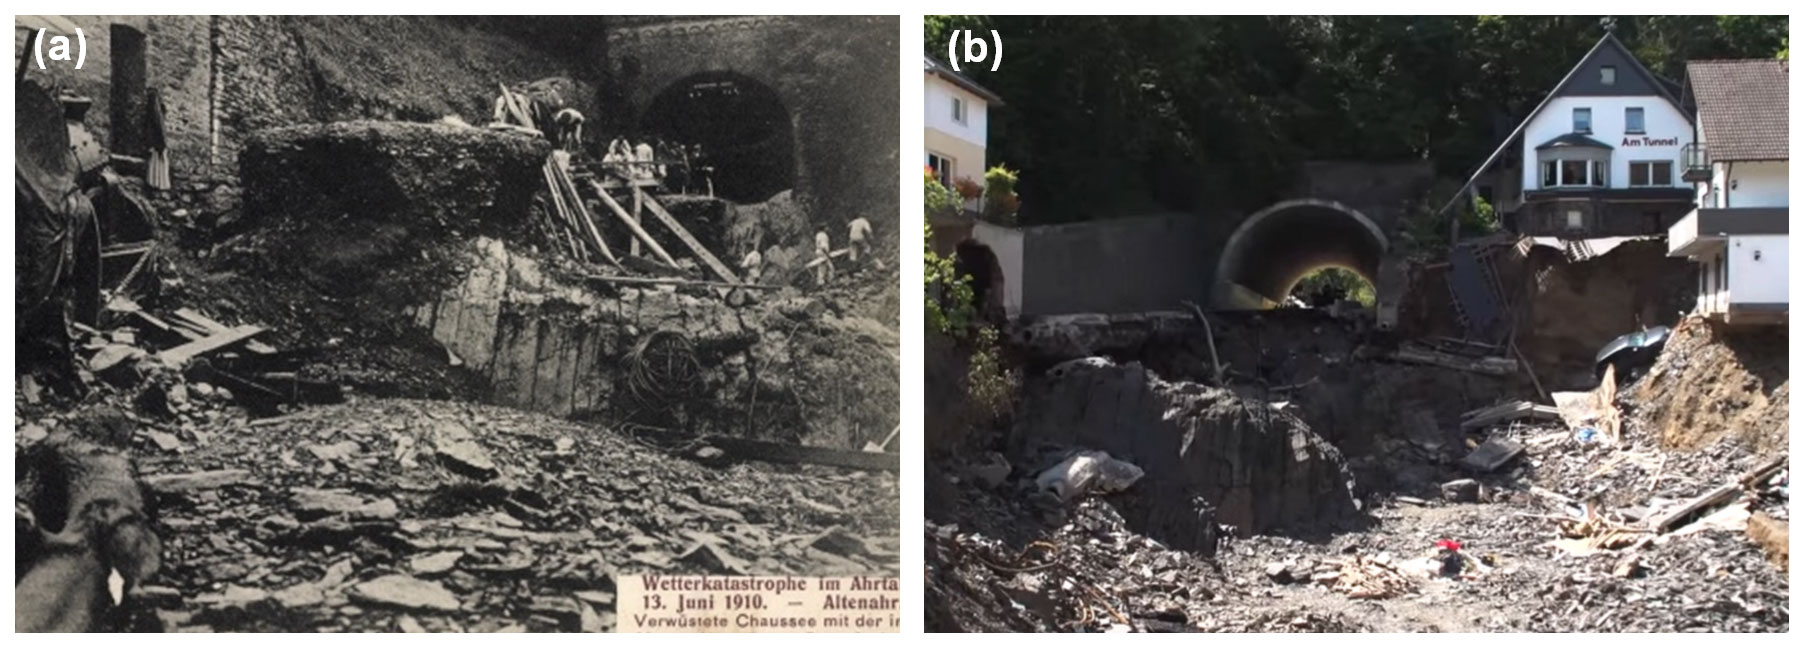
Figure 8Downstream end of the road tunnel in Altenahr after (a) the flood of 1910 (photo credits: Kreisarchiv Ahrweiler) and (b) the flood of 2021 (photo credits: Dieter Könnes).
Besides bridges or tunnels, which are the most visible and paradigmatic historical changes of anthropogenic nature in the valley morphology, the construction of buildings, infrastructure, and industrial equipment add singularities to the landscape, which are capable of landscape alteration. One example was the case of the large-scale erosion episode that originated in the mining pit in Blessem (Erftstadt) in the Erft catchment. This mining pit, which was under exploration, triggered a large-scale process of retro-dendritic erosion. A cavity that formed due to this process caused the destruction of houses and furthermore a change of the course of the river caused by the breach and collapse of the Erft riverbank that endangered the nearby highway. The occurrence of such landscape changes can introduce local landscape fragility, but they can also be used as opportunities to retain flood volumes having a positive effect on flood attenuation, as also happened in Blessem (see Part 1).
Regarding (ii), the inclusion of sediment and linked geomorphological processes in the analysis of flood risk is discussed by several authors (e.g., Best et al., 2022). However, images of the July 2021 flood showed that sediments or natural dead wood and vegetation contributed only a small portion to the total accumulated debris, but that the nature of the debris changed considerably towards a high volume of industrial elements such as vehicles and caravans, bins and containers, and construction materials (cf. cover photo at RedaktionsNetzwerk Deutschland, 2022, Ein Jahr nach der Flutkatastrophe: So geht es den Menschen im Ahrtal.).
Regarding (iii), parts of the Ahr valley, which historically would be occupied during flood events and which often are preferential areas for the deposition of sediments and debris transported by the flow, are now urban settlements. Such is the case of the southern part of the urban settlement of Schuld (see Part 1), which developed in the inner region of an Ahr valley bend. This flow region is prone to sedimentation. Furthermore, parts of the town of Altenburg (Altenahr), bordering the right bank of the river Ahr, were constructed on an abandoned oxbow lake. Although dry under normal flow conditions, the abandoned oxbow lake is of alluvial nature and prone to inundation and deposition in high flow situations (Szymczak et al., 2022). The main consequences of the inundation of this oxbow lake were the destruction of the urban area settled herein as described in Part 1.
In this chapter, we examine the 2021 flood in the context of future climate change. With this aim, it is of particular interest how a specific extreme event such as the July 2021 event would unfold under different climate conditions and, more generally, what changes regarding the intensity and frequency of extreme precipitation events can be expected in the future. For the first, PGW simulations and subsequent hydrological discharge modeling were performed, and for the latter, conventional climate projections at the CPM scale (KIT-KLIWA) were considered in this study.
4.1 Pseudo global warming experiments
4.1.1 The July 2021 precipitation event in a warming climate
Figure 9 shows the precipitation totals of PGW simulations of the July 2021 event against the background of different temperature perturbations. The control simulation (Fig. 9b) based on unperturbed (±0.0 K, hereafter PGWcontrol) ERA5 initial and boundary conditions adequately reproduces the event in its magnitude and location (see also Fig. 1b for comparison). The simulated precipitation totals in LReg (see Table 3) are almost equal to the observed totals estimated from RADOLAN data (cf. Part 1). Likewise, the most intense precipitation was simulated over the affected region. For SReg, the simulated precipitation totals are slightly higher in comparison to the observed totals (see Table 3). This overestimation might be due to a second simulated precipitation peak in the western part of SReg, which is not visible in the observations (see Fig. 1b).
Considering the PGW simulations, precipitation is lower under colder pre-industrial-like climate conditions (−1 K, hereafter PGWcold; Fig. 9a) over LReg with a decrease of 11 % (Table 3), while warmer conditions (+2 K, corresponding to GWL3, hereafter PGWwarm; Fig. 9c) lead to 18 % higher precipitation totals over LReg. Over SReg, the precipitation also decreases by 11 % for PGWcold and increases by approx. 11 % for PGWwarm (Table 3). Taking into account all PGW simulations (Fig. 9d, solid lines), the relationship between temperature and heavy precipitation change follows indeed the Clausius–Clapeyron (CC) scaling (7 % per 1 K) for the smaller SReg and even a super-CC scaling (9 % per 1 K) for the larger LReg. This is in line with recent findings about the relationship between temperature and heavy precipitation, which found that daily precipitation extremes mostly increase at approximately the CC rate (e.g., O'Gorman, 2015; Trenberth et al., 2003).
By combining the return periods based on the LAERTES-EU data (see Sect. 3.1.2, Fig. 5) and the PGW precipitation outputs, the change in the intensity of such an event under global warming can be assessed. For LReg (SReg) the return period of PGWcontrol is about 20 years (10 years) according to the LAERTES-EU data when considering the complete CReg area as reference (see Table 3). Taking into account the LAERTES-EU data only for the LReg (SReg) region, the return period of the PGWcontrol precipitation increases to about 100 years (500 years), pointing out once again how special this event was for this particular region. Taking into account the precipitation totals from PGWcold leads to reduced return periods by a factor of about 0.5 for both LReg and SReg if these precipitation amounts would occur today (Table 3). The change in return periods is more pronounced for PGWwarm with an increase by a factor of 1.5 to 2 for SReg and by a factor of even 5 to 10 for LReg with respect to the present-day LAERTES-EU statistics (Table 3). Thus, by assuming that such extreme events have the same frequency as today (equivalent with an identical return period) also in a warmer (or colder) climate, these results demonstrate that nowadays rare precipitation totals (with return periods of T>20 years) will become more extreme (corresponding to a present-day T> 200-year event) due to climate change. However, possible changes in the frequency itself of such events are not investigated in this study.

Figure 924 h precipitation sums (14 July 2021, 06:00 UTC to 15 July 2021, 06:00 UTC) from PGW experiments using the WRF model. Horizontal distributions for (a) PGW −1 K (PGWcold), (b) control run ±0 K (PGWcontrol), and (c) PGW +2 K (PGWwarm). (d) Area averaged 24 h precipitation sums (LReg in blue, SReg in red) plotted against temperature change for all conducted PGW experiments. Solid lines represent linear regression lines that are used for calculating the correction factors for the hydrological discharge modeling (see Sect. 4.1.2). Stippled horizontal lines denote the mean 24 h precipitation amount of PGWcontrol (56.5 mm for LReg and 88.5 mm for SReg).
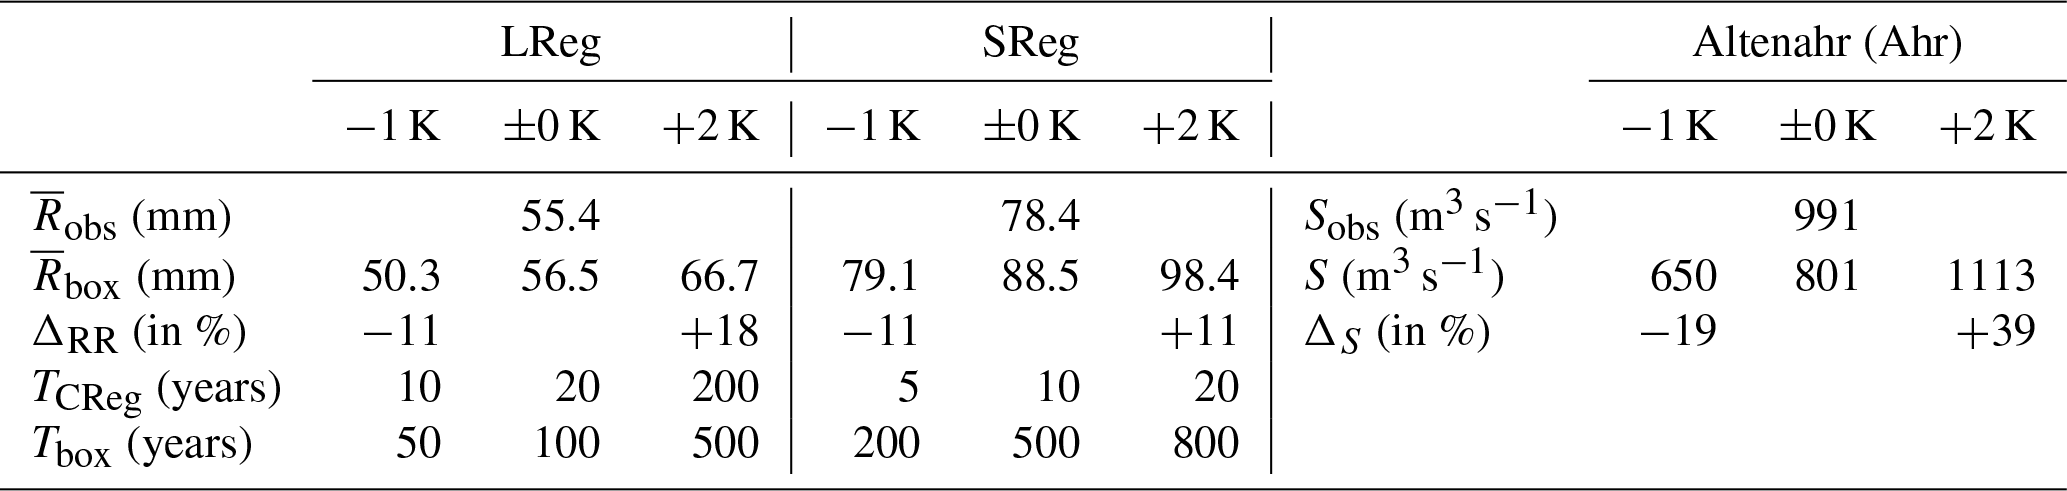
Table 3Spatially averaged 24 h precipitation totals (14 July 2021, 06:00 UTC to 15 July 2021, 06:00 UTC) over the study areas (LReg and SReg) derived from RADOLAN observations and from the PGW simulations (with box either LReg or SReg), and relative deviation ΔRR to the control run (±0 K); return period T of according to LAERTES-EU statistics considering either total CReg (TCReg) or only the two smaller study areas (Tbox with subscript box standing either for LReg or SReg); and peak discharge S from hydrological PGW simulations with LARSIM at gauge Altenahr (river Ahr) and from observations (reconstructions) Sobs, and relative deviation ΔS from the PGW results to the control run.
4.1.2 Hydrological response
In order to explicitly elaborate the pure hydrological response to a changed precipitation intensity, we determine correction factors for the two considered PGW scenarios, PGWcold and PGWwarm compared to PGWcontrol, instead of using the simulated spatial precipitation fields. As demonstrated in the previous section, the spatially averaged rainfall totals for LReg of PGWcontrol match the observed totals from RADOLAN. Using the derived linear regression function for LReg (Fig. 9d, solid blue line), the ratios between the PGWcontrol and the scenario PGWcold (PGWwarm) were calculated. The resulting adjustment factors were 0.92 for PGWcold and 1.16 for PGWwarm, representing the climate change signal compared to present-day conditions. The observed rainfall data set used for the LARSIM-Ahr reference simulation was then multiplied by these factors and used as input for two additional LARSIM-Ahr scenario simulations.
Figure 10 shows observed and simulated streamflow time series at gauge Altenahr (Ahr). The black line shows the values based on observation and reconstruction (see Part 1 for details); the peak value of 991 m3 s−1 (see also Table 3) corresponds to the upper red dot in Fig. 7. The green line shows the simulated streamflow time series using LARSIM Ahr with the best available rainfall observation product as input. The corresponding peak flow underestimates the observed one by about 20 % (Table 3). This can be attributed to deficiencies in the hydrological model, the initial conditions, and the used rainfall product. Nevertheless, the overall magnitude and course of the event are well captured. The blue and red lines show the results of the streamflow simulations based on the observed rainfall scaled by the ratios of PGWcontrol to PGWcold and PGWcontrol to PGWwarm, respectively. The resulting simulated peak flows (Table 3) are smaller (larger) than the reference by a factor of 0.81 (1.39). For both the cooling and the warming scenario, the hydrological response was, therefore, more pronounced than the meteorological one. For PGWcold, a precipitation decrease of 11 % was simulated, while the LARSIM-Ahr simulations show a decrease of the flood peak of 19 %. This non-linear response is even more pronounced for PGWwarm, where a precipitation increase of 18 % for LReg caused a 39 % increase in the flood peak. This indicates that increasing meteorological hazards due to climate change may be amplified by the rainfall-runoff transformation.
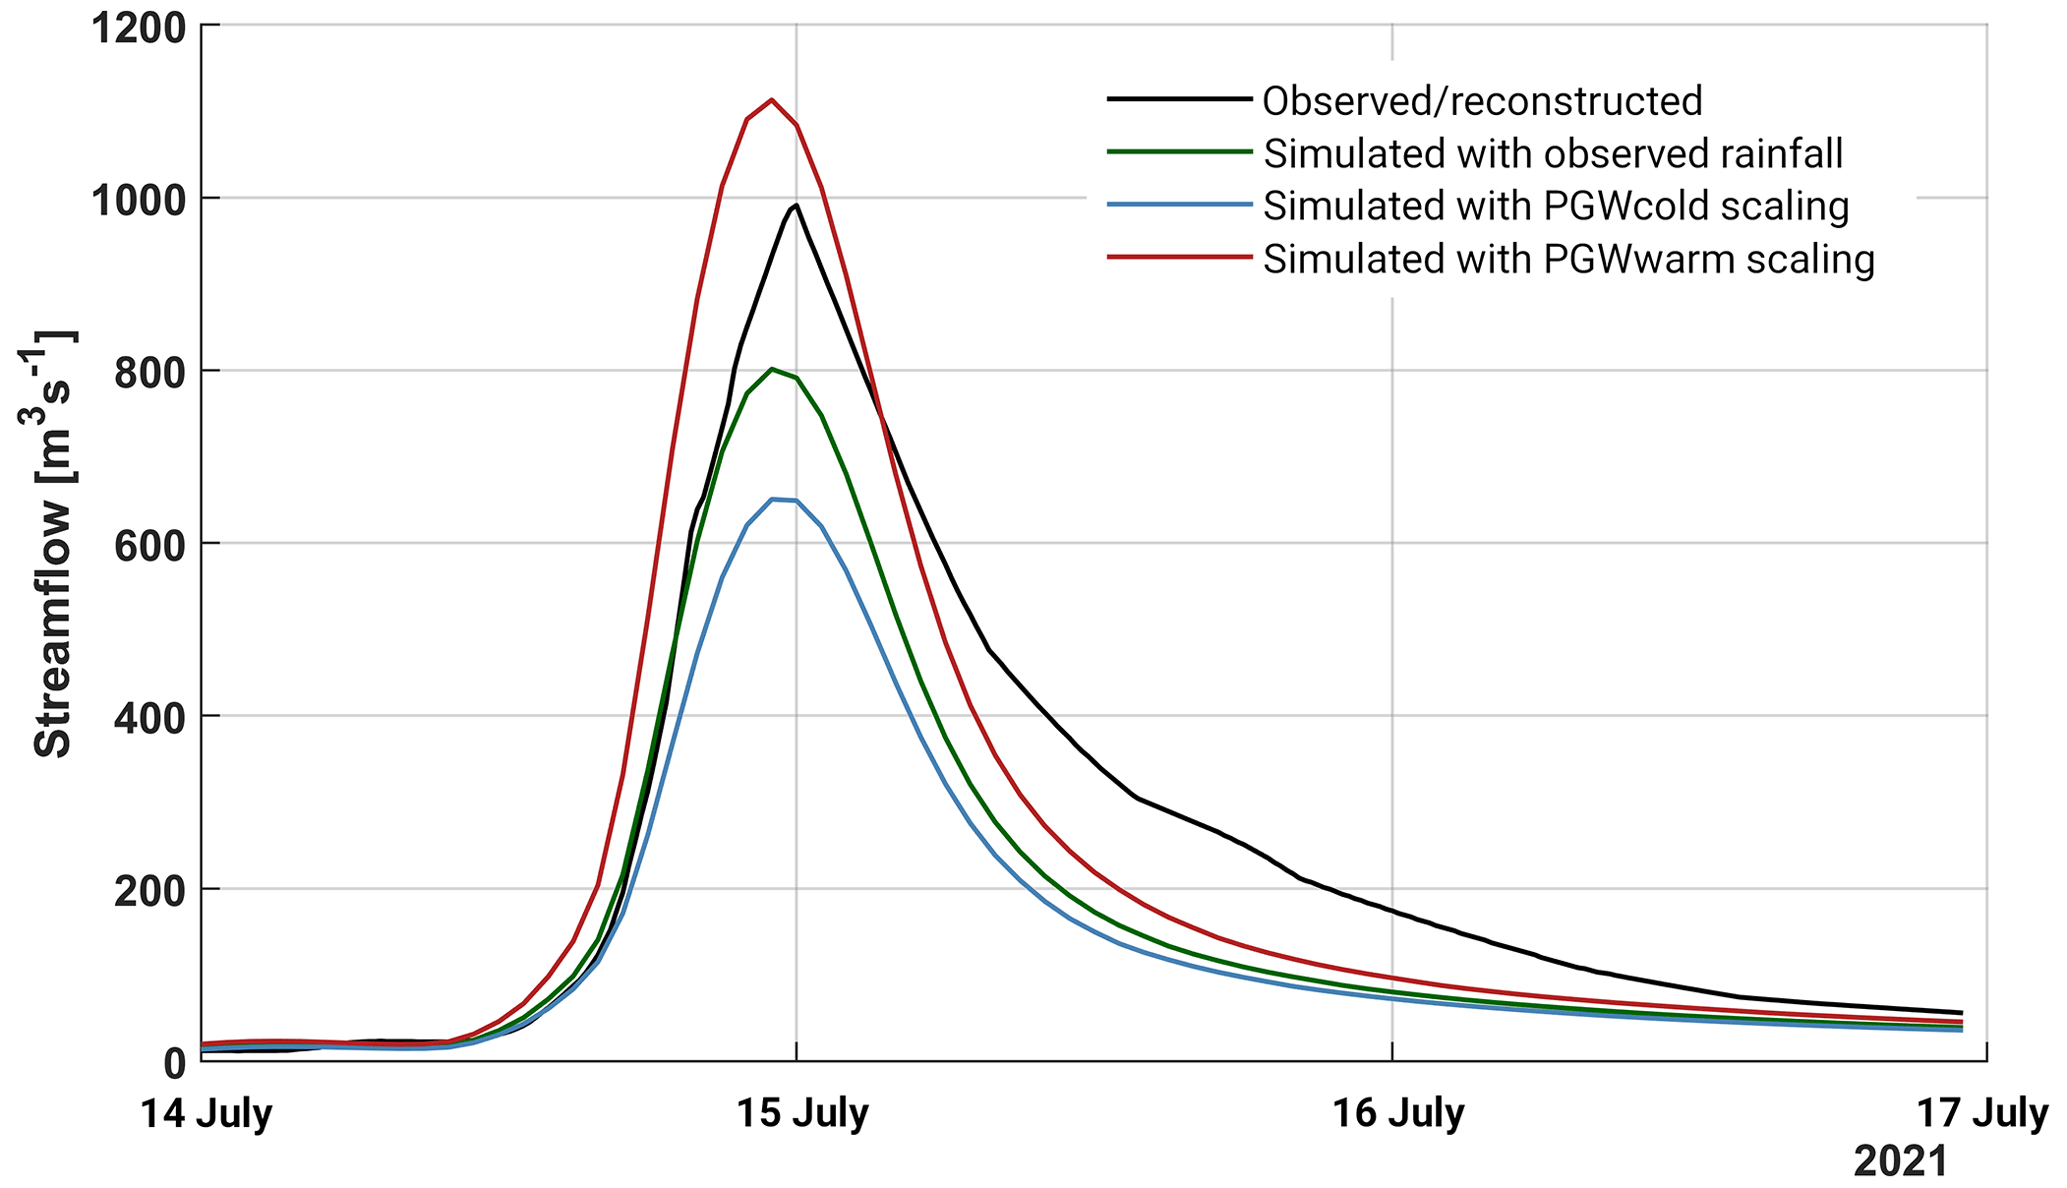
Figure 10Streamflow at gauge Altenahr (Ahr). Black is from observation and reconstruction (cf. Part 1), green is from LARSIM-Ahr simulation forced with observed rainfall (Bardossy et al., 2022), blue is from simulation with PGWcold rainfall scaling, and red is from simulation with PGWwarm rainfall scaling.
4.2 High-resolution future climate projections
The evolution of heavy precipitation in a warming climate is now investigated in conventional climate projections using the KIT-KLIWA ensemble considering exemplary the 10-year return level (RL10) of spatially averaged daily precipitation. Figure 11 shows the development of RL10 with ongoing global warming for each of the four ensemble members for CReg. The distribution of return levels within CReg is represented in the box plots. For the reference period (1971 to 2000; equivalent to GWL of +0.46 K compared to pre-industrial conditions), the RL10 averaged over CReg is 54.0 mm for the ensemble mean (Fig. 11, black dots and line). For comparison, the RL10 in KOSTRA (cf. Part 1 and Malitz and Ertel, 2015) averaged over the German part of CReg is 64.0 mm, so the KIT-KLIWA result is about 10 mm (or 18 %) smaller. However, the model-based value was calculated for fixed calendar days, whereas KOSTRA gives the maximum precipitation in an arbitrary 24 h interval. The German regulations DWA-Regelwerk 531, which KOSTRA is based on, proposes a factor of 1.14 to correct this methodical difference. Applying this technical correction to the KIT-KLIWA data, the adjusted RL10 is 61.6 mm (4 % difference to KOSTRA). Furthermore, Junghänel et al. (2017) specified a uncertainty range of ±15 % for a 10-year return period in KOSTRA. Taking both into account, the KIT-KLIWA data are in the range of KOSTRA.
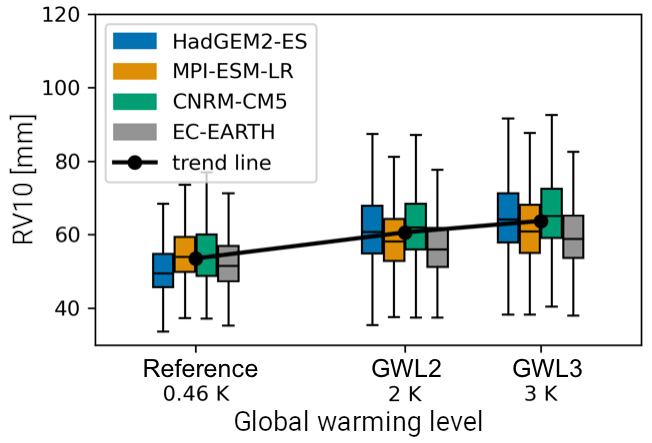
Figure 11Box plots of spatially averaged RL10 distributions over CReg for the reference period, GWL2, and GWL3 for all ensemble members of KIT-KLIWA. The boxes represent the lower and upper quartiles, the center lines the median, and the whiskers the outliers, defined as more than 1.5 times the interquartile range. Black dots and line show the multi-model ensemble mean for each set of runs and the trend.
For each ensemble member, the average value increases with proceeding global warming (Fig. 11). The extent of this increase, measured as the normalized difference between GWL3 and reference period, varies slightly between the simulations, with the strongest (lowest) increase in the CNRM-CM5-driven (EC-EARTH-driven) simulation. Averaging over CReg and all ensemble members, a trend of 4 mm per degree of warming is predicted. This corresponds to a relative change of 8.4 %. Considering the LReg only, the increase is about the same magnitude with 7.8 %, and also the individual ensemble members show similar behavior (not shown).
The analysis of additional return levels showed that the magnitude of the relative increase per degree of warming depends on the return period with lower (higher) rates in the mean for shorter (longer) return periods (Table S3). For CReg, the increase between the reference period and GWL3 is only 5.6 % for the 1-year return period, and 7.5 % for the 5-year return period. For longer return periods (e.g., 30 years), the relative increase is higher, with 10.1 % per degree of warming. Thus, the scaling of heavy precipitation with global warming is projected to be in the range of the Clausius–Clapeyron scaling (7 % per 1 K warming) for return periods of 3 to 10 years. Analysis showed that this increase is not purely linear, but a slightly stronger increase is observed when considering the change from the reference period to GWL2 only (Table S3). However, the uncertainty of these estimates, indicated by the ensemble interquartile spread (25th to 75th percentile; Table S3) also increases with the return periods due to the decreasing number of events taken into account. Within the ensemble spread, CReg and LReg show similar change signals.
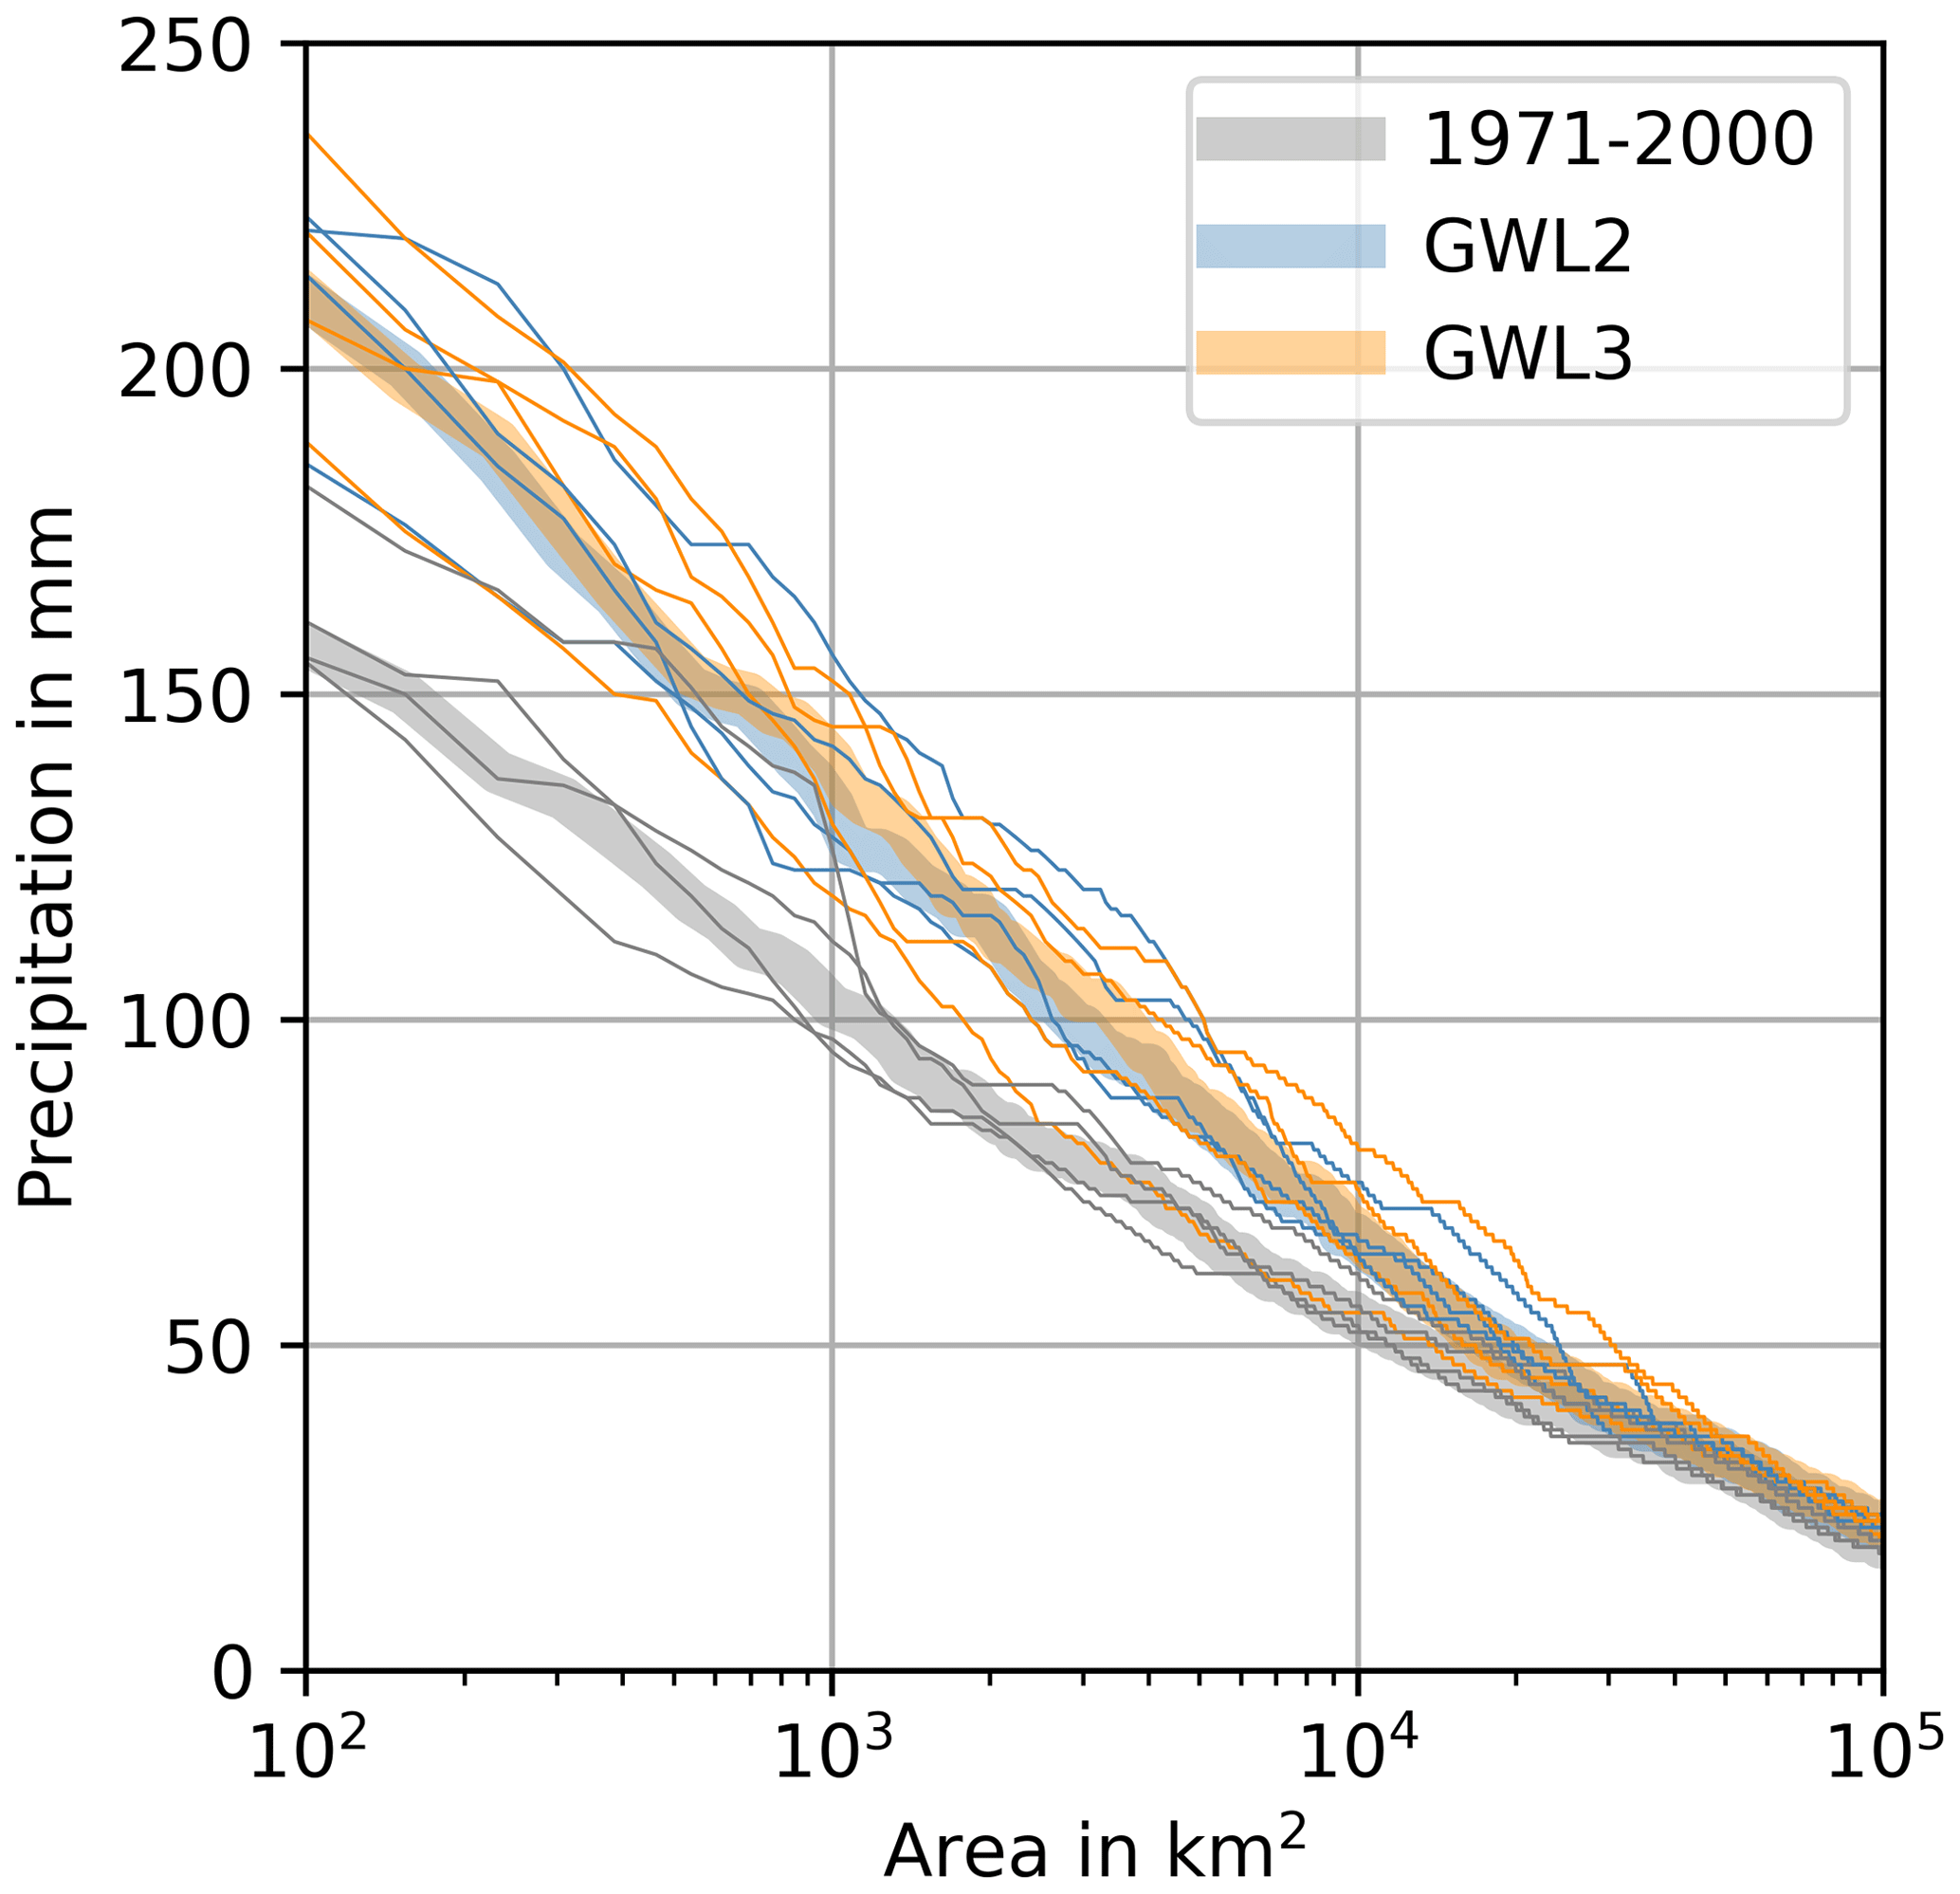
Figure 12Spatial extent of daily precipitation clusters (contiguous grid points) above the RL10 estimated from the KIT-KLIWA data set for the present-day reference period, GWL2, and GWL3. Thin lines represent individual ensemble members and thick lines the ensemble mean.
As already elaborated at the beginning of the paper, the severity of a precipitation event does not exclusively depend on the local intensities. The affected area is another essential factor, especially for triggering floods. Analogous to Sect. 3.1.2, a cluster analysis was conducted for the KIT-KLIWA to investigate the development of the spatial extent of RL10 in a warmer future. Therefore, the affected area of daily precipitation events was determined over the contiguous grid cells exceeding a certain precipitation threshold for the ensemble reference 1971 to 2000, GWL2, and GWL3. As in Sect. 3.1.2, the return level was derived from the occurrence to display RL10 (3 occurrences per 30-year time slice) in Fig. 12.
The projections show that the extent of precipitation loads experienced today as an RL10 will increase in a warmer climate (Fig. 12). The analysis of the single ensemble members (thin lines in Fig. 12) shows that all four members as well as the ensemble mean (thick lines in Fig. 12) agree on the increase of larger events in a warmer climate. However, though the difference from the reference period to GWL2 is clearly visible, only a few changes are projected on average from GWL2 to GWL3. The small spread between the ensemble members in the reference period, especially for large areas (more than 1000 km2), increases at GWL2 and GWL3. Primarily and as described above, the changes in the affected area are attributed to the general increase in extreme precipitation in a warmer climate as a higher specific humidity is anticipated under warmer conditions. This results in larger clusters of high rainfall totals that multiply the amounts of water available as runoff in downstream valleys. The size of those clusters is thus crucially responsible for the impact of an event. Therefore, the analysis of rainfall events beyond solely the intensity, but with the inclusion of the extent, is crucial for the impact of an event. With similar intensity, more expanded events tend to cause larger flooding. For areas larger than 20 000 km2, no changes can be resolved by the analysis anymore, which is also influenced by the limited area of the model domain, bounding these large extreme events.
The results presented above indicate that the projected precipitation change for high return levels might even exceed the theoretical CC scaling (super-CC scaling) over south and central Germany in a warming climate. Comparing the results with the PGW simulations for the July 2021 event (see Sect. 4.1.1), the relative changes within the conventional climate projections of KIT-KLIWA are of similar magnitudes. In comparison to the RL10 in LAERTES-EU (Fig. 5), the RL10 in KIT-KLIWA is smaller by about 30 % over the entire range of analyzed spatial dimensions. This discrepancy might largely be attributed to the difference in ensemble size (factor 10) and a varying bias correction. Additional uncertainties arise from different methods of estimating the RL10 (GPD in the case of KIT-KLIWA and empirical in the case of LAERTES-EU).
4.3 Hydro-morphodynamic responses on climate change
As climate determines the landscape occupation and organization, it is expected that global warming will cause changes in the land cover due to the adaptation of natural elements such as vegetation and soil. Furthermore, it will force the adaptation of human activities and soil use, for instance, by adaptation of agricultural practices. These factors, in turn, have a direct effect on the surface flow and on the influx of inorganic sediment and large debris such as deadwood (Eekhout and de Vente, 2022). Imbalances in river systems, such as changes in discharge and riverine vegetation, can have impacts on fluvial morphology and flow conveyance (Crosato et al., 2022).
Furthermore, Magilligan et al. (1998) argued that the frequency of the occurrence of flood events and river morphological adjustments may not always coincide. The two important factors for flood hazard evaluation and implementation of flood mitigation measures are the frequency and duration of extreme events. Both are susceptible to global warming, hence bringing extra complexity for flood managers.
The present work is the second part of an interdisciplinary study describing, analyzing, and classifying the disastrous July 2021 precipitation and flood event in central Europe, mainly affecting western Germany with the Ahr and Erft river basins. The main focus of the second part was on (i) the comparison and classification of this event in a historical and statistical context and (ii) the assessment of future climate change effects on such extreme events. Both aspects were investigated through a meteorological, hydrological, and hydro-morphological perspective. The main conclusions with respect to the research questions from Sect. 1 are as follows.
I. How does the event classify within the historical context of precipitation and flood events? Different metrics used to classify the July 2021 precipitation event in the historical context considering intensity, duration, and extent revealed that it was among the most intense historical precipitation events in the past 70 years in Germany (ranked 5th according to HPEcrit). Our analyses also revealed that the July 2021 precipitation event was unique concerning its location in western Germany, while the majority of the other extracted extreme precipitation events occurred in eastern or southern Germany, with some regions being affected by multiple events. The shape and the position of the latter event sample are often associated with a Vb cyclone pathway, which is known to favor the occurrence of extreme precipitation in eastern and southern Germany (e.g., Stucki et al., 2012; Kelemen et al., 2016). In contrast, for the July 2021 event in western Germany, large-scale mechanisms and the advection of moisture from remote sources were the driving factors (cf. Part 1). This was, for example, also the case in the 29 June 2017 event (Caldas-Alvarez et al., 2022a), where even higher precipitation totals were registered. Wet soils and local moisture recycling do not seem to be major factors in preconditioning and feeding the event. The presented results are in line with Schröter et al. (2015), who also found no flood-triggering heavy precipitation events on top of a very wet period in the used observations. However, the statistical analyses using the LAERTES-EU RCM ensemble revealed an overestimation of return periods derived using observational records given their limited length. Considering the larger CReg domain, the July 2021 event has a return period according to LAERTES-EU of about 10 to 20 years. The derived return periods increase to 100 to 200 years when considering only data for LReg (SReg). Comparing these results to the findings in Part 1 or Kreienkamp et al. (2021), which both estimated return periods for the event of several hundred to 1000 years based on observations, clearly highlights the uncertainty of a return period estimation solely based on such (short-termed) data sets or for specific areas. Although exceptional for that particular region, comparable precipitation events occur more frequently in a statistical sense anywhere within CReg.
From the hydrological perspective, the July 2021 flood event was exceptional, when (i) compared to long-term gauge recordings from a large region with a similar hydroclimate (CReg; GRDC data), (ii) compared to statistical return periods derived from a large set of gauges (LUBW data), and (iii) when compared to long-term historical records at gauge Altenahr (Ahr). While events in the order of magnitude of the 2021 flood were already observed at gauge Altenahr in the past (e.g., 1804, 1910), robust estimation of statistical return periods proved to be difficult and afflicted with large uncertainties. Along both the Ahr and Erft rivers, the 2021 event exceeded the statistical 100-year return level (HQ100) by a factor of up to 7, which is so far beyond observed gauge records that a return period estimation is questionable to impossible. This also demonstrates that the existing official flood hazard maps at the time did not represent the actual flood hazard. The July 2021 flood event, therefore, should be seen as a wake-up call to include additional information as much as possible in the risk assessment and estimation of hydrological and hydraulic design values rather than relying mainly on extreme value statistics based on gauge recordings with limited time coverage. Further, the results suggest that the range of extrapolation when estimating rare floods from limited observations should be chosen conservatively, especially under the non-stationary conditions imposed by climate change. Such additional information could be reconstructed from historical floods or hydrological simulations forced by long-term climate simulations including the effects of climate change as boundary conditions.
II. In which way did the historical transformation of river valleys (e.g., landscape occupation and organization) change the 2021 flood hazard in comparison to past events in this region? In terms of hydro-morphodynamic processes, the analysis of historical events indicated that the current methods for the evaluation of the flood hazard do not capture or account for changes in the hydro-morphology of river networks such as landscape organization and occupation. These historical changes include also the influence of human activities as constructors of the landscape and river morphology, a role which was considerably intensified in the last century. The cases of the municipalities Schuld and Altenahr (both along the river Ahr) showed that in order to improve flood management practices, it is crucial to better understand the historical land use of the valley. These considerations (based on images and reports and on paleogeography investigation) revealed additional areas prone to inundation or damage by sediment and debris, such as the abandoned oxbow lake in Altenburg (Altenahr) or the Ahr river bend in Schuld, which both had been urbanized over time. Until now, framework documents such as the floods directive (Directive 2007/60/EC of the European Parliament and of the Council of 23 October 2007 on the assessment and management of flood risks) are merely suggestive in the consideration of transported sediments and debris in flood risk assessment. Cases like the July 2021 floods showed that the consideration of sediments and large debris, including new types of industrial large debris, which did not exist in the analyzed historical floods, and the associated geomorphological processes in flood modeling, is essential to fully capture the flood hazard (Nones et al., 2017; Lucía et al., 2018; Dietze et al., 2022; Best et al., 2022). Several natural and anthropogenic aspects that condition the evolution of the landscape are climate-driven as well, which means that the determination of flood hazards and risk is a highly complex task in the context of global warming.
III. How would the specific extreme event of July 2021 unfold under different past and future climatic conditions, and what implications do these scenarios have on flood events? A further intensification of similar events (both regarding precipitation and resulting floods) is expected with ongoing global warming. Therefore, the July 2021 event was re-simulated with the WRF model using a series of PGW simulations, representing different levels of global warming by altering the mean temperature state from −2 to +3 K and keeping the relative humidity constant. This storyline approach was used here to complement the probabilistic approach of analyzing huge ensembles of climate model data to represent uncertainties in physical aspects of climate change on specific events (Shepherd et al., 2018). The control run (±0 K) uses the present-day conditions, which already represent a global warming level of +1.09 K (GWL1) according to IPCC (2022). It could be demonstrated that the event precipitation follows a (super) CC scaling of about 7 % to 9 % increase per degree of warming, which is in line with findings by Trenberth et al. (2003) or O'Gorman (2015). A higher precipitation scaling is found for LReg, underlining the unusual nature of the July 2021 event in terms of its spatial extent. The present-day control run already showed an increase of about 11 % in intensity compared to pre-industrial-like conditions (GWL0), showing that the increase in precipitation does not always have to follow CC scaling. Putting the spatial mean precipitation from the PGWcold and the present-day climate conditions into the statistical context of LAERTES-EU (for both the entire CReg domain and the specific LReg/SReg domains), the simulated increase in precipitation is equivalent to an increase of the return period for both LReg and SReg by a factor of 2 to 2.5 if both precipitation totals would occur today. The +2 K simulation predicts a further increase in precipitation of 11 % for SReg, which means a further increase of the return period again by a factor of 1.6 to 2. For LReg, an increase of 18 % is simulated, leading to a dramatic increase in the return period by a factor of 5 to 10.
Using the PGW simulations as input for a hydrological model revealed strong non-linear impacts on the hydrological response beyond the CC scaling. For gauge Altenahr (Ahr), the PGWwarm (PGWcold) scenario with an 18 % increase (11 % decrease) of rainfall led to a 39 % increase (19 % decrease) of the flood peak. This emphasizes that, in addition to the rainfall-amplifying effect of CC scaling, the non-linear relationship between meteorological drivers and the hydrological response has the potential to further magnify hazards related to climate change along the meteorological–hydrological–morphological process chain. Investigating in further detail the hydrological reasons for this amplifying effect (e.g., an increase of fast surface runoff) is beyond the scope of this work, but a relevant topic for further research, especially as such effects should not be specific to the Eifel region in western Germany and the 2021 flood event but broadly apply to many catchments around the world.
IV. How are precipitation characteristics (e.g., intensity, extent, frequency) projected to change in general under future climate conditions? The convection-permitting ensemble simulations of KIT-KLIWA over the study area agree on an intensification of extreme precipitation in a warmer climate. Precipitation at a given return period increases across all duration levels studied. The analyses confirmed an increase in moderate precipitation intensities following the CC scaling but also indicated an intensification above the CC scaling (super-CC scaling) of more than 10 % per degree warming for the highest return periods consistent with Feldmann et al. (2013) or Lenderink et al. (2021). Furthermore, the spatial extent of events, meaning the area affected by a specific intensity level, is expected to grow. Both trends lead to a general increase in the probability that a location is affected by precipitation extremes. Especially for sensitive areas, such as the steep terrain along the Ahr valley, or generally the accumulated effect of such extreme events along river reaches, we thus expect an increased hazard potential in a warmer climate. However, the results show no clear signal regarding the frequency of extreme events. Moreover, the study is limited by the number of 30 simulation years for each of the four ensemble members, leading to large uncertainty with increasing return periods. Therefore, further analyses with more data (e.g., from initiatives like the Coordinated Downscaling Experiment (CORDEX) of the World Climate Research Program) are needed.
To summarize, precipitation, especially heavy precipitation, remains a challenging research topic (cf. Stocker, 2014; IPCC, 2021a): observational records in most cases are still too short to fully capture the intensity and frequency of extremes that are physically possible. Synthetically extending these records with model simulations also has limitations due to the complexity of precipitation formation, which leads to distinct biases in the simulations. These shortcomings directly propagate into hydrological models and resulting discharge statistics such as the HQ100. Furthermore, discharge records are likewise available for short periods only, requiring statistical extrapolations for higher return periods with related uncertainties. However, official guidelines and regulations for flood risk assessments and mitigation rely solely on these observation-based metrics. The presented analysis could show to some extent that consideration of historical records in the reconstruction of past flood events can reduce the uncertainty of metrics such as the HQ100. The general inclusion of such sources would significantly improve the evaluation of the potential hazard. Within the scope of ongoing climate change and the expected further increasing precipitation intensities, this becomes increasingly relevant. Another complement is the forcing of the existing hydrological water balance models with precipitation data from the high-resolution future scenarios to investigate probable future changes in discharge statistics, which can then be used for mitigation purposes. With the recently ongoing development in climate research towards higher-resolution, convection-permitting simulations in the near future (e.g., within the BMBF project “NUKLEUS” for Germany), it is expected that the estimation of future precipitation statistics and its spatial representation will become more robust.
HYRAS-DE, RADOLAN, and KOSTRA are freely available for research at the Open Data Portal of the German Weather Service DWD (https://opendata.dwd.de; DWD, 2023). HYRAS data can be requested at DWD for research and education purposes. Gauging data are provided by the Global Runoff Data Centre (GRDC) and are freely available at the GRDC portal (https://portal.grdc.bafg.de/applications/public.html?publicuser=PublicUser#dataDownload/Home; GRDC, 2023). Regionalized flood information for Baden-Württemberg (BW-Abfluss) is freely available at the LUBW portal (https://udo.lubw.baden-wuerttemberg.de/projekte/; LUBW, 2023). River gauge data are available on request from the responsible water authority: Water administration of Rhineland-Palatinate (https://www.lfu.rlp.de; LFU, 2023) for gauges Müsch, Altenahr, Jünkerath, Kordel, Prüm 2, and Prümzurlay; Erftverband (https://www.erftverband.de; Erftverband, 2023) for gauges Schönau and Bliesheim; and Wupperverband (https://www.wupperverband.de; Wupperverband, 2023) for gauges Hückeswagen and Opladen. The LARSIM hydrological simulations based on the PGW studies are available upon request from the Water administration of Rhineland-Palatinate. The WRF model code can be obtained from https://github.com/wrf-model/WRF/releases/tag/v4.3 (WRF, 2023). ERA5-forcing data can be downloaded from the Copernicus Climate Change Service (C3S) Climate Date Store (https://cds.climate.copernicus.eu/#!/search?text=ERA5&type=dataset; Copernicus, 2023). LAERTES-EU, KIT-KLIWA, and the PGW simulation data can be requested from the authors. It is planned to provide parts via the German Climate Computing Center (DKRZ).
The supplement related to this article is available online at: https://doi.org/10.5194/nhess-23-1287-2023-supplement.
All KIT authors jointly designed the research questions of the study, continuously discussed the results, and wrote and reviewed the text passages. BM and ACA were responsible for the analysis of historical precipitation events; FE worked on the statistical analysis of the LAERTES-EU data. UE, FS, and JD were responsible for the hydrological analyses (including collection and description of the data). MF was responsible for the hydro-morphological part. MH and HF took care of the future climate projection; PL performed and analyzed the PGW simulations.
At least one of the (co-)authors is a member of the editorial board of Natural Hazards and Earth System Sciences. The peer-review process was guided by an independent editor, and the authors also have no other competing interests to declare.
Publisher’s note: Copernicus Publications remains neutral with regard to jurisdictional claims in published maps and institutional affiliations.
This article is part of the special issue “Past and future European atmospheric extreme events under climate change”. It is not associated with a conference.
This study is the result of an interdisciplinary collaboration at the Karlsruhe Institute of Technology (KIT), originating from a forensic disaster analysis (FDA) on the flood of July 2021 conducted by the Center for Disaster Management and Risk Reduction Technology (CEDIM) in summer 2021. The authors thank the Deutscher Wetterdienst (DWD) for providing the HYRAS, HYRAS-DE, KOSTRA, and RADOLAN data sets and the German Climate Computation Center (DKRZ, Hamburg) for providing computing and storage resources under the projects 105 and 983. The authors thank the water administration of Rhineland-Palatinate and Baden-Württemberg; the Erftverband; the Wupperverband; T. Roggenkamp from the University of Bonn, Germany; and the Global Runoff Data Center (GRDC), Koblenz (Germany), for providing valuable hydrological observational data and related evaluations. The authors thank the water administration of Rhineland-Palatinate and HYDRON GmbH, Karlsruhe (Germany), for carrying out all hydrological PGW simulations with LARSIM. Special thank goes to the Kreisarchiv Ahrweiler and Dieter Könnes for photo credits. We thank the reviewers for their valuable comments that helped to improve this study and the handling editor for guidance throughout the entire process. Finally, we thank the open-access publishing fund of KIT.
CEDIM is a cross-disciplinary research center in the field of disasters, risks, and security at KIT funded by the KIT and the research program “Changing Earth – Sustaining our Future” in the Helmholtz research field “Earth and Environment”. Several authors acknowledge partial funding from BMBF “ClimXtreme Module A” (01LP1901A), BMBF “RegIKlim-NUKLEUS” (01LR2002B), BMBF “RegIKlim-ISAP” (01LR2007B), and DFG “Waves to Weather” TRR 165. Additionally, Patrick Ludwig has been supported by the Helmholtz Association (Climate Initiative REKLIM grant), and Julian Quinting's contribution was funded by the Young Investigator Group “Sub-seasonal Predictability: Understanding the Role of Diabatic Outflow” (SPREADOUT, grant VH-NG-1243). Joaquim G. Pinto thanks the AXA Research Fund for support (https://axa-research.org/en/project/joaquim-pinto, last access: 9 May 2022).
The article processing charges for this open-access publication were covered by the Karlsruhe Institute of Technology (KIT).
This paper was edited by Frank Kaspar and reviewed by Sergiy Vorogushyn and one anonymous referee.
Aalbers, E. E., van Meijgaard, E., Lenderink, G., de Vries, H., and van den Hurk, B. J. J. M.: The 2018 west-central European drought projected in a warmer climate: how much drier can it get?, EGUsphere [preprint], https://doi.org/10.5194/egusphere-2022-954, 2022. a
Allen, M. R. and Ingram, W. J.: Constraints on future changes in climate and the hydrologic cycle, Nature, 419, 228–232, https://doi.org/10.1038/nature01092, 2002. a, b
Amante, C. and Eakins, B.: ETOPO1 1 Arc-Minute Global Relief Model: Procedures, Data Sources and Analysis, National Geophysical Data Center [data set], NESDIS, NOAA, US Dept, Commerce, Boulder, CO, USA, https://doi.org/10.7289/V5C8276M, 2008. a
Baldauf, M., Seifert, A., Förstner, J., Majewski, D., Raschendorfer, M., and Reinhardt, T.: Operational Convective-Scale Numerical Weather Prediction with the COSMO Model: Description and Sensitivities, Mon. Weather Rev., 139, 3887–3905, https://doi.org/10.1175/MWR-D-10-05013.1, 2011. a
Ban, N., Caillaud, C., Coppola, E., Pichelli, E., Sobolowski, S., Adinolfi, M., Ahrens, B., Alias, A., Anders, I., Bastin, S., Belušić, D., Berthou, S., Brisson, E., Cardoso, R. M., Chan, S. C., Christensen, O. B., Fernández, J., Fita, L., Frisius, T., Gašparac, G., Giorgi, F., Goergen, K., Haugen, J. E., Hodnebrog, Ø., Kartsios, S., Katragkou, E., Kendon, E. J., Keuler, K., Lavin-Gullon, A., Lenderink, G., Leutwyler, D., Lorenz, T., Maraun, D., Mercogliano, P., Milovac, J., Panitz, H.-J., Raffa, M., Remedio, A. R., Schär, C., Soares, P. M. M., Srnec, L., Steensen, B. M., Stocchi, P., Tölle, M. H., Truhetz, H., Vergara-Temprado, J., de Vries, H., Warrach-Sagi, K., Wulfmeyer, V., and Zander, M. J.: The first multi-model ensemble of regional climate simulations at kilometer-scale resolution, part I: evaluation of precipitation, Clim. Dynam., 57, 275–302, https://doi.org/10.1007/s00382-021-05708-w, 2021. a
Bardossy, A., Seidel, J., Eisele, M., El Hachem, A., Kunstmann, H., Chwala, C., Graf, M., Demuth, N., and Gerlach, N.: Verbesserung der Abschätzung von Gebietsniederschlägen mittels opportunistischer Niederschlagsmessungen am Beispiel des Ahr-Hochwassers im Juli 2021, Hydrologie und Wasserbewirtschaftung, 66, 208–214, https://www.hywa-online.de/download/hywa-heft-4-2022/ (last access: 3 February 2023), 2022. a, b
Berg, P., Feldmann, H., and Panitz, H.-J.: Bias correction of high resolution regional climate model data, J. Hydrol., 448, 80–92, https://doi.org/10.1016/j.jhydrol.2012.04.026, 2012. a
Best, J., Ashmore, P., and Darby, S.: Beyond just floodwater, Nature Sustainability, 5, 811–813, https://doi.org/10.1038/s41893-022-00929-1, 2022. a, b
Bezak, N., Brilly, M., and Šraj, M.: Comparison between the peaks-over-threshold method and the annual maximum method for flood frequency analysis, Hydrolog. Sci. J., 59, 959–977, https://doi.org/10.1080/02626667.2013.831174, 2014. a
BMDV: Verkehrsfreigabe der Teilstrecke Remagen-Ahrweiler, Bundesministerium für Digitales und Verkehr (BMDV), Berlin, Germany, https://bmdv.bund.de/SharedDocs/DE/Artikel/K/unwetter-ahrtal-bahn.html (last access: 3 February 2023), 2021. a
BMDV: Informationen zur Hochwasserkatastrophe, Bundesministerium für Digitales und Verkehr (BMDV), Berlin, Germany, https://www.bmvi.de/SharedDocs/DE/Artikel/K/unwetter.html (last access: 3 February 2023), 2022. a
Brabson, B. B. and Palutikof, J. P.: Tests of the Generalized Pareto Distribution for Predicting Extreme Wind Speeds, J. Appl. Meteorol., 39, 1627–1640, https://doi.org/10.1175/1520-0450(2000)039<1627:TOTGPD>2.0.CO;2, 2000. a
Caldas-Alvarez, A., Augenstein, M., Ayzel, G., Barfus, K., Cherian, R., Dillenardt, L., Fauer, F., Feldmann, H., Heistermann, M., Karwat, A., Kaspar, F., Kreibich, H., Lucio-Eceiza, E. E., Meredith, E. P., Mohr, S., Niermann, D., Pfahl, S., Ruff, F., Rust, H. W., Schoppa, L., Schwitalla, T., Steidl, S., Thieken, A. H., Tradowsky, J. S., Wulfmeyer, V., and Quaas, J.: Meteorological, impact and climate perspectives of the 29 June 2017 heavy precipitation event in the Berlin metropolitan area, Nat. Hazards Earth Syst. Sci., 22, 3701–3724, https://doi.org/10.5194/nhess-22-3701-2022, 2022a. a, b
Caldas-Alvarez, A., Feldmann, H., Lucio-Eceiza, E., and Pinto, J. G.: Scale-dependency of extreme precipitation processes in regional climate simulations of the greater Alpine region, Weather Clim. Dynam. Discuss. [preprint], https://doi.org/10.5194/wcd-2022-11, in review, 2022b. a
Cannon, D. J., Kirshbaum, D. J., and Gray, S. L.: Under what conditions does embedded convection enhance orographic precipitation?, Q. J. Roy. Meteor. Soc., 138, 391–406, https://doi.org/10.1002/qj.926, 2012. a
Chen, F., Janjić, Z., and Mitchell, K.: Impact of atmospheric surface-layer parameterizations in the new land-surface scheme of the NCEP mesoscale Eta model, Bound.-Lay. Meteorol., 85, 391–421, https://doi.org/10.1023/A:1000531001463, 1997. a
Copernicus: Climate Data Store, https://cds.climate.copernicus.eu/#!/search?text=ERA5&type=dataset, last access: 4 April 2023. a
Crosato, A., Grissetti-Vázquez, A., Bregoli, F., and Franca, M.: Adaptation of river channels to a wetter or drier climate: insights from the Lower Pilcomayo River, South America, J. Hydrol., 612, 128254, https://doi.org/10.1016/j.jhydrol.2022.128254, 2022. a
Dalcher, A. and Kalnay, E.: Error growth and predictability in operational ECMWF forecasts, Tellus A, 39, 474–491, https://doi.org/10.3402/tellusa.v39i5.11774, 1987. a
Dewals, B., Erpicum, S., Pirotton, M., and Archambeau, P.: The July 2021 extreme floods in the Belgian part of the Meuse basin, Hydrolink Magazine, 4/2021, http://hdl.handle.net/2268/263750 (last access: 3 February 2022), 2021. a, b
Dietze, M., Bell, R., Ozturk, U., Cook, K. L., Andermann, C., Beer, A. R., Damm, B., Lucia, A., Fauer, F. S., Nissen, K. M., Sieg, T., and Thieken, A. H.: More than heavy rain turning into fast-flowing water – a landscape perspective on the 2021 Eifel floods, Nat. Hazards Earth Syst. Sci., 22, 1845–1856, https://doi.org/10.5194/nhess-22-1845-2022, 2022. a, b
DWD: Open Data Portal, Deutscher Wetterdienst, Offenbach, Germany, https://opendata.dwd.de, last access: 3 April 2023. a
Eekhout, J. P. and de Vente, J.: Global impact of climate change on soil erosion and potential for adaptation through soil conservation, Earth-Sci. Rev., 226, 103921, https://doi.org/10.1016/j.earscirev.2022.103921, 2022. a
Ehmele, F., Kautz, L.-A., Feldmann, H., and Pinto, J. G.: Long-term variance of heavy precipitation across central Europe using a large ensemble of regional climate model simulations, Earth Syst. Dynam., 11, 469–490, https://doi.org/10.5194/esd-11-469-2020, 2020. a, b, c
Ehmele, F., Kautz, L.-A., Feldmann, H., He, Y., Kadlec, M., Kelemen, F. D., Lentink, H. S., Ludwig, P., Manful, D., and Pinto, J. G.: Adaptation and application of the large LAERTES-EU regional climate model ensemble for modeling hydrological extremes: a pilot study for the Rhine basin, Nat. Hazards Earth Syst. Sci., 22, 677–692, https://doi.org/10.5194/nhess-22-677-2022, 2022. a, b, c
Erftverband: Erftverband – Wasserwirtschft für unsere Region, Bergheim, Germany, https://www.erftverband.de, last access: 4 April 2023. a
Feldmann, H., Schädler, G., Panitz, H.-J., and Kottmeier, C.: Near future changes of extreme precipitation over complex terrain in Central Europe derived from high resolution RCM ensemble simulations, Int. J. Climatol., 33, 1964–1977, https://doi.org/10.1002/joc.3564, 2013. a, b
Feldmann, H., Pinto, J. G., Laube, N., Uhlig, M., Moemken, J., Pasternack, A., Früh, B., Pohlmann, H., and Kottmeier, C.: Skill and added value of the MiKlip regional decadal prediction system for temperature over Europe, Tellus A, 71, 1618678, https://doi.org/10.1080/16000870.2019.1618678, 2019. a
Frei, C., Davies, H. C., Gurtz, J., and Schär, C.: Climate dynamics and extreme precipitation and flood events in Central Europe, Integrated Assessment, 1, 281–300, https://doi.org/10.1023/A:1018983226334, 2000. a
Früh, B., Feldmann, H., Panitz, H.-J., Schädler, G., Jacob, D., Lorenz, P., and Keuler, K.: Determination of Precipitation Return Values in Complex Terrain and Their Evaluation, J. Climate, 23, 2257–2274, https://doi.org/10.1175/2009JCLI2685.1, 2010. a
Fuhrer, O. and Schär, C.: Embedded Cellular Convection in Moist Flow past Topography, J. Atmos. Sci., 62, 2810–2828, https://doi.org/10.1175/JAS3512.1, 2005. a
GRDC: Data Portal, Global Runoff Data Centre, Koblenz, Germany, https://portal.grdc.bafg.de/applications/public.html?publicuser=PublicUser#dataDownload/Home, last access: 3 April 2023. a
Grieser, J., Staeger, T., and Schönwiese, C.-D.: Estimates and uncertainties of return periods of extreme daily precipitation in Germany, Meteorol. Z., 16, 553–564, https://doi.org/10.1127/0941-2948/2007/0235, 2007. a
Gumbel, E. J.: The return period of flood flows, Ann. Math. Stat., 12, 163–190, http://www.jstor.org/stable/2235766 (last access: 3 February 2023), 1941. a
Hackenbruch, J., Schädler, G., and Schipper, J.: Added value of high-resolution regional climate simulations for regional impact studies, Meteorol. Z., 25, 291–304, https://doi.org/10.1127/metz/2016/0701, 2016. a
Haylock, M., Hofstra, N., Tank, A. K., Klok, E., Jones, P., and New, M.: A European daily high-resolution gridded data set of surface temperature and precipitation for 1950–2006, J. Geophys. Res., 113, D20119, https://doi.org/10.1029/2008JD010201, 2008. a
Hersbach, H., Bell, B., Berrisford, P., Hirahara, S., Horányi, A., Muñoz-Sabater, J., Nicolas, J., Peubey, C., Radu, R., Schepers, D., Simmons, A., Soci, C., Abdalla, S., Abellan, X., Balsamo, G., Bechtold, P., Biavati, G., Bidlot, J., Bonavita, M., De Chiara, G., Dahlgren, P., Dee, D., Diamantakis, M., Dragani, R., Flemming, J., Forbes, R., Fuentes, M., Geer, A., Haimberger, L., Healy, S., Hogan, R. J., Hólm, E., Janisková, M., Keeley, S., Laloyaux, P., Lopez, P., Lupu, C., Radnoti, G., de Rosnay, P., Rozum, I., Vamborg, F., Villaume, S., and Thépaut, J.-N.: The ERA5 global reanalysis, Q. J. Roy. Meteor. Soc., 146, 1999–2049, https://doi.org/10.1002/qj.3803, 2020. a
Iacono, M. J., Delamere, J. S., Mlawer, E. J., Shephard, M. W., Clough, S. A., and Collins, W. D.: Radiative forcing by long-lived greenhouse gases: Calculations with the AER radiative transfer models, J. Geophys. Res.-Atmos., 113, D13103, https://doi.org/10.1029/2008JD009944, 2008. a
IPCC: Contribution of working group I to the sixth assessment report of the intergovernmental panel on climate change, in: Climate change 2021: the physical science basis, edited by: Masson-Delmotte, V., Zhai, P., Pirani, A., Connors, S., Péan, C., Berger, S., Caud, N., Chen, Y., Goldfarb, L., Gomis, M., Huang, M., Leitzell, K., Lonnoy, E., Matthews, J., Maycock, T., Waterfield, T., Yelekçi, O., Yu, R., and Zhou, B., Cambridge University Press, Cambridge, UK and New York, NY, USA, https://report.ipcc.ch/ar6/wg1/IPCC_AR6_WGI_FullReport.pdf (last access: 3 February 2023), 2021a. a, b, c
IPCC: Annex II: Models, in: Climate change 2021: the physical science basis, edited by: Masson-Delmotte, V., Zhai, P., Pirani, A., Connors, S., Péan, C., Berger, S., Caud, N., Chen, Y., Goldfarb, L., Gomis, M., Huang, M., Leitzell, K., Lonnoy, E., Matthews, J., Maycock, T., Waterfield, T., Yelekçi, O., Yu, R., and Zhou, B., Cambridge University Press, Cambridge, UK and New York, NY, USA, https://www.ipcc.ch/report/ar6/wg1/downloads/report/IPCC_AR6_WGI_AnnexII.pdf (last access: 3 February 2023), 2021b. a
IPCC: Contribution of Working Group III to the Sixth Assessment Report of the Intergovernmental Panel on Climate Change, in: Climate Change 2022: Mitigation of Climate Change, edited by: Shukla, P., Skea, J., Slade, R., Khourdajie, A. A., van Diemen, R., McCollum, D., Pathak, M., Some, S., Vyas, P., Fradera, R., Belkacemi, M., Hasija, A., Lisboa, G., Luz, S., and Malley, J., Cambridge University Press, Cambridge, UK and New York, NY, USA, https://www.ipcc.ch/report/ar6/wg1/downloads/report/IPCC_AR6_WGI_AnnexII.pdf (last access: 3 February 2023), 2022. a, b, c
Janjić, Z. I.: The Step-Mountain Eta Coordinate Model: Further Developments of the Convection, Viscous Sublayer, and Turbulence Closure Schemes, Mon. Weather Rev., 122, 927–945, https://doi.org/10.1175/1520-0493(1994)122<0927:TSMECM>2.0.CO;2, 1994. a, b
Junghänel, T., Ertel, H., and Deutschländer, T.: KOSTRA-DWD-2010R. Bericht zur Revision der koordinierten Starkregenregionalisierung und-auswertung des Deutschen Wetterdienstes in der Version 2010, Deutscher Wetterdienst, https://www.dwd.de/DE/leistungen/kostra_dwd_rasterwerte/download/bericht_revision_kostra_dwd_2010.pdf?__blob=publicationFile&v=6 (last access: 3 February 2023), 2017. a
Junghänel, T., Bissolli, P., Daßler, J., Fleckenstein, R., Imbery, F., Janssen, W., Kaspar, F., Lengfeld, K., Leppelt, T., Rauthe, M., Rauthe-Schöch, A., Rocek, M., Walawender, E., and Weigl, E.: Hydro-klimatologische Einordnung der Stark- und Dauerniederschläge in Teilen Deutschlands im Zusammenhang mit dem Tiefdruckgebiet ,,Bernd” vom 12. bis 19. Juli 2021, Deutscher Wetterdienst (DWD), Offenbach, Germany, https://www.dwd.de/DE/leistungen/besondereereignisse/niederschlag/20210721_bericht_starkniederschlaege_tief_bernd.pdf;jsessionid=6B7BA54AE50F911B81899C3AC345C937.live21074?__blob=publicationFile&v=10 (last access: 3 February 2023), 2021. a, b
Kautz, L.-A., Martius, O., Pfahl, S., Pinto, J. G., Ramos, A. M., Sousa, P. M., and Woollings, T.: Atmospheric blocking and weather extremes over the Euro-Atlantic sector – a review, Weather Clim. Dynam., 3, 305–336, https://doi.org/10.5194/wcd-3-305-2022, 2022. a
Kelemen, F. D., Ludwig, P., Reyers, M., Ulbrich, S., and Pinto, J. G.: Evaluation of moisture sources for the Central European summer flood of May/June 2013 based on regional climate model simulations, Tellus A, 68, 29288, https://doi.org/10.3402/tellusa.v68.29288, 2016. a
Kreienkamp, F., Philip, S. Y., Tradowsky, J. S., Kew, S. F., Lorenz, P., Arrighi, J., Belleflamme, A., Bettmann, T., Caluwaerts, S., Chan, S. C., Ciavarella, A., Cruz, L. D., de Vries, H., Demuth, N., Ferrone, A., Fischer, E. M., Fowler, H. J., Goergen, K., Heinrich, D., Henrichs, Y., Lenderink, G., Kaspar, F., Nilson, E., Otto, F. E. L., Ragone, F., Seneviratne, S. I., Singh, R. K., Skålevåg, A., Termonia, P., Thalheimer, L., van Aalst, M., den Bergh, J. V., de Vyver, H. V., Stéphane Vannitsem and, G. J. v. O., Schaeybroeck, B. V., Vautard, R., Vonk, D., and Wanders, N.: Rapid attribution of heavy rainfall events leading to the severe flooding in Western Europe during July 2021, World Weather Attribution (WWA), https://www.worldweatherattribution.org/heavy-rainfall-which- led-to-severe-flooding-in-western-europe-made-more-likely-by-climate-change/ (last access: 3 February 2023), 2021. a, b, c
Lackmann, G. M.: The South-Central U.S. Flood of May 2010: Present and Future, J. Climate, 26, 4688–4709, https://doi.org/10.1175/JCLI-D-12-00392.1, 2013. a
Lenderink, G., Barbero, R., Loriaux, J. M., and Fowler, H. J.: Super-Clausius–Clapeyron Scaling of Extreme Hourly Convective Precipitation and Its Relation to Large-Scale Atmospheric Conditions, J. Climate, 30, 6037–6052, https://doi.org/10.1175/JCLI-D-16-0808.1, 2017. a
Lenderink, G., de Vries, H., Fowler, H. J., Barbero, R., van Ulft, B., and van Meijgaard, E.: Scaling and responses of extreme hourly precipitation in three climate experiments with a convection-permitting model, Philos. T. Roy. Soc. A, 379, 20190544, https://doi.org/10.1098/rsta.2019.0544, 2021. a, b
LFU: Landesamt für Umwelt Rheinland-Pfalz Mainz, Germany, https://www.lfu.rlp.de, last access: 3 April 2023. a
Lorenz, E. N.: Atmospheric predictability experiments with a large numerical model, Tellus A, 34, 505–513, https://doi.org/10.3402/tellusa.v34i6.10836, 1982. a
LUBW: Festlegung des Bemessungshochwassers für Anlagen des technischen Hochwasserschutzes, in: Oberirdische Gewässer, Gewässerökologie, 92, p. 91, Landesanstalt für Umweltschutz Baden-Württemberg (LUBW), Karlsruhe, Germany, https://pudi.lubw.de/detailseite/-/publication/29891 (last access: 3 February 2023), 2005. a
LUBW: Umwelt-Daten und -Karten Online, Landesanstalt für Umwelt Baden-Württemberg, Karlsruhe, Germany, https://udo.lubw.baden-wuerttemberg.de/projekte/, last access: 3 April 2023. a
Lucía, A., Schwientek, M., Eberle, J., and Zarfl, C.: Planform changes and large wood dynamics in two torrents during a severe flash flood in Braunsbach, Germany 2016, Sci. Total Environ., 640, 315–326, https://doi.org/10.1016/j.scitotenv.2018.05.186, 2018. a
Ludwig, K. and Bremicker, M.: The Water Balance Model LARSIM – Design, Content and Applications, Institut für Hydrologie, University of Freiburg, Germany, Freiburger Schriften zur Hydrologie, Vol. 22, https://www.larsim.info/en/ (last access: 3 February 2023), 2006. a
Madsen, H., Rasmussen, P. F., and Rosbjerg, D.: Comparison of annual maximum series and partial duration series methods for modeling extreme hydrologic events: 1. At-site modeling, Water Resour. Res., 33, 747–757, https://doi.org/10.1029/96WR03848, 1997. a
Magilligan, F. J., Phillips, J. D., James, L. A., and Gomez, B.: Geomorphic and sedimentological controls on the effectiveness of an extreme flood, J. Geol., 106, 87–96, https://doi.org/10.1086/516009, 1998. a
Maher, N., Milinski, S., and Ludwig, R.: Large ensemble climate model simulations: introduction, overview, and future prospects for utilising multiple types of large ensemble, Earth Syst. Dynam., 12, 401–418, https://doi.org/10.5194/esd-12-401-2021, 2021. a
Malitz, G. and Ertel, H.: KOSTRA DWD 2010: Starkniederschlagshöhen für Deutschland (Bezugszeitraum 1951 bis 2010), Abschlussbericht, Deutscher Wetterdienst, https://www.dwd.de/DE/leistungen/kostra_dwd_rasterwerte/download/bericht_kostra_dwd_2010_pdf.pdf?__blob=publicationFile&v=11 (last access: 3 February 2023), 2015. a
Marotzke, J., Müller, W. A., Vamborg, F. S., Becker, P., Cubasch, U., Feldmann, H., Kaspar, F., Kottmeier, C., Marini, C., Polkova, I., Prömmel, K., Rust, H. W., Stammer, D., Ulbrich, U., Kadow, C., Köhl, A., Kröger, J., Kruschke, T., Pinto, J. G., Pohlmann, H., Reyers, M., Schröder, M., Sienz, F., Timmreck, C., and Ziese, M.: MiKlip: a national research project on decadal climate prediction, B. Am. Meteorol. Soc., 97, 2379–2394, https://doi.org/10.1175/BAMS-D-15-00184.1, 2016. a
Marx, S.: Die im Gebiet der DDR aufgetretenen extrem hohen Tagessummen des Niederschlages (1907 bis 1978) mit Angaben über die Ausmaße des starken Dauerregens vom 7./8. August 1978, Z. Meteorol., 30, 318–328, 1980. a
Meinshausen, M., Smith, S., Calvin, K., Daniel, J. S.,Kainuma, M. L. T., Lamarque, J.-F., Matsumoto, K., Montzka, S. A., Raper, S. C. B., Riahi, K., Thomson, A., Velders, G. J. M., and van Vuuren, D. P. P.: he RCP greenhouse gas concentrations and their extensions from 1765 to 2300, Clim. Change, 109, 219–231, https://doi.org/10.1007/s10584-011-0156-z, 2011. a
MeteoLux: Hochwasserereignis Juli 2021, Météo au Luxembourg (MeteoLux), l'Administration de la navigation aérienne, Luxembourg, https://www.meteolux.lu/de/aktuelles/ruckblick-auf-den-ergiebigen-dauerregen-vom-14-und-15-juli-2021 (last access: 3 February 2023), 2021. a, b
Michaelis, A. C., Willison, J., Lackmann, G. M., and Robinson, W. A.: Changes in winter North Atlantic extratropical cyclones in high-resolution regional pseudo–global warming simulations, J. Climate, 30, 6905–6925, https://doi.org/10.1175/JCLI-D-16-0697.1, 2017. a
Mohr, S., Ehret, U., Kunz, M., Ludwig, P., Caldas-Alvarez, A., Daniell, J. E., Ehmele, F., Feldmann, H., Franca, M. J., Gattke, C., Hundhausen, M., Knippertz, P., Küpfer, K., Mühr, B., Pinto, J. G., Quinting, J., Schäfer, A. M., Scheibel, M., Seidel, F., and Wisotzky, C.: A multi-disciplinary analysis of the exceptional flood event of July 2021 in central Europe – Part 1: Event description and analysis, Nat. Hazards Earth Syst. Sci., 23, 525–551, https://doi.org/10.5194/nhess-23-525-2023, 2022. a, b, c
Munich Re: Hurricanes, cold waves, tornadoes: Weather disasters in USA dominate natural disaster losses in 2021 – Europe: Extreme flash floods with record losses, Munich Re, Media relations on January 10, 2022: Natural disaster losses 2021, Munich Germany, https://www.munichre.com/en/company/media-relations/media-information-and-corporate-news/media-information/2022/natural-disaster-losses-2021.html (last access: 3 February 2023), 2022. a
Nones, M., Gerstgraser, C., and Wharton, G.: Consideration of hydromorphology and sediment in the implementation of the EU water framework and floods directives: a comparative analysis of selected EU member states, Water Environ. J., 31, 324–329, https://doi.org/10.1111/wej.12247, 2017. a
Otto, F. E.: Attribution of weather and climate events, Annu. Rev. Env. Resour., 42, 627–646, https://doi.org/10.1146/annurev-environ-102016-060847, 2017. a, b
O'Gorman, P. A.: Precipitation extremes under climate change, Current Climate Change Reports, 1, 49–59, https://doi.org/10.1007/s40641-015-0009-3, 2015. a, b
Pall, P., Allen, M., and Stone, D. A.: Testing the Clausius–Clapeyron constraint on changes in extreme precipitation under CO2 warming, Clim. Dynam., 28, 351–363, https://doi.org/10.1007/s00382-006-0180-2, 2007. a
Prein, A. F., Langhans, W., Fosser, G., Ferrone, A., Ban, N., Goergen, K., Keller, M., Tölle, M., Gutjahr, O., Feser, F., Brisson, E., Kollet, S., Schmidli, J., van Lipzig, N. P. M., and Leung, R.: A review on regional convection-permitting climate modeling: Demonstrations, prospects, and challenges, Rev. Geophys., 53, 323–361, https://doi.org/10.1002/2014RG000475, 2015. a, b, c
Rauthe, M., Steiner, H., Riediger, U., A., M., and Gratzki, A.: A Central European precipitation climatology – Part I: Generation and validation of a high-resolution gridded daily data set (HYRAS), Meteorol. Z., 22, 235–256, https://doi.org/10.1127/0941-2948/2013/0436, 2013. a
RedaktionsNetzwerk Deutschland: Ein Jahr nach der Flutkatastrophe: So geht es den Menschen im Ahrtal, RedaktionsNetzwerk Deutschland, Hanover, Germany, 20 June 2022, https://www.rnd.de/panorama/ahrtal-so-geht- es-den-menschen-nach-der-flutkatastrophe-LEXREN3YXKOQEAK2FK4POQULRM.html (last access: 1 February 2023), 2022. a
Regenauer, J., Böhm, M., and Gerlinger, K.: Nachrechnung des Hochwassers an der Ahr am 14./15. Juli 2021 mit dem LARSIM-Wasserhaushaltsmodell für Rheinland-Pfalz, Report, HYDRON - Ingenieurgesellschaft für Umwelt und Wasserwirtschaft mbH, Karlsruhe, 2022. a
Roggenkamp, T. and Herget, J.: Reconstructing peak discharges of historic floods of the river Ahr, Germany, Erdkunde, 68, 49–59, http://www.jstor.org/stable/24365169 (last access: 3 February 2023), 2014a. a, b
Roggenkamp, T. and Herget, J.: Historische Hochwasser der Ahr – Die Rekonstruktion von Scheitelabflüssen ausgewählter Ahr-Hochwasser, Heimatjahrbuch Kreis Ahrweiler 2015, edited by: Ahrweiler, L., 150–154, https://relaunch.kreis-ahrweiler.de/kvar/VT/hjb2015/hjb2015.47.pdf (last access: 3 February 2023), 2014b. a, b
Roggenkamp, T. and Herget, J.: Hochwasser der Ahr im Juli 2021 – Abflusseinschätzung und Einordnung, Hydrologie und Wasserbewirtschaftung (HyWa), 66, 40–49, https://www.hywa-online.de/download/hywa-heft-1-2022/ (last access: 3 February 2023), 2022. a, b, c, d, e, f, g
Schädler, G., Panitz, H.-J., Christner, E., Feldmann, H., Karremann, M., and Laube, N.: Regional Climate Simulations with COSMO-CLM: Ensembles, Very High Resolution and Paleoclimate, in: High Performance Computing in Science and Engineering ' 17, edited by: Nagel, W. E., Kröner, D. H., and Resch, M. M., Springer International Publishing, 411–429, https://doi.org/10.1007/978-3-319-68394-2_24, 2018. a
Schäfer, A., Mühr, B., Daniell, J. E., Ehret, U., Ehmele, F., Küpfer, K., Brand, J., Wisotzky, C., Skapski, J., Rentz, L., Mohr, S., and Kunz, M.: CEDIM Forensic Disaster Analysis (FDA) Group, Hochwasser Mitteleuropa, Juni 2021 (Deutschland), Bericht Nr. 1, Nordrhein-Westfalen & Rheinland-Pfalz, Center for Disaster Management and Risk Reduction Technology, Karlsruhe, Germany, https://doi.org/10.5445/IR/1000135730, 2021. a, b
Schär, C., Frei, C., Lüthi, D., and Davies, H. C.: Surrogate climate-change scenarios for regional climate models, Geophys. Res. Lett., 23, 669–672, https://doi.org/10.1029/96GL00265, 1996. a
Schröter, K., Kunz, M., Elmer, F., Mühr, B., and Merz, B.: What made the June 2013 flood in Germany an exceptional event? A hydro-meteorological evaluation, Hydrol. Earth Syst. Sci., 19, 309–327, https://doi.org/10.5194/hess-19-309-2015, 2015. a, b
Seel, K. A.: Die Ahr und ihre Hochwässer in alten Quellen, Heimatjahrbuch des Kreises Ahrweiler, 40, 91–102, https://relaunch.kreis-ahrweiler.de/kvar/VT/hjb1983/hjb1983.25.htm (last access: 3 February 2023), 1983. a
Shepherd, T. G.: A common framework for approaches to extreme event attribution, Current Climate Change Reports, 2, 28–38, https://doi.org/10.1007/s40641-016-0033-y, 2016. a, b, c
Shepherd, T. G.: Storyline approach to the construction of regional climate change information, P. Roy. Soc. A-Math. Phy., 475, 20190013, https://doi.org/10.1098/rspa.2019.0013, 2019. a
Shepherd, T. G., Boyd, E., Calel, R. A., Chapman, S. C., Dessai, S., Dima-West, I. M., Fowler, H. J., James, R., Maraun, D., Martius, O., Senior, C. A., Sobel, A. H., Stainforth, D. A., Tett, S. F. B., Trenberth, K. E., van den Hurk, B. J. J. M., Watkins, N. W., Wilby, R. L., and Zenghelis, D. A.: Storylines: an alternative approach to representing uncertainty in physical aspects of climate change, Clim. Dynam., 151, 555–571, https://doi.org/10.1007/s10584-018-2317-9, 2018. a, b
Sillmann, J., Shepherd, T. G., van den Hurk, B., Hazeleger, W., Martius, O., Slingo, J., and Zscheischler, J.: Event-Based Storylines to Address Climate Risk, Earth's Future, 9, e2020EF001783, https://doi.org/10.1029/2020EF001783, 2021. a
Skamarock, W. C., Klemp, J. B., Dudhia, J., Gill, D. O., Liu, Z., Berner, J., Wang, W., Powers, J. G., Duda, M. G., Barker, D. M., and Huang, X.-Y.: A description of the advanced research WRF model version 4.1, NCAR Technical Notes, National Center for Atmospheric Research, Boulder, CO, USA, NCAR/TN-556+STR, p. 145, https://doi.org/10.5065/1dfh-6p97, 2019. a
Sørland, S. L., Brogli, R., Pothapakula, P. K., Russo, E., Van de Walle, J., Ahrens, B., Anders, I., Bucchignani, E., Davin, E. L., Demory, M.-E., Dosio, A., Feldmann, H., Früh, B., Geyer, B., Keuler, K., Lee, D., Li, D., van Lipzig, N. P. M., Min, S.-K., Panitz, H.-J., Rockel, B., Schär, C., Steger, C., and Thiery, W.: COSMO-CLM regional climate simulations in the Coordinated Regional Climate Downscaling Experiment (CORDEX) framework: a review, Geosci. Model Dev., 14, 5125–5154, https://doi.org/10.5194/gmd-14-5125-2021, 2021. a
Stocker, T.: Climate change 2013: the physical science basis. Working Group I contribution to the Fifth assessment report of the Intergovernmental Panel on Climate Change, Cambridge university press, Cambridge, UK and New York, NY, USA, https://doi.org/10.1017/CBO9781107415324, 2014. a
Stott, P. A., Stone, D. A., and Allen, M. R.: Human contribution to the European heatwave of 2003, Nature, 432, 610–614, https://doi.org/10.1038/nature03089, 2004. a
Stott, P. A., Christidis, N., Otto, F. E., Sun, Y., Vanderlinden, J.-P., van Oldenborgh, G. J., Vautard, R., von Storch, H., Walton, P., Yiou, P., and and Zwiers, F. W.: Attribution of extreme weather and climate-related events, WIREs Clim Change, 7, 23–41, https://doi.org/10.1002/wcc.380, 2016. a, b
Stucki, P., Rickli, R., Brönnimann, S., Martius, O., Wanner, H., Grebner, D., and Luterbacher, J.: Weather patterns and hydro-climatological precursors of extreme floods in Switzerland since 1868, Meteorol. Z., 21, 531–550, https://doi.org/10.1127/0941-2948/2012/368, 2012. a
Szymczak, S., Backendorf, F., Bott, F., Fricke, K., Junghänel, T., and Walawender, E.: Impacts of Heavy and Persistent Precipitation on Railroad Infrastructure in July 2021: A Case Study from the Ahr Valley, Rhineland-Palatinate, Germany, Atmosphere, 13, 1118, https://doi.org/10.3390/atmos13071118, 2022. a
Sánchez-Benítez, A., Goessling, H., Pithan, F., Semmler, T., and Jung, T.: The July 2019 European Heat Wave in a Warmer Climate: Storyline Scenarios with a Coupled Model Using Spectral Nudging, J. Climate, 35, 2373–2390, https://doi.org/10.1175/JCLI-D-21-0573.1, 2022. a
Taylor, K. E., Stouffer, R. J., and Meehl, G. A.: An Overview of CMIP5 and the Experiment Design, B. Am. Meteorol. Soc., 93, 485–498, https://doi.org/10.1175/BAMS-D-11-00094.1, 2012. a
Teichmann, C., Bülow, K., Otto, J., Pfeifer, S., Rechid, D., Sieck, K., and Jacob, D.: Avoiding extremes: benefits of staying below +1.5 ∘C compared to +2.0 ∘C and +3.0 ∘C global warming, Atmosphere, 9, 115, https://doi.org/10.3390/atmos9040115, 2018. a
Thompson, G., Field, P. R., Rasmussen, R. M., and Hall, W. D.: Explicit Forecasts of Winter Precipitation Using an Improved Bulk Microphysics Scheme. Part II: Implementation of a New Snow Parameterization, Mon. Weather Rev., 136, 5095–5115, https://doi.org/10.1175/2008MWR2387.1, 2008. a
Tradowsky, J. S., Philip, S. Y., Kreienkamp, F., Kew, S. F., Lorenz, P., Arrighi, J., Belleflamme, A., Bettmann, T., Caluwaerts, S., Chan, S. C., Ciavarella, A., De Cruz, L., de Vries, H., Demuth, N., Ferrone, A., Fischer, E. M., Fowler, H. J., Goergen, K., Heinrich, D., Henrichs, Y., Lenderink, G., Kaspar, F., Nilson, E., Otto, F. E. L., Ragone, F., Seneviratne, S. I., Singh, R. K., Skålevåg, A., Termonia, P., Thalheimer, L., van Aalst, M., Van den Bergh, J., Van de Vyver, H., Vannitsem, S., van Oldenborgh, G. J., Van Schaeybroeck, B., Vautard, R., Vonk, D., and Wanders, N.: Attribution of heavy rainfall events leading to the severe flooding in Western Europe during July 2021, Clim. Change, in revision, 2022. a, b
Trenberth, K. E., Dai, A., Rasmussen, R. M., and Parsons, D. B.: The Changing Character of Precipitation, B. Am. Meteorol. Soc., 84, 1205–1218, https://doi.org/10.1175/BAMS-84-9-1205, 2003. a, b
Trenberth, K. E., Fasullo, J. T., and Shepherd, T. G.: Attribution of climate extreme events, Nat. Clim. Change, 5, 725–730, https://doi.org/10.1038/nclimate2657, 2015. a
Trier, S. B., Parsons, D. B., and Clark, J. H. E.: Environment and Evolution of a Cold-Frontal Mesoscale Convective System, Mon. Weather Rev., 119, 2429–2455, https://doi.org/10.1175/1520-0493(1991)119<2429:EAEOAC>2.0.CO;2, 1991. a
Ulbrich, U., Brücher, T., Fink, A. H., Leckebusch, G. C., Krüger, A., and Pinto, J. G.: The central European floods of August 2002: Part 1 – Rainfall periods and flood development, Weather, 58, 371–377, https://doi.org/10.1256/wea.61.03A, 2003. a, b
van Garderen, L., Feser, F., and Shepherd, T. G.: A methodology for attributing the role of climate change in extreme events: a global spectrally nudged storyline, Nat. Hazards Earth Syst. Sci., 21, 171–186, https://doi.org/10.5194/nhess-21-171-2021, 2021. a
Vergara-Temprado, J., Ban, N., and Schär, C.: Extreme Sub-Hourly Precipitation Intensities Scale Close to the Clausius-Clapeyron Rate Over Europe, Geophys. Res. Lett., 48, e2020GL089506, https://doi.org/10.1029/2020GL089506, 2021. a
von Storch, H., Langenberg, H., and Feser, F.: A Spectral Nudging Technique for Dynamical Downscaling Purposes, Mon. Weather Rev., 128, 3664–3673, https://doi.org/10.1175/1520-0493(2000)128<3664:ASNTFD>2.0.CO;2, 2000. a
Vorogushyn, S., Apel, H., Kemter, M., and Thieken, A.: Analyse der Hochwassergefährdung im Ahrtal unter Berücksichtigung historischer Hochwasser, Hydrol. Wasserbewirts., 66, 244–254, https://doi.org/10.5675/HyWa_2022.5_2, 2022. a, b, c, d
Weckwerth, T. M. and Parsons, D. B.: A Review of Convection Initiation and Motivation for IHOP_2002, Mon. Weather Rev., 134, 5–22, https://doi.org/10.1175/MWR3067.1, 2006. a
Weigl, E. and Winterrath, T.: Radargestützte Niederschlagsanalyse und –vorhersage (RADOLAN, RADVOR-OP), Promet, 35, 78–86, 2009. a
Wilks, D. S.: Statistical methods in the atmospheric sciences, in: International Geophysics Series, 91, 2nd Edn., Elsevier Acad. Press, ISBN 13:978-0-12-751966-1, 2006. a
Winterrath, T., Brendel, C., Hafer, M., Junghänel, T., Klameth, A., Lengfeld, K., Walawender, E., Weigl, E., and Becker, A.: RADKLIM Version 2017.002: Reprozessierte, mit Stationsdaten angeeichte Radarmessungen (RADOLAN), 5-Minuten-Niederschlagsraten (YW), Deutscher Wetterdienst (DWD) [data set], https://doi.org/10.5676/DWD/RADKLIM_YW_V2017.002, 2018. a
Woollings, T., Barriopedro, D., Methven, J., Son, S.-W., Martius, O., Harvey, B., Sillmann, J., Lupo, A. R., and Seneviratne, S.: Blocking and its response to climate change, Current Climate Change Reports, 4, 287–300, https://doi.org/10.1007/s40641-018-0108-z, 2018. a
WRF: wrf-model/WRF, GitHub [code], https://github.com/wrf-model/WRF/releases/tag/v4.3, last access: 4 April 2023. a
Wupperverband: Wupperverband für Wasser, Mensch und Umwelt, Wuppertal, Germany, https://www.wupperverband.de, last access: 4 April 2023. a
Zhang, C., Wang, Y., and Hamilton, K.: Improved Representation of Boundary Layer Clouds over the Southeast Pacific in ARW-WRF Using a Modified Tiedtke Cumulus Parameterization Scheme, Mon. Weather Rev., 139, 3489–3513, https://doi.org/10.1175/MWR-D-10-05091.1, 2011. a
Zhang, F., Sun, Y. Q., Magnusson, L., Buizza, R., Lin, S.-J., Chen, J.-H., and Emanuel, K.: What is the predictability limit of midlatitude weather?, J. Atmos. Sci., 76, 1077–1091, https://doi.org/10.1175/JAS-D-18-0269.1, 2019. a
- Abstract
- Introduction
- Data and methods
- The July 2021 event in the historical context
- Relation to climate change
- Discussion and conclusions
- Data availability
- Author contributions
- Competing interests
- Disclaimer
- Special issue statement
- Acknowledgements
- Financial support
- Review statement
- References
- Supplement