the Creative Commons Attribution 4.0 License.
the Creative Commons Attribution 4.0 License.
 | 01 Feb 2021
Data assimilation impact studies with the AROME-WMED reanalysis of the first special observation period of the Hydrological cycle in the Mediterranean Experiment
Mathieu Nuret
Pierre Brousseau
Olivier Caumont
This study was performed in the framework of HyMeX (Hydrological cycle in the Mediterranean Experiment), which aimed to study the heavy precipitation that regularly affects the Mediterranean area. A reanalysis with a convective-scale model AROME-WMED (Application of Research to Operations at MEsoscale western Mediterranean) was performed, which assimilated most of the available data for a 2-month period corresponding to the first special observation period of the field campaign (Fourrié et al., 2019). Among them, observations related to the low-level humidity flow were assimilated. Such observations are important for the description of the feeding of the convective mesoscale systems with humidity (Duffourg and Ducrocq, 2011; Bresson et al., 2012; Ricard et al., 2012). Among them there were a dense reprocessed network of high-quality Global Navigation Satellite System (GNSS) zenithal total delay (ZTD) observations, reprocessed data from wind profilers, lidar-derived vertical profiles of humidity (ground and airborne) and Spanish radar data. The aim of the paper is to assess the impact of the assimilation of these four observation types on the analyses and the forecasts from the 3 h forecast range (first guess) up to the 48 h forecast range. In order to assess this impact, several observing system experiments (OSEs) or so-called denial experiments, were carried out by removing one single data set from the observation data set assimilated in the reanalysis.
Among the evaluated observations, it is found that the ground-based GNSS ZTD data set provides the largest impact on the analyses and the forecasts, as it represents an evenly spread and frequent data set providing information at each analysis time over the AROME-WMED domain. The impact of the reprocessing of GNSS ZTD data also improves the forecast quality, but this impact is not statistically significant. The assimilation of the Spanish radar data improves the 3 h precipitation forecast quality as well as the short-term (30 h) precipitation forecasts, but this impact remains located over Spain. Moreover, marginal impact from wind profilers was observed on wind background quality. No impacts have been found regarding lidar data, as they represent a very small data set, mainly located over the sea.
- Article
(5978 KB) - Full-text XML
-
Supplement
(137 KB) - BibTeX
- EndNote


Heavy precipitation regularly affects the Mediterranean area with huge damages and sometimes casualties. One of the aims of the Hydrological cycle in the Mediterranean Experiment (HyMeX; Drobinski et al., 2014) was to study the high-impact weather events, especially during the first special observation period (SOP1; Ducrocq et al., 2014), which took place in autumn 2012 (5 September–6 November 2012) in the northwestern Mediterranean. The importance of an accurate description of the low-level humidity flow, which feeds the mesoscale systems, was shown in previous studies (Duffourg and Ducrocq, 2011; Bresson et al., 2012; Ricard et al., 2012). This is why during this period research observations were deployed over the northwestern Mediterranean area. These observations aimed at a better description of the humidity and wind fields. As an example, water vapour lidars were deployed at Candillargues and Menorca island (pink dots in Fig. 1). Particular attention was also paid to the control of data quality.
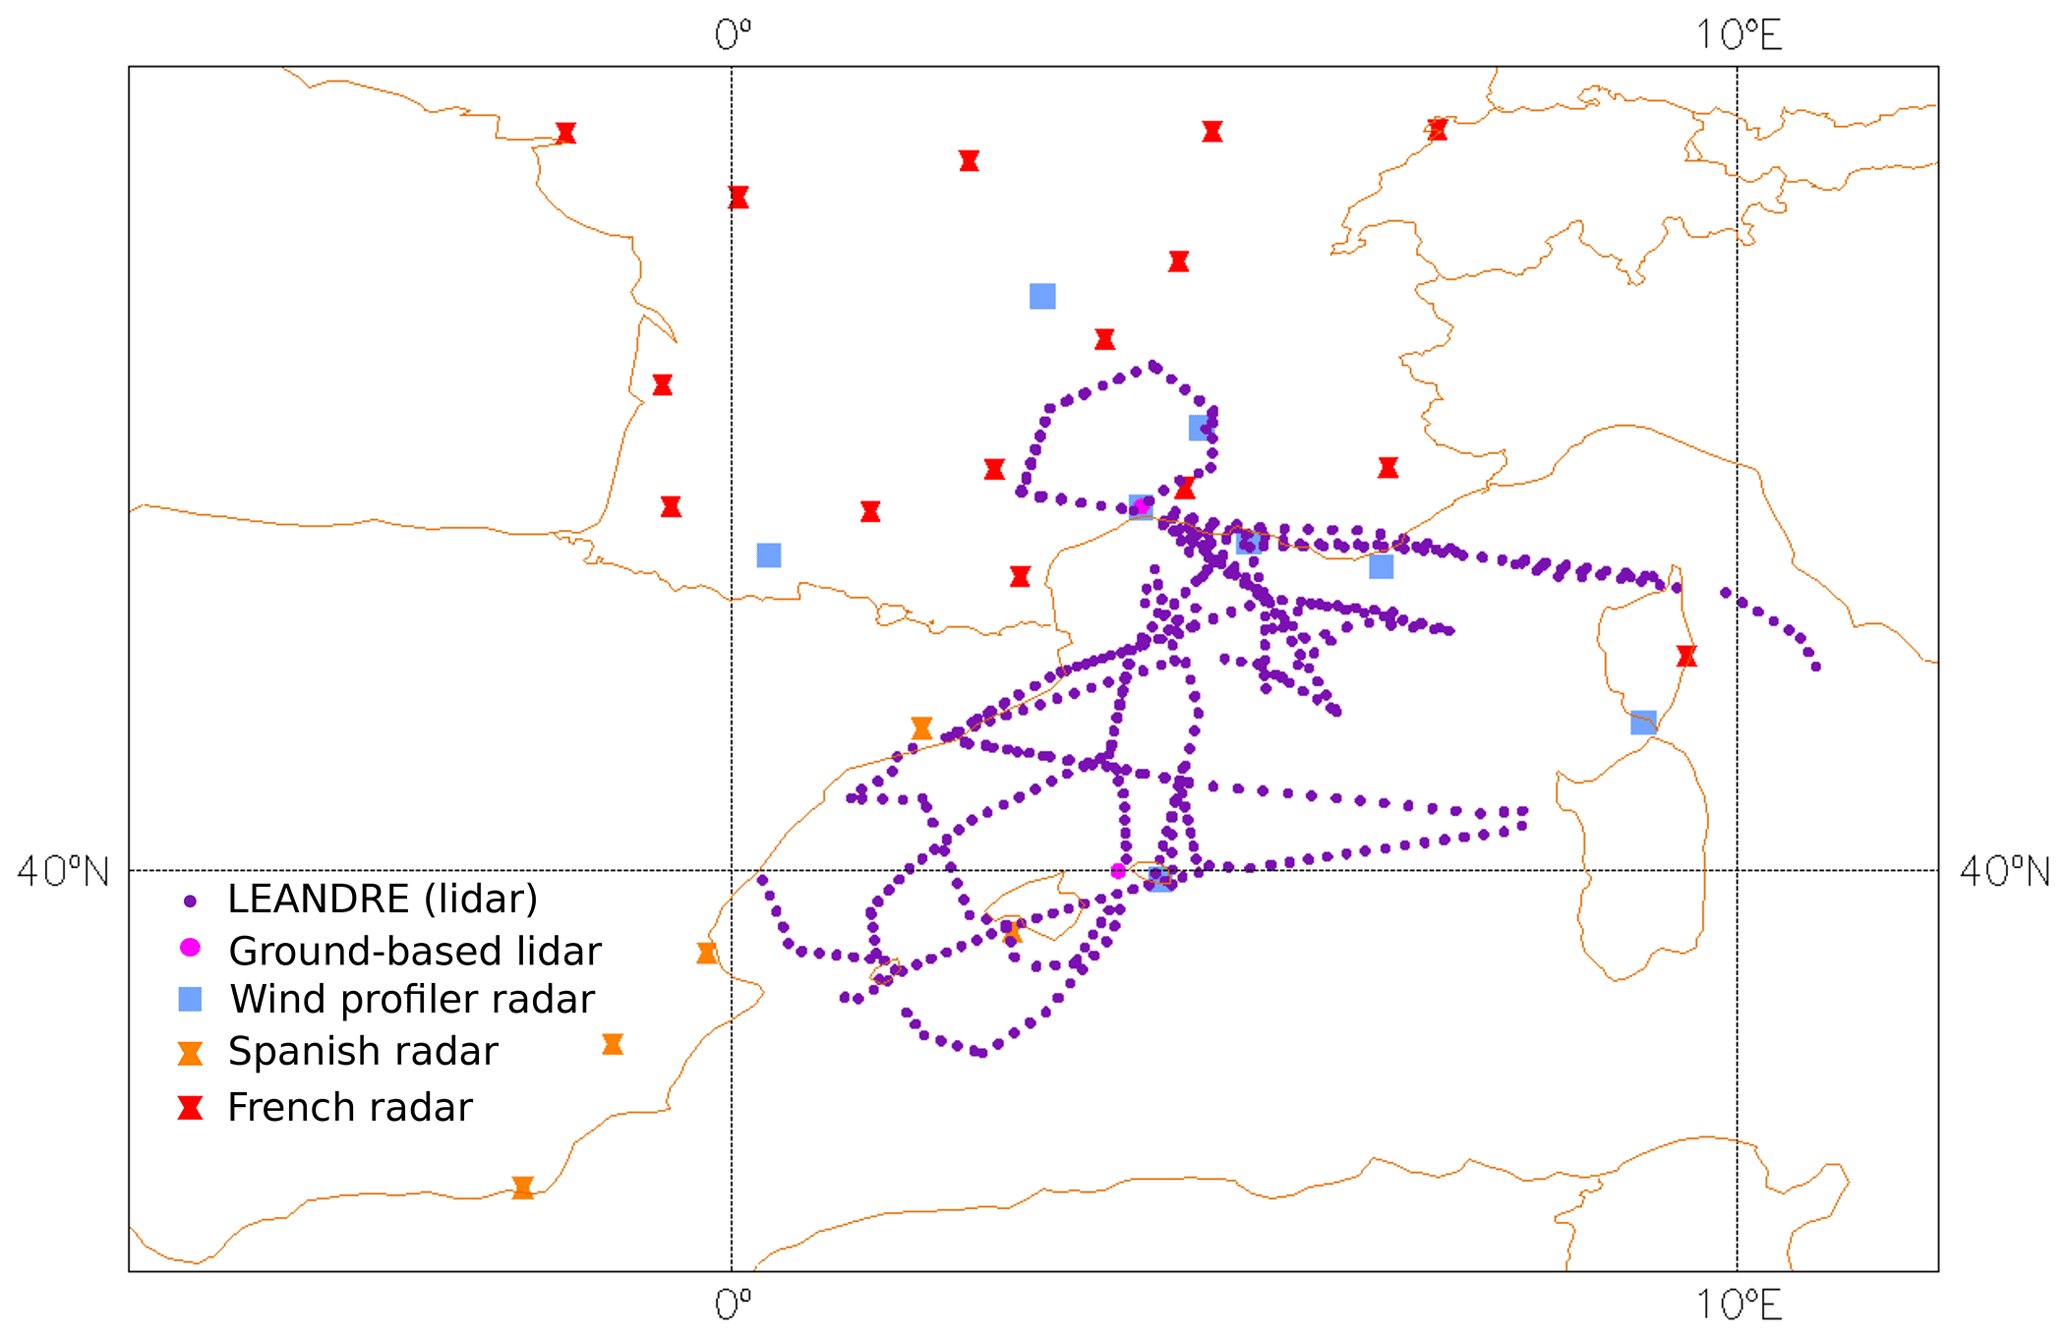
Figure 1Location of observations considered in this study, with the exception of GNSS zenithal total delays. Wind profilers are depicted with blue squares; ground-based lidars are depicted with pink dots; assimilated LEANDRE II (Lidar Embarqué pour l'étude des Aérosols, Nuage, Dynamique, Rayonnement et Espèces minoritaires) airborne profiles are depicted with purple dots; and Spanish radars are depicted with orange symbols. Red symbols correspond to the French radar locations.
Another important element to better understand the key processes related to the high precipitation and their forecasting is the convective-scale modelling. For many years, such numerical weather prediction models have been implemented in operations to enhance the forecast quality. In addition, the forecast quality depends on their initial atmospheric conditions, which are determined with a data assimilation system.
For the HyMeX SOP1 campaign, an AROME (Application of Research to Operations at MEsoscale; Seity et al., 2011) version was developed and ran in real time to forecast and study heavy precipitation in this region: the AROME-WMED (western Mediterranean) model (Fourrié et al., 2015). This model is cantered over the western Mediterranean basin and includes a data assimilation system, which provides every 3 h an analysis of the meteorological situation. In the framework of the Innovative Observing and Data Assimilation Systems for severe weather events in the Mediterranean (IODA-MED) project, two reanalyses were performed after the campaign (Fourrié et al., 2019) with the aim of providing new references for process studies. The first one intended to provide a homogeneous data set of atmospheric fields (which was not the case in the real-time version due to a system upgrade in the middle of the SOP1). The second one included in addition a maximum of observations deployed during the SOP1 field campaign with a more recent version of the model. The latter will be considered in this study.
Among the research observations assimilated in the AROME-WMED reanalysis were the humidity profiles from ground-based and airborne lidars. Reprocessing after the campaign was also performed for the wind profiler data (Saïd et al., 2016) and the ground-based GNSS (Global Navigation Satellite System) zenithal total delays (ZTDs) (Bock et al., 2016) to improve data quality and filter out bad data.
Previous impact studies were already performed for this type of observation in other contexts. For example, Bielli et al. (2012) and Grzeschik et al. (2008) tested the impact of the assimilation of water vapour lidars in mesoscale models and found a positive impact of such an assimilation up to the 24 h forecast range. Benjamin et al. (2004) studied the impact of a wind profiler network and obtained a positive impact on short-range (3–12 h) forecasts. Concerning the GNSS data, Mahfouf et al. (2015) showed systematic improvements of the atmospheric-humidity short-range forecasts and of the structure and the location of precipitation in the AROME models as found previously in a heavy precipitation context (Boniface et al., 2009). These results agree well with previous studies performed in other numerical weather prediction (NWP) models (Macpherson et al., 2008; Gutman et al., 2004).
As previously mentioned, an accurate description of the low-level humidity flow is required to simulate the evolution of the mesoscale system well. The aim of the study presented here is to quantify the impact of four observation systems on the quality of precipitation simulation. These observation data sets, assimilated in the AROME-WMED reanalysis of the SOP1, provided information on the atmospheric-humidity distribution and the wind circulation, hence describing the moisture flux of the low-level flow. The observations are the reprocessed ZTDs from the ground-based GNSS (Bock et al., 2016), the humidity profiles from ground-based and airborne lidars (Chazette et al., 2016; Di Girolamo et al., 2016), reprocessed wind profiler data (Saïd et al., 2016), and the Doppler winds and reflectivities from the Spanish radars. To achieve this, a number of denial data assimilation experiments, consisting in removing one observation type, were carried out during the 2-month period of the SOP1.
The paper is arranged as follows. Section 2 describes the AROME-WMED configurations, the observation data sets and the denial experiments. Section 3 assesses the impact of the ground-based GNSS data assimilation on the analyses, the background and the forecast quality during the SOP1. Section 4 provides information on the impact of other observation types (i.e. wind profilers, lidars and Spanish radars). Section 5 focusses on the impact of all these data on the IOP16a (Intensive Observation Period) case study. Finally, conclusions are given in Sect. 7.
2.1 “Denial” experiment methodology
To study the contribution of the observations on the analysis and forecast quality of the heavy-precipitation events of the SOP1, denial experiments have been devised. These experiments consist of removing one observation data set to compare its forecast quality with the reanalysis simulations, where all observations are assimilated. Here, denial experiments were conducted on the following four observation types: the ground-based GNSS ZTDs, the wind profilers, the water vapour lidars and Spanish radars. They were performed with the AROME-WMED model.
2.2 AROME-WMED configuration
The different AROME-WMED model configurations are described in Fourrié et al. (2015, 2019) and rely on the operational limited-area model AROME (Seity et al., 2011; Brousseau et al., 2016) version running at Météo-France since 2008. At the time of the SOP1 campaign, analyses were performed at a 2.5 km horizontal resolution every 3 h with a 3D variational data assimilation (3D-Var; Brousseau et al., 2011). The AROME-WMED version used in this study as the reference is the second reanalysis one, named hereafter REANA. An extensive description of this reanalysis can be found in Fourrié et al. (2019). The main components are recalled here. The REANA data set has a 2.5 km horizontal resolution, and the model has 60 vertical levels from 10 m above the surface to 1 hPa. Deep convection is explicitly resolved, and a one-moment microphysical scheme with five classes of hydrometeors is used (Pinty and Jabouille, 1998; Caniaux et al., 1994).
Initial atmospheric states of AROME-WMED come every 3 h from 3D-Var analyses assimilating observations within a ±1 h 30 min assimilation window. This system analyses the two components of horizontal wind, temperature, specific water vapour humidity and surface-pressure fields on the model grid at full resolution. The other prognostic model fields (turbulent kinetic energy, pressure departure from hydrostatism, vertical divergence and specific content of five condensed water species) are not updated by the analyses but copied from the background. The background error statistics are climatological. Based on the Berre (2000) multivariate formulation, cross covariances between errors for different physical quantities are represented using scale‐dependent statistical regressions, including an extra balance relationship for specific humidity. The background error statistics have been calculated using forecast differences from AROME-WMED ensemble data assimilation (Brousseau et al., 2011, approach) over a 15 d period of the HyMeX SOP1 (17 to 31 October 2012) to be representative of the encountered meteorological conditions of the SOP1 on average. More details on these background error covariances are available in Fourrié et al. (2019). Lateral boundary conditions are hourly provided by the global NWP ARPEGE (Action de Recherche Petite Echelle Grande Echelle; Courtier et al., 1991) forecasts which also benefited from a maximum of assimilated observation with longer cutoff analyses. Each day at 00:00 UTC, a 54 h forecast is run. Conventional observations (from radiosondes, aircraft, surface stations, wind profilers and GNSS ZTDs), radar data and satellite observations (infrared and microwave radiances, atmospheric motion vectors, and ocean surface winds from scatterometers) were assimilated.
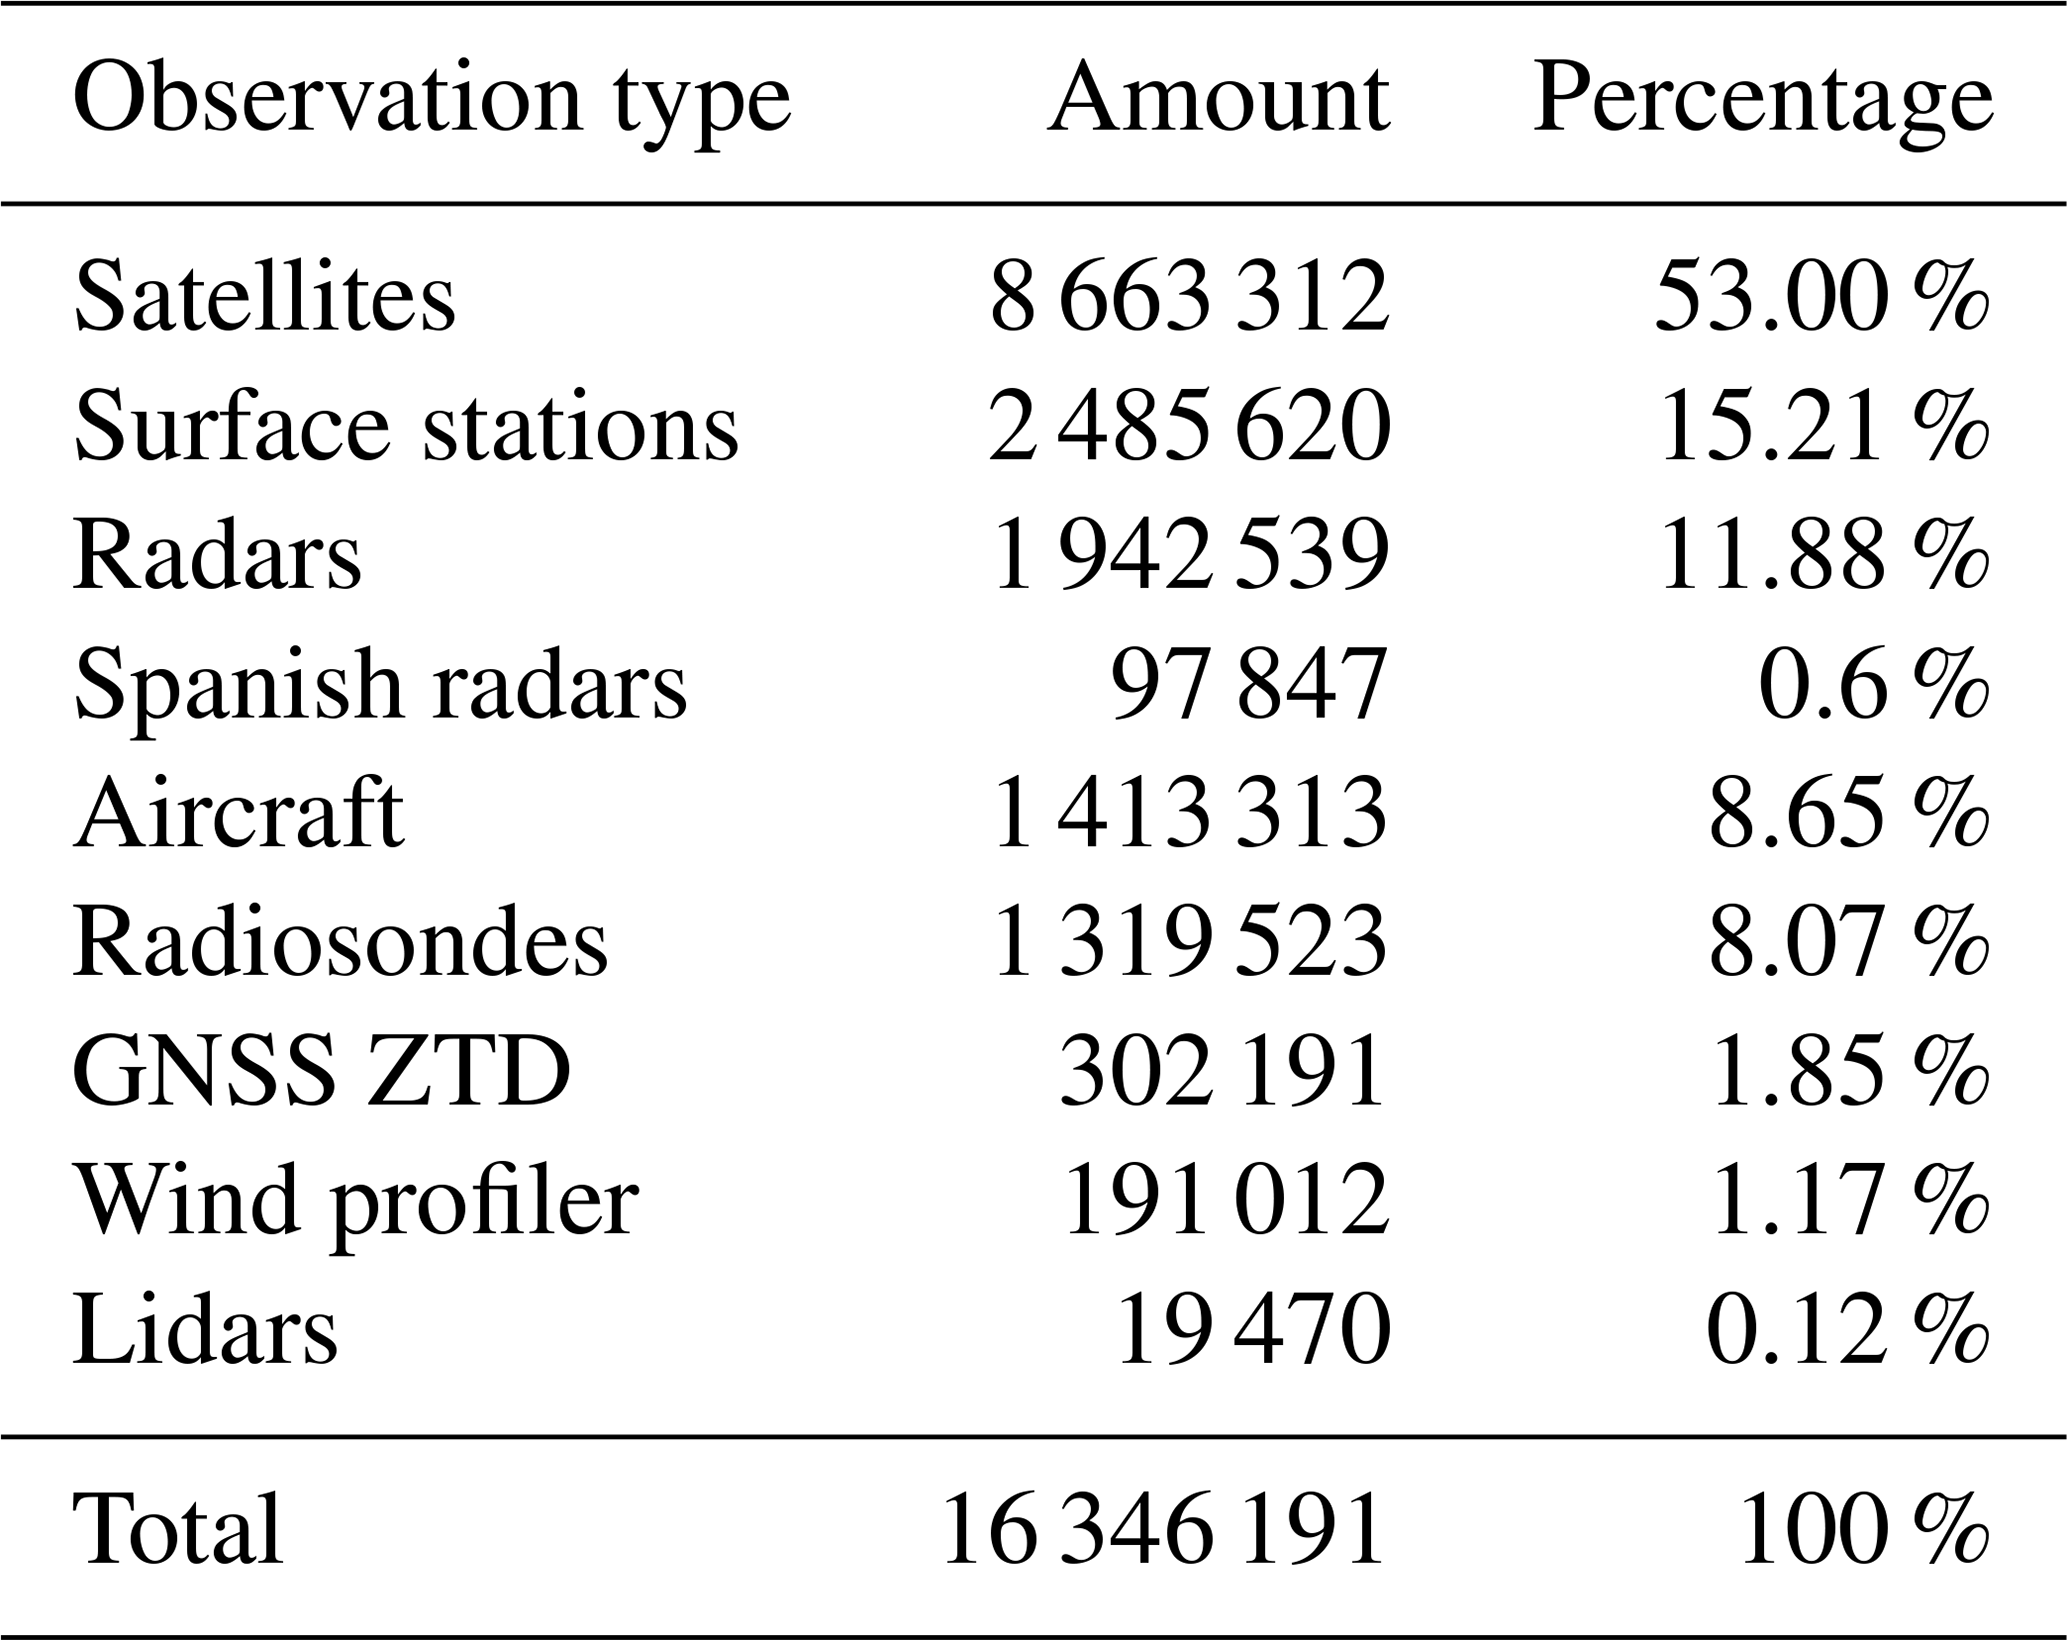
Table 1 presents the distribution of assimilated data in REANA as a function of observation types. Satellite data represent the majority of observations. This can be explained by the fact that the Infrared Atmospheric Sounding Interferometer (IASI) sensor provides 44 channels per observation point. Surface observations provide 15.21 % of assimilated data. Aircraft and radiosondes give a similar amount of data (around 8 %). GNSS ZTDs represent 1.85 % of the total, and wind profilers represent 1.17 %. Special efforts were made to assimilate non-operational data types such as lidar water vapour profiles and Spanish radar data. Humidity data from lidar contribute a very small amount of assimilated data at 0.12 %. Radar data represent 11.88 % of the total amount of assimilated data, and Spanish ones only represent 0.6 %.
Table 1Sorted amounts of assimilated data in REANA over the SOP1 period (5 September–5 November 2012).
2.3 Description of the studied observing systems
As mentioned above, four observing systems were studied. The location of these observations is shown in Fig. 1, except for the ground-based GNSS ZTD location, which is available in Fig. 4 of Fourrié et al. (2019).
2.3.1 GNSS zenithal total delays
GNSS ZTD provides useful information on precipitable water and pressure at a high temporal frequency and in all weather conditions. In REANA2, we considered here reprocessed data (REPROC-GNSS in the following) with a homogeneous reprocessing using a single software and more precise satellite orbit position and clocks (Bock et al., 2016), which were available for the whole SOP1. Additional data were also considered compared to the operational and data set available in near real time. This data set, called hereafter OPERGNSS, is provided by E-GVAP (EUMETNET EIG – Network of European Meteorological Services – GNSS water VApour Programme), and ZTD data for one reception station may be available for more than 10 processing centres. These ZTD data are assimilated according the methodology described in Mahfouf et al. (2015). The model equivalent is computed with the following equation (Mahfouf et al., 2015):
where p is the pressure, T is the temperature, e is the water vapour pressure, k1=0.776 Pa−1 K and k3=3730 Pa−1 K2, x is the height above the ground, and ztop is the height of the model top. After a monitoring of the difference between observations and model equivalent, observations with good statistics are selected from a “white list”. ZTD data are also bias-corrected, and an updated bias correction for each GNSS station was also computed in the REANA2 version. They are finally assimilated if they pass the first-guess quality control which rejects data too far from the model background. Only one observation per 3 h assimilation and per surface station is assimilated for each analysis. Please refer to Mahfouf et al. (2015) for more information on the data assimilation of GNSS ZTD in AROME.
2.3.2 Wind profilers
Data from eight wind profiler radars (sounding in VHF or UHF bands) were assimilated in AROME-WMED (see Fig. 1). These profilers provided vertical profiles of the wind vector, turbulence, precipitation, and height of the atmospheric boundary layer and tropopause (Saïd et al., 2016). The measure principle is described in Annex 1 of Saïd et al. (2016). Profilers measure the Doppler radial spectra of the returned signal backscattered by various types of targets. In order to derive the three components of the wind, most of the HyMeX profilers use five beams. These data were available for the whole SOP1 in real time and have been reprocessed after the SOP1 by Saïd et al. (2016) with an improved quality control to remove spurious data. Here, observations from eight wind radars (UHF and VHF) mainly located in the south of France, in Corsica and in Menorca (Fig. 1) were considered. These observations are assimilated as vertical profiles of horizontal wind.
2.3.3 Lidars
During the SOP1, ground-based and airborne lidars were operated. The mobile Water vapour and Aerosol LIdar (WALI; Chazette et al., 2016) operates with an emitted wavelength of 354.7 nm. This instrument was operated at a site close to Ciutadella (western part of Menorca located near 39∘59′07′′ N, 3∘50′13′′ E). Mixing ratio profiles were delivered with a resolution of 15 m for the 0–6000 m altitude range. A detailed description of this instrument can be found in Chazette et al. (2016). The raw vertical resolution of the data is 75 m, but for assimilation above 2000 m, the resolution was thinned starting from 75 to 450 m above 5000 m.
The second ground-based lidar, the BASIL instrument (University of BASILicata Raman lidar system; Di Girolamo et al., 2016) was located in Candillargues in the south of France. The original data resolution is 30 m, but data were thinned at 60 m below 1000 m, increasing up to 420 m above 4000 m in the assimilation. For WALI, 292 mixing ratio profiles were assimilated in REANA, covering the period 17 September at 03:00 UTC to 27 October 2012 at 21:00 UTC, whereas for BASIL, 172 profiles were assimilated, covering the period 10 September at 09:00 UTC to 5 November 2012 at 15:00 UTC.
Concerning the LEANDRE II lidar (Chazette et al., 2016) on board ATR 42 aircraft, data were available for 22 analysis slots (512 assimilated profiles), covering the period 11 September at 09:00 UTC to 25 October 2012 at 21:00 UTC. Profiles with a 150 m vertical resolution were thinned at a 15 km horizontal resolution and are mainly located over the Mediterranean Sea (Fig. 1).
2.3.4 Spanish radars
Doppler radial winds and reflectivities from five Spanish radars located in Barcelona, Valencia, Almeria, Murcia and Palma de Mallorca and provided by AEMET (Agencia Estatal de Meteorología) were assimilated in REANA. After a strict quality control check to exclude data with gross errors, only the three lowest elevations were considered for the assimilation. Doppler winds are assimilated in the 3D-Var of AROME according the method described by Montmerle and Faccani (2009), and reflectivity data are assimilated as pseudo-observations of relative humidity profiles as proposed in Caumont et al. (2010) and implemented in Wattrelot et al. (2014).
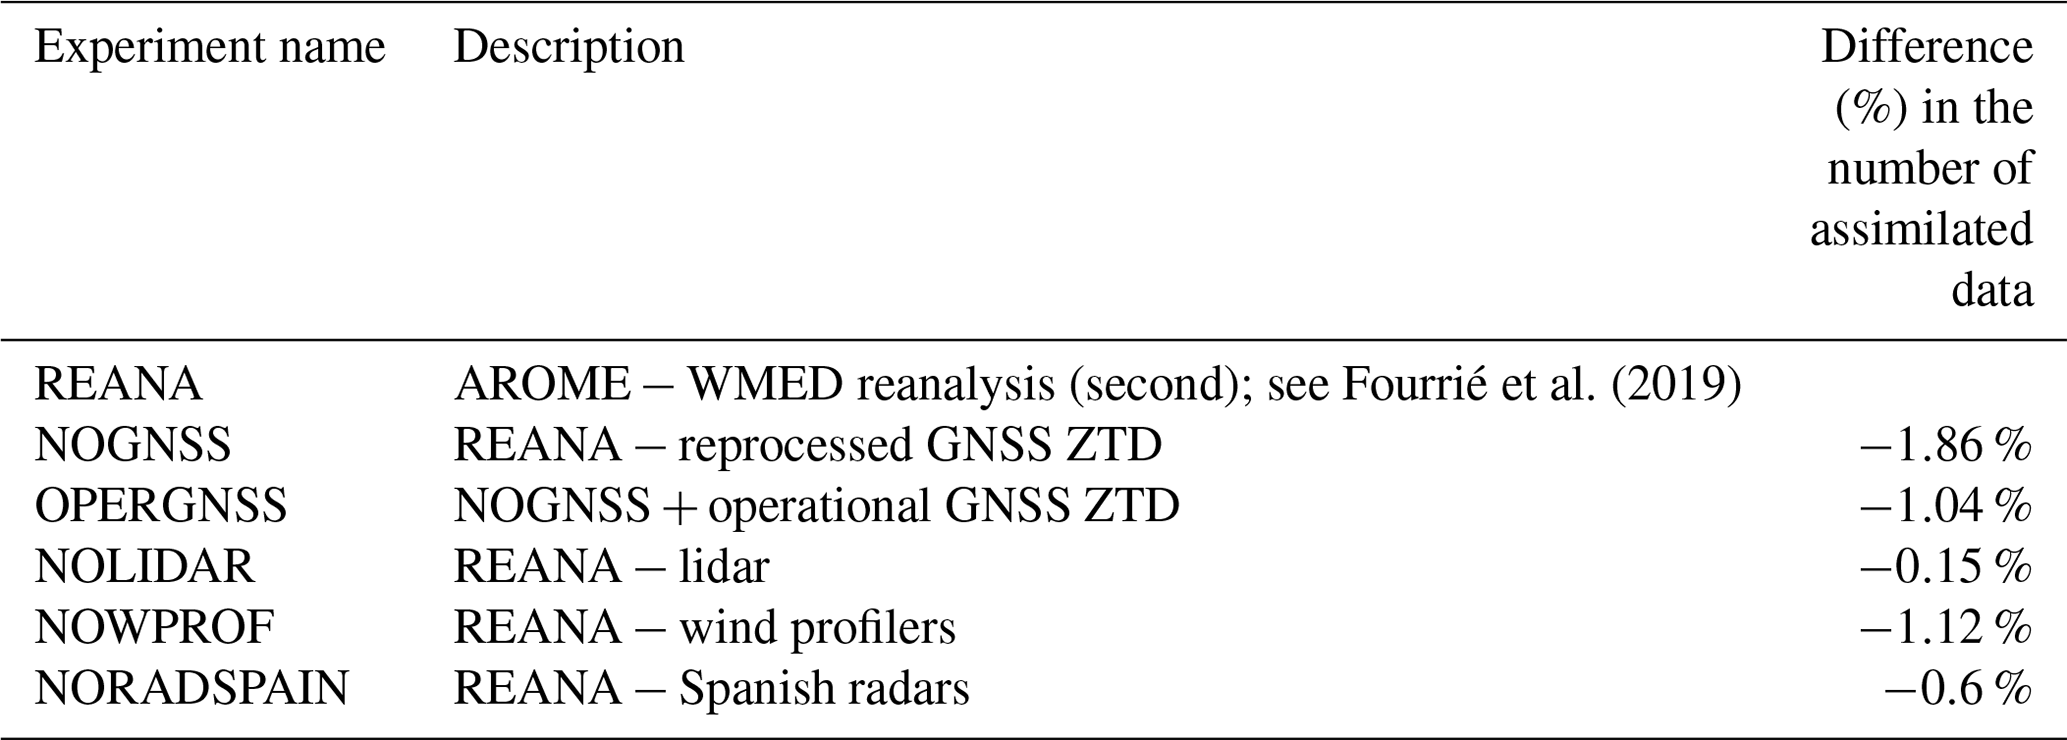
Fourrié et al. (2019)Table 2Description of the data denial experiments discussed in this study and difference (in %) in the amount of assimilated data compared to the reanalysis REANA.
Several procedures are applied to raw data in order to avoid erroneous measurements entering the minimization as much as possible. An observation operator allows for simulating radial Doppler winds measurements from the model horizontal wind based on Caumont and Ducrocq (2008). Only measurements performed within 150 km of the radar are considered due to the broadening of the beam with increasing distance and the lack of reliability. An observation error variance proportional to the distance from the radar is applied in the minimization. Reflectivities are not directly assimilated, but they are used to retrieve pseudo-observations of relative humidity from surrounding simulated reflectivity profiles through a unidimensional Bayesian inversion. A horizontal thinning on the data (Doppler winds and retrieved profiles of relative humidity) is performed to avoid horizontal correlation of observation errors: only one profile, having the most important number of elevations that passed the quality control, is selected in each 15×15 km2 box.
2.4 Description of the experiments
Table 2 summarizes the names of the denial experiments and the observations considered. Five experiments were conducted over the 2-month period of the SOP1 (from 5 September to 5 November 2012). They all used the same configuration of AROME-WMED, with the differences lying in the observations assimilated. For each experiment, it differs by only one observation type from the reanalysis (REANA) used as the reference. This allows for evaluating the impact of this observation type on the analysis and the forecast. Among the five experiments, two experiments deal with the impact of GNSS ZTD. The first one, NOGNSS, is obtained by removing the REPROC-GNSS ZTD from the assimilation. The second, called OPERGNSS, aimed to evaluate the impact of the REPROC-GNSS data set provided by Bock et al. (2016) compared to the OPERGNSS data set provided by E-GVAP. The E-GVAP data set was thus assimilated after replacing that of Bock et al. (2016) in OPERGNSS. The NOLIDAR experiment is the run with neither airborne nor ground-based lidar data in the data assimilation. The NOWPROF experiment is obtained by removing the wind profiler data, and the NORADSPAIN experiment was run without any data from the five Spanish radars. A total of 97 847 observations, representing 0.6 % of the total number of assimilated observations, were removed in the NORADSPAIN experiments.
As shown in Table 2, the largest differences in terms of the number of assimilated observations are obtained with NOGNSS, which leads to a 1.85 % difference in the amount of assimilated data.
2.5 Validation protocol
As a first step, the performance of the data assimilation system is validated by comparing the various analysis (AN) and first-guess (FG) values against available observations which can be independent from REANA (i.e. not assimilated) or on the contrary assimilated in REANA. One of the key tools used to evaluate the performance of the assimilation system is to examine the FG departure (O FG) and the AN departure (O AN) in terms of mean and root mean square (RMS) values, with O standing for observation with the other assimilated observations. Statistics of departures are computed at the observation location.
Those statistics were also computed using a small amount of available independent data. The first source comes from the vessel Marfret Niolon, which was an instrumented commercial ship of opportunity, cruising regularly between the southern French harbour of Marseille and two Algerian harbours (Algiers and Mostaganem). Please refer to Fig. 14 of Fourrié et al. (2019) for the trajectories of the vessel during the SOP1. Two autonomous systems were installed in order to provide atmospheric and oceanic measurements, in the context of the HyMeX long observation period (LOP). A GNSS antenna was installed on the front of the Marfret Niolon for the duration of the HyMeX campaign. The data were post-processed in kinematic precise point positioning with the software provided by Natural Resources Canada (Kouba and Héroux, 2001) and using high-resolution products provided by the International GNSS Service.
The second source of independent data comes from wind data obtained from an airborne Doppler cloud profiler radar named RASTA (Radar Airborne System Tool for Atmosphere; Bouniol et al., 2008; Protat et al., 2009; Delanoë et al., 2013) that flew 45 d during the SOP1. This airborne radar was on board the Falcon 20 research aircraft. It allows for the documentation of the microphysical properties and the horizontal components of the wind field in terms of vertical profiles.
The operational data assimilation monitoring procedure also provides FG and AN departure statistics for assimilated observations in the experiments, which are described in a companion paper (Fourrié et al., 2019).
In a second step, the forecast (range between +3 and +54 h) quality is assessed in terms of surface parameters and precipitation scores. The surface parameters (temperature and relative humidity at 2 m and wind at 10 m) come from the HyMeX database, which provides surface synoptic observations available over the AROME-WMED domain, together with additional hourly observations from the Météo-France, AEMET and MeteoCat (Meteorological Service of Catalonia) mesoscale networks. Some of these observations were assimilated to produce surface analyses. For the evaluation of the precipitation quality, the dense surface data set rain gauge network available in the HyMeX database (version V4, https://doi.org/10.6096/MISTRALS-HyMeX.904) has been used. Scores of 3-hourly accumulated precipitation from all analysis times on a given day are compared to the corresponding observed 24 h accumulated precipitation.
The evaluation of the various denial experiments is compared with the reference REANA run. This allows for getting the impact of each considered observation type on the analysis and the forecast.
This section investigates the impact of assimilating the ground-based GNSS ZTD data on the numerical weather prediction model analysis and subsequent forecast quality. This data set represents the largest one in terms of the number of studied observation types, event though in the end it represents only a small fraction of assimilated data (1.85 %) in the analyses (Table 1). As seen in Table 1, satellite data are the most numerous, followed by surface station data, radar data from the French network, aircraft data and radiosonde data. Even if surface data provide information only for one level, the network is very dense over France and was reinforced in other countries like Spain or Italy. The other observation types provide information at different levels all along the vertical.
3.1 Impact on moisture field
Comparison to the integrated water vapour (IWV) from the reprocessed GNSS observations (not independent from REANA, as the information from this data set is assimilated in this experiment) indicates that the best correlation, as expected, is obtained for REANA (around 0.99), with the second one being OPERGNSS (around 0.975) and the last one being NOGNSS (around 0.96), as shown in Fig. 2. This result is confirmed when computing the RMSE of the differences (Fig. 2, right panel). A weak diurnal cycle of the scores is noticed with a maximum correlation around 09:00 UTC and a minimum around 15:00 UTC. Concerning the standard deviation of the differences, they are lower during the 03:00–09:00 UTC period and larger in the afternoon. This minimum of correlation and maximum of standard deviation correspond to the time of the early stage of the convection, which is less easy to predict and introduces inhomogeneities in the water vapour distribution due to precipitation processes (condensation, evaporation, cold-pool formation, etc.).
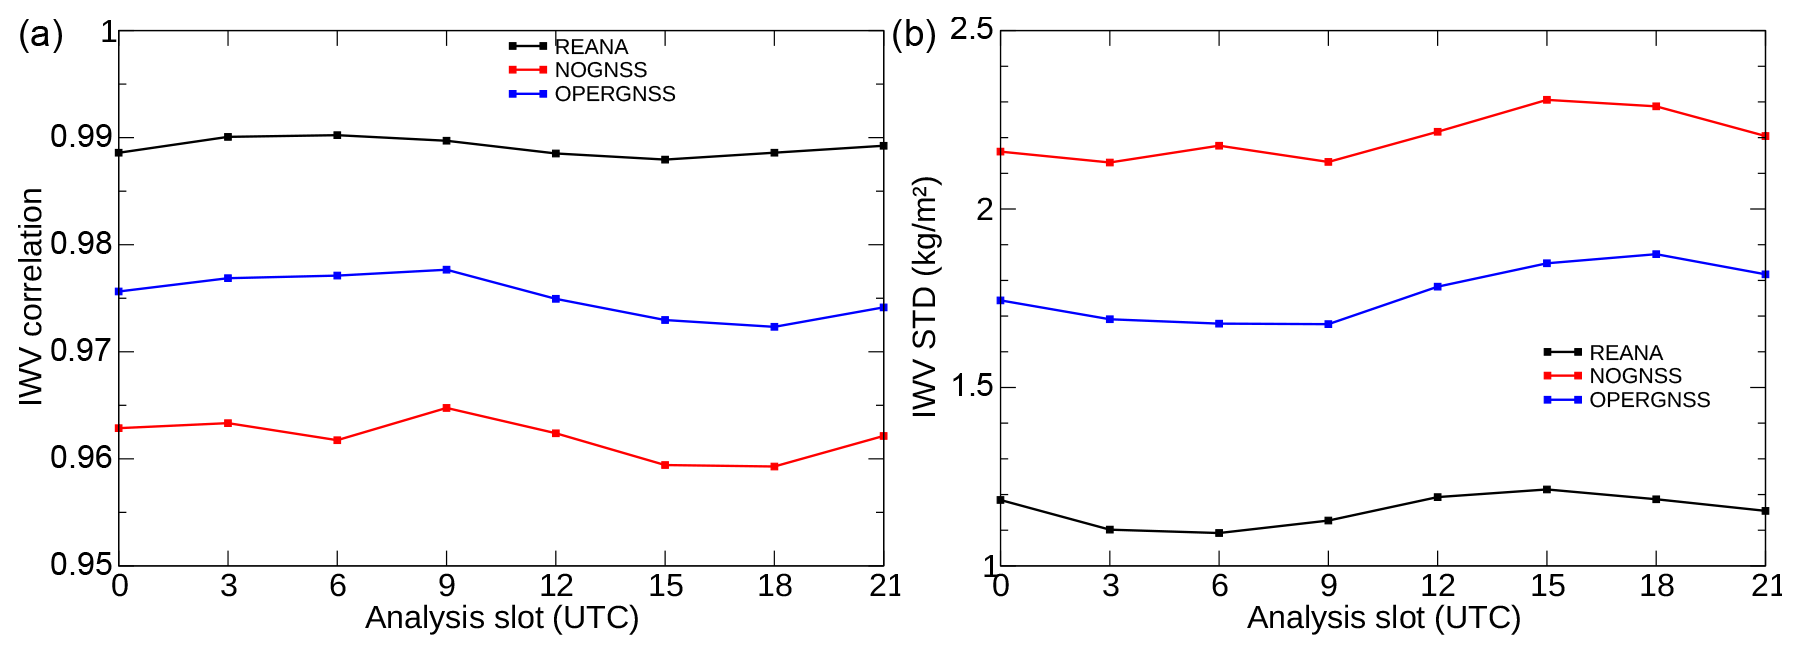
Figure 2Correlation (a) and standard deviations (b, in kg m−2) of integrated water vapour (IWV) content from reprocessed GNSS observations (Bock et al., 2016) and AROME-WMED analyses (REANA in black, NOGNSS in red and OPERGNSS in blue) as a function of the analysis slot (h).
We then discuss the result of the statistics for the analysis and first guess against radiosonde observations, which represents a reference data set in data assimilation (Fig. 3). First of all, as expected, the AN RMS difference (solid lines) is smaller than the FG difference (dashed lines) for the three simulations, showing the expected behaviour of the minimization during the assimilation process, with differences between the observing system experiments (OSEs; Fig. 3). No impact can be seen on the AN RMS differences. The absence of impact can be explained by the fact that radiosondes are reference observations for assimilation and that all the analyses are very constrained by these observations. However, a small positive impact is present on the FG RMS difference 3 h later. The lowest differences are obtained with REANA FG, and the largest ones are obtained with NOGNSS FG. OPERGNSS FG differences are close to REANA FG but slightly larger, showing on the one hand that the assimilation of GNSS data is beneficial (OPERGNSS or REPROC-GNSS data sets) and on the other hand that the reprocessing of the data brings a small improvement in the comparison of FG with humidity of radiosondes. This shows that the modifications in the analysis brought by the GNSS at places other than radiosondes ones are beneficial and kept during the 3 h forecast. The largest improvement of the assimilation of GNSS data is found between 600 and 850 hPa, with NOGNSS FG being larger than REANA FG and OPERGNSS FG in this part of the atmosphere. In addition, OPERGNSS FG is larger than REANA FG between 700 and 850 hPa, showing a slight benefit of assimilating REPROC-GNSS instead of OPERGNSS.
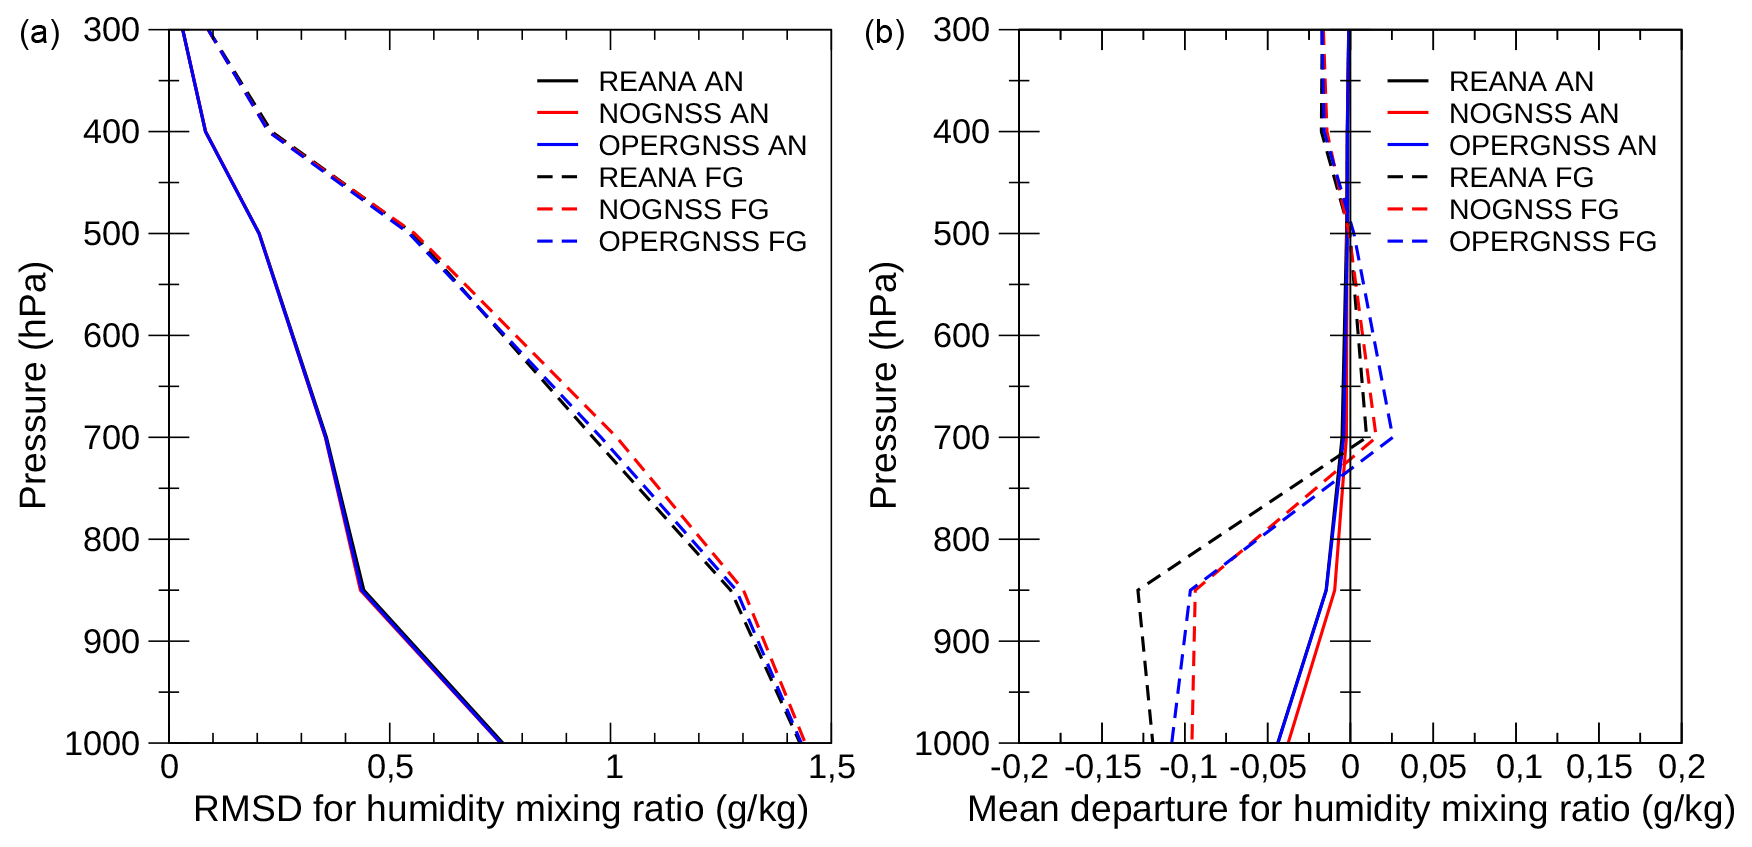
Figure 3Root mean square differences (RMSDs) (a) and mean (b) for analysis (AN, solid lines) and first-guess (FG, dashed lines) departures against assimilated radio-sounding observations for the mixing ratio (g kg−1); REANA in black, NOGNSS in red and OPERGNSS in blue.
The various AN mean departures are very close to each other, with slight negative values in the lower and mid troposphere (analysis too moist), as displayed in the right panel of Fig. 3. Mean FG departures are larger and homothetic, with stronger values for REANA FG, being the signature of a weak moist bias in the corresponding analysis for the lower troposphere. The less biased first guess is the one from the NOGNSS experiment.
In addition, AN and FG were compared with radiances from the Spinning Enhanced Visible and Infrared Imager (SEVIRI) on board the geostationary satellite Meteosat Second Generation (MSG), which is sensitive to moisture (WV channels 6.2 µm for the upper troposphere and 7.3 µm for the mid troposphere). This imager indeed represents another important source of humidity information, especially over oceans where information from neither GNSS nor radiosondes is available. These humidity channel data are assimilated for each of the AROME-WMED analyses. The study of the FG and AN statistics for REANA, OPERGNSS and NO GNSS shows no impact between the various experiments for these observations (not shown, Table S1 in the Supplement).
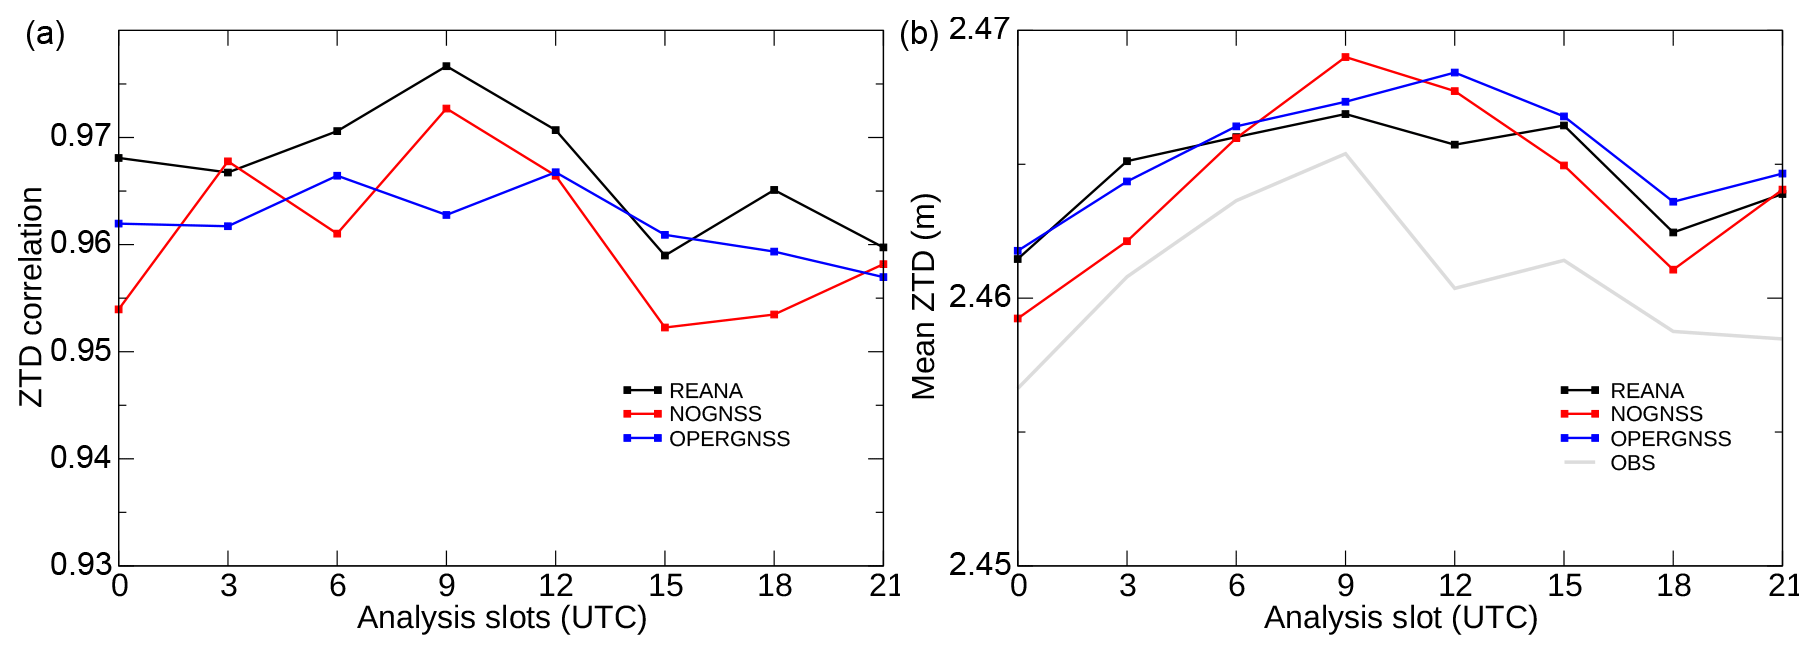
Figure 4Correlation of the differences between zenithal total delays (ZTD) between REANA (black), NOGNSS (red) and OPERGNSS (blue) analyses and corresponding Marfret Niolon independent observations as a function of analysis time in (a); mean value of ZTD (m) in (b), the grey line corresponding to observations.
Table 3Mean zenithal total delays (ZTDs) for REANA, NOGNSS and OPERGNSS analyses and Marfret Niolon observations (first column). Correlation of ZTDs between REANA, NOGNSS and OPERGNSS analyses and corresponding Marfret Niolon observations (OBS) computed over the eight analysis slots and correlation between ZTDs forecasted by AROME-WMED at the 3 h forecast range and corresponding observations from Marfret Niolon.

The correlation between the various AROME-WMED ZTD AN and corresponding independent (not assimilated) Marfret Niolon observations is higher for REANA than for NOGNSS and even for OPERGNSS (Fig. 4). There is a correlation maximum around 09:00 UTC and a minimum around 15:00 UTC. The mean ZTD is quite similar in all experiments, with a maximum at 09:00 UTC and a minimum around 00:00 UTC. A moist bias is found in all simulations when compared to the mean observation in grey shown in Fig. 4. The magnitude of this relative positive (moist) bias is around 0.5 %. Table 3 shows the mean correlation of REANA, NOGNSS and OPERGNSS AN and FG with Marfret Niolon observations. The higher correlation is obtained with REANA for both AN and FG. When comparing the mean value of ZTD at the Marfret Niolon places, the closest value to the observed one is obtained with REANA, even if a small moist bias is observed (0.9 mm). This bias is larger for NOGNSS (3.6 mm) and OPERGNSS (4.8 mm). This could be explained by the fact that there few assimilated observations over the sea, which results in a more biased model. Although the sample size of the Marfret Niolon data set is rather small (around 1000 collocations), this is an original result and makes clear that the REANA experiment produces the best reanalysis and the best 3 h forecasts.
3.2 Impact on wind field
Analysis and first-guess quality has been evaluated against RASTA (Radar Airborne System Tool for Atmosphere) Doppler winds (Borderies et al., 2019a). This airborne radar was on board Falcon 20 aircraft and provided 33 083 wind observations over the Mediterranean area as illustrated in Fig. 5, where only a small amount of wind data from conventional observations is available. It is worth reminding that the data from this instrument were not assimilated in REANA. This data set thus represents additional independent information for the evaluation of our denial experiments.
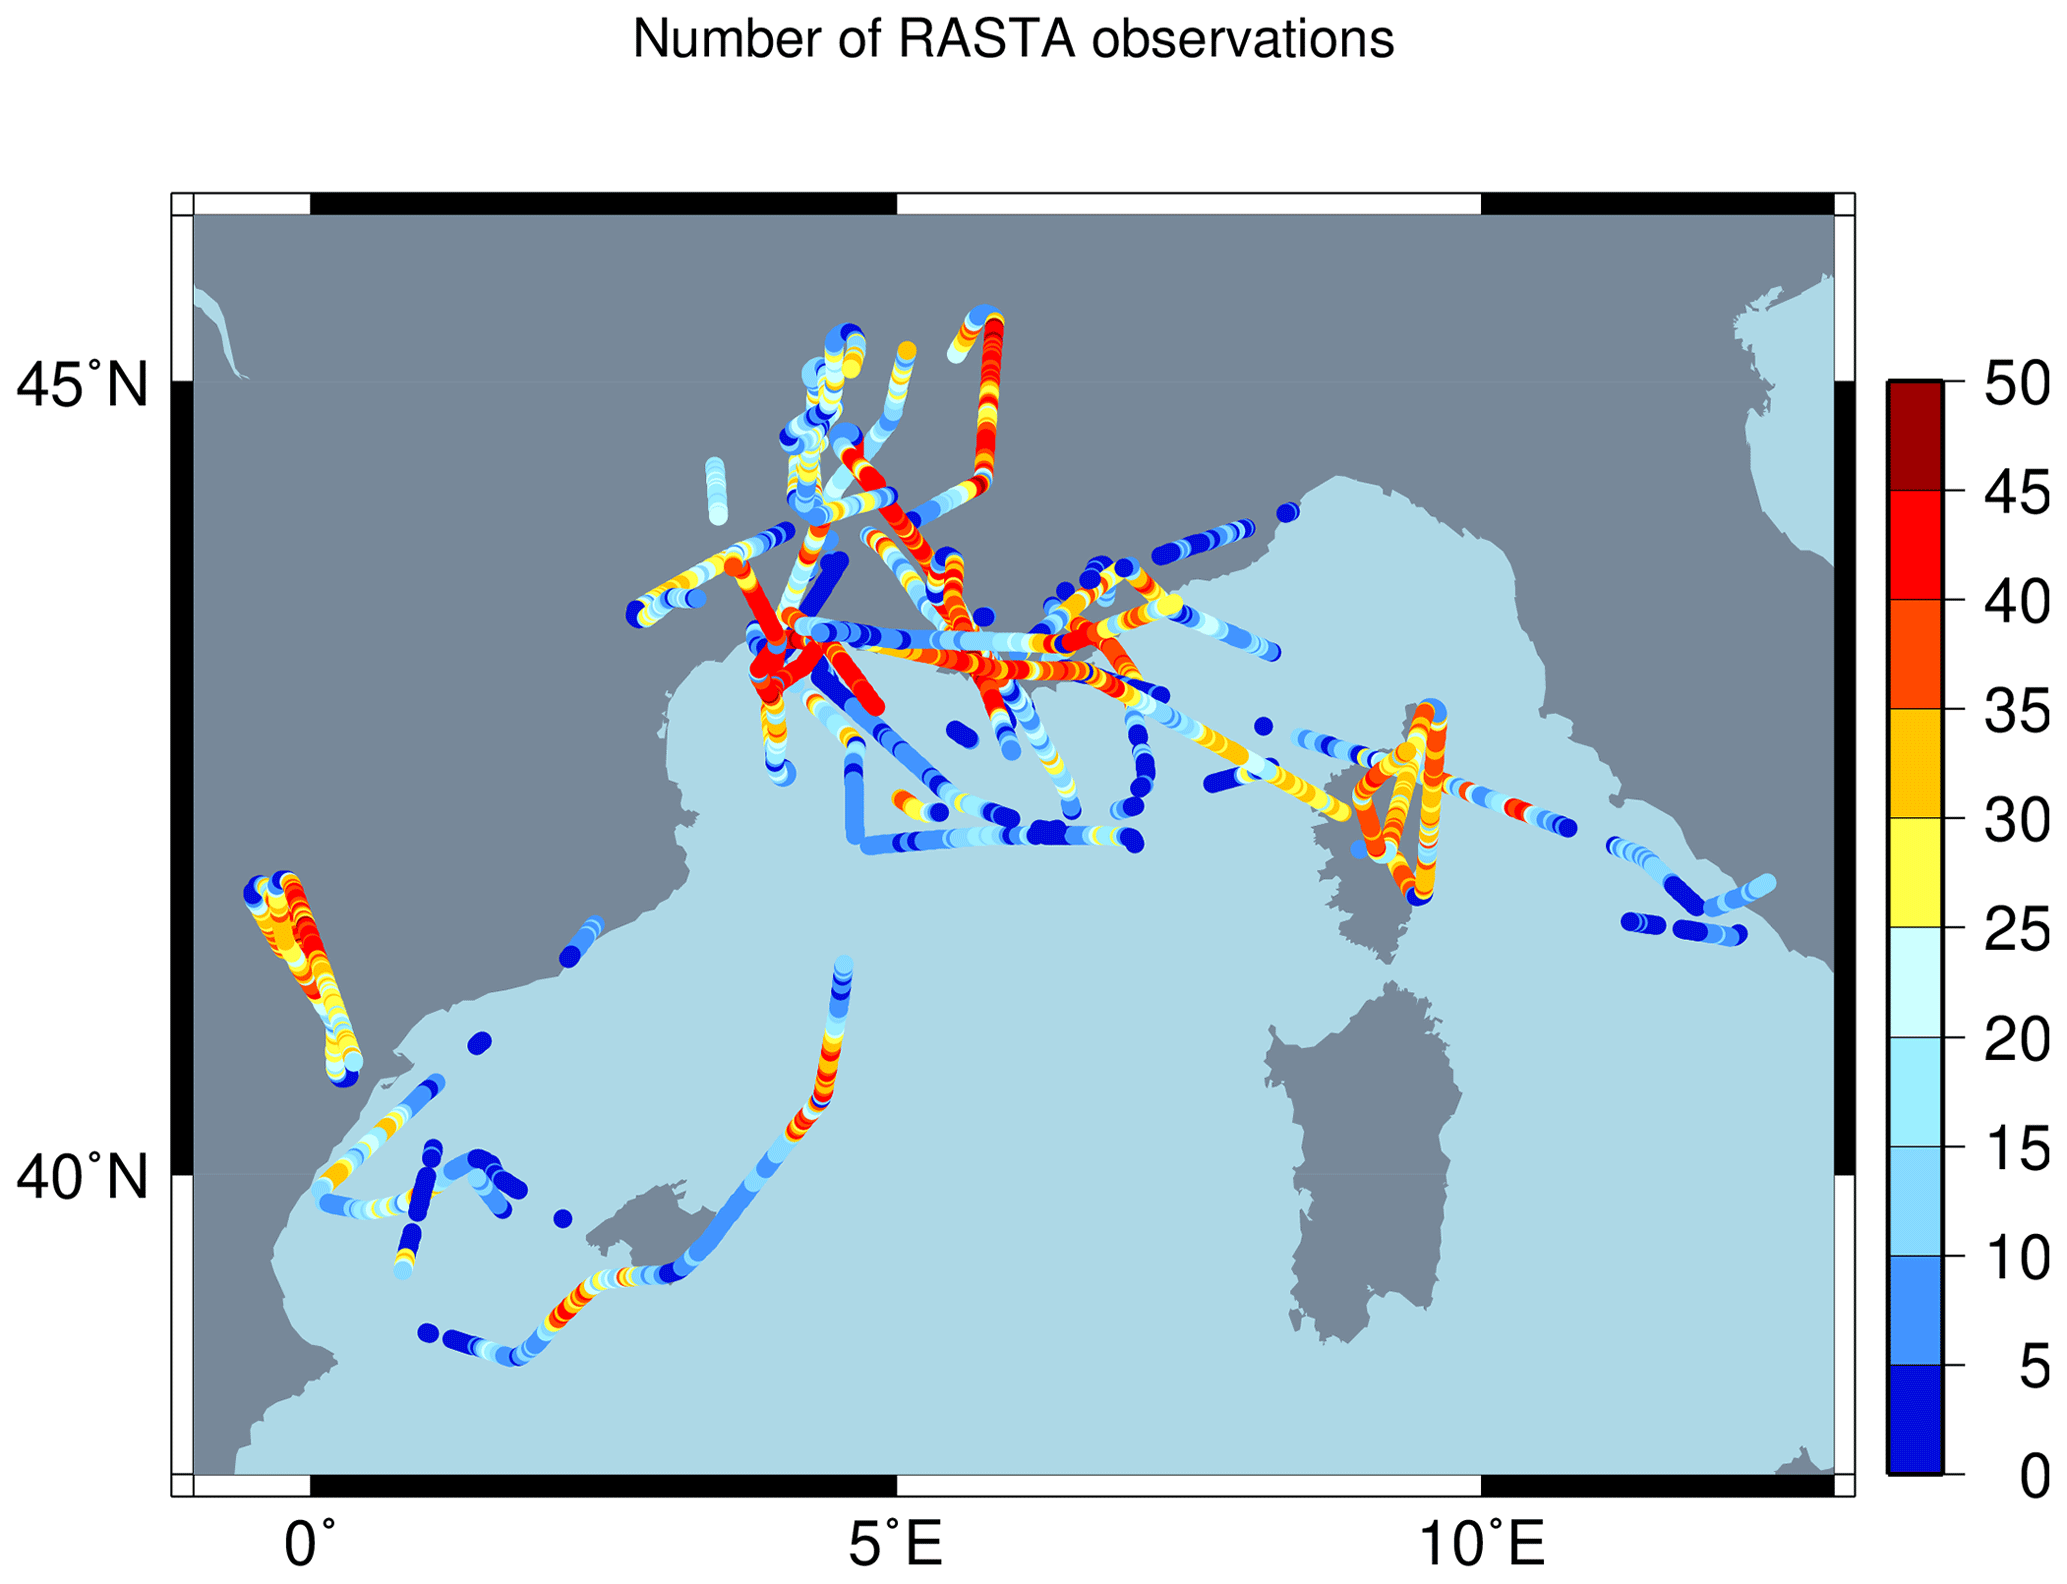
Figure 5Location of RASTA observations during the first HyMeX special observation period. Coloured dots represent the number of wind data available per profile.
Table 4 provides the RMS error (RMSE) values for wind calculated with these data. The RMSE for background and analysis is lower in REANA than in the other two experiments. The analysis RMSE for OPERGNSS is lower than the one for NOGNSS.
Table 4Analysis (AN) and first-guess (FG) root mean square error (RMSE) values for the wind (in m s−1) computed with respect to RASTA observations (sample size of 33 083 observations) for REANA, NOGNSS and OPERGNSS experiments.

As GNSS observations do not provide any wind information, the improvement observed in wind field can be explained by the effect of mass field information assimilation on the wind field, essentially created during model integration. There is indeed a little coupling between these fields during the analysis (Borderies et al., 2019b). This indirect effect was already demonstrated by Wattrelot et al. (2014), for example, who noted a positive impact on the wind field when assimilating pseudo-observations of relative humidity. Lindskog et al. (2017) also reported – but did not show – a positive impact on wind forecasts when assimilating ZTD data.
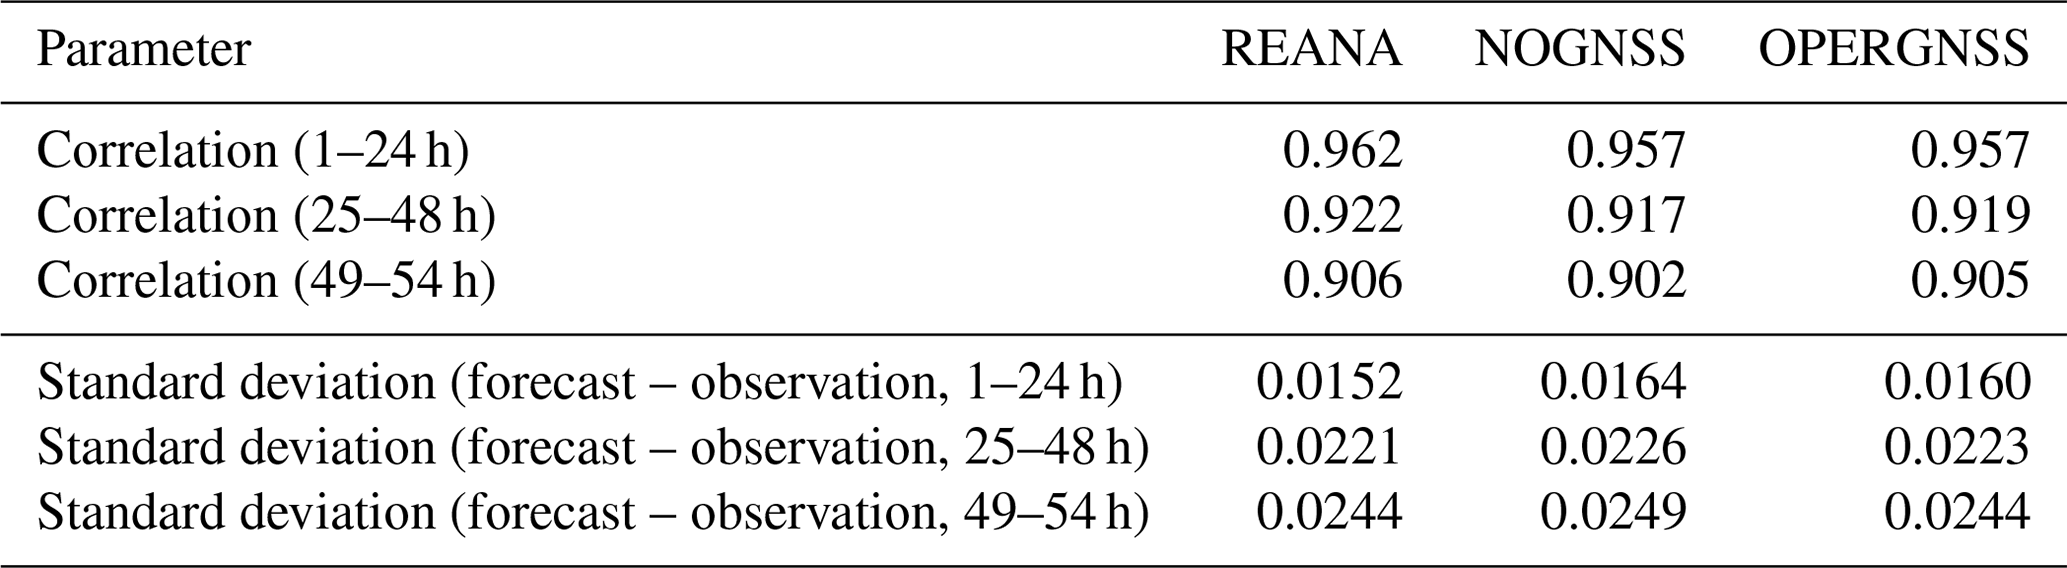
Table 5Correlation and standard deviation of ZTD (in m) between AROME-WMED forecasts and reprocessed GNSS observations averaged over forecast ranges.
3.3 Impact on short-range precipitation
Figure 6 shows that the equitable threat score (ETS) of the 24 h accumulated precipitation computed with the sum of the 3 h precipitation from the eight analysis times is improved with the assimilation of GNSS ZTD data compared to the NOGNSS experiment. It represents an evaluation of the background quality. The difference is statistically significant for each threshold. When comparing the assimilation of REANA to OPERGNSS, the ETS for precipitation is slightly better with the reprocessed data set, but the differences are not significant except for the 40 mm d−1 threshold. The loss of skill for OPERGNSS simulation for larger daily precipitation from the eight 3 h forecasts is surely due to the lower number of occurrences for heavier precipitations.
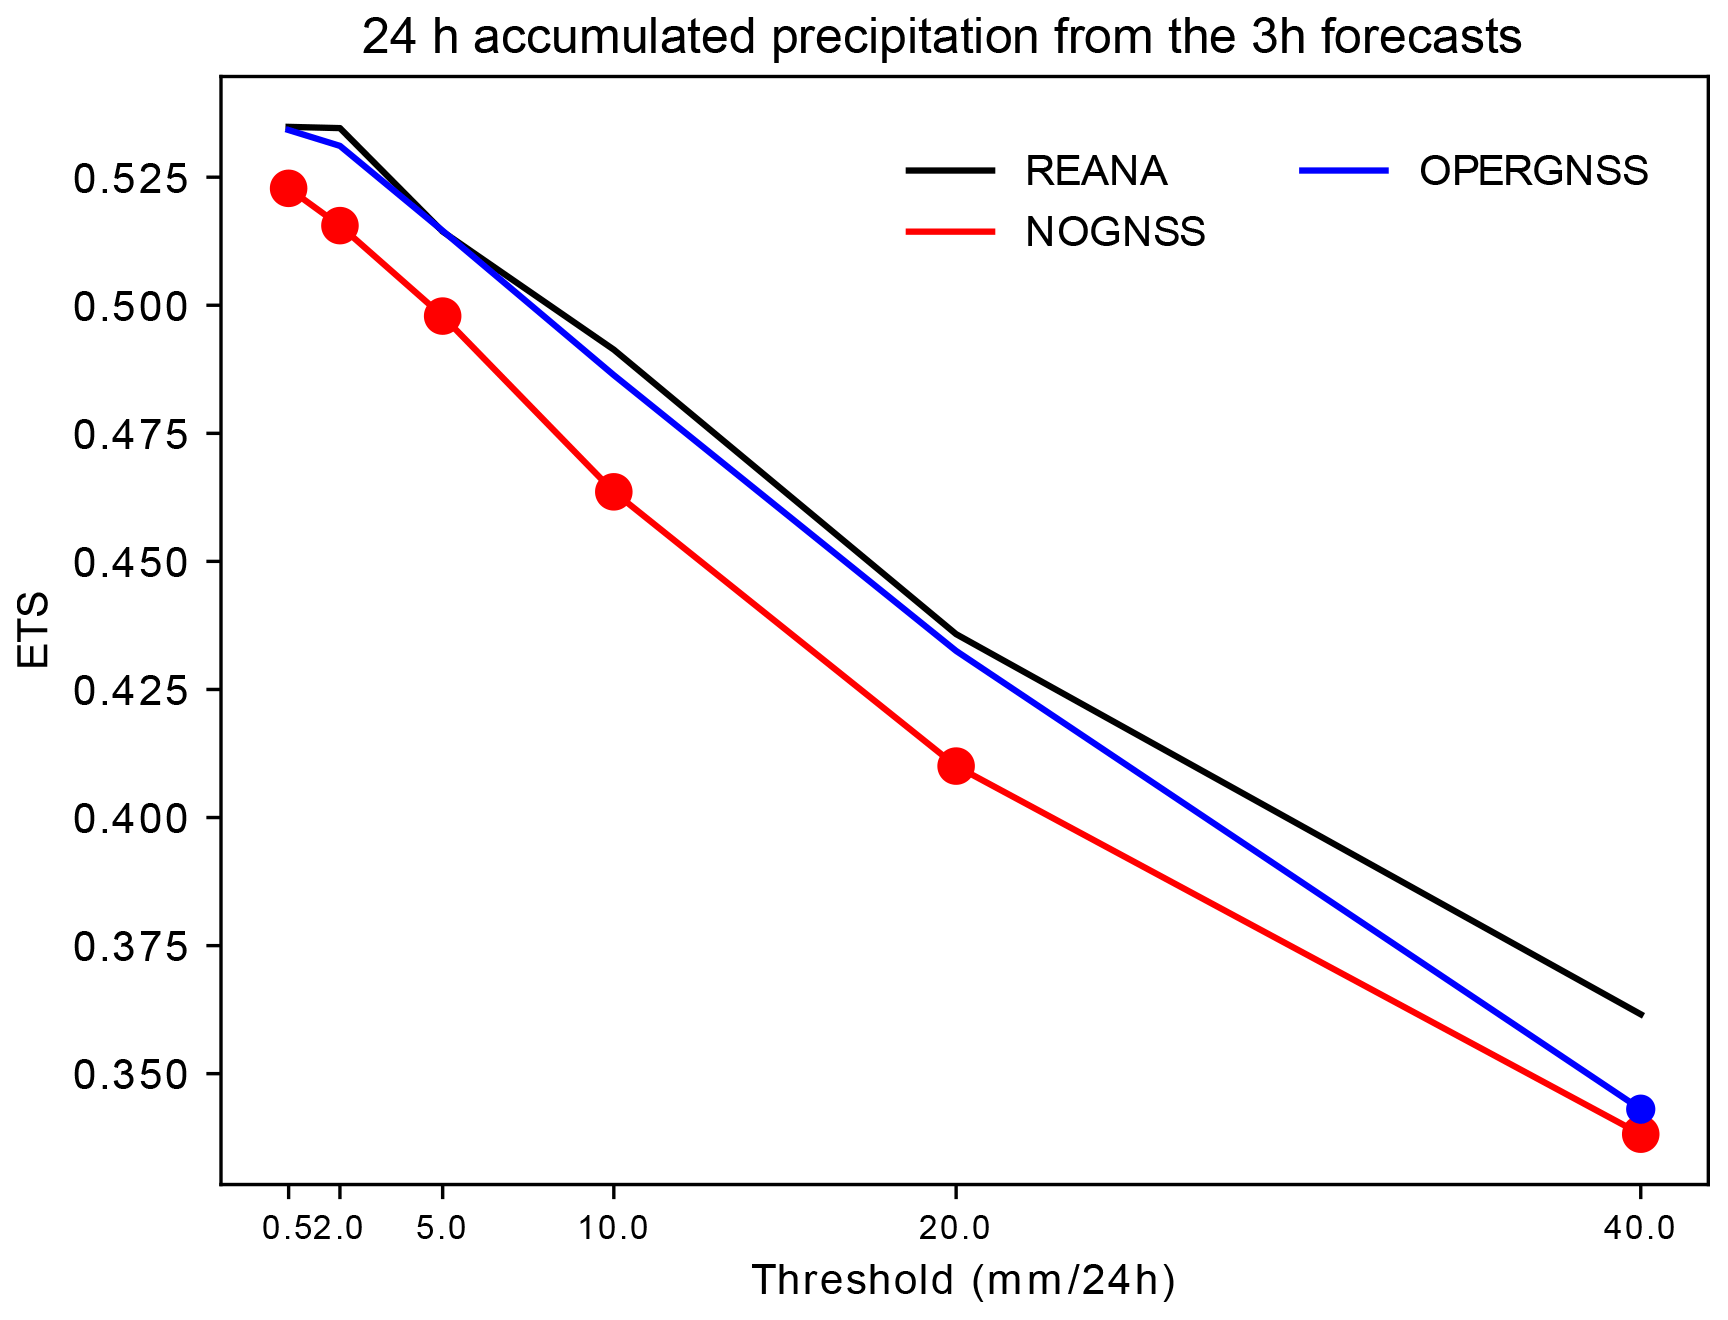
Figure 6Equitable threat score (ETS) for the 24 h accumulated precipitation from the sum of the eight 3 h forecasts used as a background of the data assimilation cycle each day of the period from 5 September to 5 November 2012. Results for REANA are displayed in black; those for NOGNSS are displayed in red; and those for OPERGNSS are displayed in blue. Dots indicate that the difference between the curves and the REANA curve as a reference is statistically significant at a 0.95 confidence threshold using a bootstrap test.
Overall, the background quality is improved with the assimilation of GNSS observations, and the data reprocessing brings improvement in terms of precipitation from 3 h forecast, even though this benefit is not significant.
The impact of the GNSS data has also been assessed for longer forecast ranges (3 to 54 h). The effect of the assimilation of the GNSS data on the correlation with IWV from the GNSS data set is maximal for the analysis and decreases up to the 30 h forecast range (Fig. 7) as the general impact of the initial conditions on the forecast performance reduces. A similar behaviour is found with the standard deviations of the differences between observed IWV and one simulated from the three experiments.
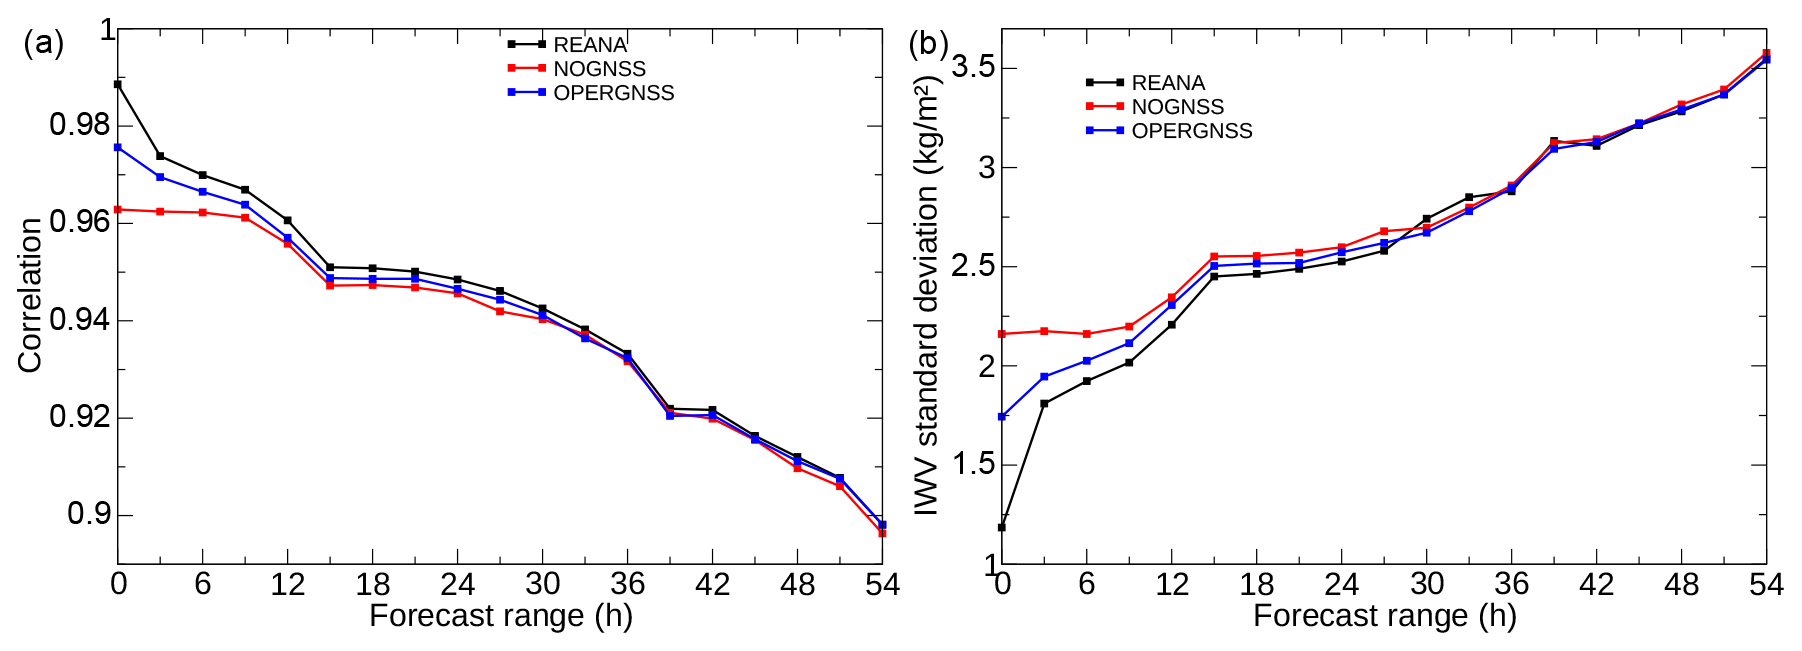
Figure 7Correlation (a) and standard deviations (b, kg m−2) of integrated water vapour content between AROME-WMED forecasts and reprocessed GNSS observations (Bock et al., 2016) as a function of forecast range (h).
Compared to the observed ZTDs from the Marfret Niolon, the signal is more noisy because of a smaller data set, but when compared to values averaged over the forecast ranges (Table 5), the correlation for NOGNSS is lower than REANA and OPERGNSS, which provides itself lower correlation than REANA. The standard deviations are higher for the NOGNSS forecasts. In addition, a decrease of the correlation (respectively an increase of the standard deviation) is seen for forecast range over 24 h.
The forecast quality has also been evaluated against surface data. No impact was found on temperature at 2 m or on 10 m wind (not shown). A small impact was found on relative humidity at 2 m (Fig. 8). A reduction of the bias is noticed with REANA during the first 9 h of the forecast compared to OPERGNSS and NOGNSS. From 12 h onwards the results for REANA and OPERGNSS are similar. Regarding the standard deviation, it is smaller for REANA between 0 and 9 h than for NOGNSS and OPERGNSS and between the 21 and 27 h forecast range than for NOGNSS. This difference represents more than 2 % of improvement. For the other forecast ranges the differences are lower than 1 %.
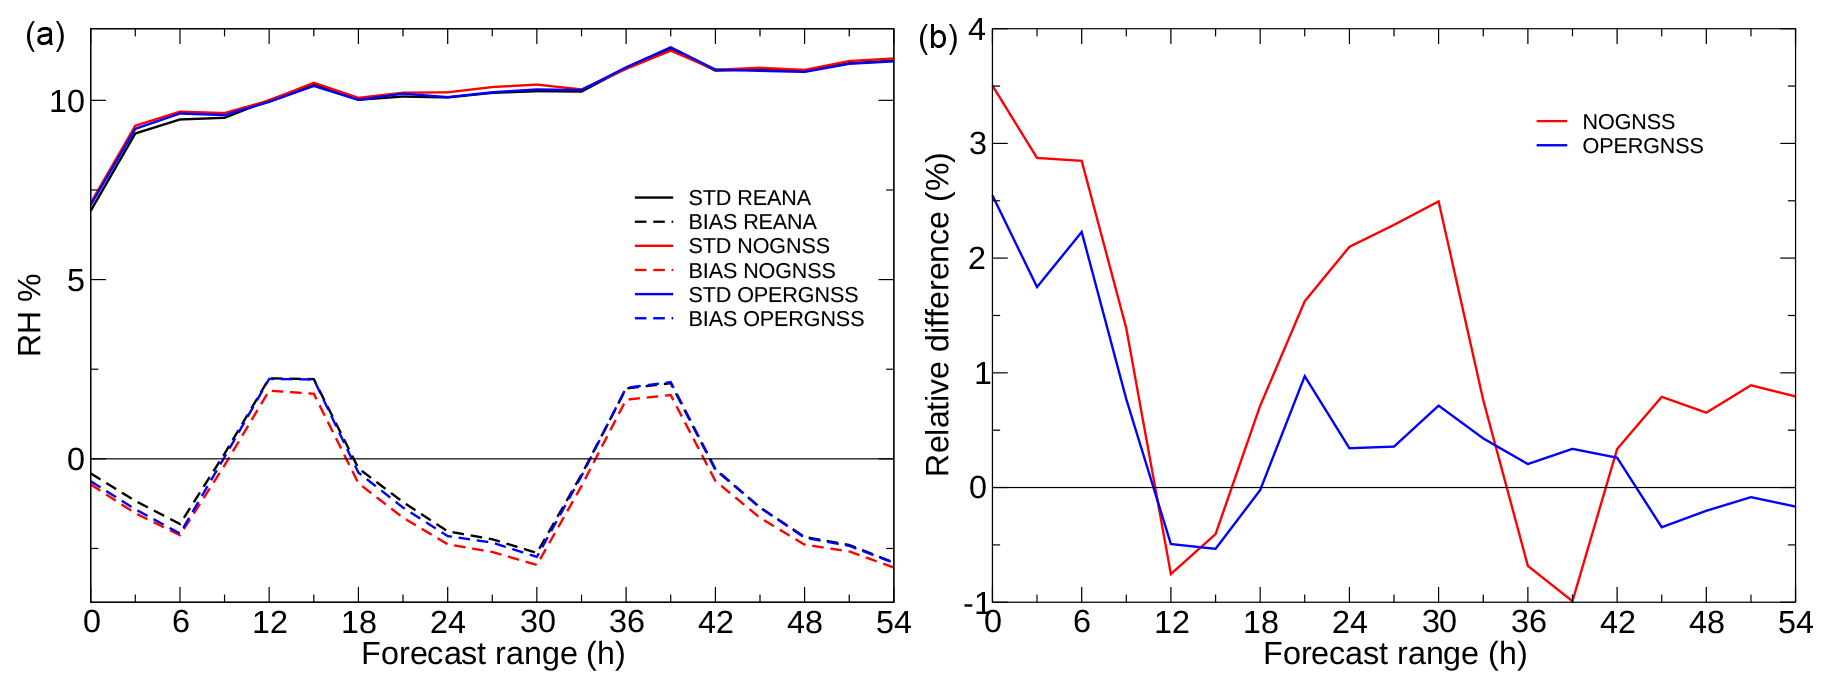
Figure 8Bias (BIAS; forecast minus observations, dashed lines) and standard deviations (STD; solid lines) computed with relative humidity at 2 m (a) and relative root mean square differences (%, b) with respect to REANA.
The impact of the assimilation of GNSS data on the 24 h accumulated precipitation from the forecast initialized at 06:00 UTC is less clear. The improvement of the GNSS data reprocessing compared to the real-time data set is beneficial for all thresholds except for 2 mm d−1 (where the ETS is better for OPERGNSS) and is statistically significant for moderate thresholds (10 and 20 mm d−1, Fig. 9). The difference between REANA ETS and NOGNSS ETS values is not significant. When examining scores for precipitation forecasts between 30 and 54 h, there is a small significant degradation of the ETS for 2 mm d−1 with the NOGNSS experiment and a small improvement with OPERGNSS for 40 mm d−1 (Fig. 10).
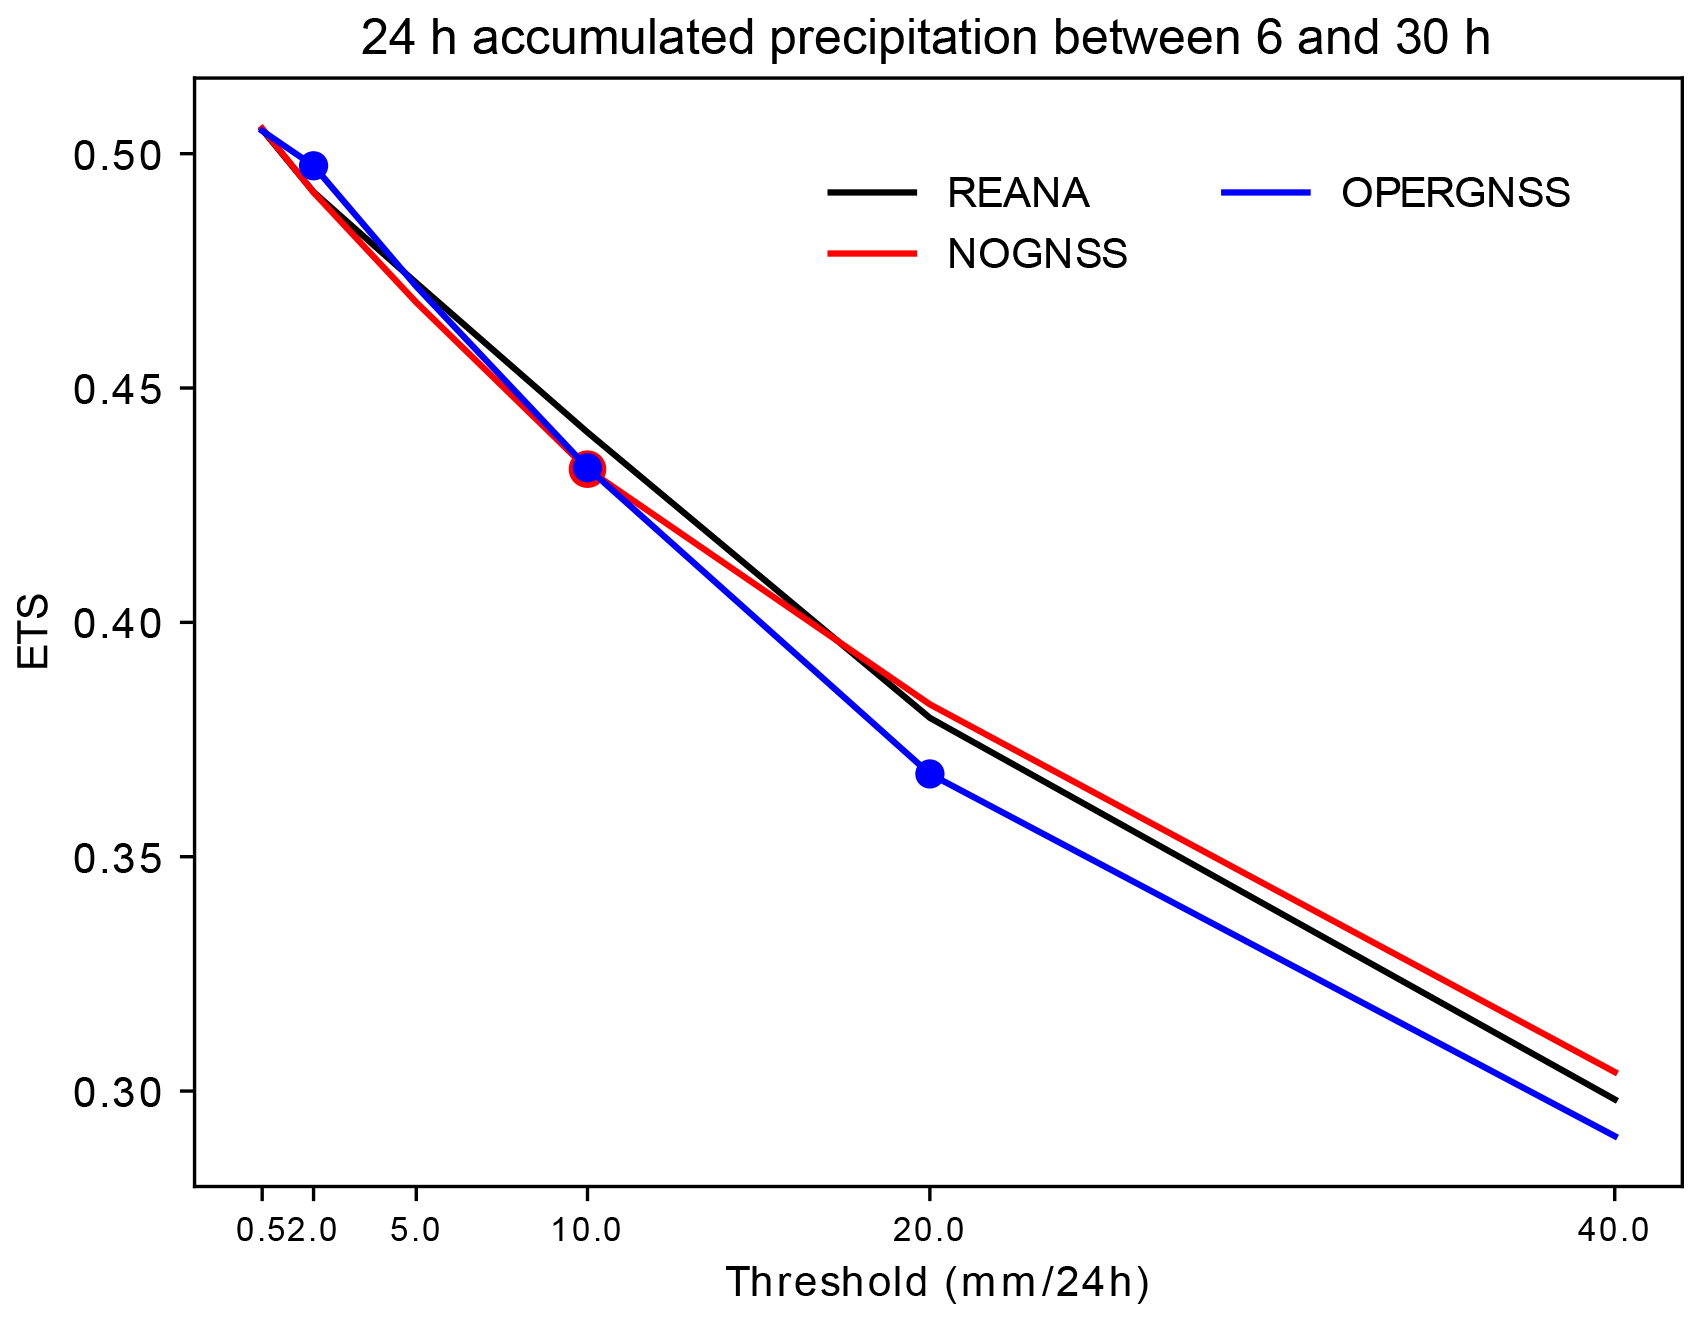
Figure 9Equitable threat score of the 24 h accumulated precipitation from the 6–30 h forecast range of the long forecast initialized at 00:00 UTC each day of the period from 5 September to 5 November 2012 computed over the AROME-WMED domain with rain gauges of the HyMeX database (version 4). Dots indicate that the difference between the curves is statistically significant.

Figure 10Equitable threat score of 24 h accumulated precipitation from the 30 to 54 h forecast range of the long forecast initialized at 00:00 UTC each day of the period from 5 September to 5 November 2012 computed over the AROME-WMED domain with rain gauges of the HyMeX database (version 4). Dots indicate that the difference between the curves is statistically significant.
As previously mentioned we performed other impact studies with wind profilers, lidar data and Spanish radar data.
5.1 Wind profilers
No impact of the assimilation of wind profiler data is found except on the wind field. A small impact is noticed in terms of wind RMS differences of background and analysis departures for radiosondes, aircraft and satellite winds (Fig. 11). The largest impact is a decrease of 0.08 m s−1 for the radiosonde FG RMS differences at 300 hPa (left panel). Concerning the AN RMS differences, the improvement (SATOB, satellite observation) or degradation (radiosondes and aircraft) are very small. The largest value obtained at 200 hPa is due to the small amount of data available for the computation.
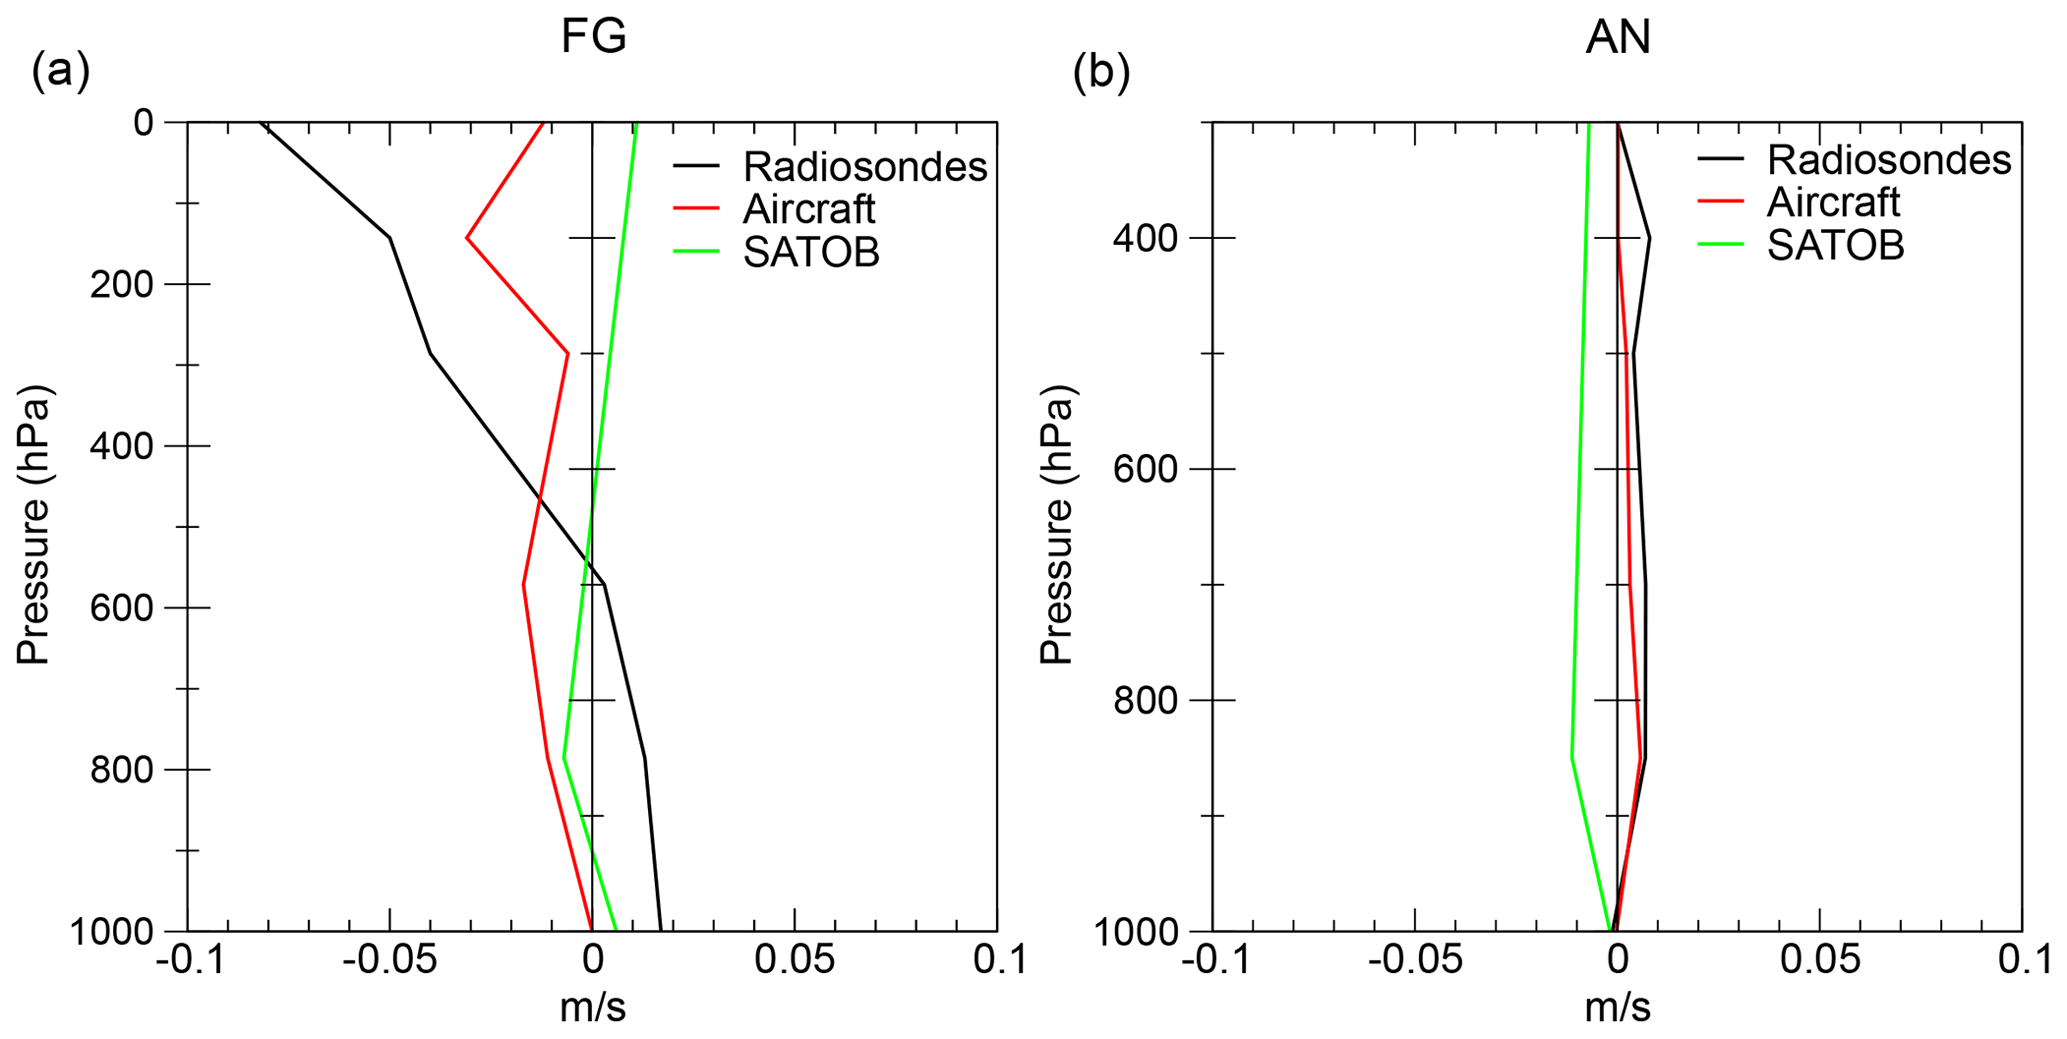
Figure 11First-guess (a) and analysis (b) RMS differences (REANA–NOWPROF experiments) computed against radiosondes (black), aircraft (red) and satellite observations (SATOB, green) observations for the zonal wind component (m s−1); negative values correspond to a positive impact of the wind profiler.
A small but not significant (Fig. 12) improvement of REANA compared to NOWPROF appears on the ETS of the 24 h accumulated precipitation accumulated from the 6 to 30 h forecast ranges.
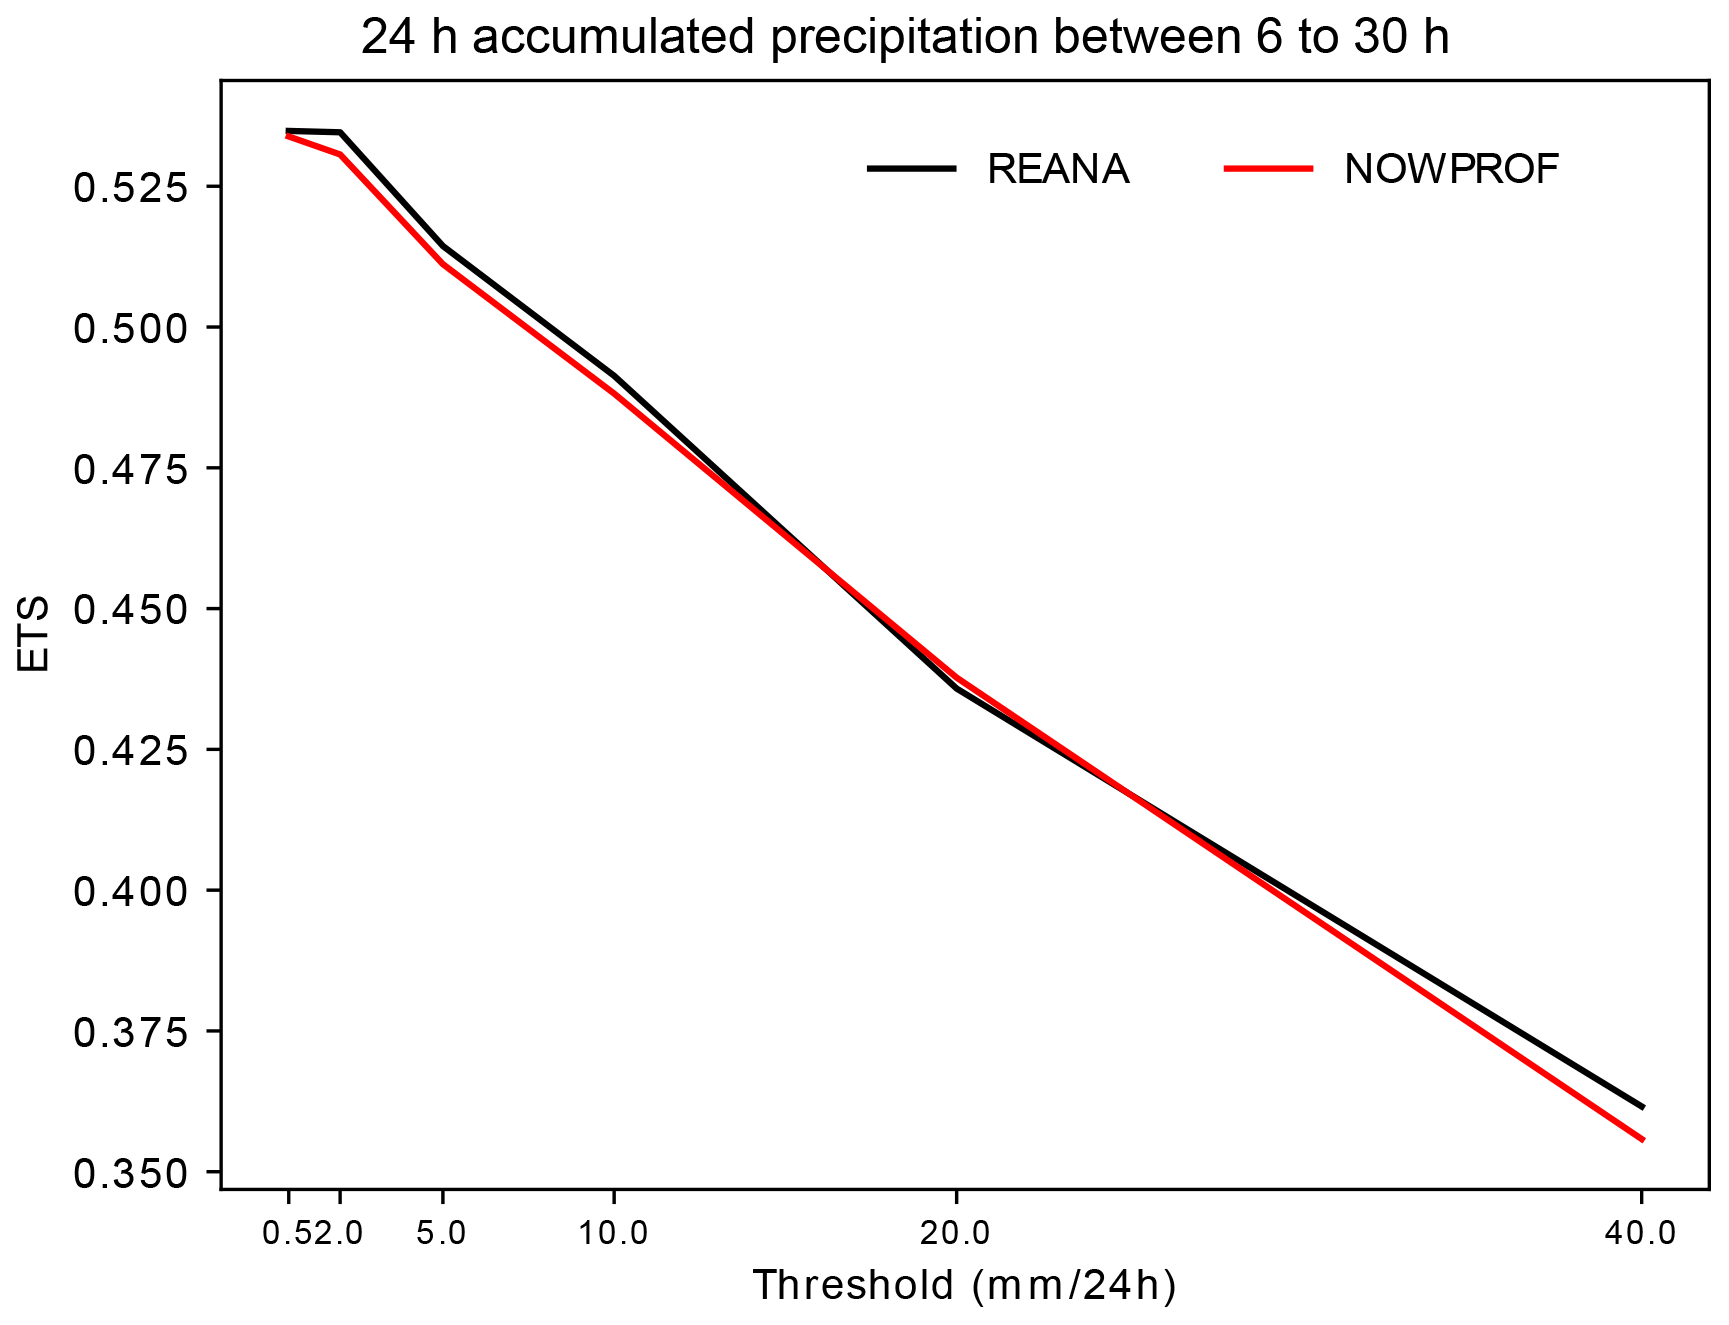
Figure 12Equitable threat score (ETS) of 24 h accumulated precipitation from the 6 to 30 h forecast ranges of the long forecast starting at 00:00 UTC each day of the period from 5 September to 5 November 2012 computed over the AROME-WMED domain with rain gauges of the HyMeX database (version 4). The lack of dots indicates that the difference between the curves is not significant. REANA is plotted in black, and NOWPROF is in red.
5.2 Ground-based and airborne lidar data
As discussed in Sect. 2.2, humidity profiles retrieved from ground-based and airborne lidars have been assimilated in the REANA experiment. In Fig. 1, the trajectories of all ATR 42 flights are plotted, together with the localization of the two ground-based lidars. The denial NOLIDAR experiment results are very close to the reanalysis ones (Table 6), as these data represent very few additional data located over ocean, where few observations are available for the comparison. No impact of the lidar data is found when comparing the various analysed ZTDs to the Marfret Niolon corresponding observations. These results agree with the Bielli et al. (2012) study where no significant impact was found on the 24 h accumulated precipitation.
Table 6Correlations and standard deviations of zenithal total delays (in m) between AROME-WMED forecasts from 00:00 UTC and reprocessed GNSS observations averaged over forecast ranges (0, 1–24, 25–48 and 49–54 h).
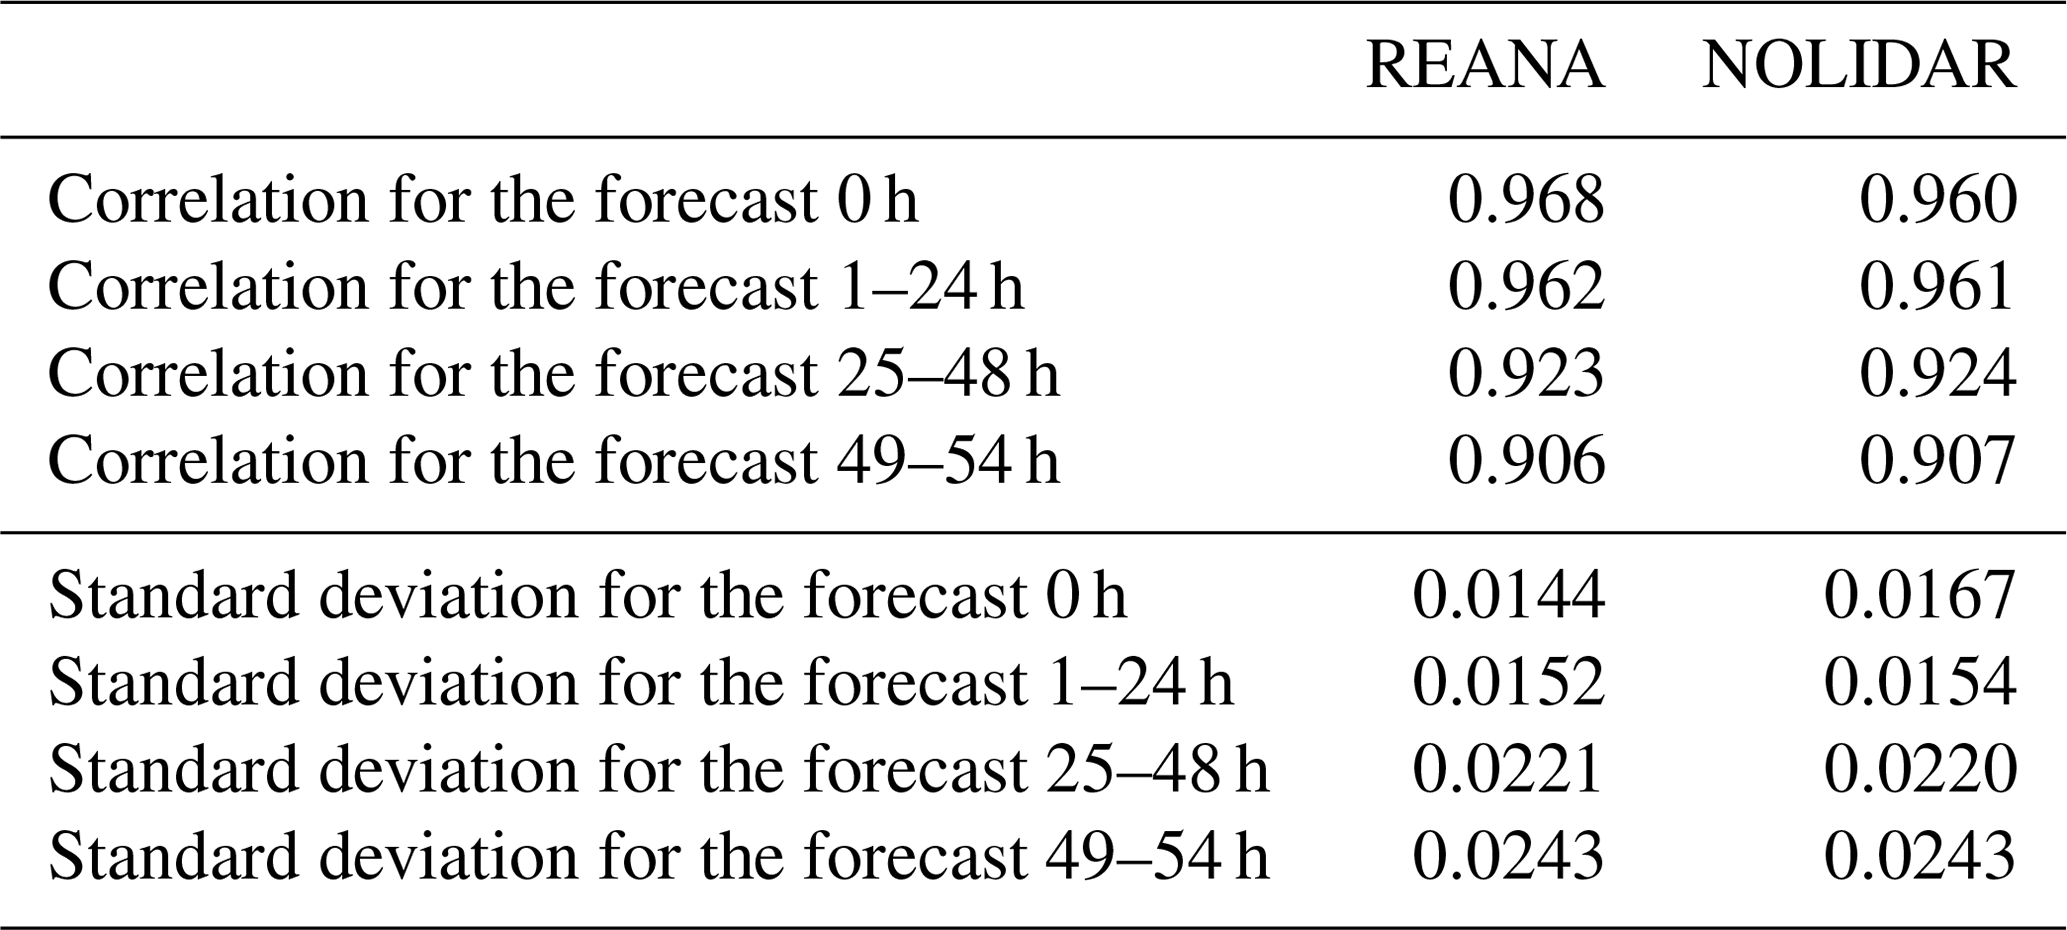

Figure 13Equitable threat score (ETS) for the 24 h accumulated precipitation obtained from the sum of eight 3 h forecasts used as a background of the data assimilation cycle each day of the period from 5 September to 5 November 2012 computed over the AROME-WMED domain with rain gauges of the HyMeX database (version 4). Results for REANA are displayed in black, and those for NORADSPAIN are in red. Dots indicate that the difference between the curves is statistically significant.
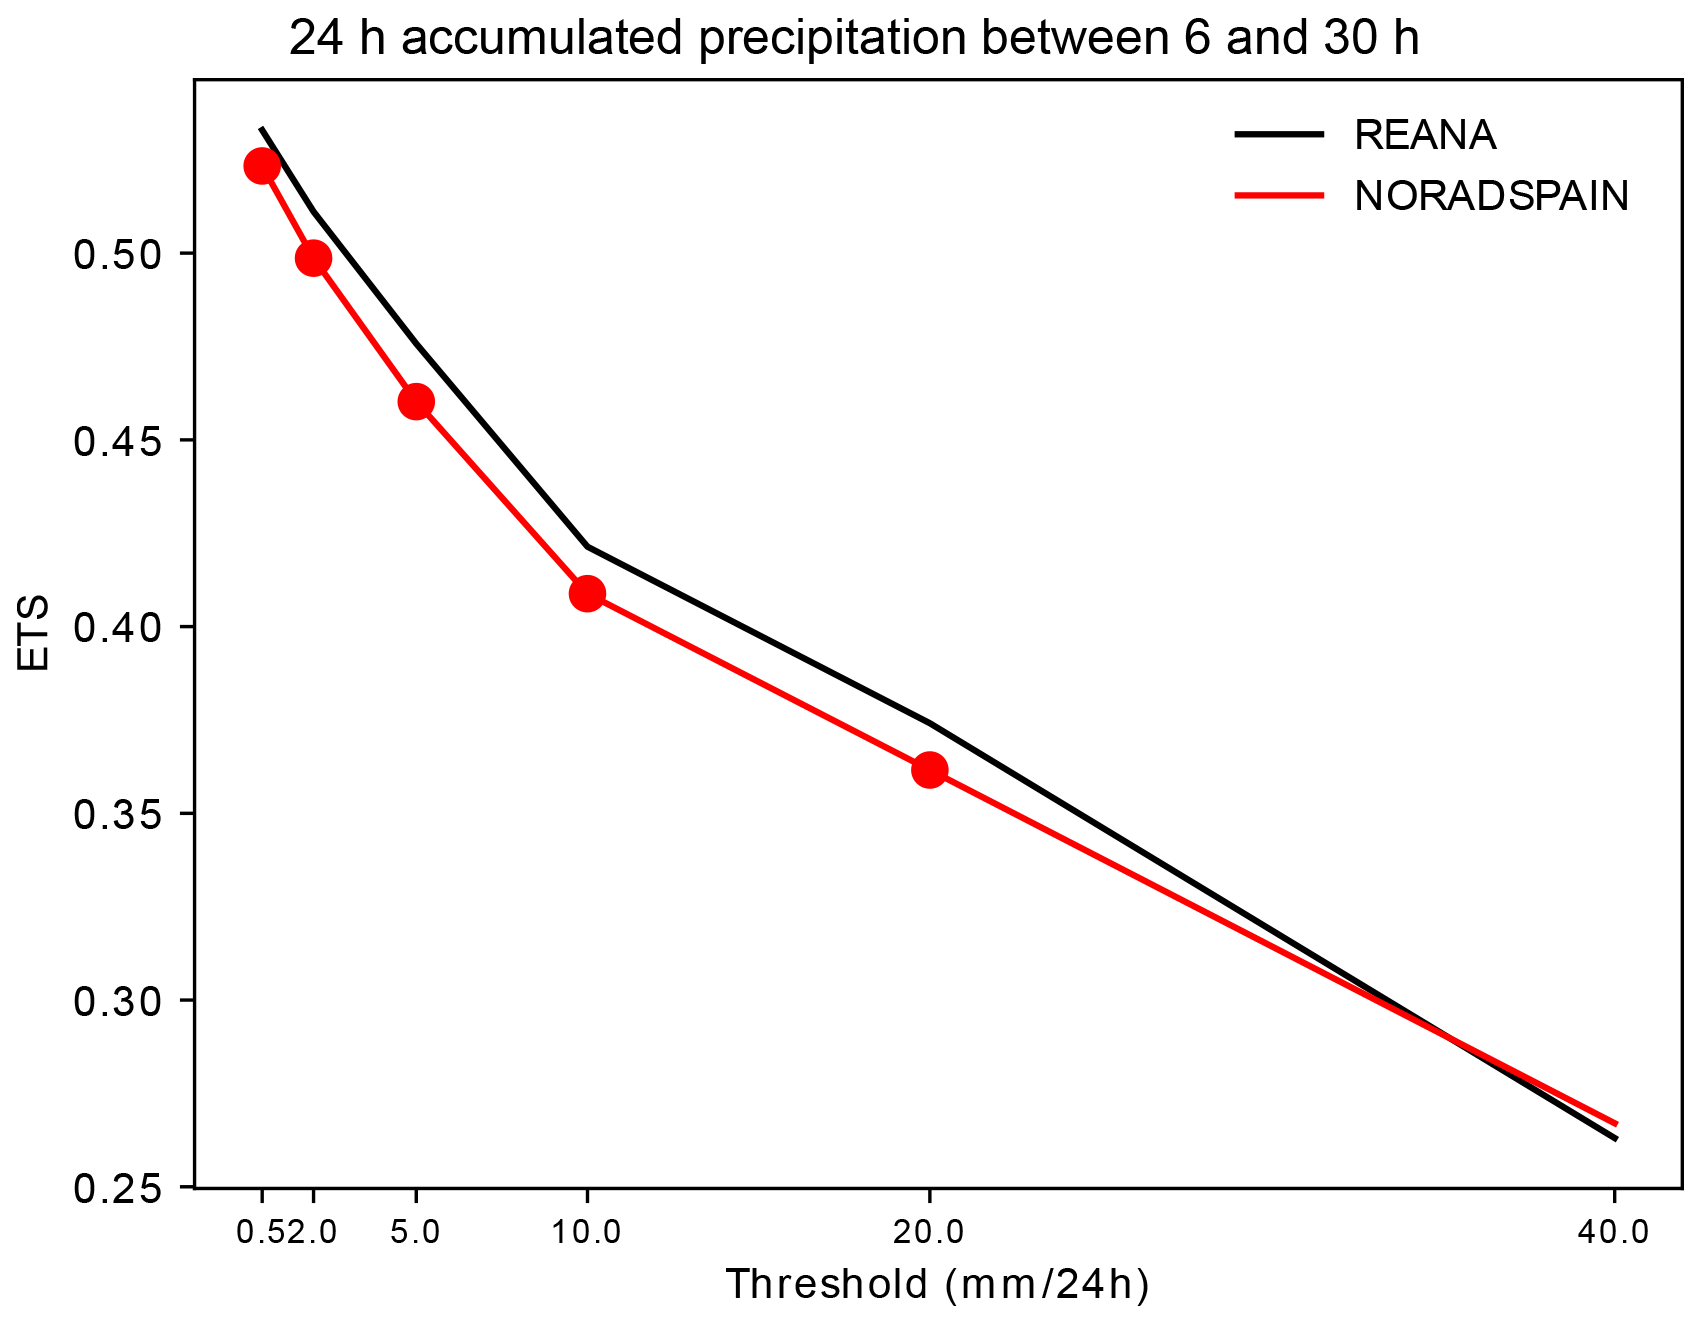
Figure 14Equitable threat score (ETS) for the 24 h accumulated precipitation from the 6 to 30 h forecast ranges initialized at 00:00 UTC each day of the period from 5 September to 5 November 2012 computed over the AROME-WMED domain with rain gauges of the HyMeX database (version 4). Results for REANA are displayed in black, and those for NORADSPAIN are in red. Dots indicate that the difference between the curves is statistically significant.
5.3 Spanish radars
No significant impact has been noticed over the HyMeX domain. However, when focusing over the Iberian Peninsula, the ETS for the 24 h accumulated precipitation from the sum of the eight 3 h precipitation background forecasts (Fig. 13) is improved with the assimilation of Spanish radar data. This impact also remains in longer forecast ranges as the ETS for the 24 h precipitation accumulation between 6 and 30 h forecast ranges is improved with the assimilation of Spanish radars for thresholds between 0.5 and 20 mm every 24 h (Fig. 14). This impact does not remain at longer forecast ranges (Fig. 15). These results are in good agreement with the Wattrelot et al. (2014) study which found an improvement of the short-term precipitation forecast scores. However contrary to the aforementioned study, we obtained a significant improvement of the 24 h precipitation accumulation between 6 and 30 h forecast ranges over the Iberian Peninsula. Even if we do not obtain a significant impact at the HyMeX domain scale but a significant one over the Iberian Peninsula, it is interesting to note that the assimilation of Spanish radar data in AROME-WMED was made on a research mode, as only French radars were assimilated at the time of the HyMeX campaign and the reanalyses. These data represent only 0.6 % of the assimilated data. This is 3 times less than REPROC-GNSS data.
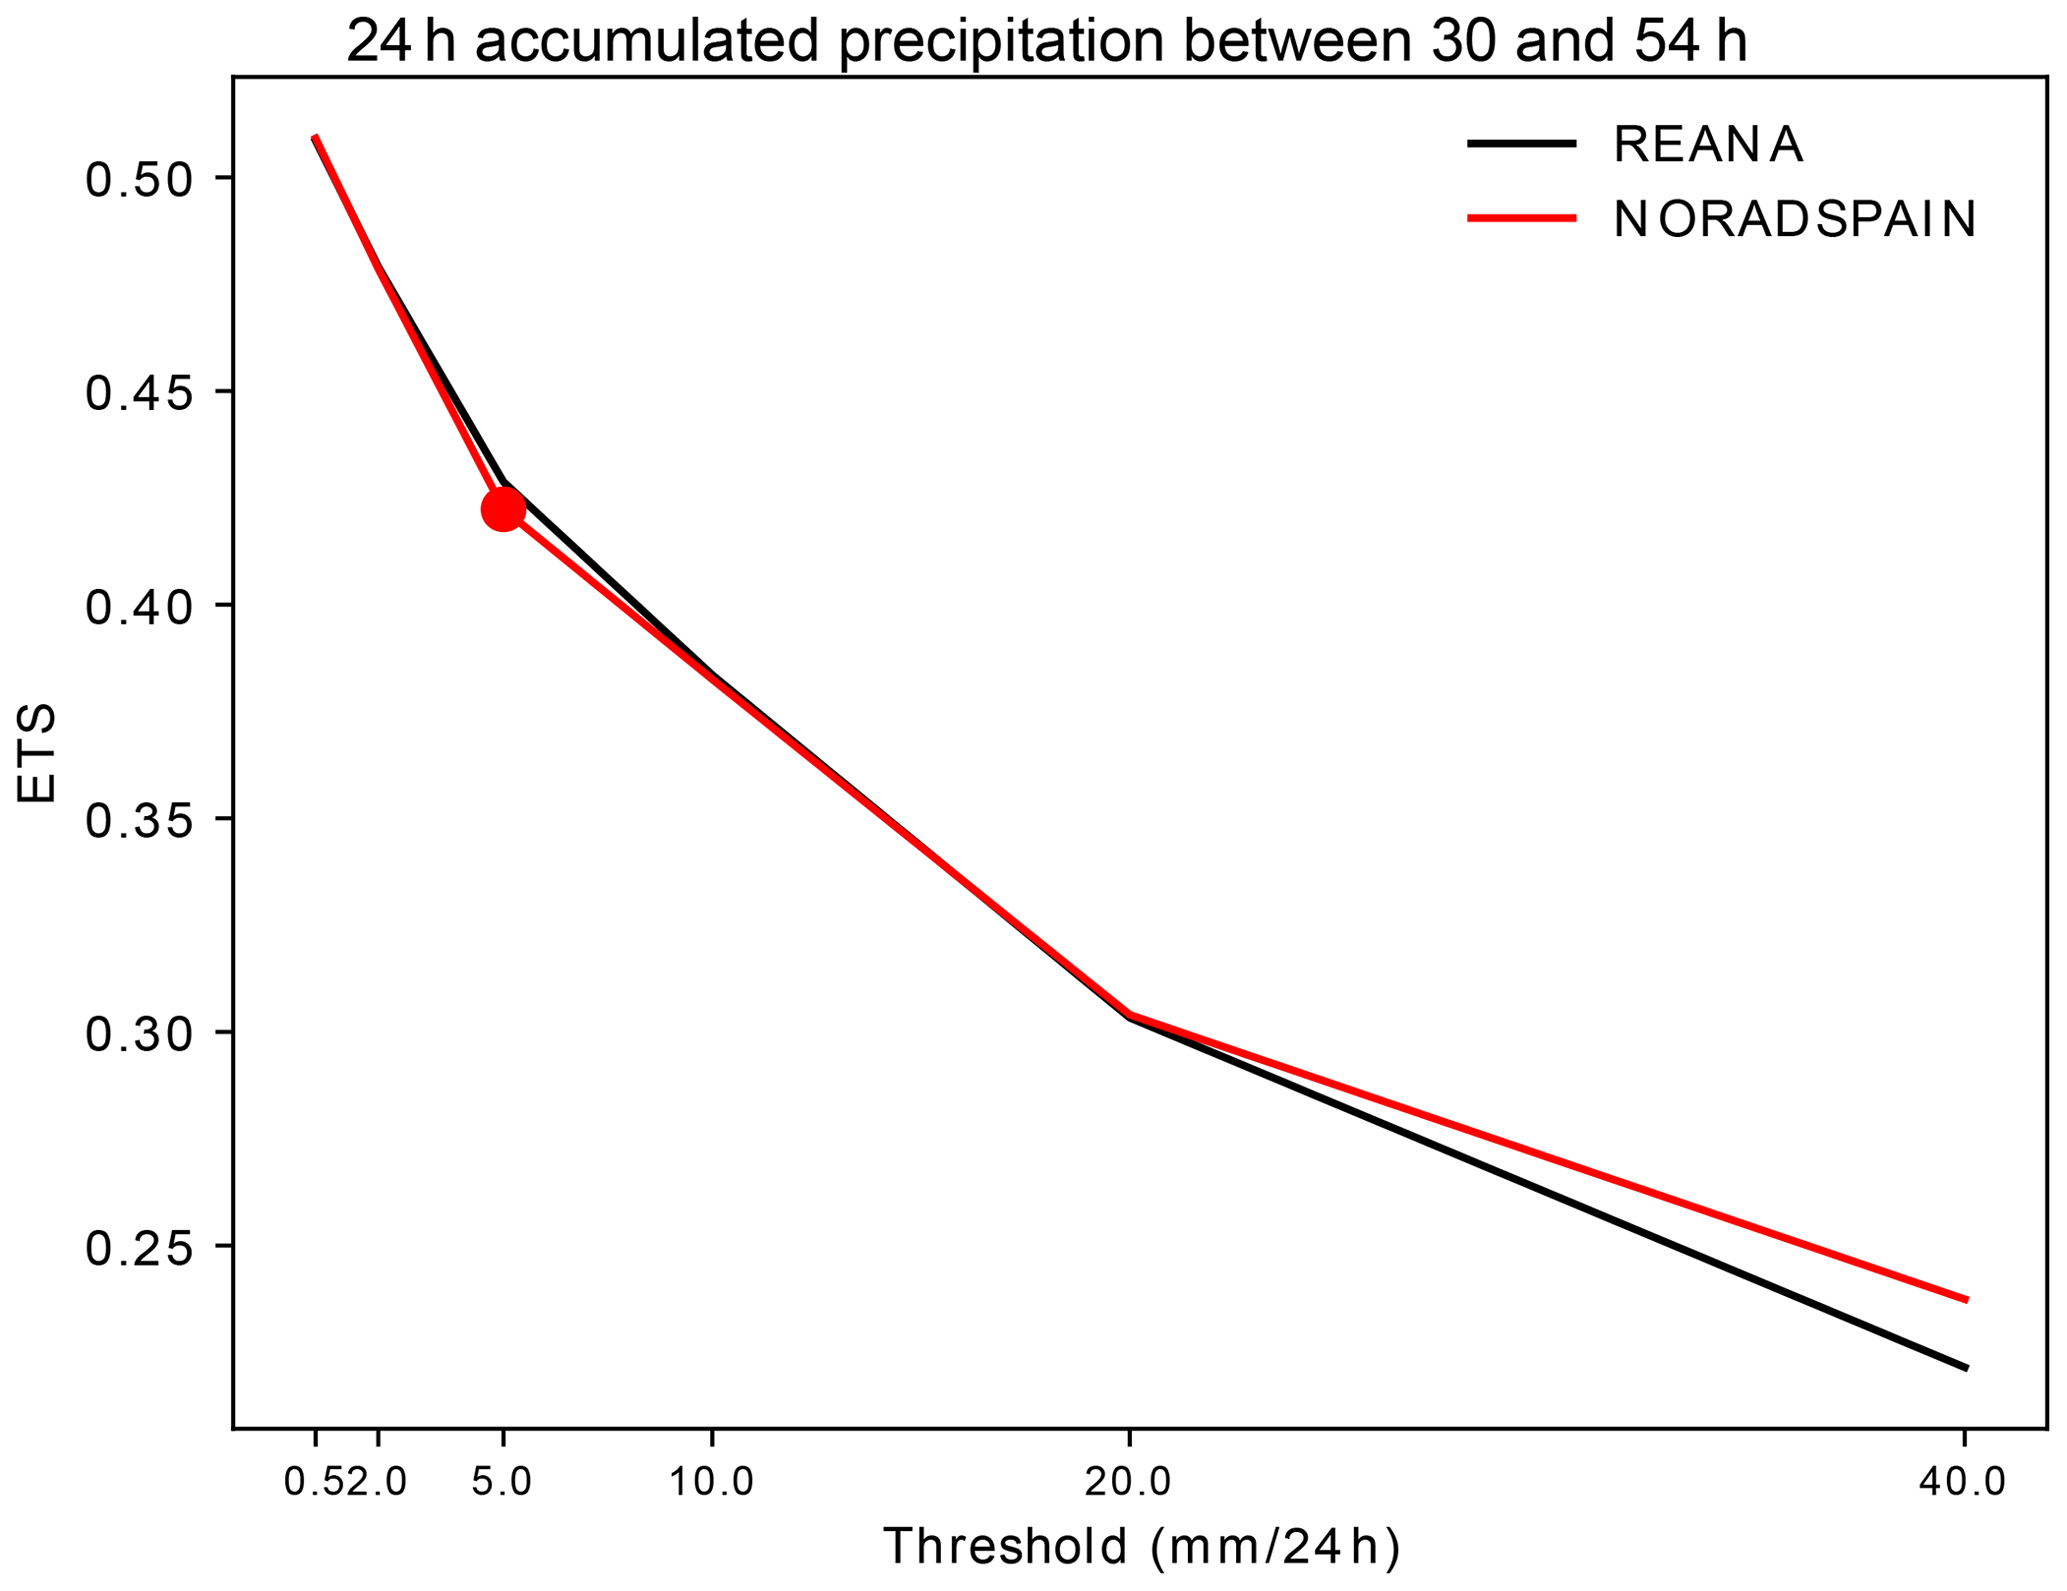
Figure 15Equitable threat score (ETS) for the 24 h accumulated precipitation from the 30 to 54 h forecast ranges initialized at 00:00 UTC each day of the period from 5 September to 5 November 2012 computed over the AROME-WMED domain with rain gauges of the HyMeX database (version 4). Results for REANA are displayed in black, and those for NORADSPAIN are in red. Dots indicate that the difference between the curves is statistically significant.
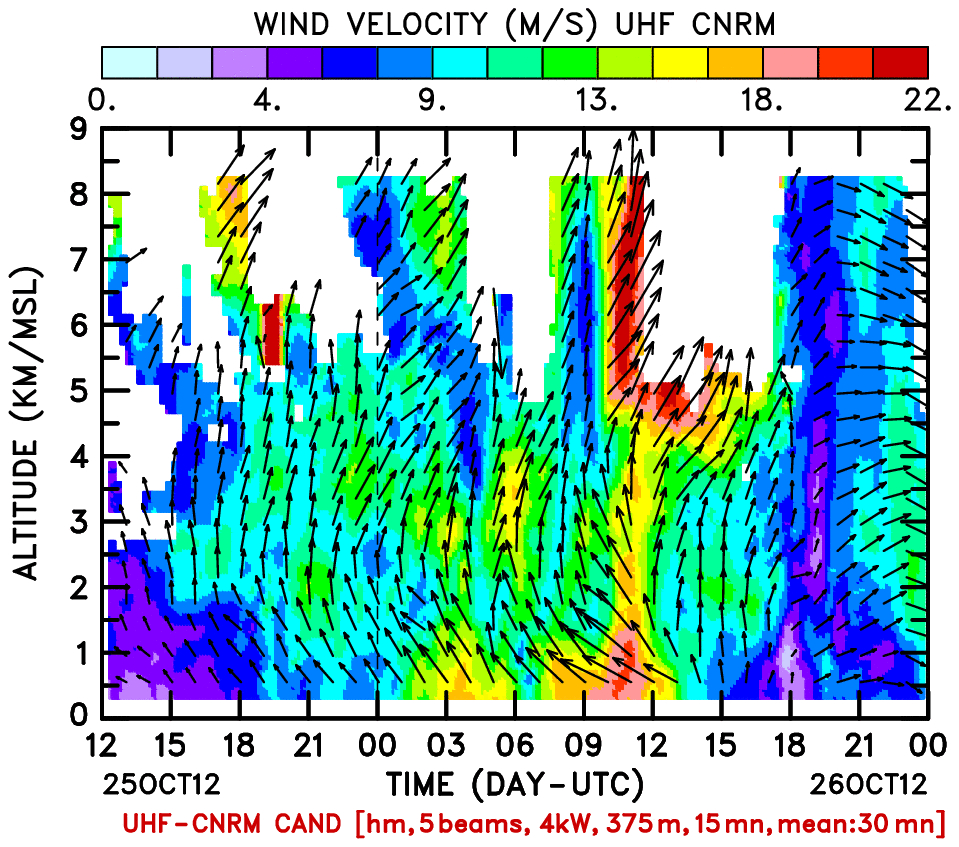
Figure 16Time–height cross section of the wind measured by the Candillargues UHF radar for IOP16. Horizontal wind components are represented by the black arrows (meteorological convention), and wind speeds are in colour. CNRM: Centre National de Recherches Météorologiques; CAND: Candillargues.
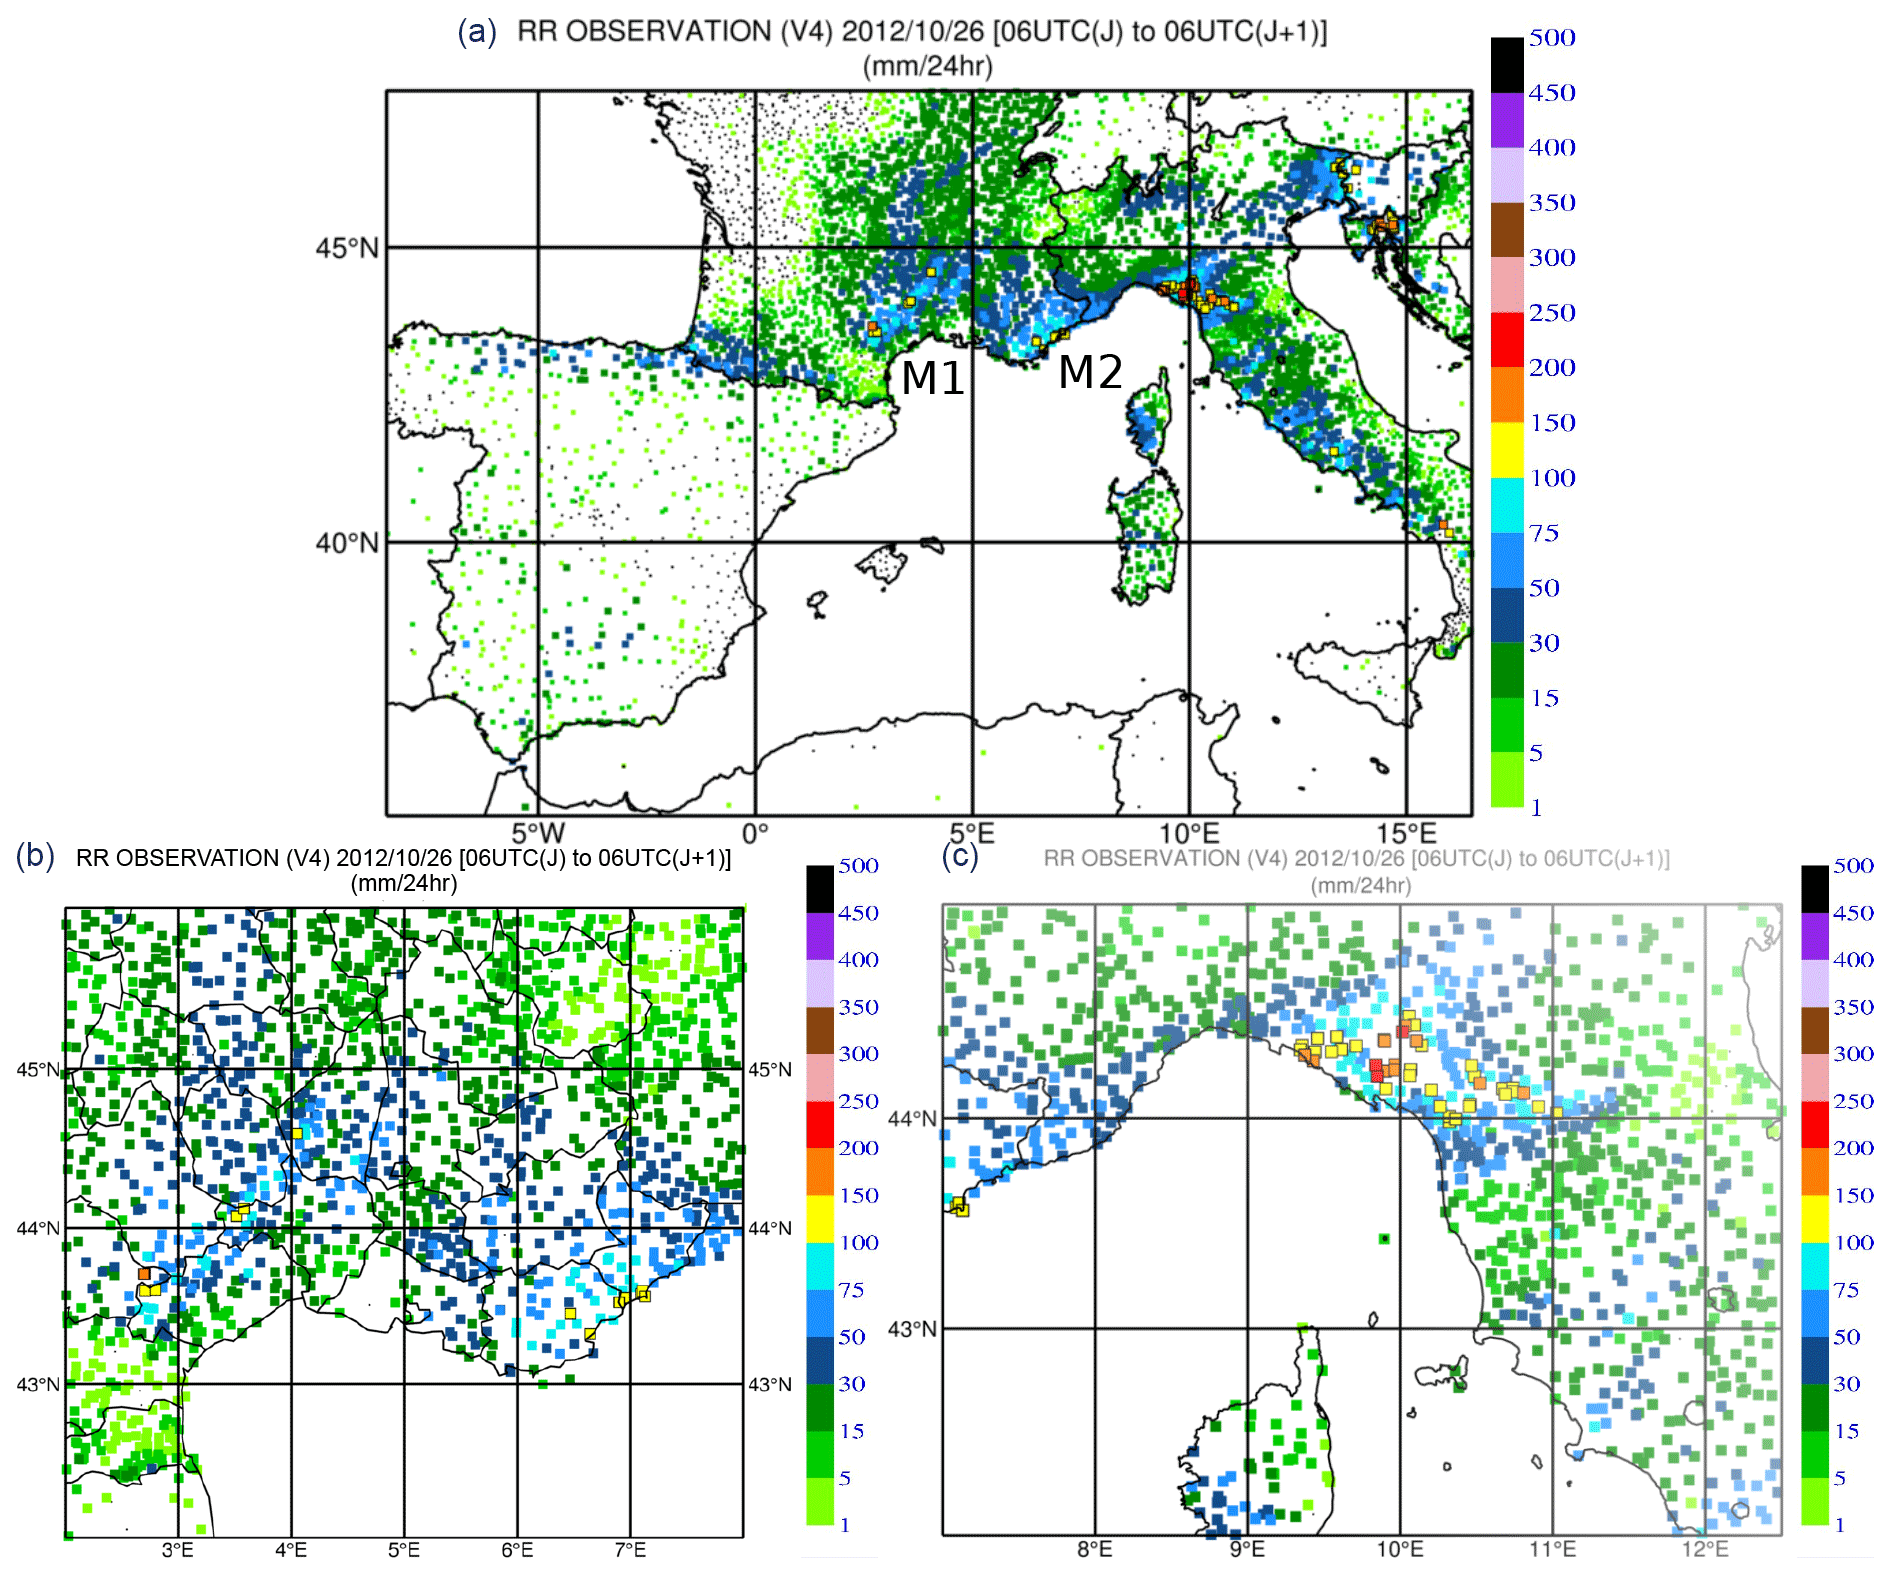
Figure 17Accumulated precipitation (mm) for 24 h between 26 October at 06:00 UTC and 27 October 2012 at 06:00 UTC over the AROME-WMED domain (a) and zoom over the Cevennes region (b) and over the north of Italy (c). Please note that the dates given in the figure are in the format of year month day (yyyy/mm/dd). RR: rain rate.
During the HyMeX SOP1, IOP16a was dedicated to a heavy-precipitation event (HPE) that occurred over Cévennes–Vivarais (CV) in France and later on, in Italy (IOP16b) on 25–26 October; this event was associated with local flash flooding and several casualties. This offshore convection case is well documented in Duffourg et al. (2016). On 26 October at 00:00 UTC active convection was occurring over Catalonia; this area of intense convective activity crossed the Gulf of Lion, reaching the French Mediterranean coast around 06:00 UTC and later on and then hitting the Italian Ligurian coast in the evening. It is well known that the associated convective systems are usually fed with moisture, during their early stage over the warm Mediterranean Sea. A moist, conditionally unstable southwestern flux is therefore found in the lower troposphere (Fig. 16) with a low-level jet by the Candillargues radar around 09:00–12:00 UTC, associated with a slowly evolving weak-pressure low (around 995 hPa) localized over southern France on 26 October at midday. Moreover, low-level convergence is reinforced by the complex orography (Cévennes ridge of the Massif Central and Alps in France), triggering convection. An upper southwesterly wind jet is observed above 500 hPa (Fig. 16); in the evening of 25 October the wind rotates to the west on the CV area as shown by the Candillargues UHF radar.
During the 25 and 26 October period, many deep convective systems developed over the northwestern Mediterranean (Duffourg et al., 2016). Although observed accumulated surface precipitation from Friday, 26 October, at 18:00 UTC, to Saturday, 27 October, at 06:00 UTC, over southern France it only reached around 150 mm in 24 h (Martinet et al., 2017), very strong hourly rates (near 50 mm every 1 h) were recorded, with intense river discharges (Ardèche, Gardon and Gapeau rivers for example). Such intense rainfall amounts led to local flash floods and two casualties in the Var region. In fact as shown in Fig. 17, three local precipitation maxima appear on the observed 24 h accumulated rainfall amount (25 October at 06:00 UTC to 26 October at 06:00 UTC) on the Mediterranean coastal area of France and Italy (Liguria Tuscany region), with a first elongated one in the Cévennes area (more than 150 mm, M1) and a small second one close to the coast (around 100 mm, M2).
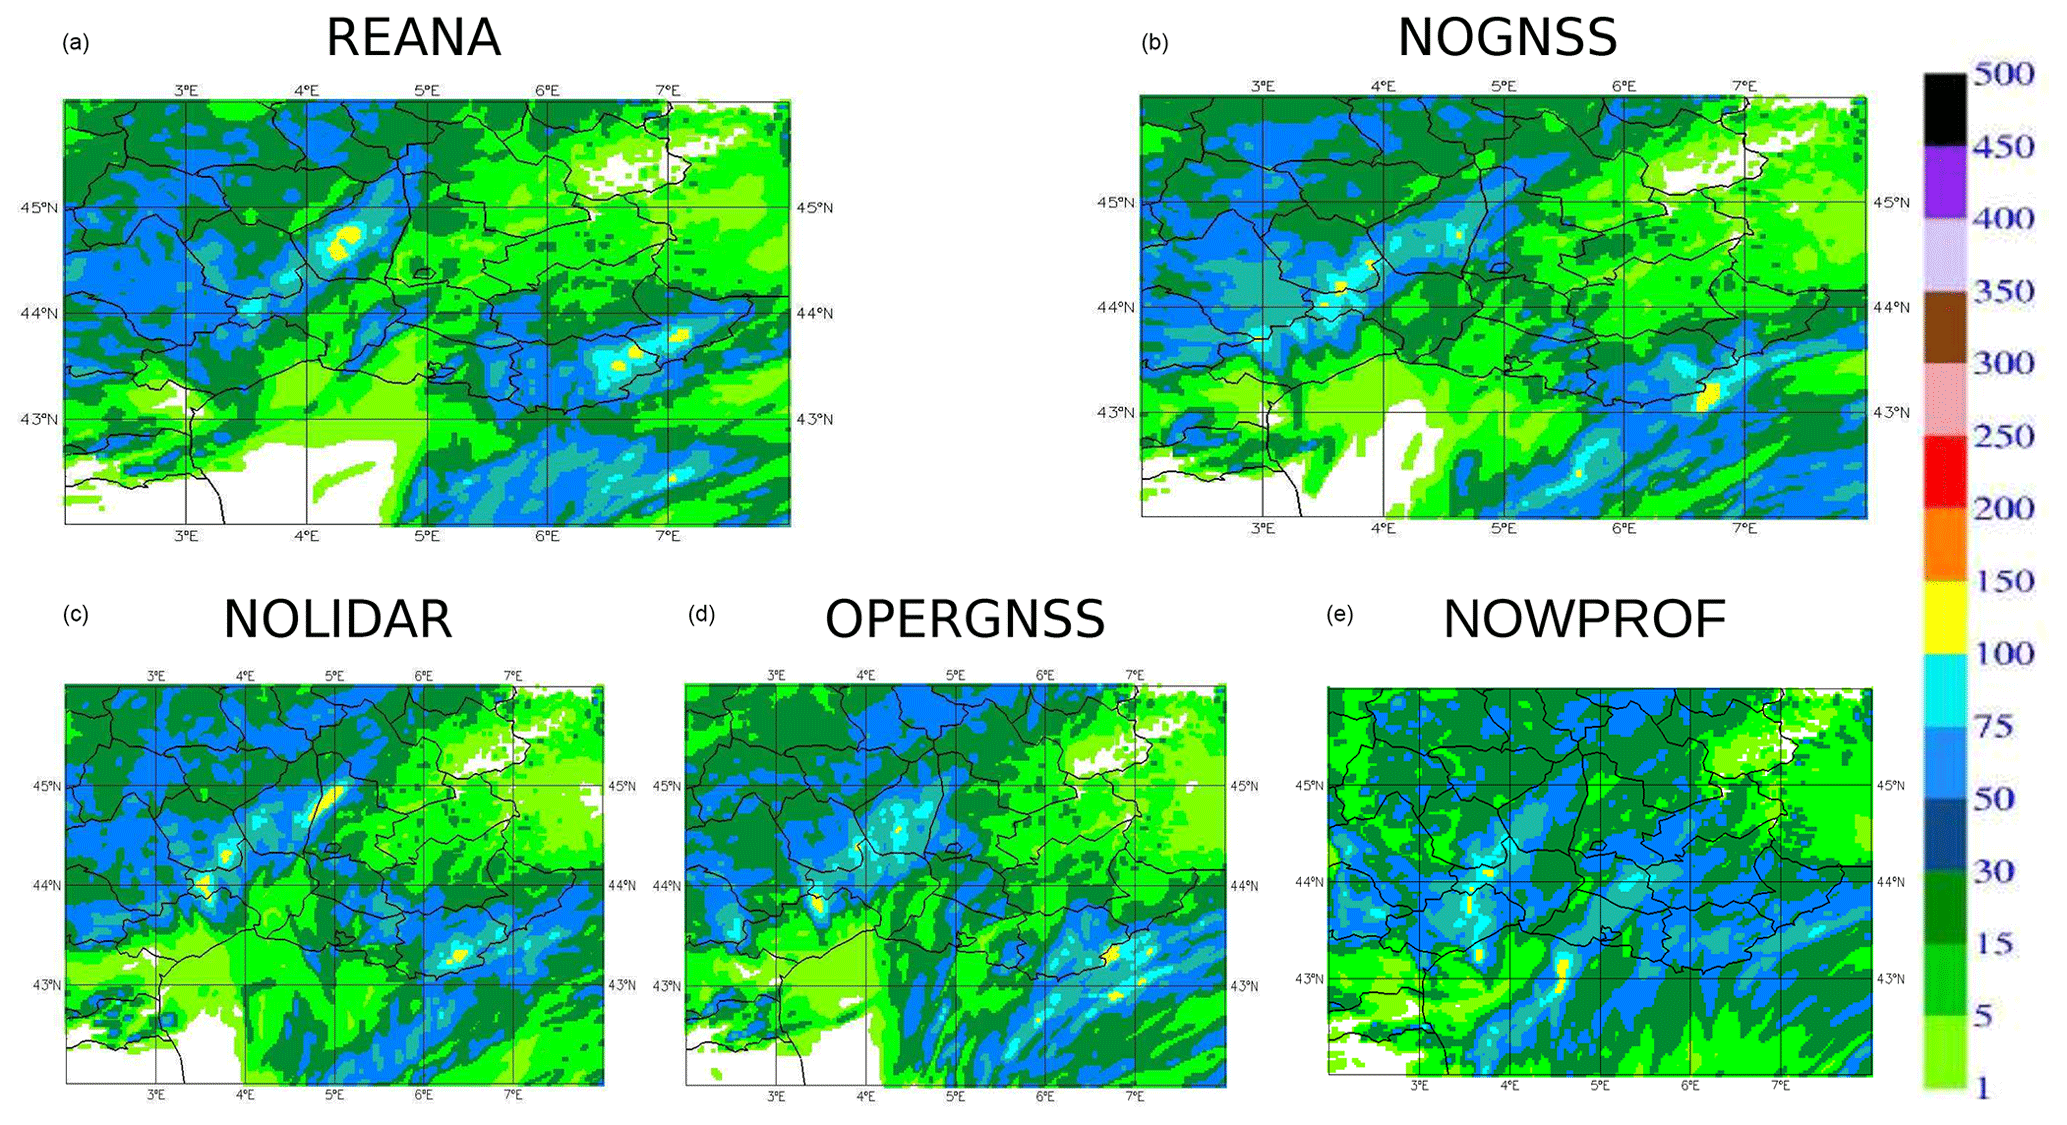
Figure 18Same as Fig. 17 but for 24 h accumulated precipitation forecasted by (a) REANA, (b) NOGNSS, (c) NOLIDAR, (d) OPERGNSS and (e) NOWPROF experiments, from the 6 to 30 h forecast ranges.
Figure 18 shows the 24 h accumulated precipitation between the 6 and 30 h forecasts for the different experiments considered in this study. The REANA 24 h accumulated rainfall (from the 6 to 30 h forecast ranges) simulation agrees with the observations for both the M1 and M2 systems. The NOLIDAR experiment is very close to REANA; this is consistent with the fact that the amount of additional lidar data is fairly small in REANA when compared to NOLIDAR. The strongest impact is found when no GNSS data are assimilated (NOGNSS run): M1 and M2 are strongly underestimated; surprisingly the OPERGNSS experiment leads to an accurate forecast of M2 but underestimates the southwestward extension of M1. Finally a strong negative impact is found with the NOWPROF simulation which misses M2 and does not reproduce correctly M1. Over Italy, the gain brought by the observations is not so evident, but it is quite well known in data impact studies that the assimilation of observation does not always improve the forecast at each analysis time but does overall.
The AROME-WMED model was originally developed to study and forecast heavy-precipitation Mediterranean events during the special observation periods (SOPs) of the HyMeX programme. Two reanalyses were produced after the HyMeX autumn campaign for the first SOP. The first one was carried out after the field campaign to provide reanalyses simulations of the period enjoying an updated AROME-WMED version. The second one, performed a few years after, was done to improve the quality of the first reanalyses, assimilating the largest amount of data possible from the experimental field campaign (i.e. lidar and dropsonde humidity profiles) or from reprocessed data (such as GNSS ZTDs, wind profiles, high-vertical-resolution radiosondes and Spanish doppler radars) using the latest AROME version.
Previous studies such as Duffourg and Ducrocq (2011), Ricard et al. (2012), or Bresson et al. (2012) have shown the importance of an accurate description of the low-level moist flow-feeding mesoscale convective systems. In this study the impact of various data sets related to humidity and wind on the forecast quality from this comprehensive reanalysis is investigated over the 2-month period. Many data sets of the first special observation period of the HyMeX campaign have been considered here. The reprocessed GNSS data set (Bock et al., 2016) was removed and replaced with the operational data set used in the real-time AROME-WMED version. We examined the humidity data provided by ground-based and airborne lidars. The impact of the reprocessed wind profilers and the Spanish radar data was also evaluated. The impact of these data sets was assessed through observing system experiments which consist of removing the data sets and comparing forecast quality from these denial experiments with a reference which includes all data sets. The selected data sets were research observations (water vapour lidars) or reprocessed data (from ground-based GNSS receivers or wind profilers). In total, the amount of denied data ranged between 0.15 % and 1.86 % of the total number of observations, depending on the OSE', and the impact was thus expected to be small.
Our study finds a small positive impact on humidity forecast at short-term ranges of the reprocessed GNSS ground-based zenithal total delay assimilation compared with NOGNSS. This data set is evenly distributed over the AROME-WMED domain and provided at each analysis time information period on integrated water vapour. The impact of the data reprocessing for GNSS zenithal total delays compared to the processing made in real time was also studied by comparing REANA with OPERGNSS. Even though a positive impact is observed with REANA compared to OPERGNSS, this improvement is not statistically significant. Given the impact of ground-based GNSS, there is also an interest in continuing work to assimilate GNSS data over ocean surfaces.
Small impacts on wind fields were also observed for wind profilers. The sole impact of the assimilation of lidar data is found when comparing with independent airborne radar observations located over the Mediterranean Sea. Since this data set represents a very small fraction of assimilated data, this may explain the absence of impact. In addition they were not assimilated at their full available temporal frequency but just once every 3 h.
Spanish radar data assimilation improves the short-term quality of the background as noticed on the 24 h accumulated precipitation of the eight 3 h background forecasts for each day but only over the Iberian Peninsula with no clear impact over the HyMeX domain. It is interesting to stress that this impact remains during the first 30 h of the forecast but without any remote impact over the rest of the AROME-WMED domain. A greater impact could possibly be obtained if the data were provided with additional scan elevations.
With the examination of the impact of the assimilation of four different data sets over a 2-month period in the mesoscale AROME-WMED, our study shows that it is required to be spatially distributed well and have frequent data sets such as the GNSS ZTD data set to get, with its assimilation, an overall impact in terms of analysis and forecast skills. This result agrees with the findings of Mahfouf et al. (2015), who show that the assimilation of GNSS systematically improves the atmospheric-humidity short-range forecasts despite the small fraction of GNSS observations assimilated in AROME. A high temporal availability and a regular horizontal distribution are both needed to get a significant impact on the forecast scores. Moreover, it is interesting to process as precisely as possible a maximum of GNSS data in real time and to have bias-corrected observations that are valuable for data assimilation. In addition, GNSS data availability on ships seems to be a promising way to increase the coverage over ocean (Fan et al., 2016). When the data set is available frequently but not well spread over the model domain, such as for the Doppler winds and reflectivities from the Spanish radars or winds from profiler radars, its assimilation may lead to a positive impact on the precipitation forecast, but it remains local. Finally, a marginal impact from local and sporadic data sets such as humidity profiles from water vapour lidars can be obtained, but it is not visible on “global scores”. To get a material impact on the forecast in a mesoscale model from a set of observation through its data assimilation, our study suggests to select data sets which are frequently available at each analysis time and also well spread over the domain.
The impact of the abovementioned data could be further improved. For example, the impact of GNSS in AROME-France has been recently improved with the use of variational bias correction in replacement of the static bias correction used in this study (Patrick Moll, personal communication, 2020). In addition radar data from foreign countries have been assimilated in AROME since July 2020. The distribution of these data by OPERA (Operational Programme for the Exchange of Weather Radar Information; the EUMETNET Radar programme) allows for getting data of a high quality in the data assimilation and thus increasing their impact in the AROME model (Martet et al., 2019). With a more frequent data assimilation cycle, making use of observations at higher temporal frequency as is the case with the current AROME-France model (Brousseau et al., 2016), it is likely that surface observations or the remote sensing data sources such as radars, GNSS or SEVIRI available for each hourly analysis in this study would have a greater impact on analyses and forecasts. Moreover new data assimilation systems such as 4D-Var or 4D-EnVar (ensemble background) are under development for convective-scale models (Gustafsson et al., 2018) and will allow for accounting for very frequent data. Therefore, they are expected to enhance the impact of observations available several times an hour. In the future, the impact of the Infrared Sounder on board Meteosat Third Generation will benefit from these new data assimilation systems, as this sounder will provide observations every 30 min over the AROME domain and especially over the oceans.
The source code of AROME-WMED, derived from the operational AROME code, cannot be obtained.
The analyses and the forecast fields are available in the HyMeX database (http://mistrals.sedoo.fr/HyMeX/, last access: 19 August 2019) (HyMeX database, 2019). The final (second) reanalysis labelled REANA in this paper is available at https://doi.org/10.14768/MISTRALS-HYMEX.1492 (Fourrié and Ducrocq, 2011).
The supplement related to this article is available online at: https://doi.org/10.5194/nhess-21-463-2021-supplement.
NF and MN prepared and carried out all the numerical experiments of the reanalysis and the OSEs. They investigated the results and wrote the paper with the help of all the coauthors. PB and OC helped to investigate the results by performing diagnostics and verification computations.
The authors declare that they have no conflict of interest.
This article is part of the special issue “Hydrological cycle in the Mediterranean (ACP/AMT/GMD/HESS/NHESS/OS inter-journal SI)”. It is not associated with a conference.
The authors would like to acknowledge the MISTRALS–HyMeX programme and the funding from the ANR (contract nos. IODA-MED ANR-11-BS56-0005 and MUSIC ANR-14-CE01-0014). Jean-Francois Mahfouf and Véronique Ducrocq are acknowledged for their helpful comments on a previous version of the paper. The authors also thank the anonymous reviewers for their fruitful comments. The authors acknowledge the principal investigators of the data sets: Patrick Chazette (WALI), Cyrille Flamant (LEANDRE), Paolo Di Girolamo (BASIL), Frédérique Saïd (wind profilers), Olivier Bock, Pierre Bosser (reprocessed GNSS data) and Isabelle Taupier-Letage (data from opportunity ships).
The research was supported mainly by the ANR (Agence Nationale de la Recherche; contract nos. IODA-MED ANR-11-BS56-0005 and MUSIC ANR-14-CE01-0014.)
This paper was edited by Eric Martin and reviewed by two anonymous referees.
Benjamin, S. G., Schwartz, B. E., Szoke, E. J., and Koch, S. E.: The Value of Wind Profiler Data in U.S. Weather Forecasting, B. Am. Meteorol. Soc., 85, 1871–1886, https://doi.org/10.1175/BAMS-85-12-1871, 2004. a
Berre, L.: Estimation of Synoptic and Mesoscale Forecast Error Covariances in a Limited-Area Model, Mon. Weather Rev., 128, 644–667, https://doi.org/10.1175/1520-0493(2000)128<0644:EOSAMF>2.0.CO;2, 2000. a
Bielli, S., Grzeschik, M., Richard, E., Flamant, C., Champollion, C., Kiemle, C., Dorninger, M., and Brousseau, P.: Assimilation of water-vapour airborne lidar observations: impact study on the COPS precipitation forecasts, Q. J. Roy. Meteorol. Soc., 138, 1652–1667, https://doi.org/10.1002/qj.1864, 2012. a, b
Bock, O., Bosser, P., Pacione, R., Nuret, M., Fourrié, N., and Parracho, A.: A high-quality reprocessed ground-based GPS dataset for atmospheric process studies, radiosonde and model evalu ation, and reanalysis of HyMeX Special Observing Period, Q. J. Roy. Meteorol. Soc., 142, 56–71, https://doi.org/10.1002/qj.2701, 2016. a, b, c, d, e, f, g, h
Boniface, K., Ducrocq, V., Jaubert, G., Yan, X., Brousseau, P., Masson, F., Champollion, C., Chéry, J., and Doerflinger, E.: Impact of high-resolution data assimilation of GPS zenith delay on Mediterranean heavy rainfall forecasting, Ann. Geophys., 27, 2739–2753, https://doi.org/10.5194/angeo-27-2739-2009, 2009. a
Borderies, M., Caumont, O., Delanoë, J., Ducrocq, V., and Fourrié, N.: Assimilation of wind data from airborne Doppler cloud-profiling radar in a kilometre-scale NWP system, Nat. Hazards Earth Syst. Sci., 19, 821–835, https://doi.org/10.5194/nhess-19-821-2019, 2019a. a
Borderies, M., Caumont, O., Delanoë, J., Ducrocq, V., Fourrié, N., and Marquet, P.: Impact of airborne cloud radar reflectivity data assimilation on kilometre-scale numerical weather prediction analyses and forecasts of heavy precipitation events, Natural Hazards and Earth System Sciences, 19, 907–926, https://doi.org/10.5194/nhess-19-907-2019, 2019b. a
Bouniol, D., Protat, A., Plana-Fattori, A., Giraud, M., Vinson, J.-P., and Grand, N.: Comparison of Airborne and Spaceborne 95-GHz Radar Reflectivities and Evaluation of Multiple Scattering Effects in Spaceborne Measurements, J. Atmos. Ocean. Tech., 25, 1983–1995, https://doi.org/10.1175/2008JTECHA1011.1, 2008. a
Bresson, E., Ducrocq, V., Nuissier, O., Ricard, D., and de Saint-Aubin, C.: Idealized numerical simulations of quasi-stationary convective systems over the Northwestern Mediterranean complex terrain, Q. J. Roy. Meteorol. Soc., 138, 1751–1763, 2012. a, b, c
Brousseau, P., Berre, L., Bouttier, F., and Desroziers, G.: Background error covariances for a convective-scale data-assimilation system : AROME-France 3D-Var, Q. J. Roy. Meteorol. Soc., 137, 409–422, https://doi.org/10.1002/qj.750, 2011. a, b
Brousseau, P., Seity, Y., Ricard, D., and Léger, J.: Improvement of the forecast of convective activity from the AROME-France system, Q. J. Roy. Meteorol. Soc., 142, 2231–2243, https://doi.org/10.1002/qj.2822, 2016. a, b
Caniaux, G., Redelsperger, J.-L., and Lafore, J.-P.: A numerical study of the stratiform region of a fast-moving squall line. Part I: General description and water and heat budgets, J. Atmos. Sci., 51, 2046–2074, 1994. a
Caumont, O. and Ducrocq, V.: What should be considered when simulating Doppler velocities measured by ground-based weather radars?, J. Appl. Meteorol. Clim., 47, 2256–2262, https://doi.org/10.1175/2008JAMC1894.1, 2008. a
Caumont, O., Ducrocq, V., Wattrelot, E., Jaubert, G., and Pradier-Vabre, S.: 1D+3DVar assimilation of radar reflectivity data: a proof of concept, Tellus A, 62, 173–187, https://doi.org/10.1111/j.1600-0870.2009.00430.x, 2010. a
Chazette, P., Flamant, C., Shang, X., Totems, J., Raut, J.-C., Doerenbecher, A., Ducrocq, V., Fourrié, N., Bock, O., and Cloché, S.: A multi-instrument and multi-model assessment of atmospheric moisture variability over the western Mediterranean during HyMeX, Q. J. Roy. Meteorol. Soc., 142, 7–22, https://doi.org/10.1002/qj.2671, 2016. a, b, c, d
Courtier, P., Freydier, C., Rabier, F., and Rochas, M.: The ARPEGE Project at Météo-France, ECMWF Seminar Proceedings, 7, 193–231, 1991. a
Delanoë, J., Protat, A., Jourdan, O., Pelon, J., Papazzoni, M., Dupuy, R., Gayet, J.-F., and Jouan, C.: Comparison of Airborne In Situ, Airborne Radar–Lidar, and Spaceborne Radar–Lidar Retrievals of Polar Ice Cloud Properties Sampled during the POLARCAT Campaign, J. Atmos. Ocean. Tech., 30, 57–73, https://doi.org/10.1175/JTECH-D-11-00200.1, 2013. a
Di Girolamo, P., Flamant, C., Cacciani, M., Richard, E., Ducrocq, V., Summa, D., Stelitano, D., Fourrié, N., and Saïd, F.: Observation of low-level wind reversals in the Gulf of Lion area and their impact on the water vapour variability, Q. J. Roy. Meteorol. Soc., 142, 153–172, https://doi.org/10.1002/qj.2767, 2016. a, b
Drobinski, P., Ducrocq, V., Alpert, P., Anagnostou, E., Béranger, K., Borga, M., Braud, I., Chanzy, A., Davolio, S., Delrieu, G., Estournel, C., Boubrahmi, N. F., Font, J., Grubišić, V., Gualdi, S., Homar, V., Ivančan-Picek, B., Kottmeier, C., Kotroni, V., Lagouvardos, K., Lionello, P., Llasat, M. C., Ludwig, W., Lutoff, C., Mariotti, A., Richard, E., Romero, R., Rotunno, R., Roussot, O., Ruin, I., Somot, S., Taupier-Letage, I., Tintore, J., Uijlenhoet, R., and Wernli, H.: HyMeX: A 10-Year Multidisciplinary Program on the Mediterranean Water Cycle, B. Am. Meteorol. Soc., 95, 1063–1082, https://doi.org/10.1175/BAMS-D-12-00242.1, 2014. a
Ducrocq, V., Braud, I., Davolio, S., Ferretti, R., Flamant, C., Jansa, A., Kalthoff, N., Richard, E., Taupier-Letage, I., Ayral, P.-A., Belamari, S., Berne, A., Borga, M., Boudevillain, B., Bock, O., Boichard, J.-L., Bouin, M.-N., Bousquet, O., Bouvier, C., Chiggiato, J., Cimini, D., Corsmeier, U., Coppola, L., Cocquerez, P., Defer, E., Delanoë, J., Girolamo, P. D., Doerenbecher, A., Drobinski, P., Dufournet, Y., Fourrié, N., Gourley, J. J., Labatut, L., Lambert, D., Coz, J. L., Marzano, F. S., Molinié, G., Montani, A., Nord, G., Nuret, M., Ramage, K., Rison, W., Roussot, O., Said, F., Schwarzenboeck, A., Testor, P., Baelen, J. V., Vincendon, B., Aran, M., and Tamayo, J.: HyMeX-SOP1: The Field Campaign Dedicated to Heavy Precipitation and Flash Flooding in the Northwestern Mediterranean, B. Am. Meteorol. Soc., 95, 1083–1100, https://doi.org/10.1175/BAMS-D-12-00244.1, 2014. a
Duffourg, F. and Ducrocq, V.: Origin of the moisture feeding the Heavy Precipitating Systems over Southeastern France, Nat. Hazards Earth Syst. Sci., 11, 1163–1178, https://doi.org/10.5194/nhess-11-1163-2011, 2011. a, b, c
Duffourg, F., Nuissier, O., Ducrocq, V., Flamant, C., Chazette, P., Delanoë, J., Doerenbecher, A., Fourrié, N., Di Girolamo, P., Lac, C., Legain, D., Martinet, M., Saïd, F., and Bock, O.: Offshore deep convection initiation and maintenance during HyMeX IOP16a heavy precipitation event, Q. J. Roy. Meteorol. Soc., 142, 259–274, 2016. a, b
Fan, S., Zang, J.-F., Peng, X.-Y., Wu, S.-Q., Liu, Y.-X., and Zhang, K.-F.: Validation of Atmospheric Water Vapor Derived from Ship-Borne GPS Measurements in the Chinese Bohai Sea, Ter. Atmos. Ocean. Sci., 27, 213–220, https://doi.org/10.3319/TAO.2015.11.04.01(A), 2016. a
Fourrié, N. and Nuret, M.: AROME_WMED reanalysis_2, https://doi.org/10.14768/MISTRALS-HYMEX.1492, 2017. a
Fourrié, N., Bresson, E., Nuret, M., Jany, C., Brousseau, P., Doerenbecher, A., Kreitz, M., Nuissier, O., Sevault, E., Bénichou, H., Amodei, M., and Pouponneau, F.: AROME-WMED, a real-time mesoscale model designed for the HyMeX special observation periods, Geosci. Model Dev., 8, 1919–1941, https://doi.org/10.5194/gmd-8-1919-2015, 2015. a, b
Fourrié, N., Nuret, M., Brousseau, P., Caumont, O., Doerenbecher, A., Wattrelot, E., Moll, P., Bénichou, H., Puech, D., Bock, O., Bosser, P., Chazette, P., Flamant, C., Di Girolamo, P., Richard, E., and Saïd, F.: The AROME-WMED reanalyses of the first special observation period of the Hydrological cycle in the Mediterranean experiment (HyMeX), Geosci. Model Dev., 12, 2657–2678, https://doi.org/10.5194/gmd-12-2657-2019, 2019. a, b, c, d, e, f, g, h, i
Grzeschik, M., Bauer, H.-S., Wulfmeyer, V., Engelbart, D., Wandinger, U., Mattis, I., Althausen, D., Engelmann, R., Tesche, M., and Riede, A.: Four-Dimensional Variational Data Analysis of Water Vapor Raman Lidar Data and Their Impact on Mesoscale Forecasts, J. Atmos. Ocean. Tech., 25, 1437–1453, https://doi.org/10.1175/2007JTECHA974.1, 2008. a
Gustafsson, N., Janjić, T., Schraff, C., Leuenberger, D., Weissmann, M., Reich, H., Brousseau, P., Montmerle, T., Wattrelot, E., Bučánek, A., Mile, M., Hamdi, R., Lindskog, M., Barkmeijer, J., Dahlbom, M., Macpherson, B., Ballard, S., Inverarity, G., Carley, J., Alexander, C., Dowell, D., Liu,S., Ikuta, Y., and Fujita, T.: Survey of data assimilation methods for convective-scale numerical weather prediction at operational centres, Q. J. Roy. Meteorol. Soc., 144, 1218–1256, https://doi.org/10.1002/qj.3179, 2018. a
Gutman, S. I., Sahm, S. R., Benjamin, S. G., Schwartz, B. E., Holub, K. L., Stewart, J. Q., and Smith, T. L.: Rapid Retrieval and Assimilation of Ground Based GPS Precipitable Water Observations at the NOAA Forecast Systems Laboratory: Impact on Weather Forecasts, J. Meteorol. Soc. Jpn. Ser. II, 82, 351–360, https://doi.org/10.2151/jmsj.2004.351, 2004. a
HyMeX database: Welcome to The HyMeX Database, available at: http://mistrals.sedoo.fr/HyMeX/, last access: 19 August 2019. a
Kouba, J. and Héroux, P.: Precise Point Positioning Using IGS Orbit and Clock Products, GPS Solutions, 5, 12–28, https://doi.org/10.1007/PL00012883, 2001. a
Lindskog, M., Ridal, M., Thorsteinsson, S., and Ning, T.: Data assimilation of GNSS zenith total delays from a Nordic processing centre, Atmos. Chem. Phys., 17, 13983–13998, https://doi.org/10.5194/acp-17-13983-2017, 2017. a
Macpherson, S. R., Deblonde, G., Aparicio, J. M., and Casati, B.: Impact of NOAA Ground-Based GPS Observations on the Canadian Regional Analysis and Forecast System, Mon. Weather Rev., 136, 2727–2746, https://doi.org/10.1175/2007MWR2263.1, 2008. a
Mahfouf, J.-F., Ahmed, F., Moll, P., and Teferle, F. N.: Assimilation of zenith total delays in the AROME France convective scale model: a recent assessment, Tellus A, 67, 26106, https://doi.org/10.3402/tellusa.v67.26106, 2015. a, b, c, d, e
Martet, M., Guillaume, F., and Wattrelot, E.: Assimilation of OPERA radar data in AROME-FRANCE NWP MODEL: a challenge, in: 39th international conference on radar meterology, 16–20 September 2019, Nara Kasugano International Forum IRAKA, Nara, Japan, available at: https://cscenter.co.jp/icrm2019/program/data/abstracts/Session3B-02_2.pdf, (last access: 19 August 2020), 2019. a
Martinet, M., Nuissier, O., Duffourg, F., Ducrocq, V., and Ricard, D.: Fine-scale numerical analysis of the sensitivity of the HyMeX IOP16a heavy precipitating event to the turbulent mixing length parameterization, Q. J. Roy. Meteorol. Soc., 143, 3122–3135, 2017. a
Montmerle, T. and Faccani, C.: Mesoscale Assimilation of Radial Velocities from Doppler Radars in a Preoperational Framework, Mon. Weather Rev., 137, 1939–1953, https://doi.org/10.1175/2008MWR2725.1, 2009. a
Pinty, J.-P. and Jabouille, P.: A mixed-phased cloud parameterization for use in a mesoscale non-hydrostatic model: simulations of a squall line and of orographic precipitation, in: Proceeding, Conference on Cloud Physics, Amer. Meteor. Soc., Everett, WA, 217–220, 1998. a
Protat, A., Bouniol, D., Delanoë, J., O'Connor, E., May, P. T., Plana-Fattori, A., Hasson, A., Görsdorf, U., and Heymsfield, A. J.: Assessment of Cloudsat Reflectivity Measurements and Ice Cloud Properties Using Ground-Based and Airborne Cloud Radar Observations, J. Atmos. Ocean. Tech., 26, 1717–1741, https://doi.org/10.1175/2009JTECHA1246.1, 2009. a
Ricard, D., Ducrocq, V., and Auger, L.: A Climatology of the Mesoscale Environment Associated with Heavily Precipitating Events over a Northwestern Mediterranean Area, J. Appl. Meteorol. Clim., 51, 468–488, 2012. a, b, c
Saïd, F., Campistron, B., Delbarre, H., Canut, G., Doerenbecher, A., Durand, P., Fourrié, N., Lambert, D., and Legain, D.: Offshore winds obtained from a network of wind-profiler radars during HyMeX, Q. J. Roy. Meteorol. Soc., 142, 23–42, https://doi.org/10.1002/qj.2749, 2016. a, b, c, d, e
Seity, Y., Brousseau, P., Malardel, S., Hello, G., Bénard, P., Bouttier, F., Lac, C., and Masson, V.: The AROME-France convective scale operational model, Mon. Weather Rev., 139, 976–991, 2011. a, b
Wattrelot, E., Caumont, O., and Mahfouf, J.-F.: Operational Implementation of the 1D+3D-Var Assimilation Method of Radar Reflectivity Data in the AROME Model, Mon. Weather Rev., 142, 1852–1873, https://doi.org/10.1175/MWR-D-13-00230.1, 2014. a, b, c
- Abstract
- Introduction
- Sensitivity study description and validation methodology
- Impact of GNSS data on the analysis and first-guess quality
- Impact of GNSS data on medium-term forecasts
- Other impact studies
- IOP16 case study
- Conclusions
- Code availability
- Data availability
- Author contributions
- Competing interests
- Special issue statement
- Acknowledgements
- Financial support
- Review statement
- References
- Supplement