the Creative Commons Attribution 4.0 License.
the Creative Commons Attribution 4.0 License.
 | 26 Feb 2026
Flood damage functions for rice: synthesizing evidence and building data-driven models
Alina Bill-Weilandt
Nivedita Sairam
Dennis Wagenaar
Kasra Rafiezadeh Shahi
Heidi Kreibich
Perrine Hamel
David Lallemant
Floods are a major cause of agricultural losses, yet flood damage models for crops are scarce, often lack validation, uncertainty estimates, and assessments of their performance in new regions. This study evaluates and compares flood damage modelling approaches for rice crops. We compile and review 20 damage models from 12 countries, identifying key gaps and limitations. Using empirical survey data from Thailand and Myanmar, we develop a suite of empirical models, including deterministic and probabilistic stage-damage functions, Bayesian regression, and Random Forest, based on key flood characteristics like water depth, duration, and plant growth stage. We assess predictive performance through cross-validation and test how well models trained in one region perform when applied to another. Our results show that model performance depends on complexity and context: Random Forest achieves the highest accuracy, while simpler models offer ease of use in data-scarce settings. The results also demonstrate the potential errors introduced by transferring models spatially, highlighting the need for diverse training data or local calibration. In summary, we present the most comprehensive review of flood damage models for rice crops to date and provide practical guidance on model selection and expected errors when transferring models across regions.
- Article
(3978 KB) - Full-text XML
-
Supplement
(3827 KB) - BibTeX
- EndNote


1.1 Flood damage models for the agricultural sector
Extreme events have caused estimated losses of USD 3.8 trillion in the agricultural sector over the past three decades (1991–2021) (FAO, 2023). This is equivalent to an average annual loss of about USD 123 billion or 5 % of the global agricultural GDP (FAO, 2023). Agricultural losses affect the livelihoods of people globally – in 2019, about half of the population worldwide (3.83 billion people) lived in households with agrifood system-based livelihoods (Davis et al., 2023). In 2023, 29 % of the global population faced moderate or severe food insecurity, meaning they did not have regular access to adequate food, while 9.1 % of the global population faced hunger (FAO et al., 2024). Stress to agricultural production is caused by abiotic (non-living environmental) factors – such as flooding, drought, and extreme temperatures – and biotic factors such as pests, diseases, and invasive species. Among these, flooding is especially damaging, as it affects not only crops but also agricultural assets.
Crop models are used to predict or explain yield under varying conditions. There are three state-of-the-art approaches to assess the impact of extreme climatic events on yield: field experiments, process-based models (relying on biophysical processes), and statistical and empirical models (like regression models and machine-learning algorithms) (Hu et al., 2024). Crop models can integrate biological, physiological, ecological, physical, and economic components (Pasquel et al., 2022). While progress has been made in modeling yield reductions from droughts and heat, few process-based crop models account for the effects of excessive rainfall (Kim et al., 2024). These models often overestimate yields under wet conditions, because they consider the plants' water requirements but disregard submergence-related damage (Li et al., 2019; Liu et al., 2022). Integrating flood damage models into crop models has the potential to improve yield estimations under wet conditions.
Quantifying flood damage is imperative for effective flood risk management and transfer solutions in the agricultural sector. Flood damage models, often represented by vulnerability curves estimate asset damage due to submergence based on hazard intensity variables (e.g., flood duration and water depth). The choice of the flood damage model can have significant effects on impact estimates (Apel et al., 2009; de Moel et al., 2012; Jongman et al., 2012). Flood damage in rural areas is often underestimated or overlooked, largely due to their lower exposures and associated losses in comparison to urban settings (Förster et al., 2008). However, this neglect can have serious consequences as flooding in agricultural regions poses a significant threat to global food security.
Key drivers of yield loss due to flooding include flood duration, seasonality, and velocity (Brémond et al., 2013). Yield loss is influenced by both inundation characteristics (water depth, flood duration, flow velocity, water contamination, and sediment load) and plant characteristics (crop type, growth stage, plant height, minimum damageable flood depth, and tolerable flood duration) (Förster et al., 2008; Nguyen et al., 2021; Shrestha et al., 2021). Although yield loss results from complex, nonlinear interactions between multiple variables, few machine learning algorithms exist for crop damage modeling (Monteleone et al., 2023b). Machine learning methods and Bayesian inference have been found suitable for estimating the size of agricultural areas damaged by flooding and flood-induced yield loss based on remote sensing data (Nhangumbe et al., 2023; Tapia-Silva et al., 2011), complemented by meteorological data (Lazin et al., 2021).
Despite these advancements, the prediction of flood losses from crop models is associated with high uncertainty. For instance, state-of-the-art crop models were found to underestimate losses by up to 7-fold (Monteleone et al., 2023a). The high variability in damage processes calls for probabilistic models, which are capable of accounting for uncertainty in model parameters, structure, and damage process, to inform flood risk management decisions (Sairam et al., 2020). In contrast to deterministic models, which predict a single loss estimate, probabilistic models quantify uncertainty in the damage predictions by providing the likelihood of the whole spectrum of loss values.
Despite the high prevalence of data-driven (including machine learning), probabilistic modeling approaches for the built-up sector (Dottori et al., 2016; Schröter et al., 2014; Wagenaar et al., 2018), they do not exist for the agriculture sector. This can be attributed to the scarcity of agricultural damage survey data in many countries. Only 31 countries submitted hazard-disaggregated agricultural losses to the Sendai Framework Monitor, from 2015 to 2021 (FAO, 2023, p.19), which highlights a lack of data for developing damage models for crops. In the absence of local yield damage data, risk modelers rely on generalized models or localized models trained on data from other regions (transferred models). They are confronted with the question of which flood damage model is the most suited for their case. A popular choice of models is from practice-oriented literature, including the HAZUS Flood Model, the Multi-Coloured Model (MCM), and the damage curves from the Joint Research Centre (JRC). The HAZUS Flood Model estimates yield loss from river flooding based on flood duration and time of the year (FEMA, 2020). The MCM presents yield reductions and the financial gain (or loss) resulting from cultivating one more (or less) hectare of land for crops in England and Wales, under different drainage conditions (Penning-Rowsell, 2013; Penning-Rowsell et al., 2005). The JRC report provides continental stage-damage functions (SDFs) – also known as depth-damage curves – for crops in Asia and Europe as well as five country-specific SDFs for agriculture (including three SDFs for rice), created based on models and maximum damage values from the literature. The JRC report found limited damage models available for the agriculture and infrastructure/roads sectors (Huizinga et al., 2017).
1.2 Spatial transferability of flood damage models
The choice of transferred damage models introduces biases in risk assessment. For instance, a case study in Thailand reported an 8-fold increase in estimated losses when applying the damage models from the Philippines in comparison to the ones from Myanmar (Budhathoki et al., 2024; applying models by Shrestha et al., 2021, 2016). In addition, most crop damage models consider the time of the year to incorporate seasonality in damage estimation. However, the usage of “time of the year” as a proxy for growth stage hinders the transfer of the model to a region with different climatic conditions and crop planting cycles as this approach inherently ties the model's processes to a specific region, reducing its applicability elsewhere (Brémond et al., 2013).
Assessing transferability across regions helps risk modelers balance the cost of collecting localized, detailed damage data against the benefits of adopting more pragmatic, cost-effective damage modeling approaches. While transferability is a key requirement in process-based model development, transferability assessments remain limited (Brémond et al., 2022). Agricultural studies have assessed the transferability of linear flood damage models for wheat (Scorzini et al., 2021), piecewise linear (ramp) functions for rice (Shrestha et al., 2021), and crop yield prediction models (Priyatikanto et al., 2023; Stiller et al., 2024). However, most damage models for crops rely on national loss databases or expert knowledge without a transferability assessment (Brémond et al., 2022).
1.3 Inventory of existing flood damage models for rice
We created an inventory of flood damage models for rice, comprising 20 models from 12 countries. Figure 1 presents a structured overview of flood damage models for rice in the inventory (categories adapted from Gerl et al., 2016). Half of the models are based on empirical data, 20 % rely on experimental data with potted rice, and another 20 % are based on expert knowledge. Model validation was reported for 40 % of all models, and model transferability was only tested for a single model, the ramp functions by Shrestha et al. (2021). This study addresses these gaps by conducting model validation and transferability assessments. Less than half of the models incorporate the plant's growth stage as a predictor. Two-thirds of the models incorporate flood duration as a predictor, primarily as a categorized variable (60 % of all models) and rarely as a continuous variable (15 % of all models). The models developed in this study use flood duration as a continuous input variable. No model offers probabilistic outputs or formal uncertainty analysis. This highlights the need for more data-driven, multivariable, and transferable models. Most flood damage models for rice define the response variable in relative terms. In line with the existing literature, the models developed in this paper predict relative yield loss. A summary of the models in the inventory is provided in Table S1 in the Supplement. The models are categorized by region of application, and modeling approach (methodology and model concept), model validation, and model transferability as well as predictor variables and damage format (see Fig. 1 and Table S1). The inventory of flood damage models, including an overview of the model characteristics, the damage datasets, and lookup tables, is publicly available (Bill-Weilandt et al., 2026a).
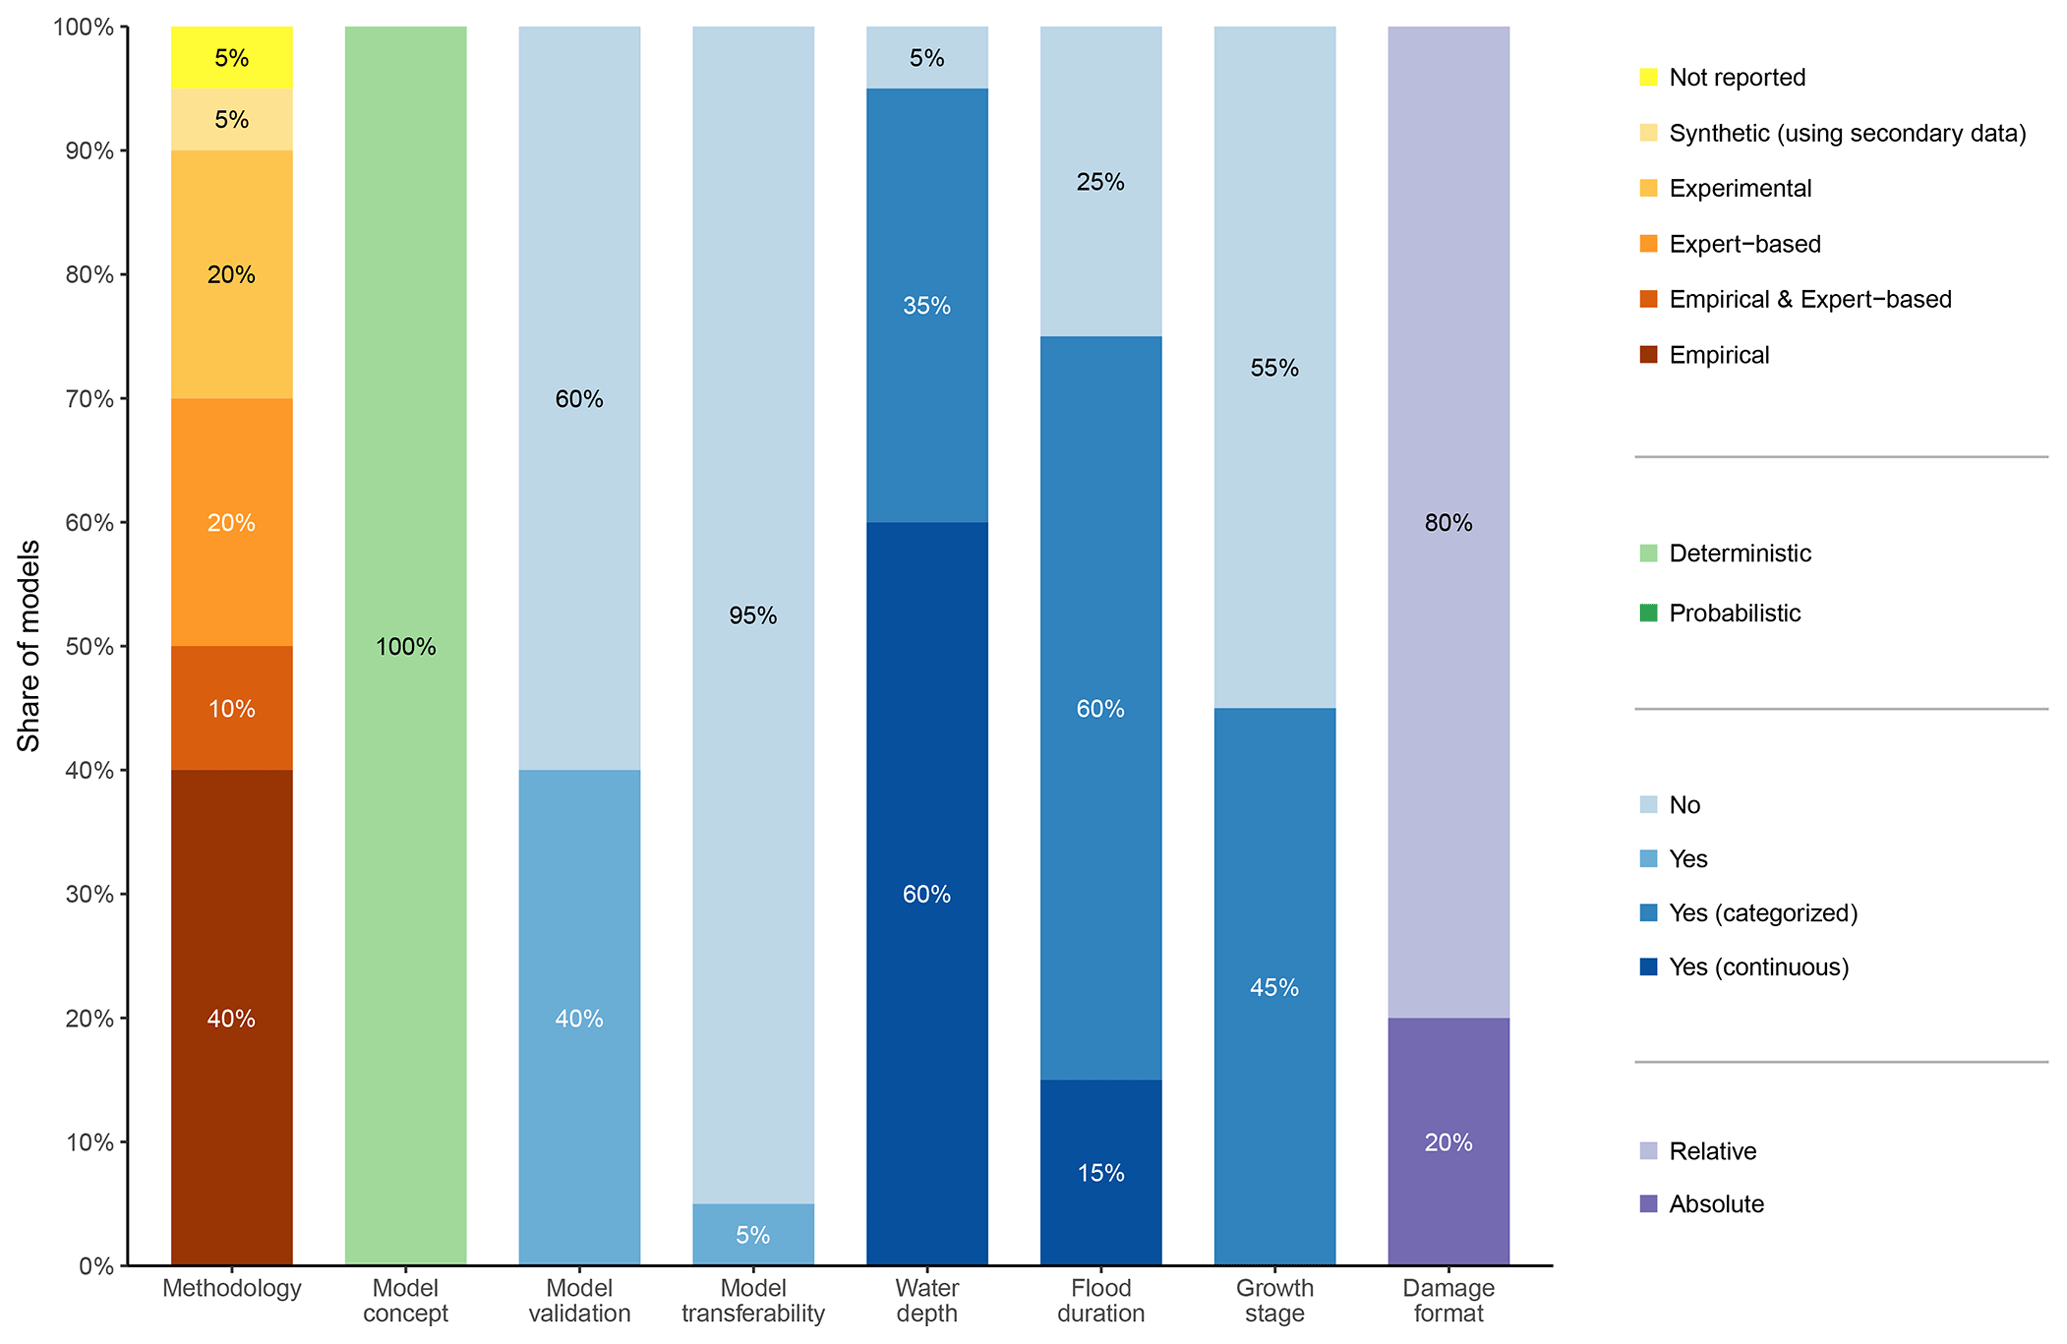
Figure 1Characteristics of flood damage models for rice in the inventory. The figure shows model characteristics, including the methodology to build the model, the model concept (deterministic or probabilistic), and whether model validation and model transferability assessment were reported in the publication. The four columns on the right indicate the inclusion and format of three commonly used predictors (water depth, duration, and growth stage) and the damage format. When a publication presented multiple model variations with the same variables for one country, the model was counted once.
1.4 Research contributions and scope
The objective of this study is to conceptualize and implement a four-step methodological framework for advancing flood damage models for rice, which is also applicable to other crops. The framework supports flood damage modeling for crops that integrates machine learning approaches in the model development and validates models across regions. The methodology aims to advance flood damage models for rice crop losses. In this context, there is a lack of models that quantify prediction uncertainties and evaluate the possibility of transferability across regions. Empirical data (reported from farm owners) provide real-world observations of hazard, exposure, and damage for calibrating and validating flood damage models. Machine-Learning models use empirical data to learn complex, multi-level relationships between flood characteristics and resulting losses, often outperforming traditional stage-damage functions. Combining empirical data with machine learning-based probabilistic models has enabled transferable and reliable flood damage predictions (Rözer et al., 2019; Sairam et al., 2020).
In line with the key recommendations for the development of damage models for crops (Monteleone et al., 2023b), the methodological framework developed in this study (1) uses field observations (collected through household surveys), disaggregated by growth stage, (2) enables the selection of easily measurable predictors instead of crop model-derived predictors, (3) involves detailed reporting of the damage models and their parameters, and (4) supports validation of the damage models, including cross-region transferability.
The methodological framework is implemented to model flood damages to rice in two countries – Thailand and Myanmar – since rice is the primary staple crop for a large share of the global population. Grown and consumed predominantly in Asia, which accounted for almost half (45 %) of the agricultural losses from natural hazards from 2015 to 2021 (FAO, 2023, p. 26, estimate based on FAO and EM-DAT data), rice crops are at high risk due to disasters. Moreover, a few flood damage models for rice exist, allowing us to compare the performance of models based on different approaches.
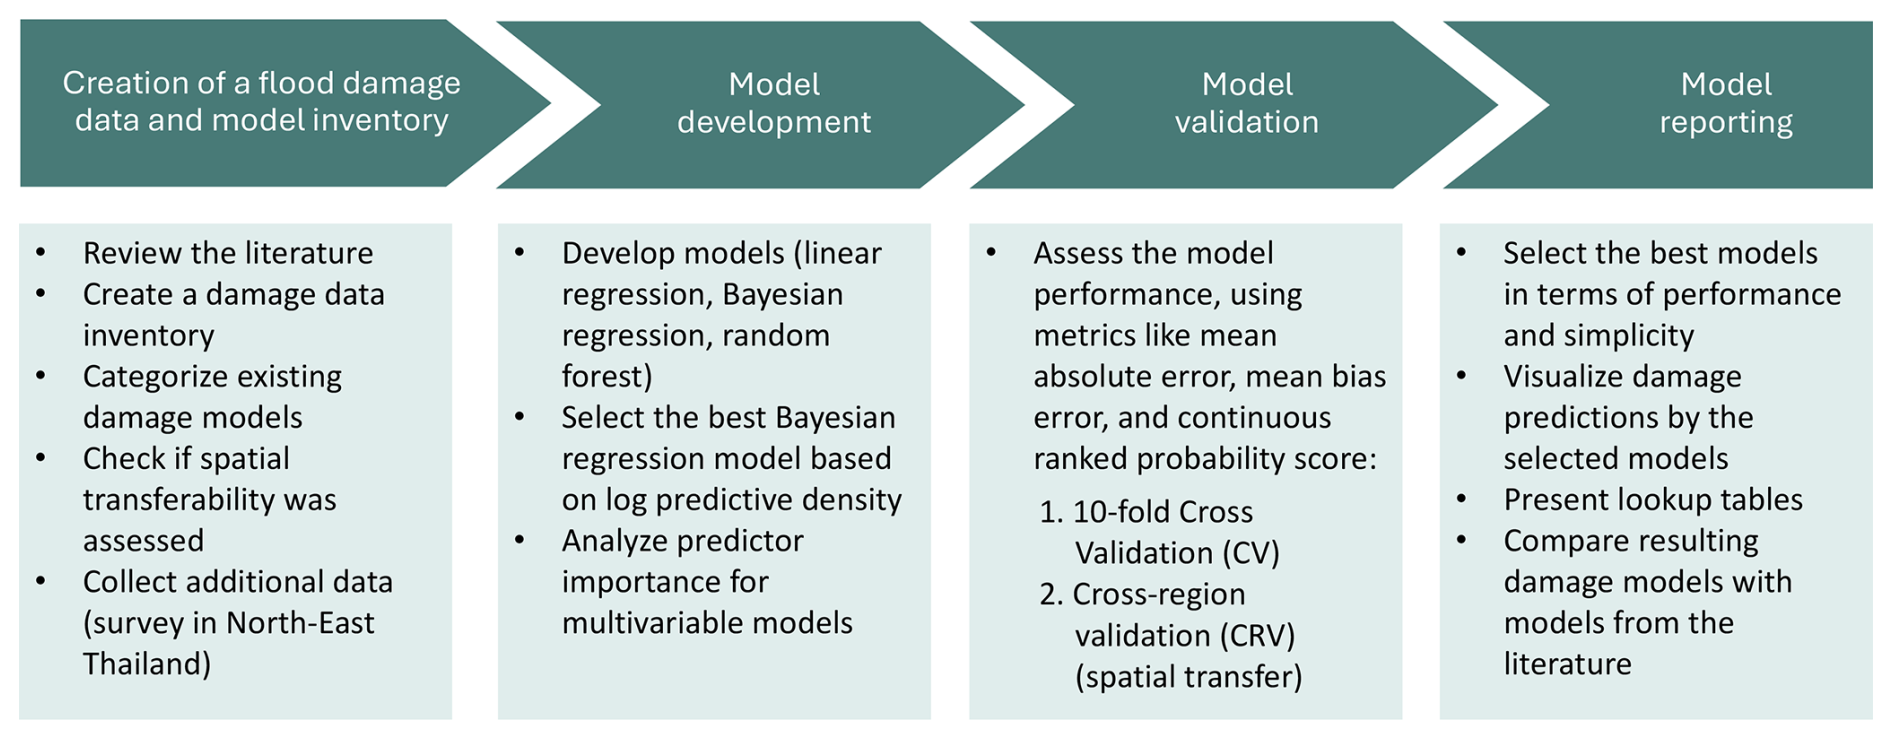
Figure 2Methodological framework Crop-Loss-X for damage model development and validation for the agricultural sector through machine learning & model transferability assessments.
Figure 2 presents the methodological framework, which includes (1) the creation of a flood damage data and model inventory for rice, (2) the development of machine learning and statistical flood damage model for rice, (3) model validation (10-fold cross-validation and cross-region validation), and (4) model reporting. We call the crop loss modeling framework Crop-Loss-X, where “X” stands for next-generation modeling approaches – such as machine learning and probabilistic methods – and cross-regional learning.
In this study, flooding refers to excessive water accumulation in a field that causes unintended submergence of plants – when part or all of the shoot (the aboveground portion) is underwater (Kim et al., 2024). Since paddy fields are routinely submerged during parts of the growth cycle, this definition differs from that of the Intergovernmental Panel on Climate Change (2022), which describes flooding as water overflowing natural boundaries or accumulating in normally dry areas. The study focuses on the vulnerability of rice plants to submergence. We disregard other causes of water-related yield loss like waterlogging (when the soil becomes overly saturated with water), lodging (when heavy rain or strong winds displace the shoots), pests and diseases (Kim et al., 2024), saltwater intrusion, and water pollution.
The Crop-Loss-X framework (Fig. 2) outlines the steps for developing and validating damage models for crops.
2.1 Data for the model development
As a preparatory step before model development, we gathered flood damage data for rice from scientific and grey literature. In the next step, we extended the review to non-academic publications and compiled a table of existing flood damage models for rice (Table S1). To develop new flood damage models for rice, we combined the three datasets presented in Table 1.
Table 1Flood damage datasets for rice used for the model development, including the variables relative yield loss, water depth, flood duration, and growth stage.
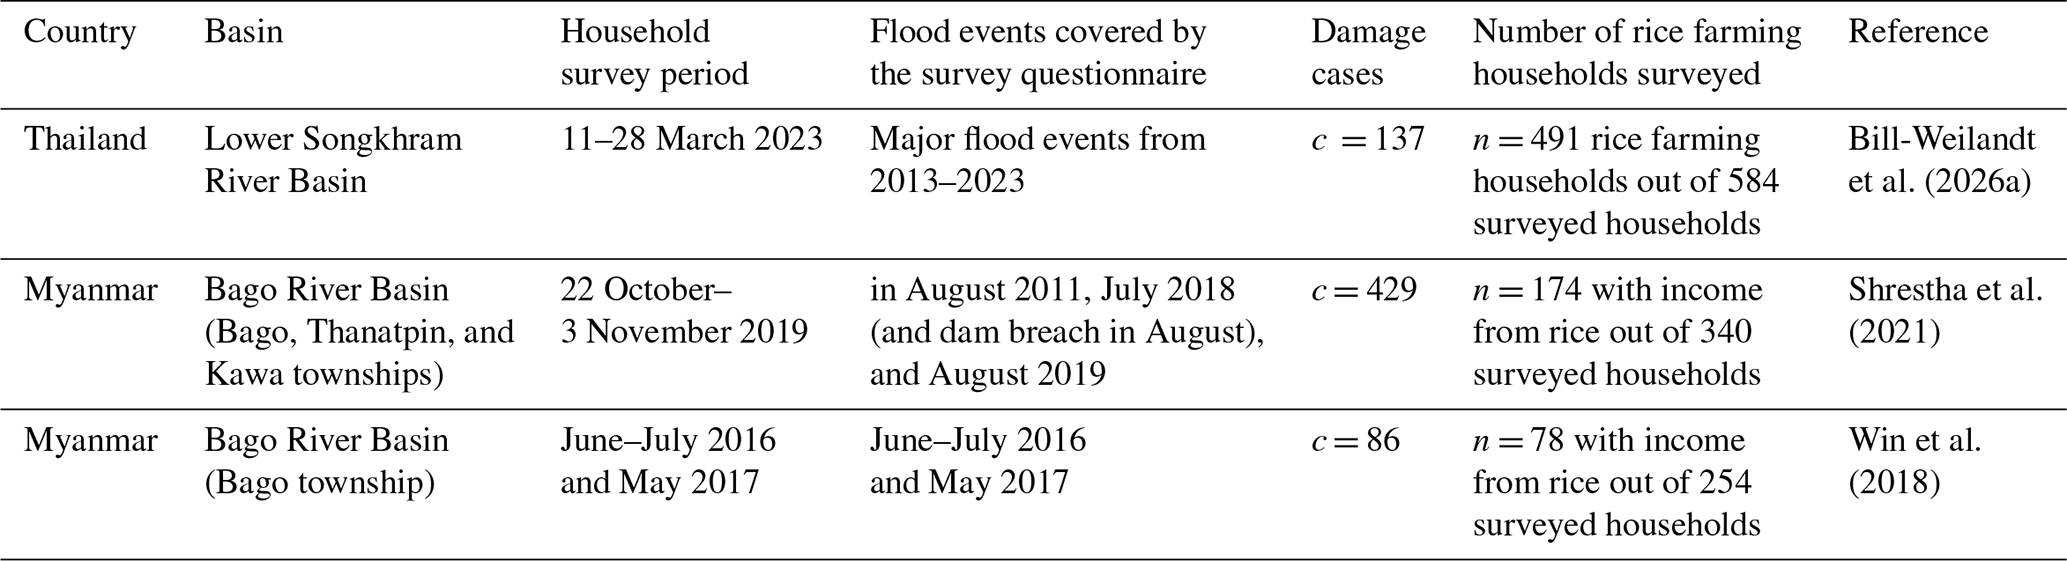
We used survey-based flood damage data published by Shrestha et al. (2021), including four key variables: relative yield loss, water depth, flood duration, and growth stage. This dataset was complemented with additional data from the same basin in Myanmar (Win et al., 2018). These were the only publicly available datasets that included all four variables and were suitable for developing predictive models.
In addition to the secondary datasets, we conducted a household survey among farmers in Northeast Thailand to collect flood damage data concerning rice. The survey data collected in Thailand are comparable to those from Myanmar. We interviewed 584 households (20 % of the 2904 total) in the Lower Songkhram River Basin in March 2023, exceeding the minimum sample size for a 95 % confidence level (see a map in Fig. S1 and Tables S2–S3 for details on the data collection). The methodology of the household survey conducted from 11–28 March 2023, is described in detail in the Supplement (Sect. S1.2). The data used for the model development is publicly available (Bill-Weilandt et al., 2026a).
In the Lower Songkhram River Basin in Northeast Thailand, over 80 % of households earn income from rice farming. Located in the Mekong River Basin near the Lao PDR border, the area often experiences flood-related rice yield losses. On 15 May 2020, it was designated Thailand's 15th Ramsar site for its rich biodiversity and vital ecosystem services. The site includes wetlands, the nearly 100 km long Lower Songkhram River, floodplains, and marshlands, surrounded by paddy fields (Ramsar, 2019).
In the Bago River Basin in Southern Myanmar, paddy fields account for about half of the sown area. The 331 km long Bago River is used for hydropower generation, irrigation, and fishing (Win et al., 2018). Hosting over 20 000 migratory waterbirds, the Moeyungyi Wetland Wildlife Sanctuary, located west of the Bago River Basin, between the Waw Township and the Bago Township, was declared a Ramsar site in 2004 (Ramsar Site Information Service, 2004). Win et al. (2018) interviewed 254 households, and Shrestha et al. (2021) interviewed 340 households in the downstream area of the Bago River Basin. The downstream part of the basin is flat (with an elevation below 10 m) in contrast to the hilly upstream parts (with an elevation of 50–750 m) (Shrestha et al., 2021).
2.2 Model development
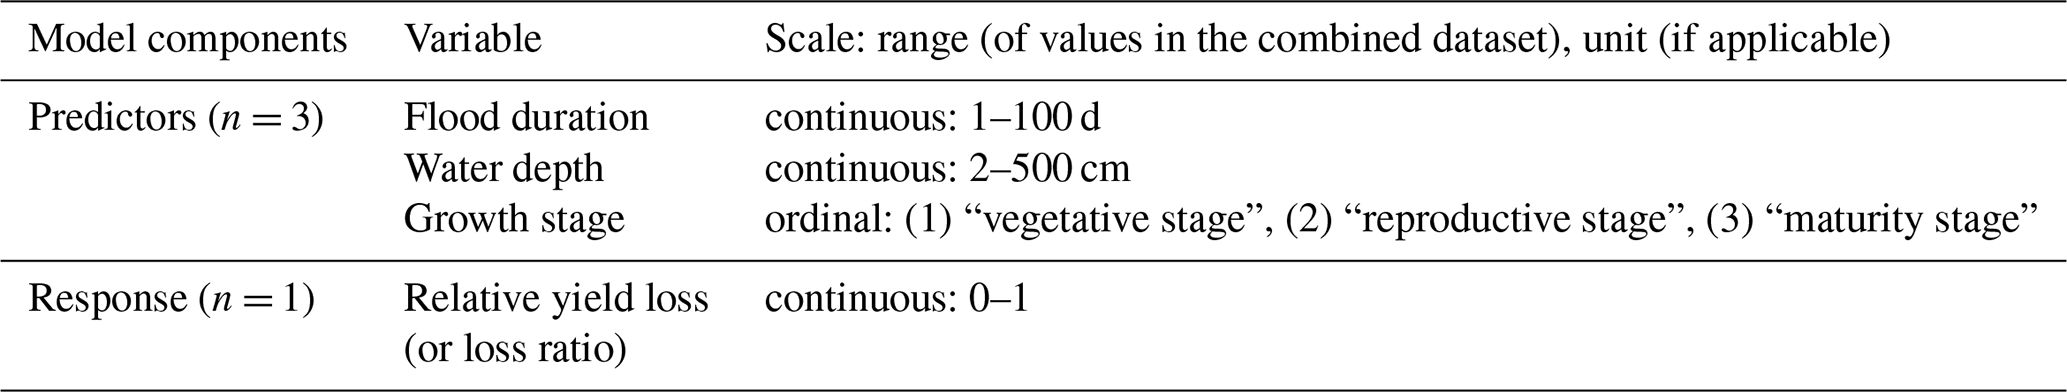
Each of the three selected datasets contains three predictor variables (flood duration, water depth at the flood location, and plant growth stage) and a response variable (relative yield loss), describing the share of yield lost from 0 (no yield loss) to 1 (total yield loss, Table 2). The considered phenological traits (duration of each plant growth stage and the plant height at each plant growth stage) are similar in the datasets used to develop the models (see Fig. S2).
Table 2Overview of predictor and response variables used for flood damage model fitting. The variables describe flood events reported in the household surveys conducted in Thailand and Myanmar described in Table 1. The ranges indicate the minimum and maximum values reported in the household surveys.
In this study, we develop data-driven models – namely linear regression, Bayesian regression, and Random Forest models – to estimate direct physical flood damage to crops, with rice as an example crop. Each modeling approach is presented in detail in Sect. S2, and formulas are provided in Table 3.
Table 3Overview of flood damage model types evaluated in this study, with relative yield loss ranging from 0 to 100 %. For each new model type, we developed a generalized model trained on the combined data and two localized models (one per region). For comparison with the ramp function, we also trained the localized Myanmar models with a smaller dataset, limited to the Shrestha et al. 2021 data.

Linear regression: In line with similar studies (Merz et al., 2013; Schoppa et al., 2020; Schröter et al., 2014; Wagenaar et al., 2017), the linear regression uses the square root of water depth, which is commonly used as a reference damage model for assessing the value of additional model complexity. The root function has two coefficients α and β. We defined these coefficients by fitting them to the data such that we minimize the error on the training data using the ordinary least-squares method. The formula we used is: relative yield loss = (Wagenaar et al., 2017).
Bayesian regression: Bayesian regression is used to model relative damage using a zero-and-one-inflated beta distribution whose parameters are estimated within a probabilistic framework. Instead of predicting only a single mean value, the Bayesian approach models all distributional parameters including the zero- and one-inflation, position, and precision of the beta distribution as functions of covariates. This multi-parameter formulation allows the regression to capture both the probability of extreme outcomes and the continuous variation in losses simultaneously.
Random Forest: Random Forest was selected because it has performed well in past flood-loss studies (e.g., Merz et al., 2013; Wagenaar et al., 2017) and is suitable for representing non-linear multivariable relationships using relatively small datasets. A Random Forest is a supervised learning algorithm based on an ensemble of regression trees. A regression tree is a set of rules to predict an output value (e.g. damage) based on a set of inputs (e.g. water depth and growth stage). These regression trees can be generated from historical data on input - output combinations using the method of (Breiman, 2001). Each tree in the Random Forest is based on a subset of historical data, which is resampled for each tree. The individual trees each predict one output value and, as such, the method provides a probabilistic distribution of damage prediction. More details on Random Forests can be found in the Supplement (Sect. S2.1).

Figure 3Visualization of the model development and validation steps. The figure highlights key findings from the literature review that informed the methodological framework. Household survey data were used to develop different models; for each model category, four modeling approaches (boxes with solid lines) were applied. In addition, results were compared against the benchmark ramp function for Myanmar created by Shrestha et al. (2021, box with dashed line). Three model validation steps were defined. In each step, the same three performance metrics were used.
For each model type, we developed one generalized model using the combined dataset and one localized model for each region (Myanmar or Thailand). To evaluate model performance against the current standard in the literature, we included the most recently published ramp functions based on empirical data from Myanmar (Shrestha et al., 2021), and retrained our models on the same dataset to allow direct comparison. Figure 3 provides an overview of the developed models and validation steps.
2.3 Model validation
We evaluated model performance following the four model validation steps shown in Fig. 3. First, we conducted 10-fold cross-validation (CV) (Fig. S3) to assess predictive accuracy. For the 10-fold CV, we randomly split the observed rice yield loss data into ten folds of roughly the same size. Each fold served as a validation set for a model that was fitted with the remaining observations in the training set (James et al., 2013). Second, we tested model transferability across locations, also referred to as cross-region validation (CRV), by training the models on damage data from region A and validating them on data from region B. Third, we tested the performance of the generalized models in each region as part of the 10-fold CV. In this step, we used all observations per left-out fold from one region for the validation and calculated mean performance metrics across the 10 folds. Fourth, the models trained on the Shrestha et al. (2021) data from Myanmar were compared with the ramp functions by Shrestha et al. (2021). After the validation, leave-nothing-out (LNO) models were trained on the full dataset for future application. Table 4 summarizes the calibration and validation strategies for each model type. Performance was assessed using three established metrics: mean absolute error (MAE), mean bias error (MBE), and continuous ranked probability score (CRPS). These allow for comparison across deterministic and probabilistic models and align with prior flood damage modeling studies (e.g., Schoppa et al., 2020). Full definitions and formulas of the performance metrics are provided in the Supplement (Sect. S3). By examining how performance metrics vary across folds in the 10-fold CV, we gained insights into the stability and robustness of the models. Low variability (tightly clustered errors) indicates model stability, while high variability (widely spread errors) indicates model instability, meaning that the model is not generalizing well.
Table 4Overview of performance evaluation approaches. The table presents the model category (either generalized or localized model), the data used to fit the model (calibration), and the data used to assess the performance (validation). It further describes the approach used, including 10-fold CV, Leave-nothing-out (LNO) (creation of models trained with all the data for use in future risk assessments), and cross-region validation (CRV). Finally, the use case of each model type is mentioned. The models highlighted with an asterisk are available on GitHub (see Data Availability Statement).

We also assessed predictor importance for the multivariable models, based on the unconditional computation of the importance using the R function partykit::varimp. For the Bayesian Regression Model, predictor relevance was derived from posterior coefficient distributions (see Sect. S2.2).
3.1 Summary statistics of the damage data used for the model development
Figure 4 presents the kernel density estimations of the variable distributions for the datasets from Myanmar (n = 515) and Thailand (n = 137). In the Myanmar dataset, flood duration and water depth are more concentrated than in the Thailand dataset. In Myanmar, yield loss occurred primarily in the vegetative stage (255 cases), followed by the reproductive stage (88) and the maturity stage (29). In Thailand, yield loss primarily occurred in the reproductive stage (88 cases), followed by the maturity stage (29) and the vegetative stage (20). The kernel density estimations were computed using the default Gaussian kernel in the R stats::density function to produce the violin plot visualization.

Figure 4Kernel density estimations of the variable distributions for the Myanmar and Thailand datasets, with lines representing the quartiles and the dots showing the mean. Continuous variables were scaled to the range [0;1] and integers were assigned to each growth stage [(1) “vegetative stage”, (2) “reproductive stage”, (3) “maturity stage”].
3.2 Model performance
For each metric, this study examined model performance based on two criteria: firstly, based on local data (using testing data from the same region, where the training data originated from) in a 10-fold CV (boxplots in Fig. 5), and, secondly, in a CRV (shapes in the localized model columns of Fig. 5; Sect. 3.4). The performance of generalized models in a specific region was assessed by separately calculating the performance for the observations per region in the left-out folds of the 10-fold CV (shapes and thin boxplots in the left column of Fig. 5). A detailed summary of the model performance assessment is provided in Table S6. This subsection presents the performance of the generalized models based on the first criterion (Sect. 3.2.1) and compares their performance with the ramp functions (Sect. 3.2.2).

Figure 5Results of performance evaluation and transferability assessment. Results are shown for three performance metrics (rows) and four calibration setups (generalized, localized trained on Thailand data and Myanmar data, and localized trained on Myanmar data by Shrestha et al., 2021) (columns). Colors indicate the model types (RF, BRM, probabilistic SDF, and deterministic SDF). Boxplots show the 10-fold cross-validation results. The thick lines show the median; boxes represent the interquartile range (IQR); whiskers extend to 1.5 × IQR; and black points are outliers. Each box summarizes variability across 10 folds. For localized models, shapes indicate the performance of transferred models (CRV). For generalized models, shapes indicate mean performance metrics from local validation across ten folds, and the thin boxplots summarize variability in the local validation across the 10 folds. The lines mark the mean performance of the benchmark ramp function in Myanmar (solid red line) and in Thailand (dashed blue lines).
3.2.1 Performance of the generalized models in a 10-fold cross-validation
We evaluated four model types: deterministic Stage-Damage Function (SDF), probabilistic SDF, Bayesian Regression Model (BRM), and Random Forest (RF) model, using generalized (cross-regional) training data. Model performance was assessed using Mean Absolute Error (MAE), Mean Bias Error (MBE), and Continuous Ranked Probability Score (CRPS). Figure 5 summarizes the results. Figure S7 in the Supplement presents a comparison of predicted and observed relative yield loss for randomly sampled farms.
Among the generalized models, RF achieved the best performance in a 10-fold CV conducted with a joint dataset combining observations from Myanmar and Thailand:
-
MAE: RF had the lowest error (20.3 %), followed by BRM (22.3 %), probabilistic SDF (24.4 %), and deterministic SDF (26.3 %).
-
MBE: All models showed low bias, with RF (0.1 %) having the lowest bias, followed by BRM (0.2 %), deterministic SDF (0.4 %), and probabilistic SDF (0.5 %).
-
CRPS: RF also achieved the lowest CRPS (12.4 %), indicating stronger probabilistic prediction performance than the BRM (14.2 %) and the probabilistic SDF (15.4 %).
In the 10-fold CV for generalized models, model complexity improved performance consistently: multivariable models (RF and BRM) outperformed the simpler univariable SDFs. Moreover, model complexity reduced the range of the MBE observed in the CV. These gains in accuracy suggest that incorporating multiple flood characteristics – more precisely, water depth, duration, and growth stage – enhances prediction quality.
3.2.2 Comparison of the new models with the ramp functions from the literature
To benchmark model performance, we compared the new models against the ramp functions from Shrestha et al. (2021), which were developed for rice in Myanmar. When tested on the full dataset (Myanmar + Thailand), the ramp functions yielded an MAE of 23.3 % and an MBE of 5.3 %.
Compared to this baseline:
-
RF and BRM reduced the MAE by 6 % and 4 %, respectively.
-
All new models showed significantly lower bias, with bias reductions ranging from 4.8 (RF) to 3.5 (deterministic SDF) percentage points compared to the ramp functions.
-
The deterministic and probabilistic SDF had a slightly higher MAE (+3.5 and +2 percentage points, respectively), indicating limitations when excluding duration and growth stage.
To enable a more direct comparison with the ramp functions, we also trained all models using only the Shrestha et al. (2021) dataset. The findings from comparing the ramp functions with the mean performance metrics obtained from a 10-fold CV are summarized below and presented in detail in the Supplement (Table S7). In this restricted setting:
-
The MAE for RF and BRM converged with that of the ramp functions (around 23 %).
-
Both SDFs performed worse (MAE = 28.4 %).
-
All new models exhibited lower bias (MBE of 0.0 %–1.0 %) than the ramp functions (MBE = 3.2 %).
This confirms that while point prediction accuracy can be similar, the new models – especially RF and BRM – offer improved calibration and flexibility, particularly for regional or large-scale applications where reducing systematic bias is critical for accurate loss estimation.
3.3 Predictor importance in the Random Forest
We assessed predictor importance in the generalized and localized RF models to understand which variables most strongly influence predicted relative yield loss (Fig. 6). Importance values reflect the overall contribution of each predictor (water depth, flood duration, and growth stage) to model performance (Hothorn and Zeileis, 2023). Additionally, we also assessed the BRM coefficients (Fig. S6).
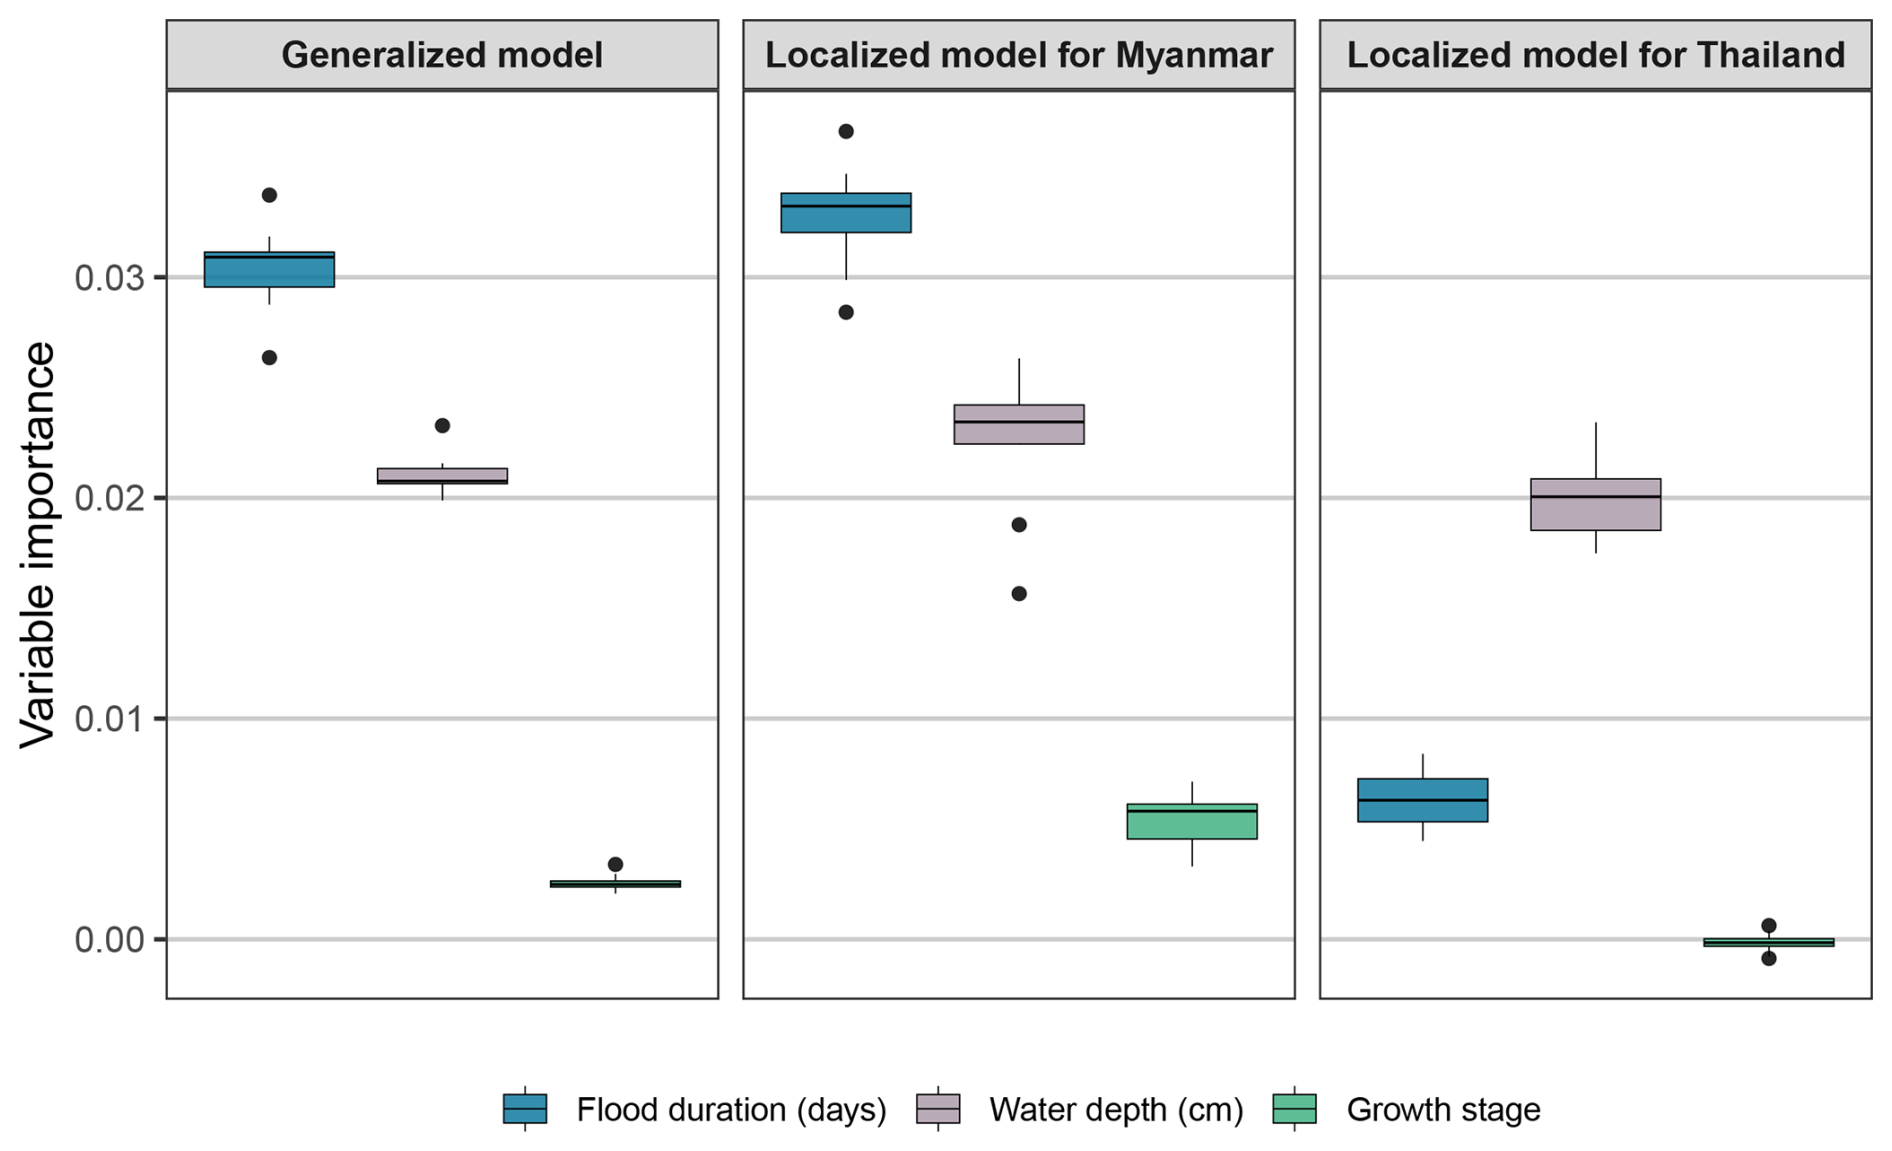
Figure 6Box plots indicating the predictor importance for the generalized and localized RF models. Each boxplot shows the median (thick horizontal line), the interquartile range (IQR), the most extreme values within 1.5 × IQR (whiskers), and outliers (black points).
In the generalized RF model and the localized model for Myanmar, flood duration emerged as the most important predictor, followed by water depth. Growth stage contributed the least. In contrast, the localized RF model for Thailand ranked water depth highest, with flood duration playing a secondary role. Growth stage showed almost no importance in the Thailand model.
These differences likely reflect regional and dataset-specific factors. The Myanmar dataset includes flood events across a wider range of growth stages and more variability in flood timing, which may explain the greater role of duration. In Thailand, floods tended to occur during a narrower window in the reproductive stage, reducing the influence of the growth stage as a predictor. In addition, Thailand's landscape includes greater elevation differences, and the dataset captures a wider range of water depths, likely increasing the relative importance of water depth in that model.
Despite these insights, some expected relationships (shorter floods and lower water depths leading to less severe losses) were not consistently observed. This may be due to the limited number of predictor variables collected. Other relevant factors – such as rice variety, water turbidity, pest or disease pressure, plant health, and floodwater rise rate – were not included in the surveys but could influence outcomes. The growth stage variable disregards variability in the plants' vulnerability to flooding within a growth stage – further investigation would be needed to confirm if this can explain the low importance of growth stage in the model trained on the Myanmar dataset (which shows variability in growth stages). The skewed nature of the Thailand dataset, which overrepresents high-damage events, may also affect predictor importance.
3.4 Transferability of flood damage models
Understanding the performance of flood damage models under transfer is essential for practical risk assessment in data-scarce contexts. We assessed the performance of generalized models (10-fold CV) and localized models (cross-region validation) in Thailand and Myanmar. Figure 5 shows the performance of transferred models (points for validation in Myanmar and triangles for validation in Thailand). Tables S6 and S7 report the performance metrics under transfer. The results provide four key findings, which are further described below:
-
Local models perform better than transferred models; transfer reduces accuracy, especially with skewed training data.
-
Complex models (RF, BRM) generally transfer better than simple ones (including the baseline ramp functions from the literature), but they still lose performance without representative damage data.
-
The direction of bias matters: overprediction may lead to high insurance costs; underprediction may leave risks underestimated.
-
Generalized models can work across regions if trained on diverse data that captures relevant damage processes.
Local models outperform transferred models. In Myanmar, the worst-performing localized model for Myanmar (SDF-det) outperforms the best-performing transferred localized model for Thailand (SDF-prob). The same holds for Thailand, where the simplest localized model (SDF-det) outperforms the best complex transferred model trained in Myanmar (RF). The MAEs of the worst-performing Myanmar-trained model and the best-performing TH-trained model differ by 11.4 percentage points, which can lead to considerable differences in the loss estimates. This highlights the importance of assessing model performance and transferability.
Complex models (RF, BRM) generally transfer better than simple ones, but they still lose performance in the absence of representative damage data. The deterministic SDF loses the most predictive accuracy when transferred. The deterministic SDFs are unable to capture complex, nonlinear interactions, which makes them less applicable to new contexts with different conditions from the data they are trained on. To enable a direct comparison of the new models with the ramp functions, we also tested the transferability of the new models trained only on the Shrestha et al. (2021) dataset. In this restricted setting, all new models except for the deterministic SDF outperformed the Shrestha et al. (2021) ramp functions in terms of MAE (Fig. 5 and Table S7).
Model transferability suffers when training data is skewed and does not comprehensively represent local damage characteristics. The models trained on Thailand data show poor transferability to Myanmar, with MAEs of 27 %–29 % and over 50 % for low-loss events (Fig. S8) – regardless of the model type. Focusing on major flood events, the survey data collected in Thailand were skewed toward extreme events, which resulted in a lack of low-loss cases. Even the best ML algorithm cannot perform well without data that captures relevant local damage processes. Broader data coverage would improve performance in transfer settings such as in Myanmar, as well as for predicting yield loss from small floods in Thailand.
The direction of the bias should be considered in spatial transfers; it differs depending on model type and flood characteristics (Figs. 5 and S8). In the present study, the localized Myanmar BRM tends to overestimate yield losses in Thailand, while the simple Myanmar models (SDF-det and SDF-prob) tend to underestimate yield losses – the RF has a low bias (Fig. 5). All models tend to overpredict losses concerning low-impact events. Models trained in Myanmar and validated in Thailand tend to underpredict losses from short floods and shallow water depth. In contrast, models trained in Thailand and validated in Myanmar show the reverse trend; they overpredict losses under these conditions (Fig. S8). Overprediction may lead to high insurance costs, while underprediction may lead to insufficient allocation of disaster response resources.
Generalized models perform well across regions if trained on sufficient data. They outperformed transferred models on all three performance metrics (MAE, MBE, and Mean CRPS). The spread of the MAEs of the generalized BRM across ten folds is smaller in the model validation in Myanmar than in Thailand, indicating less stable results in Thailand (thin boxplots in the “generalized models” column in Fig. 5). The generalized models perform better in Thailand than in Myanmar, likely because the Thailand dataset contains fewer low-loss cases for which the model predictions are less accurate. For floods resulting in smaller losses, all generalized models tend to overpredict the loss (Fig. S8).
Limitations in the spatial transfer analysis were the difference in sample size of the datasets for each region and a small number of regions considered (n = 2). The transferred models show a considerable error, which could result from uncertainty in the historical data, a limited total sample size (n = 652), a skewed Thailand dataset (towards high losses), and the lack of variables that capture potentially critical damage processes in the model.
3.5 Reporting of flood damage models for rice
We created an inventory of flood damage models for rice, based on both peer-reviewed and grey literature, expanding the compilation by Shrestha et al. (2021). This inventory provided context for the development of more flexible, multivariable, and probabilistic approaches presented in this study, and it highlighted the lack of transferability assessments. Figure 7a presents a selection of damage models from the inventory. The majority are deterministic stage-damage functions that relate percentage yield loss to water depth using simplified threshold or ramp functions, often for different duration classes.

Figure 7Flood damage models for rice. The figure presents predictions by selected models from the literature ((a), see Table S1) and from the generalized models developed in this study, including the deterministic and probabilistic SDF (b–c) and two probabilistic, multivariable models: Bayesian Regression Model (d) and Random Forest (e). Solid lines represent the median prediction of the BRM and the mean prediction from the ensemble of trees in the RF; shaded ribbons show the interquartile range (25th to 75th percentile).
To support the practical application of our damage models in agricultural flood risk assessments, we present the outputs (Fig. 7b–e) and lookup tables (Tables S8–S11) for the generalized models: the deterministic and probabilistic stage-damage functions (SDF-det and SDF-prob), the Bayesian Regression Model (BRM), and the Random Forest (RF) model. Lookup tables for the generalized models developed in this study are presented in the inventory (Bill-Weilandt et al., 2026a) and Tables S8–S11. Generalized and localized models are provided for use in flood damage assessments in rice-cultivating regions (see Data Availability Statement).
3.5.1 Stage-damage functions (SDF-det and SDF-prob)
Figure 7b and c shows predictions from the deterministic and probabilistic versions of the stage-damage function (SDF). Both models are univariable and rely on water depth as the sole predictor. The SDFs predict a smooth, gradual increase in relative yield loss with increasing water depth. The deterministic SDF shows a steeper increase of relative yield loss at lower water depth and reaches complete loss at 3.15 m. In contrast, the probabilistic SDF shows a steeper increase at higher water depths, predicting complete loss at 1.40 m (median), while reaching complete loss at 2.03 m is also plausible based on the 25th percentile.
While less accurate (higher MAE and MBE) and flexible than multivariable models, the SDFs are simple to apply and useful in data-scarce contexts. Lookup tables for the SDFs are provided in Tables S8 and S9.
3.5.2 Bayesian Regression Model (BRM)
Figure 7d shows predictions from the BRM, a multivariable, probabilistic model using water depth and flood duration as predictors, disaggregated by growth stage. The model estimates encompass not only expected median yield loss (line) but also the uncertainty around predictions (25th–75th percentile ribbon).
The BRM indicates that young rice plants are more vulnerable to flooding than more mature ones. As plants grow taller and reach advanced growth stages, yield loss increases more gradually with increasing water depth, and complete loss occurs at greater water depth.
-
Vegetative stage: Complete loss occurs at relatively shallow water depths – a 4 d flood at 1.4 m depth or a 27 d flood at 1.0 m.
-
Reproductive stage: Higher tolerance is observed, with complete loss reached after a 4 d flood at 1.72 m or a 27 d flood at 1.49 m.
-
Maturity stage: This is the most resilient stage, where complete loss occurs only at water depths exceeding 2 m – after a 4 d flood at 2.18 m or a 27 d flood at 2.00 m.
These findings highlight the combined influence of water depth, duration, and growth stage on yield loss, and indicate that even short-duration floods can lead to total yield loss in the vegetative stage. Reasons for the low loss in the maturity stage include the plant height and the possibility of early harvest to mitigate yield losses. By providing a distribution of possible predictions, probabilistic models like the BRM make uncertainty in the loss estimates visible and capture unlikely extreme events. Lookup tables for the BRM are provided in Table S10.
3.5.3 Random Forest model (RF)
Figure 7e shows predictions from the RF model, a non-parametric ensemble method that captures complex nonlinear relationships and interactions between predictors.
-
The RF predicts stepwise increases of the relative yield loss with rising water depth, shown by flat segments followed by sharp increases of the damage curve, reflecting the tree-based model structure; it partitions the predictor space into discrete regions rather than fitting continuous functions.
-
Across all growth stages, yield loss tends to plateau at a similar water depth (∼ 2 m). In contrast to the BRM (where all curves plateau at complete loss), the RF curves for shorter flood durations plateau at lower relative yield loss.
-
The maximum relative yield loss increases with longer durations and decreases with advanced growth stages; it is the highest in the vegetative stage (95 %), followed by the reproductive stage (94 %), and lowest in the maturity stage (88 %).
-
The maximum relative yield loss slightly increases with growth stage, and slightly decreases with later growth stages, indicating that more mature plants are more resilient.
-
Greater variability in the predictions is observed at water depths above 2 m, as indicated by the wider interquartile range.
While the RF model achieved the highest predictive accuracy overall (lowest MAE), it is more difficult to interpret and communicate than SDF and BRM models. Lookup tables for the RF model are provided in Table S11.
3.5.4 Summary and practical application
Each model provides distinct advantages depending on the intended application:
-
SDF-det and SDF-prob are simple, interpretable, and suitable for settings with limited data.
-
BRM offers transparency, probabilistic outputs, and robust performance, making it appropriate for informed policy planning.
-
RF provides high predictive accuracy and captures complex nonlinear effects, best suited for data-rich applications.
The accompanying lookup tables enable rapid, non-technical application of these models for insurance pricing, disaster risk assessment, and climate adaptation planning. Users may select a model based on available inputs, intended use, and the required level of interpretability.
Existing flood damage models for rice remain limited in flexibility, generalizability, and probabilistic prediction capability. This study presented an inventory comprising 20 flood damage models for rice from 12 countries, which highlighted limitations of current flood damage models for rice. We introduced the Crop-Loss-X framework for developing and validating flood damage models for crops, which was applied to rice in this study. We built and evaluated a suite of flood damage models for rice, including Random Forest (RF) and Bayesian Regression Models (BRM) as well as simpler, deterministic and probabilistic stage-damage functions for data-scarce contexts. For each of these modeling approaches, we fit generalized models (trained on data from multiple regions) and localized models (trained on data from one region) and tested their spatial transferability. The models are made available for future applications. Our findings highlight that, among the generalized models, the RF model performs best, followed by the multivariate BRM. The results indicate that each model provides unique strengths depending on the use case: Excelling in predictive power and modeling complex nonlinear relationships, RF models are best suited to data-rich applications. BRM are easier to interpret than RF models, tend to provide stronger probabilistic outputs on smaller datasets than RF and stage-damage functions (as shown by the mean CRPS in the localized model validation), making them appropriate for evidence-based flood risk management policymaking. The simple stage-damage functions with water depth as the only predictor are easy to interpret and ideal for contexts where data availability is limited.
This study also provides a systematic investigation of transferability of rice damage models across regions. We find limited transferability of localized models across regions, especially when data are skewed. RF models show the most consistent performance, making them the most reliable for cross-regional applications, especially when aiming for a low bias in large-scale assessments. In contrast, BRM and deterministic SDF exhibit higher bias and error, highlighting the challenges of transferring them. The direction of bias matters: Overprediction may lead to over-preparedness, and underprediction may leave risks underestimated.
Expanding the datasets to include more variables and a broader spectrum of flood characteristics (from in-situ measurements or flood models) would provide insights into additional damage processes. This could improve performance as well as transferability and address open questions regarding the variable importance in the RF models. Future studies could investigate whether model ensembles, e.g. Bayesian model averaging (Huang and Merwade, 2023), yield higher performance scores than single flood damage models for rice. While we apply Crop-Loss-X to rice, it could be applied to other crops and regions in the future. A global inventory of available flood damage data categorized by crop and country would be necessary to scale up crop-specific, multi-variable models developed and validated using the Crop-Loss-X framework.
The inventory of flood damage models and data for rice is published (https://doi.org/10.21979/N9/OZGWXE, Bill-Weilandt et al., 2026a). The inventory file includes lookup tables for models from the literature and models developed in this paper. The generalized models and localized models for Thailand and Myanmar built in this paper are available on GitHub https://github.com/ntu-dasl-sg/flood_damage_models_rice (last access: 3 February 2026) (https://doi.org/10.5281/zenodo.18472496, Bill-Weilandt et al., 2026b). We used the varimp function from the partykit package in R to measure variable importance (https://doi.org/10.32614/CRAN.package.partykit, Hothorn and Zeileis, 2023).
The supplement related to this article is available online at https://doi.org/10.5194/nhess-26-925-2026-supplement.
Alina Bill-Weilandt: Conceptualization, data curation, formal analysis (lead), writing – original draft preparation, funding acquisition. Nivedita Sairam: Methodology, formal analysis (supporting), writing – reviewing & editing. Dennis Wagenaar: Methodology, writing – review & editing. Kasra Rafiezadeh Shahi: Methodology. Heidi Kreibich: Writing – reviewing & editing, supervision. Perrine Hamel: Writing – review & editing, supervision. David Lallemant: Conceptualization, writing – review & editing, supervision, funding acquisition. All authors read and approved the final manuscript.
At least one of the (co-)authors is a member of the editorial board of Natural Hazards and Earth System Sciences. The peer-review process was guided by an independent editor, and the authors also have no other competing interests to declare.
Publisher's note: Copernicus Publications remains neutral with regard to jurisdictional claims made in the text, published maps, institutional affiliations, or any other geographical representation in this paper. The authors bear the ultimate responsibility for providing appropriate place names. Views expressed in the text are those of the authors and do not necessarily reflect the views of the publisher.
We thank the Stockholm Environment Institute Asia (Parichat Pinsri, Ridhi Saluja, Thanapon Piman, and Niall O'Connor), the Asian Institute of Technology (Ho Huu Loc), Nakhon Phanom University, and Nanyang Technological University (Fernando, Indraneel Kasmalkar, Aishah Kasmadi, and Mary Lim Gim Hong) for supporting the project. We are grateful for the input provided by Shelly Win on the interpretation of the damage dataset for Myanmar and for feedback on Fig. 3 from the research group “Adaptation in Agricultural Systems” at the Potsdam Institute for Climate Impact Research. ChatGPT, version GPT-4.0, was used to improve the clarity and readability of this article.
This research has been supported by the Ministry of Education, Singapore, under its NTU Singapore International Graduate Award and its MOE AcRF Tier 2 Award MOE-T2EP50222-0016 and MOE AcRF Tier 3 Award MOE2019-T3-1-004. ABW's research is supported by the Dr. Stephen Riady Geoscience Scholars Fund. NS is funded by the project HI-CliF (grant no. 01LN2209A) by the BMFTR. This study has been supported by the National Research Foundation, Prime Minister’s Office, Singapore under the NRF-NRFF12-2020-0009 award.
This paper was edited by Animesh Gain and reviewed by four anonymous referees.
Apel, H., Aronica, G. T., Kreibich, H., and Thieken, A. H.: Flood risk analyses–how detailed do we need to be?, Nat. Hazards, 49, 79–98, https://doi.org/10.1007/s11069-008-9277-8, 2009.
Bill-Weilandt, A., Sairam, N., Wagenaar, D., Rafiezadeh Shahi, K., Kreibich, H., Hamel, P., and Lallemant, D.: Data for “Flood damage functions for rice: synthesizing evidence and building data-driven models”, DR-NTU [data set], https://doi.org/10.21979/N9/OZGWXE, 2026a.
Bill-Weilandt, A., Sairam, N., Wagenaar, D., Rafiezadeh Shahi, K., Kreibich, H., Hamel, P., and Lallemant, D.: Models for “Flood damage functions for rice: synthesizing evidence and building data-driven models”, Zenodo [code], https://doi.org/10.5281/zenodo.18472496, 2026b.
Breiman, L.: Random Forests, Machine Learning, 45, 5–32, 2001.
Brémond, P., Grelot, F., and Agenais, A.-L.: Review Article: Economic evaluation of flood damage to agriculture – review and analysis of existing methods, Nat. Hazards Earth Syst. Sci., 13, 2493–2512, https://doi.org/10.5194/nhess-13-2493-2013, 2013.
Brémond, P., Agenais, A.-L., Grelot, F., and Richert, C.: Process-based flood damage modelling relying on expert knowledge: a methodological contribution applied to the agricultural sector, Nat. Hazards Earth Syst. Sci., 22, 3385–3412, https://doi.org/10.5194/nhess-22-3385-2022, 2022.
Budhathoki, A., Tanaka, T., and Tachikawa, Y.: Developing flood risk curves of agricultural economic damage under climate change in the Lower Chao Phraya River Basin, Thailand, J. Flood Risk Management, 17, e13031, https://doi.org/10.1111/jfr3.13031, 2024.
Davis, B., Mane, E., Gurbuzer, L. Y., Caivano, G., Piedrahita, N., Schneider, K., Azhar, N., Benali, M., Chaudhary, N., Rivera, R., Ambikapathi, R., and Winters, P.: Estimating global and country-level employment in agrifood systems, Food and Agriculture Organization of the United Nations (FAO), Rome, Italy, https://doi.org/10.4060/cc4337en, 2023.
de Moel, H., Asselman, N. E. M., and Aerts, J. C. J. H.: Uncertainty and sensitivity analysis of coastal flood damage estimates in the west of the Netherlands, Nat. Hazards Earth Syst. Sci., 12, 1045–1058, https://doi.org/10.5194/nhess-12-1045-2012, 2012.
Dottori, F., Figueiredo, R., Martina, M. L. V., Molinari, D., and Scorzini, A. R.: INSYDE: a synthetic, probabilistic flood damage model based on explicit cost analysis, Nat. Hazards Earth Syst. Sci., 16, 2577–2591, https://doi.org/10.5194/nhess-16-2577-2016, 2016.
Federal Emergency Management Agency (FEMA): Hazus Flood Model Technical Manual 2.1: Multi-hazard Loss Estimation Methodology Flood Model, https://www.fema.gov/sites/default/files/2020-09/fema_hazus_flood-model_technical-manual_2.1.pdf (last access: 11 July 2025), 2020.
Food and Agriculture Organization of the United Nations (FAO): The Impact of Disasters on Agriculture and Food Security 2023 – Avoiding and reducing losses through investment in resilience, Rome, https://doi.org/10.4060/cc7900en, 2023.
Food and Agriculture Organization of the United Nations (FAO), International Fund for Agricultural Development (IFAD), United Nations Children's Fund (UNICEF), World Food Programme (WFP), and World Health Organization (WHO): The state of food security and nutrition in the world 2024: Financing to end hunger, food insecurity and malnutrition in all its forms, FAO, IFAD, UNICEF, WFP, WHO, https://doi.org/10.4060/cd1254en, 2024.
Förster, S., Kuhlmann, B., Lindenschmidt, K.-E., and Bronstert, A.: Assessing flood risk for a rural detention area, Nat. Hazards Earth Syst. Sci., 8, 311–322, https://doi.org/10.5194/nhess-8-311-2008, 2008.
Gerl, T., Kreibich, H., Franco, G., Marechal, D., and Schröter, K.: A Review of Flood Loss Models as Basis for Harmonization and Benchmarking, PLoS ONE, 11, e0159791, https://doi.org/10.1371/journal.pone.0159791, 2016.
Hothorn, T. and Zeileis, A.: partykit: A Toolkit for Recursive Partytioning, CRAN [code], https://doi.org/10.32614/CRAN.package.partykit, 2023.
Hu, T., Zhang, X., Khanal, S., Wilson, R., Leng, G., Toman, E. M., Wang, X., Li, Y., and Zhao, K.: Climate change impacts on crop yields: A review of empirical findings, statistical crop models, and machine learning methods, Environmental Modelling & Software, 179, 106119, https://doi.org/10.1016/j.envsoft.2024.106119, 2024.
Huang, T. and Merwade, V.: Uncertainty Analysis and Quantification in Flood Insurance Rate Maps Using Bayesian Model Averaging and Hierarchical BMA, J. Hydrol. Eng., 28, 04022038, https://doi.org/10.1061/JHYEFF.HEENG-5851, 2023.
Huizinga, J., de Moel, H., and Szewczyk, W.: Global flood depth-damage functions: methodology and the database with guidelines, Publications Office of the European Union, Luxembourg, https://doi.org/10.2760/16510, 2017.
Intergovernmental Panel on Climate Change (IPCC): Climate Change 2022: Impacts, Adaptation, and Vulnerability, Contribution of Working Group II to the Sixth Assessment Report of the Intergovernmental Panel on Climate Change, edited by: Pörtner, H.-O., Roberts, D. C., Tignor, M., Poloczanska, E. S., Mintenbeck, K., Alegría, A., Craig, M., Langsdorf, S., Löschke, S., Möller, V., Okem, A., and Rama, B., Cambridge University Press, Cambridge, UK and New York, NY, USA, 3056 pp., https://doi.org/10.1017%2F9781009325844, 2022.
James, G., Witten, D., Hastie, T., and Tibshirani, R.: An introduction to statistical learning with applications in R, 1st edn., Springer Science+Business Media, New York, USA, 426 pp., https://doi.org/10.1007/978-1-4614-7138-7_1, 2013.
Jongman, B., Kreibich, H., Apel, H., Barredo, J. I., Bates, P. D., Feyen, L., Gericke, A., Neal, J., Aerts, J. C. J. H., and Ward, P. J.: Comparative flood damage model assessment: towards a European approach, Nat. Hazards Earth Syst. Sci., 12, 3733–3752, https://doi.org/10.5194/nhess-12-3733-2012, 2012.
Kim, Y.-U., Webber, H., Adiku, S. G. K., Nóia Júnior, R. D. S., Deswarte, J.-C., Asseng, S., and Ewert, F.: Mechanisms and modelling approaches for excessive rainfall stress on cereals: Waterlogging, submergence, lodging, pests and diseases, Agricultural and Forest Meteorology, 344, 109819, https://doi.org/10.1016/j.agrformet.2023.109819, 2024.
Lazin, R., Shen, X., and Anagnostou, E.: Estimation of flood-damaged cropland area using a convolutional neural network, Environ. Res. Lett., 16, 054011, https://doi.org/10.1088/1748-9326/abeba0, 2021.
Li, Y., Guan, K., Schnitkey, G. D., DeLucia, E., and Peng, B.: Excessive rainfall leads to maize yield loss of a comparable magnitude to extreme drought in the United States, Global Change Biology, 25, 2325–2337, https://doi.org/10.1111/gcb.14628, 2019.
Liu, W., Li, Z., Li, Y., Ye, T., Chen, S., and Liu, Y.: Heterogeneous impacts of excessive wetness on maize yields in China: Evidence from statistical yields and process-based crop models, Agricultural and Forest Meteorology, 327, 109205, https://doi.org/10.1016/j.agrformet.2022.109205, 2022.
Meinshausen, N.: Quantile Regression Forests, Journal of Machine Learning Research, 7, 983–999, 2006.
Merz, B., Kreibich, H., and Lall, U.: Multi-variate flood damage assessment: a tree-based data-mining approach, Nat. Hazards Earth Syst. Sci., 13, 53–64, https://doi.org/10.5194/nhess-13-53-2013, 2013.
Monteleone, B., Giusti, R., Magnini, A., Arosio, M., Domeneghetti, A., Borzì, I., Petruccelli, N., Castellarin, A., Bonaccorso, B., and Martina, M. L. V.: Estimations of Crop Losses Due to Flood Using Multiple Sources of Information and Models: The Case Study of the Panaro River, Water, 15, 1980, https://doi.org/10.3390/w15111980, 2023a.
Monteleone, B., Borzí, I., Bonaccorso, B., and Martina, M.: Quantifying crop vulnerability to weather-related extreme events and climate change through vulnerability curves, Nat. Hazards, 116, 2761–2796, https://doi.org/10.1007/s11069-022-05791-0, 2023b.
Nguyen, N. Y., Kha, D. D., and Ichikawa, Y.: Developing a multivariable lookup table function for estimating flood damages of rice crop in Vietnam using a secondary research approach, International Journal of Disaster Risk Reduction, 58, 102208, https://doi.org/10.1016/j.ijdrr.2021.102208, 2021.
Nhangumbe, M., Nascetti, A., Georganos, S., and Ban, Y.: Supervised and unsupervised machine learning approaches using Sentinel data for flood mapping and damage assessment in Mozambique, Remote Sensing Applications: Society and Environment, 32, 101015, https://doi.org/10.1016/j.rsase.2023.101015, 2023.
Ospina, R. and Ferrari, S. L. P.: Inflated beta distributions, Stat. Papers, 51, 111–126, https://doi.org/10.1007/s00362-008-0125-4, 2010.
Pasquel, D., Roux, S., Richetti, J., Cammarano, D., Tisseyre, B., and Taylor, J. A.: A review of methods to evaluate crop model performance at multiple and changing spatial scales, Precision Agric., 23, 1489–1513, https://doi.org/10.1007/s11119-022-09885-4, 2022.
Penning-Rowsell, E. C. (Ed.): Flood and coastal erosion risk management: a manual for economic appraisal, Routledge, New York, 448 pp., https://doi.org/10.4324/9780203066393, 2013.
Penning-Rowsell, E. C., Johnson, C., Tunstall, S., Tapsell, S., Morris, J., Chatterton, J., and Green, C.: The benefits of flood and coastal risk management: a handbook of assessment techniques, Middlesex Univ. Press, London, 81 pp., ISBN 1904750516, 2005.
Priyatikanto, R., Lu, Y., Dash, J., and Sheffield, J.: Improving generalisability and transferability of machine-learning-based maize yield prediction model through domain adaptation, Agricultural and Forest Meteorology, 341, 109652, https://doi.org/10.1016/j.agrformet.2023.109652, 2023.
Ramsar: Ramsar Information Sheet for Thailand Lower Songkhram River, https://rsis.ramsar.org/RISapp/files/RISrep/TH2420RIS_2004_en.pdf (last access: 20 July 2025), 2019.
Ramsar Site Information Service: Information Sheet on Ramsar Wetlands, Ramsar Site no. 1431, https://rsis.ramsar.org/RISapp/files/RISrep/MM1431RIS.pdf (last access: 8 July 2025), 2004.
Rözer, V., Kreibich, H., Schröter, K., Müller, M., Sairam, N., Doss-Gollin, J., Lall, U., and Merz, B.: Probabilistic Models Significantly Reduce Uncertainty in Hurricane Harvey Pluvial Flood Loss Estimates, Earth's Future, 7, 384–394, https://doi.org/10.1029/2018EF001074, 2019.
Sairam, N., Schröter, K., Carisi, F., Wagenaar, D., Domeneghetti, A., Molinari, D., Brill, F., Priest, S., Viavattene, C., Merz, B., and Kreibich, H.: Bayesian Data-Driven approach enhances synthetic flood loss models, Environmental Modelling & Software, 132, 104798, https://doi.org/10.1016/j.envsoft.2020.104798, 2020.
Schoppa, L., Sieg, T., Vogel, K., Zöller, G., and Kreibich, H.: Probabilistic Flood Loss Models for Companies, Water Resources Research, 56, e2020WR027649, https://doi.org/10.1029/2020WR027649, 2020.
Schröter, K., Kreibich, H., Vogel, K., Riggelsen, C., Scherbaum, F., and Merz, B.: How useful are complex flood damage models?, Water Resources Research, 50, 3378–3395, https://doi.org/10.1002/2013WR014396, 2014.
Scorzini, A. R., Di Bacco, M., and Manella, G.: Regional flood risk analysis for agricultural crops: Insights from the implementation of AGRIDE-c in central Italy, International Journal of Disaster Risk Reduction, 53, 101999, https://doi.org/10.1016/j.ijdrr.2020.101999, 2021.
Shrestha, B. B., Okazumi, T., Miyamoto, M., and Sawano, H.: Flood damage assessment in the Pampanga River basin of the Philippines, J. Flood Risk Manag., 9, 355–369, https://doi.org/10.1111/jfr3.12174, 2016.
Shrestha, B. B., Kawasaki, A., and Zin, W. W.: Development of flood damage functions for agricultural crops and their applicability in regions of Asia, Journal of Hydrology: Regional Studies, 36, 100872, https://doi.org/10.1016/j.ejrh.2021.100872, 2021.
Stiller, S., Grahmann, K., Ghazaryan, G., and Ryo, M.: Improving spatial transferability of deep learning models for small-field crop yield prediction, ISPRS Open Journal of Photogrammetry and Remote Sensing, 12, 100064, https://doi.org/10.1016/j.ophoto.2024.100064, 2024.
Tapia-Silva, F.-O., Itzerott, S., Foerster, S., Kuhlmann, B., and Kreibich, H.: Estimation of flood losses to agricultural crops using remote sensing, Physics and Chemistry of the Earth, Parts A/B/C, 36, 253–265, https://doi.org/10.1016/j.pce.2011.03.005, 2011.
Wagenaar, D., de Jong, J., and Bouwer, L. M.: Multi-variable flood damage modelling with limited data using supervised learning approaches, Nat. Hazards Earth Syst. Sci., 17, 1683–1696, https://doi.org/10.5194/nhess-17-1683-2017, 2017.
Wagenaar, D., Lüdtke, S., Schröter, K., Bouwer, L. M., and Kreibich, H.: Regional and Temporal Transferability of Multivariable Flood Damage Models, Water Resources Research, 54, 3688–3703, https://doi.org/10.1029/2017WR022233, 2018.
Win, S., Zin, W. W., Kawasaki, A., and San, Z. M. L. T.: Establishment of flood damage function models: A case study in the Bago River Basin, Myanmar, International Journal of Disaster Risk Reduction, 28, 688–700, https://doi.org/10.1016/j.ijdrr.2018.01.030, 2018.