
the Creative Commons Attribution 4.0 License.
the Creative Commons Attribution 4.0 License.
 | 30 Oct 2026
The 2025 Mediterranean marine heatwaves through sea surface temperature analogues

Thibault Guinaldo
Francisco Pastor
Tommaso Alberti
Samira Khodayar
The Mediterranean Sea experienced an exceptional marine heatwave throughout June–July 2025. Here we analyse this event using an analogue framework that differs from the common atmospheric circulation-based analogue attribution approach. Instead of identifying atmospheric circulation analogues first, we search directly for historical analogues of the observed sea surface temperature (SST) anomaly pattern of the 20 to 30 June 2025 build-up and peak phase, and then compare the associated atmospheric and air-sea surface conditions in a past (1950 to 1986) and a present (1987 to 2024) period, using ERA5 daily fields over the Mediterranean between June and September. Our results suggest that the present period exhibits higher SST anomalies than the past one, with the strongest positive differences over the western Mediterranean and the Adriatic Sea. Warmer 2 m air temperatures over surrounding land areas and higher net shortwave radiation over large parts of the basin are also observed, while sea level pressure, wind speed, latent heat flux, sensible heat flux, and longwave radiation display smaller and more spatially heterogeneous changes. Thus, the 2025 event occurred in a warmer thermodynamic background than analogous SST patterns in earlier decades. Since the analogue framework cannot fully separate externally forced trends from internal variability and it does not explicitly resolve ocean dynamical processes, these results do not constitute a complete formal attribution on their own. Nevertheless, the analogue analysis supports the interpretation that long term warming contributed substantially to the intensity of the 2025 Mediterranean marine heatwave and shows how SST analogue comparisons can complement existing attribution approaches for marine extremes.
- Article
(2027 KB) - Full-text XML
- BibTeX
- EndNote


Anthropogenic climate change has unequivocally warmed the oceans and the atmosphere, increasing the frequency and intensity of different extreme events (Forster et al., 2025; Seneviratne et al., 2021). Among them, marine heatwaves (MHWs) are prolonged periods of unusually warm ocean temperatures and represent one of the clearest manifestations of the interaction between climate internal variability and long-term changes in the ocean (Hobday et al., 2016; Holbrook et al., 2020). Their frequency, duration, and intensity have increased over the last century at a global scale (Frölicher et al., 2018; Oliver et al., 2018; Laufkötter et al., 2020) as evidenced by the recent surge in both global and regional extreme heat events (Gyuleva et al., 2025; England et al., 2025; Guinaldo et al., 2025). These events can produce severe ecological and socioeconomic impacts, including mass mortality of marine organisms, coral bleaching, seagrass decline, and fisheries disruption (Smale et al., 2019; Smith et al., 2021; Garrabou et al., 2022; Wernberg et al., 2025).
The Mediterranean Sea is a particularly sensitive region in this context. It is widely recognized as a climate change hotspot (Giorgi, 2006), with regional warming trend exceeding the global average (Cramer et al., 2018; Tuel and Eltahir, 2020; Pastor et al., 2020; Seneviratne et al., 2021). Consistent with this background trend, Mediterranean MHWs have become more frequent, longer, and more intense in recent decades (Darmaraki et al., 2024) with an annual mean number of days increasing from 1 d yr−1 over the period 1982–1999 to 5.5 d yr−1 over the period 2000–2021 (Pastor and Khodayar, 2023). Several remarkable events have been documented during the last two decades (Guinaldo et al., 2023; Martínez et al., 2023; Pastor et al., 2024) with major impacts on local marine ecosystems and coastal environments (Coll et al., 2010; Garrabou et al., 2022; Artana et al., 2026). Recent work has also highlighted that Mediterranean MHWs can be intensified when they co-occur with atmospheric heat extremes and anomalous summer circulation patterns that favour enhanced radiative input and weak surface winds (Sen Gupta et al., 2020; Pastor et al., 2024; Bonino et al., 2025; Paredes-Fortuny et al., 2025), conditions whose frequency is increasing in recent years (D'Andrea et al., 2024).
The contribution of anthropogenic climate change to the increasing likelihood and intensity of MHWs is now well established, with the vast majority of observed events attributable to human influence (Frölicher et al., 2018). The question addressed here is more specific. We examine the June 2025 Mediterranean event using an analogue framework designed to compare physically similar SST anomaly patterns across different climate backgrounds. The aim is not to replace formal probabilistic attribution studies based on climate model ensembles, but to provide an event-specific observational line of evidence and a process-oriented diagnostic of how the background thermodynamic environment differs between earlier and more recent analogues.
Analogue-based attribution has become an established complementary approach in the extreme event attribution field (Vautard et al., 2016; Faranda et al., 2022, 2024). In its more classical form, the method first identifies atmospheric circulation analogues and then evaluates how associated impacts differ between climate states. Here we adopt a different perspective. We first identify analogues of the observed SST anomaly pattern itself, and only then examine the atmospheric and surface fields associated with those SST analogue dates. This choice is motivated by the nature of the event under study, namely a MHW, for which the SST pattern is the central feature to be matched.
The study has three objectives. First, we document the exceptional character of the June 2025 event (Sect. 3). Second, we assess how the associated SST, atmospheric, and air-sea flux anomaly composites differ between past and present SST analogues (Sect. 4). Third, we discuss the extent to which these differences are consistent with thermodynamic amplification in a warmer climate, while explicitly acknowledging the limits of the analogue framework, in particular its inability to isolate forced and internal components fully and its omission of explicit ocean dynamical processes (Sect. 5).
2.1 Reanalysis and observational datasets
The main dataset used in this study is the ECMWF ERA5 reanalysis (Hersbach et al., 2020). ERA5 provides globally gridded atmospheric and surface fields at 0.25° resolution from 1940 onward. In this work, ERA5 is used as a temporally consistent, observation-constrained dataset for both the characterization of the 2025 event and the identification of historical analogues. All analyses are restricted to the June to September season (JJAS).
For SST, the ERA5 product relies on observationally constrained analyses rather than on a fully coupled ocean reanalysis. In practice, the SST field combines HadISST2 for the earlier part of the record (until August 2007) and OSTIA for the more recent period (from September 2007), both regridded within the ERA5 framework. We therefore refer to ERA5 SST as a consistent gridded SST product used within ERA5, rather than as an ocean reanalysis field in the strict dynamical sense.
The variables analysed in the analogue-based attribution are SST, 2 m air temperature (T2m), mean sea level pressure (MSL), surface net shortwave radiation (SSR), surface net longwave radiation (STR), surface latent heat flux (SLHF), surface sensible heat flux (SSHF), and 10 m wind speed (WSPD, derived from U10 and V10). These variables were selected because they are relevant to the development and maintenance of summer MHWs in the Mediterranean Sea through radiative forcing, air-sea exchanges, and near-surface circulation (Capotondi et al., 2024; Darmaraki et al., 2024; Bonino et al., 2025).
For descriptive purposes in the event characterization section, we also use the Mediterranean Sea High Resolution L4 Sea Surface Temperature Reprocessed product (MED-REP-L4; Copernicus Marine Service Information, https://doi.org/10.48670/moi-00173, Pisano et al., 2016; Embury et al., 2024; CMEMS, 2024). This observational product is not used in the analogue protocol and its role is only to document the timing, spatial structure, and magnitude of the 2025 event from an independent observational perspective.
2.2 Definition of anomalies and target event
For ERA5, daily anomalies are computed at each grid point relative to the 1950 to 2024 JJAS daily climatology. Thus, for each calendar day, the corresponding climatological mean for that day is removed before further analysis. All variables are then smoothed with an 11 d centred moving average, following the ClimaMeter framework and ensuring that the target event and candidate analogue fields are compared at the same temporal scale (Faranda et al., 2024). The target event is defined as the temporal mean SST anomaly over 20 to 30 June 2025. Daily SST anomalies are first computed, then averaged over this 11 d period. This period was selected because it corresponds to the most rapid build up and peak phase of the exceptional western Mediterranean warming documented by the observational datasets and by ERA5. The target is therefore a temporally averaged SST anomaly field, not a single day snapshot.
2.3 Analogue selection
We search for analogues of the 20 to 30 June 2025 SST anomaly pattern over the Mediterranean basin. The matching domain covers the western and central Mediterranean (approximately 6° W–19° E, 35–46° N; Fig. 2a–d), including the immediate coastal grid points represented in ERA5. For each JJAS day in the historical record, we compute the Euclidean distance between the candidate daily SST anomaly field and the target event pattern. The distance is calculated over all grid points in the domain, with cosine of latitude weighting to account for the different area represented by each grid cell. Candidate days are then ranked from the smallest to the largest distance. The analogue days are those with the smallest distances (i.e., the first 1 % of dates), that is, the SST anomaly fields most similar to the target 2025 pattern. The search is performed independently for two subperiods, a past period, 1950 to 1986, and a present period, 1987 to 2024. The year 1987 is used as the split because it lies close to a documented acceleration in Mediterranean warming and also divides the record into two comparably sized samples (Lionello and Scarascia, 2018). We stress that the past period is not a pre industrial baseline. It is simply a cooler segment of the observational era, which may have been cooler because of higher aerosol emissions over western Europe or a different phase of multidecadal variability (Pisano et al., 2020).
In each period we retain the top 42 analogue days. This corresponds to about 1 % of all available JJAS days in each subperiod and follows the standard ClimaMeter choice adopted in previous sensitivity analyses (Faranda et al., 2024). Fixing the number of analogues in both periods allows direct comparison of composite means between the two climate backgrounds.
For each period, we compute composites by averaging the selected analogue days for SST, T2m, MSL, SSR, STR, SLHF, SSHF, and WSPD. We then compare the past and present composites as well as the present minus past difference. This difference is interpreted as a diagnostic of how the environmental conditions associated with similar SST anomaly patterns differ between the earlier and later parts of the record. A positive difference indicates that the present climate analogues are associated with stronger positive anomalies – consistent with a warming signal. For instance, a positive SST difference implies that recent analogues occur under warmer SST conditions than similar events in the past. Conversely, near-zero or negative differences suggest either no significant change or a reduction in anomaly amplitude under current climate conditions, though this is less common for variables associated with heat extremes. We remark that this framework does not justify a claim that identical atmospheric or oceanic states are being compared. It compares atmospheric and surface conditions associated with similar SST anomaly patterns. The method is therefore best understood as conditional and diagnostic. It provides information on how the thermodynamic and near-surface atmospheric context of SST analogue events has shifted between the two periods, but it does not in itself isolate external forcing from internal variability.
2.4 Statistical significance
To assess whether present minus past composite differences are robust to sampling uncertainty, we use a non-parametric bootstrap test following Faranda et al. (2022, 2024). The 84 analogue dates, 42 from the past and 42 from the present, are pooled together. We then generate 1000 random resamples, each time dividing the 84 dates into two groups of 42 without preserving their original period labels. For each resample we compute the difference between the two composite means at each grid point. The resulting empirical distribution provides the expected range of differences under the null hypothesis that the observed present minus past difference arises from random sampling within the pooled analogue set. Grid point differences are considered significant at the 95 % level when their magnitude exceeds twice the standard deviation of the bootstrap distribution.
2.5 Climate variability indices and analogue quality
To characterize the background large-scale variability associated with the analogue dates, we analyse six standard climate indices, El Niño Southern Oscillation (ENSO), North Atlantic Oscillation (NAO), Pacific Decadal Oscillation (PDO), Atlantic Multidecadal Oscillation (AMO), East Atlantic pattern (EA), and Scandinavian pattern (SCAND). The indices are taken from the following sources: ENSO 3.4 from ERSSTv5 (Extended Reconstructed Sea Surface Temperature version 5); PDO from SWFSC (Southwest Fisheries Science Center); NAO from CPC (Climate Prediction Center, NOAA); AMO from ERSST_TS (Extended Reconstructed Sea Surface Temperature time series); EA and SCAND from CPC (Climate Prediction Center, NOAA). For each analogue date we extract the value of the corresponding index time series and compare the past and present distributions using violin plots and a two tailed Cramér von Mises test. These comparisons are purely descriptive and inform on the large-scale context without demonstrating a causal role of any given mode in the 2025 event. We also evaluate analogue quality using the mean Euclidean distance between the target 2025 SST pattern and its selected analogues, following Faranda et al. (2022). This quality metric indicates how closely the selected analogue set matches the target pattern relative to typical analogue distances within each period.

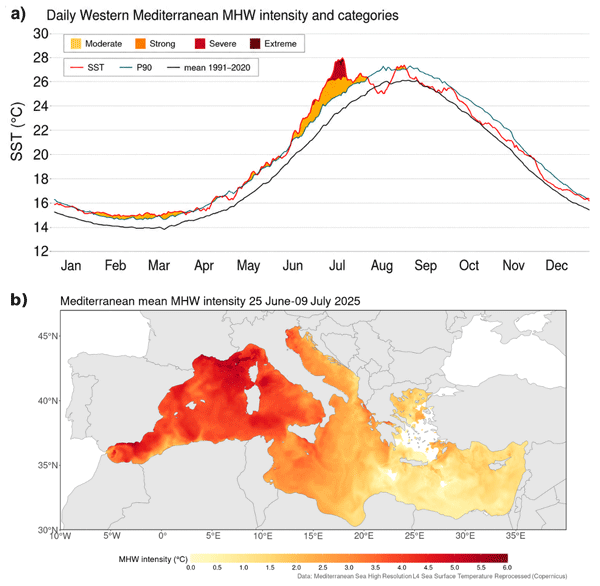
Figure 1(a) Daily SST averaged over the Western Mediterranean Sea for 2025 (red), together with the 1991–2020 daily climatological mean (black line) and the 90th percentile MHW threshold (P90, teal line). Shading indicates the MHW category (moderate, strong, severe, extreme) following Hobday et al. (2016, 2018). (b) Mean MHW intensity (temperature anomaly above the 1991–2020 climatology, in °C) over the Mediterranean Sea for the 25 June–9 July 2025 period, i.e. the most intense (severe category) phase highlighted in panel (a). White areas over the sea are grid points where no MHW was detected. SST data obtained from the Mediterranean Sea-High Resolution L4 Sea Surface Temperature Reprocessed (MED-REP-L4) dataset from Copernicus.
The June to July 2025 MHW was exceptional in both duration and spatial extent. Figure 1a shows the daily mean western Mediterranean SST together with the 1991–2020 reference period climatology, the 90th percentile threshold. The 90th percentile threshold used to define MHW conditions and the MHW category (Hobday et al., 2016, 2018). The event developed progressively during June 2025, with SST remaining above the climatological threshold for the whole month and then intensifying sharply in the second half of June and the start of July. Accordingly, the western Mediterranean experienced moderate MHW conditions persisting from early June to late July, with two periods of stronger intensity. A short strong phase occurred in mid June, followed by a more sustained severe phase around the turn of June to July. The daily western Mediterranean SST reached its maximum close to 28 °C in early July. MHW intensity then rapidly decayed, and the event ended in late July. This time evolution of the MHW event classifies it as a long-duration event, significantly exceeding the average of 16 d for Mediterranean MHWs in the period 1982–2021 (Pastor and Khodayar, 2023).
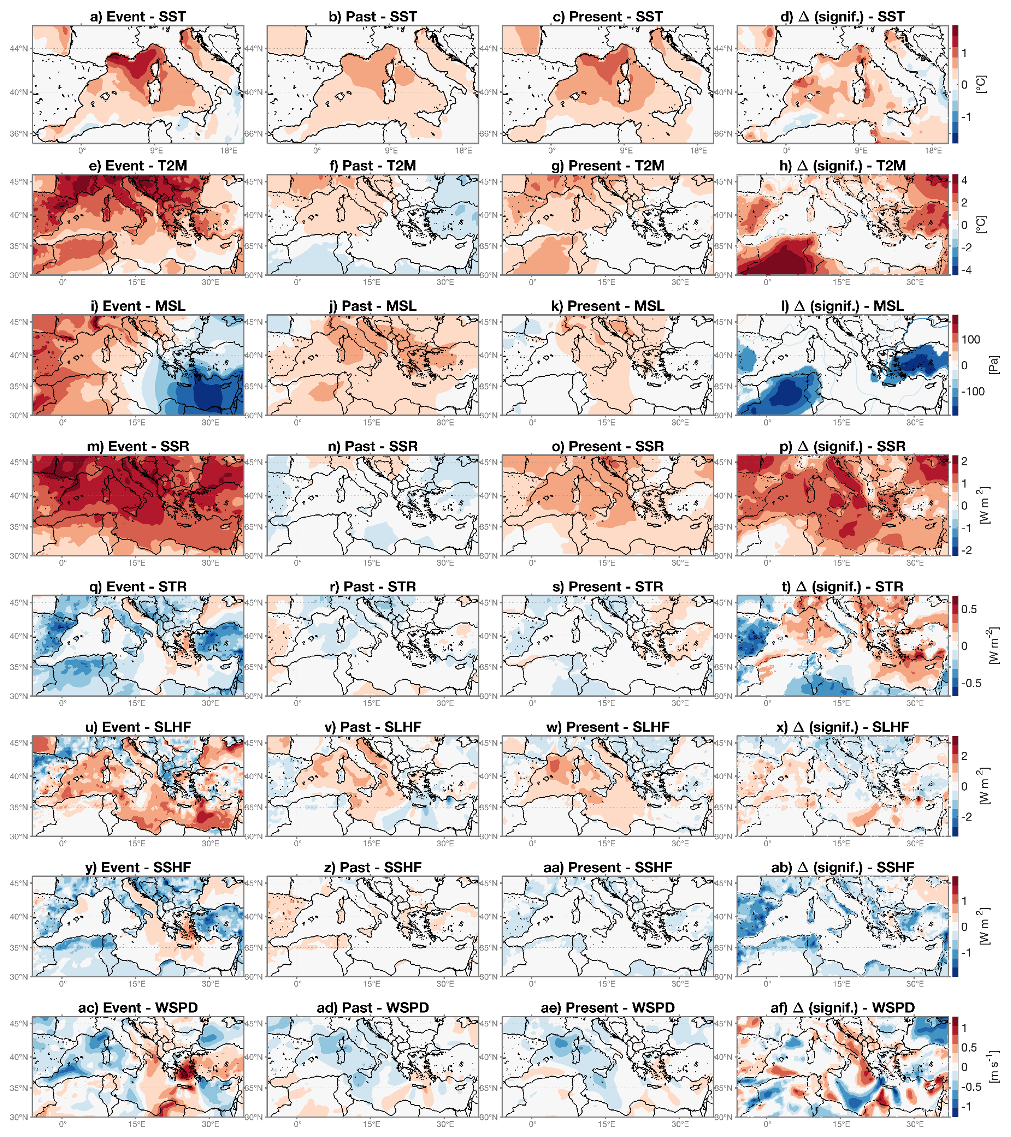
Figure 2Multi-variable analogue analysis for the period 20–30 June 2025. Rows: sea-surface temperature, SST (a–d); 2 m air temperature, T2m (e–h); mean sea-level pressure, MSL (i–l); surface net shortwave radiation, SSR (m–p); surface net longwave radiation, STR (q–t); surface latent heat flux, SLHF (u–x); surface sensible heat flux, SSHF (y–ab); 10 m wind speed, WSPD (ac–af). Columns: event anomaly; Past analogue composite (1950–1986); Present analogue composite (1987–2024); Present–Past difference. In the difference column, colour-filled areas indicate 95 % bootstrap significance. Temperatures are in °C, MSL in Pa, fluxes in W m−2, and wind speed in m s−1.
Figure 1b shows the mean MHW intensity over the Mediterranean Sea for the period 25 June to 9 July 2025, corresponding to the peak phase identified in Fig. 1a. The strongest intensities were concentrated in the western Mediterranean, particularly between the Gulf of Lions, the Balearic Sea, Corsica, Sardinia, and the Tyrrhenian sub-basin, with local values above +4.5 °C and in some areas approaching +5.5 to 6 °C. Positive intensities extended across most of the basin, but with a clear west to east decrease. The central Mediterranean showed widespread moderate to strong conditions, whereas the eastern Mediterranean exhibited weaker intensities overall. The spatial distribution of MHW intensity therefore qualifies the event as a western Mediterranean-centred one (Fig. 1b): although it affected much of the basin, its most exceptional expression was clearly located in the western Mediterranean, which motivates focusing the following sections on this sub-basin. The temporal window 20 to 30 June 2025 used for the analogue target therefore corresponds to the onset of the strongest basin-wide phase and captures the spatial structure that later culminated during the 25 June to 9 July interval shown in Fig. 1b.
ERA5 shows that the event coincided with positive MSL anomalies over parts of southwestern and central Europe (Fig. 2i) and with widespread positive SSR anomalies over the Mediterranean region (Fig. 2m). T2m anomalies were strongly positive over surrounding land areas, especially over the Iberian Peninsula, southern France, Italy, and North Africa (Fig. 2e). WSPD anomalies were weak to moderate and spatially heterogeneous (Fig. 2ac). These features are consistent with a hot and radiatively favourable large scale environment during the peak phase of the event, but the present paper does not attempt a formal classification of the associated atmospheric circulation pattern or of concurrent atmospheric heatwaves.
4.1 SST analogue composites
Figure 2a–d compares the target SST anomaly field for 20 to 30 June 2025 with the past and present SST analogue composites and with their difference. The past and present composites both reproduce the broad spatial structure of the target event, with stronger anomalies in the western Mediterranean than further east. This indicates that the 2025 pattern is not unprecedented in terms of its large-scale spatial organization. The amplitudes, however, differ between the two analogue periods. The past composite shows weaker positive SST anomalies than the present composite over much of the basin. The present minus past SST difference is positive over large areas, with the strongest values in the western Mediterranean and parts of the Adriatic. Many of these positive differences are significant at the 95 % level after bootstrap testing. Thus, within the analogue framework, similar SST anomaly patterns are associated with systematically higher SST anomalies in the later part of the record.
4.2 Near-surface air temperature and pressure
Figure 2e–h shows the T2m fields. The target event exhibits strong positive air temperature anomalies over land surrounding the Mediterranean. Both past and present analogue composites retain positive T2m anomalies over southern Europe and North Africa, but the present composite is generally warmer. The present minus past T2m difference is positive over substantial land areas, with significant values over parts of the Iberian Peninsula, southern France, Italy, the Balkans, and North Africa. Over the sea, T2m differences are smaller and less spatially coherent. The target event is associated with positive pressure anomalies over the western and central Mediterranean sector and negative anomalies farther east. The past and present analogue composites show broadly similar large-scale pressure structures. In contrast to SST and T2m, the present minus past MSL differences are weaker, spatially heterogeneous, and often not significant over the basin. This suggests that the pressure patterns associated with the SST analogues do not differ as strongly between the two periods as the thermodynamic fields do.
4.3 Radiative fluxes
Figure 2m–p shows SSR. During the target event, positive shortwave anomalies cover much of the Mediterranean and adjacent land areas. Both analogue composites also display positive SSR anomalies, but the present composite is generally stronger over broad parts of the basin and neighbouring regions. The present minus past SSR differences are positive over much of the western and central Mediterranean and are significant at many grid points. Figure 2q–t shows STR. The target event presents negative STR anomalies over wide marine areas, while the analogue composites are weaker and more spatially mixed. The present minus past STR difference is not uniformly positive over the basin. Instead, it shows a heterogeneous structure, with positive values in some areas and near zero or negative values elsewhere. The signal is therefore less spatially robust than for SST, T2m, or SSR, and its interpretation requires caution.
4.4 Turbulent heat fluxes and wind speed
Figure 2u–x shows SLHF. The event field and the analogue composites display mixed spatial structures. The present minus past difference is generally weak and heterogeneous, with localized positive and negative regions and limited significance. Within this framework, SLHF does not show a basin wide shift comparable to that seen in SST or SSR. Figure 2y–ab shows SSHF. Here again the present minus past differences are modest and spatially variable. Over parts of the Mediterranean basin the differences are close to zero, while surrounding land and coastal regions show a mix of positive and negative values. The SSHF response is therefore not spatially coherent at the basin scale. Figure 2ac–af shows WSPD. The target event is associated with generally weak wind anomalies over much of the basin, but with pronounced regional contrasts. The past and present composites also show weak and heterogeneous wind anomaly structures. Present minus past wind speed differences are small in most regions and only locally significant.
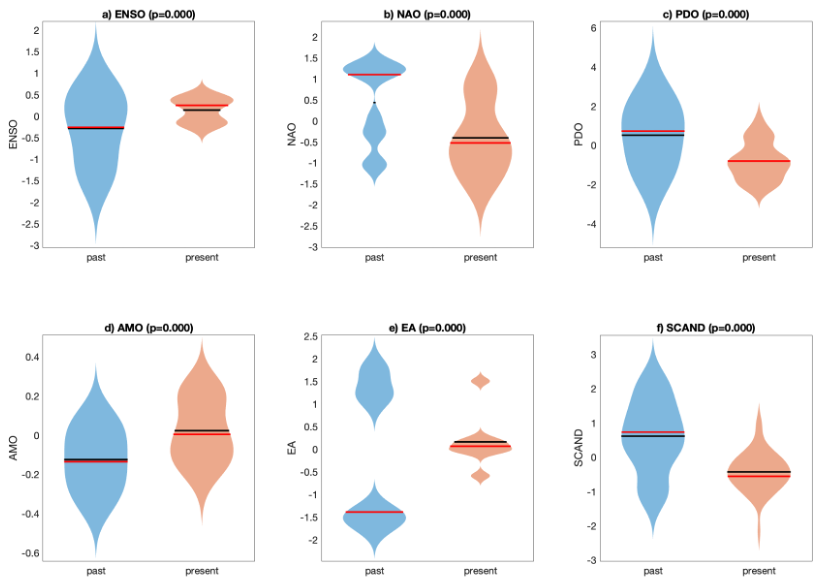
Figure 3Violin plots comparing the distributions of natural variability indices during analogue dates in the past (1950–1986, blue) and present (1987–2024, orange) periods. The indices include: (a) El Niño–Southern Oscillation (ENSO), (b) North Atlantic Oscillation (NAO), (c) Pacific Decadal Oscillation (PDO), (d) Atlantic Multidecadal Oscillation (AMO), (e) East Atlantic pattern (EA), and (f) Scandinavian pattern (SCAND). Each violin shows the full probability density of the distribution, with horizontal red and black lines indicating the mean and median, respectively. The width of the violin reflects the relative frequency of values. All comparisons yield statistically significant differences between past and present periods (two-tailed Cramér–von Mises test, p<0.001), suggesting that the underlying state of large-scale climate modes has shifted over time.
4.5 Climate variability indices and analogue quality
The distributions of ENSO (El Niño–Southern Oscillation), NAO (North Atlantic Oscillation), PDO (Pacific Decadal Oscillation), AMO (Atlantic Multidecadal Oscillation), EA (East Atlantic pattern), and SCAND (Scandinavian pattern) differ between past and present analogue dates according to the two-tailed Cramér–von Mises test, with p<0.001 for all six indices (Fig. 3). Because the sample is limited to 42 dates per period, these p-values quantify a clear distributional shift but should not be over-interpreted as a precise probability statement. Figure 3 shows consistent shifts between past and present distributions for all modes. ENSO moves from a distribution centred on negative values in the past to values closer to neutral or slightly positive in the present, with a reduced spread. NAO shifts from a predominantly positive distribution in the past to a distribution centred on negative values in the present, with a broader range. PDO changes from a distribution centred on positive values to one centred on negative values. AMO shifts from weakly negative values toward values closer to zero or slightly positive. EA changes from a past distribution with two preferred states, one negative and one positive, to a present distribution concentrated near neutral values. SCAND shifts from positive values in the past to negative values in the present. These differences indicate that the analogue dates in the two periods sample different large-scale states of oceanic and atmospheric variability. The result is statistical and does not imply that any of these modes individually explains or causes the 2025 event but they might have contributed to the occurrence of the event. Finally, the analogue quality analysis (Fig. 4) shows that the selected analogue sets reproduce the target SST pattern in both periods. The Q values of the 2025 event lie above the distributions in both periods, indicating that the event is not among the most typical configurations. The comparison between periods does not show a systematic improvement of analogue quality in the present climate, despite the temporal proximity of the event.
The analogue comparison reveals a physically coherent picture: the clearest differences between past and present analogues of the June 2025 MHW lie in the thermodynamic fields, SST itself, near-surface air temperature over surrounding land, and net shortwave radiation, rather than in the dynamic fields. Sea level pressure, wind speed, latent heat flux and sensible heat flux show weaker, spatially heterogeneous present-minus-past differences with limited basin-wide coherence. This is consistent with the expectation that long-term warming primarily elevates the background thermodynamic state, whereas forced changes in the large-scale atmospheric circulation are smaller and harder to detect against internal variability over the observational record (Deser et al., 2012; Shepherd, 2014; Faranda et al., 2023). We stress, however, that internal variability is only one of several plausible readings of the patchy present-minus-past differences in sea level pressure, wind speed, and latent and sensible heat fluxes. These heterogeneous patterns may equally reflect a spatially complex atmospheric response, forced circulation changes whose amplitude is simply weaker than the internal variability sampled by 42 analogue dates per period, or the influence of regional processes such as land-sea thermal contrasts, orographic channelling of the regional wind systems, and coastal upwelling, which are not well captured by basin-scale composites. Distinguishing between these explanations would require large initial-condition model ensembles rather than the observational analogue framework used here. Our results complement recent work showing that concurrent atmospheric heatwaves and weakened surface winds under subtropical ridges can intensify MHW through modified air-sea heat flux exchanges (Bonino et al., 2025; Paredes-Fortuny et al., 2025; Pastor et al., 2024). The relatively weak and spatially incoherent wind speed and turbulent flux differences in the present analogue composites suggest that the 2025 event's exceptional character, like other recent MHWs (Gyuleva et al., 2025; Dong et al., 2025), was not primarily driven by a shift in the atmospheric dynamical conditions associated with the event, here diagnosed through the near-surface wind and turbulent heat flux composites, which reflect the regional air-sea coupling rather than the large-scale circulation itself, but rather by the superposition of a recurrent SST anomaly pattern onto a warmer thermodynamic background without a significant change in variance (Xu et al., 2022): a warmer ocean, a warmer atmosphere, and more available solar energy reaching a stratified upper-ocean.
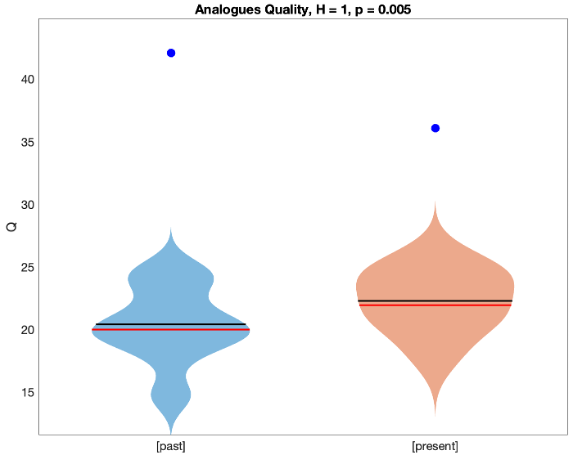
Figure 4Analogue quality scores (Q) for the analogue dates selected in the past (1950–1986, blue) and present (1987–2024, orange) periods. Violin plots show the distribution of mean Euclidean distances between 42 analogue SST patterns and randomly selected JJAS days from the same period. The horizontal red and black lines indicate the mean and median of each distribution, respectively. The filled blue dots mark the actual Q values computed between the target 2025 SST event and its selected analogues. A lower Q indicates a better match. The statistical difference between past and present distributions is confirmed by a two-tailed Cramér–von Mises test (p=0.005).
The positive SSR differences between present and past analogues are the most spatially coherent and robust signals over the western and central Mediterranean basin. This is consistent with enhanced clear-sky conditions and reduced cloudiness in summer as documented both regionally (Guinaldo et al., 2023; Bonino et al., 2025; Behr et al., 2025) and at a global scale (Sen Gupta et al., 2020; Goessling et al., 2025) but this point cannot be quantified directly with the present methodology. By contrast, STR differences are spatially heterogeneous and cannot be interpreted as a simple basin-wide increase in longwave forcing. Several mechanisms may contribute to the observed radiation patterns, including changes in the thermodynamic state of the lower atmosphere, changes in humidity, and changes in cloudiness. We did not explicitly analyse cloud cover or specific humidity, and multiple mechanisms can contribute to the observed radiation changes, including thermodynamic modifications of the lower atmosphere and long-term drying trends. The radiation results are best interpreted as part of a consistent surface energy budget signal rather than as an isolated causal diagnosis. This interpretation should, however, be stated with care. The method does not compare identical atmospheric or coupled ocean–atmosphere states. It compares atmospheric and surface conditions associated with similar SST anomaly patterns. The results therefore support a conditional statement. In the later part of the historical record, SST patterns resembling the June 2025 event are associated with stronger marine warming and, in several regions, with stronger atmospheric warming and stronger shortwave input than in the earlier part of the record. This is consistent with thermodynamic amplification in a warmer climate background, but it is not a complete attribution proof on its own.
A first-order quantification of the conditional shift can be obtained directly from the analogue composites in Fig. 2. Over the grid points where the present-minus-past difference is significant at the 95 % level after bootstrap testing, the SST shift typically reaches +1 to +1.5 °C across broad sectors of the western Mediterranean and parts of the Adriatic, while T2m shifts over surrounding land are of comparable or larger magnitude, locally in the +1.5 to +2.5 °C range over the Iberian Peninsula, southern France, Italy and the Balkans. The corresponding present-minus-past SSR differences are of the order of a few W m−2 over much of the western and central basin. These figures should be interpreted as conditional metrics: they describe the typical shift of the thermodynamic environment in which SST patterns analogous to the June 2025 event occur, and not as a probabilistic attribution estimate of the human contribution to the 2025 event itself. Internal variability associated with the different distributions of low-frequency modes sampled by the two analogue populations (Fig. 3) can also contribute to these magnitudes, which is why we present them as ranges rather than as point estimates.
Compared to formal probabilistic attribution based on CMIP-class model ensembles, the SST-analogue framework offers complementary, rather than redundant, information for an event such as the June 2025 Mediterranean MHW. Model-ensemble attribution typically targets a scalar return-period or risk-ratio change in a regional SST or MHW index. Here, by holding the SST anomaly pattern approximately constant by construction, we obtain spatially resolved, multi-variable composite differences for SST, T2m, MSL, SSR, STR, SLHF, SSHF, and WSPD, all from observation-constrained reanalysis fields. This disaggregation makes it possible to identify which surface energy budget terms shift most coherently between past and present analogue populations – in this case clearly SST, T2m and SSR – and which terms remain weak and spatially heterogeneous – here MSL, STR, SLHF, SSHF and WSPD. Model ensembles can of course also deliver variable-by-variable, grid-point-resolved diagnostics. The distinctive feature of the present framework is rather that these diagnostics are conditioned on observed analogues of one specific event and are therefore derived directly from the observational record, instead of being obtained from model simulations or attribution ensembles. The two approaches are therefore best used jointly, as already suggested by hybrid frameworks combining observational analogues with large ensembles.
The shifts in ENSO, NAO, PDO, AMO, EA, and SCAND distributions indicate an important and complex interaction in the observational analogue method: the analogue populations are embedded in different low frequency variability states. The observed present minus past differences reflect a combination of externally forced long-term warming and changes in internal variability. Separating such shifts from the externally forced signal is a key aspect of every attribution study. Numerous methods have been proposed (Trenberth et al., 2015; Naveau et al., 2020; Otto, 2023) to overcome these limitations and sample in the best way possible the decennial to multi-decennial variability including the use of large ensembles (Deser et al., 2020). The observed differences provide a physically interpretable signal, but they cannot be partitioned into forced and unforced components. As such, hybrid approaches that combine observational analogues with large ensemble model diagnostics could help address this in future work.
A second important limitation concerns ocean dynamics. Our analysis does not explicitly include ocean advection, mixed layer depth, vertical mixing, or subsurface heat content. These processes can be important in the Mediterranean, and in some seasons or subregions they may substantially modulate the onset, intensity, or persistence of marine heatwaves. The omission is less severe in the summer Mediterranean than it would be in other contexts because stratification is typically strong and mixed layers are shallow and less variable in summer (d'Ortenzio et al., 2005; Juza et al., 2022). Even so, ocean dynamical contributions cannot be ruled out and the present study should not be interpreted as a complete process-based explanation of the 2025 event.
A key assumption of the analogue method is that variable structures remain physically sufficiently comparable across climate states, meaning that a pattern of SST anomalies in 1980 represents a dynamically similar configuration to the same pattern in 2020, differing primarily in the background state. In the Mediterranean Sea, the basin geometry and recurrent large-scale forcing constrain the broad spatial organization of anomalies, making this assumption plausible. Nevertheless, long-term warming can modify the magnitude of SST anomalies and their west–east gradients, which may reduce the representativeness of historical analogues, especially when recent extremes are compared with earlier decades (Marullo et al., 2011; Pastor et al., 2020; Pisano et al., 2020). The analogue quality analysis confirms that the 2025 event lies toward the upper end of analogue distances in both periods, indicating that the event is only partially captured even by its best historical analogues. This also illustrates the limits of this approach alone as attribution evidence.
Within these limits, the analogue analysis provides an event-specific observational comparison of the environmental context associated with similar SST anomaly patterns in two parts of the historical record. It therefore complements the broader literature showing that Mediterranean MHWs are intensifying under climate change by showing, for this particular event, where and in which variables the past and present analogue contexts differ most strongly.
The Mediterranean Sea experienced one of its most intense early-summer MHWs on record in June 2025. Using an SST analogue framework, in which the target of the analogue search is the observed SST anomaly pattern itself, applied to ERA5 reanalysis data covering 1950–2024, we have compared the atmospheric and surface energy budget conditions associated with historical SST patterns appearing like the June 2025 event across two climate periods: a past period (1950–1986) and a present period (1987–2024). This distinguishes the study from the more commonly used circulation-based analogue approach and is better aligned with the marine nature of the event.
Three main findings emerge from the analysis. First, the June 2025 event was exceptional in the observational record, with the strongest MHW intensities concentrated in the western Mediterranean, locally exceeding +4.5 °C, and with elevated temperatures extending over much of the basin.
Second, the analogue comparison reveals a clear thermodynamic fingerprint of long-term warming. Present-period analogues of the 2025 SST pattern are systematically associated with stronger SST anomalies, warmer near-surface air temperatures over surrounding land areas, and greater net shortwave radiation than past-period analogues. These differences are spatially coherent and statistically significant across broad portions of the basin. By contrast, differences in sea level pressure, wind speed, latent and sensible heat fluxes, and longwave radiation are weaker and spatially heterogeneous, indicating that the dominant shift between earlier and more recent climate backgrounds lies in the thermodynamic environment rather than in a change of the associated large-scale circulation.
Third, the analogue framework demonstrates both its utility and its limitations for marine heat extreme event attribution. It provides a physically transparent, observation-based, and event-specific line of evidence consistent with thermodynamic amplification of the 2025 MHW in the context of long-term Mediterranean warming. It cannot, however, fully disentangle contributions of the externally forced warming from internal variability, and it does not resolve ocean dynamical processes that may have contributed to the event's onset and persistence.
More generally, the study shows that SST analogue comparisons offer a valuable complement to model-based attribution for marine extremes. Their observational grounding, and event-specific objectives make them well-suited for rapid scientific assessments following major events. Future developments of this approach should explore its combination with large climate model ensembles to explicitly disentangle forced and internal contributions, and its extension to include subsurface ocean variables to better capture the role of ocean dynamics in MHW intensification.
The analogue analysis workflow builds on publicly available functions implemented in the ClimaMeter framework (Faranda et al., 2024). Custom scripts used in this study are available from the corresponding author upon reasonable request.
ERA5 reanalysis data used in this study are publicly available from the Copernicus Climate Data Store. The Mediterranean Sea High Resolution L4 Sea Surface Temperature Reprocessed product is available from the Copernicus Marine Service Information (https://doi.org/10.48670/moi-00173, Pisano et al., 2016; Embury et al., 2024; CMEMS, 2024). All derived data supporting the findings of this study are available from the corresponding author upon reasonable request.
D.F. designed the study and coordinated the analysis. T.G. and F.P. provided data and analysis for observational datasets. T.G., F.P., and S.K. provided expertise on Mediterranean marine heatwaves and contributed to interpretation. T.A. contributed to methodological development. All authors discussed the results and contributed to writing and revising the manuscript.
The contact author has declared that none of the authors has any competing interests.
Publisher's note: Copernicus Publications remains neutral with regard to jurisdictional claims made in the text, published maps, institutional affiliations, or any other geographical representation in this paper. The authors bear the ultimate responsibility for providing appropriate place names. Views expressed in the text are those of the authors and do not necessarily reflect the views of the publisher.
This article is based on collaborative work within the COST Action CA22162 FutureMed.
This research has been supported by the Agence Nationale de la Recherche (grant nos. ANR-22-PETA-0016 “PowDev”, ANR-23-CE56-0002 “Templex” and ANR-22-EXTR-0005 “TRACCS-PC4-EXTENDING”), the European Cooperation in Science and Technology (grant no. CA22162 “FutureMed”), and the Generalitat Valenciana (grant no. CIPROM/2022/37 “EVER_PROMETEO”).
This paper was edited by Piero Lionello and reviewed by two anonymous referees.
Artana, C., Kaplan, A., Ramírez, F., Ortega, M., Steenbeek, J. G., and Coll, M.: Marine heatwaves are transforming Western Mediterranean marine ecosystems, Sci. Rep., 16, 5843, https://doi.org/10.1038/s41598-026-35813-x, 2026.
Behr, L., Xoplaki, E., Luther, N., Josey, S. A., and Luterbacher, J.: Atmospheric patterns drive marine heatwaves in the North Atlantic and Mediterranean Sea during summer 2023, Environ. Res. Lett., 20, 104020, https://doi.org/10.1088/1748-9326/ae0055, 2025.
Bonino, G., McAdam, R., Athanasiadis, P., Cavicchia, L., Rodrigues, R. R., Scoccimarro, E., Tibaldi, S., and Masina, S.: Mediterranean summer marine heatwaves triggered by weaker winds under subtropical ridges, Nat. Geosci., 18, 848–853, https://doi.org/10.1038/s41561-025-01762-9, 2025.
Capotondi, A., Rodrigues, R. R., Sen Gupta, A., Benthuysen, J. A., Deser, C., Frölicher, T. L., Lovenduski, N. S., Amaya, D. J., Le Grix, N., Xu, T., Hermes, J., Holbrook, N. J., Martinez-Villalobos, C., Masina, S., Roxy, M. K., Schaeffer, A., Schlegel, R. W., Smith, K. E., and Wang, C.: A global overview of marine heatwaves in a changing climate, Commun. Earth Environ., 5, 701, https://doi.org/10.1038/s43247-024-01806-9, 2024.
Coll, M., Piroddi, C., Steenbeek, J., Kaschner, K., Ben Rais Lasram, F., Aguzzi, J., Ballesteros, E., Bianchi, C. N., Corbera, J., Dailianis, T., Danovaro, R., Estrada, M., Froglia, C., Galil, B. S., Gasol, J. M., Gertwagen, R., Gil, J., Guilhaumon, F., Kesner-Reyes, K., Kitsos, M.-S., Koukouras, A., Lampadariou, N., Laxamana, E., López-Fé de la Cuadra, C. M., Lotze, H. K., Martin, D., Mouillot, D., Oro, D., Raicevich, S., Rius-Barile, J., Saiz-Salinas, J. I., San Vicente, C., Somot, S., Templado, J., Turon, X., Vafidis, D., Villanueva, R., and Voultsiadou, E.: The biodiversity of the Mediterranean Sea: estimates, patterns, and threats, PLoS ONE, 5, e11842, https://doi.org/10.1371/journal.pone.0011842, 2010.
Cramer, W., Guiot, J., Fader, M., Garrabou, J., Gattuso, J.-P., Iglesias, A., Lange, M. A., Lionello, P., Llasat, M. C., Paz, S., Peñuelas, J., Snoussi, M., Toreti, A., Tsimplis, M. N., and Xoplaki, E.: Climate change and interconnected risks to sustainable development in the Mediterranean, Nat. Clim. Change, 8, 972–980, https://doi.org/10.1038/s41558-018-0299-2, 2018.
D'Andrea, F., Duvel, J.-P., Rivière, G., Vautard, R., Cassou, C., Cattiaux, J., Coumou, D., Faranda, D., Happé, T., Jézéquel, A., Ribes, A., and Yiou, P.: Summer deep depressions increase over the Eastern North Atlantic, Geophys. Res. Lett., 51, e2023GL104435, https://doi.org/10.1029/2023GL104435, 2024.
Darmaraki, S., Denaxa, D., Theodorou, I., Livanou, E., Rigatou, D., Raitsos, D. E., Stavrakidis-Zachou, O., Dimarchopoulou, D., Bonino, G., McAdam, R., Organelli, E., Pitsouni, A., and Parasyris, A.: Marine heatwaves in the Mediterranean Sea: A literature review, Mediterr. Mar. Sci., 25, 586–620, https://doi.org/10.12681/mms.38392, 2024.
Deser, C., Phillips, A., Bourdette, V., and Teng, H.: Uncertainty in climate change projections: the role of internal variability, Clim. Dynam., 38, 527–546, https://doi.org/10.1007/s00382-010-0977-x, 2012.
Deser, C., Lehner, F., Rodgers, K. B., Ault, T., Delworth, T. L., DiNezio, P. N., Fiore, A., Frankignoul, C., Fyfe, J. C., Horton, D. E., Kay, J. E., Knutti, R., Lovenduski, N. S., Marotzke, J., McKinnon, K. A., Minobe, S., Randerson, J., Screen, J. A., Simpson, I. R., and Ting, M.: Insights from Earth system model initial-condition large ensembles and future prospects, Nat. Clim. Change, 10, 277–286, https://doi.org/10.1038/s41558-020-0731-2, 2020.
Dong, T., Zeng, Z., Pan, M., Wang, D., Chen, Y., Liang, L., Yang, S., Jin, Y., Luo, S., Liang, S., Huang, X., Zhao, D., Ziegler, A. D., Chen, D., Li, L. Z. X., Zhou, T., and Zhang, D.: Record-breaking 2023 marine heatwaves, Science, 389, 369–374, https://doi.org/10.1126/science.adr0910, 2025.
d'Ortenzio, F., Iudicone, D., de Boyer Montégut, C., Testor, P., Antoine, D., Marullo, S., Santoleri, R., and Madec, G.: Seasonal variability of the mixed layer depth in the Mediterranean Sea as derived from in situ profiles, Geophys. Res. Lett., 32, L12605, https://doi.org/10.1029/2005GL022463, 2005.
Embury, O., Merchant, C. J., Good, S. A., Rayner, N. A., Høyer, J. L., Atkinson, C., Block, T., Alerskans, E., Pearson, K. J., Worsfold, M., McCarroll, N., and Donlon, C.: Satellite-based time-series of sea-surface temperature since 1980 for climate applications, Sci. Data, 11, 326, https://doi.org/10.1038/s41597-024-03147-w, 2024.
England, M. H., Li, Z., Huguenin, M. F., Kiss, A. E., Sen Gupta, A., Holmes, R. M., and Rahmstorf, S.: Drivers of the extreme North Atlantic marine heatwave during 2023, Nature, 642, 636–643, https://doi.org/10.1038/s41586-025-08903-5, 2025.
E.U. Copernicus Marine Service Information (CMEMS): Mediterranean Sea – High Resolution L4 Sea Surface Temperature Reprocessed, Marine Data Store (MDS) [data set], https://doi.org/10.48670/moi-00173, 2024.
Faranda, D., Bourdin, S., Ginesta, M., Krouma, M., Noyelle, R., Pons, F., Yiou, P., and Messori, G.: A climate-change attribution retrospective of some impactful weather extremes of 2021, Weather Clim. Dynam., 3, 1311–1340, https://doi.org/10.5194/wcd-3-1311-2022, 2022.
Faranda, D., Messori, G., Jézéquel, A., Vrac, M., and Yiou, P.: Atmospheric circulation compounds anthropogenic warming and impacts of climate extremes in Europe, P. Natl. Acad. Sci. USA, 120, e2214525120, https://doi.org/10.1073/pnas.2214525120, 2023.
Faranda, D., Messori, G., Coppola, E., Alberti, T., Vrac, M., Pons, F., Yiou, P., Saint Lu, M., Hisi, A. N. S., Brockmann, P., Dafis, S., Mengaldo, G., and Vautard, R.: ClimaMeter: contextualizing extreme weather in a changing climate, Weather Clim. Dynam., 5, 959–983, https://doi.org/10.5194/wcd-5-959-2024, 2024.
Forster, P. M., Smith, C., Walsh, T., Lamb, W. F., Lamboll, R., Cassou, C., Hauser, M., Hausfather, Z., Lee, J.-Y., Palmer, M. D., von Schuckmann, K., Slangen, A. B. A., Szopa, S., Trewin, B., Yun, J., Gillett, N. P., Jenkins, S., Matthews, H. D., Raghavan, K., Ribes, A., Rogelj, J., Rosen, D., Zhang, X., Allen, M., Aleluia Reis, L., Andrew, R. M., Betts, R. A., Borger, A., Broersma, J. A., Burgess, S. N., Cheng, L., Friedlingstein, P., Domingues, C. M., Gambarini, M., Gasser, T., Gütschow, J., Ishii, M., Kadow, C., Kennedy, J., Killick, R. E., Krummel, P. B., Liné, A., Monselesan, D. P., Morice, C., Mühle, J., Naik, V., Peters, G. P., Pirani, A., Pongratz, J., Minx, J. C., Rigby, M., Rohde, R., Savita, A., Seneviratne, S. I., Thorne, P., Wells, C., Western, L. M., van der Werf, G. R., Wijffels, S. E., Masson-Delmotte, V., and Zhai, P.: Indicators of Global Climate Change 2024: annual update of key indicators of the state of the climate system and human influence, Earth Syst. Sci. Data, 17, 2641–2680, https://doi.org/10.5194/essd-17-2641-2025, 2025.
Frölicher, T. L., Fischer, E. M., and Gruber, N.: Marine heatwaves under global warming, Nature, 560, 360–364, https://doi.org/10.1038/s41586-018-0383-9, 2018.
Garrabou, J., Gómez-Gras, D., Medrano, A., Cerrano, C., Ponti, M., Schlegel, R., Bensoussan, N., Turicchia, E., Sini, M., Gerovasileiou, V., Teixido, N., Mirasole, A., Tamburello, L., Cebrian, E., Rilov, G., Ledoux, J.-B., Ben Souissi, J., Khamassi, F., Ghanem, R., Benabdi, M., Grimes, S., Ocaña, O., Bazairi, H., Hereu, B., Linares, C., Kersting, D. K., Rovira, G., Ortega, J., Casals, D., Pagès-Escolà, M., Margarit, N., Capdevila, P., Verdura, J., Ramos, A., Izquierdo, A., Barbera, C., Rubio-Portillo, E., Anton, I., López-Sendino, P., Díaz, D., Vázquez-Luis, M., Duarte, C., Marbà, N., Aspillaga, E., Espinosa, F., Grech, D., Guala, I., Azzurro, E., Farina, S., Gambi, M. C., Chimienti, G., Montefalcone, M., Azzola, A., Mantas, T. P., Fraschetti, S., Ceccherelli, G., Kipson, S., Bakran-Petricioli, T., Petricioli, D., Jimenez, C., Katsanevakis, S., Kizilkaya, I. T., Kizilkaya, Z., Sartoretto, S., Rouanet, E., Ruitton, S., Comeau, S., Gattuso, J.-P., and Harmelin, J.-G.: Marine heatwaves drive recurrent mass mortalities in the Mediterranean Sea, Glob. Change Biol., 28, 5708–5725, https://doi.org/10.1111/gcb.16301, 2022.
Giorgi, F.: Climate change hot-spots, Geophys. Res. Lett., 33, L08707, https://doi.org/10.1029/2006GL025734, 2006.
Goessling, H. F., Rackow, T., and Jung, T.: Recent global temperature surge intensified by record-low planetary albedo, Science, 387, 68–73, https://doi.org/10.1126/science.adq7280, 2025.
Guinaldo, T., Voldoire, A., Waldman, R., Saux Picart, S., and Roquet, H.: Response of the sea surface temperature to heatwaves during the France 2022 meteorological summer, Ocean Sci., 19, 629–647, https://doi.org/10.5194/os-19-629-2023, 2023.
Guinaldo, T., Cassou, C., Sallée, J.-B., and Liné, A.: Internal variability effect doped by climate change drove the 2023 marine heat extreme in the North Atlantic, Commun. Earth Environ., 6, 291, https://doi.org/10.1038/s43247-025-02197-1, 2025.
Gyuleva, G., Knutti, R., and Sippel, S.: Combination of internal variability and forced response reconciles observed 2023-2024 warming, Geophys. Res. Lett., 52, e2025GL115270, https://doi.org/10.1029/2025GL115270, 2025.
Hersbach, H., Bell, B., Berrisford, P., Hirahara, S., Horányi, A., Muñoz-Sabater, J., Nicolas, J., Peubey, C., Radu, R., Schepers, D., Simmons, A., Soci, C., Abdalla, S., Abellan, X., Balsamo, G., Bechtold, P., Biavati, G., Bidlot, J., Bonavita, M., De Chiara, G., Dahlgren, P., Dee, D., Diamantakis, M., Dragani, R., Flemming, J., Forbes, R., Fuentes, M., Geer, A., Haimberger, L., Healy, S., Hogan, R. J., Hólm, E., Janisková, M., Keeley, S., Laloyaux, P., Lopez, P., Lupu, C., Radnoti, G., de Rosnay, P., Rozum, I., Vamborg, F., Villaume, S., and Thépaut, J.-N.: The ERA5 global reanalysis, Q. J. Roy. Meteor. Soc., 146, 1999–2049, https://doi.org/10.1002/qj.3803, 2020.
Hobday, A. J., Alexander, L. V., Perkins, S. E., Smale, D. A., Straub, S. C., Oliver, E. C. J., Benthuysen, J. A., Burrows, M. T., Donat, M. G., Feng, M., Holbrook, N. J., Moore, P. J., Scannell, H. A., Sen Gupta, A., and Wernberg, T.: A hierarchical approach to defining marine heatwaves, Prog. Oceanogr., 141, 227–238, https://doi.org/10.1016/j.pocean.2015.12.014, 2016.
Hobday, A. J., Oliver, E. C. J., Sen Gupta, A., Benthuysen, J. A., Burrows, M. T., Donat, M. G., Holbrook, N. J., Moore, P. J., Thomsen, M. S., Wernberg, T., and Smale, D. A.: Categorizing and naming marine heatwaves, Oceanography, 31, 162–173, https://doi.org/10.5670/oceanog.2018.205, 2018.
Holbrook, N. J., Sen Gupta, A., Oliver, E. C. J., Hobday, A. J., Benthuysen, J. A., Scannell, H. A., Smale, D. A., and Wernberg, T.: Keeping pace with marine heatwaves, Nature Reviews Earth and Environment, 1, 482–493, https://doi.org/10.1038/s43017-020-0068-4, 2020.
Juza, M., Fernández-Mora, À., and Tintoré, J.: Sub-regional marine heat waves in the Mediterranean Sea from observations: Long-term surface changes, sub-surface and coastal responses, Front. Marine Sci., 9, 785771, https://doi.org/10.3389/fmars.2022.785771, 2022.
Laufkötter, C., Zscheischler, J., and Frölicher, T. L.: High-impact marine heatwaves attributable to human-induced global warming, Science, 369, 1621–1625, https://doi.org/10.1126/science.aba0690, 2020.
Lionello, P. and Scarascia, L.: The relation between climate change in the Mediterranean region and global warming, Reg. Environ. Change, 18, 1481–1493, https://doi.org/10.1007/s10113-018-1290-1, 2018.
Marullo, S., Artale, V., and Santoleri, R.: The SST multidecadal variability in the Atlantic Mediterranean region and its relation to AMO, J. Climate, 24, 4385–4401, https://doi.org/10.1175/2011JCLI3884.1, 2011.
Martínez, J., Leonelli, F. E., García-Ladona, E., Garrabou, J., Kersting, D. K., Bensoussan, N., and Pisano, A.: Evolution of marine heatwaves in warming seas: The Mediterranean Sea case study, Front. Mar. Sci., 10, 1193164, https://doi.org/10.3389/fmars.2023.1193164, 2023.
Naveau, P., Hannart, A., and Ribes, A.: Statistical methods for extreme event attribution in climate science, Annu. Rev. Stat. Appl., 7, 89–110, https://doi.org/10.1146/annurev-statistics-031219-041314, 2020.
Oliver, E. C. J., Donat, M. G., Burrows, M. T., Moore, P. J., Smale, D. A., Alexander, L. V., Benthuysen, J. A., Feng, M., Sen Gupta, A., Hobday, A. J., Holbrook, N. J., Perkins-Kirkpatrick, S. E., Scannell, H. A., Straub, S. C., and Wernberg, T.: Longer and more frequent marine heatwaves over the past century, Nat. Commun., 9, 1324, https://doi.org/10.1038/s41467-018-03732-9, 2018.
Otto, F. E. L.: Attribution of extreme events to climate change, Annu. Rev. Env. Resour., 48, 813–828, https://doi.org/10.1146/annurev-environ-112621-083538, 2023.
Paredes-Fortuny, L., Pastor, F., and Khodayar, S.: Concurrent atmospheric heatwaves intensify marine heatwaves through air-sea heat flux change in the Mediterranean Sea, Commun. Earth Environ., 6, 638, https://doi.org/10.1038/s43247-025-02633-2, 2025.
Pastor, F. and Khodayar, S.: Marine heat waves: Characterizing a major climate impact in the Mediterranean, Sci. Total Environ., 861, 160621, https://doi.org/10.1016/j.scitotenv.2022.160621, 2023.
Pastor, F., Valiente, J. A., and Khodayar, S.: A warming Mediterranean: 38 years of increasing sea surface temperature, Remote Sens., 12, 2687, https://doi.org/10.3390/rs12172687, 2020.
Pastor, F., Paredes-Fortuny, L., and Khodayar, S.: Mediterranean marine heatwaves intensify in the presence of concurrent atmospheric heatwaves, Commun. Earth Environ., 5, 797, https://doi.org/10.1038/s43247-024-01982-8, 2024.
Pisano, A., Buongiorno Nardelli, B., Tronconi, C., and Santoleri, R.: The new Mediterranean optimally interpolated pathfinder AVHRR SST Dataset (1982–2012), Remote Sens. Environ., 176, 107–116, https://doi.org/10.1016/j.rse.2016.01.019, 2016.
Pisano, A., Marullo, S., Artale, V., Falcini, F., Yang, C., Leonelli, F. E., Santoleri, R., and Buongiorno Nardelli, B.: New evidence of Mediterranean climate change and variability from sea surface temperature observations, Remote Sens., 12, 132, https://doi.org/10.3390/rs12010132, 2020.
Seneviratne, S. I., Zhang, X., Adnan, M., Badi, W., Dereczynski, C., Di Luca, A., Ghosh, S., Iskandar, I., Kossin, J., Lewis, S., Otto, F., Pinto, I., Satoh, M., Vicente-Serrano, S. M., Wehner, M., and Zhou, B.: Weather and climate extreme events in a changing climate, in: Climate Change 2021: The Physical Science Basis. Contribution of Working Group I to the Sixth Assessment Report of the Intergovernmental Panel on Climate Change, edited by: Masson-Delmotte, V., Zhai, P., Pirani, A., Connors, S. L., Péan, C., Berger, S., Caud, N., Chen, Y., Goldfarb, L., Gomis, M. I., Huang, M., Leitzell, K., Lonnoy, E., Matthews, J. B. R., Maycock, T. K., Waterfield, T., Yelekçi, O., Yu, R., and Zhou, B., Cambridge University Press, Cambridge, UK and New York, NY, USA, 1513–1766, https://doi.org/10.1017/9781009157896.013, 2021.
Sen Gupta, A., Thomsen, M., Benthuysen, J. A., Hobday, A. J., Oliver, E., Alexander, L. V., Burrows, M. T., Donat, M. G., Feng, M., Holbrook, N. J., Perkins-Kirkpatrick, S., Moore, P. J., Rodrigues, R. R., Scannell, H. A., Taschetto, A. S., Ummenhofer, C. C., Wernberg, T., and Smale, D. A.: Drivers and impacts of the most extreme marine heatwave events, Sci. Rep., 10, 19359, https://doi.org/10.1038/s41598-020-75445-3, 2020.
Shepherd, T. G.: Atmospheric circulation as a source of uncertainty in climate change projections, Nat. Geosci., 7, 703–708, https://doi.org/10.1038/ngeo2253, 2014.
Smale, D. A., Wernberg, T., Oliver, E. C. J., Thomsen, M., Harvey, B. P., Straub, S. C., Burrows, M. T., Alexander, L. V., Benthuysen, J. A., Donat, M. G., Feng, M., Hobday, A. J., Holbrook, N. J., Perkins-Kirkpatrick, S. E., Scannell, H. A., Sen Gupta, A., Payne, B. L., and Moore, P. J.: Marine heatwaves threaten global biodiversity and the provision of ecosystem services, Nat. Clim. Change, 9, 306–312, https://doi.org/10.1038/s41558-019-0412-1, 2019.
Smith, K. E., Burrows, M. T., Hobday, A. J., Sen Gupta, A., Moore, P. J., Thomsen, M., Wernberg, T., and Smale, D. A.: Socioeconomic impacts of marine heatwaves: Global issues and opportunities, Science, 374, eabj3593, https://doi.org/10.1126/science.abj3593, 2021.
Trenberth, K. E., Fasullo, J. T., and Shepherd, T. G.: Attribution of climate extreme events, Nat. Clim. Change, 5, 725–730, https://doi.org/10.1038/nclimate2657, 2015.
Tuel, A. and Eltahir, E. A. B.: Why is the Mediterranean a climate change hot spot?, J. Climate, 33, 5829–5843, https://doi.org/10.1175/JCLI-D-19-0910.1, 2020.
Vautard, R., Yiou, P., Otto, F., Stott, P., Christidis, N., van Oldenborgh, G. J., and Schaller, N.: Attribution of human-induced dynamical and thermodynamical contributions in extreme weather events, Environ. Res. Lett., 11, 114009, https://doi.org/10.1088/1748-9326/11/11/114009, 2016.
Wernberg, T., Thomsen, M. S., Burrows, M. T., Filbee-Dexter, K., Hobday, A. J., Holbrook, N. J., Montie, S., Moore, P. J., Oliver, E. C. J., Sen Gupta, A., Smale, D. A., and Smith, K.: Marine heatwaves as hot spots of climate change and impacts on biodiversity and ecosystem services, Nature Reviews Biodiversity, 1, 461–479, https://doi.org/10.1038/s44358-025-00058-5, 2025.
Xu, T., Newman, M., Capotondi, A., Stevenson, S., Di Lorenzo, E., and Alexander, M. A.: An increase in marine heatwaves without significant changes in surface ocean temperature variability, Nat. Commun., 13, 7396, https://doi.org/10.1038/s41467-022-34934-x, 2022.