
the Creative Commons Attribution 4.0 License.
the Creative Commons Attribution 4.0 License.
 | 14 Oct 2026
Seismic and tsunami hazard potential of the Negros–Sulu megathrust, Philippines
Lyndon P. Nawanao Jr.

Noelynna T. Ramos
Toshitaka Baba
Naotaka Chikasada
Kenji Satake
The Negros–Sulu megathrust poses an imminent threat to coastal communities surrounding the Sulu Sea, but with limited information on past tsunamis, megathrust geometry, and locked segments, robust seismic and tsunami hazard assessments are hindered. To identify highly exposed coastal areas amid this knowledge gap, we estimated the Negros–Sulu megathrust source parameters using a structural-based segmentation and scaling-relation approach for tsunami modeling. A total of 18 sets of source parameters from six segments and three dip angle scenarios were considered with moment magnitude and average slip of Mw 8.0–8.9 and 1.68–6.23 m, respectively. Tsunami simulations were modeled in JAGURS, accounting for nonlinear shallow water equations, horizontal and vertical seafloor displacements, and Boussinesq dispersion effects. Coastal regions directly facing the segments have the highest exposures with <2 min arrival times, highlighting the major control of wave directivity and the need for rapid evacuation strategies. The Negros Trench generates up to 6 m wave height and 7 m s−1 flow velocity, while the Sulu Trench produces up to 8 m and 6 m s−1. Coastal areas with ≥2 m wave heights typically exhibit a concave morphology with a nearshore width interquartile range of 2–4.5 km. At wider nearshore widths (>20 km), wave dissipation results in lower wave heights (<2 m) that underscore the need for accurate nearshore bathymetry in tsunami modeling. As average slip is used in these models, we highlight that the maximum wave height and flow velocity are likely underestimated and recommend treating them as minimum values. Nonetheless, the relative exposure levels of coastal areas from these results provide a significant basis for regional-scale tsunami risk mitigation strategies and for searching tsunami deposits.
- Article
(23756 KB) - Full-text XML
-
Supplement
(22555 KB) - BibTeX
- EndNote


Tsunamis brought about by megathrust ruptures are infrequent but have led to the most damaging coastal disasters in recorded history. The Mw 7.8–8.2 1923 Taisho Kanto (Satake, 2023), Mw 9.5 1960 Valvidia (Duke, 1960), Mw 9.2 1964 Great Alaska (Brocher et al., 2014), Mw 9.2 2004 Indian Ocean (Athukorala and Resosudarmo, 2005), and Mw 9.1 2011 Tohoku-Oki (Kajitani et al., 2013; Suppasri et al., 2012) events led to accumulated casualties of more than 380 000 and billions (USD) worth of damage. In the Philippines, Bautista et al. (2012) collated 41 positive tsunamigenic earthquake events from 1589 to 2012, primarily based on eyewitness accounts and previous reports. Of the 41 events (Fig. 1a), 20 can be directly linked to subduction zones, and three subduction-related events have a magnitude of at least 8.0: The Ms 8.0 1918 and Mw 8.1 1976 events along the Cotabato Trench with up to 8 and 9 m maximum tsunami wave height, respectively, and the Ms 8.2 1946 event along the Negros Trench but with a lower maximum tsunami wave of 2 m. The Mw 8.1 1976 is the most damaging historical tsunami event in the Philippines, characterized by a shallow rupture with a 25 km depth leading to estimated casualties of 3000–8000 (Acharya, 1978; Badillo and Astilla, 1978; Stratta et al., 1977). A washover deposit (766–675 cal BP) was also discovered along the coasts of Zamboanga del Sur facing the Cotabato Trench, suggesting an extreme wave event (tsunami or storm surge) prior to the 1976 earthquake and tsunami (Claro et al., 2021).
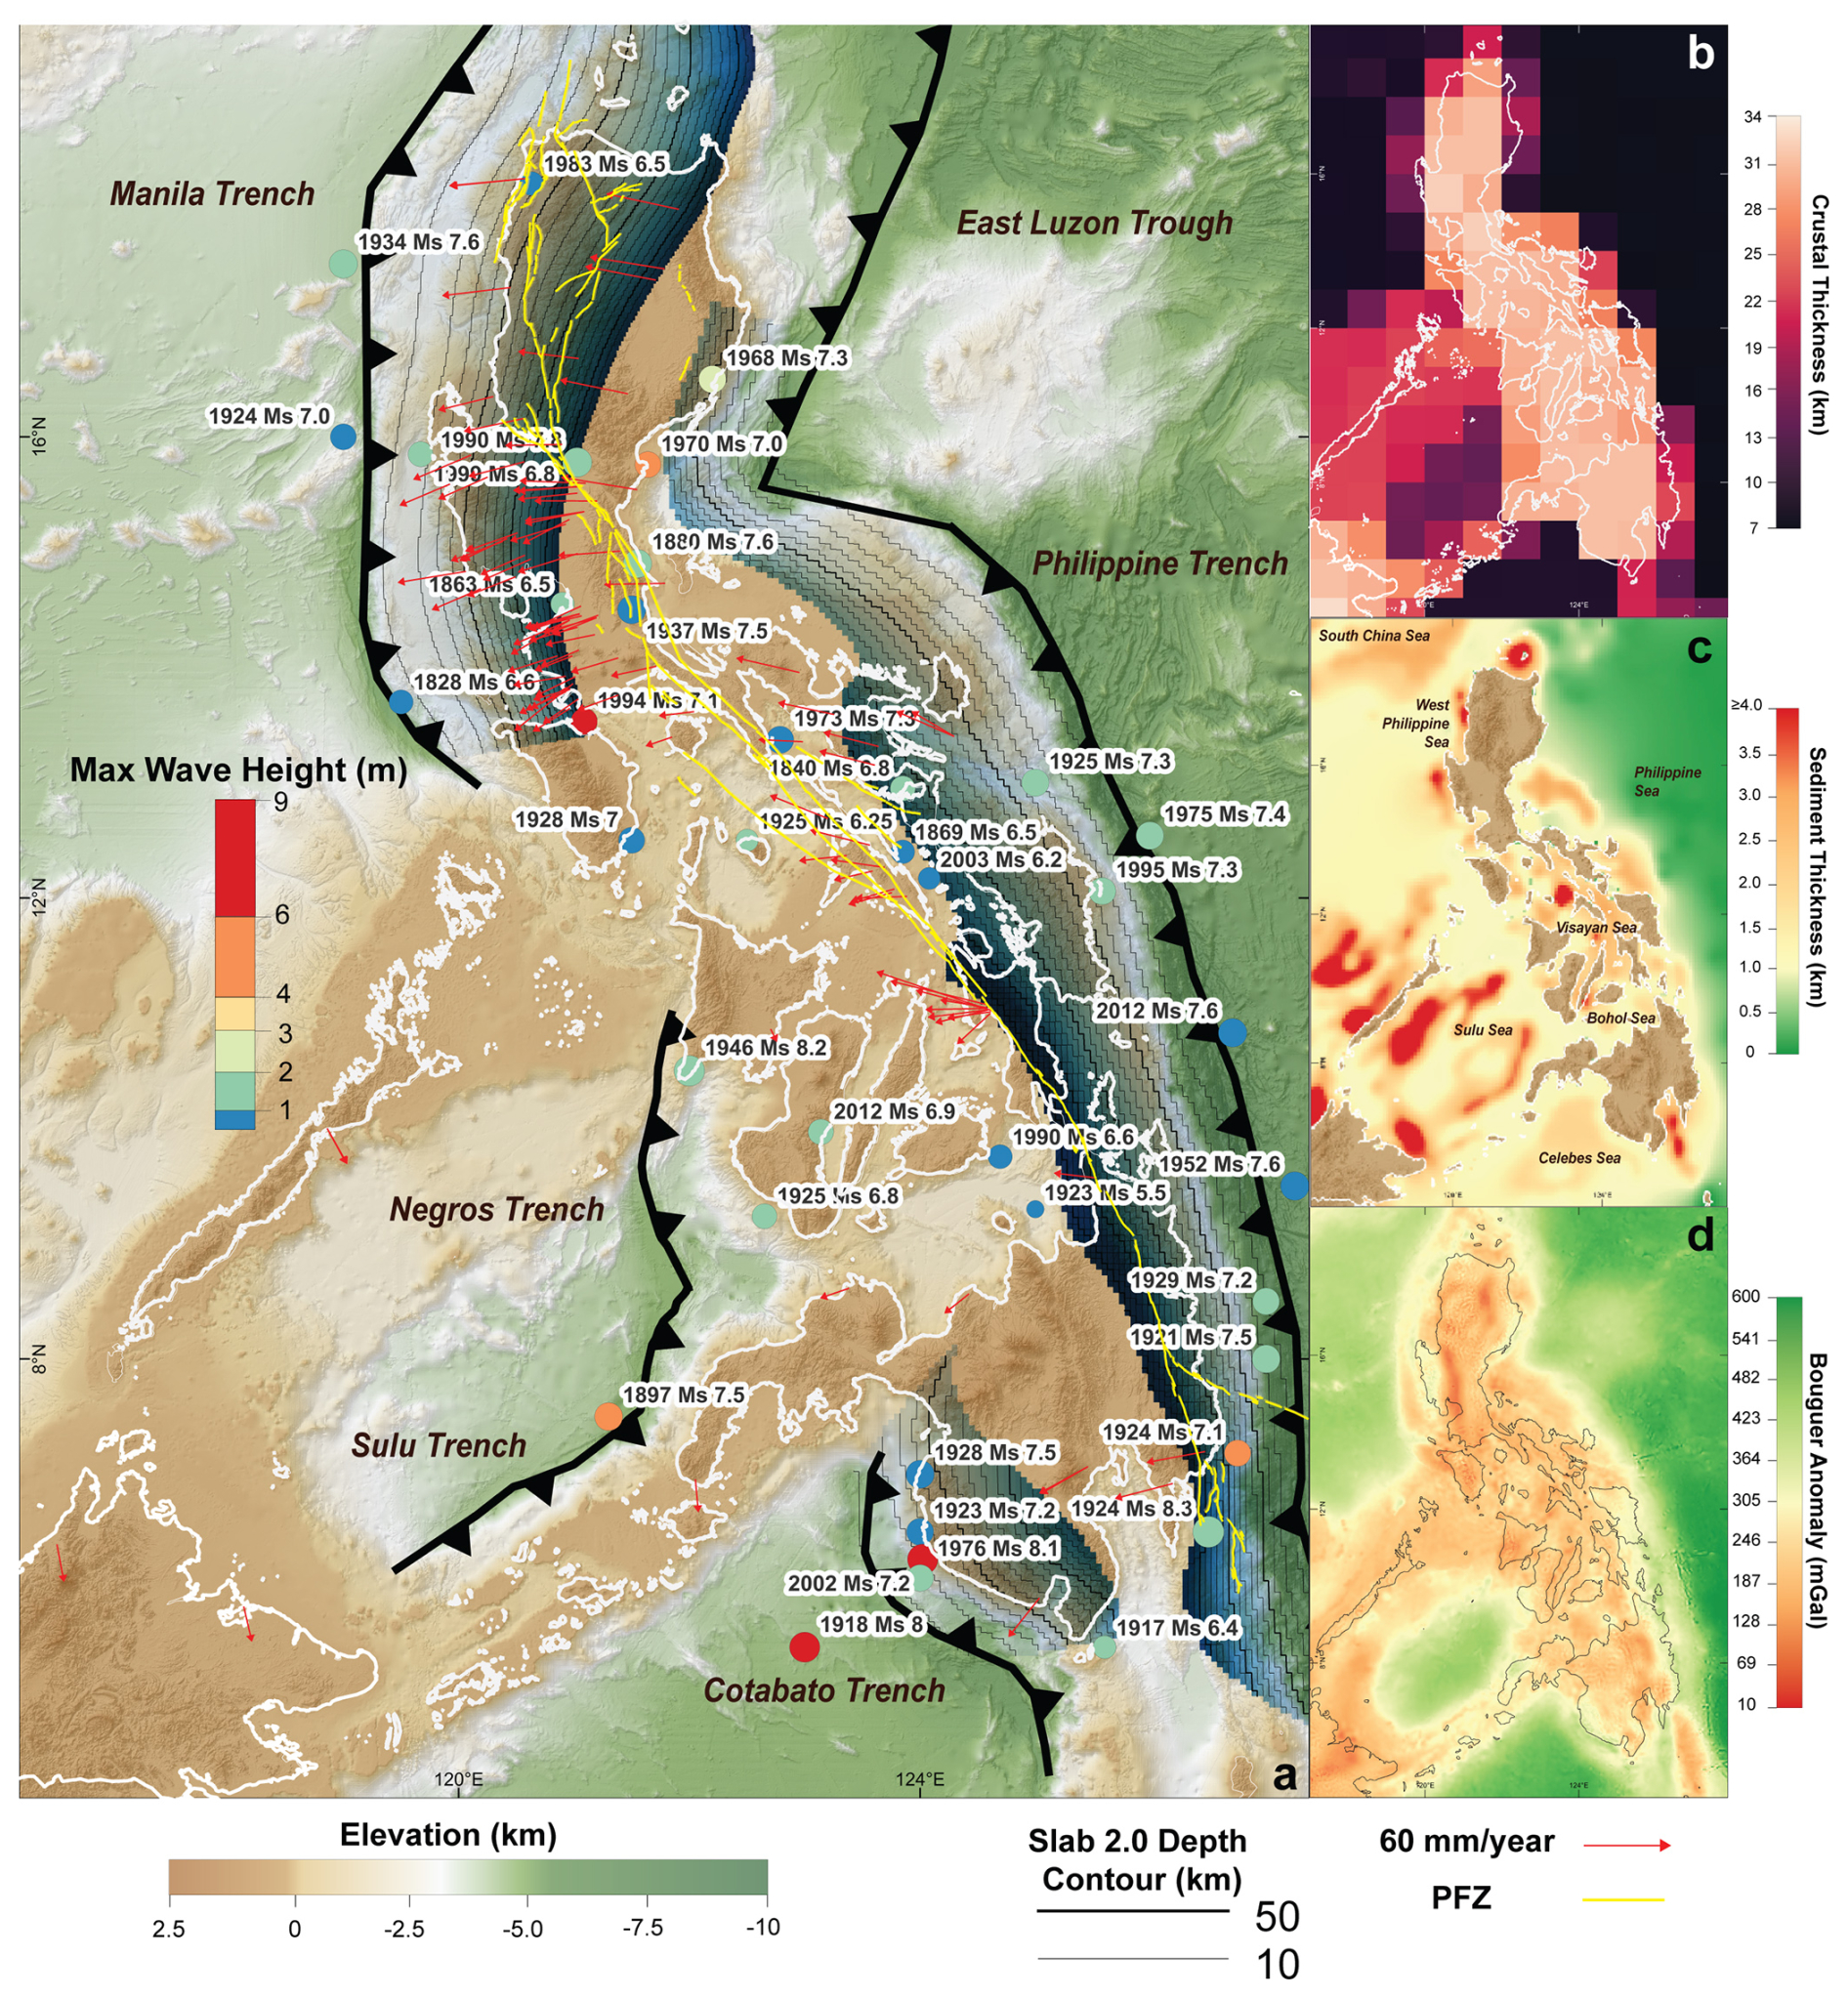
Figure 1Philippine tectonic setting. (a) Estimated epicenters of positive tsunamigenic earthquakes and the associated eyewitness accounts of maximum wave heights in the affected coastal areas since 1589 (Bautista et al., 2012). The trace of the Philippine Fault Zone (PFZ) was adapted from PHIVOLCS. Depth contours of the Slab 2.0 model from Hayes et al. (2018). Arrows indicate the velocity vectors relative to no-net-rotation reference frame from inland GPS networks (Kreemer et al., 2014). Bathymetry and topography data from the 2024 General Bathymetric Chart of the Oceans (© GEBCO Compilation Group, 2024). (b) Crustal thickness (Laske et al., 2013), (c) sediment thickness (Straume et al., 2019), and (d) Bouguer anomaly (Balmino et al., 2012) across the archipelago.
One of the primary goals when inferring future megathrust ruptures is to establish seismic gaps, and coupling models with slip deficits are used to derive these locked segments from geodetic measurements (e.g., Chlieh et al., 2008; Métois et al., 2013, 2016; Michel et al., 2019; Moreno et al., 2010; Ozawa et al., 2012). However, with the current temporal limitation of geodetic records compared with the hundred-to-thousand-year recurrence of megathrust earthquakes, uncertainty remains regarding the likelihood and extent of ruptures. Even in subduction zones with low coupling, evidence of past ruptures and tsunamis was identified (e.g., Bécel et al., 2017; Debaecker et al., 2026; Witter et al., 2016), highlighting the limitations of solely relying on coupling models to infer future ruptures.
Coupling models have been constrained in the Manila, East Luzon, and Philippine Trench as well as along the Philippine Fault Zone (PFZ) (Galgana et al., 2007; Hsu et al., 2012, 2016) as GPS networks are dense in these regions. On the other hand, a sparse GPS network along the Negros–Sulu Trench inhibits identifying locked segments with slip deficits that may rupture. The current Slab 2.0 of global subduction zone geometry (Hayes et al., 2018) includes all trenches in the Philippines except the Negros–Sulu Trench, and while previous studies have provided tomography profiles of the Negros Trench (Fan et al., 2017; Fan and Zhao, 2019), the geometry of the Negros–Sulu megathrust remains uncertain.
Although earlier source estimation and tsunami modeling exist in this active margin (Nurashid et al., 2013; Okal et al., 2011; Pedersen et al., 2011; Salcedo and Hara, 2011; Zhao and Niu, 2022), the uncertainties of the slab geometry were not accounted for, as well as updated scaling equations more suitable for megathrust ruptures and hydrodynamic complexities such as nonlinear effects and Boussinesq dispersion. To fill these gaps and provide crucial information on the tsunami wave characteristics, this study estimated the megathrust earthquake source parameters in the Negros and Sulu subduction zones using a structural-based segmentation and scaling-relation approach. We produced three slab dip scenarios and used the estimated source parameters to model tsunamis and identify potentially exposed coastal areas across the coastal areas surrounding the Sulu Sea.
The amalgamation of different terranes in the Philippine Mobile Belt is a consequence of the complex interaction among the Pacific, Philippine Sea, Eurasia, and Indo–Pacific plates, leading to its present configuration marked by oppositely dipping subduction zones and the PFZ across the archipelago (Aurelio, 2008; Aurelio et al., 2013; Hilde et al., 1977; Holloway and Hall, 1996; Yumul et al., 2003, 2008; Zahirovic et al., 2014). These subduction zones include the East Luzon Trough, Philippine, Manila, Negros–Sulu, and Cotabato trenches that can potentially generate great to epic (M>8) megathrust earthquakes (e.g., Li et al., 2016; Qiu et al., 2019; Ramos et al., 2017; Wu and Huang, 2009). Peñarubia et al. (2020) evaluated an empirical Gutenberg–Richter (GR) magnitude–frequency distribution (MFD) in these subduction zones. The b-values range from 0.691 to 1.724, based on the declustered seismicity catalog from the International Seismological Centre (ISC) and the Philippine Institute of Volcanology and Seismology (PHIVOLCS), where <1.0 indicates that large earthquakes contribute more to the long-term seismic moment rate (Nishikawa and Ide, 2014). In the study, the number of earthquakes in the declustered catalog in all trench segments was less than 300, with the majority of the segments having <50 (Peñarubia et al., 2020). In the Negros and Sulu subduction zones, only 7 and 21 earthquakes, respectively, were used to evaluate the GR MFD, with resulting b-values of 1.084 for Negros and 0.797 for Sulu. With longer and denser seismicity records, constraints on the GR MFD in this region will further improve. However, even with relatively denser declustered seismicity, rheological conditions and seismic behavior are not fully captured due to the complex factors affecting frictional heterogeneity (Chlieh et al., 2008; Fagereng and Beall, 2021; Fan and Zhao, 2021; Volpe et al., 2023; Yabe and Ide, 2018) and the short span of observations relative to the apparent hundred-to-thousand-year recurrence of megathrust earthquakes.
Inland GPS networks in the Philippines (Galgana et al., 2007; Hsu et al., 2016; Kreemer et al., 2014; Rangin et al., 1999) are mostly distributed in Luzon and eastern Philippines, revealing a west-northwest motion (Fig. 1a), while sparse GPS data in the southwestern Philippines show a south–southwest direction. The oceanic plates subducting beneath the five subduction zones have a crustal thickness ranging from 7 to 15 km (Fig. 1b), where relatively thicker crusts (>15 km) are linked to the island arcs across the Philippine Archipelago (Laske et al., 2013). PHILCRUST 3.0 provides a higher resolution inland crustal thickness varied by different island growth rates and terranes (Parcutela et al., 2020). Based on the global dataset from Straume et al. (2019), the majority of marginal seas and active margins in the Philippines are characterized by ≥1 km thick overlying sediments (Fig. 1c), except in the Philippine Sea. The Sulu Sea is particularly marked by high sediment thickness of up to 6 km. Estimates on the gravity variations in the Philippines from Balmino et al. (2012) show distinct high Bouguer anomalies (>300 mGal) of the subducting oceanic basins where the trench marks the boundary of the active margin and island arcs with relatively lower (<300 mGal) Bouguer anomaly signatures (Fig. 1d). The NW Sulu sub-basin, with the thickest sediments, has a lower Bouguer anomaly than the SE Sulu sub-basin. Past GPS campaigns estimated convergence rates of <60 mm yr−1 along the Negros–Sulu subduction zone (Rangin et al., 1999; Simons et al., 1999).
3.1 Constraining Megathrust Fault Parameters
Simplified rectangular fault models were adapted for the megathrust with parameters length (km), width (km), strike (°), dip angle (°), depth from the seafloor (km), rake (°), and slip amount (m). Insights from previous seismic tomography profiles (Fan et al., 2017; Fan and Zhao, 2019; Sevilla, 2011) on the geometry of the subducting slab reveal tapering of high P-wave velocity in the northern Negros Trench segment west of Panay Island, which provides limiting constraints on the length of the northern Negros Trench segment. Steepening of the subducting slab was also observed in the seismic tomography profiles around 100 km depth, although this is well beyond global seismogenic zones. Best-fit estimates on the slab dip of the shallow portion of the subducting slab derived from the tomography profiles within 50 km depth range from 9 to 30°. Focal mechanism solutions (ISC data from 1977 to 2023) of reverse-oblique rake values (10 to 170°) (Bondár et al., 2015; Di Giacomo et al., 2015, 2018; Storchak et al., 2013, 2015) also show a wide distribution of dip angles ranging from 9 to 90° (Fig. 2). To account for this uncertainty of the slab dip, we used three dip angles for all source parameters at 10, 20, and 30°.
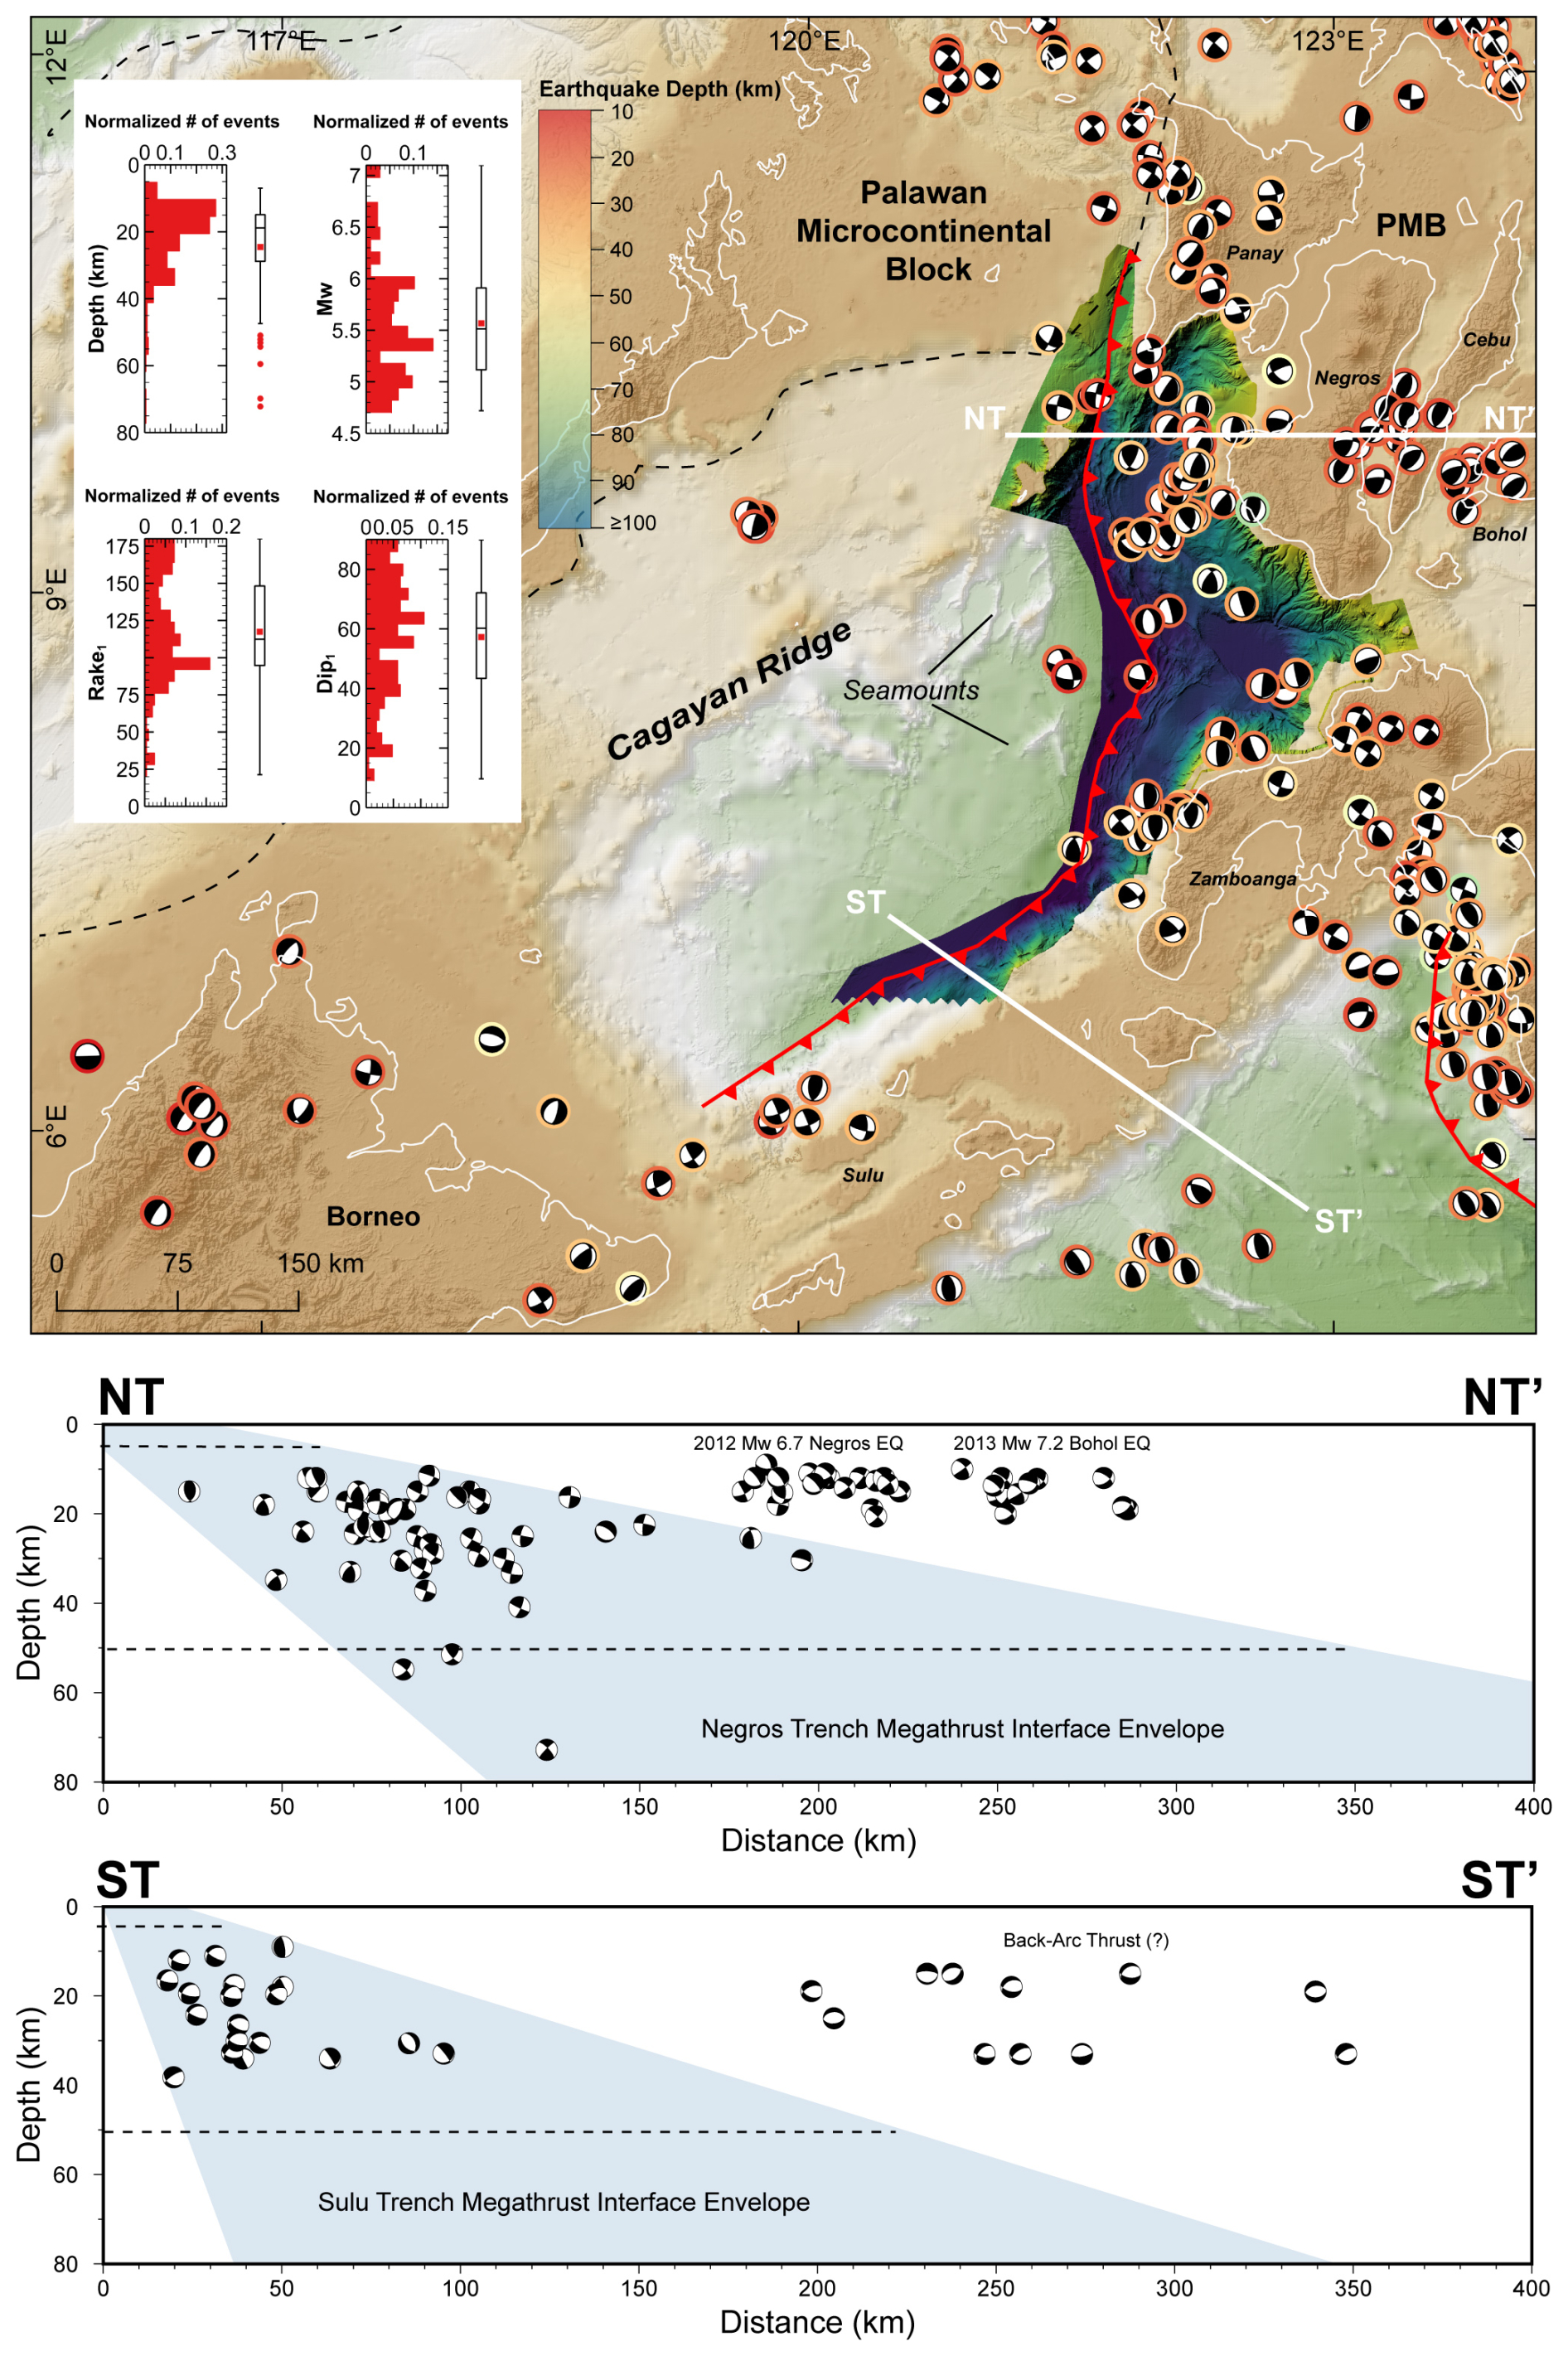
Figure 2Reverse-oblique focal mechanism solutions (1977–2023) of earthquakes along the Negros–Sulu subduction zone collated by the International Seismological Centre (ISC) (Bondár et al., 2015; Di Giacomo et al., 2015, 2018; Storchak et al., 2013, 2015). Earthquakes in the cross-sectional profiles (NT–NT′ and ST–ST′) are within 80 km depth and 200 km distance from each side of the profile. The possible interface of the megathrust fault plane is marked in the light blue zone, and dashed lines indicate the upper and lower boundaries of the megathrust rupture.
We utilized a structural-based segmentation in which the megathrust fault length is derived from the orientation variations of the frontal wedge (i.e., Nawanao and Ramos, 2023), and the width and bottom depth are limited by the seismogenic zone. These led to four main segments of the Negros–Sulu subduction zone, namely, NT1, NT2, ST1, and ST2. The NT1 and NT2 are marked by north-northeast and north-northwest orientations, respectively, while the ST1 and ST2 by north–northeast and northeast, respectively (Fig. 3a). Due to the uncertainty of the northern extent of NT1 where P-wave velocity profiles of Fan et al. (2017) and Fan and Zhao (2019) indicate tapering of the slab northward, we included longer (NT1-1) and shorter (NT1-2) rupture lengths for NT1. For the Sulu Trench, an additional longer segment (ST) that combines ST1 and ST2 is also modeled due to their similar northeast trend. This segmentation results in six subfaults, i.e., NT1-1, NT1-2, NT2, ST, ST1, ST2.

Figure 3Megathrust fault parameterization of Negros–Sulu Trench segments. (a) A total of 18 sets of megathrust fault parameters were utilized for the tsunami modeling based on six segments and three dip angle scenarios. (b) Cross-section schematic diagram of the megathrust plane, where the width saturates at 196 km and is calculated using sine function. (c) Six cross-sectional segments of the Negros–Sulu subduction zone projected in the N–S profile. The colors of the megathrust plane follow those in Fig. 3a.
A shallow blind rupture is assumed for all scenarios with a top depth of 5 km and a rake of 90° (purely reverse slip). Based on the interquartile range (1.5 IQR) of 207 reverse-oblique earthquakes (Fig. 2), a threshold depth of 50 km was set as the bottom depth of the seismogenic zone. The width of the megathrust is calculated using sine function from the top and bottom depth, with the given the dip angles, and we adopted a saturation limit of 196 km as observed in global subduction zones (Allen and Hayes, 2017; Skarlatoudis et al., 2016; Tajima et al., 2013). The dip angles 10, 20, and 30° correspond to 196 (maximum width limit), 132, and 90 km, respectively (Fig. 3).
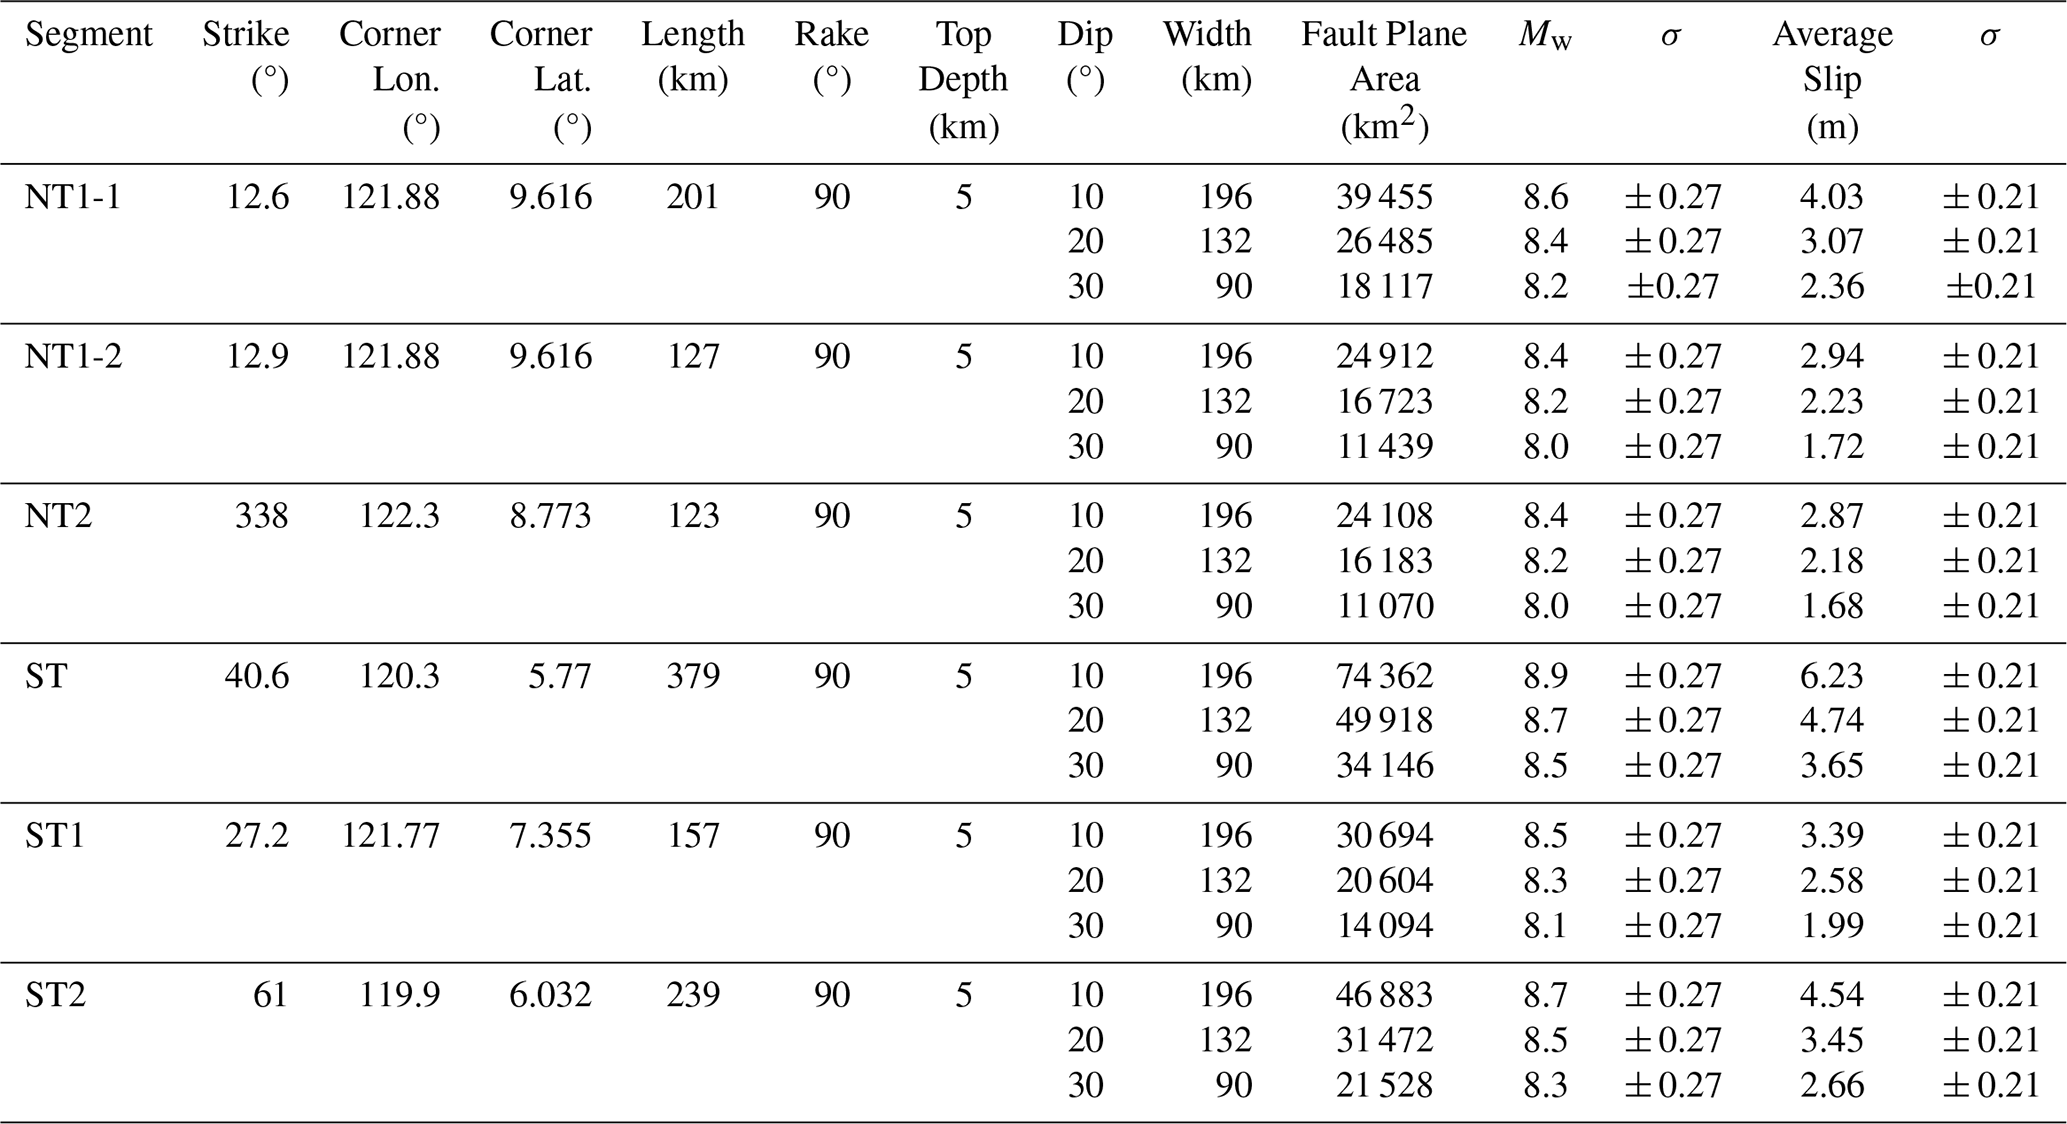
To account for the variability of length and width, the area (S) of the fault plane is used as input in the linear rupture-scaling equations (Eqs. 1–2) of Allen and Hayes (2017) to estimate the maximum Mw and the average (Dave) slip (m). The linear area–Mw was preferred over the bilinear area–Mw scaling equation as the former produced slightly higher Mw, adopting a more conservative approach. A total of 18 sets of source parameters were constrained for elastic dislocation and tsunami modeling, with the ST (379 km) and NT1-1 (201 km) having the longest lengths (Table 1). Estimates of the moment magnitude from scaling equations range from Mw 8.0 to 8.9 (±0.27), where the ST segment with the longest fault length has the largest magnitude. These earthquake magnitudes correspond to an average slip of 1.68–6.23 m (±0.21).
Table 1Negros–Sulu megathrust fault parameters of the six segments and three dip angle scenarios based on the scaling equations of Allen and Hayes (2017).
3.2 Tsunami Modeling
We utilized the 15 arcsec-resolution 2024 General Bathymetric Chart of the Oceans (GEBCO Compilation Group, 2024) bathymetry data as input for the tsunami simulation. To have a higher elevation accuracy of the topography, we resampled the interferometric synthetic aperture radar (IFSAR)-derived 5 m-resolution digital terrain model (DTM) (±1 m vertical accuracy) from the National Mapping and Resource Information Authority (NAMRIA) to 15 arcsec and merged it with the GEBCO bathymetry data. The resulting 15 arcsec IFSAR DTM–bathymetry raster served as the input depth in computing the initial seafloor and seawater displacement for tsunami modeling. As the entire coastal areas surrounding the Sulu Sea were considered for tsunami simulations, high-resolution subgrids for inundation models were not performed due to the absence of high-resolution nearshore bathymetry as well as restrictions in computational capacity and processing time.
The elastic deformation from the finite rectangular fault source is analytically solved through Green's function, assuming a homogeneous isotropic elastic half-space (Okada, 1985) and utilizing the average slip from the scaling equation. The tsunami wave propagation is modeled using two-dimensional nonlinear shallow water equations through the finite difference method (FDM) in a staggered grid deployed in the JAGURS numerical code (Baba et al., 2015, 2017). In JAGURS, both the initial vertical and horizontal seafloor displacement and Boussinesq dispersion effects are accounted for in the tsunami propagation. The modeling assumes a uniform surface roughness (Manning's coefficient = 0.025 s m), and we set a time step (Δt) of 0.5 s to maintain stability conditions based on the maximum depth (d), bathymetry resolution (Δx), and acceleration due to gravity (g) in Eq. (3) (Satake, 2002):
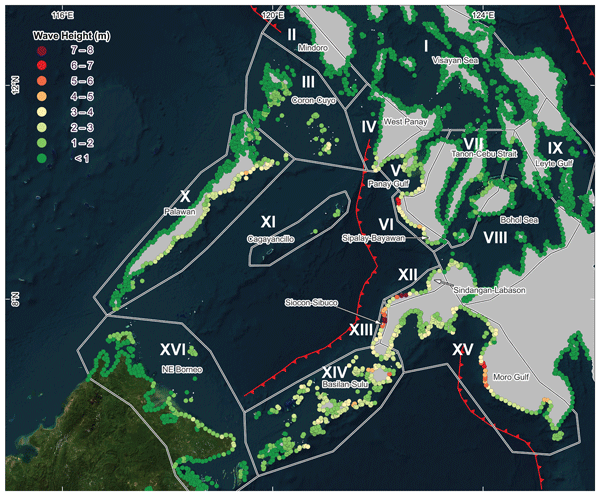
The tsunami wave propagation time was set to 4 h, and 34 synthetic tide gauge stations (TGS) (Fig. 4 and Table S1 in the Supplement) were positioned across the coastal areas surrounding the Sulu Sea. The coastal areas surrounding the Negros–Sulu Trench are subdivided into 16 regions: I, Visayan Sea; II, Mindoro; III, Coron–Cuyo; IV, West Panay; V, Panay Gulf; VI, Sipalay–Bayawan; VII, Tañon–Cebu Strait; VIII, Bohol Sea; IX, Leyte Gulf; X, Palawan; XI, Cagayancillo; XII, Sindangan–Labason; XIII, Siocon–Sibuco; XIV, Basilan–Sulu; XV, Moro Gulf; and XVI, northeast Borneo. To represent the minimum arrival time, maximum wave height, and flow velocity across the coastlines, 6879 sampling points were set at 10 km intervals, each with a radius of 5 km.
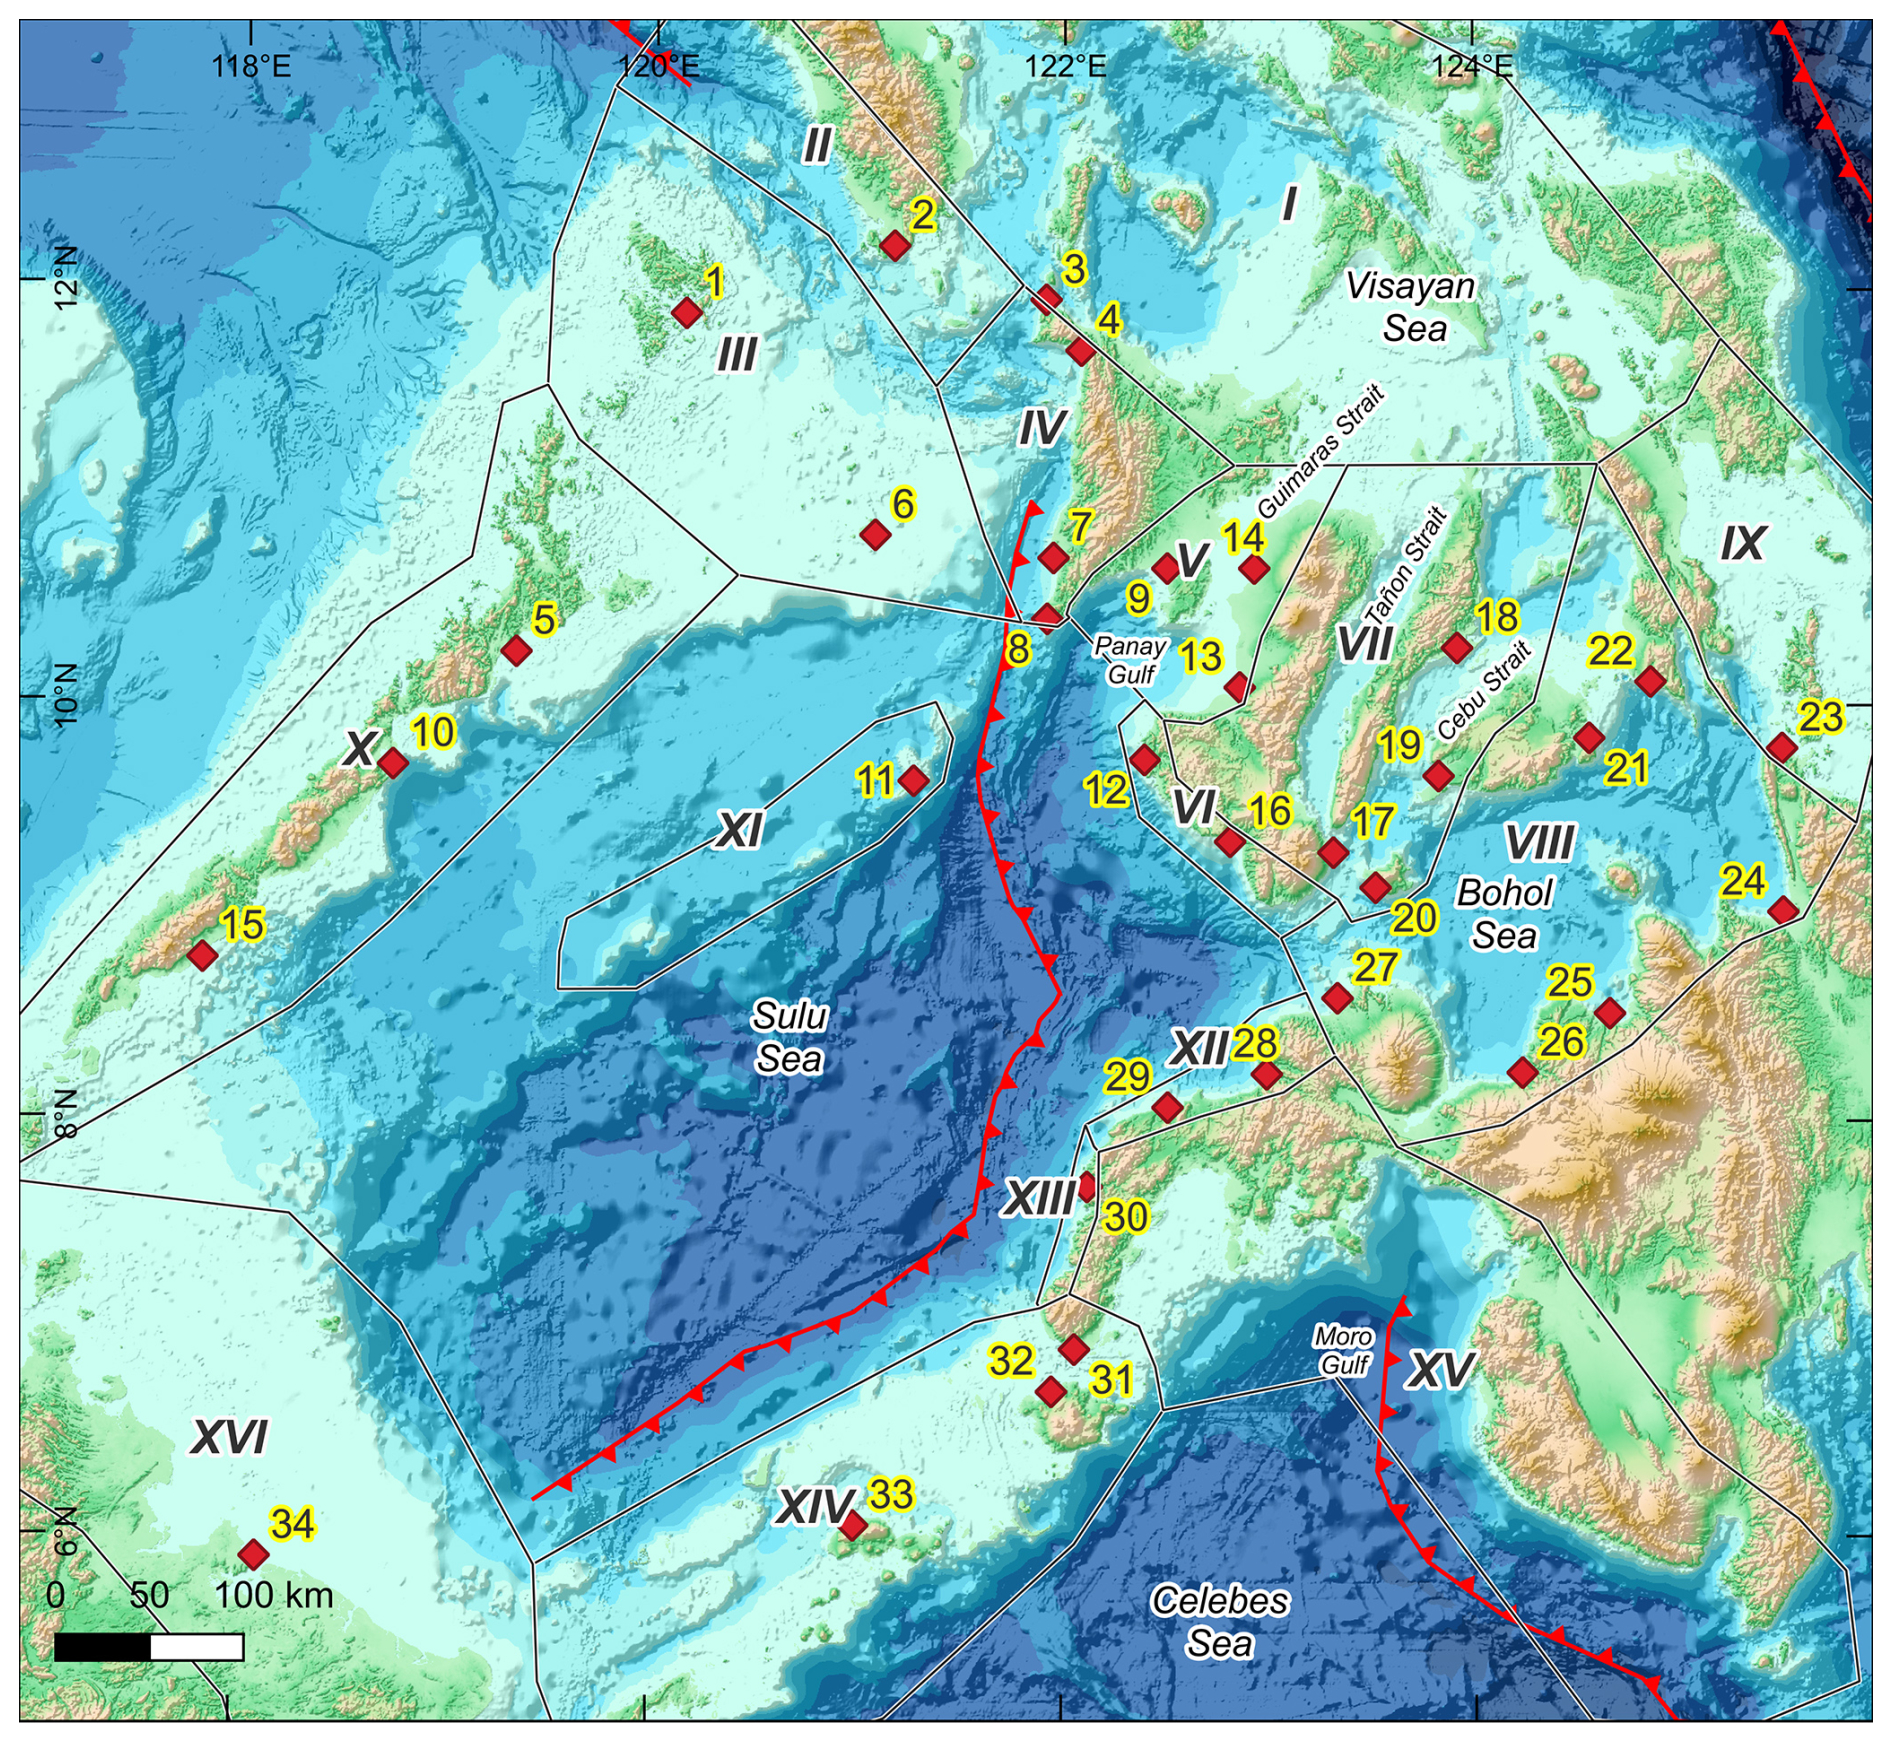
Figure 4The 16 coastal regions surrounding the Negros–Sulu subduction zone and the 34 synthetic tide gauge stations (TGS). (I) Visayan Sea; (II) Mindoro; (III) Coron–Cuyo; (IV) West Panay; (V) Panay Gulf; (VI) Sipalay–Bayawan; (VII) Tañon–Cebu Strait; (VIII) Bohol Sea; (IX) Leyte Gulf; (X) Palawan; (XI) Cagayancillo; (XII) Sindangan–Labason; (XIII) Siocon–Sibuco; (XIV) Basilan–Sulu; (XV) Moro Gulf; (XVI) northeast Borneo. Basemap from © GEBCO Compilation Group (2024).
Tsunami Models
Figures 5 and S1–S5 (in the Supplement) show the representative wave propagation snapshots from rupture scenarios of six segments (NT1-1, NT1-2, NT2, ST, ST1, ST2) based on the 20° slab dip. The initial wave propagation from all ruptures is characterized by strong east–west and northwest–southeast wave crests in the Negros and Sulu Trench, respectively. Short-period wave dispersion and interferences are also prevalent as waves propagate toward shallower depths. In I, III, VII, VIII, and IX, the combined effects of dispersion, diffraction, and refraction caused significant deformation of wave crests as they propagated toward the coasts.

Figure 5Tsunami wave (2 h) propagation from ST segment at 20° dip angle. Basemap from World Imagery Esri | Powered by Esri.
Coastal islands in direct proximity have <2 min arrival time, including V and VI for Negros Trench segments and XII, XIII, and XIV for Sulu Trench segments. Arrival times from Negros Trench segments in XI, XII, XIII, and northeast of X were about 10, 15, 30, and 45 min, respectively. As the initial wave approaches shallow depths, wave speed significantly drops as indicated by the compression of arrival time contours (Fig. 6). For instance, the first wave arrives in the southwest of X about 1 h after the initial displacement, while about 2 h in XVI. The effects of wave refraction, diffraction, and interference are also apparent in the deformed arrival time contours in the majority of coastal regions.
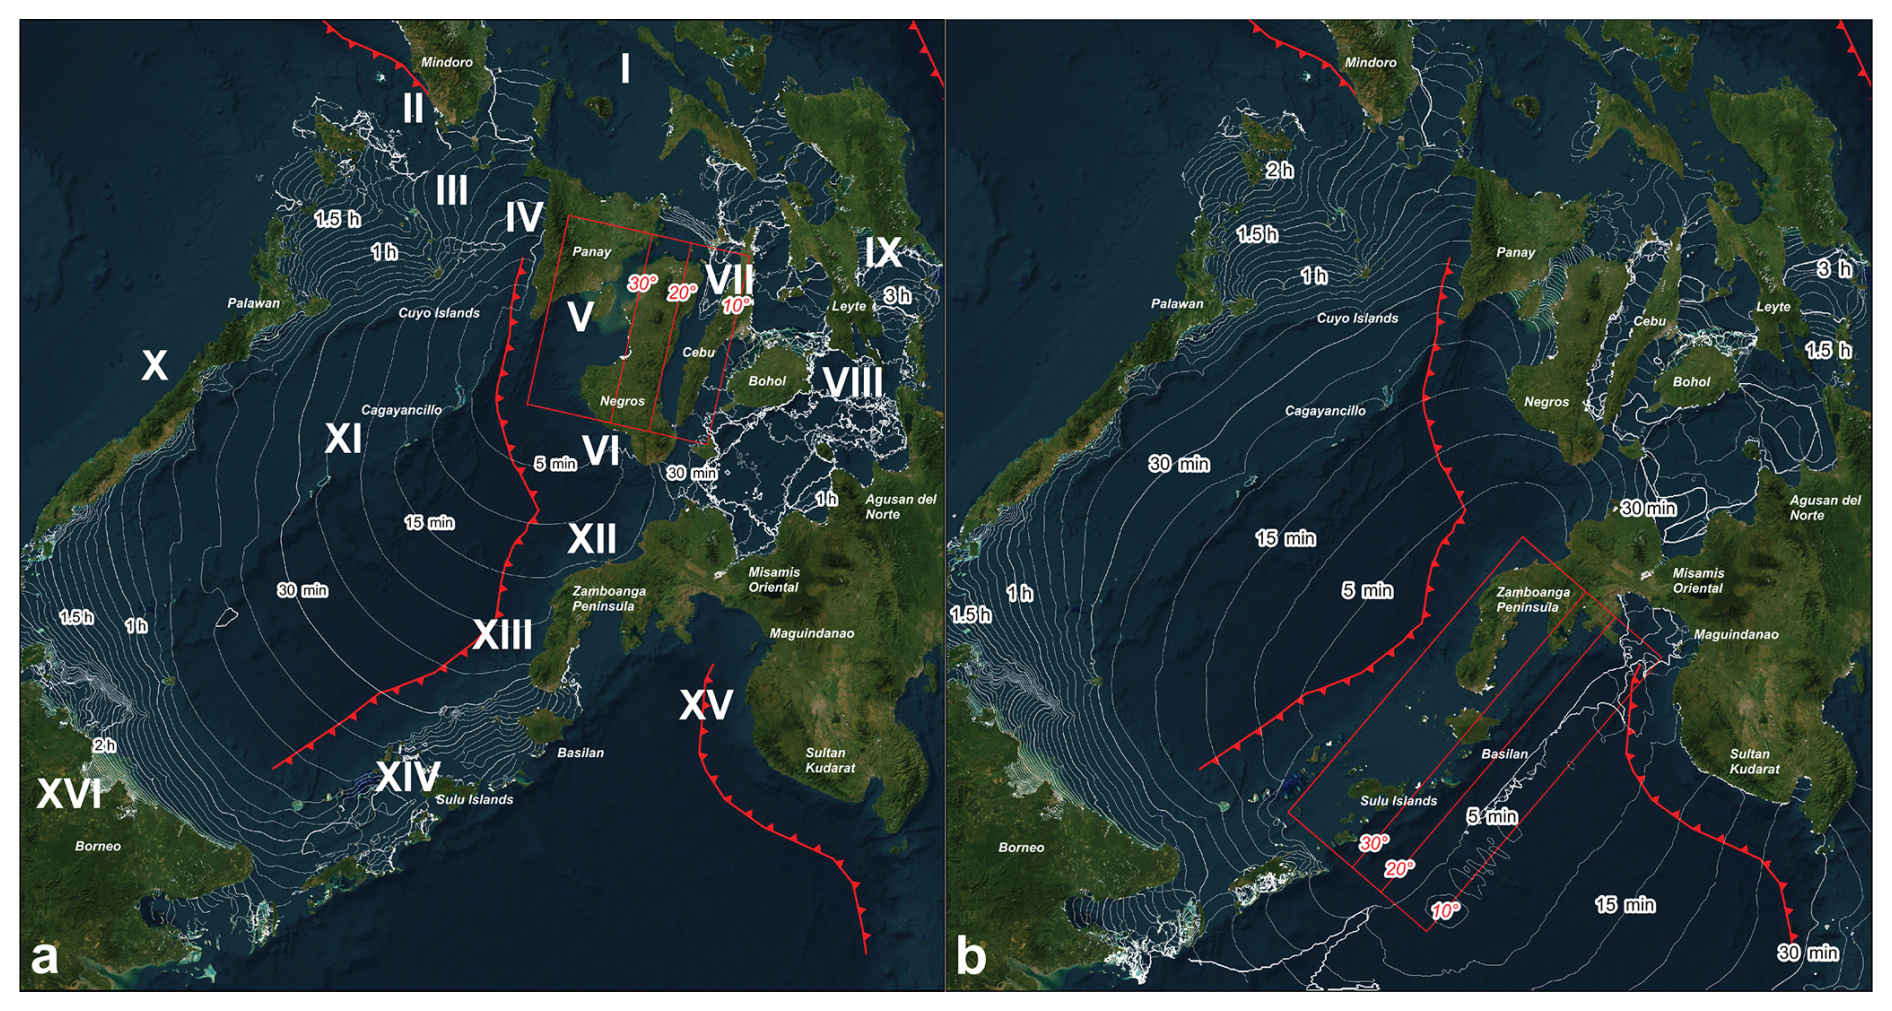
Figure 6Tsunami wave arrival times from (a) NT1-1 and (b) ST segments. Contours have 5 min intervals. (I)–(XI) indicate the 16 coastal regions described in Fig. 4. Basemap from World Imagery Esri | Powered by Esri.
For ST and ST1 segments, the initial wave arrives in VI, XI, IV, and III by 10, 20, 25, and 45 min, respectively. For ST2 segments, arrival times are around 30 min in VI and XI, while around 35 min, 45 min, and 1 h in XVI, V, and III, respectively. Tsunami waves from Sulu Trench segments can also pass through the XIV and propagate across the Celebes Sea, arriving in XV at about 10 min (Fig. 6).
Waveforms from 34 synthetic tide gauge stations (Figs. 7–8 and S6–S7) also indicate the arrival as the first crest or trough. Relatively long-period waves are apparent in TGS 1 Coron, 2 Pandarochan Bay, 13 Himamaylan, 14 Bacolod, and 18 Cebu, while the majority are dominated by short-period waves due to nonlinear and dispersion effects. Tsunami waves from all segments did not propagate in TGS 22 Surigao City within the 4 h simulation. In TGS 33 Jolo, dissipation also led to no tsunami waveforms from NT and ST1, while the ST and ST2 ruptures caused coastal uplift.

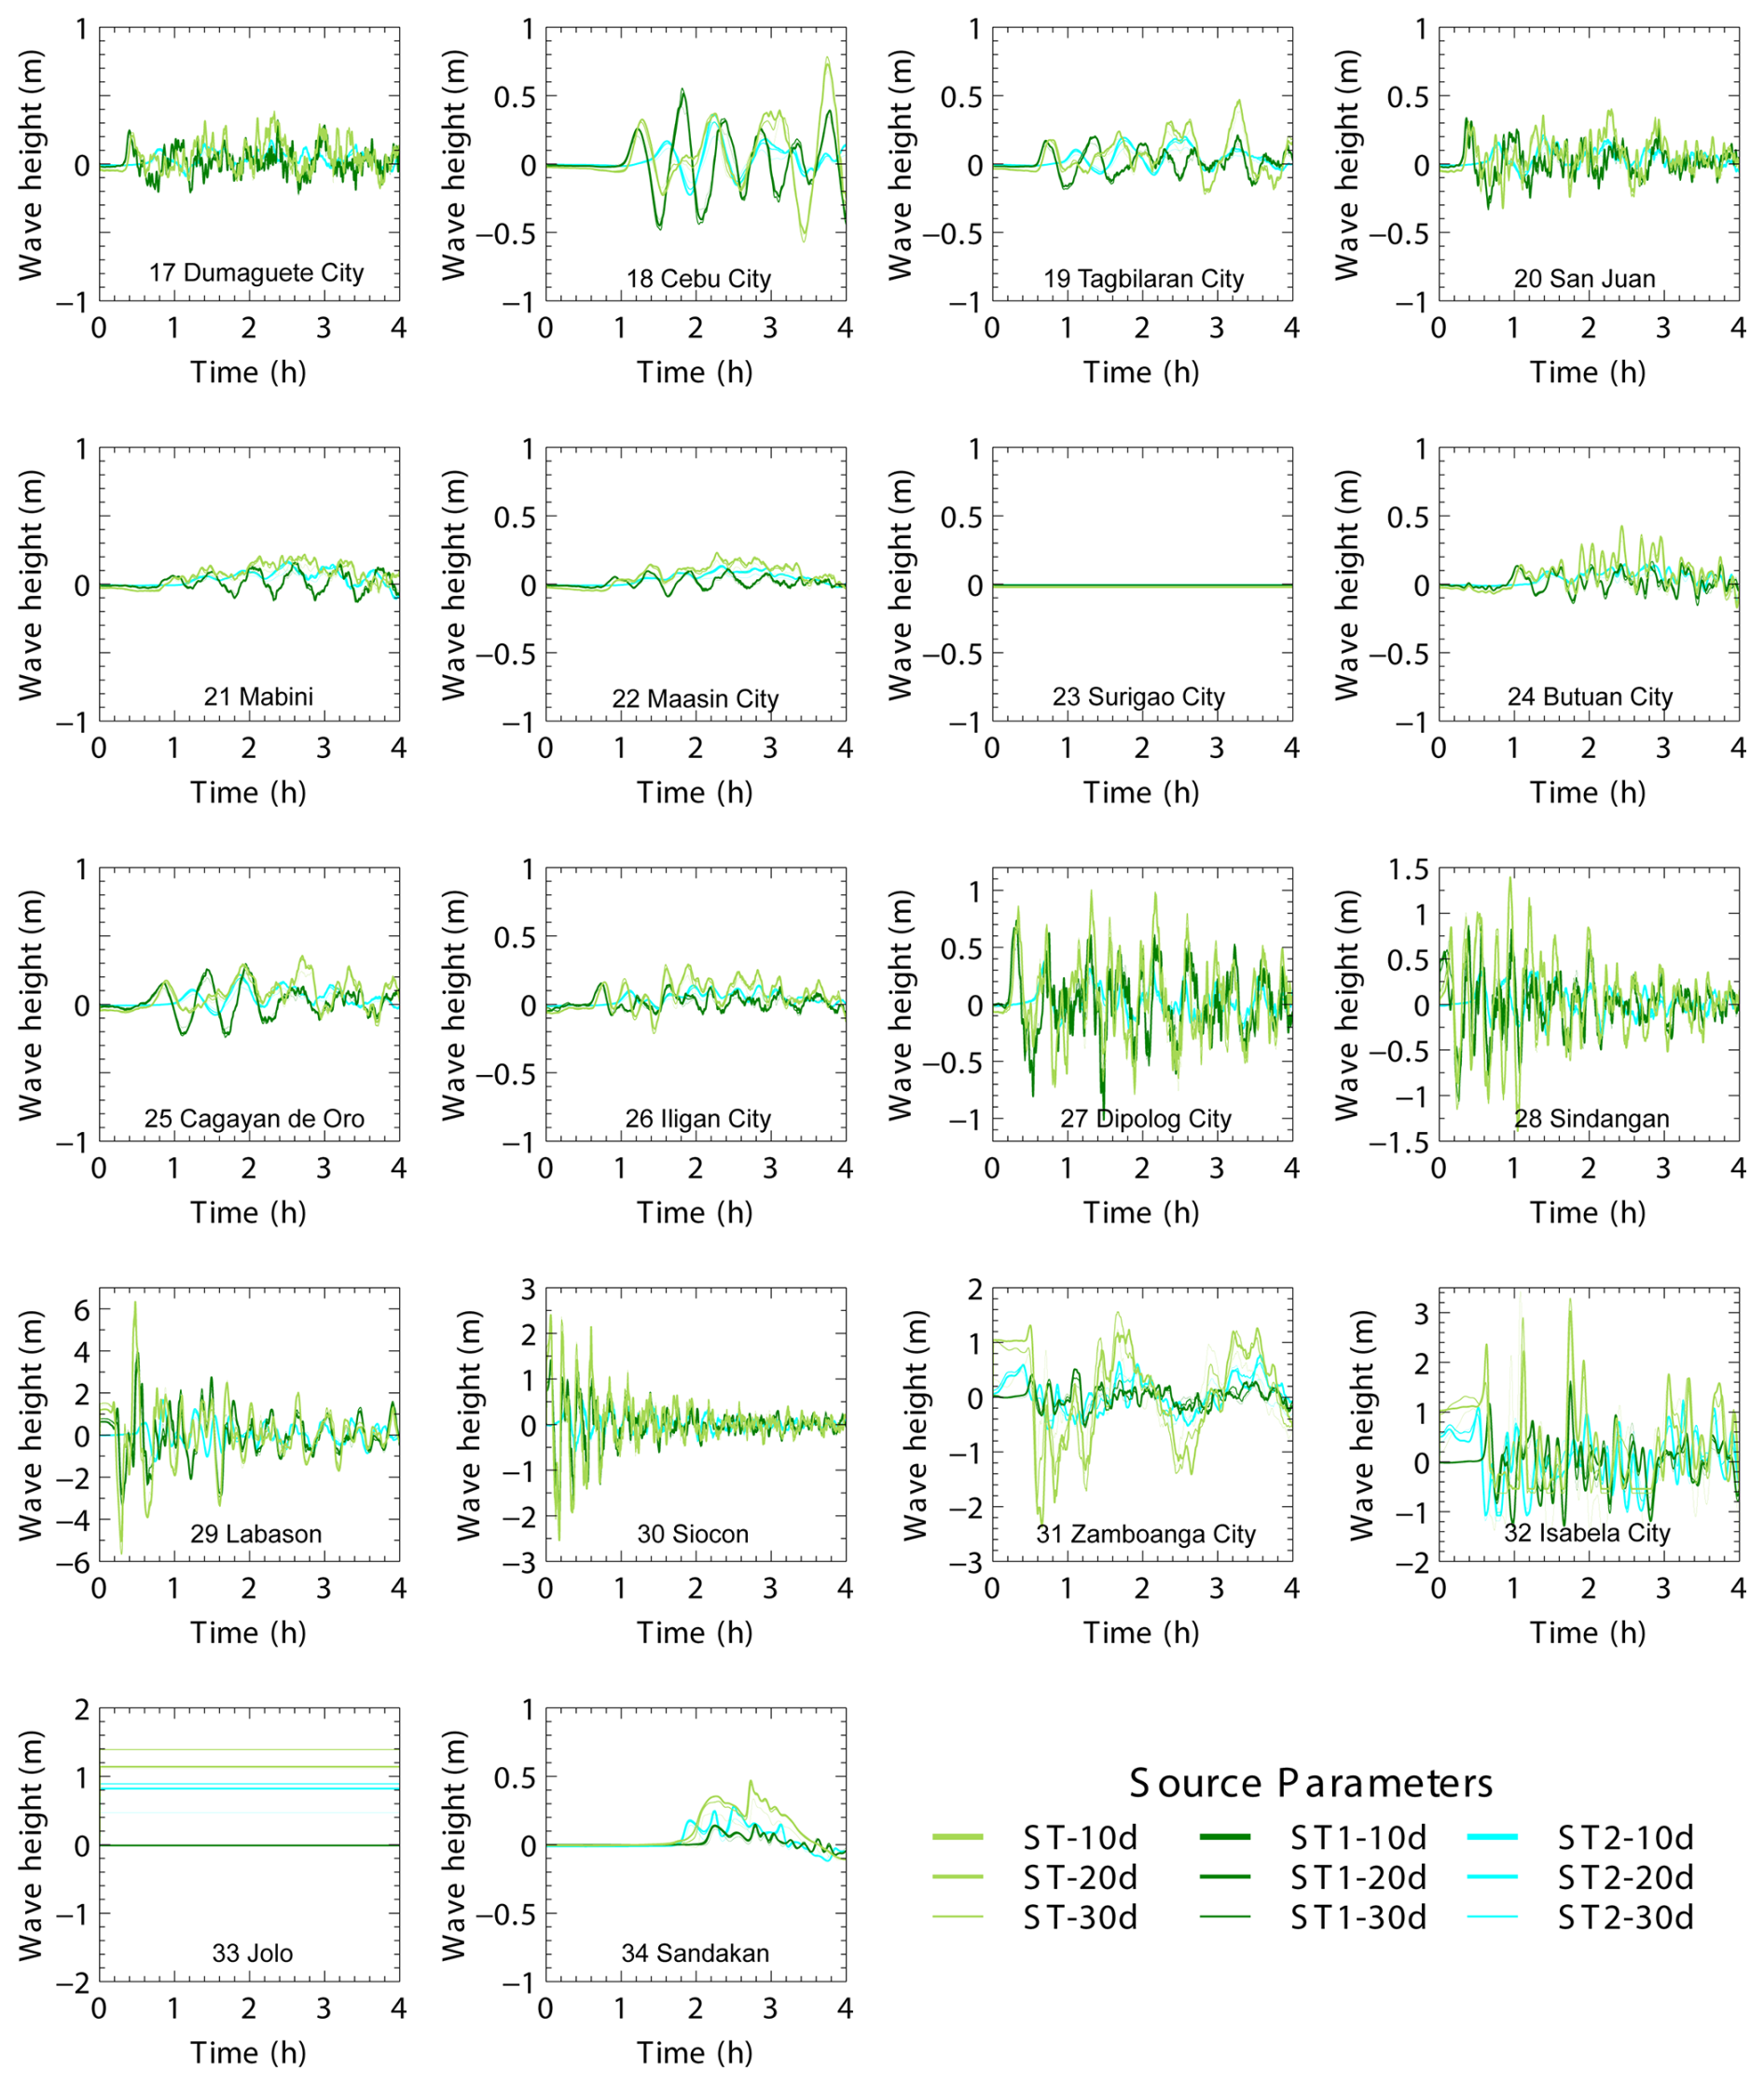
Figure 8Tsunami waveforms in TGS 17–34 from Sulu Trench segments (see Fig. 4 for locations).
The maximum wave height and flow velocity from six segments are shown in Fig. 9 (Figs. S8–S9) and Fig. 10 (Figs. S10–S11), respectively. The highest wave heights (>2 m) are observed in coastal areas parallel to the rupture segments, as also indicated in six tide gauge stations (13, 16, 28, 29, 30, 32). For NT1, tsunami waves reached up to 4–5 m in VI. For the NT2 segment, tsunami waves of up to 4 m are localized in VI. For ST and ST1 segments, the highest wave heights are located in XII (8 m) and XIII (5–7 m). Tsunami waves from ST segments propagate across the Celebes Sea, reaching 3–7 m in XV.
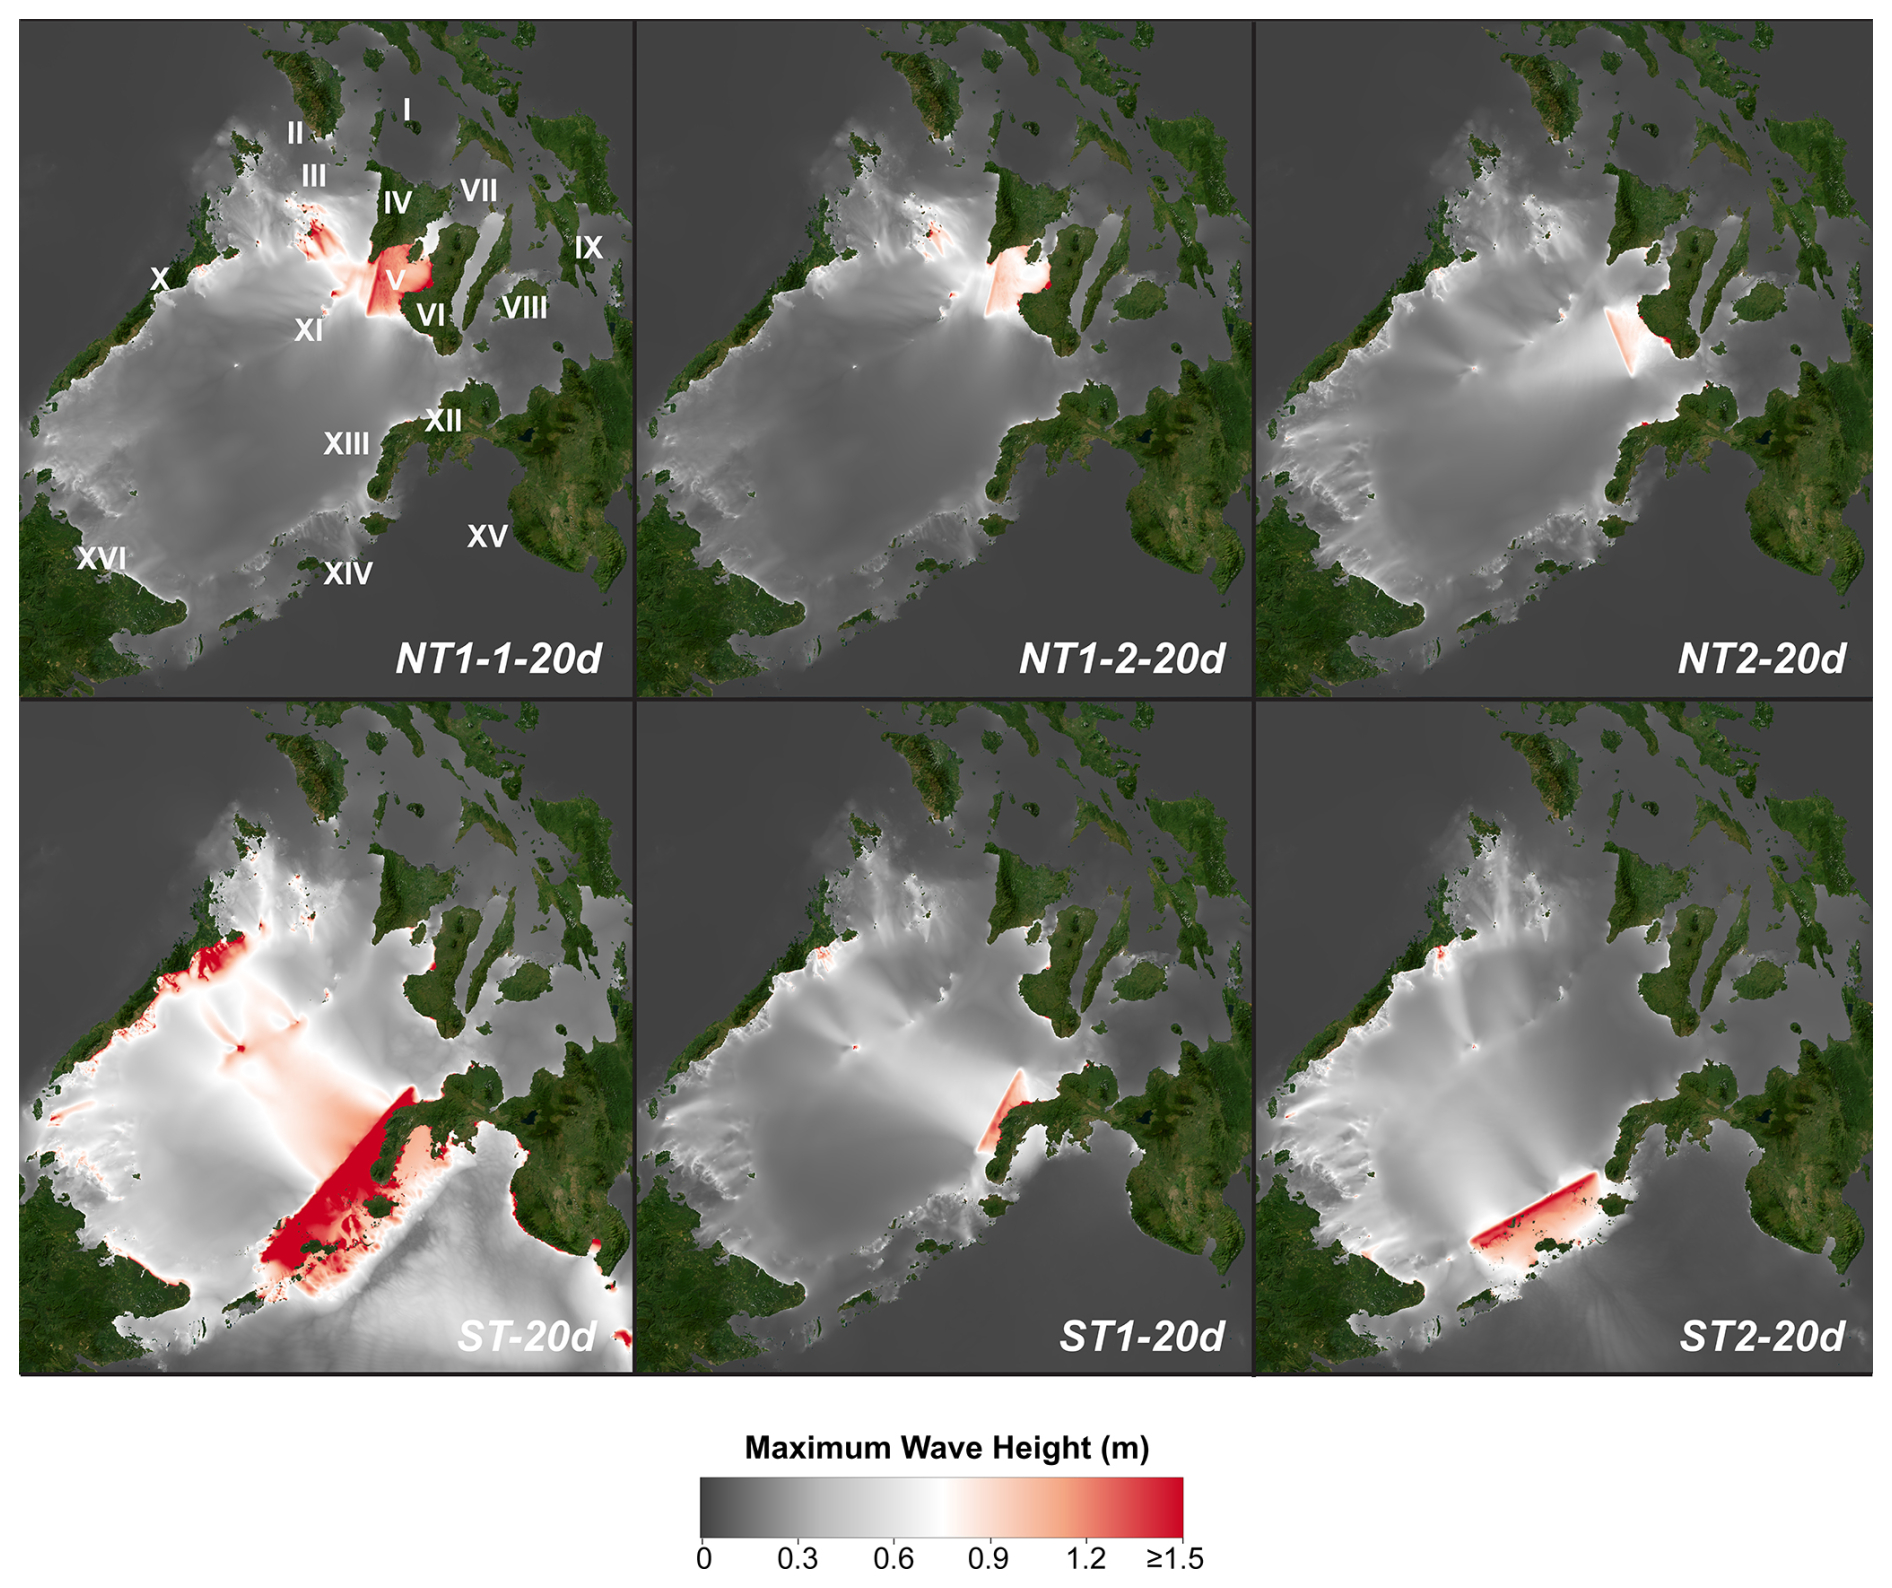
Figure 9Maximum wave height (m) from the 4 h tsunami simulation of six segments with a megathrust dipping at 20°. Basemap from World Imagery Esri | Powered by Esri.
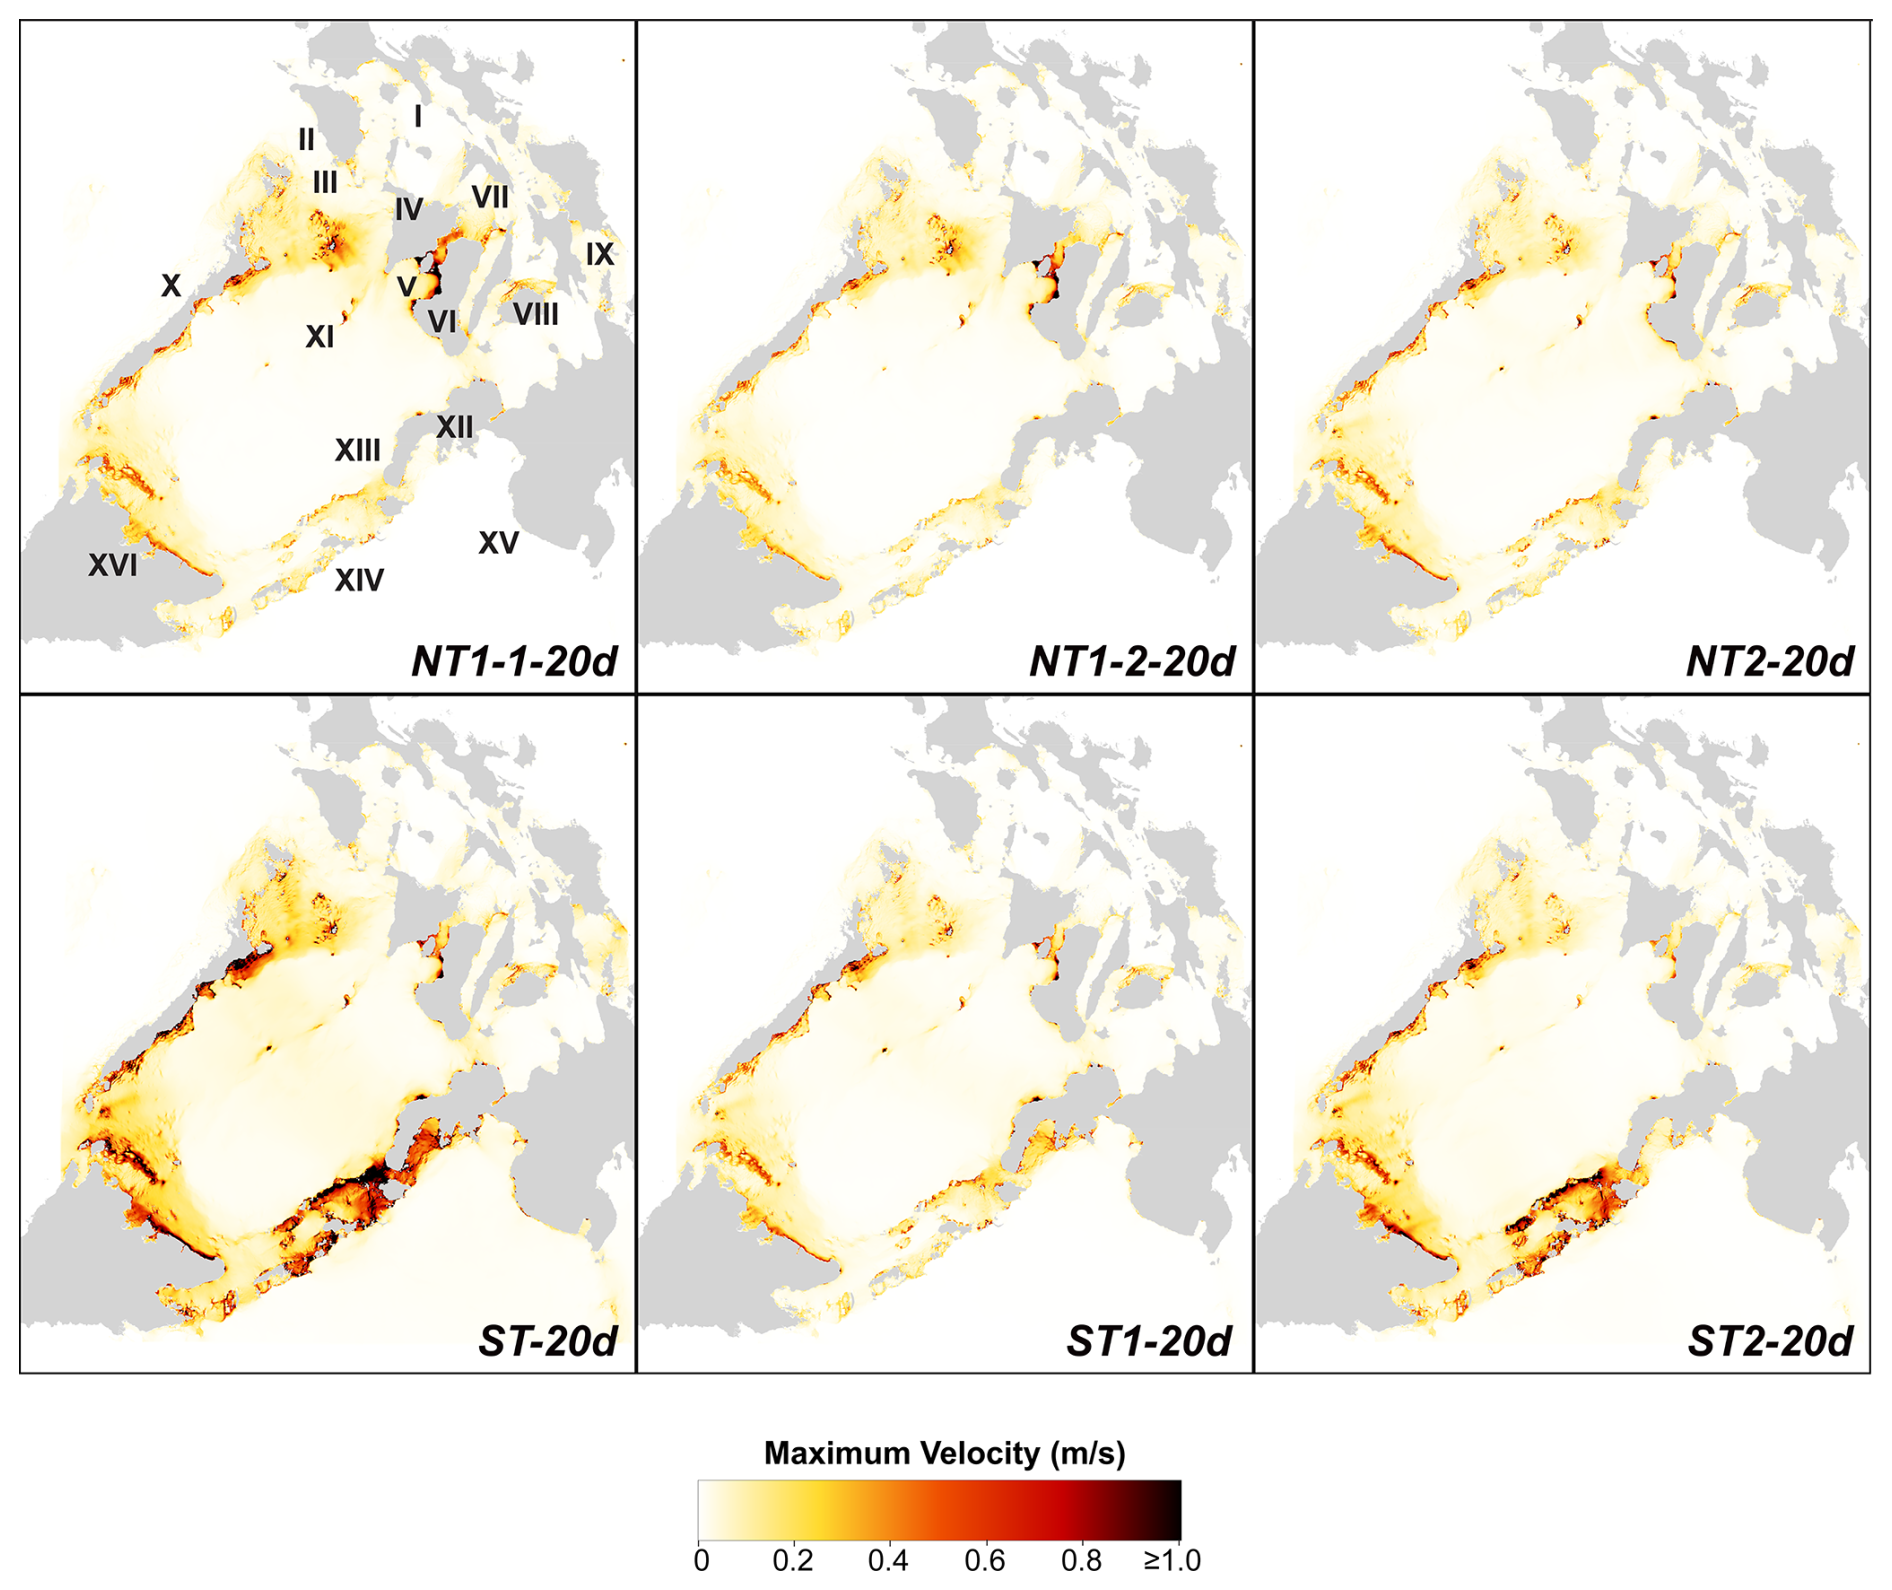
Figure 10Maximum flow velocity (m s−1) from the 4 h tsunami simulation of six segments with a megathrust dipping at 20°.
Coastal areas on the rear side and parallel to the trench segment also have relatively high tsunami waves. Negros Trench segments produced up to 2–3 m of tsunami wave heights in III and 1–2 m in XI and northeast of X. Sulu Trench segments also produced up to 3–4 m in X and up to 1–2 m in XI and III. The majority of the central Philippines (I, VII, VIII, IX), as well as in XVI, have wave heights of <1 m, except in some embayments and narrow channels where amplifications can reach 1–2 m.
The maximum tsunami wave height and flow velocity are coupled, i.e., coastal areas with the highest tsunami waves also have the highest flow velocity. For Negros Trench segments, the coastal areas with high tsunami waves in VI correspond to flow velocities of 3–7 m s−1, while reaching up to 3 m s−1 in III. For Sulu Trench segments, coastal areas in XII, XIII, XIV, and XV with the highest tsunami waves are exposed to a flow velocity of 3–6 m s−1. In coastal areas of northeast Palawan, the flow velocity reached 3–4 m s−1. The majority of coastal areas with <1 m tsunami wave height correspond to a maximum velocity of <1 m s−1.
Table 2 summarizes the maximum, minimum, and average differences of the maximum tsunami wave height and flow velocity from megathrust segments at 10° dip compared to 20 and 30°. A shallow-dipping megathrust tends to produce the largest earthquakes (Bletery et al., 2016; Schellart and Rawlinson, 2013), hence the use of the 10°-dip rupture parameter as a reference. This tendency is highlighted by the positive average and maximum differences among parameters. However, in certain regions, steeper initial seawater displacement from rupture parameters with 20 and 30° dip angles produced waveforms that preferentially led to higher maximum wave height and flow velocity as represented by the negative minimum differences. The spatial distribution of the maximum wave height and wave velocity differences among parameters is indicated in Figs. 11 and S12–S14.

Figure 11Maximum wave height differences (10–20 and 10–30°) comparing 10°-dip megathrust with those of 20 and 30° in the Sulu Trench (ST) segments.
Table 2Statistics of the maximum wave height and flow velocity differences comparing 10°-dip megathrust with 20 and 30°.
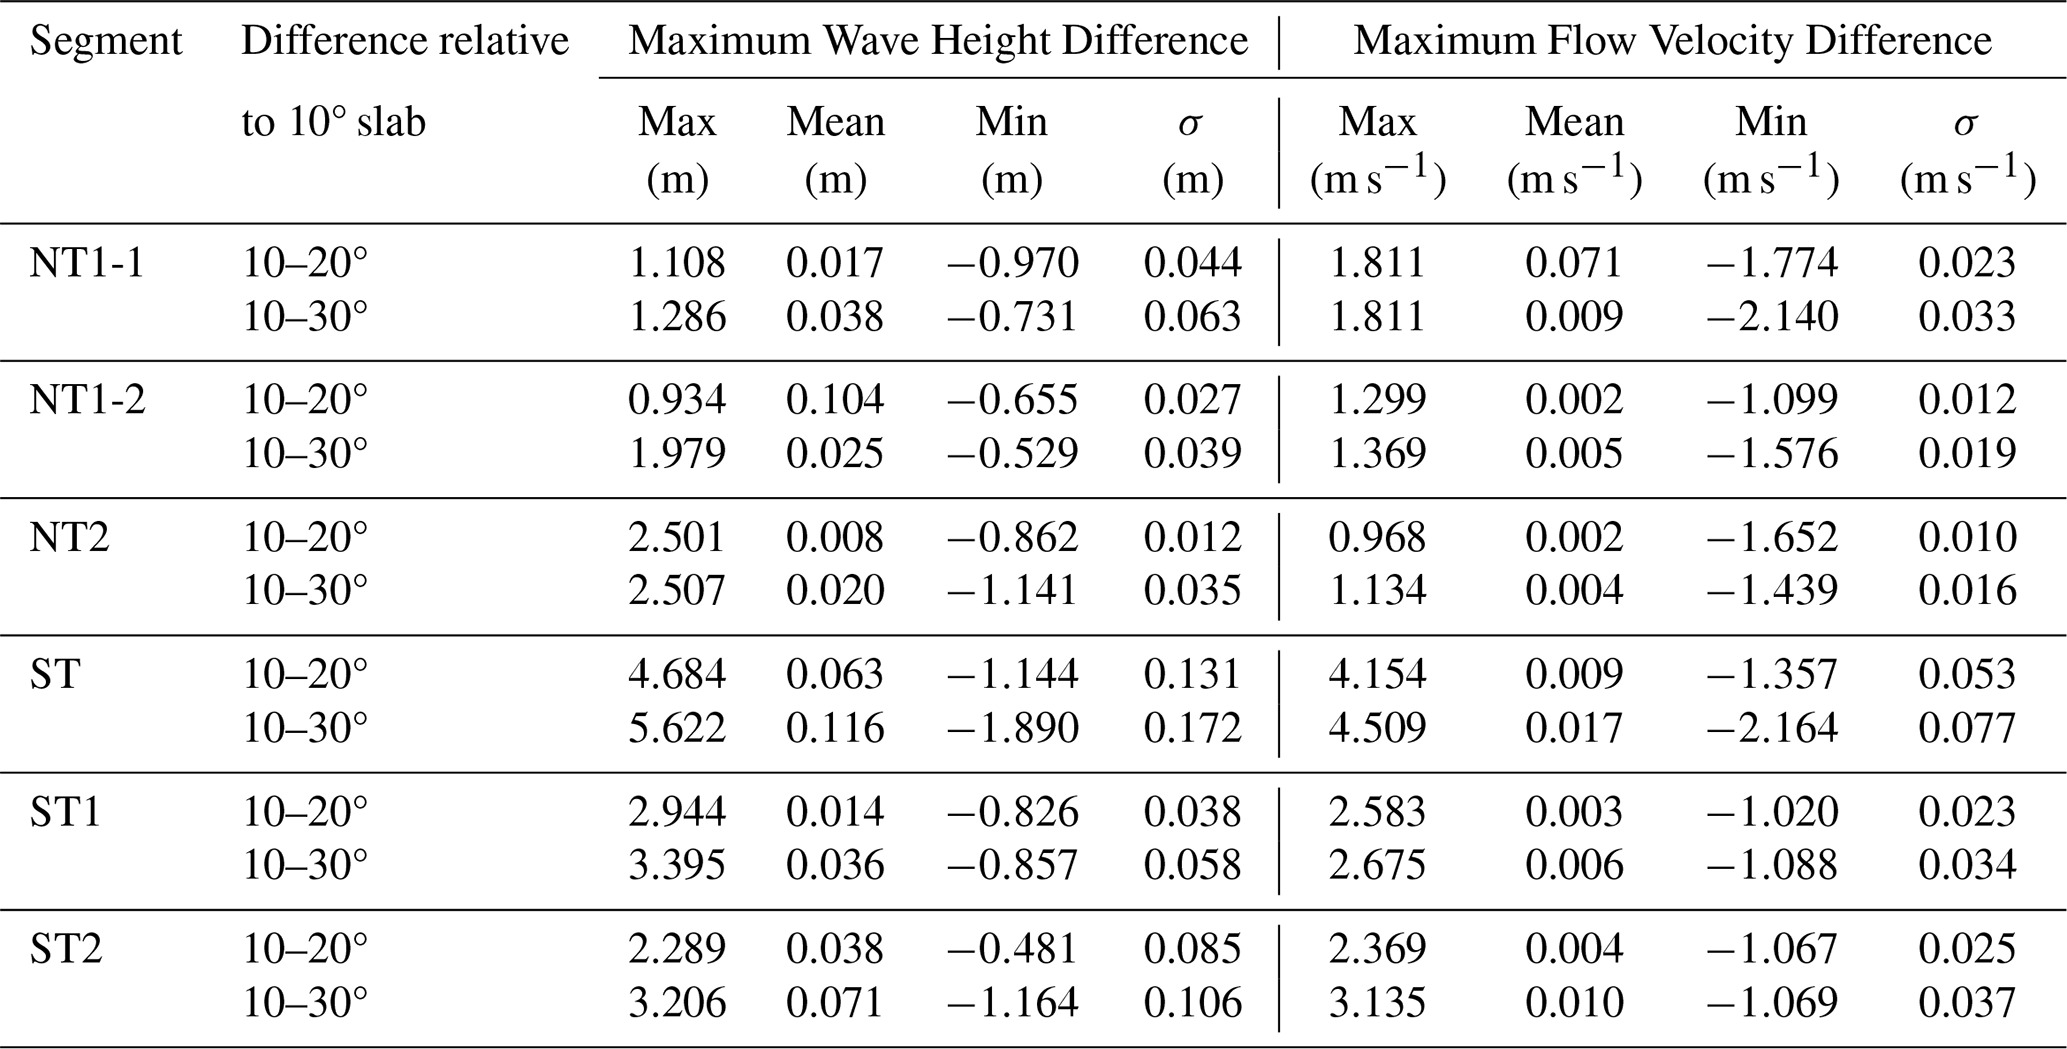
For Negros Trench segments, the range of maximum difference is 0.934–2.507 m and 0.968–1.811 m s−1 for maximum wave height and flow velocity, respectively, while the average differences are 0.008–0.104 m and 0.002–0.071 m s−1. The minimum differences range from −0.529 to −1.141 m (maximum wave height) and −1.099 to −2.140 m s−1 (maximum flow velocity). For Sulu Trench segments, the differences are higher than those from Negros Trench segments, with a range of 2.289–5.622 m (maximum wave height) and 2.369–4.509 m s−1 (maximum flow velocity) for the maximum, 0.014–0.116 m and 0.003–0.017 m s−1 for the average, and −0.481 to −1.890 m and −1.020 to −2.164 m s−1 for the minimum.
5.1 Influence of Wave Directivity, Coastal Morphology, and Nearshore Width on Maximum Wave Height
Wave directivity mainly controls the distribution of the highest tsunami wave heights, which are coastal regions directly facing (i.e., V, VI, XII, XIII, XIV, XV) and on the rear side (III, X) of the segments. As tsunami waves propagate in the interior central Philippines, wave interactions, refraction, diffraction, reflection, and nonlinear effects result in significant dissipation, with the majority of coastal areas in I, VII, XIII, and IX having <1 m wave height. However, the morphology of coastlines, especially along embayments, can amplify tsunamis due to constructive resonance, which can even generate up to 2 m in interior islands (Fig. 12b–f). Previous studies have also acknowledged the effects of morphology on tsunami wave resonance (e.g., Aranguiz et al., 2019; Roeber et al., 2010; Vela et al., 2014; Yamazaki and Cheung, 2011).

Figure 12Representative sites highlighting the influence of nearshore bathymetry and coastal morphology on the maximum wave height among 18 segment scenarios. (a) Inset maps of (b)–(h). The white contours of the bathymetry from GEBCO have 50 m intervals. (b–d) southwest Negros (VI), (e) Labason (XII), (f) northern Bohol (VII), (g) Coron Islands (III), and (h) northeast Borneo (XVI). Basemap from World Imagery Esri | Powered by Esri.
The foremost islands can also function as a natural barrier for the rear islands as they diffract and attenuate the tsunami waves. This case is apparent for the higher tsunami waves in III compared to its rear islands (Fig. 12g). Another factor playing a role in the resulting tsunami waves is the nearshore width along the coasts, as nonlinear shallow-water waves dominate. Arbitrarily setting the distance between the −50 and 0 m depth contour as a reference for nearshore width in 6879 sampling points, the nearshore width interquartile range of the coastal areas with ≥2 m maximum wave height is 2–4.5 km with a maximum bound of 8 km (Fig. 13). On the other hand, coastal areas with <2 m maximum wave height have a nearshore width interquartile range of 2.8–10.6 km with a maximum bound of 22 km. All coastal areas with nearshore width ranging from 30 to 77 km also have <2 m maximum wave height. This indicates that as the nearshore width widens (e.g., >20 km), wave dissipation increases, reducing the tsunami wave as it reaches the shoreline. This is exemplified in the difference in distribution of maximum tsunami wave heights between the northern and southern coastline of XVI (Fig. 12h).

Figure 13Maximum tsunami wave height from 6879 sampling points across the coastal regions in central and southern Philippines and the corresponding nearshore width (km) relative to 50 m depth. Boxplots show the interquartile range (1.5 IQR) of nearshore width between coastlines with ≥2 and <2 m maximum tsunami wave height. Orange circles indicate the outliers of the interquartile range.
5.2 Implications for Tsunami Hazard Potential
Accounting for all 18 megathrust rupture scenarios, Figs. 14, S15, and S16 present the maximum wave height (m), flow velocity (m s−1), and minimum arrival times (min), respectively, in coastal areas surrounding the Sulu Sea. Of the 6879 sampling points, 8 % have a maximum wave height of ≥2 m. Sindangan–Labason (XII) and Siocon–Sibuco (XIII), Sipalay–Bayawan (VI), Moro Gulf (XV), and Basilan–Sulu (XIV) have the highest exposure of 5–8 m wave height and 5–7 m s−1 flow velocity. Certain coastlines in Palawan (X), Panay Gulf (V), Coron–Cuyo (III), West Panay (IV), northeast Borneo (XVI), and Bohol Sea (III) are potentially exposed to 2–4 m wave height and 2–4 m s−1 flow velocity. The majority of Tañon–Cebu Strait (VII), Mindoro (II), Leyte Gulf (IX), and Visayan Sea (I) coastal regions have a maximum wave height and flow velocity of <1 m and <1 m s−1, respectively, with minor amplification of up to 2 m and 2 m s−1 in a few areas. Comparisons of wave heights across 16 coastal regions are also shown in Fig. 15 with an average ranging from 0.1 to 2.1 m and standard deviations of ±0.06–0.77 m.

Figure 14Map of coastal regions in central and southern Philippines showing the highest maximum wave height from the 18 megathrust rupture scenarios. The 6879 sampling points have a 10 km interval. Basemap from World Imagery Esri | Powered by Esri.

Figure 15Comparisons of maximum wave heights among the 16 coastal regions from the models and eyewitness accounts (triangles and squares) of historical tsunamigenic earthquakes in the Sulu and Celebes Sea from Bautista et al. (2012). White circles and blue bars indicate the mean and maximum values, respectively, while the envelope indicates the 1σ and 2σ standard deviations. (I) Visayan Sea; (II) Mindoro; (III) Coron–Cuyo; (IV) West Panay; (V) Panay Gulf; (VI) Sipalay–Bayawan; (VII) Tanon–Cebu Strait; (VIII) Bohol Sea; (IX) Leyte Gulf; (X) Palawan; (XI) Cagayancillo; (XII) Sindangan–Labason; (XIII) Siocon–Sibuco; (XIV) Basilan–Sulu; (XV) Moro Gulf; (XVI) northeast Borneo. Rupture mechanisms: UP, upper plate; MT, megathrust; IP, intraplate; OR, outer rise. Subduction zones: NT, Negros Trench; ST, Sulu Trench; CT, Cotabato Trench.
The majority of coastal regions with the highest tsunami waves (XII, XIII, VI, XV, XIV) also have the shortest arrival times of <2 min due to their proximity to the rupture segments. This short arrival requires the need for quick evacuation strategies. In certain areas where established evacuation sites are far, vertical evacuation, i.e., reaching the closest elevated and structurally strong location, may be the most viable option. While the variability of coastal surface roughness is not accounted for in these models, pre-existing natural and man-made barriers may delay or inhibit inundation, providing additional time for evacuation.
We compared the maximum wave heights from the models to the eyewitness accounts of historical tsunamis in the Sulu and Celebes seas from Bautista et al. (2012). Although the source mechanisms of the majority of earthquakes were unknown, we can attribute them to megathrust, upper-plate, outer-rise, or intraplate ruptures, depending on the hypocenter when available and the position of the estimated epicenter relative to the trench, as labeled in Fig. 15. The estimated epicenter of the 1897 Ms 7.5 event was along the Sulu Trench with a 2 m maximum wave height in the majority of the Sulu Sea basin (III, IV, VI, X, XIII, XV, XVI) and up to 6 m in coastal region XIV. In III, IV, VI, X, XIII, XV, and XVI, the highest modeled tsunami wave in this study is slightly greater than the eyewitness accounts. However, in XIV where a 6 m wave height was estimated, the highest modeled tsunami wave is slightly lower at 5.4 m. Eyewitness accounts of the more localized tsunamis by the 2012 Ms 6.9, 1925 Ms 6.8, and 1948 Ms 8.2, reported up to 2 m wave height, which is lower than the highest modeled tsunami. In Moro Gulf (XV), six historical tsunamigenic earthquakes (2002 Ms 7.2, 1976 Ms 8.1, 1928 Ms 7.5, 1923 Ms 7.2, 1918 Ms 8, 1917 Ms 6.4) were generated along the Cotabato Trench (CT) with eyewitness accounts reporting tsunami wave heights ranging from 1 to 9 m. In this region, the highest modeled tsunami from the Sulu Trench reached 6 m. This indicates that this coastal region is not only susceptible to the Cotabato subduction zone rupture but also to that of the Sulu subduction zone. In addition, prehistoric extreme wave deposits that may be recovered from this coastal region (e.g., Claro et al., 2021) may also be associated with the Sulu megathrust rupture and tsunami.
It should be noted, however, that these eyewitness accounts pose uncertainties and are only available in certain coastal areas that have been inhabited before these events. For events before the 1960s, the estimated earthquake magnitudes are based on reported damages or anecdotes. The magnitude of the 1897 Ms 7.5, for example, may have been underestimated. This event may have also been a tsunami earthquake which generates large tsunami waves compared than its earthquake magnitude (e.g., Tanioka and Seno, 2001), or an earthquake-triggered submarine landslide also contributed to the basin-wide tsunamis as these submarine features are prevalent in this active margin (Nawanao and Ramos, 2023). As our models assumed blind megathrust rupture, these historical events may also have been triggered by other rupture mechanisms (e.g., outer rise, tsunami earthquake, intraplate, upper-plate earthquakes) with a different set of parameter estimations. With the scarcity of information, these historical accounts are still valuable to compare with tsunami models. What is consistent is that the coastal positions and configuration relative to the trench dictate where the highest exposures are identified, i.e., controlled by wave directivity.
5.3 Limitations and Future Work
A major limitation of this study is the uniform slip distribution along the megathrust fault plane, which is based on the average slip from the scaling equation. Earthquake slip distributions are typically heterogeneous, and they control whether the initial seafloor displacement can generate tsunamis. Megathrust ruptures with larger slip distributions downdip but lower on the updip can produce lower tsunami waves (e.g., Delouis et al., 2010; Fujii et al., 2020), which can lead to overestimation from these rupture scenarios. Conversely, large slip updip, especially for trench-breaching and splay faulting rupture types, can produce larger seafloor displacement (e.g., Baba et al., 2006; Fujiwara et al., 2011) that may underestimate the resulting tsunami wave heights from this study. Splay faulting and trench-breaching megathrust scenarios are also not accounted for in this study, as these modes of rupture are rarely reported, but they must be considered in future tsunami hazard assessments in this subduction zone. While the geometry of the Negros–Sulu subduction zone is currently not well constrained, the generally thick sediment cover overlying the Negros and Sulu subduction zone (Fig. 1) may decrease the slab dip and can widen the seismogenic zone (Brizzi et al., 2020). With the bathymetry data used in this study and the lack of variable and asperity-based slip distribution when considering megathrust ruptures, we recommend that the maximum wave heights are treated as minimum and that the actual highest tsunami waves are more likely underestimated.
Future studies along the Negros–Sulu subduction zone should aim to constrain both the geometry of the subduction slab and coupling ratios where slip deficits can be derived as applied in other subduction zones (e.g., Chlieh et al., 2008; Métois et al., 2013, 2016; Michel et al., 2019; Moreno et al., 2010; Ozawa et al., 2012). The role of submarine landslides in tsunami generation can also be explored in future studies as these features are prevalent in this active margin (Nawanao and Ramos, 2023). Submarine landslides have been shown to amplify tsunamis when the failure is coeval to megathrust earthquakes or can also be the main driver of localized but large tsunamis (e.g., Heinrich et al., 2001; Imamura et al., 1995; Nakata et al., 2020; Ramirez et al., 2022; Schambach et al., 2020; Takagi et al., 2019). Other mechanisms such as tsunami earthquakes and outer rise faulting may also be possible where focal mechanism solutions indicate normal faulting along these sections of the subduction zone (Fig. 2).
Updated seismic reflection and geophysical surveys across the Negros–Sulu Trench may also reveal underlying complexities that can influence the potential to generate megathrust rupture, including splay faults, fluids, and subducting seamounts. Gathering high-resolution bathymetry data is necessary to capture the local-scale wave amplification and deformation. The accuracy of nearshore bathymetry connecting inland and offshore must also be assessed, as the nearshore width shown in this study has significant effects on the resulting maximum tsunami waves along the coasts. Furthermore, mapping of pre-existing natural and man-made barriers for site-specific simulation and vulnerability assessment will also be important to assess their effectiveness in minimizing tsunami inundation.
The identified localities with the highest exposure to tsunami waves are potential sites (e.g., V, VI, XII, XIII) in searching for paleotsunami deposits that may serve as records for prehistoric earthquakes. Most importantly, the estimated moment magnitude, maximum tsunami wave heights, flow velocity, and minimum arrival times can provide invaluable information in creating strategies and policies for local government offices and coastal communities to mitigate hazard risk. These include information dissemination in coastal communities, delineation of evacuation routes and sites, and proper engineering designs such as coastal forests, green embankments, seawalls, offshore breakwaters, and dikes (e.g., Benazir et al., 2024; Dengler, 2005; Oetjen et al., 2022; Strusińska-Correia, 2017). In addition, as the majority of these coastal areas tend to have short arrival times, site-specific inundation modeling and geotechnical analysis are recommended for identifying and creating infrastructure for vertical evacuation.
We modeled the fault rupture and tsunami hazard potential of the Negros–Sulu subduction zone by constraining six megathrust fault segments at three dip angle scenarios (10, 20, and 30°). Rupture-scaling equations using the fault plane area estimate potential magnitude ranging from Mw 8.0 to 8.6 for the Negros Trench and Mw 8.1 to 8.9 for the Sulu Trench segments. From the estimated source parameters, elastic dislocation, and 4 h tsunami simulation, coastal areas directly facing the trench segments (VI Sipalay–Bayawan, XII Sindangan–Labason, XIII Siocon–Sibuco, XIV Basilan–Sulu, XV Moro Gulf) segments are potentially exposed to 5–8 m wave height and 5–7 m s−1 flow velocity with a minimum arrival time of <2 min in majority of these regions, demonstrating the major control of wave directivity. Coastal areas parallel and on the rear side of the trench (X Palawan, XI Cagayancillo) are prone to tsunami wave height and flow velocity of up to 2–4 m and 2–4 m s−1, respectively. Due to the cumulative effects of wave dissipation, interference, diffraction, and refraction, interior and rearmost islands are also exposed to <2 m tsunami wave height and <2 m s−1 flow velocity. We also identified regions in the Sulu Sea where resonance on embayments can amplify tsunami waves, while nearshore width >30 km can lead to attenuation before reaching coastlines.
The multitude of future work reflects the scarcity of information along this active margin and the opportunity to fill these gaps. What this study provides, amid the limited information, are the maps of the minimum arrival, maximum tsunami wave, and flow velocity across the entire central and southern Philippines from different scenarios, informed based on available data and current understanding of megathrust ruptures. Amid the limitations of these models, we recommend that the tsunami wave heights and flow velocity for megathrust rupture scenarios are treated as minimum, serving as baseline reference in these coastal areas. This new information is useful not only for future studies to extend our records by searching paleotsunami deposits but most especially in conducting regional-scale mitigation assessments of coastal areas to the imminent threat of tsunamis that have severely affected the Philippines in the past.
The JAGURS code is available at https://github.com/jagurs-admin/jagurs (last access: 10 January 2025) and https://doi.org/10.5281/zenodo.3737816 (jagurs-admin, 2020).
Data can be accessed freely available under the Creative Commons Attribution 4.0 International license at Zenodo: https://doi.org/10.5281/zenodo.17234831 (Nawanao and Ramos, 2025).
The supplement related to this article is available online at https://doi.org/10.5194/nhess-26-5035-2026-supplement.
LN and NR conceptualized the study. LN conducted the tsunami modeling, formal analysis, and visualization. NR acquired the funding and administered the project. TB, NC, and KS were involved in the development of the JAGURS code. LN wrote the original draft. NR, TB, NC, and KS reviewed and edited the manuscript.
The contact author has declared that none of the authors has any competing interests.
Publisher's note: Copernicus Publications remains neutral with regard to jurisdictional claims made in the text, published maps, institutional affiliations, or any other geographical representation in this paper. The authors bear the ultimate responsibility for providing appropriate place names. Views expressed in the text are those of the authors and do not necessarily reflect the views of the publisher.
We are grateful to Editor Dr. Rachid Omira and two anonymous reviewers for their careful review that significantly improved our manuscript. We thank the project team, including Alec Benjamin G. Ramirez, Jelian S. Reyes, and Robelyn Z. Mangahas–Flores, as well as the members of the UP NIGS Geomorphology and Active Tectonics Research (GEAR) Laboratory for their contribution to this project. The maps in the manuscript were generated in QGIS. The World Imagery basemap is from Esri, DigitalGlobe, GeoEye, i-cubed, USDA FSA, USGS, AEX, Getmapping, Aerogrid, IGN, IGP, swisstopo, and the GIS User Community. This study forms part of LN's Master's thesis, “From Trench to Coast: Investigating the Late Quaternary Tectonic History and Seismic Hazard Potential of the Negros–Sulu Trench System, Philippines”, conducted at the University of the Philippines Diliman.
Funding was provided by the Department of Science and Technology (DOST) through the project (No. 4233) titled “Investigation and Numerical Modeling of Philippine Tsunamis Based on Historical, Geomorphological, and Geological Evidence of Past Earthquakes” of NR.
This paper was edited by Rachid Omira and reviewed by two anonymous referees.
Acharya, H. K.: Mindanao earthquake of 16 August 1976: Preliminary seismological assessment, B. Seismol. Soc. Am., 68, 1459–1468, 1978.
Allen, T. I. and Hayes, G. P.: Alternative rupture-scaling relationships for subduction interface and other offshore environments, B. Seismol. Soc. Am., 107, 1240–1253, https://doi.org/10.1785/0120160255, 2017.
Aranguiz, R., Catalán, P. A., Cecioni, C., Bellotti, G., Henriquez, P., and González, J.: Tsunami Resonance and Spatial Pattern of Natural Oscillation Modes With Multiple Resonators, J. Geophys. Res.-Oceans, 124, 7797–7816, https://doi.org/10.1029/2019JC015206, 2019.
Athukorala, P. and Resosudarmo, B. P.: The Indian Ocean Tsunami: Economic Impact, Disaster Management, and Lessons, Asian Econ. Pap., 4, 1–39, https://doi.org/10.1162/asep.2005.4.1.1, 2005.
Aurelio, M. A.: Shear partitioning in the Philippines: Constraints from Philippine Fault and global positioning system data, Isl. Arc, 9, 584–597, https://doi.org/10.1111/j.1440-1738.2000.00304.x, 2008.
Aurelio, M. A., Peña, R. E., and Taguibao, K. J. L.: Sculpting the Philippine archipelago since the Cretaceous through rifting, oceanic spreading, subduction, obduction, collision and strike-slip faulting: Contribution to IGMA5000, J. Asian Earth Sci., 72, 102–107, https://doi.org/10.1016/j.jseaes.2012.10.007, 2013.
Baba, T., Cummins, P. R., Hori, T., and Kaneda, Y.: High precision slip distribution of the 1944 Tonankai earthquake inferred from tsunami waveforms: Possible slip on a splay fault, Tectonophysics, 426, 119–134, https://doi.org/10.1016/j.tecto.2006.02.015, 2006.
Baba, T., Takahashi, N., Kaneda, Y., Ando, K., Matsuoka, D., and Kato, T.: Parallel Implementation of Dispersive Tsunami Wave Modeling with a Nesting Algorithm for the 2011 Tohoku Tsunami, Pure Appl. Geophys., 172, 3455–3472, https://doi.org/10.1007/s00024-015-1049-2, 2015.
Baba, T., Allgeyer, S., Hossen, J., Cummins, P. R., Tsushima, H., Imai, K., Yamashita, K., and Kato, T.: Accurate numerical simulation of the far-field tsunami caused by the 2011 Tohoku earthquake, including the effects of Boussinesq dispersion, seawater density stratification, elastic loading, and gravitational potential change, Ocean Model., 111, 46–54, https://doi.org/10.1016/j.ocemod.2017.01.002, 2017.
Badillo, V. L. and Astilla, Z. C.: Moro Gulf Tsunami of 17 August 1976, National Committee on Marine Sciences (Philippines). Special Committee on Tsunami Warning System, Quezon City, Philippines, 1978.
Balmino, G., Vales, N., Bonvalot, S., and Briais, A.: Spherical harmonic modelling to ultra-high degree of Bouguer and isostatic anomalies, J. Geodesy, 86, 499–520, https://doi.org/10.1007/s00190-011-0533-4, 2012.
Bautista, M. L. P., Bautista, B. C., Joan, S., and Narag, I.: Philippine Tsunamis and Seiches (1589–2012), 1–111, Philippine Institute of Volcanology and Seismology, 2012.
Bécel, A., Shillington, D. J., Delescluse, M., Nedimović, M. R., Abers, G. A., Saffer, D. M., Webb, S. C., Keranen, K. M., Roche, P.-H., Li, J., and Kuehn, H.: Tsunamigenic structures in a creeping section of the Alaska subduction zone, Nat. Geosci., 10, 609–613, https://doi.org/10.1038/ngeo2990, 2017.
Benazir, Triatmadja, R., Syamsidik, Nizam, and Warniyati: Vegetation-based approached for tsunami risk reduction: Insights and challenges, Prog. Disaster Sci., 23, 100352, https://doi.org/10.1016/j.pdisas.2024.100352, 2024.
Bletery, Q., Thomas, A. M., Rempel, A. W., Karlstrom, L., Sladen, A., and De Barros, L.: Mega-earthquakes rupture flat megathrusts, Science, 354, 1027–1031, https://doi.org/10.1126/science.aag0482, 2016.
Bondár, I., Engdahl, E. R., Villaseñor, A., Harris, J., and Storchak, D.: ISC-GEM: Global Instrumental Earthquake Catalogue (1900–2009), II. Location and seismicity patterns, Phys. Earth Planet. In., 239, 2–13, https://doi.org/10.1016/j.pepi.2014.06.002, 2015.
Brizzi, S., van Zelst, I., Funiciello, F., Corbi, F., and van Dinther, Y.: How Sediment Thickness Influences Subduction Dynamics and Seismicity, J. Geophys. Res.-Sol. Ea., 125, 1–19, https://doi.org/10.1029/2019JB018964, 2020.
Brocher, T. M., Filson, J. R., Fuis, G. S., Haeussler, P. J., Holzer, T. L., Plafker, G., and Blair, J. L.: The 1964 Great Alaska Earthquake and tsunamis: a modern perspective and enduring legacies, U.S. Geological Survey, https://doi.org/10.3133/fs20143018, 2014.
Chlieh, M., Avouac, J. P., Sieh, K., Natawidjaja, D. H., and Galetzka, J.: Heterogeneous coupling of the Sumatran megathrust constrained by geodetic and paleogeodetic measurements, J. Geophys. Res.-Sol. Ea., 113, 1–31, https://doi.org/10.1029/2007JB004981, 2008.
Claro, S. M. D., Ramos, N. T., Fernando, A. G. S., Ishimura, D., and Switzer, A. D.: Sedimentological evidence of washover deposits from extreme wave events in Zamboanga del Sur, Mindanao, southern Philippines, Mar. Geol., 438, 106535, https://doi.org/10.1016/j.margeo.2021.106535, 2021.
Debaecker, S., Feuillet, N., Satake, K., Sowa, K., Yamada, M., Sato, T., Nakamura, M., Watanabe, A., Saiki, A., Saurel, J.-M., Occhipinti, G., Yu, T.-L., and Shen, C.-C.: Evidence of megathrust earthquakes and seismic supercycles in subtropical Japan from millennia-old coral microatolls, Nat. Commun., 17, 1398, https://doi.org/10.1038/s41467-025-67724-2, 2026.
Delouis, B., Nocquet, J., and Vallée, M.: Slip distribution of the 27 February 2010 Mw = 8.8 Maule Earthquake, central Chile, from static and high-rate GPS, InSAR, and broadband teleseismic data, Geophys. Res. Lett., 37, 1–7, https://doi.org/10.1029/2010GL043899, 2010.
Dengler, L.: The Role of Education in the National Tsunami Hazard Mitigation Program, Nat. Hazards, 35, 141–153, https://doi.org/10.1007/s11069-004-2409-x, 2005.
Di Giacomo, D., Bondár, I., Storchak, D. A., Engdahl, E. R., Bormann, P., and Harris, J.: ISC-GEM: Global Instrumental Earthquake Catalogue (1900–2009), III. Re-computed M and m, proxy M, final magnitude composition and completeness assessment, Phys. Earth Planet. In., 239, 33–47, https://doi.org/10.1016/j.pepi.2014.06.005, 2015.
Di Giacomo, D., Engdahl, E. R., and Storchak, D. A.: The ISC-GEM Earthquake Catalogue (1904–2014): status after the Extension Project, Earth Syst. Sci. Data, 10, 1877–1899, https://doi.org/10.5194/essd-10-1877-2018, 2018.
Duke, C. M.: The Chilean Earthquakes of May 1960, Science, 132, 1797–1802, https://doi.org/10.1126/science.132.3442.1797, 1960.
Fagereng, Å. and Beall, A.: Is complex fault zone behaviour a reflection of rheological heterogeneity?, Philos. T. R. Soc. A, 379, 20190421, https://doi.org/10.1098/rsta.2019.0421, 2021.
Fan, J. and Zhao, D.: P-wave anisotropic tomography of the central and southern Philippines, Phys. Earth Planet. In., 286, 154–164, https://doi.org/10.1016/j.pepi.2018.12.001, 2019.
Fan, J. and Zhao, D.: Subslab heterogeneity and giant megathrust earthquakes, Nat. Geosci., 14, 349–353, https://doi.org/10.1038/s41561-021-00728-x, 2021.
Fan, J., Zhao, D., Dong, D., and Zhang, G.: P-wave tomography of subduction zones around the central Philippines and its geodynamic implications, J. Asian Earth Sci., 146, 76–89, https://doi.org/10.1016/j.jseaes.2017.05.015, 2017.
Fujii, Y., Satake, K., Watada, S., and Ho, T.-C.: Slip distribution of the 2005 Nias earthquake (Mw 8.6) inferred from geodetic and far-field tsunami data, Geophys. J. Int., 223, 1162–1171, https://doi.org/10.1093/gji/ggaa384, 2020.
Fujiwara, T., Kodaira, S., No, T., Kaiho, Y., Takahashi, N., and Kaneda, Y.: The 2011 Tohoku-Oki earthquake: Displacement reaching the trench axis, Science, 334, 1240, https://doi.org/10.1126/science.1211554, 2011.
Galgana, G., Hamburger, M., McCaffrey, R., Corpuz, E., and Chen, Q.: Analysis of crustal deformation in Luzon, Philippines using geodetic observations and earthquake focal mechanisms, Tectonophysics, 432, 63–87, https://doi.org/10.1016/j.tecto.2006.12.001, 2007.
GEBCO Compilation Group: GEBCO 2024 Grid, https://doi.org/10.5285/1c44ce99-0a0d-5f4f-e063-7086abc0ea0f, 2024.
Hayes, G. P., Moore, G. L., Portner, D. E., Hearne, M., Flamme, H., Furtney, M., and Smoczyk, G. M.: Slab2, a comprehensive subduction zone geometry model, Science, 362, 58–61, https://doi.org/10.1126/science.aat4723, 2018.
Heinrich, P. H., Piatanesi, A., and Hébert, H.: Numerical modelling of tsunami generation and propagation from submarine slumps: The 1998 Papua New Guinea event, Geophys. J. Int., 145, 97–111, https://doi.org/10.1111/j.1365-246X.2001.00336.x, 2001.
Hilde, T. W. C., Uyeda, S., and Kroenke, L.: Evolution of the western pacific and its margin, Tectonophysics, 38, https://doi.org/10.1016/0040-1951(77)90205-0, 1977.
Holloway, R. and Hall, R.: Reconstructing Cenozoic SE Asia, Geol. Soc. Spec. Publ., 106, 153–184, https://doi.org/10.1144/GSL.SP.1996.106.01.11, 1996.
Hsu, Y.-J., Yu, S.-B., Song, T.-R. A., and Bacolcol, T.: Plate coupling along the Manila subduction zone between Taiwan and northern Luzon, J. Asian Earth Sci., 51, 98–108, https://doi.org/10.1016/j.jseaes.2012.01.005, 2012.
Hsu, Y.-J., Yu, S.-B., Loveless, J. P., Bacolcol, T., Solidum, R., Luis, A., Pelicano, A., and Woessner, J.: Interseismic deformation and moment deficit along the Manila subduction zone and the Philippine Fault system, J. Geophys. Res.-Sol. Ea., 121, 7639–7665, https://doi.org/10.1002/2016JB013082, 2016.
Imamura, F., Gica, E., Takahashi, T., and Shuto, N.: Numerical simulation of the 1992 Flores tsunami: Interpretation of tsunami phenomena in northeastern Flores Island and damage at Babi Island, Pure Appl. Geophys., 144, 555–568, https://doi.org/10.1007/BF00874383, 1995.
jagurs-admin: jagurs-admin/jagurs: JAGURS-D_V0515a (Version JAGURS-D_V0515a), Zenodo [computer software], https://doi.org/10.5281/zenodo.3737816, 2020.
Kajitani, Y., Chang, S. E., and Tatano, H.: Economic Impacts of the 2011 Tohoku-Oki Earthquake and Tsunami, Earthq. Spectra, 29, 457–478, https://doi.org/10.1193/1.4000108, 2013.
Kreemer, C., Blewitt, G., and Klein, E. C.: A geodetic plate motion and Global Strain Rate Model, Geochem. Geophy. Geosy, 15, 3849–3889, https://doi.org/10.1002/2014GC005407, 2014.
Laske, G., Masters, G., Ma, Z., and Pasyanos, M.: Update on CRUST1.0 – A 1-degree Global Model of Earth's Crust, Geophys. Res. Abstr., EGU2013-2658, EGU General Assembly 2013, Vienna, Austria, 2013.
Li, L., Switzer, A. D., Chan, C., Wang, Y., Weiss, R., and Qiu, Q.: How heterogeneous coseismic slip affects regional probabilistic tsunami hazard assessment: A case study in the South China Sea, J. Geophys. Res.-Sol. Ea., 121, 6250–6272, https://doi.org/10.1002/2016JB013111, 2016.
Métois, M., Socquet, A., Vigny, C., Carrizo, D., Peyrat, S., Delorme, A., Maureira, E., Valderas-Bermejo, M.-C., and Ortega, I.: Revisiting the North Chile seismic gap segmentation using GPS-derived interseismic coupling, Geophys. J. Int., 194, 1283–1294, https://doi.org/10.1093/gji/ggt183, 2013.
Métois, M., Vigny, C., and Socquet, A.: Interseismic Coupling, Megathrust Earthquakes and Seismic Swarms Along the Chilean Subduction Zone (38°–18° S), Pure Appl. Geophys., 173, 1431–1449, https://doi.org/10.1007/s00024-016-1280-5, 2016.
Michel, S., Gualandi, A., and Avouac, J. P.: Interseismic Coupling and Slow Slip Events on the Cascadia Megathrust, Pure Appl. Geophys., 176, 3867–3891, https://doi.org/10.1007/s00024-018-1991-x, 2019.
Moreno, M., Rosenau, M., and Oncken, O.: 2010 Maule earthquake slip correlates with pre-seismic locking of Andean subduction zone, Nature, 467, 198–202, https://doi.org/10.1038/nature09349, 2010.
Nakata, K., Katsumata, A., and Muhari, A.: Submarine landslide source models consistent with multiple tsunami records of the 2018 Palu tsunami, Sulawesi, Indonesia, Earth, Planets Sp., 72, 44, https://doi.org/10.1186/s40623-020-01169-3, 2020.
Nawanao, L. P. and Ramos, N. T.: Frontal wedge variations and controls of submarine landslides in the Negros–Sulu Trench System, Philippines, Front. Earth Sci., 11, 1–17, https://doi.org/10.3389/feart.2023.1054825, 2023.
Nawanao Jr., L. and Ramos, N.: Tsunami Models from Negros–Sulu Megathrust (Philippines) Rupture Scenarios. In Seismic and Tsunami Hazard Potential of the Negros–Sulu Megathrust, Philippines (Version 1.0), Zenodo [data set], https://doi.org/10.5281/zenodo.17234831, 2025.
Nishikawa, T. and Ide, S.: Earthquake size distribution in subduction zones linked to slab buoyancy, Nat. Geosci., 1–5, https://doi.org/10.1038/NGEO2279, 2014.
Nurashid, N. I. I., Shibazaki, B., Fujii, Y., and Yanagisawa, H.: Tsunami inundation modeling along the east coast of Sabah, Malaysia for potential earthquakes in Sulu sea, Bull. Int. Inst. Seismol. Earthq. Eng., 47, 127–132, 2013.
Oetjen, J., Sundar, V., Venkatachalam, S., Reicherter, K., Engel, M., Schüttrumpf, H., and Sannasiraj, S. A.: A comprehensive review on structural tsunami countermeasures, Nat. Hazards, 113, 1419–1449, https://doi.org/10.1007/s11069-022-05367-y, 2022.
Okada, Y.: Surface deformation due to shear and tensile faults in a half-space, B. Seismol. Soc. Am., 75, 1135–1154, https://doi.org/10.1785/BSSA0750041135, 1985.
Okal, E. A., Synolakis, C. E., and Kalligeris, N.: Tsunami Simulations for Regional Sources in the South China and Adjoining Seas, Pure Appl. Geophys., 168, 1153–1173, https://doi.org/10.1007/s00024-010-0230-x, 2011.
Ozawa, S., Nishimura, T., Munekane, H., Suito, H., Kobayashi, T., Tobita, M., and Imakiire, T.: Preceding, coseismic, and postseismic slips of the 2011 Tohoku earthquake, Japan, J. Geophys. Res.-Sol. Ea., 117, https://doi.org/10.1029/2011JB009120, 2012.
Parcutela, N. E., Dimalanta, C. B., Armada, L. T., and Yumul, G. P.: PHILCRUST3.0: New constraints in crustal growth rate computations for the Philippine arc, J. Asian Earth Sci. X, 4, 100032, https://doi.org/10.1016/j.jaesx.2020.100032, 2020.
Pedersen, C., Latif, Z. A., and Lai, C.: TSUNAMI MODELLING AND RISK MAPPING FOR EAST COAST OF SABAH, MALAYSIA, Coast. Eng. Proc., 1, 55, https://doi.org/10.9753/icce.v32.currents.55, 2011.
Peñarubia, H. C., Johnson, K. L., Styron, R. H., Bacolcol, T. C., Sevilla, W. I. G., Perez, J. S., Bonita, J. D., Narag, I. C., Solidum, R. U., Pagani, M. M., and Allen, T. I.: Probabilistic seismic hazard analysis model for the Philippines, Earthq. Spectra, 36, 44–68, https://doi.org/10.1177/8755293019900521, 2020.
Qiu, Q., Li, L., Hsu, Y.-J., Wang, Y., Chan, C.-H., and Switzer, A. D.: Revised earthquake sources along Manila trench for tsunami hazard assessment in the South China Sea, Nat. Hazards Earth Syst. Sci., 19, 1565–1583, https://doi.org/10.5194/nhess-19-1565-2019, 2019.
Ramirez, A. B. G., Ramos, N. T., Nawanao, L. P. J., Mangahas-Flores, R. Z., Narag, I. C., Baba, T., Chikasada, N., and Satake, K.: An Earthquake-Triggered Submarine Mass Failure Mechanism for the 1994 Mindoro Tsunami in the Philippines: Constraints from Numerical Modeling and Submarine Geomorphology, Front. Earth Sci., 10, 1–20, https://doi.org/10.3389/feart.2022.1067002, 2022.
Ramos, N. T., Maxwell, K. V., Tsutsumi, H., Chou, Y.-C., Duan, F., Shen, C.-C., and Satake, K.: Occurrence of 1 ka-old corals on an uplifted reef terrace in west Luzon, Philippines: Implications for a prehistoric extreme wave event in the South China Sea region, Geosci. Lett., 4, 12, https://doi.org/10.1186/s40562-017-0078-3, 2017.
Rangin, C., Le Pichon, X., Mazzotti, S., Pubellier, M., Chamot-Rooke, N., Aurelio, M., Walpersdorf, A., and Quebral, R.: Plate convergence measured by GPS across the Sundaland/Philippine Sea Plate deformed boundary: the Philippines and eastern Indonesia, Geophys. J. Int., 139, 296–316, https://doi.org/10.1046/j.1365-246x.1999.00969.x, 1999.
Roeber, V., Yamazaki, Y., and Cheung, K. F.: Resonance and impact of the 2009 Samoa tsunami around Tutuila, American Samoa, Geophys. Res. Lett., 37, https://doi.org/10.1029/2010GL044419, 2010.
Salcedo, J. C. and Hara, T.: Earthquake source parameters for subduction zone events causing tsunamis in and around the Philippines, Bull. Int. Inst. Seismol. Earthq. Eng., 45, 49–54, 2011.
Satake, K.: 28 Tsunamis, in: International Handbook of Earthquake and Engineering Seismology, Part A, edited by: Lee, W. H. K., Kanamori, H., Jennings, P. C., and Kisslinger, C., Academic Press, 437–451, https://doi.org/10.1016/S0074-6142(02)80231-5, 2002.
Satake, K.: Recurrence and Long-Term Evaluation of Kanto Earthquakes, B. Seismol. Soc. Am., 113, 1826–1841, https://doi.org/10.1785/0120230072, 2023.
Schambach, L., Grilli, S. T., Tappin, D. R., Gangemi, M. D., and Barbaro, G.: New simulations and understanding of the 1908 Messina tsunami for a dual seismic and deep submarine mass failure source, Mar. Geol., 421, 106093, https://doi.org/10.1016/j.margeo.2019.106093, 2020.
Schellart, W. P. and Rawlinson, N.: Global correlations between maximum magnitudes of subduction zone interface thrust earthquakes and physical parameters of subduction zones, Phys. Earth Planet. In., 225, 41–67, https://doi.org/10.1016/j.pepi.2013.10.001, 2013.
Sevilla, W. I.: Seismic Velocity Variations Under Island Arcs: Examples from the Philippines and Montserrat, Pennsylvania State University, 1–202, https://etda.libraries.psu.edu/catalog/10285 (last access: 8 October 2026), 2011.
Simons, W. J. F., Ambrosius, B. A. C., Noomen, R., Angermann, D., Wilson, P., Becker, M., Reinhart, E., Walpersdorf, A., and Vigny, C.: Observing plate motions in S.E. Asia: Geodetic results of the GEODYSSEA Project, Geophys. Res. Lett., 26, 2081–2084, https://doi.org/10.1029/1999GL900395, 1999.
Skarlatoudis, A. A., Somerville, P. G., and Thio, H. K.: Source-scaling relations of interface subduction earthquakes for strong ground motion and tsunami simulation, B. Seismol. Soc. Am., 106, 1652–1662, https://doi.org/10.1785/0120150320, 2016.
Storchak, D. A., Di Giacomo, D., Bondar, I., Engdahl, E. R., Harris, J., Lee, W. H. K., Villasenor, A., and Bormann, P.: Public Release of the ISC-GEM Global Instrumental Earthquake Catalogue (1900–2009), Seismol. Res. Lett., 84, 810–815, https://doi.org/10.1785/0220130034, 2013.
Storchak, D. A., Di Giacomo, D., Engdahl, E. R., Harris, J., Bondár, I., Lee, W. H. K., Bormann, P., and Villaseñor, A.: The ISC-GEM Global Instrumental Earthquake Catalogue (1900–2009): Introduction, Phys. Earth Planet. In., 239, 48–63, https://doi.org/10.1016/j.pepi.2014.06.009, 2015.
Stratta, J. L., Canon, T. J., Duke, M. C., and Selna, L. G.: Reconnaissance Report of the Mindanao, Philippine Earthquake of 17 August 1976, 100 pp., Earthquake Engineering Research Institute, https://learningfromearthquakes.org/wp-content/uploads/EERI-LFE-Reconnaissance-Report-Mindanao-Philippines-1976.pdf (last access: 8 October 2026), 1977.
Straume, E. O., Gaina, C., Medvedev, S., Hochmuth, K., Gohl, K., Whittaker, J. M., Abdul Fattah, R., Doornenbal, J. C., and Hopper, J. R.: GlobSed: Updated Total Sediment Thickness in the World's Oceans, Geochem. Geophy. Geosy., 20, 1756–1772, https://doi.org/10.1029/2018GC008115, 2019.
Strusińska-Correia, A.: Tsunami mitigation in Japan after the 2011 Tōhoku Tsunami, Int. J. Disast. Risk Re., 22, 397–411, https://doi.org/10.1016/j.ijdrr.2017.02.001, 2017.
Suppasri, A., Muhari, A., Ranasinghe, P., Mas, E., Shuto, N., Imamura, F., and Koshimura, S.: Damage and reconstruction after the 2004 Indian Ocean tsunami and the 2011 Great East Japan tsunami, J. Nat. Disaster Sci., 34, 19–39, https://doi.org/10.2328/jnds.34.19, 2012.
Tajima, R., Matsu, Y., Si, H., and Irikuda, K.: Comparative Study on Scaling Relations of Source Parameters for Great Earthquakes in Inland Crusts and on Subducting Plate-Boundaries, Zisin [Journal Seismol. Soc. Japan. 2nd ser.], 66, 31–45, https://doi.org/10.4294/zisin.66.31, 2013.
Takagi, H., Pratama, M. B., Kurobe, S., Esteban, M., Aránguiz, R., and Ke, B.: Analysis of generation and arrival time of landslide tsunami to Palu City due to the 2018 Sulawesi earthquake, Landslides, 983–991, https://doi.org/10.1007/s10346-019-01166-y, 2019.
Tanioka, Y. and Seno, T.: Sediment effect on tsunami generation of the 1896 Sanriku Tsunami Earthquake, Geophys. Res. Lett., 28, 3389–3392, https://doi.org/10.1029/2001GL013149, 2001.
Vela, J., Pérez, B., González, M., Otero, L., Olabarrieta, M., Canals, M., and Casamor, J. L.: Tsunami Resonance in Palma Bay and Harbor, Majorca Island, as Induced by the 2003 Western Mediterranean Earthquake, J. Geol., 122, 165–182, https://doi.org/10.1086/675256, 2014.
Volpe, G., Pozzi, G., Locchi, M. E., Tinti, E., Scuderi, M. M., Marone, C., and Collettini, C.: Rheological heterogeneities at the roots of the seismogenic zone, Geology, 51, 988–992, https://doi.org/10.1130/G51432.1, 2023.
Witter, R. C., Carver, G. A., Briggs, R. W., Gelfenbaum, G., Koehler, R. D., La Selle, S., Bender, A. M., Engelhart, S. E., Hemphill-Haley, E., and Hill, T. D.: Unusually large tsunamis frequent a currently creeping part of the Aleutian megathrust, Geophys. Res. Lett., 43, 76–84, https://doi.org/10.1002/2015GL066083, 2016.
Wu, T.-R. and Huang, H.-C.: Modeling tsunami hazards from Manila trench to Taiwan, J. Asian Earth Sci., 36, 21–28, https://doi.org/10.1016/j.jseaes.2008.12.006, 2009.
Yabe, S. and Ide, S.: Variations in precursory slip behavior resulting from frictional heterogeneity, Prog. Earth Planet. Sc., 5, 43, https://doi.org/10.1186/s40645-018-0201-x, 2018.
Yamazaki, Y. and Cheung, K. F.: Shelf resonance and impact of near-field tsunami generated by the 2010 Chile earthquake, Geophys. Res. Lett., 38, https://doi.org/10.1029/2011GL047508, 2011.
Yumul, G. P., Dimalanta, C. B., Tamayo, R. A., and Maury, R. C.: Collision, subduction and accretion events in the Philippines: A synthesis, Isl. Arc, 12, 77–91, https://doi.org/10.1046/j.1440-1738.2003.00382.x, 2003.
Yumul, G. P., Dimalanta, C. B., Maglambayarw, V. B., and Marquez, E. J.: Tectonic setting of a composite terrane: A review of the Philippine island arc system, Geosci. J., 12, 7–17, https://doi.org/10.1007/s12303-008-0002-0, 2008.
Zahirovic, S., Seton, M., and Müller, R. D.: The Cretaceous and Cenozoic tectonic evolution of Southeast Asia, Solid Earth, 5, 227–273, https://doi.org/10.5194/se-5-227-2014, 2014.
Zhao, G. and Niu, X.: Local amplification of tsunami waves along the west coast of Negros Island and Panay Island, Appl. Ocean Res., 123, 103175, https://doi.org/10.1016/j.apor.2022.103175, 2022.