
the Creative Commons Attribution 4.0 License.
the Creative Commons Attribution 4.0 License.
 | 07 Oct 2026
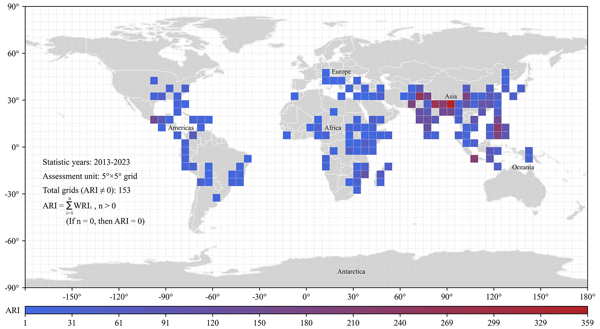
Global disaster risk assessment from Emergency Events Database (2013–2023)
Qingzhao Kong

Erqi Zhu
This study introduces an Accumulated-Event Risk Indicator (ARI) to identify global hotspots of recent major-event accumulation using 2013–2023 records from the Emergency Events Database (EM-DAT). For each 5° × 5° latitude–longitude grid cell, ARI sums the country-level World Risk Index (WRI) values associated with events meeting a study-specific threshold of at least 50 reported fatalities, thereby combining recent major-event recurrence with contextual risk conditions. The baseline analysis identifies 153 grid cells with non-zero ARI values and 14 principal hotspots, located mainly in South and Southeast Asia and along the Himalayan belt. Diagnostic comparisons with a grid-level WRI-only reference, unweighted major-event count, and summed reported fatalities show that ARI produces a distinct upper-priority pattern. A temporally separated comparison indicates that major events recorded in Asia during 2024–2025 are concentrated in high-ARI sets at rates above the defined equal-grid benchmark. Sensitivity analyses further show that the principal hotspot geography is largely retained under the tested changes to the fatality threshold, grid resolution, and spatial allocation. The study also presents the 3H Dataset, an ARI-guided compilation of standardized high-resolution remote-sensing imagery assembled from open-data resources and supplementary acquisitions for the 14 hotspot cells. The dataset serves as a downstream observational resource for finer-scale analyses in data-scarce priority regions.
- Article
(8625 KB) - Full-text XML
- BibTeX
- EndNote


In association with the compounding effects of climate change and human activities, natural hazards demonstrate a more frequent and intense trend in recent years (Yarveysi et al., 2023; Chamberlain et al., 2024; Wang et al., 2017; Hussain et al., 2023; Taghizadeh-Hesary et al., 2021; Wen et al., 2023; Chitondo et al., 2024; Coronese et al., 2019). Moreover, natural hazards are not isolated, but exhibit clustering features in both time and space dimensions, which indirectly reflect accumulated socio-economic impacts (Ridder et al., 2020; Hufschmidt et al., 2005). The resulting impacts are also closely related to both the frequency and intensity of disaster events. Particularly in developing countries, major events triggered by multiple natural hazards interact with socio-economic vulnerability, resulting in severe human casualties, substantial economic losses, and heightened social unrest (Koks et al., 2019; Rentschler et al., 2022; Baranowski et al., 2020). Consequently, the escalating risk of major disaster events poses a severe challenge to global sustainable development, which underscores the necessity for comprehensive risk assessments.
There is growing recognition of the need for disaster risk assessments, accompanied by increasing scientific and policy dialogue (Koks et al., 2019; Ward et al., 2020). In recent years, a large volume of research has been dedicated to assessing the risks associated with individual hazards or specific regions (Ridder et al., 2020; Koks et al., 2019; Julià and Ferreira, 2021). However, owing to the inherent complexity and methodological challenges involved, assessing the probable impacts of multiple natural hazards on a global scale has yet to be widely adopted in mainstream practices (Ward et al., 2020; Julià and Ferreira, 2021; Gallina et al., 2016), with only initiatives promoted by renowned organizations such as the United Nations Development Programme (UNDP) being exceptions.
As summarized in Table 1, representative global multi-disaster risk assessment frameworks broadly fall into three methodological paradigms. Indicator-based approaches (e.g., WRI and INFORM) emphasize exposure, vulnerability, and coping-capacity conditions through composite indicators and are therefore effective for portraying relatively stable structural risk patterns. Statistical or event-based approaches (e.g., DRI and Natural Disaster Hotspots) rely more directly on historical disaster outcomes, such as mortality and economic loss, and are therefore more sensitive to realized impacts. Hybrid approaches (e.g., TRI and MhRI) attempt to combine historical disaster records with broader socio-economic context. These paradigms are complementary rather than mutually exclusive, but they are not equally suitable for all analytical purposes. For the objective of identifying recent major-event accumulation at a globally comparable yet spatially differentiated scale, four methodological considerations are particularly relevant.
Table 1Representative frameworks for global multi-disaster risk assessment (Shi and Kasperson, 2015; Dilley et al., 2005; UNDP, 2004; Eckstein et al., 2021; Marin-Ferrer et al., 2017; Bündnis Entwicklung Hilft and IFHV, 2023).
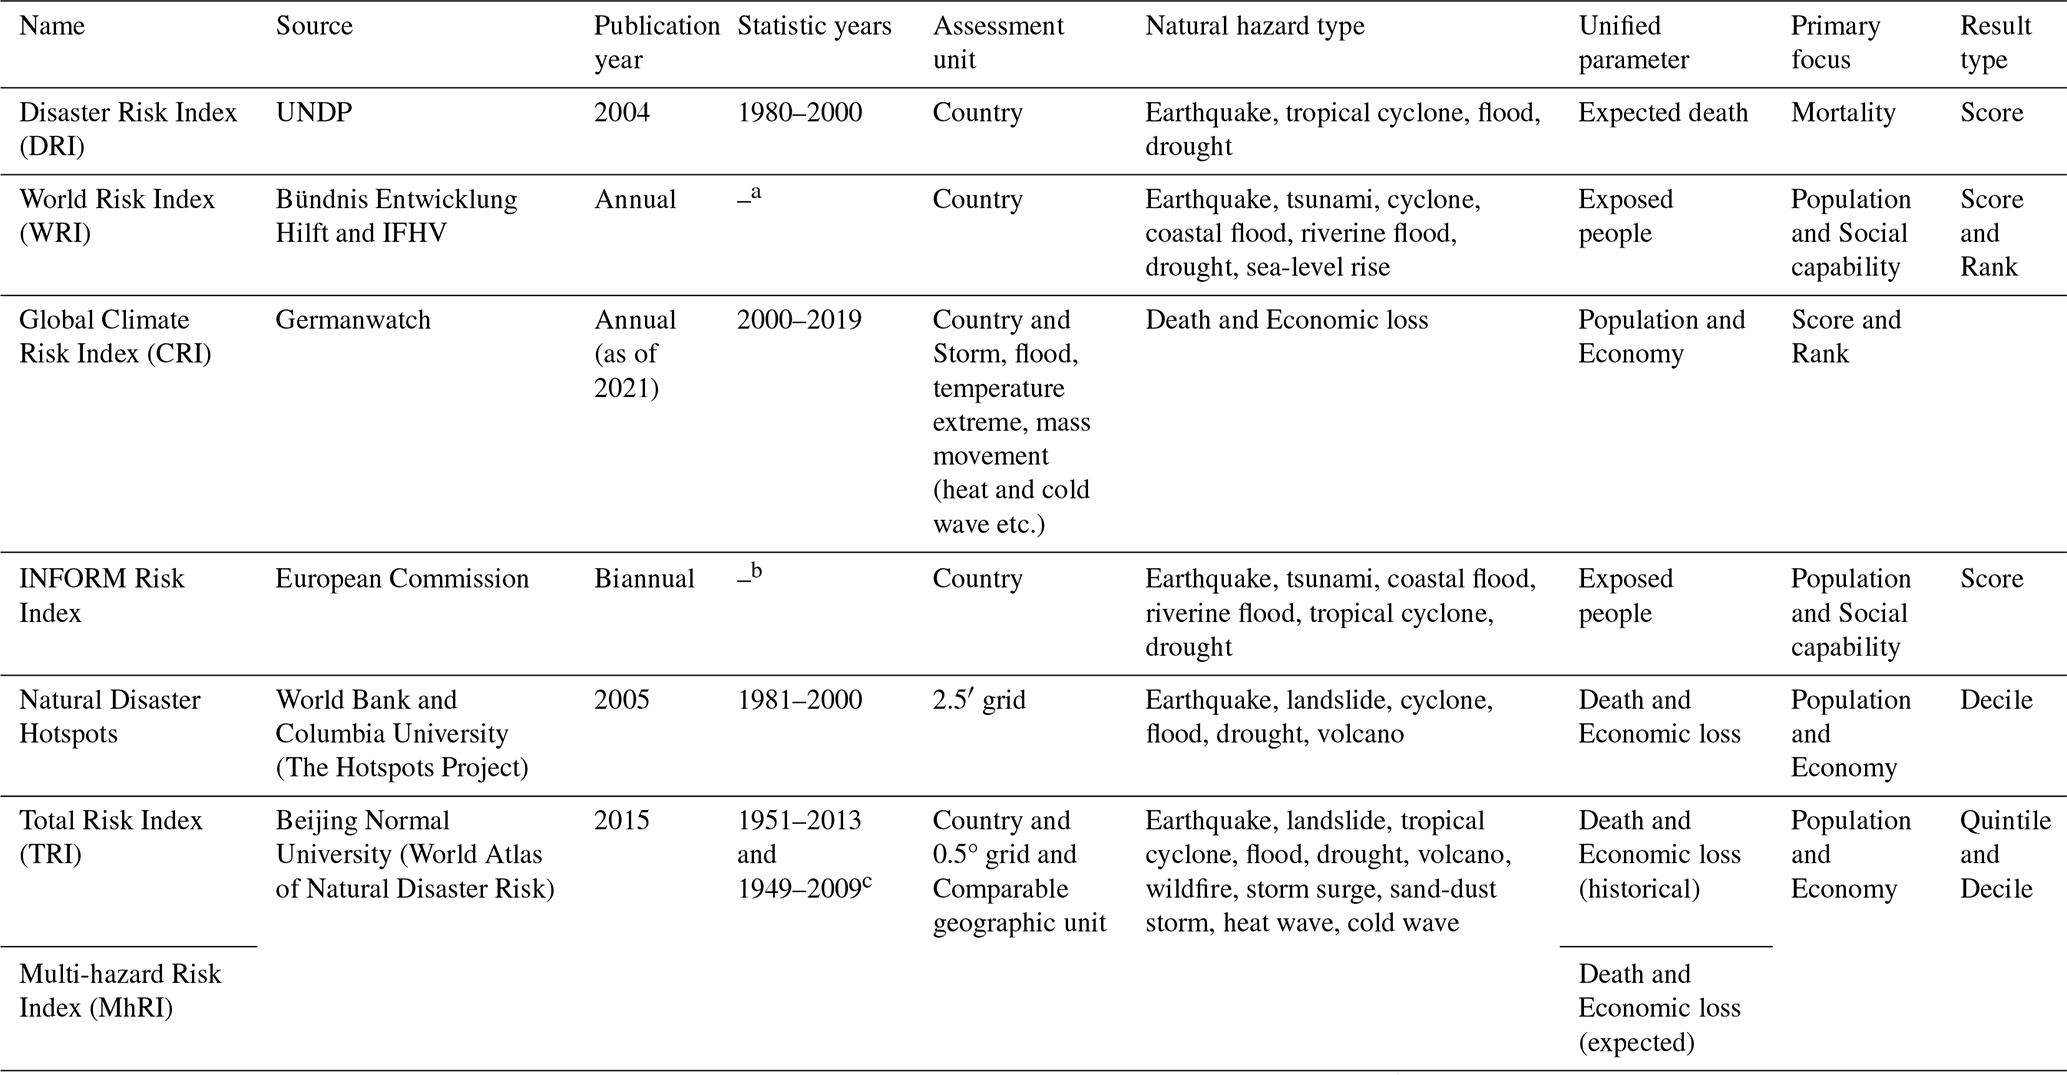
a WRI is calculated based on the latest available data, and its statistic period depends on the update of data sources (Bündnis Entwicklung Hilft and IFHV, 2023); b INFORM uses different statistical data sources for different natural hazards, and the corresponding reference years vary (Marin-Ferrer et al., 2017); c Both TRI and MhRI use EM-DAT data from 1951 to 2013 and China Catastrophe Statistics data from 1949 to 2009 (Shi and Kasperson, 2015; Delforge et al., 2025).
First, in terms of data timeliness, many existing frameworks are designed to characterize long-term or slowly changing risk trends. Even with regular updates, they may not respond strongly to the concentration of major disaster shocks within a relatively short period, such as the most recent decade. Second, in terms of assessment unit, country-based frameworks facilitate the integration of socio-economic indicators, but they are often too coarse to represent subnational heterogeneity or transboundary disaster corridors, limiting their compatibility with subsequent remote-sensing-based analysis (Shi and Kasperson, 2015; Dilley et al., 2005; Paprotny et al., 2018; Bündnis Entwicklung Hilft, 2011). Third, in terms of hazard representation, some frameworks focus on a limited set of natural hazards or mix natural and human-induced hazards, which complicates direct comparison in a unified multi-hazard setting. Fourth, in terms of impact indicators, the choice of unified parameters varies widely across studies, from mortality-centred indicators to broader social and economic composites, and each choice involves a trade-off between comparability, interpretability, and multidimensional completeness (Yarveysi et al., 2023; Dilley et al., 2005; UNDP, 2004; Marin et al., 2021; Bündnis Entwicklung Hilft and IFHV, 2022, 2023). Together, these considerations leave scope for a complementary framework that emphasizes recent major-event accumulation at subnational and transboundary scales.
In the implementation of disaster risk assessments, remote sensing technology is widely regarded as a critical source of spatial information and distribution data (Pittore et al., 2017; Tronin, 2010; Geiß and Taubenböck, 2013). Disaster risk assessment relies heavily on statistical information concerning exposure and vulnerability. However, data availability and acquisition costs significantly limit the broader application of remote sensing technology in disaster risk research (Geiß and Taubenböck, 2013; Elliott et al., 2016; Rathje and Adams, 2008; Manfré et al., 2012), especially for developing countries (Herold and Sawada, 2012). Furthermore, there is an inherent trade-off between spatial resolution and coverage area in remote sensing data: higher spatial resolution typically entails a smaller coverage area (Pittore et al., 2017; Geiß and Taubenböck, 2013; Rathje and Adams, 2008). Consequently, while remote sensing is invaluable for fine-scale disaster analysis, its direct and uniform deployment within a global risk-assessment framework remains difficult. This practical constraint further motivates the need for an intermediate spatial screening strategy to identify priority areas for subsequent Earth observation analysis.
The preceding considerations highlight two related needs: an indicator that is sensitive to recent major-event accumulation and a spatial unit capable of representing subnational and transboundary patterns. Locations experiencing recurrent major events within a relatively short period may warrant closer assessment of preparedness, recovery conditions, and resilience, particularly in developing countries (Ridder et al., 2020; Rentschler et al., 2022; Bündnis Entwicklung Hilft and IFHV, 2023). A spatially explicit framework can therefore complement long-term country-level indices by identifying localized concentrations of recent major-event activity.
Accordingly, this study introduces the ARI, a retrospective and grid-based indicator designed to represent the spatial accumulation of mortality-screened major disaster events during 2013–2023. The indicator uses 5° × 5° latitude–longitude grid cells as its basic assessment unit and incorporates WRI as a contextual weighting coefficient. ARI thereby provides a complementary perspective that links recent major-event accumulation with the underlying country-level risk context. To evaluate the resulting prioritization, ARI is further examined through direct reference-indicator comparisons, a temporally separated 2024–2025 post-period comparison, and sensitivity analyses of key methodological choices.
ARI is intended to support policymakers, practitioners, humanitarian organizations, and researchers by identifying areas where recent major-event activity is concentrated. The resulting spatial priorities can inform more detailed assessment of preparedness, recovery, capacity-building, and humanitarian needs, while providing researchers with a complementary perspective to existing long-term risk indices.
In addition, to facilitate further remote sensing-based research, this study systematically integrates and supplements existing sub-metre visible-spectrum remote sensing imagery for ARI-identified hotspot grids, thereby constructing the standardized 3H Dataset. The dataset provides a downstream observational resource for subsequent fine-scale applications in the identified priority regions.
2.1 Disaster event dataset and filtering strategy
The Emergency Events Database (EM-DAT) serves as the primary source of disaster records for this study. A joint initiative of the Centre for Research on the Epidemiology of Disasters (CRED) and the World Health Organization (WHO), EM-DAT was established in 1988 and has since been managed by the University of Leuven (UNDP, 2004; Delforge et al., 2025). The database documents over 26 000 significant events worldwide from 1900 to the present (Delforge et al., 2025), and its combination of open-access format and authoritative sources has made it a cornerstone resource in disaster risk research (Wen et al., 2023; Mokhtari et al., 2023; Peduzzi et al., 2012; Formetta and Feyen, 2019).
Considering the timeliness of disaster statistics and reliability of historical records, this study uses 2013–2023 as the fixed historical period for constructing ARI and the associated baseline indicators. In addition, earlier EM-DAT records (particularly pre-2000) are known to suffer from reporting inconsistencies and missing entries, especially in developing countries. Therefore, restricting the temporal scope to the past decade ensures higher data completeness and comparability, consistent with the objective of capturing recent major-event accumulation. Records from 2024–2025 are excluded from the construction of ARI and are used only for the temporally separated post-period consistency and benchmark comparison described in Sect. 2.6.
This study prioritizes disaster categories associated with structural damage, as building destruction accounts for the majority of casualties and losses in natural hazards (Ceferino et al., 2018a, b, 2024). Accordingly, the present framework mainly targets sudden-onset hazard processes for which major event accumulation can be more directly represented within EM-DAT records and more plausibly connected to Earth observation applications. EM-DAT's focus on significant events, those likely to trigger humanitarian crises and attract international attention, is consistent with the present emphasis on major disaster events (Delforge et al., 2025; Mokhtari et al., 2023; Peduzzi et al., 2012; Formetta and Feyen, 2019).
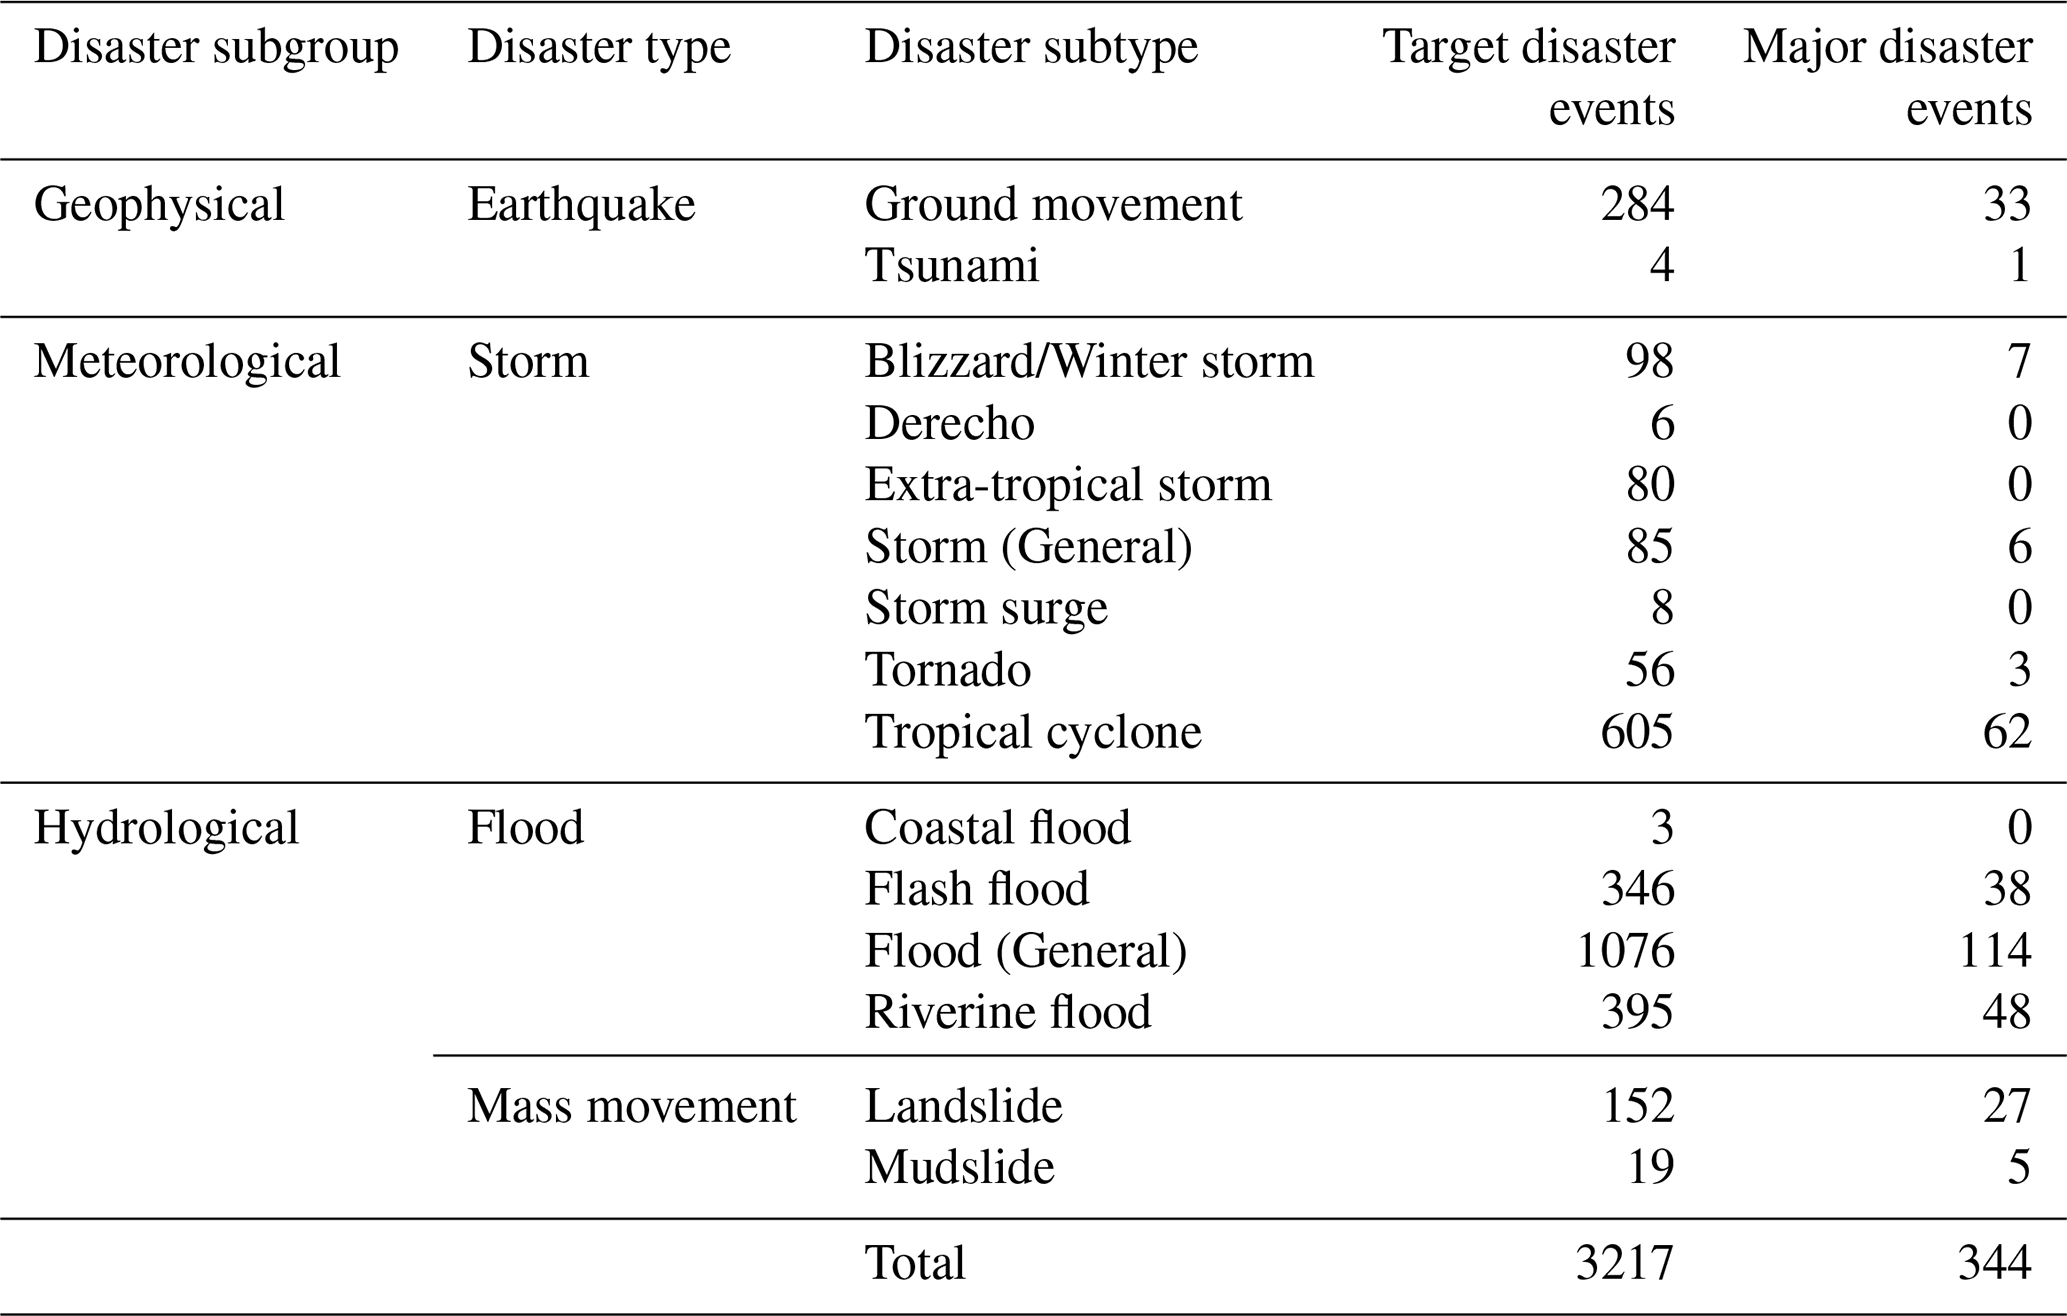
Using a threshold of 50 fatalities (Total Deaths), this study identifies 344 major disaster events for detailed statistical analysis. Mortality is adopted as a study-specific operational screening variable because population-based indicators in EM-DAT, such as “No. Affected” and “No. Homeless”, are often influenced by differences in national definitions and estimation practices (UNDP, 2004; Newman and Noy, 2023; Peduzzi et al., 2009), while economic indicators such as “Total Damage” are strongly shaped by uneven valuation systems, reporting capacity, and development levels across countries (UNDP, 2004; Peduzzi et al., 2009). Mortality therefore provides relatively high cross-country comparability while allowing a sufficiently large and geographically distributed sample for global grid-level analysis. The influence of the ≥50-fatality criterion is examined through local threshold perturbations of 40, 60, and 70 reported fatalities, as described in Sect. 2.6 and reported in Sect. 3.3.2. Consequently, the resulting sample emphasizes mortality-intensive events and underrepresents economic-loss-dominated disasters, indirect cascading impacts, and slow-onset hazard processes.
Table 2 presents the selected disaster categories and their corresponding event counts, following EM-DAT's classification system of subgroups, types, and subtypes. The analysis encompasses earthquakes, storms, floods, and mass movements, comprising three disaster subgroups and fifteen disaster subtypes. Within EM-DAT, “Mass movement” events and the subtype “Landslide” are categorized as either dry or wet events under the “Geophysical” and “Hydrological” subgroups, respectively (Delforge et al., 2025). For statistical clarity, dry landslides, representing only 1.3 % of cases, are consolidated within the “Hydrological” subgroup. Derecho, extra-tropical storm, storm surge, and coastal flood are absent from the final major-event sample because no records in these four subtypes meet the ≥50-fatality criterion during the study period. This event composition may bias the analysis toward hazard subtypes prone to generating short-term, high-mortality impacts.
2.2 Spatial standardization
A significant challenge in analyzing EM-DAT data arises from its non-standardized recording of disaster locations (Lindersson et al., 2020; Rosvold and Buhaug, 2021; Nohrstedt et al., 2022). While precise latitude–longitude coordinates are available for all earthquake events and selected other disaster events, the majority of events are documented only through textual descriptions of affected locations, such as city and village names. In addition, certain disaster events, notably floods and storms, may affect broad or spatially discontinuous areas, which makes direct spatial comparisons inherently difficult when only textual location descriptions are available.
To support consistent grid-based aggregation, this study employs a rule-guided manual spatial-standardization procedure that converts each major disaster event into a single representative event-location anchor. When precise latitude–longitude coordinates are already provided within EM-DAT, they are retained directly. For events recorded only through textual descriptions, the reported affected places and administrative units are reviewed, and one practical event-location anchor is selected with reference to their geographic distribution and, where clearly documented in the source information, the principal area of reported impact. The selected location is then converted to latitude–longitude coordinates using available geographic and administrative-boundary information.
The source records vary considerably in spatial detail, and more than one plausible anchor may exist for an event described through several affected locations. The manual selection step may therefore involve qualitative judgement. Nevertheless, the selected anchor is constrained by the geography documented in the corresponding EM-DAT record and is applied consistently to establish a standardized event–grid association at the analytical scale used in this study.
For events spanning multiple administrative units, one event-location anchor is assigned to a single grid cell, thereby avoiding double-counting across adjacent grids. This point-based standardization enables uniform global allocation for ARI calculation but simplifies the spatial footprints of geographically extensive events. Table 3 documents representative examples by linking the original location descriptions with the selected sites and coordinates. The implications of this spatial simplification are discussed in Sect. 5, and its influence on the resulting hotspot pattern is evaluated through an alternative allocation of the 2022 Pakistan flood event in Sect. 2.6.
Table 3Illustrative examples of the rule-guided conversion of textual EM-DAT location records into representative event-location anchors.
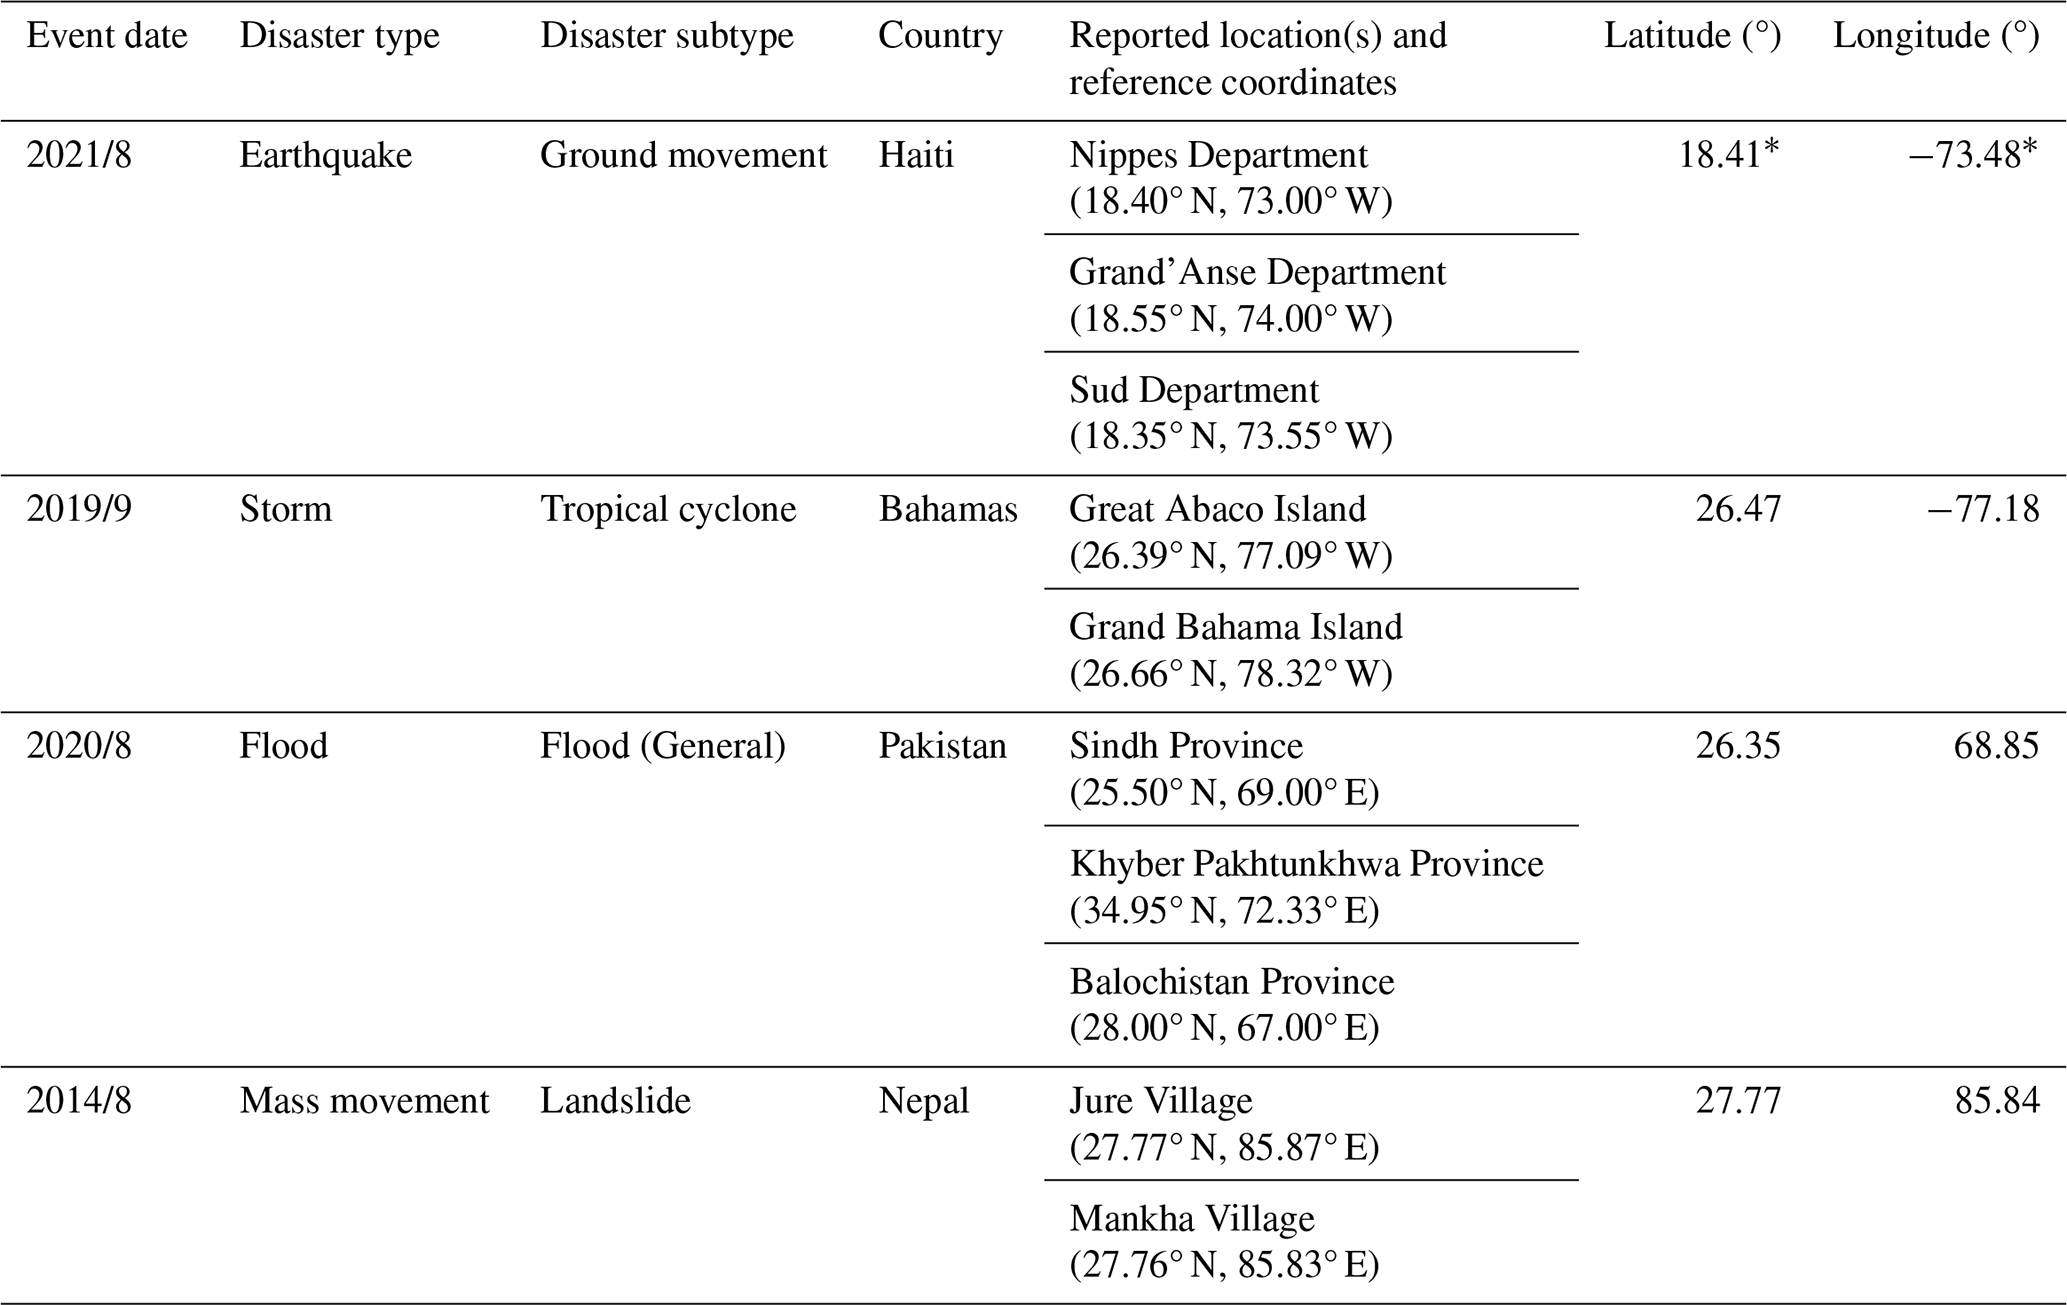
* Precise latitude–longitude coordinates are available for all earthquake events in EM-DAT.
2.3 Risk indices and indicators
Disaster risk assessments at global or large spatial scales commonly use indicator-based methods or statistical analyses of historical data (Gill and Malamud, 2014; Shi et al., 2016; Ming et al., 2015), whereas local and urban studies at smaller scales often rely on remote sensing-supported simulations (Chen et al., 2014). In this study, we adopt a hybrid approach that combines a global indicator-based index (WRI) with event statistics at the grid scale to construct the ARI.
In disaster risk assessment, there is broad consensus that risk results from the interaction between the hazard posed by a disaster and the vulnerability of the affected region (Koks et al., 2015, 2019; Little et al., 2023; Welle and Birkmann, 2015; Birkmann, 2007), often expressed as:
Equation (1) is a simplified schematic expression used here to illustrate the joint influence of physical processes and socio-economic fragility. It is a conceptual representation and is not the computational equation used to calculate ARI. This basic formula has evolved into various forms to accommodate different dimensional requirements and methodological approaches. In many operational frameworks, a third component (Exposure) is explicitly included to reflect the population and assets at risk. For example, DRI expands the model to define risk as the product of hazard, population, and vulnerability (UNDP, 2004), while WRI characterizes the risk index as the geometric mean of exposure and vulnerability (Bündnis Entwicklung Hilft and IFHV, 2023).
2.3.1 World Risk Index (reference index)
The WRI framework, published annually since 2011 through the World Risk Report (WRR), is particularly noteworthy for its alignment with current United Nations Office for Disaster Risk Reduction (UNDRR) terminology and its contemporary relevance (Bündnis Entwicklung Hilft, 2011; Bündnis Entwicklung Hilft and IFHV, 2023). In WRI, exposure quantifies an area's susceptibility to various hazards, primarily considering hazard intensity and population density (Bündnis Entwicklung Hilft and IFHV, 2023). Vulnerability, on the other hand, is composed of sensitivity, lack of coping capacities, and lack of adaptive capacities (Bündnis Entwicklung Hilft and IFHV, 2023), closely linked to socio-economic factors. WRI is expressed as follows:
where E denotes exposure, V denotes vulnerability, P represents the number and share of the population exposed to natural hazards, D represents the intensity levels of natural hazards, S denotes susceptibility, L1 denotes the lack of coping capacities, and L2 denotes the lack of adaptive capacities (Bündnis Entwicklung Hilft and IFHV, 2023).
WRR posits that the occurrence of disaster events is influenced by both the severity of disaster impacts on society and the vulnerability of society in responding to these impacts (Bündnis Entwicklung Hilft, 2011). In other words, the risk level of disaster events depends on both natural processes and social capabilities (Bündnis Entwicklung Hilft and IFHV, 2023). In this study, these structural conditions are represented through the country-level WRI value.
In the present study, WRI is adopted as a reference index because it provides a well-established and annually updated country-level representation of exposure and vulnerability conditions. Its comprehensive indicator system and multi-hazard orientation make it suitable for contextualizing disaster events across regions with different socio-economic backgrounds (Bündnis Entwicklung Hilft and IFHV, 2022, 2023). At the same time, its country-level assessment unit and broad statistics for accumulated impacts, including “Internally displaced persons due to natural disasters” and “Population affected by disasters in the last 5 years” from the perspective of vulnerable groups, limit its ability to represent recent grid-level event clustering at subnational and transboundary scales and may introduce the data-reliability concerns discussed in Sect. 2.1.
2.3.2 Accumulated-Event Risk Indicator (proposed indicator)
In this study, WRI is adopted unchanged as a country-level reference index and contextual weighting factor, encapsulating the broader exposure-vulnerability setting in which disaster events occur. The proposed ARI builds on this reference framework by combining recent major disaster events with national WRI values at the grid scale. Conceptually, ARI integrates two components: (1) the number of major disaster events assigned to each grid cell from 2013 to 2023, based on the event filtering strategy in Sect. 2.1 and the spatial standardization procedure in Sect. 2.2; and (2) the WRI value of the country associated with each event, which contextualizes the event contribution according to country-level exposure and vulnerability conditions. In this way, ARI emphasizes the recent accumulation of mortality-screened major events in contexts with varying underlying risk conditions. The indicator is defined as:
where ARIj is the ARI of grid cell j, nj is the number of major disaster events assigned to grid cell j from 2013 to 2023, i indexes the events occurring in that grid cell, c(i) denotes the country associated with the i-th event according to the EM-DAT record, and WRIc(i) is the WRI value of that country. When nj=0, ARIj is strictly defined as 0. In this formulation, ARI represents the accumulated sum of country-level WRI weights associated with recent major disaster events occurring within each grid cell. ARI should therefore be interpreted as an event-driven, grid-based, context-weighted relative indicator for hotspot prioritization.
In the current implementation, reported fatalities determine event eligibility, after which each qualifying event contributes the associated country-level WRI value once. All events receive the same temporal treatment throughout 2013–2023, so their chronological order does not affect ARI. The resulting formulation provides a static retrospective representation of event accumulation over the fixed study period.
WRI is selected as the reference framework because it is regularly updated through WRR, integrates social, economic, political, and environmental dimensions, adopts a multi-hazard perspective, and provides quantitative scores suitable for comparison and further computation (Bündnis Entwicklung Hilft and IFHV, 2022, 2023). These properties allow ARI to retain a common country-level contextual framework while shifting the analytical focus toward recent major-event accumulation. Although WRI and the present study do not use exactly the same hazard taxonomy, both concentrate on major natural hazards affecting large populations. Given the aggregate role of WRI and the exploratory purpose of ARI, these differences are considered acceptable for the present analysis.
For grid cells intersecting multiple countries, each event is linked to the WRI of the country recorded in EM-DAT as part of the affected area, preserving the association between individual disaster records and their national risk contexts. To facilitate comparison with the original country-based WRI, an Equivalent WRI is calculated by assigning each grid cell the maximum WRI of all overlapping countries. This provides a conservative grid-level representation of the highest WRI background within the common spatial framework, without incorporating historical event accumulation. Two additional event-based reference indicators are calculated using the same qualifying events and grid assignments: unweighted major-event count, defined as the number of qualifying events in each grid, and death-sum, defined as the total reported fatalities of those events. Their diagnostic comparisons with ARI are described in Sect. 2.6 and reported in Sect. 3.2.
2.4 Spatial aggregation for ARI computation
ARI computation depends on the choice of spatial assessment unit. The objective is to identify recent major-event accumulation patterns at the global scale while retaining a spatial resolution finer than national boundaries. The selected grid must therefore be large enough to accommodate the positional uncertainty and broad footprints of some disaster events, yet sufficiently refined to reveal subnational and transboundary clustering.
The choice of spatial unit therefore involves a methodological trade-off. Excessively large grid cells can obscure localized event-accumulation patterns and weaken the advantage of moving beyond country-level assessment. Conversely, very small cells can fragment the representation of geographically extensive hazards such as floods and storms, amplify the positional uncertainty associated with representative event coordinates, and increase sensitivity to temporal changes in population distribution and hazard zones (Dilley et al., 2005). Moreover, as disaster risk assessments become more refined at smaller scales (Feng et al., 2017; Smith et al., 2019), the pursuit of excessively small assessment unit sizes on a global scale clearly no longer meets practical application needs.
For these reasons, this study adopts a 5° × 5° latitude–longitude grid as the baseline assessment unit for ARI computation. This resolution is intended to provide a practical balance among global coverage, spatial differentiation, data reliability, and compatibility with remote sensing applications. To examine the sensitivity of this choice, alternative grid sizes of 2.5° × 2.5° and 10° × 10° are evaluated in Sect. 3.3. The quantitative cross-resolution assessment focuses on the exactly nested 5° and 2.5° grids and uses parent–child spatial correspondence measures defined in Sect. 2.6; the 10° result is retained as a descriptive coarser-resolution comparison.
2.5 Analytical workflow
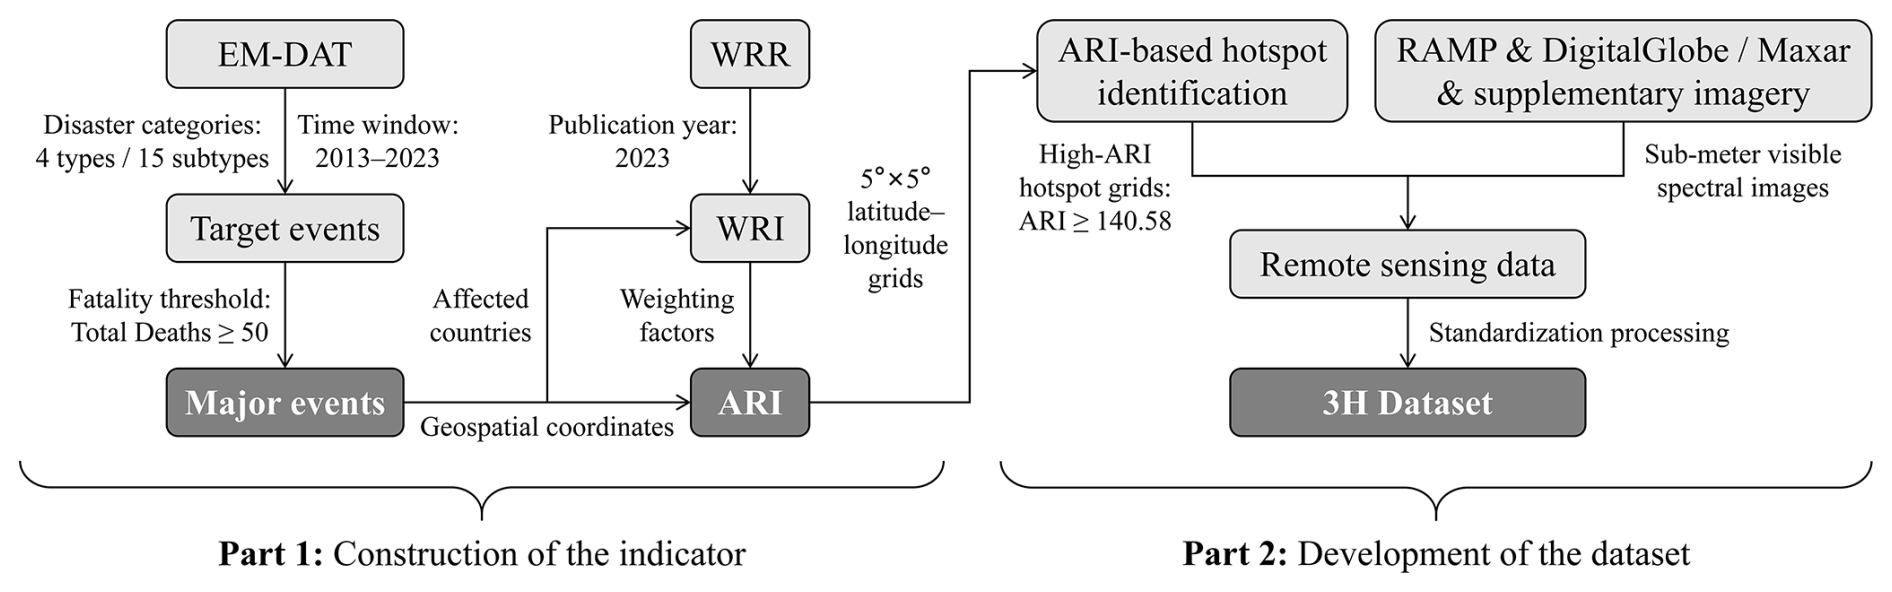
Figure 1 summarizes the analytical workflow from disaster-event selection to ARI construction and remote sensing data integration. The workflow consists of three sequential stages: (1) Identification of major disaster events: EM-DAT records for 2013–2023 are filtered using the ≥50-fatality threshold (Sect. 2.1), and each selected event is assigned a standardized event-location anchor (Sect. 2.2). (2) Construction of the ARI: Major disaster events are aggregated within 5° × 5° grid cells and weighted using country-level WRI values (Sect. 2.3). The grid configuration is described in Sect. 2.4, and the comparative and sensitivity analyses are presented in Sect. 2.6. (3) Development of the remote sensing dataset: Existing sub-metre imagery within the high-ARI hotspot grids is compiled and supplemented where necessary to construct the 3H Dataset (Sect. 4), which supports subsequent finer-scale studies in the selected priority regions.
2.6 Comparative and sensitivity analyses
Four complementary analyses are used to examine the construction, prioritization characteristics, post-period correspondence, and methodological sensitivity of ARI.
First, a global diagnostic comparison is conducted among ARI, Equivalent WRI, unweighted major-event count, and death-sum across the same 153 grid cells with non-zero baseline ARI. All four indicators use the 2013–2023 event period, the same event-location anchors, and the same 5° × 5° grid framework. Spearman's rank correlation coefficients are used to measure the monotonic correspondence between pairs of grid rankings. Overlap among the principal upper-priority sets is evaluated using the Jaccard similarity coefficient:
where A and B are the respective high-value grid sets. The study-defined 14-grid hotspot set is used as the principal global comparison threshold because it is the baseline priority set subsequently used to construct the 3H Dataset. All grids tied at a nominal ranking boundary are retained in the corresponding high-value set. The number of distinct indicator values and the proportion of cells belonging to tied-value groups are also recorded to characterize grid-ranking differentiation.
Second, post-period consistency and benchmark comparison are evaluated using 44 Asian events recorded during 2024–2025 and meeting the same ≥50-fatality screening criterion as the baseline analysis. These events comprise 23 records from 2024 and 21 from 2025, and occur in 22 unique 5° × 5° grid cells. ARI and the three reference indicators used for this comparison are calculated exclusively from 2013–2023 data. For the 42 post-period events located in cells belonging to the common historical ranking universe, the corresponding global ranks under the four indicators are recorded and compared through mean and median rank, coverage by the predefined global Top-14 sets, and paired event-level rank comparisons. The remaining two events occur in post-period-only cells and are retained in the analysis without assigning them a historical rank.
An equal-grid reference is additionally implemented within an Asia-specific comparison universe defined as the union of the 74 Asian cells with non-zero ARI during 2013–2023 and the two post-period-only event cells, producing 76 unique cells. For each of the four indicators, nominal Top-5, Top-10, and Top-20 sets are identified within this universe, with all boundary ties retained. The expected hit rate under equal grid selection is calculated as the actual number of cells in each tie-inclusive high-value set divided by 76. Two observed rates are reported: the event-level hit rate, defined as the proportion of all 44 events occurring within the selected set, and the unique-grid hit rate, defined as the proportion of the 22 event-containing cells included in that set. The observed-to-expected ratio is calculated by dividing each observed rate by its corresponding equal-grid expected rate. These quantities are used as descriptive benchmarks of post-period spatial correspondence.
Third, sensitivity to the fatality threshold is assessed by reconstructing the qualifying event set and recalculating ARI under thresholds of 40, 60, and 70 reported fatalities. These values represent local changes of −20 %, +20 %, and +40 %, respectively, relative to the 50-death baseline. For each configuration, the analysis records the number of cells with non-zero ARI, the number and proportion of baseline Top-14 hotspot cells retained, and their mean absolute rank displacement. Spearman correlations with the baseline ordering are calculated across a common grid universe defined as the union of cells with non-zero ARI under at least one of the four threshold configurations; cells absent under an individual configuration are assigned an ARI value of zero for this comparison.
Grid-resolution sensitivity is evaluated by recalculating ARI using 2.5° × 2.5° and 10° × 10° grids. Because absolute ARI values depend on the aggregation unit, the quantitative 5°–2.5° comparison uses relative high-value sets and their exact parent–child spatial correspondence. Each 5° cell contains four 2.5° child cells. The child-grid retention ratio is defined as the proportion of the 14 baseline high-ARI 5° cells containing at least one tie-inclusive high-ARI 2.5° child. The parent-grid containment ratio is the proportion of tie-inclusive high-ARI 2.5° cells located within baseline high-ARI 5° parents. The mean high-ARI child share is the average proportion of the four child cells classified as high ARI across the 14 baseline hotspot parents. The 10° calculation provides a descriptive comparison of the effect of spatial coarsening.
Finally, the influence of point allocation for a geographically extensive event is examined using the 2022 Pakistan floods. The EM-DAT location description supports affected locations across nine 5° × 5° cells. Three scenarios are evaluated: (1) the original point allocation, in which the full Pakistan WRI contribution of 26.45 is assigned to the original representative cell; (2) an event-excluded diagnostic, in which the event is removed to isolate its contribution; and (3) an equal fractional allocation, in which the same total contribution is conserved and divided equally among the nine supported cells. The fractional scenario therefore provides a weight-conserving test of allocation sensitivity across the supported cells. ARI values and ranks are recalculated within the Pakistan-related grid set and within the global ranking, and changes in the predefined Top-5, Top-10, Top-14, and Top-20 sets are recorded.
3.1 Spatiotemporal characteristics of recent disaster events
Within the 2013–2023 study period, EM-DAT records 3217 target disaster events across four disaster types and fifteen disaster subtypes (Table 2). Applying the ≥50 fatalities criterion results in 344 major disaster events that form the empirical basis of this study. Among these, earthquakes, storms, floods and mass movements account for 9.9 %, 22.7 %, 58.1 % and 9.3 % of events, respectively. Floods therefore dominate the mortality-screened event set, followed by storms, whereas earthquakes and mass movements account for smaller but still non-negligible proportions.
Figure 2a displays the global distribution of the selected disaster events against a Natural Earth basemap (https://www.naturalearthdata.com, last access: 5 October 2026), while panels (b)–(e) show the distributions of the four disaster types. Semi-transparent event points indicate local clustering intensity, and N1–N4 denote the maximum point overlap in the corresponding subpanels. These values are used as descriptive visual measures of local event concentration.
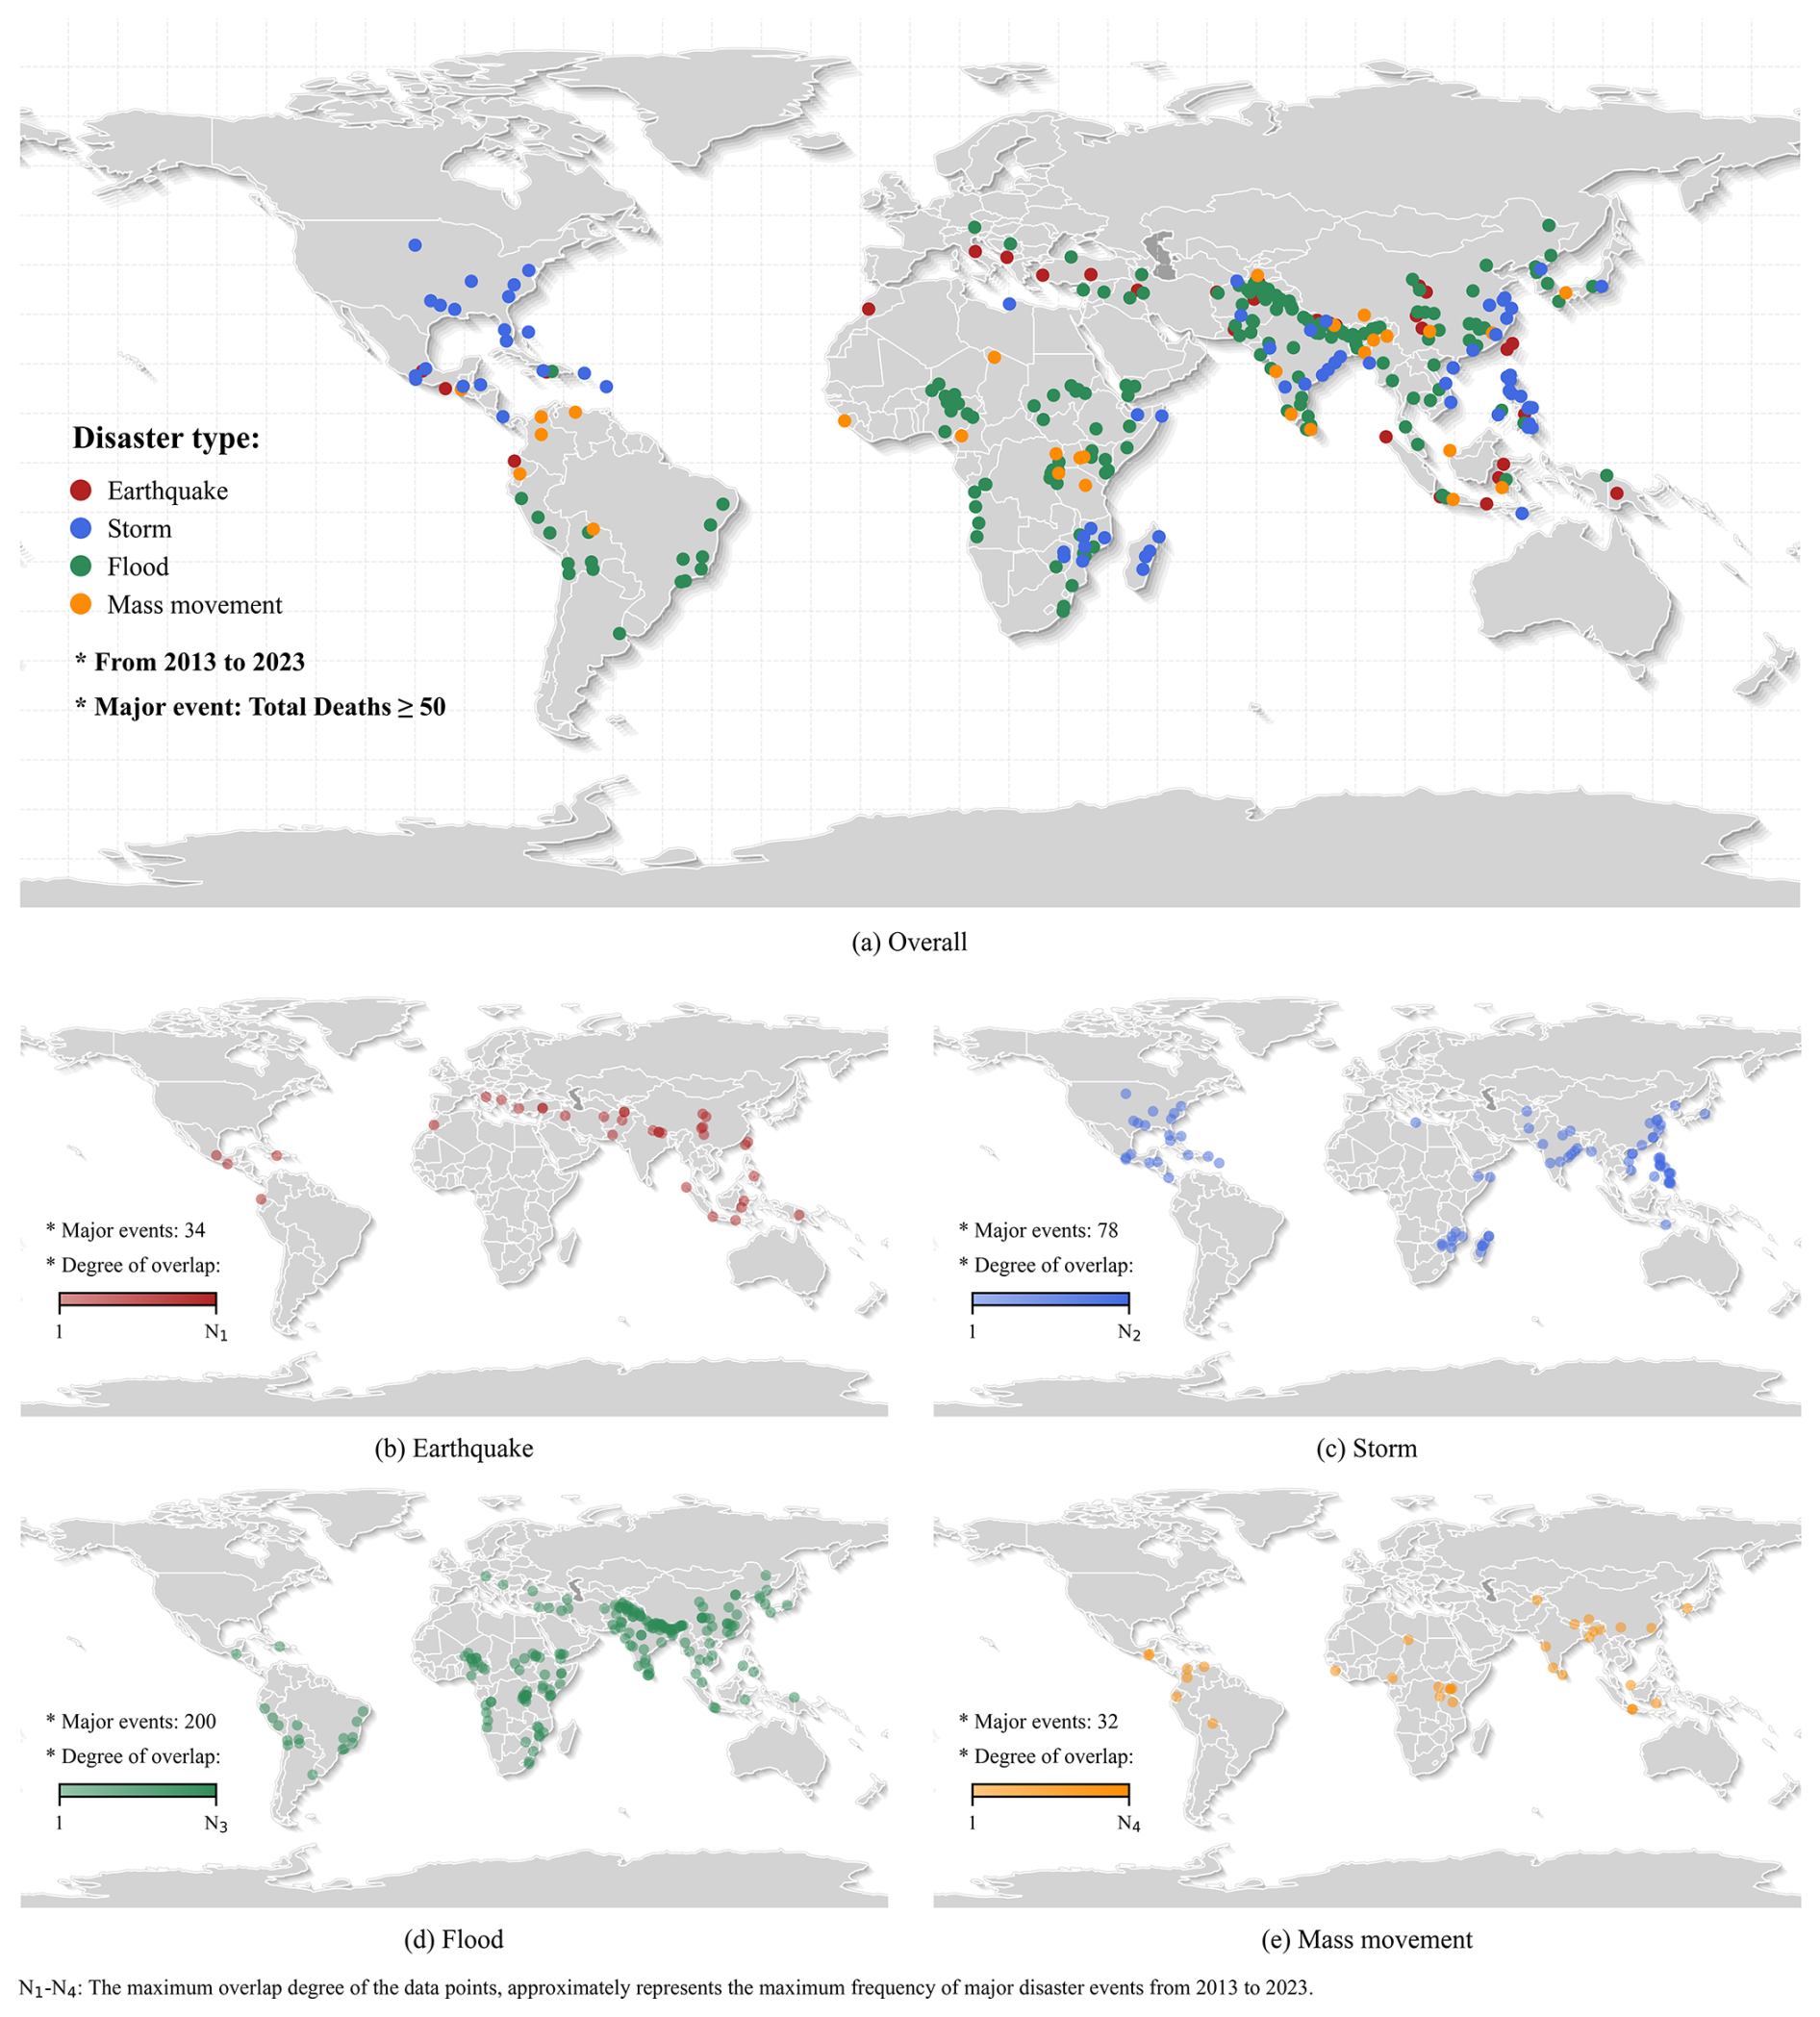
Figure 2Geographic distribution of selected major disaster events. (a) Global overview. Panels (b)–(e) visualize local event clustering using semi-transparent points. The notations N1–N4 denote the peak point superposition density, which serves as an approximate indicator of local disaster concentration within respective subpanels.
Overall, major disaster events exhibit marked spatial clustering. High concentrations of events are observed along tectonically active belts and in monsoon-affected regions, particularly in and around South and Southeast Asia, as well as in parts of Central America. These clusters often extend across national borders, reflecting the fact that many large-scale hazards, such as riverine floods and tropical cyclones, inherently transcend administrative boundaries. The resulting cross-border patterns are represented through the grid-based ARI analysis in the following section.
3.2 Global ARI distribution, hotspot identification, and diagnostic comparison
Using the 5° × 5° latitude–longitude grid as the baseline spatial unit, ARI values are computed for all regions based on the occurrence of major disaster events and the corresponding country-level WRI values. Calculation results indicate that there are 153 grids with ARI ≠ 0, accounting for 5.9 % of the total grid cells (Fig. 3a). High ARI values are predominantly concentrated in Asia, especially in regions surrounding the Himalayas and along the coastal belts of South and Southeast Asia, where repeated major floods, storms and earthquakes have occurred within the past decade. The global ARI distribution is therefore strongly uneven, with recent major-event contributions concentrated in a relatively limited set of hotspot regions.
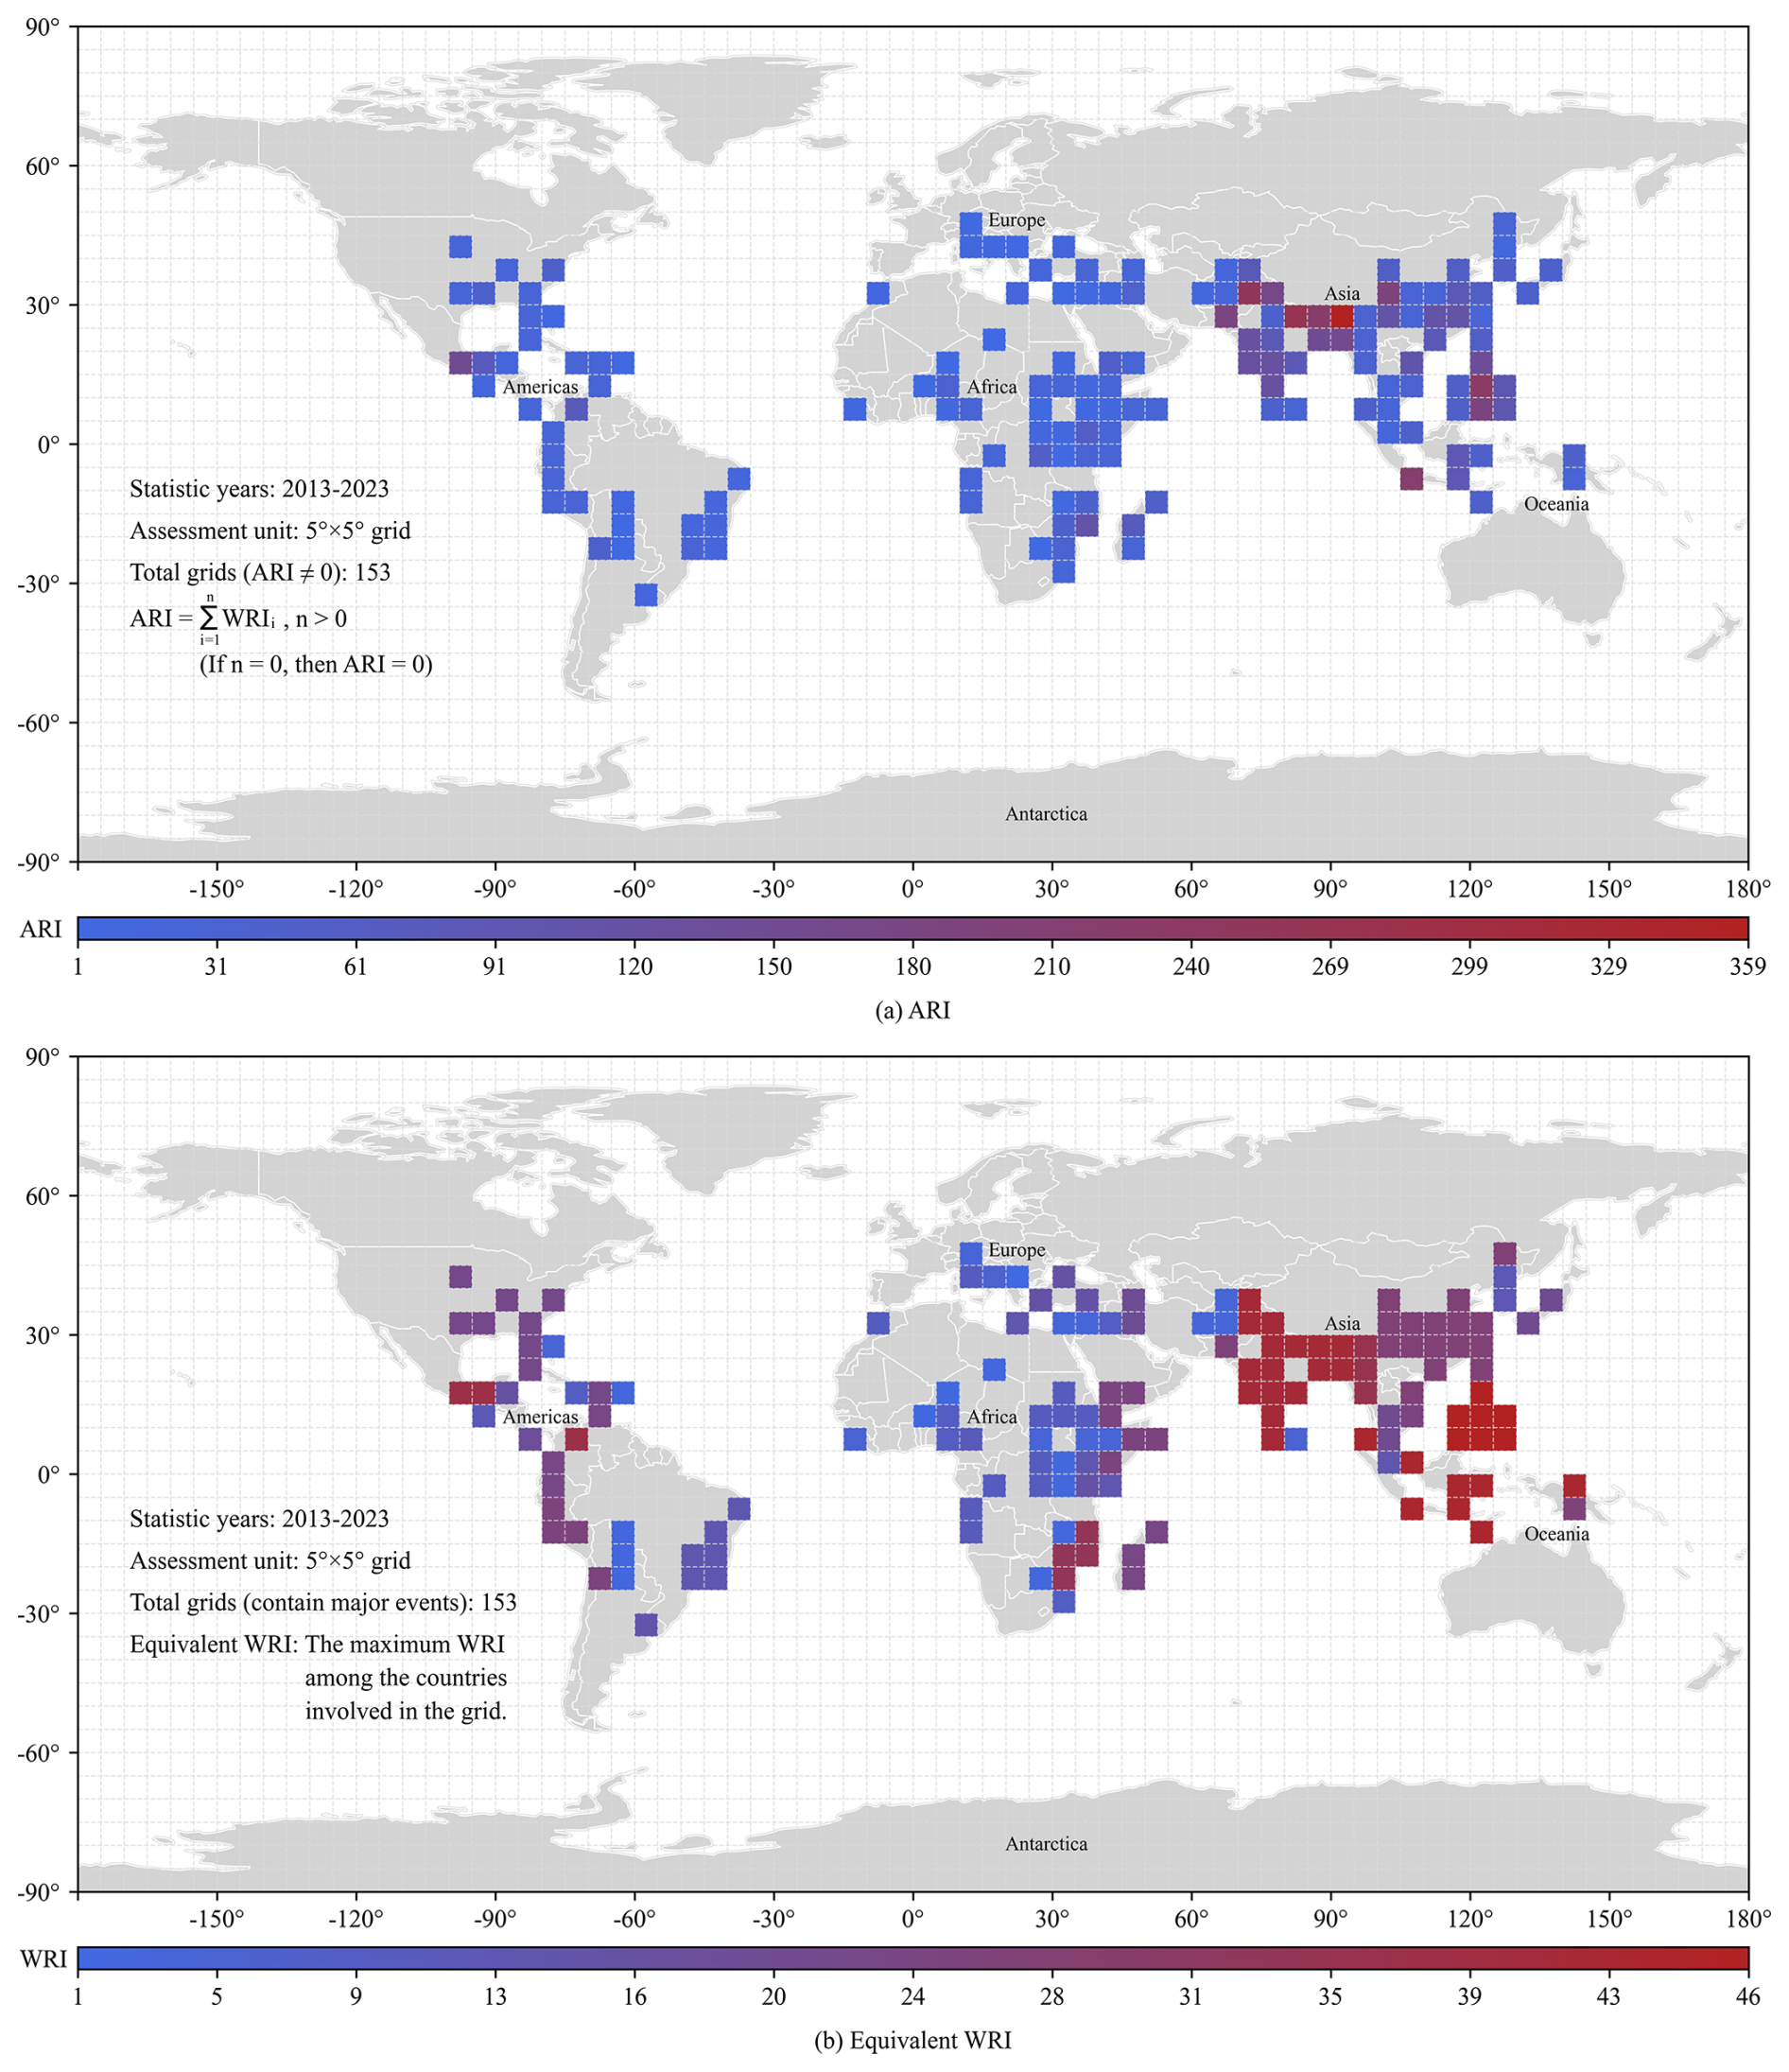
Figure 3Global distributions of (a) ARI and (b) Equivalent WRI in 5° × 5° latitude–longitude grids. The two panels use analogous colour progression but different numerical ranges.
To facilitate comparison with country-level risk patterns, an Equivalent WRI is calculated for each grid cell by assigning the maximum WRI value among all countries intersecting the grid (Sect. 2.3.2), as shown in Fig. 3b. Both indicators highlight elevated values in parts of Asia, but ARI produces stronger differentiation between high- and low-value grids where multiple major disasters have clustered. Because ARI represents recent event accumulation and Equivalent WRI represents country-level background risk, the analogous colour progression is used to compare their spatial patterns and relative contrasts across different numerical ranges. Their ranking and upper-priority differences are quantified later in this section.
To improve interpretability beyond the global maps, Fig. 4 provides a regional zoom-in corresponding to the Himalayan belt, South Asia, and Southeast Asia where high ARI grids cluster in Fig. 3a. The figure is designed for a grid-aligned comparison: the full 5° × 5° gridlines are shown in the regional window, and the two highlighted sub-windows (A and B) are reproduced on the right as actual cell-by-cell mosaics for Equivalent WRI and ARI using the same colour progression as in Fig. 3.
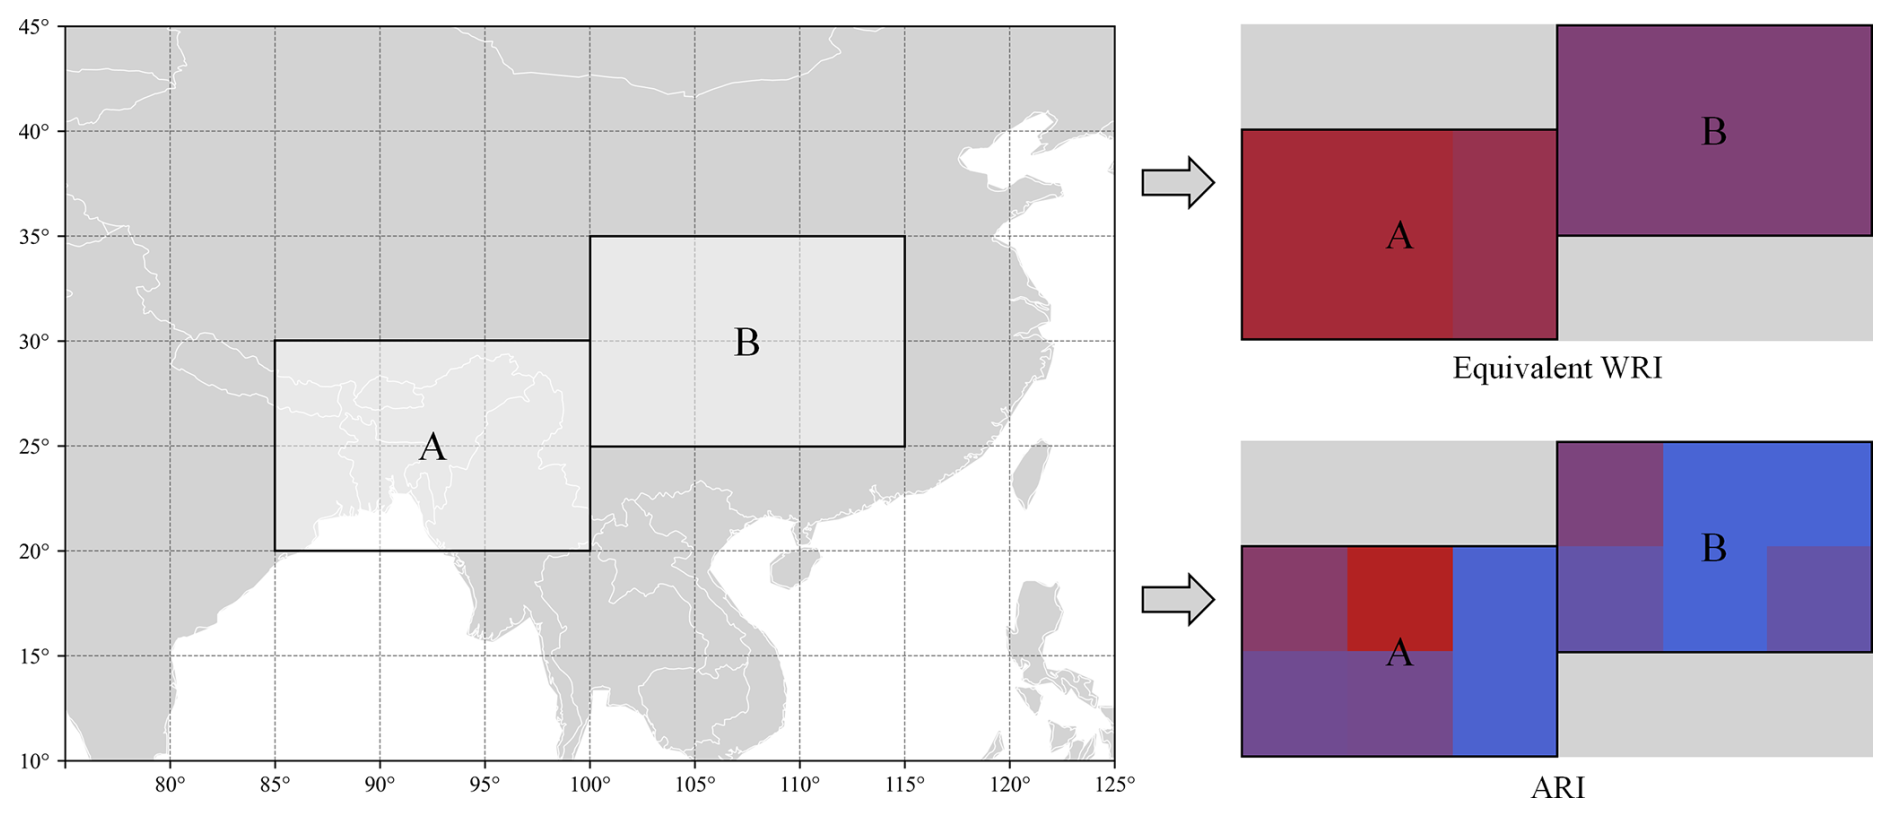
Figure 4Local zoom-in comparison of ARI and Equivalent WRI in 5° × 5° latitude–longitude grids.
Two contrasting situations are illustrated. In Window A, which spans multiple countries, Equivalent WRI mainly reflects country-level background differences, whereas ARI further differentiates neighbouring 5° × 5° cells according to the spatial concentration of recent major events within the same transboundary corridor. In Window B, which lies entirely within China, Equivalent WRI becomes spatially uniform by construction, while ARI still exhibits marked intra-national heterogeneity, indicating subnational hotspots associated with recent event accumulation. Taken together, Fig. 4 makes the contrast in Fig. 3 more explicit: incorporating recent event accumulation adds spatial discrimination along transboundary hazard corridors and within large countries where subnational variability is important.
To further examine regional variability, ARI results are grouped by continental regions (Americas, Europe, Africa, Asia and Oceania) according to EM-DAT's geographic partitioning labels (Delforge et al., 2025). Figure 5 displays the distribution of ARI across these continents. Asia clearly dominates in terms of both the number of non-zero grids and the magnitude of ARI values, reflecting the concentration of qualifying major events and their associated country-level WRI contributions within the study period. In other continents, non-zero ARI grids are fewer and generally of lower magnitude, although localized clusters of high ARI can still be identified, for instance in parts of Central America. The grid cells are ranked by their ARI values, and detailed information for each cell is provided in Table A1 in Appendix A.
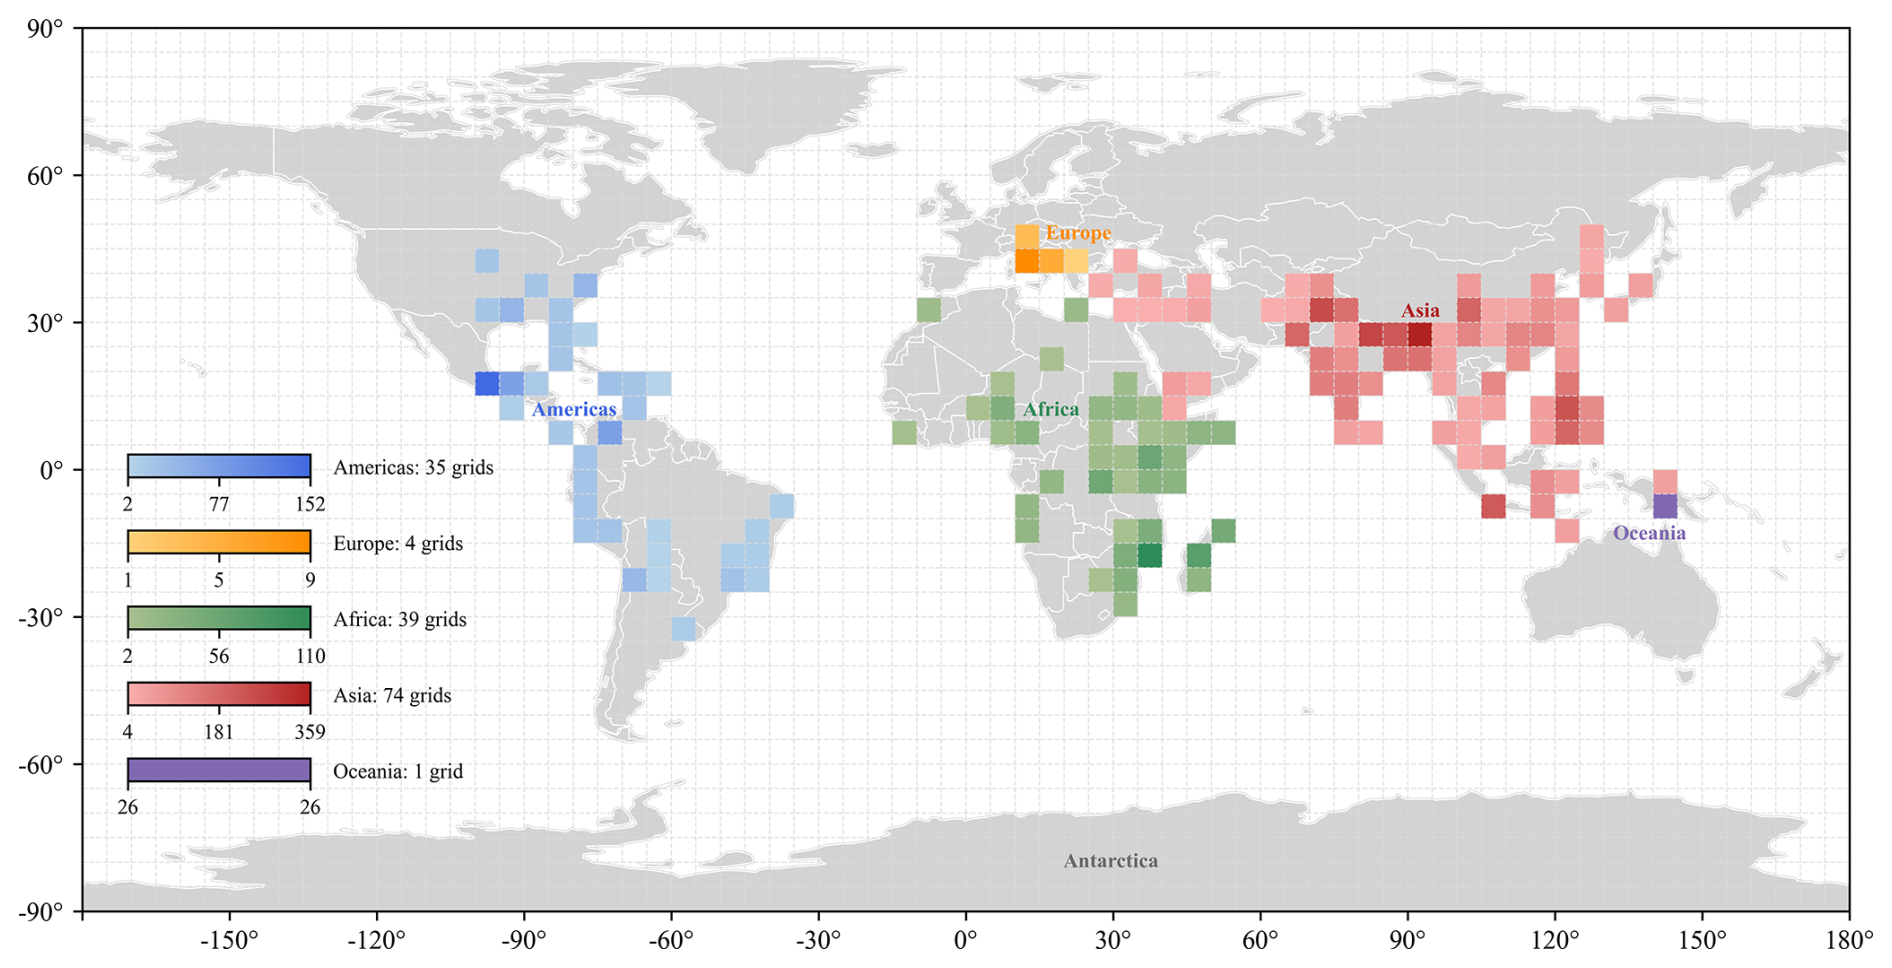
Figure 5Global distribution of ARI in 5° × 5° latitude–longitude grids across continental regions.
A subset of high-ARI hotspot grids is defined for subsequent prioritization and remote sensing data integration. A study-defined threshold is set at three times the maximum WRI value (46.86), corresponding to ARI ≥ 140.58. Under this criterion, 14 high-ARI hotspot grids are identified, accounting for 9.2 % of all non-zero ARI grids (Fig. 6). Based on their geographic coordinates, these hotspot grids intersect or contain areas in ten countries: India, China, Pakistan, the Philippines, Nepal, Bhutan, Indonesia, Myanmar, Bangladesh and Mexico. The identification of these high-ARI hotspot grids provides a focused spatial framework for subsequent remote sensing data integration (Sect. 4).
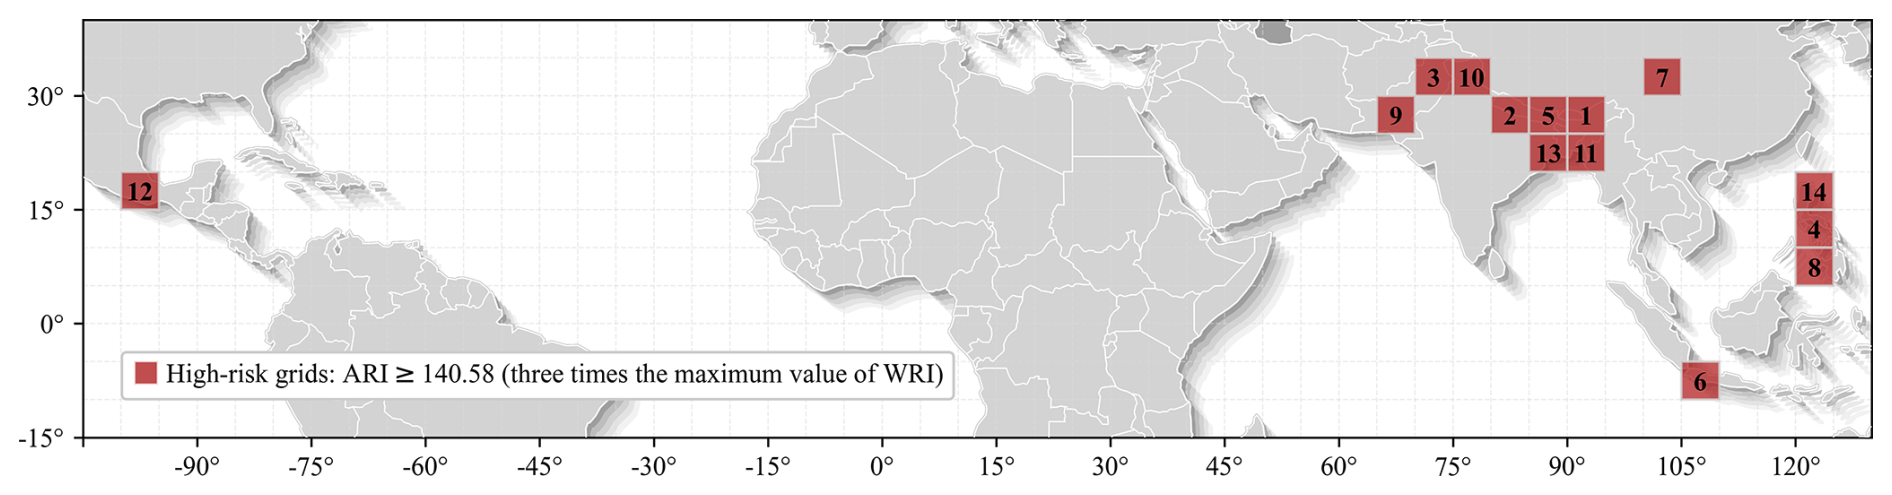
Figure 6Spatial distribution of the 14 high-ARI hotspot grids.
To characterize its relationships with the WRI-derived and event-based reference patterns, ARI is compared with Equivalent WRI, unweighted major-event count, and death-sum across the same 153 cells with non-zero baseline ARI. Table 4 reports pairwise Spearman rank correlations and Jaccard similarities among the tie-inclusive Top-14 high-value sets.
Table 4Global diagnostic comparison among ARI and three reference indicators across the 153 grid cells with non-zero baseline ARI.
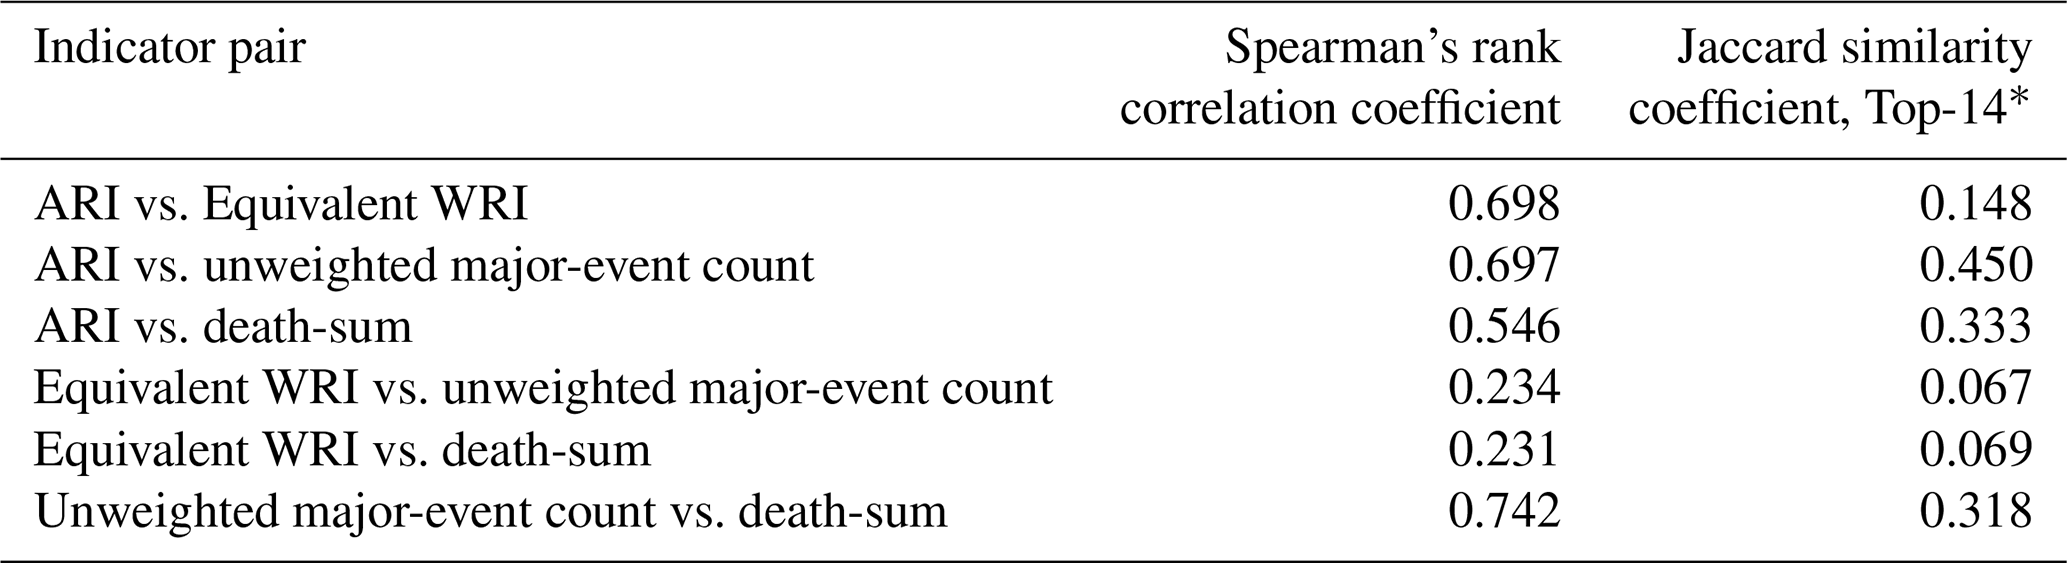
* All grid cells tied at the Top-14 cutoff were retained when constructing the high-value sets.
ARI has similar overall rank correlations with Equivalent WRI and unweighted major-event count, at 0.698 and 0.697, respectively, and a lower correlation with death-sum, at 0.546. These relationships are consistent with the formulation of ARI, in which WRI is deliberately incorporated as the contextual weight and qualifying-event recurrence supplies the historical event component.
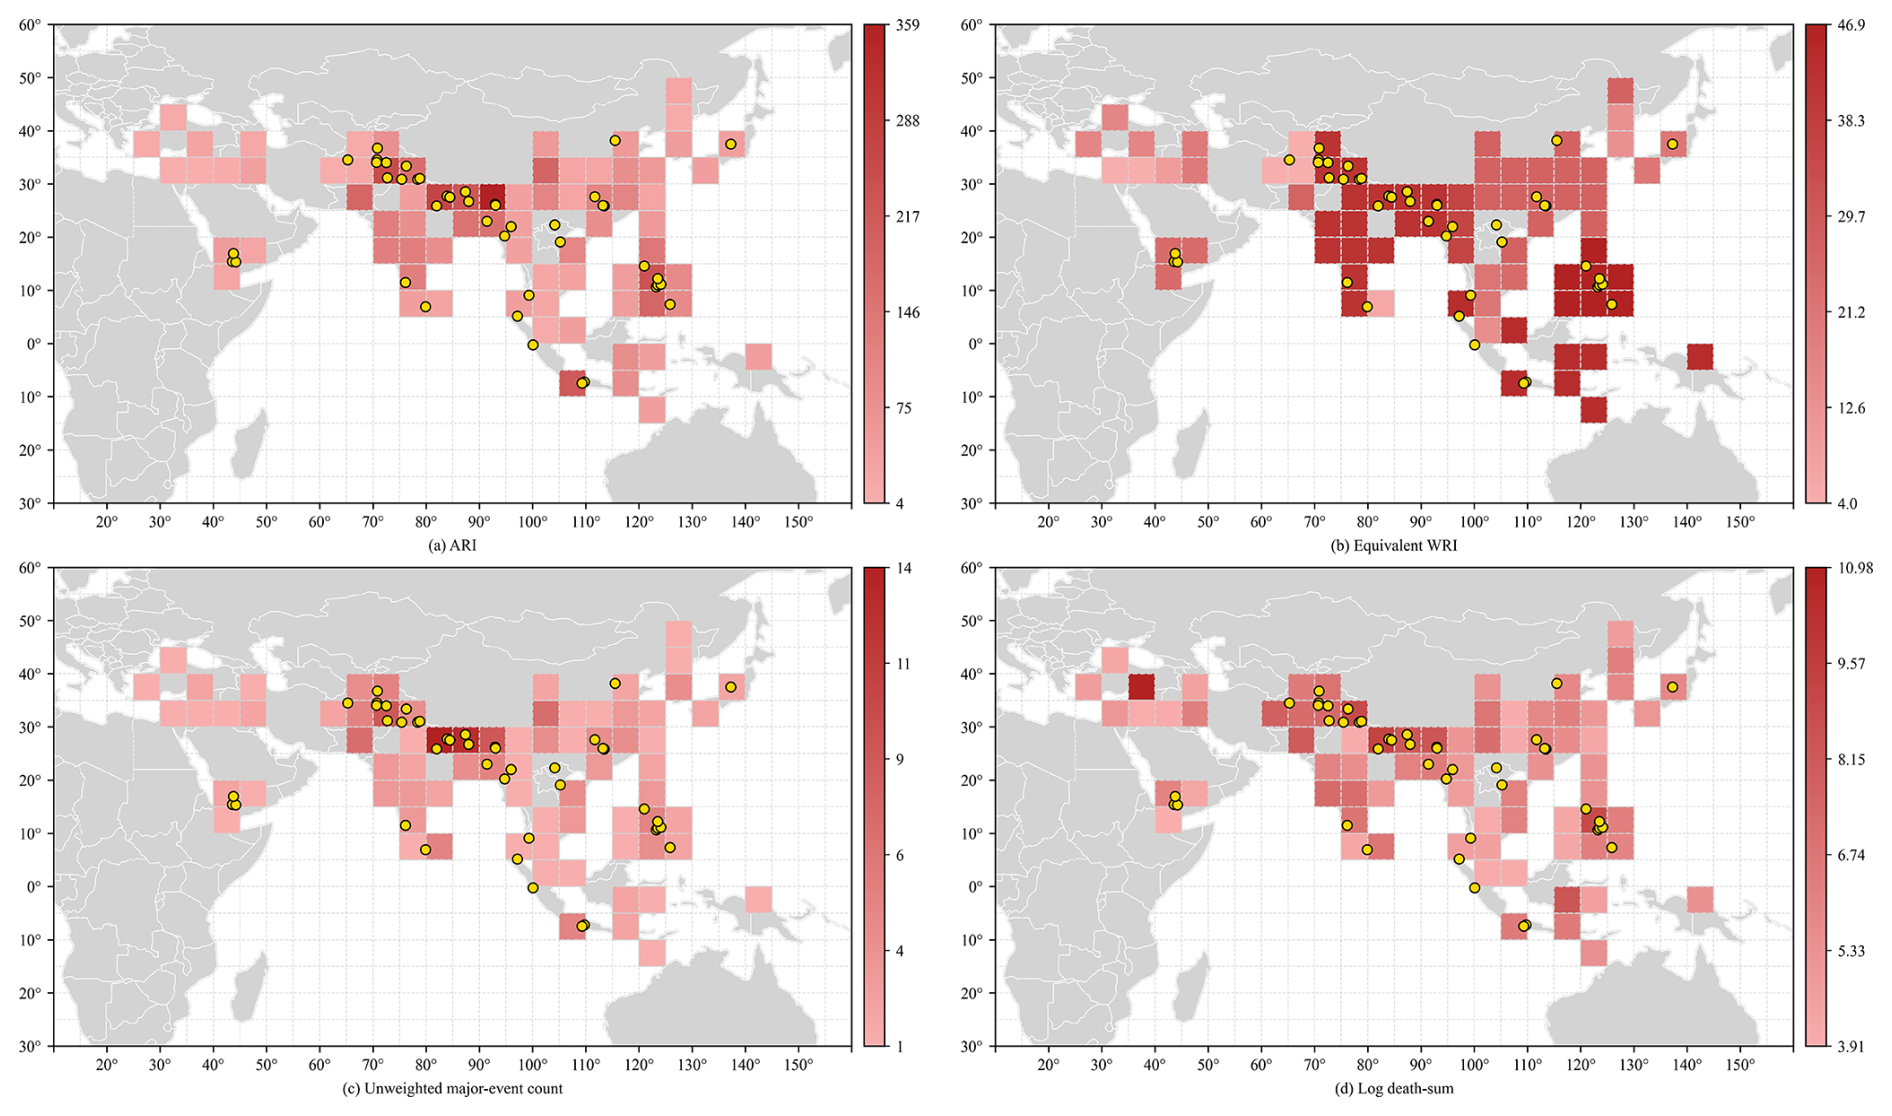
Figure 7Spatial comparison of (a) ARI, (b) Equivalent WRI, (c) unweighted major-event count, and (d) death-sum constructed from 2013–2023 data, together with the locations of major disaster events recorded in Asia during 2024–2025. Each panel uses a separately normalized colour scale for within-indicator interpretation.
The corresponding upper-priority overlaps are substantially lower than the overall rank associations, with Top-14 Jaccard similarities of 0.148, 0.450, and 0.333 for Equivalent WRI, unweighted major-event count, and death-sum, respectively. These results indicate that historical event accumulation reorganizes the upper-priority part of the WRI-only pattern, WRI weighting changes the ordering of recurrent-event grids, and death-sum produces a different priority pattern from mortality-screened event accumulation.
The four indicators also differ in ranking differentiation. Across the 153-cell comparison set, ARI produces 104 distinct values, compared with 44 for Equivalent WRI, 9 for unweighted major-event count, and 120 for death-sum. The proportions of cells belonging to tied-value groups are 49.7 %, 90.2 %, 98.7 %, and 36.6 %, respectively. By combining event recurrence with heterogeneous WRI weights, ARI provides finer differentiation than the WRI-only and integer-valued event-count references within the present dataset, supporting more selective grid prioritization.
3.3 Post-period consistency, benchmark comparison, and sensitivity analyses
This section examines three complementary properties of the ARI result: the correspondence between the historical prioritization and later major-event locations, the sensitivity of the principal hotspot set to the event-screening threshold and spatial resolution, and the influence of point allocation in the geographically extensive 2022 Pakistan flood case.
3.3.1 Post-period consistency and benchmark comparison
The post-period comparison contains 44 major disaster events recorded in Asia during 2024–2025 and meeting the same ≥50-fatality criterion as the baseline analysis. These comprise 23 events in 2024 and 21 in 2025 and occur in 22 unique 5° × 5° cells. All four historical indicators – ARI, Equivalent WRI, unweighted major-event count, and death-sum – are constructed exclusively from the 2013–2023 records. Of the 44 later events, 42 occur in cells included in the common historical ranking universe, while two occur in post-period-only cells without comparable prior ranks. Detailed event-level information is provided in Table B1. The corresponding spatial comparison is shown in Fig. 7.
For the 42 rankable events, ARI produces a mean historical grid rank of 21 and a median rank of 10. The corresponding mean and median ranks are 28 and 18 for Equivalent WRI, 21.48 and 9 for event count, and 31.31 and 20 for death-sum. Twenty-four of the 42 events (57.1 %) occur in the predefined global Top-14 ARI cells, compared with 10 events (23.8 %) for Equivalent WRI, 22 (52.4 %) for event count, and 20 (47.6 %) for death-sum. Event count therefore produces a slightly better median rank, whereas ARI combines the lowest mean rank with the largest number of later events located in the predefined global Top-14 set.
Paired event-level comparisons further distinguish the indicators. ARI assigns a better historical rank than Equivalent WRI for 30 of the 42 events and a better rank than death-sum for 31. Its comparison with event count is closer: ARI gives a better rank for 21 events, an equal rank for 4, and a worse rank for 17. ARI therefore differs most clearly from the WRI-only and cumulative-fatality patterns, while unweighted event count remains its closest direct comparator.
The equal-grid comparison uses an Asia-specific universe consisting of the 74 Asian cells with non-zero ARI during 2013–2023 and the two post-period-only event cells, yielding 76 cells. Under the tie-inclusive Top-10 ARI definition, the selected 10 cells represent 13.16 % of this universe but contain 22 of the 44 later events and 7 of their 22 unique event cells. The resulting event-level and unique-grid observed-to-expected ratios are 3.80 and 2.42, respectively.
Across the nested screening definitions, ARI produces event-level and unique-grid observed-to-expected ratios of 5.53 and 3.45 at Top-5, 3.80 and 2.42 at Top-10, and 2.42 and 1.73 at Top-20. At Top-5, these are the highest ratios among the four indicators under both accounting approaches. At Top-10, ARI retains the highest event-level ratio, whereas event count is slightly higher under unique-grid accounting. At Top-20, event count is slightly higher under both measures. The complete cross-indicator results and actual tie-inclusive set sizes are reported in Table B2.
Overall, the 2024–2025 Asian major events are concentrated above the equal-grid reference in historically high-ARI sets, with the strongest relative concentration in the selective upper-priority tail and increasing competitiveness of unweighted event count as the retained set broadens.
3.3.2 Sensitivity to the fatality threshold
The baseline ARI configuration uses a threshold of ≥50 fatalities (Total Deaths) to select major disaster events (Sect. 2.1). To test the sensitivity of ARI to this choice, alternative thresholds of 40, 60, and 70 fatalities are considered. These values represent local changes of −20 %, +20 %, and +40 %, respectively, relative to the operational baseline. For each threshold, the qualifying event set and ARI values are recalculated, and the resulting patterns are compared through the number of non-zero cells, retention of the baseline Top-14 hotspot set, mean absolute rank displacement, and Spearman rank correlation (Table 5).
Table 5Quantified sensitivity of the principal high-ARI hotspot set to local changes in the fatality threshold.

The event-selection threshold has a measurable effect on the extent of the non-zero ARI surface and on individual grid values and ranks. Lowering the threshold to 40 deaths increases the number of non-zero cells from 153 to 172, whereas thresholds of 60 and 70 deaths reduce the number to 132 and 120, respectively. Nevertheless, 13 of the 14 baseline hotspot cells remain in the alternative Top-14 set under the 40-death configuration, and 12 remain under both more restrictive configurations. The corresponding retention rates are 92.9 %, 85.7 %, and 85.7 %, with mean absolute rank displacements of 2.0–3.4 positions and Spearman correlations of 0.880–0.907. Within the tested local range, the principal hotspot structure remains largely retained, while exact rankings and some membership near the upper-priority boundary vary with the threshold.
3.3.3 Sensitivity to the grid resolution
The ARI computation adopts 5° × 5° latitude–longitude grids as the baseline spatial unit (Sect. 2.4). To evaluate the influence of spatial resolution, additional ARI maps are generated using finer (2.5° × 2.5°) and coarser (10° × 10°) grids. Figure 8 compares the resulting ARI distributions under these alternative resolutions.
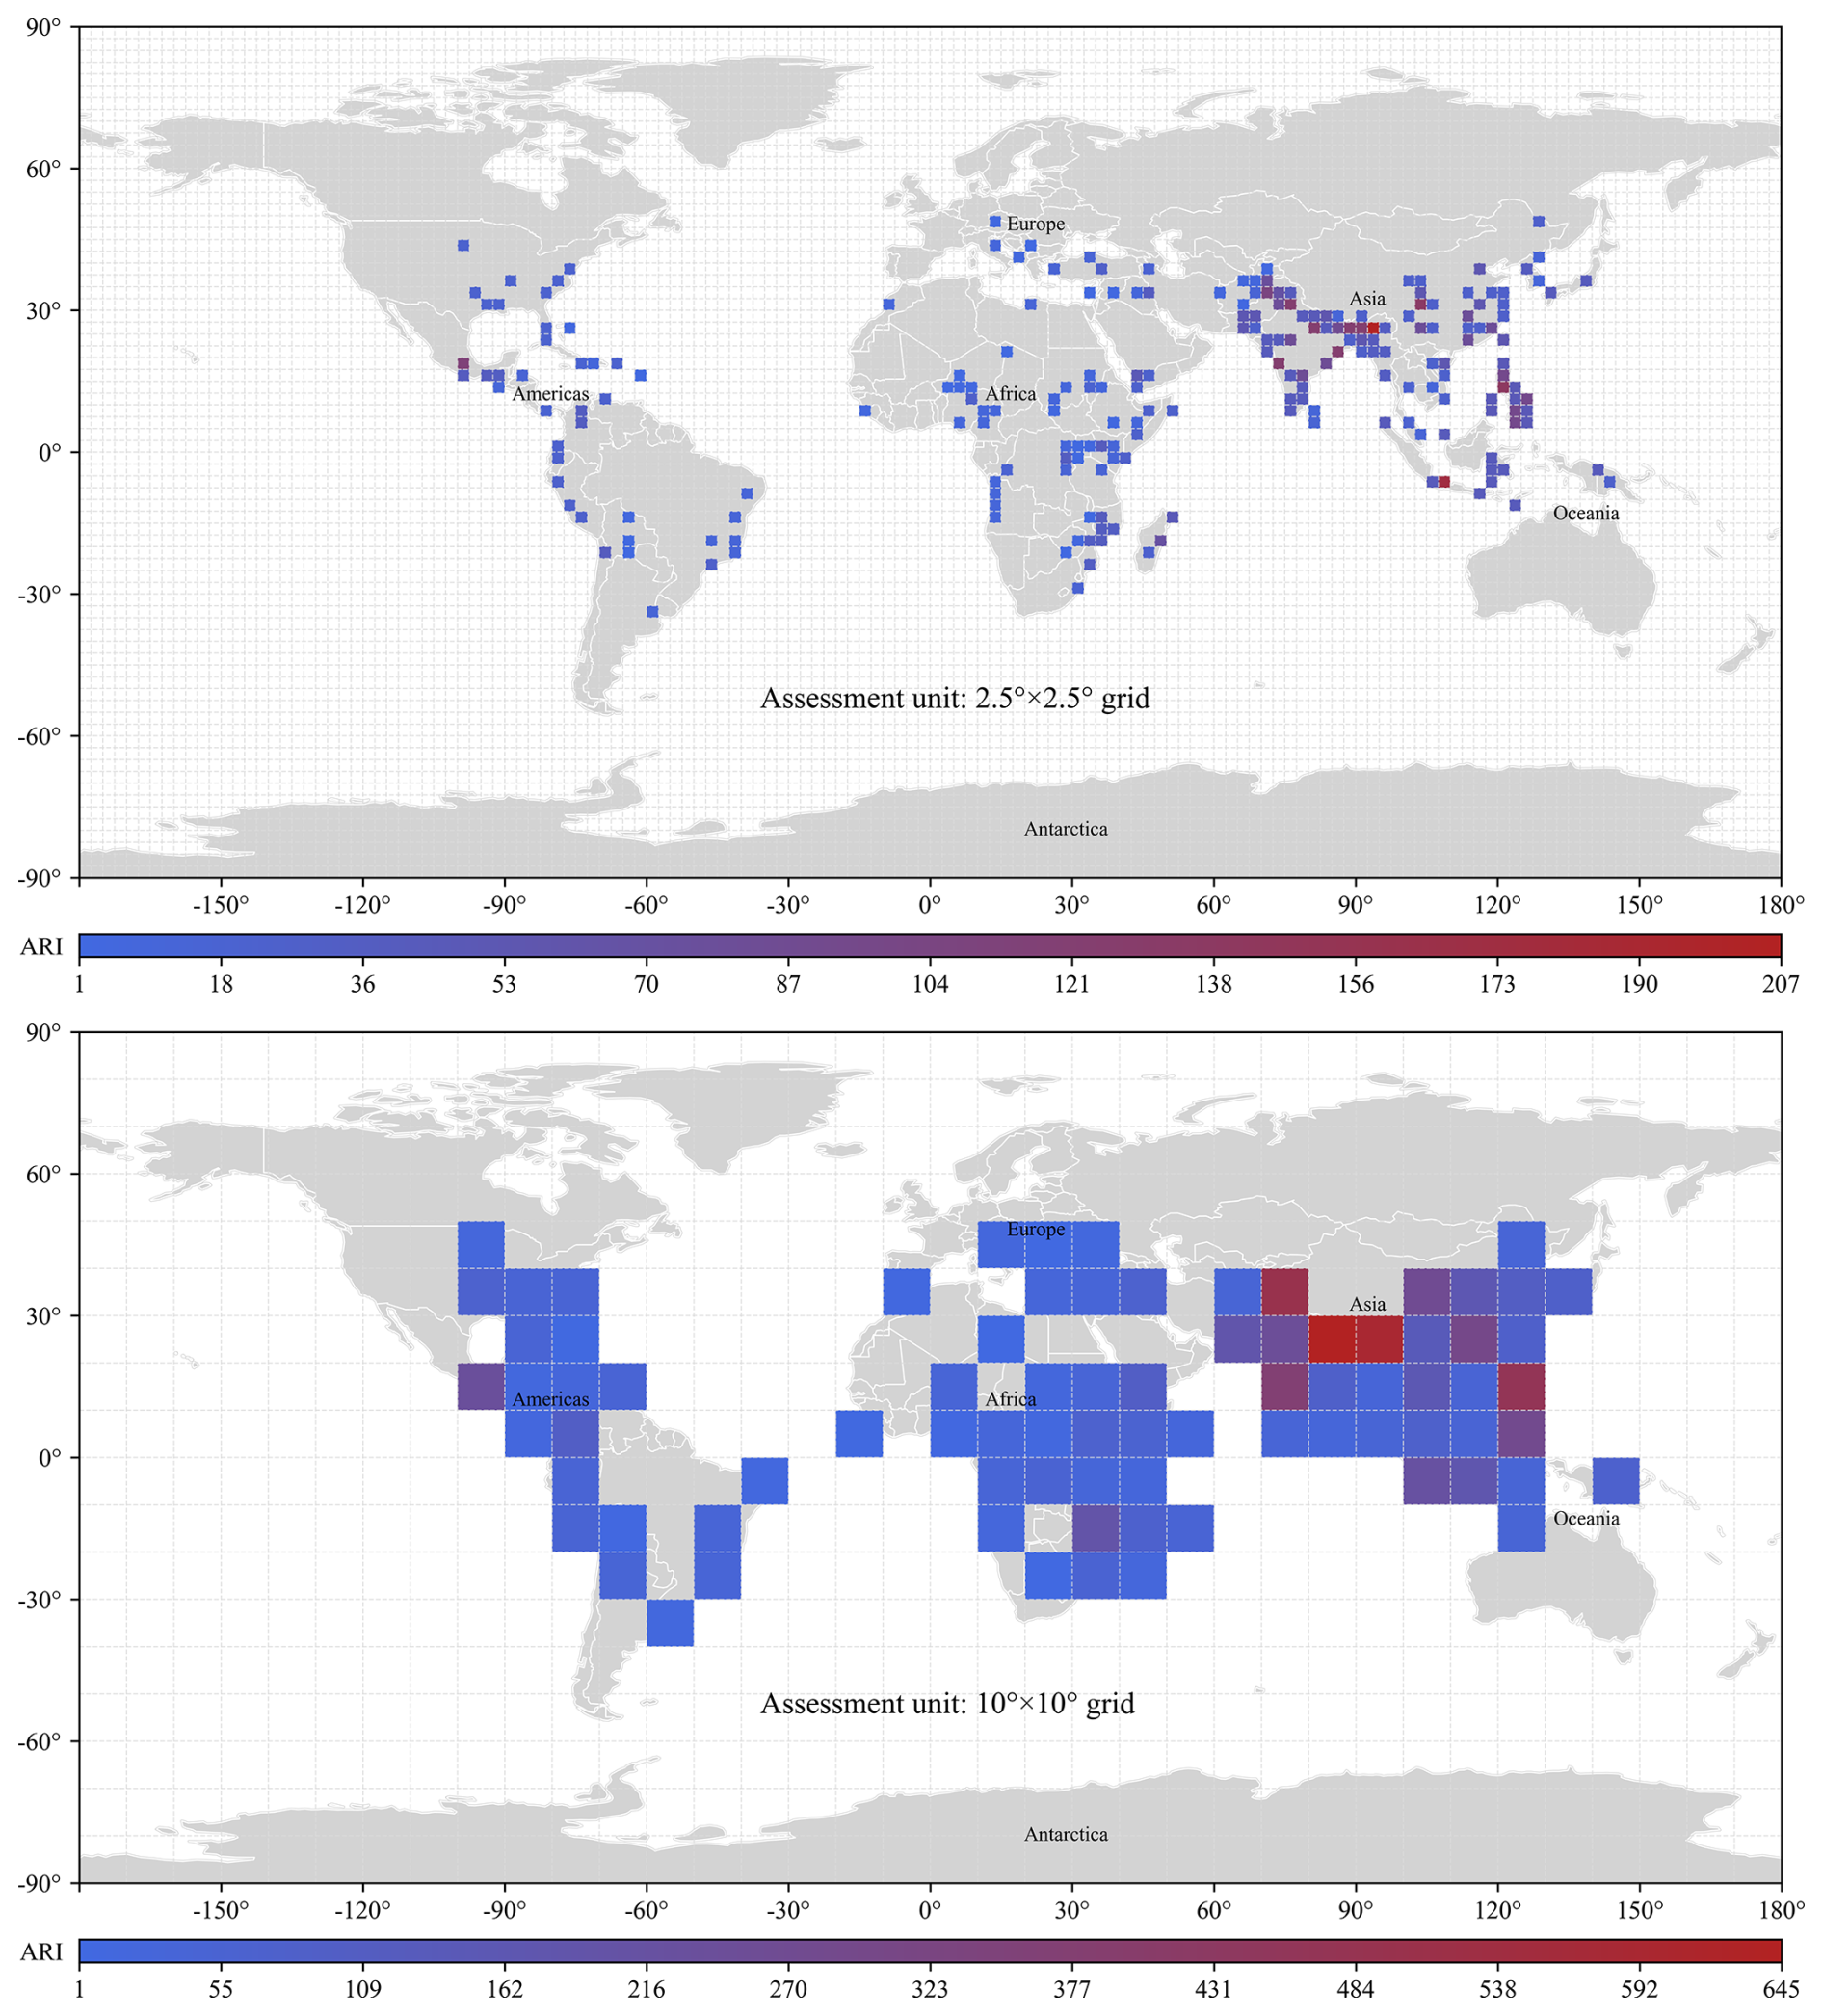
Figure 8Comparison of ARI distributions under the 2.5° × 2.5° and 10° × 10° grid configurations.
Refinement from 5° to 2.5° increases the number of non-zero ARI cells from 153 to 218 and reveals finer spatial variation within the broader hotspot regions. Because the spatial aggregation units and ranking universes differ, cross-resolution comparison focuses on the relative high-value sets and their spatial correspondence. At the nominal Top-14 boundary, tied values result in a tie-inclusive set of 16 high-ARI 2.5° cells.
Of the 14 baseline high-ARI 5° cells, 12 contain at least one high-ARI 2.5° child, producing a child-grid retention ratio of 85.7 %. Viewed in the opposite direction, 14 of the 16 high-ARI 2.5° cells lie within baseline high-ARI 5° parents, producing a parent-grid containment ratio of 87.5 %. The mean proportion of high-ARI children across the 14 baseline hotspot parents is 25.0 %, equivalent on average to one of the four constituent 2.5° cells. This pattern indicates that refinement tends to localize the strongest event-accumulation signal within the broader 5° hotspot cells rather than reproduce their complete areas as uniformly high-value zones.
The 10° map provides a complementary visual representation of spatial coarsening: fewer non-zero cells and smoother regional gradients are obtained, while the broad concentration across South and Southeast Asia remains visible.
3.3.4 Allocation sensitivity for the 2022 Pakistan floods
The 2022 Pakistan floods provide a case for examining how point-based event assignment affects the ARI result for a geographically extensive disaster. The original calculation assigns the complete Pakistan WRI contribution of 26.45 to the representative cell at 25–30° N and 65–70° E. Two diagnostic alternatives are examined: removing the event from the calculation and distributing the same total contribution equally among the nine 5° cells supported by the EM-DAT location description. Under the fractional scenario, each of these cells receives approximately 2.94, conserving the total event contribution across the nine cells. Detailed grid-level results are provided in Table B3.
The original assignment produces a measurable concentration effect in the representative cell. Its ARI value is 185.15, placing it second among the Pakistan-related cells and ninth globally. Removing the event reduces the value to 158.70, with corresponding ranks of third within Pakistan and eleventh globally. Under equal fractional allocation, its ARI becomes 161.64 and it ranks third within Pakistan and tenth globally.
The redistribution changes the relative ordering of this cell and the neighbouring Pakistan-related cell originally ranked tenth globally: the two exchange the ninth and tenth global positions. Several lower-ranked cells also receive small contributions and change rank. The highest-ranked Pakistan-related cell nevertheless remains first nationally and third globally under all three configurations.
Most importantly, the Pakistan Top-5 set remains unchanged, as do the global Top-5, Top-10, Top-14, and Top-20 sets. The original point assignment therefore increases the ARI value of an already high-ranking location but does not create a principal hotspot that disappears when the same event contribution is redistributed across the nine supported cells. For this case, the allocation assumption affects individual values and positions without reorganizing the principal national or global priority sets.
The ARI results presented in Sect. 3.2 identify 14 high-ARI latitude–longitude hotspot grids in which mortality-screened major-event contributions accumulated most strongly during 2013–2023 under the associated country-level WRI contexts. These grids provide spatial focal points for finer-scale risk assessment and management, for which remote sensing is widely used to map exposed assets and post-disaster damage.
High-resolution remote sensing data, particularly sub-metre visible-spectrum imagery, remain costly and unevenly available, especially in developing countries. Existing open-data resources often focus on large cities or specific crisis events and vary in image type, size, and other attributes, complicating their integration and application. These constraints motivate a targeted effort to compile standardized imagery within the ARI-identified priority regions.
In this study, ARI defines the macro-scale hotspot set within which imagery is searched and data gaps are assessed. Remote sensing data are then compiled and supplemented within these locations to form the 3H Dataset, which is organized at the hotspot-grid level as a standardized resource for subsequent finer-scale Earth observation and machine-learning studies. Accordingly, ARI determines the spatial inclusion framework, while imagery compilation constitutes the subsequent data-development stage.
4.1 Data sources and spatial coverage
Based on the 14 high-ARI hotspot grids identified in Sect. 3.2, a review of existing open-data remote sensing resources was conducted to identify sub-metre visible-spectrum imagery available within these grids. Figure 9 shows the spatial distribution of the available imagery sources associated with the ARI hotspots. Two primary data sources were used: (1) the RAMP Building Footprint Training Dataset, developed under the WHO-supported DevGlobal initiative (https://rampml.global, last access: 5 October 2026); and (2) the DigitalGlobe Open Data Program, launched by DigitalGlobe/Maxar (https://www.maxar.com/open-data, last access: 5 October 2026).
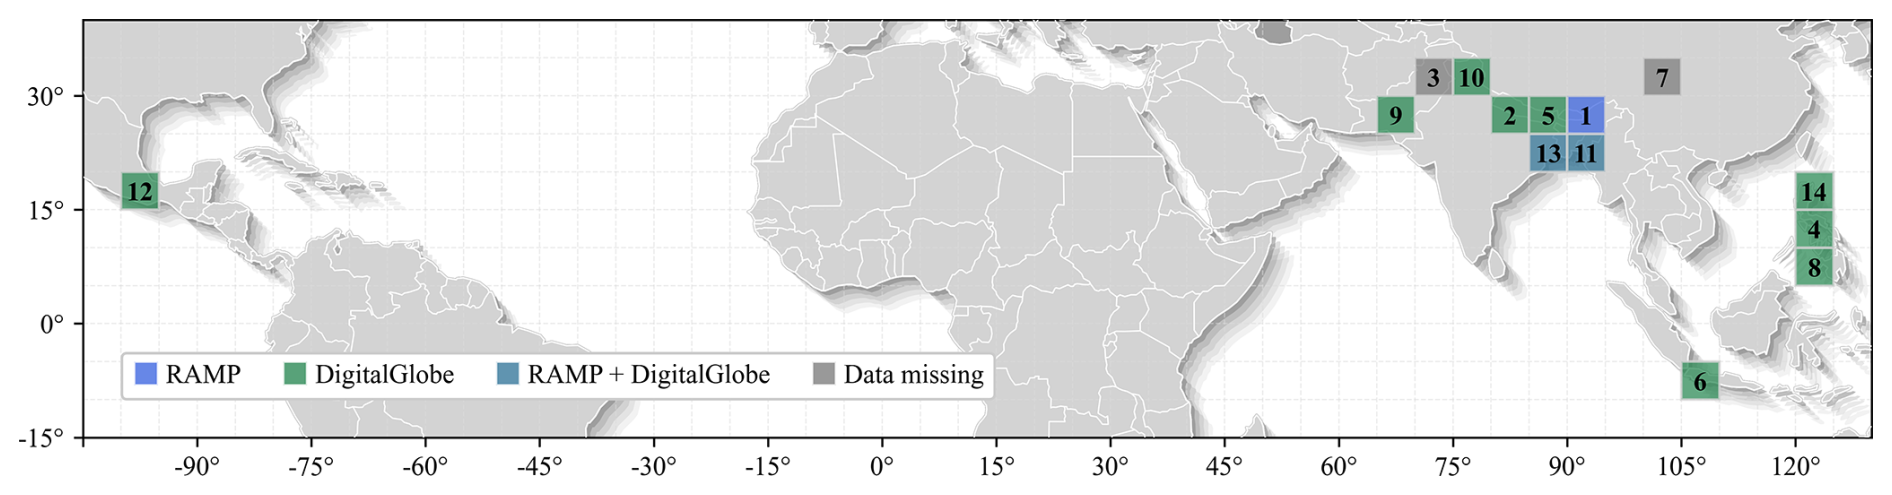
Figure 9Spatial distribution of source imagery identified within the 14 high-ARI hotspot grids.
Using these sources, sub-metre visible-spectrum images were compiled for selected areas within the 14 high-ARI hotspot grids, as summarized in Table A2 in Appendix A. Most grids are covered by one or several DigitalGlobe/Maxar crisis datasets, while some, especially those in Bangladesh, include multiple RAMP tiles covering urban and peri-urban areas. The spatial coverage reflects both the concentration of ARI hotspots mainly in South Asia, Southeast Asia, and the Himalayan belt and the geographically uneven availability of open high-resolution imagery. Consequently, coverage is targeted and heterogeneous within and among the hotspot grids.
The primary satellite observations were produced by RAMP and DigitalGlobe/Maxar. The present study contributes their ARI-guided spatial selection, integration, gap supplementation, quality screening, tiling, common formatting, and source- and grid-level organization.
4.2 Targeted supplementation in data-scarce hotspot grids
Although RAMP and DigitalGlobe/Maxar provide imagery for most hotspot grids, two high-ARI hotspot grids (Grids 3 and 7 in Table A2) lack suitable imagery from these selected open-data resources. To address these gaps, additional visible-spectrum satellite images were acquired and processed specifically for these grids. For each of the two grids, imagery covering a rectangular area of approximately 50 km2 was obtained, resulting in 100 km2 of supplementary data in total. Grids 3 and 7 both extend from 30° to 35° N and span 5° of longitude. Based on a spherical surface-area approximation, each grid covers approximately 260 600 km2. Each approximately 50 km2 acquisition therefore represents about 0.019 % of the corresponding grid area and provides localized imagery gap filling within that grid.
The centre of each acquisition area was selected according to the representative location of the qualifying event reporting the highest number of fatalities within the corresponding hotspot grid. This event-centred rule was applied to the two supplementary acquisitions. The supplementary images were selected to match, as closely as possible, the spatial resolution and spectral characteristics of the existing source imagery and were processed through the same standardization workflow as the RAMP and DigitalGlobe/Maxar materials.
4.3 Standardization and construction of the 3H Dataset
To create a coherent and user-friendly dataset, all imagery from RAMP, DigitalGlobe/Maxar, and the supplementary acquisitions was subjected to a common standardization workflow. The overall process can be summarized as follows: (1) ARI-guided hotspot selection; (2) source imagery collection within the selected grids; (3) visual quality screening of candidate scenes; (4) spatial standardization and tiling; and (5) metadata assignment and final dataset organization.
First, candidate scenes were manually inspected, and imagery with severe artefacts, substantial cloud, cloud-shadow, or haze contamination that prevented reliable interpretation of built-up targets was removed. Scenes with little or no meaningful built-up content were also excluded because they were poorly aligned with the intended downstream applications of the dataset. Second, the retained scenes were spatially standardized and tiled into fixed-size patches of 256×256 pixels. Third, all tiles were stored in TIF format and annotated with the corresponding hotspot-grid identifier and data source, preserving traceability to their source imagery and ARI-identified grid locations. This workflow was applied consistently across the 14 high-ARI hotspot grids.
The final standardized dataset contains 7 583 094 TIF image tiles, each of size 256×256 pixels, with spatial resolutions ranging from 0.27 to 0.54 m. The complete compilation contains imagery from selected locations in 14 ARI-identified hotspot grids distributed across ten developing countries. The imagery provides heterogeneous and spatially partial coverage across the 14 grid cells. Figure 10 provides representative examples of the imagery, illustrating the diversity of urban forms, building densities, and environmental contexts captured by the dataset.
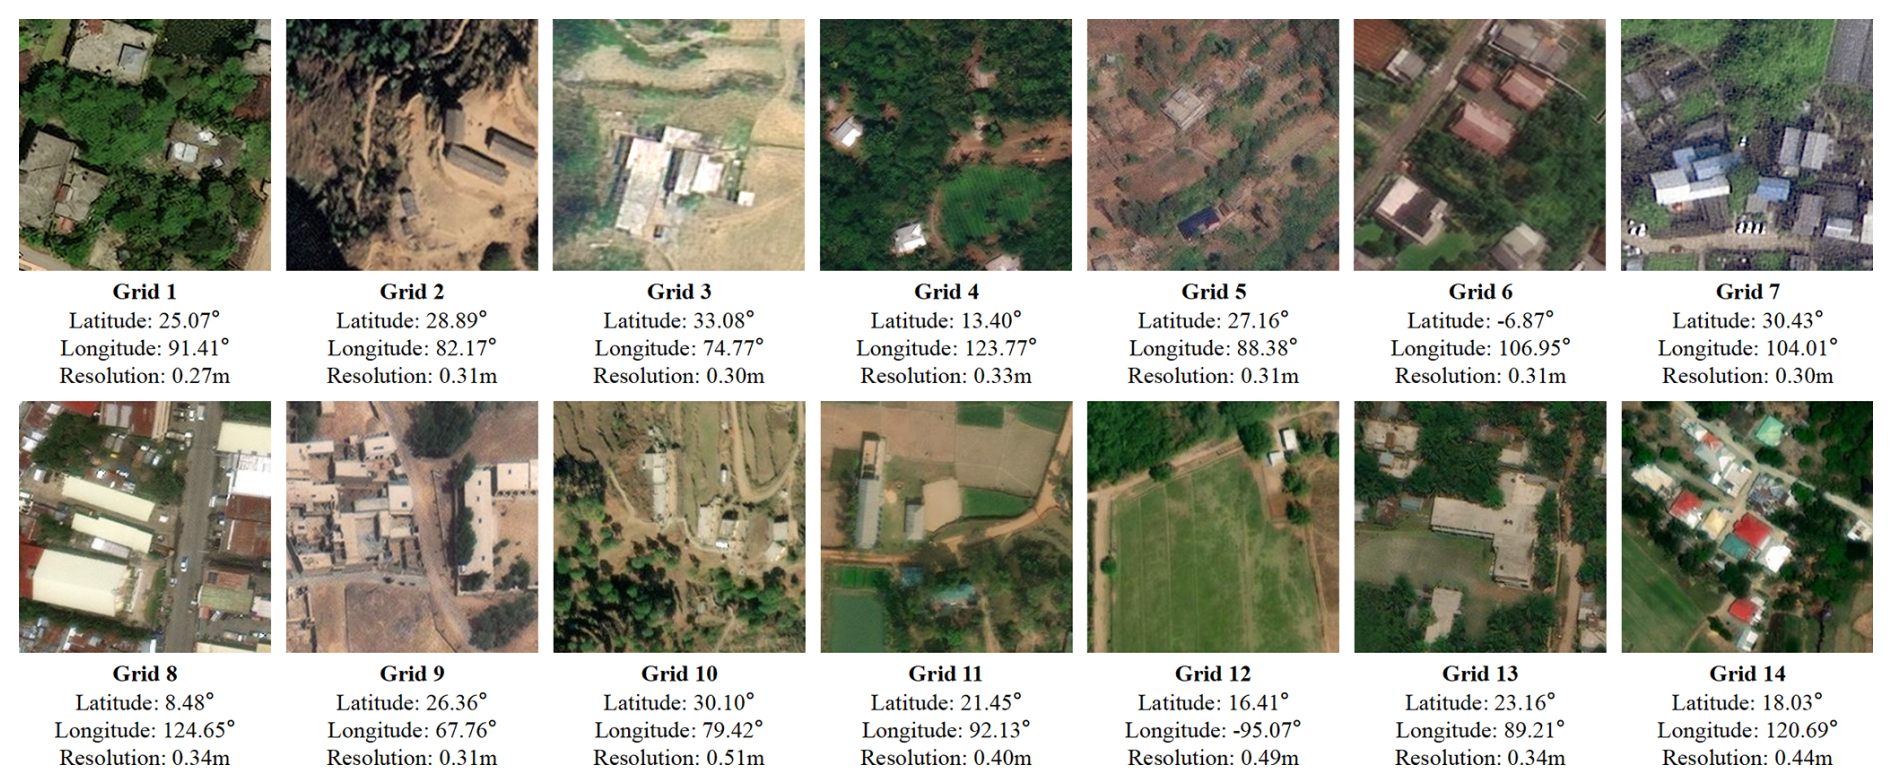
Figure 10Representative standardized image tiles from the 14 high-ARI hotspot grids included in the 3H Dataset. Most primary observations originate from RAMP and DigitalGlobe/Maxar, while supplementary imagery was acquired for Grids 3 and 7. Grid identifiers, geographic coordinates, and spatial resolutions are provided for the displayed examples.
The final data compilation for each high-ARI hotspot grid is summarized in Table A3 in Appendix A. This standardized compilation is referred to as the “3H Dataset”, denoting high-resolution imagery assembled for high-ARI hotspots. By providing standardized imagery from selected locations within these grids, the dataset supports future finer-scale studies such as building damage detection, exposure mapping, and post-disaster recovery monitoring.
The principal contribution of ARI is to provide a spatially explicit complement to country-level structural risk indices. WRI characterizes national exposure and vulnerability conditions, whereas ARI highlights where mortality-screened major disaster events accumulated during 2013–2023 under those broader risk contexts. The diagnostic comparisons show that both event recurrence and WRI contextualization shape the ARI pattern. Unweighted major-event count remains a strong comparator, particularly as the screening set broadens, but WRI weighting changes the ordering and composition of the most selective upper-priority grids. It also reduces the extensive ties associated with country-level WRI values and integer-valued event counts, thereby supporting more differentiated prioritization when only a limited number of regions can be selected for further assessment.
The 2024–2025 Asian comparison provides temporally separated evidence for this screening function. Later major events were concentrated in historically high-ARI sets at rates above the equal-grid reference, with the clearest comparative advantage appearing in the selective upper tail. As the retained set broadened, unweighted event count became increasingly competitive, indicating that the added influence of WRI contextualization is most evident when prioritization is highly selective. The sensitivity analyses further show that the broad hotspot geography persists across the tested fatality thresholds, grid resolutions, and Pakistan flood-allocation scenarios. At the same time, changes in exact ranks and boundary membership confirm that ARI values remain dependent on event selection and spatial processing. Grid refinement primarily localizes the strongest signal within broader hotspot regions, while the Pakistan case illustrates how point allocation can affect local values without necessarily reorganizing the principal priority sets.
Several methodological choices define the interpretation of these results. Mortality-based screening provides a comparatively consistent global event-selection variable but emphasizes sudden-onset, high-fatality disasters and underrepresents events dominated by economic losses, indirect impacts, prolonged disruption, or slow-onset processes. Assigning one source-constrained event-location anchor to each event enables uniform global grid aggregation, but compresses the spatial extent of geographically extensive hazards and retains some coordinate-level judgement for text-based records. The use of country-level WRI supplies a common exposure–vulnerability context, although it cannot represent within-country variation or rapidly changing local conditions. Finally, the equal temporal treatment of all qualifying events makes ARI a static retrospective representation of event accumulation. These limitations primarily affect the interpretation of exact values and ranking boundaries rather than the indicator's intended role as a macro-scale screening tool.
The ARI-guided 3H Dataset extends this screening framework into a finer-scale observational resource. ARI defines the 14-grid spatial inclusion framework, while the dataset assembles standardized high-resolution imagery from selected locations within those priority regions. Coverage remains heterogeneous because both open-data availability and supplementary acquisition are spatially uneven. The dataset is therefore most appropriate for localized Earth observation and model-development tasks, including built-environment mapping, exposure characterization, damage detection, and recovery monitoring. Its practical value lies in improving the accessibility and technical consistency of high-resolution observations in regions identified through a transparent global prioritization process.
Future research can develop the framework in three main directions. First, dynamic or temporally weighted formulations could incorporate event recency, recovery periods, and evolving vulnerability. Second, footprint-aware allocation and multidimensional severity measures could better represent geographically extensive events and impacts beyond mortality. Third, the integration of projected hazard changes, socio-economic scenarios, and Earth-observation-derived variables could connect retrospective event accumulation with forward-looking assessment and finer-scale machine-learning applications.
This study develops the ARI as a retrospective, grid-based framework for identifying where mortality-screened major disaster events accumulated during 2013–2023 under different country-level WRI contexts. ARI sums the WRI values associated with qualifying events assigned to each 5° × 5° grid cell. The baseline analysis identifies 153 cells with non-zero ARI values and defines 14 principal hotspot cells, concentrated mainly across South and Southeast Asia and along the Himalayan belt. Diagnostic comparisons show that ARI reflects both historical event recurrence and country-level WRI context while producing an upper-priority pattern distinct from those derived from Equivalent WRI, unweighted major-event count, or cumulative reported fatalities alone. The 2024–2025 Asian comparison provides temporally separated evidence for this hotspot-screening function, with later major events concentrated in historically high-ARI sets at rates above the equal-grid reference, particularly in the selective upper-priority tail. Unweighted event count nevertheless remains a strong comparator as the retained priority set broadens. The sensitivity analyses indicate that the principal hotspot geography is largely retained across the tested fatality thresholds, grid resolutions, and alternative allocation of the 2022 Pakistan flood contribution. Exact ARI values, rankings, and membership near the selection boundary remain dependent on event-selection and spatial-processing choices, but the broader priority pattern shows substantial geographical correspondence across the examined configurations.
Building on the 14 ARI-identified hotspot cells, the study also presents the 3H Dataset, comprising 7 583 094 standardized sub-metre image tiles from selected locations across ten developing countries. ARI provides the macro-scale spatial prioritization framework, while the imagery compilation supports subsequent finer-scale studies of buildings, exposure, disaster-related change, damage, and recovery. Together, these components connect recent major-event accumulation, country-level structural risk context, and high-resolution Earth observation resources within a common priority-region framework.

Table A2Source imagery and supplementary acquisitions associated with the 14 high-ARI hotspot grids.
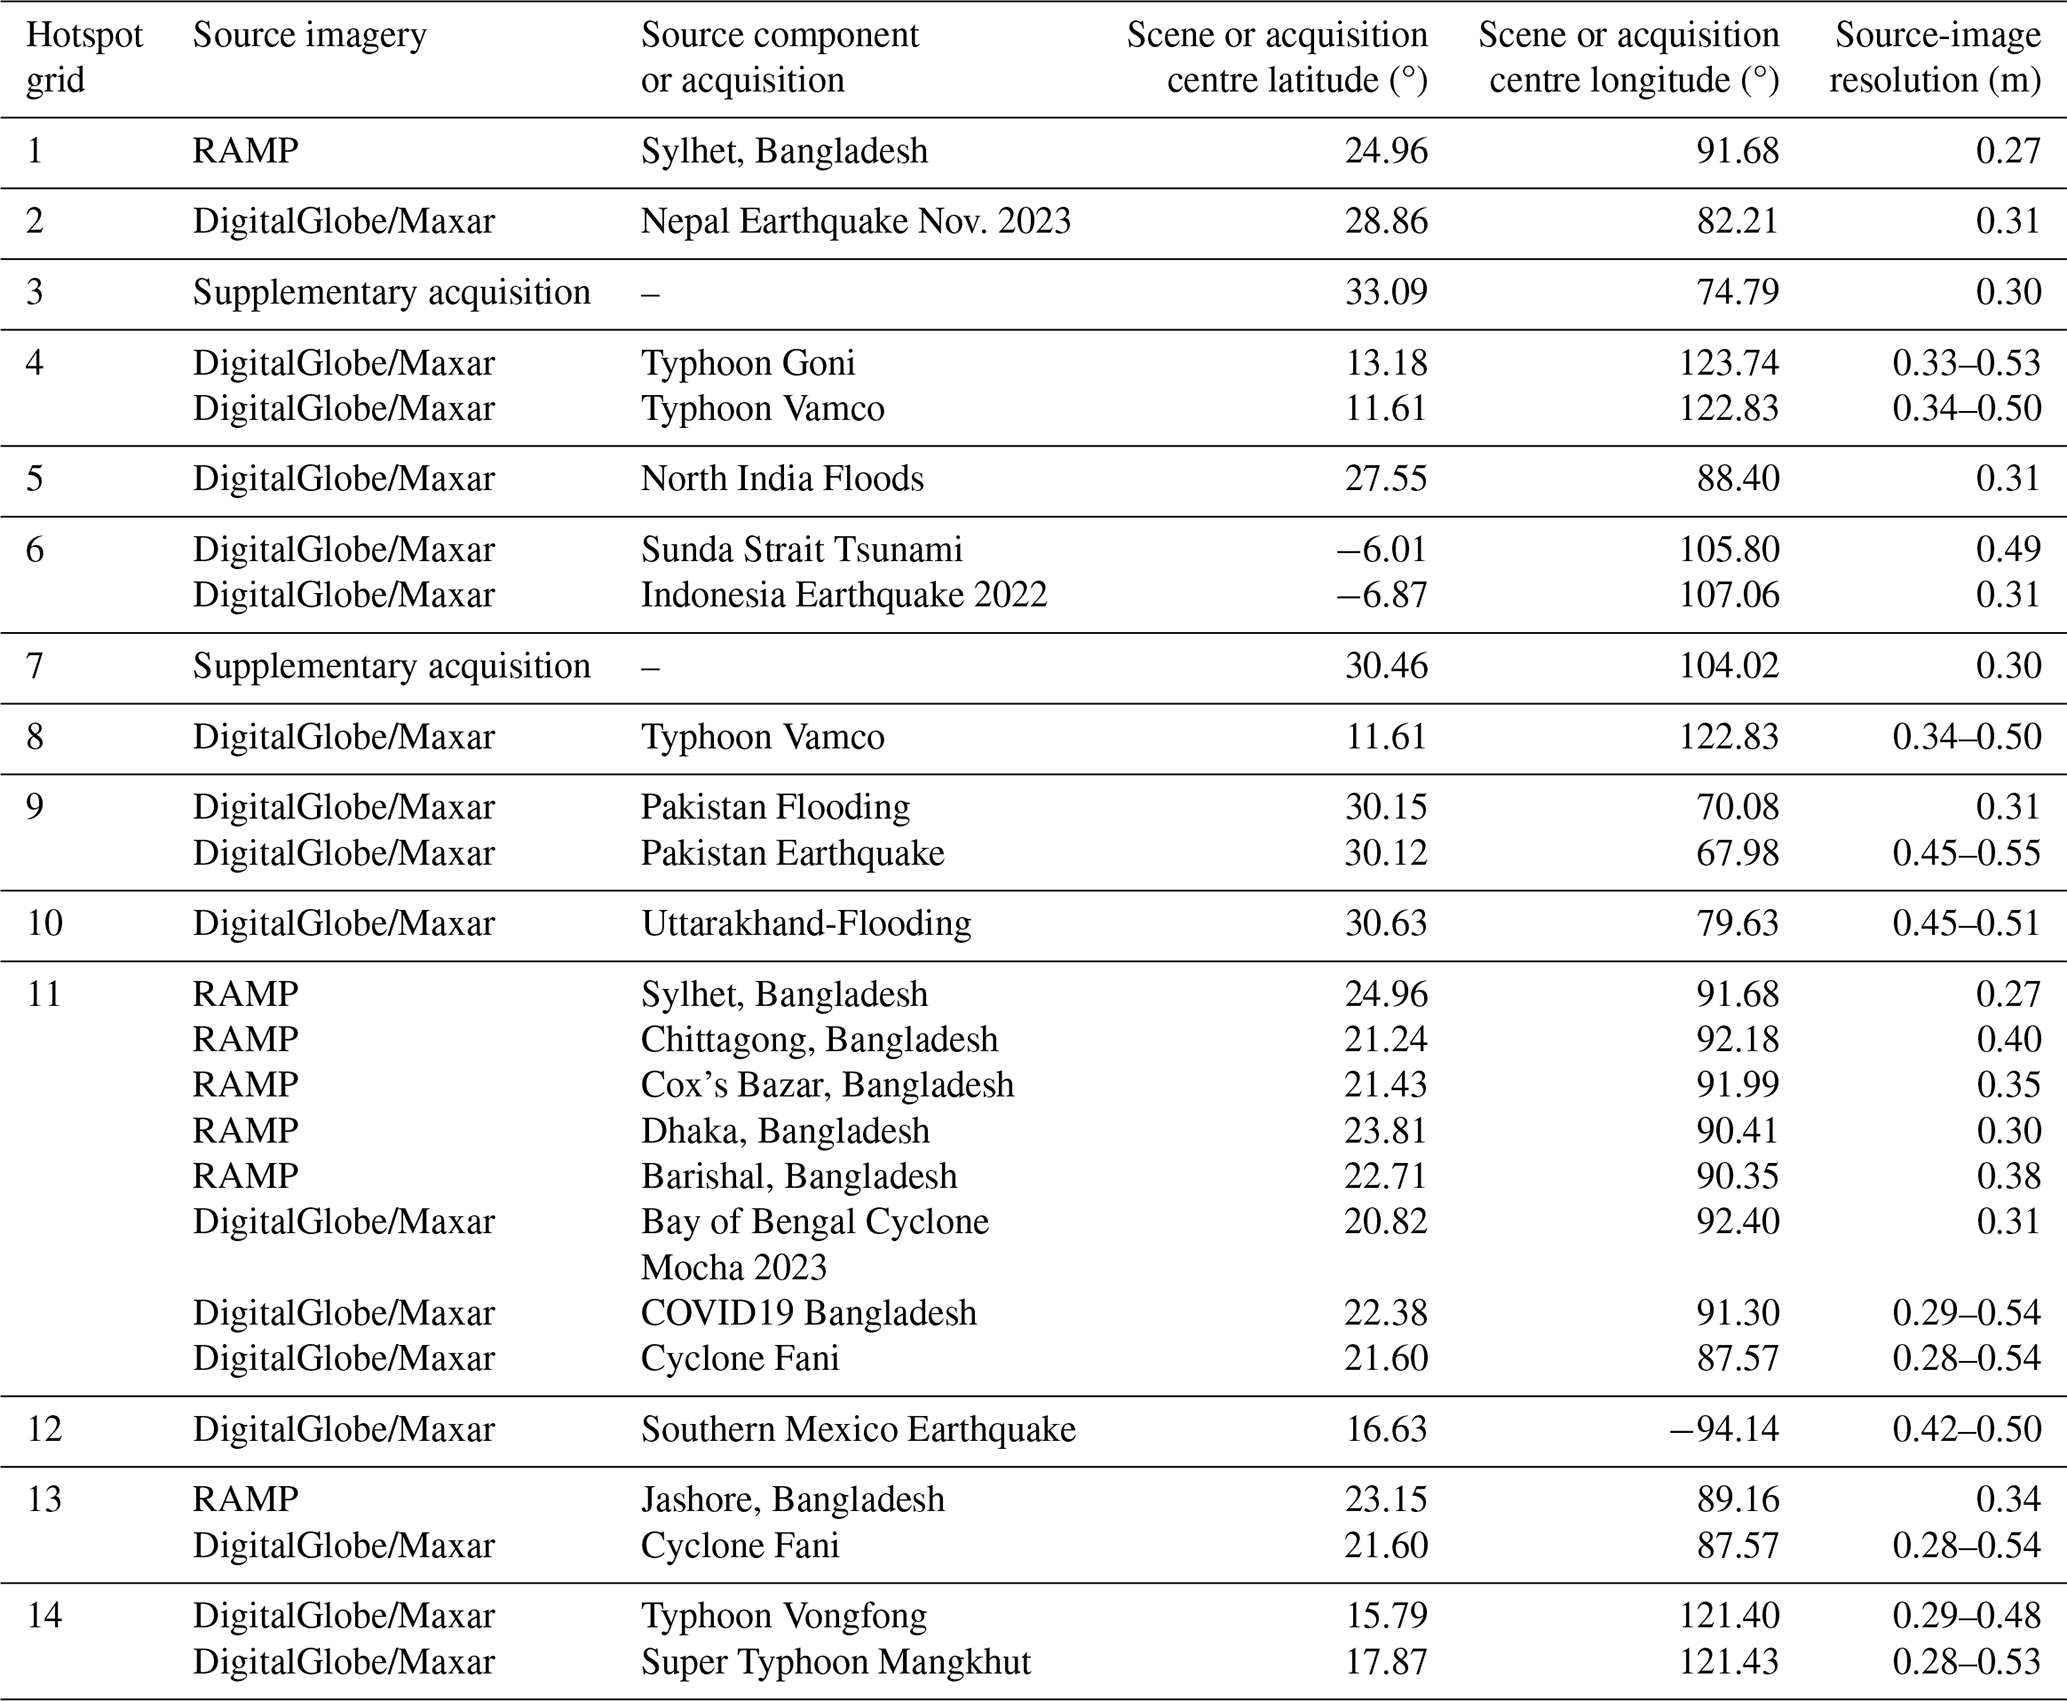
Table A3Summary of standardized imagery tiles for the 14 high-ARI hotspot grids.
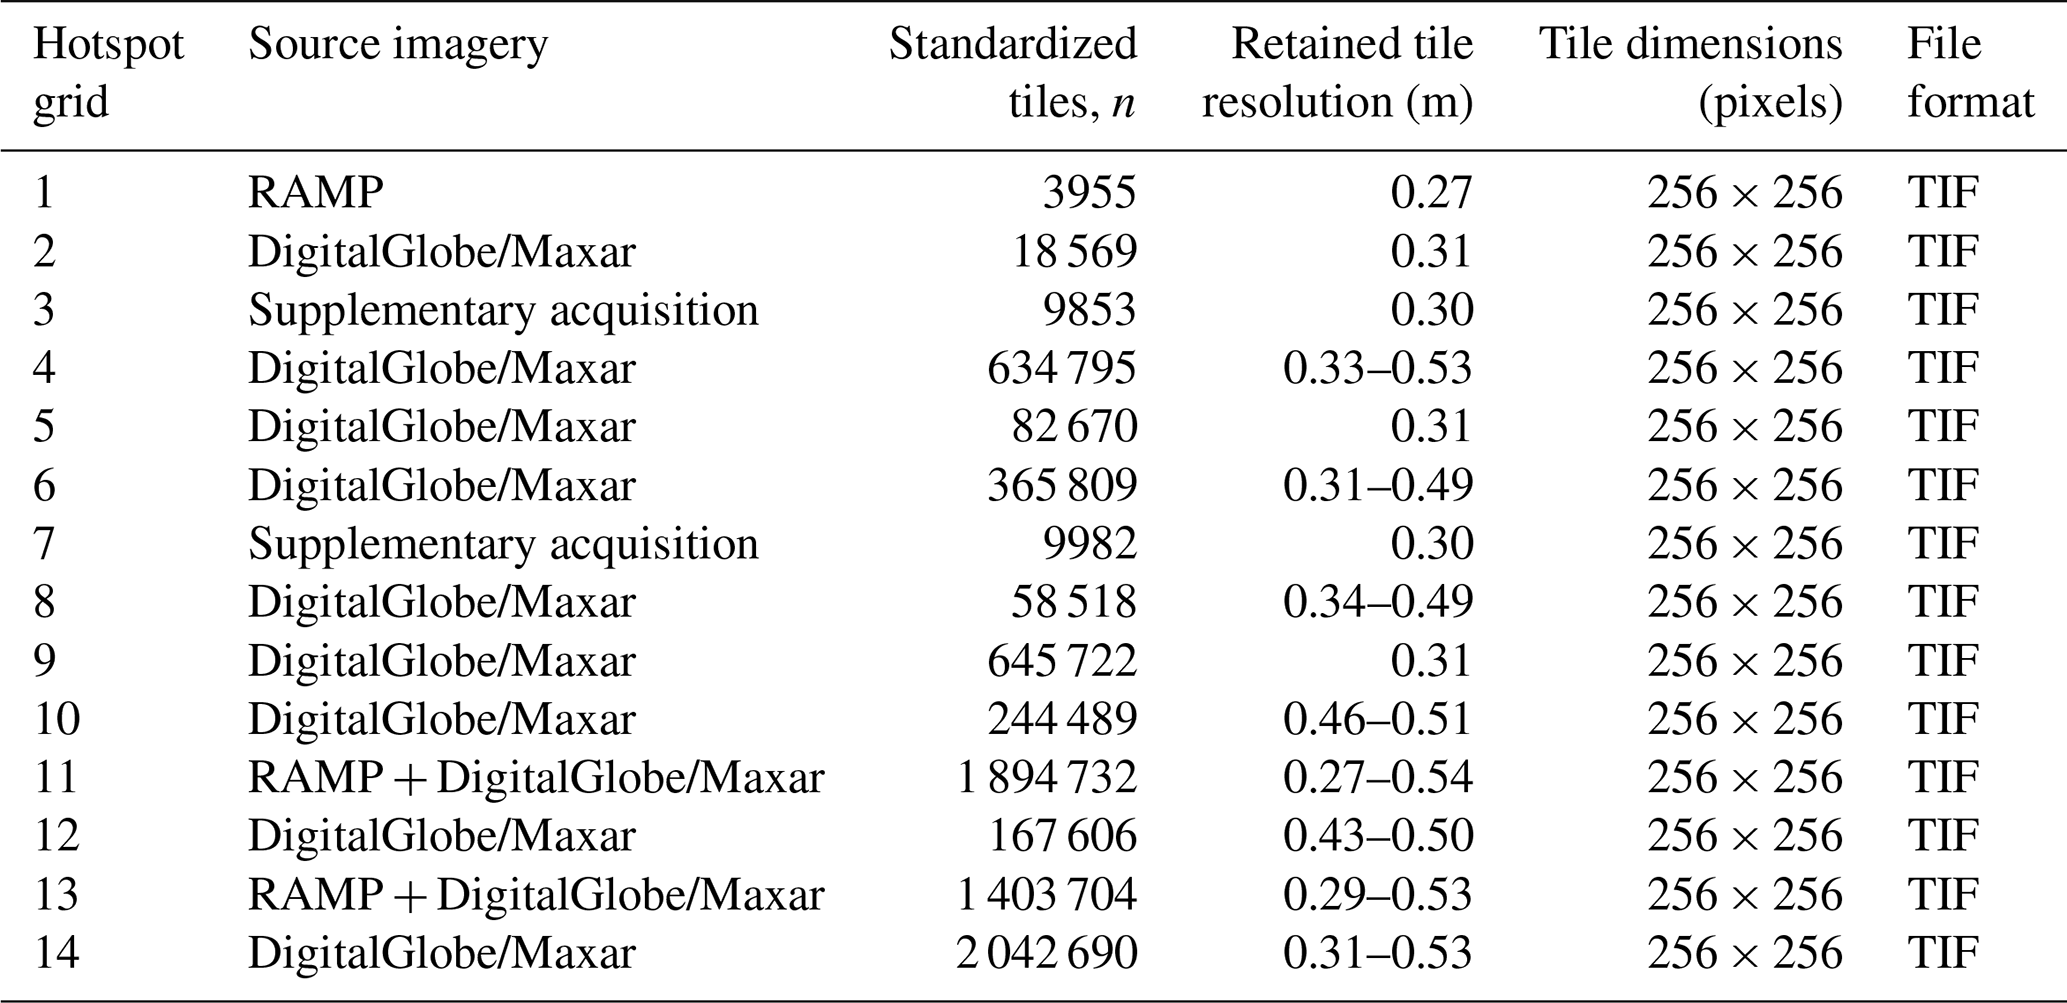
Table B1Global baseline grid ranks of the 2024–2025 Asian major disaster events under ARI and the three reference indicators.
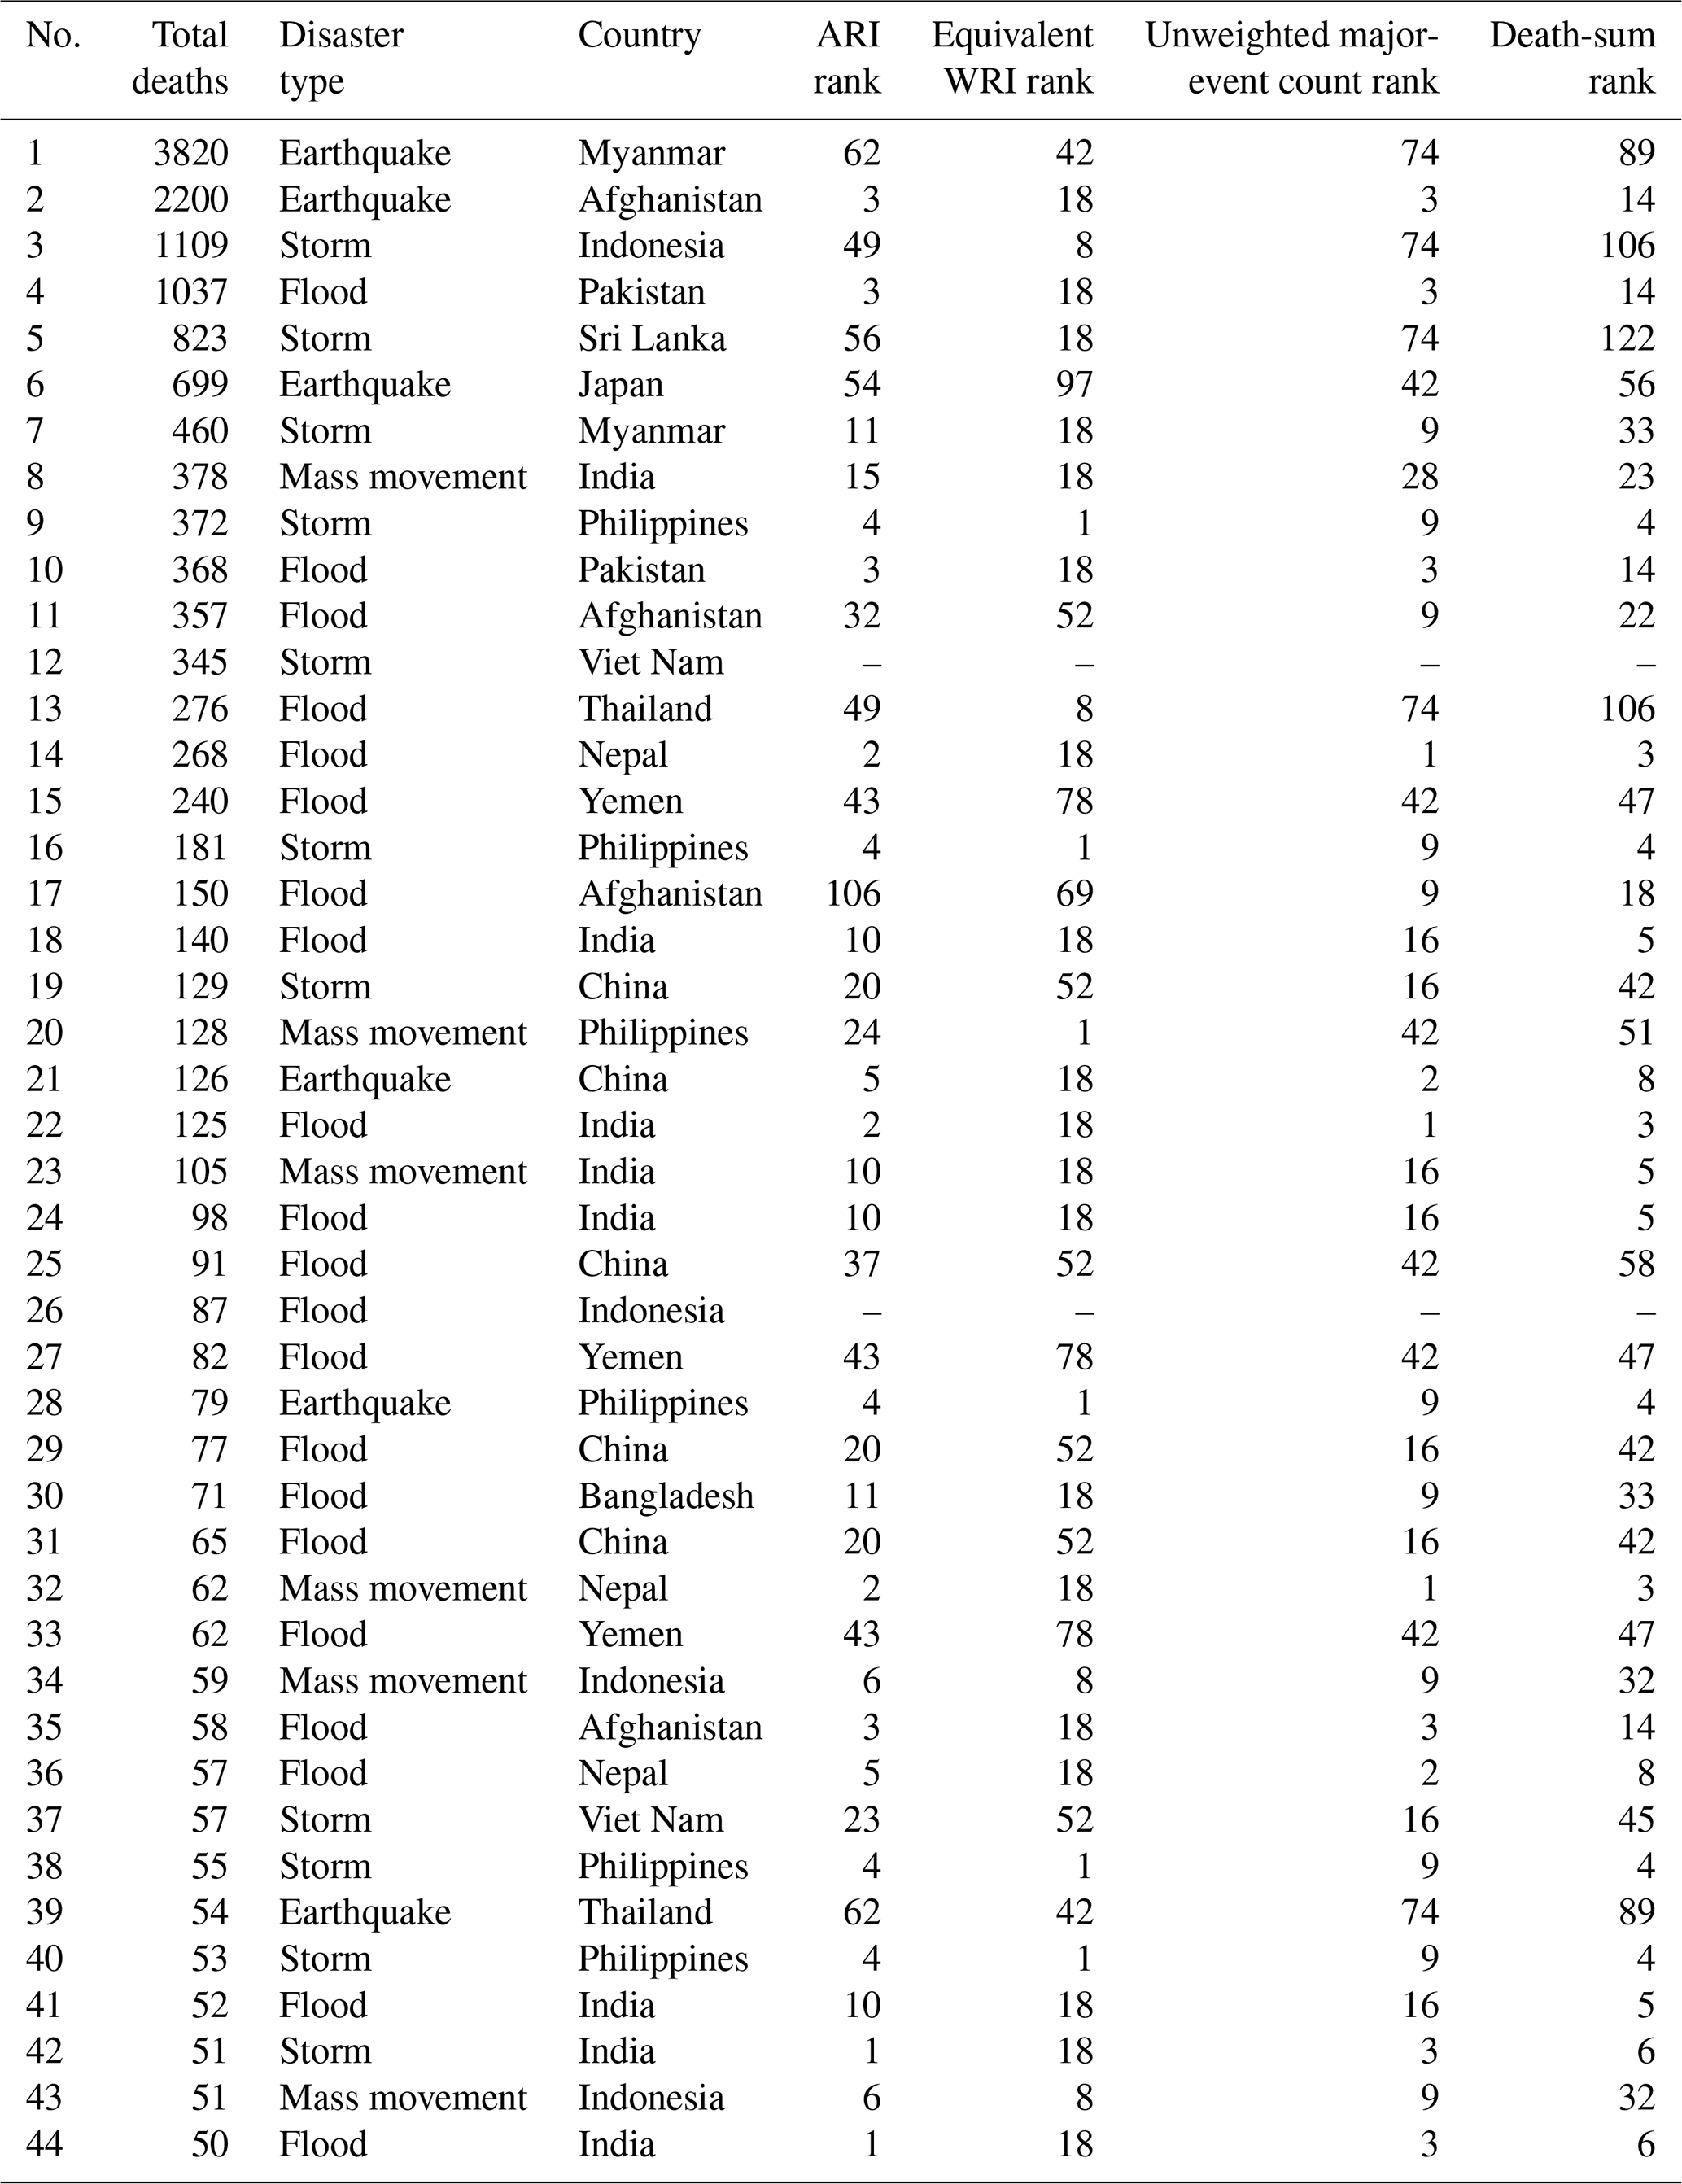
Note: The en dash (–) identifies an event located in a post-period-only cell outside that universe and therefore indicates the absence of a comparable prior grid rank; it does not indicate missing event information or the absence of an underlying country-level WRI value.
Table B2Post-period consistency and benchmark comparison for the 2024–2025 Asian major disaster events.
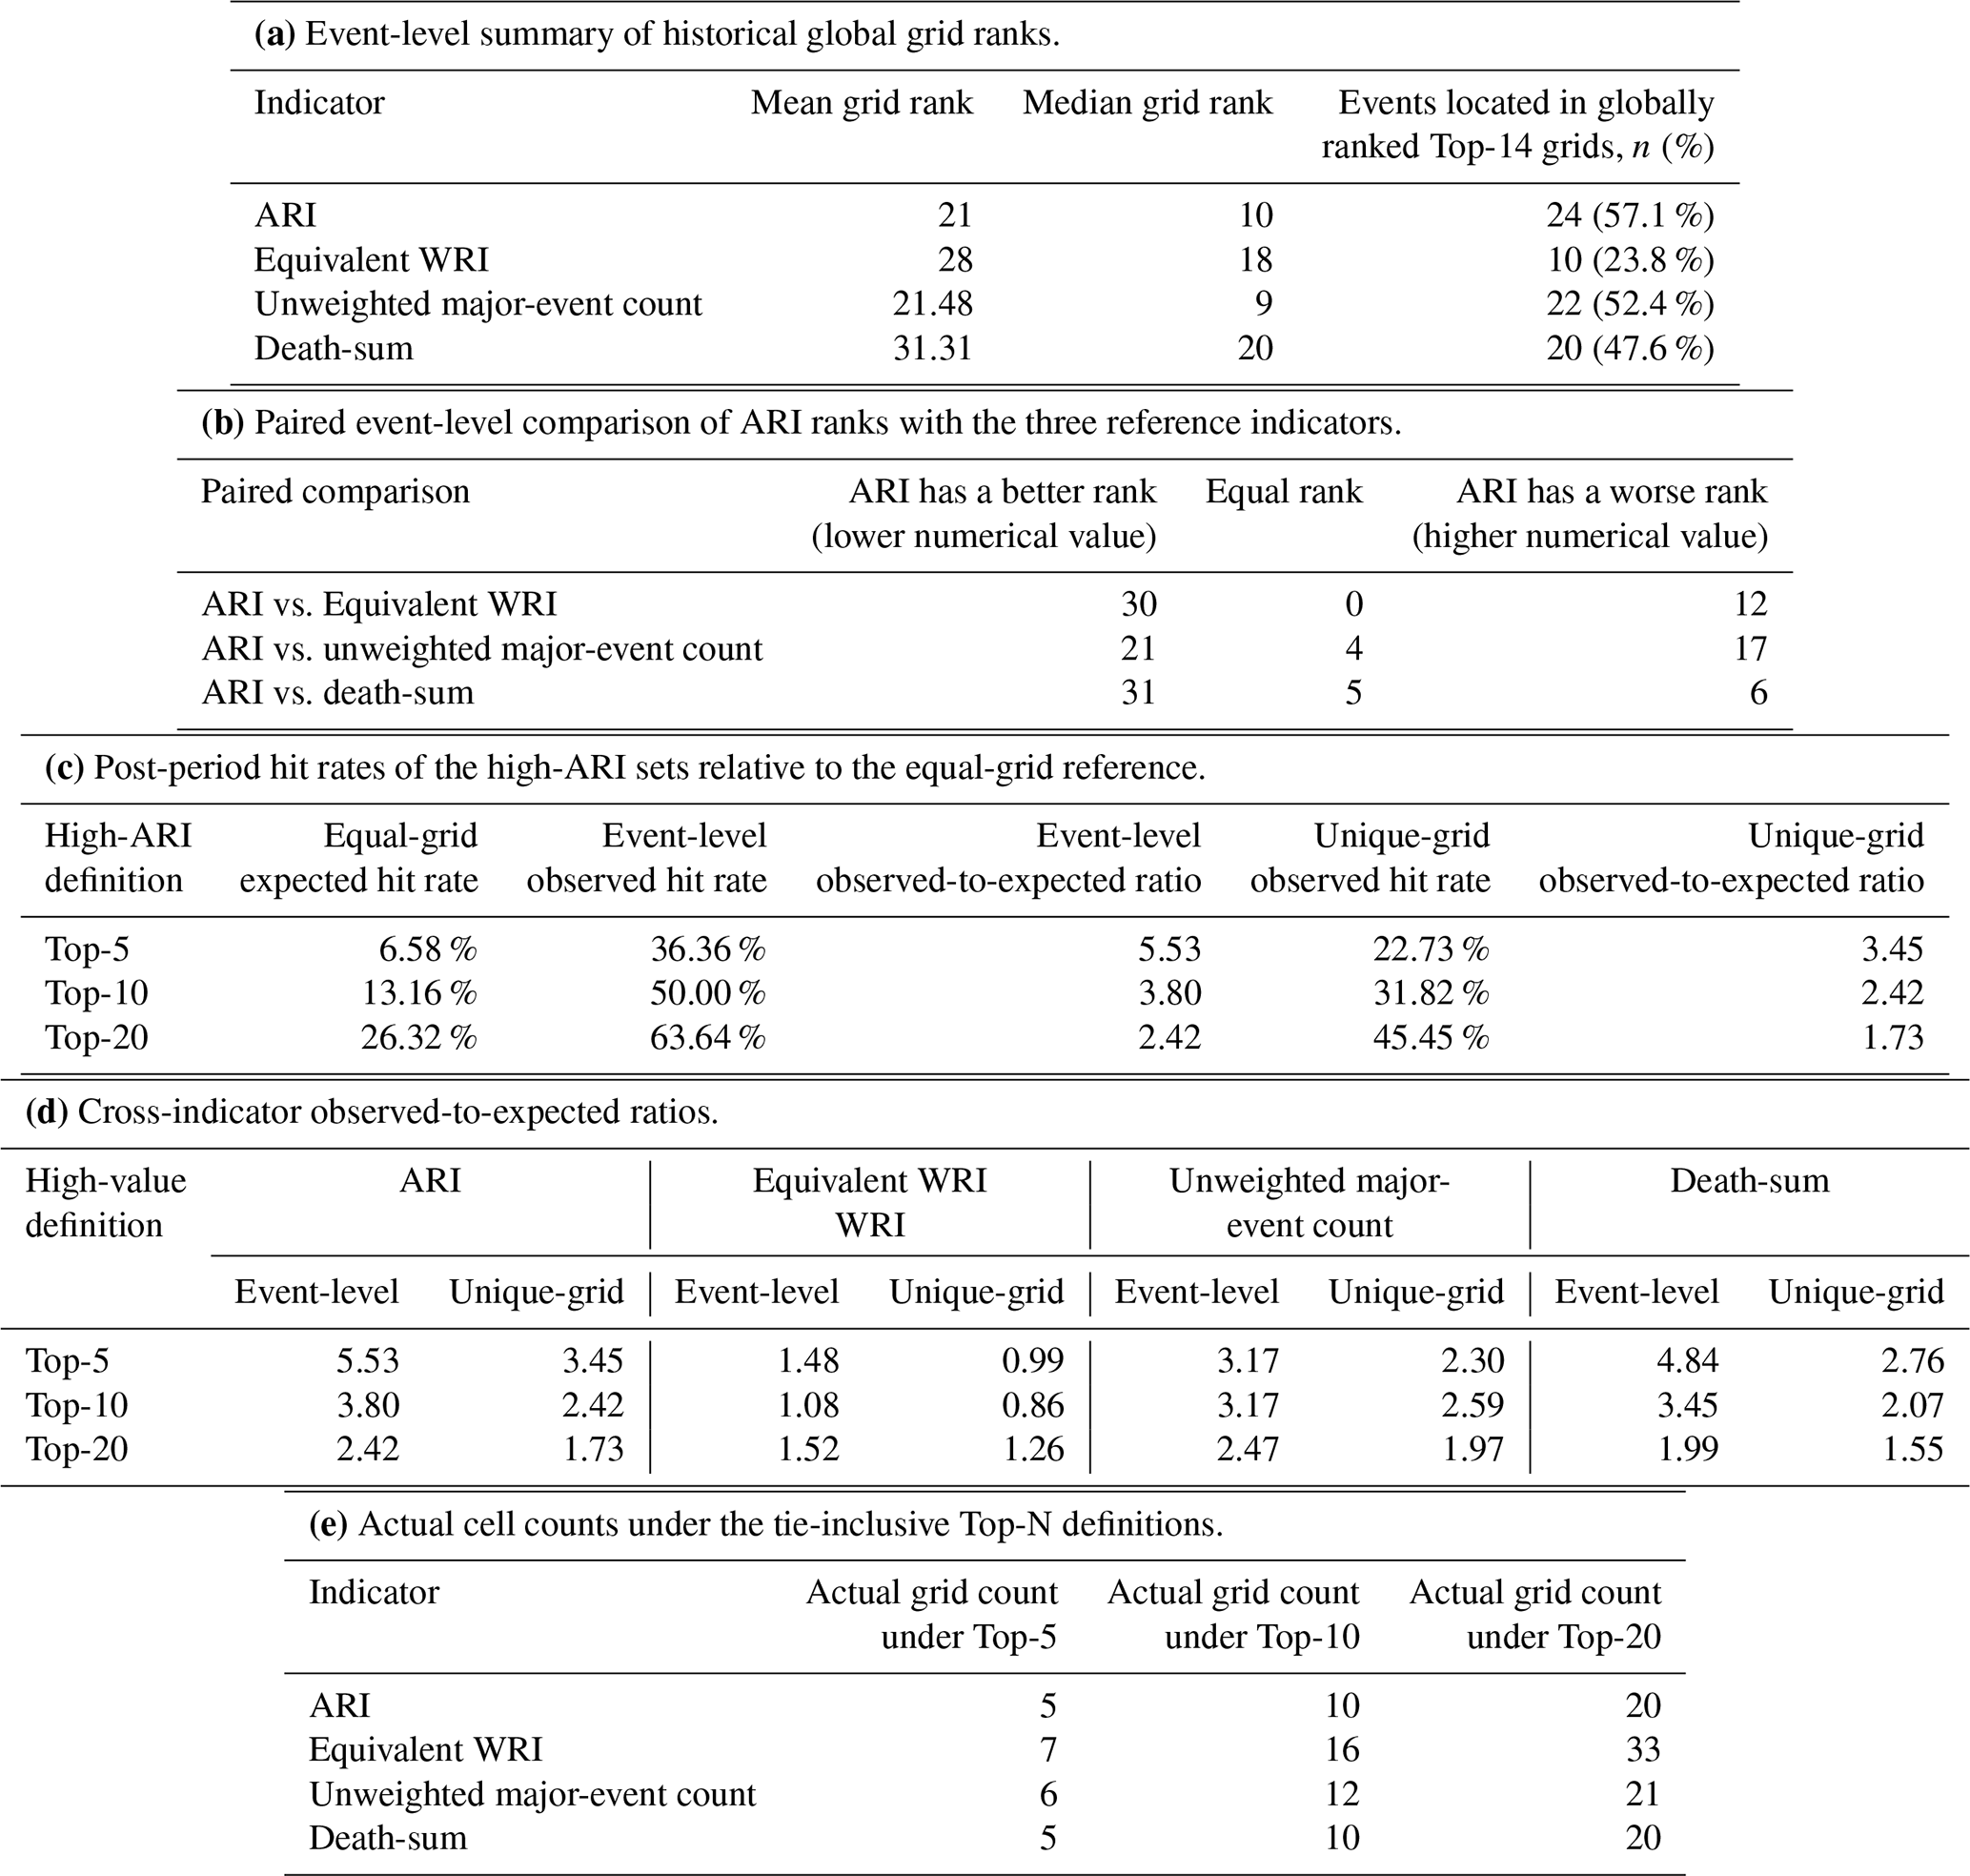
Note: Expected rates were calculated separately for each indicator using its actual tie-inclusive set size reported in (e).
Table B3Spatial-allocation sensitivity analysis for the 2022 Pakistan floods.
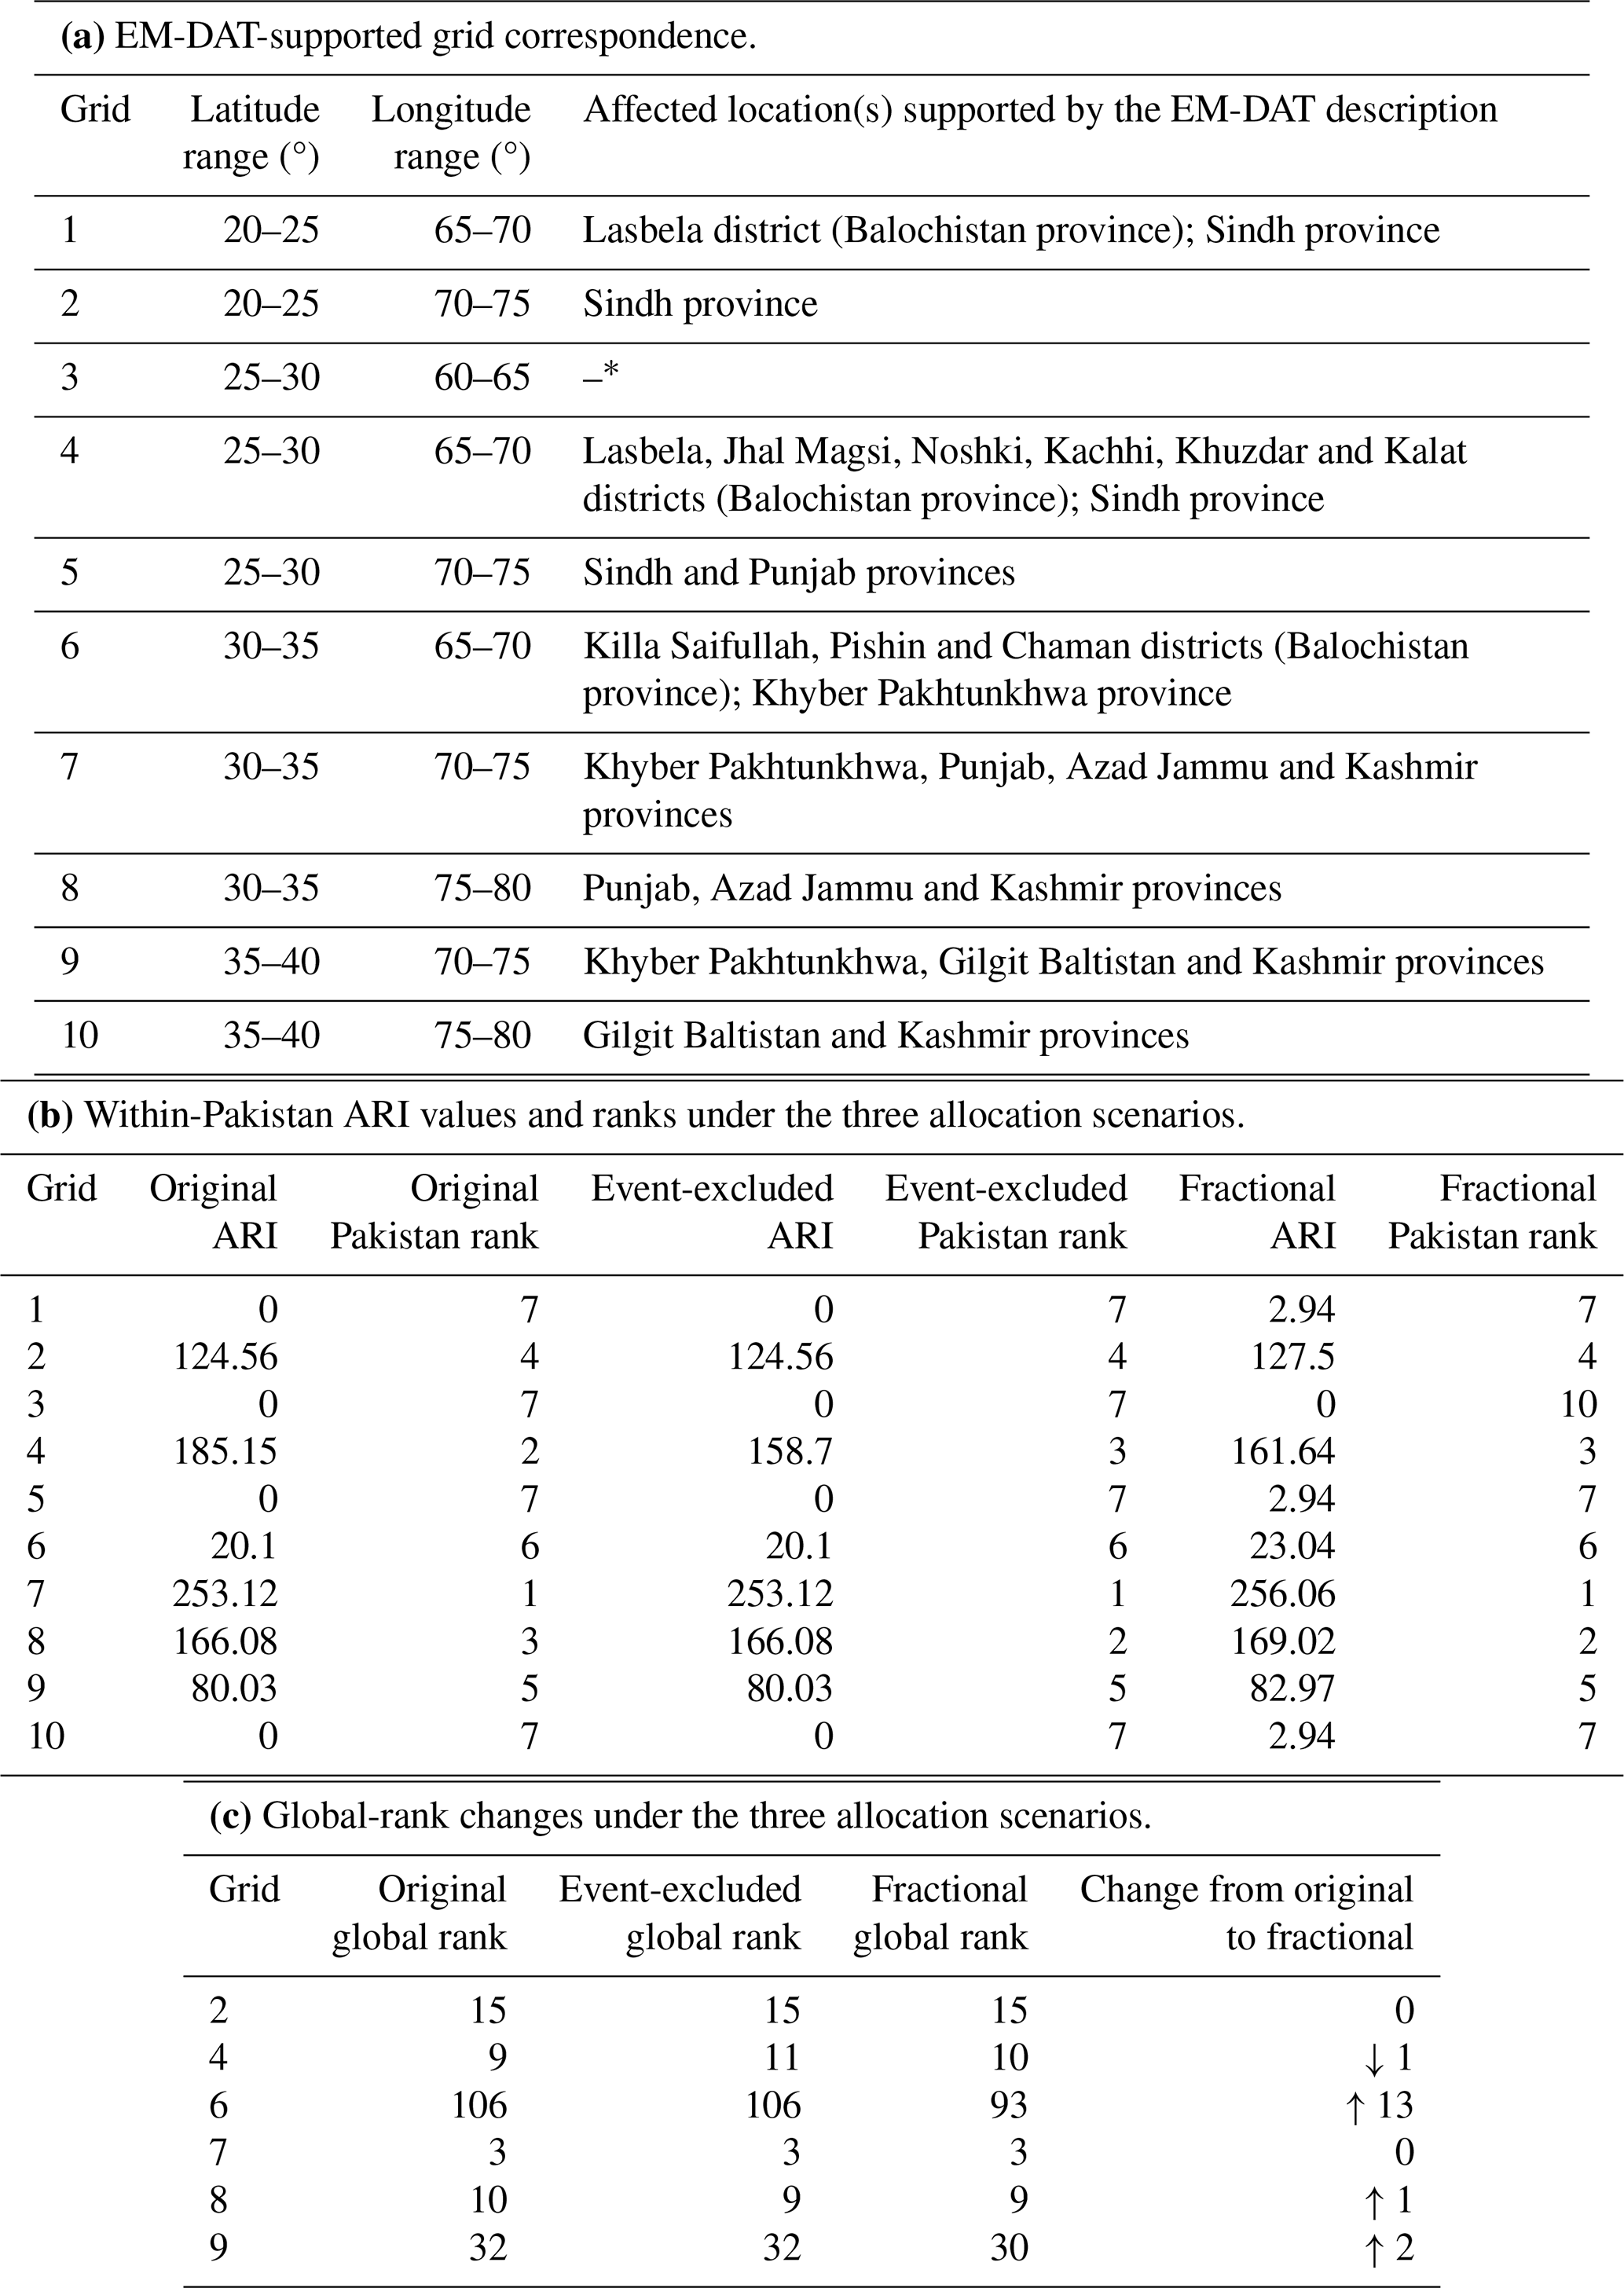
* No corresponding affected location was identified from the EM-DAT description. Notes: Only Pakistan-related cells with non-zero baseline ARI are included. An upward arrow indicates movement to a higher global position, corresponding to a lower numerical rank; a downward arrow indicates movement to a lower global position.
The disaster-event records used in this study were obtained from EM-DAT and remain subject to the database’s applicable access and citation conditions. The composition, sources, and technical characteristics of the 3H Dataset are documented in Sect. 4.3, Fig. 10, and Tables A2–A3. The 3H Dataset (version 1.0.0) is publicly available from Zenodo: https://doi.org/10.5281/zenodo.22930015 (Kong and Zhu, 2026). Reuse and redistribution of the underlying imagery remain subject to the applicable terms and conditions of the original data providers.
E.Z. prepared the figures and wrote the manuscript. Q.K. prepared the figures and revised the final manuscript. All authors reviewed the manuscript.
The contact author has declared that neither of the authors has any competing interests.
Publisher's note: Copernicus Publications remains neutral with regard to jurisdictional claims made in the text, published maps, institutional affiliations, or any other geographical representation in this paper. The authors bear the ultimate responsibility for providing appropriate place names. Views expressed in the text are those of the authors and do not necessarily reflect the views of the publisher.
The authors thank the CRED at UCLouvain for access to EM-DAT, Bündnis Entwicklung Hilft and the IFHV for the WRI data, the RAMP project and the DigitalGlobe/Maxar Open Data Program for the imagery resources, and Natural Earth for the basemap data. We also thank the handling editor, Animesh Gain, and all reviewers for their constructive comments and suggestions.
This paper was edited by Animesh Gain and reviewed by Mohammad Mokhtari and four anonymous referees.
Baranowski, D. B., Flatau, M. K., Flatau, P. J., Karnawati, D., Barabasz, K., Labuz, M., Latos, B., Schmidt, J. M., Paski, J. A. I., and Marzuki: Social-media and newspaper reports reveal large-scale meteorological drivers of floods on Sumatra, Nat. Commun., 11, 2503, https://doi.org/10.1038/s41467-020-16171-2, 2020.
Birkmann, J.: Risk and vulnerability indicators at different scales: applicability, usefulness and policy implications, Environ. Hazards, 7, 20–31, https://doi.org/10.1016/j.envhaz.2007.04.002, 2007.
Bündnis Entwicklung Hilft: WorldRiskReport 2011: Focus: Governance and Civil Society, Bündnis Entwicklung Hilft, Berlin, 68 pp., ISBN 978-3-9814495-1-8, 2011.
Bündnis Entwicklung Hilft and Institute for International Law of Peace and Armed Conflict (IFHV): WorldRiskReport 2022: Focus: Digitalization, Bündnis Entwicklung Hilft, Berlin, 75 pp., ISBN 978-3-946785-14-9, 2022.
Bündnis Entwicklung Hilft and Institute for International Law of Peace and Armed Conflict (IFHV): WorldRiskReport 2023: Focus: Diversity, Bündnis Entwicklung Hilft, Berlin, 76 pp., ISBN 978-3-946785-16-3, 2023.
Ceferino, L., Kiremidjian, A., and Deierlein, G.: Probabilistic model for regional multiseverity casualty estimation due to building damage following an earthquake, ASCE-ASME Journal of Risk and Uncertainty in Engineering Systems, Part A: Civil Engineering, 4, 04018023, https://doi.org/10.1061/AJRUA6.0000972, 2018a.
Ceferino, L., Kiremidjian, A., and Deierlein, G.: Regional multiseverity casualty estimation due to building damage following an Mw 8.8 earthquake scenario in Lima, Peru, Earthq. Spectra, 34, 1739–1761, https://doi.org/10.1193/080617EQS154M, 2018b.
Ceferino, L., Merino, Y., Pizarro, S., Moya, L., and Ozturk, B.: Placing engineering in the earthquake response and the survival chain, Nat. Commun., 15, 4298, https://doi.org/10.1038/s41467-024-48624-3, 2024.
Chamberlain, E. L., Goodbred, S. L., Steckler, M. S., Wallinga, J., Reimann, T., Akhter, S. H., Bain, R., Muktadir, G., Al Nahian, A., Rahman, F. M. A., Rahman, M., Seeber, L., and von Hagke, C.: Cascading hazards of a major Bengal basin earthquake and abrupt avulsion of the Ganges River, Nat. Commun., 15, 4975, https://doi.org/10.1038/s41467-024-47786-4, 2024.
Chen, P., Zhang, J., Zhang, L., and Sun, Y.: Evaluation of resident evacuations in urban rainstorm waterlogging disasters based on scenario simulation: Daoli District (Harbin, China) as an example, Int. J. Environ. Res. Pu., 11, 9964–9980, https://doi.org/10.3390/ijerph111009964, 2014.
Chitondo, L., Thelma, C. C., and Phiri, E. V.: Ensuring national food security in Southern Africa: challenges and solutions, International Journal of Novel Research in Interdisciplinary Studies, 11, 1–18, https://doi.org/10.5281/zenodo.10785042, 2024.
Coronese, M., Lamperti, F., Keller, K., Chiaromonte, F., and Roventini, A.: Evidence for sharp increase in the economic damages of extreme natural disasters, P. Natl. Acad. Sci. USA, 116, 21450–21455, https://doi.org/10.1073/pnas.1907826116, 2019.
Delforge, D., Wathelet, V., Below, R., Lanfredi Sofia, C., Tonnelier, M., van Loenhout, J. A. F., and Speybroeck, N.: EM-DAT: The Emergency Events Database, Int. J. Disaster Risk Re., 124, 105509, https://doi.org/10.1016/j.ijdrr.2025.105509, 2025.
Dilley, M., Chen, R. S., Deichmann, U., Lerner-Lam, A. L., Arnold, M., Agwe, J. N., Buys, P., Kjekstad, O., Lyon, B., and Yetman, G.: Natural Disaster Hotspots: A Global Risk Analysis, Disaster Risk Management Series No. 5, The World Bank and Columbia University, Washington, DC, 132 pp., https://doi.org/10.1596/0-8213-5930-4, 2005.
Eckstein, D., Künzel, V., and Schäfer, L.: Global Climate Risk Index 2021: Who Suffers Most from Extreme Weather Events? Weather-Related Loss Events in 2019 and 2000–2019, Germanwatch, Bonn, ISBN 978-3-943704-84-6, 2021.
Elliott, J., Walters, R., and Wright, T.: The role of space-based observation in understanding and responding to active tectonics and earthquakes, Nat. Commun., 7, 13844, https://doi.org/10.1038/ncomms13844, 2016.
Feng, J., Li, N., Zhang, Z., and Chen, X.: The dual effect of vegetation green-up date and strong wind on the return period of spring dust storms, Sci. Total Environ., 592, 729–737, https://doi.org/10.1016/j.scitotenv.2017.02.028, 2017.
Formetta, G. and Feyen, L.: Empirical evidence of declining global vulnerability to climate-related hazards, Glob. Environ. Change, 57, 101920, https://doi.org/10.1016/j.gloenvcha.2019.05.004, 2019.
Gallina, V., Torresan, S., Critto, A., Sperotto, A., Glade, T., and Marcomini, A.: A review of multi-risk methodologies for natural hazards: consequences and challenges for a climate change impact assessment, J. Environ. Manage., 168, 123–132, https://doi.org/10.1016/j.jenvman.2015.11.011, 2016.
Geiß, C. and Taubenböck, H.: Remote sensing contributing to assess earthquake risk: from a literature review towards a roadmap, Nat. Hazards, 68, 7–48, https://doi.org/10.1007/s11069-012-0322-2, 2013.
Gill, J. C. and Malamud, B. D.: Reviewing and visualizing the interactions of natural hazards, Rev. Geophys., 52, 680–722, https://doi.org/10.1002/2013RG000445, 2014.
Herold, S. and Sawada, M. C.: A review of geospatial information technology for natural disaster management in developing countries, Int. J. Appl. Geospat. Res., 3, 24–62, https://doi.org/10.4018/jagr.2012040103, 2012.
Hufschmidt, G., Crozier, M., and Glade, T.: Evolution of natural risk: research framework and perspectives, Nat. Hazards Earth Syst. Sci., 5, 375–387, https://doi.org/10.5194/nhess-5-375-2005, 2005.
Hussain, M. A., Shuai, Z., Moawwez, M. A., Umar, T., Iqbal, M. R., Kamran, M., and Muneer, M.: A review of spatial variations of multiple natural hazards and risk management strategies in Pakistan, Water, 15, 407, https://doi.org/10.3390/w15030407, 2023.
Julià, P. B. and Ferreira, T. M.: From single- to multi-hazard vulnerability and risk in historic urban areas: a literature review, Nat. Hazards, 108, 93–128, https://doi.org/10.1007/s11069-021-04734-5, 2021.
Koks, E. E., Jongman, B., Husby, T. G., and Botzen, W. J. W.: Combining hazard, exposure and social vulnerability to provide lessons for flood risk management, Environ. Sci. Policy, 47, 42–52, https://doi.org/10.1016/j.envsci.2014.10.013, 2015.
Koks, E. E., Rozenberg, J., Zorn, C., Tariverdi, M., Vousdoukas, M. I., Fraser, S. A., Hall, J. W., and Hallegatte, S.: A global multi-hazard risk analysis of road and railway infrastructure assets, Nat. Commun., 10, 2677, https://doi.org/10.1038/s41467-019-10442-3, 2019.
Kong, Q. and Zhu, E.: 3H Dataset: Standardized High-Resolution Remote-Sensing Imagery for High-ARI Disaster Hotspots, Zenodo [data set], https://doi.org/10.5281/zenodo.22930015, 2026.
Lindersson, S., Brandimarte, L., Mård, J., and Di Baldassarre, G.: A review of freely accessible global datasets for the study of floods, droughts and their interactions with human societies, WIREs Water, 7, e1424, https://doi.org/10.1002/wat2.1424, 2020.
Little, A. S., Priestley, M. D., and Catto, J. L.: Future increased risk from extratropical windstorms in northern Europe, Nat. Commun., 14, 4434, https://doi.org/10.1038/s41467-023-40102-6, 2023.
Manfré, L. A., Hirata, E., Silva, J. B., Shinohara, E. J., Giannotti, M. A., Larocca, A. P. C., and Quintanilha, J. A.: An analysis of geospatial technologies for risk and natural disaster management, ISPRS Int. J. Geo-Inf., 1, 166–185, https://doi.org/10.3390/ijgi1020166, 2012.
Marin, G., Modica, M., Paleari, S., and Zoboli, R.: Assessing disaster risk by integrating natural and socio-economic dimensions: a decision-support tool, Socio-Econ. Plan. Sci., 77, 101032, https://doi.org/10.1016/j.seps.2021.101032, 2021.
Marin-Ferrer, M., Vernaccini, L., and Poljanšek, K.: INFORM Index for Risk Management: Concept and Methodology, Version 2017, EUR 28655 EN, Publications Office of the European Union, Luxembourg, https://doi.org/10.2760/094023, 2017.
Ming, X., Xu, W., Li, Y., Du, J., Liu, B., and Shi, P.: Quantitative multi-hazard risk assessment with vulnerability surface and hazard joint return period, Stoch. Environ. Res. Risk Assess., 29, 35–44, https://doi.org/10.1007/s00477-014-0935-y, 2015.
Mokhtari, M., Faridi, P., Masoodi, M., and Ahmadi, S. M.: Perspective chapter: A global view of natural hazards related disasters, in: Natural Hazards – New Insights, edited by: Mokhtari, M., IntechOpen, London, https://doi.org/10.5772/intechopen.111582, 2023.
Newman, R. and Noy, I.: The global costs of extreme weather that are attributable to climate change, Nat. Commun., 14, 6103, https://doi.org/10.1038/s41467-023-41888-1, 2023.
Nohrstedt, D., Hileman, J., Mazzoleni, M., Di Baldassarre, G., and Parker, C. F.: Exploring disaster impacts on adaptation actions in 549 cities worldwide, Nat. Commun., 13, 3360, https://doi.org/10.1038/s41467-022-31059-z, 2022.
Paprotny, D., Sebastian, A., Morales-Nápoles, O., and Jonkman, S. N.: Trends in flood losses in Europe over the past 150 years, Nat. Commun., 9, 1985, https://doi.org/10.1038/s41467-018-04253-1, 2018.
Peduzzi, P., Dao, H., Herold, C., and Mouton, F.: Assessing global exposure and vulnerability towards natural hazards: the Disaster Risk Index, Nat. Hazards Earth Syst. Sci., 9, 1149–1159, https://doi.org/10.5194/nhess-9-1149-2009, 2009.
Peduzzi, P., Chatenoux, B., Dao, H., De Bono, A., Herold, C., Kossin, J., Mouton, F., and Nordbeck, O.: Global trends in tropical cyclone risk, Nat. Clim. Change, 2, 289–294, https://doi.org/10.1038/nclimate1410, 2012.
Pittore, M., Wieland, M., and Fleming, K.: Perspectives on global dynamic exposure modelling for geo-risk assessment, Nat. Hazards, 86, 7–30, https://doi.org/10.1007/s11069-016-2437-3, 2017.
Rathje, E. M. and Adams, B. J.: The role of remote sensing in earthquake science and engineering: opportunities and challenges, Earthq. Spectra, 24, 471–492, https://doi.org/10.1193/1.2923922, 2008.
Rentschler, J., Salhab, M., and Jafino, B. A.: Flood exposure and poverty in 188 countries, Nat. Commun., 13, 3527, https://doi.org/10.1038/s41467-022-30727-4, 2022.
Ridder, N. N., Pitman, A. J., Westra, S., Ukkola, A., Do, H. X., Bador, M., Hirsch, A. L., Evans, J. P., Di Luca, A., and Zscheischler, J.: Global hotspots for the occurrence of compound events, Nat. Commun., 11, 5956, https://doi.org/10.1038/s41467-020-19639-3, 2020.
Rosvold, E. L. and Buhaug, H.: GDIS, a global dataset of geocoded disaster locations, Sci. Data, 8, 61, https://doi.org/10.1038/s41597-021-00846-6, 2021.
Shi, P. and Kasperson, R. (Eds.): World Atlas of Natural Disaster Risk, Springer and Beijing Normal University Press, Berlin and Beijing, https://doi.org/10.1007/978-3-662-45430-5, 2015.
Shi, P., Yang, X., Fang, J., Wang, J., Xu, W., and Han, G.: Mapping and ranking global mortality, affected population and GDP loss risks for multiple climatic hazards, J. Geogr. Sci., 26, 878–888, https://doi.org/10.1007/s11442-016-1304-1, 2016.
Smith, A., Bates, P. D., Wing, O., Sampson, C., Quinn, N., and Neal, J.: New estimates of flood exposure in developing countries using high-resolution population data, Nat. Commun., 10, 1814, https://doi.org/10.1038/s41467-019-09282-y, 2019.
Taghizadeh-Hesary, F., Sarker, T., Yoshino, N., Mortha, A., and Vo, X. V.: Quality infrastructure and natural disaster resiliency: a panel analysis of Asia and the Pacific, Econ. Anal. Policy, 69, 394–406, https://doi.org/10.1016/j.eap.2020.12.021, 2021.
Tronin, A. A.: Satellite remote sensing in seismology: a review, Remote Sens., 2, 124–150, https://doi.org/10.3390/rs2010124, 2010.
United Nations Development Programme (UNDP): Reducing disaster risk: a challenge for development: a global report, Bureau for Crisis Prevention and Recovery, UNDP, New York, 146 pp., ISBN 9211261600, 2004.
Wang, L., Yu, J. Y., and Paek, H.: Enhanced biennial variability in the Pacific due to Atlantic capacitor effect, Nat. Commun., 8, 14887, https://doi.org/10.1038/ncomms14887, 2017.
Ward, P. J., Blauhut, V., Bloemendaal, N., Daniell, J. E., de Ruiter, M. C., Duncan, M. J., Emberson, R., Jenkins, S. F., Kirschbaum, D., Kunz, M., Mohr, S., Muis, S., Riddell, G. A., Schäfer, A., Stanley, T., Veldkamp, T. I. E., and Winsemius, H. C.: Review article: Natural hazard risk assessments at the global scale, Nat. Hazards Earth Syst. Sci., 20, 1069–1096, https://doi.org/10.5194/nhess-20-1069-2020, 2020.
Welle, T. and Birkmann, J.: The World Risk Index – an approach to assess risk and vulnerability on a global scale, J. Extreme Events, 2, 1550003, https://doi.org/10.1142/S2345737615500037, 2015.
Wen, J., Wan, C., Ye, Q., Yan, J., and Li, W.: Disaster risk reduction, climate change adaptation and their linkages with sustainable development over the past 30 years: a review, Int. J. Disaster Risk Sc., 14, 1–13, https://doi.org/10.1007/s13753-023-00472-3, 2023.
Yarveysi, F., Alipour, A., Moftakhari, H., Jafarzadegan, K., and Moradkhani, H.: Block-level vulnerability assessment reveals disproportionate impacts of natural hazards across the conterminous United States, Nat. Commun., 14, 4222, https://doi.org/10.1038/s41467-023-39853-z, 2023.
- Abstract
- Introduction
- Data and Methods
- Results
- ARI-guided remote sensing data integration and the 3H Dataset
- Discussion
- Conclusions
- Appendix A: Existing grid and imagery inventories
- Appendix B: Supplementary diagnostic and sensitivity results
- Data availability
- Author contributions
- Competing interests
- Disclaimer
- Acknowledgements
- Review statement
- References
- Abstract
- Introduction
- Data and Methods
- Results
- ARI-guided remote sensing data integration and the 3H Dataset
- Discussion
- Conclusions
- Appendix A: Existing grid and imagery inventories
- Appendix B: Supplementary diagnostic and sensitivity results
- Data availability
- Author contributions
- Competing interests
- Disclaimer
- Acknowledgements
- Review statement
- References