
the Creative Commons Attribution 4.0 License.
the Creative Commons Attribution 4.0 License.
 | 07 Oct 2026
Invited perspective: Uncertainties in natural systems may be uncomfortable, but ignoring them would be absurd
Warner Marzocchi

Alberto Montanari
Uncertainties in natural systems are pervasive, varied, and unavoidable due to inherent open system complexity and limited knowledge. Therefore, the evolution of a natural system cannot be predicted deterministically and probabilistic forecasts are commonly used to account for these uncertainties. As the Voltaire-inspired title suggests, representing and quantifying all uncertainties in hazard and risk forecasting is challenging yet essential for an effective risk management cycle and for a meaningful scientific evaluation of forecasting models. Although this paper focuses on hazard forecasting, we argue that the discussion and treatment of uncertainty apply equally to vulnerability and, therefore, to risk assessment. The most important challenges are reflected in the current absence of a common hierarchy of uncertainties, of a shared quantitative procedure to include all uncertainties in a forecast, and of effective communication and decision-making protocols, across different hazards and risks. Deepening the understanding of these distinct challenges has been the main goal of a dedicated task force of scientists from different disciplines, experts in communication, and decision-makers in the framework of a large Italian project on multirisk under NextGenEU funds – the RETURN project (https://www.fondazionereturn.it/en/, last access: 5 October 2026) – which includes eighteen Italian universities and research centers, the Italian Civil Protection Department, Italian State Railways, Assicurazioni Generali, other profit entities, and one Italian River Basin Authority. Within this initiative, we examined several examples of natural hazard forecasting and projections, from the perspectives of experts in various fields and/or users of these forecasts. The task force found that different hazards share key features and challenges regarding uncertainty definition, understanding, quantification and communication, which may be embedded in a common framework. Such a framework introduces the concept of a “complete forecast”, defined as a forecast that explicitly represents and keeps distinct all recognized uncertainties. This distinction is essential for the proper evaluation of forecasting models. This work categorizes the common key scientific and communication challenges, propose potential solutions, and intend to stimulate a deeper reflection on these issues.
- Article
(2803 KB) - Full-text XML
- BibTeX
- EndNote


Many natural hazards are hard to predict on time scales useful for risk reduction. This arises both from incomplete knowledge of underlying processes and from intrinsic unpredictability. The latter stems from strong nonlinearities (e.g. chaos), fine-scale aggregation in space and time, high dimensionality, and the open nature of Earth systems that exchange energy and matter with their surroundings in often uncontrolled ways. As a result, the future evolution of a natural hazard can only be expressed probabilistically through forecasts: each forecasting model provides a probability distribution for hazard intensity within a given space–time window. Even predictions, including point estimates (“best guesses”), implicitly carry uncertainty, whether stated or not, and are therefore effectively probabilistic. In addition to intrinsic variability, pervasive knowledge gaps often require using multiple forecasting models, introducing further probabilistic complexity in the Earth sciences (Oreskes et al., 1994) and complicating effective communication.
These issues have been extensively discussed within the RETURN project (multi-Risk sciEnce for resilienT commUnities undeR a chaNging climate; https://www.fondazionereturn.it/en/, last access: 5 October 2026). RETURN is a large national partnership that brings together eighteen Italian universities and research centers, the Italian Civil Protection Department, Italian State Railways, Assicurazioni Generali, other profit entities, and one Italian River Basin Authority. It has been designed to strengthen Italy's research capacity on environmental, natural, and human-induced risks, while connecting it with major European and global value chains. The project had a dual mission: on the one hand, to advance basic knowledge and develop new technologies for risk prevention and mitigation; on the other, to transfer these innovations into practical applications, engaging public administrations, companies, and local communities. Within the RETURN framework, we established a transversal task force comprising scientists from multiple disciplines, communication experts, and decision-makers. Its aim was to address the problem of handling uncertainties in hazard forecasting from the perspectives of scientists, practitioners, communicators, and stakeholders across a range of natural hazards – including floods, earthquakes, volcanic phenomena, landslides, climate projections (which can be interpreted as forecasts conditioned on a specific emissions scenario), weather forecasting, and marine biogeochemistry. Although this paper focuses on hazard forecasting, the proposed framework represents an important first step toward a comprehensive treatment of uncertainty in risk forecasting. In its simplest formulation, risk is a function of hazard, exposure, and vulnerability. While uncertainty in hazard has received considerable attention, vulnerability assessments are also affected by substantial uncertainty, which may in some cases exceed that associated with the hazard itself (e.g. Pianosi et al., 2026). We argue that the probabilistic framework proposed here for representing and propagating uncertainty in hazard forecasting can be extended naturally to the vulnerability domain. If this is the case, the resulting risk assessment becomes the combination of the uncertainties associated with both hazard and vulnerability, propagated through the risk model.
Drawing on the experience as both producers and users of such forecasts, we summarize here the main concepts discussed within the task force. First, we outline the general discussion and highlight common challenges across different hazards that may warrant shared procedures (e.g. Beven et al., 2018a). Then, we examine these scientific and communication challenges in detail. Finally, we offer general recommendations to help scientists and practitioners to develop common procedures for building and testing forecasts, clarifying the meaning of a “complete forecast”, i.e. a forecast that explicitly represents and keeps distinct all recognized uncertainties, and communicating these uncertainties.
The first issue that clearly emerged from the discussion inside the task force is the lack of a common terminology across the different disciplines as well as the different risk management stakeholders. For example, the terms prediction and forecast are often used with different meanings across disciplines. In this paper, a prediction is defined as a deterministic statement that a specific hazard intensity will or will not occur in a particular geographic region and time horizon, whereas a forecast gives a probability that such an event will occur (Jordan et al., 2011). Although also predictions are inherently probabilistic, due to the unavoidable presence of false alarms and missed events, we argue that issuing a forecast is preferable because it quantifies uncertainties through probability, and it clarifies the roles of the different actors in the whole decision-making process: in a nutshell, scientists provide probabilities describing scientific uncertainty, whereas decision-makers select probability thresholds to guide actions (Jordan et al., 2014). Section 8 summarizes the terms used in this paper and their meanings as commonly applied across different natural hazards. It does not claim to provide the “correct” definitions, but it is intended to facilitate readability and understanding.
We also noticed that different hazards share common features and challenges: (i) the presence of uncertainties linked both to the natural variability of the process and to our limited knowledge; (ii) the lack of a clear and unambiguous definition of these uncertainties and how to include both of them in a complete hazard forecast; (iii) how to test the reliability of the complete forecasts; and (iv) how to communicate these forecasts effectively to decision-makers and society in general. Oddly, despite the many similarities across fields, these problems have largely been tackled in isolation, as evidenced, for example, by the proliferation of distinct terminologies used to describe and to handle different kinds of uncertainty: without pretending to be exhaustive, terms like shallow and deep, intra- and inter-model, external and internal, value and structural uncertainty, likelihood and confidence, state and model uncertainty, uncertainty on model parameters and on initial/boundary conditions are widely used across many disciplines to deal with similar issues, both within and beyond natural-hazard forecasting (e.g. Marinacci, 2015).
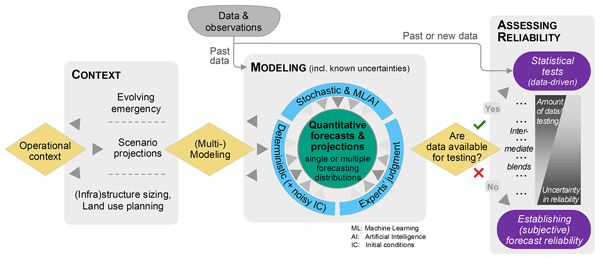
These common features and distinctive characteristics are summarized in Fig. 1, which illustrates the different operational perspectives according to the role of the task force, regardless of the specific hazard considered. The first block defines the operational context, i.e. whether the forecast is long-term (e.g. forecast over years to tens of years or centuries, guiding structural design and planning) or short-term (e.g. forecast over hours/days/months, managing an unfolding emergency).
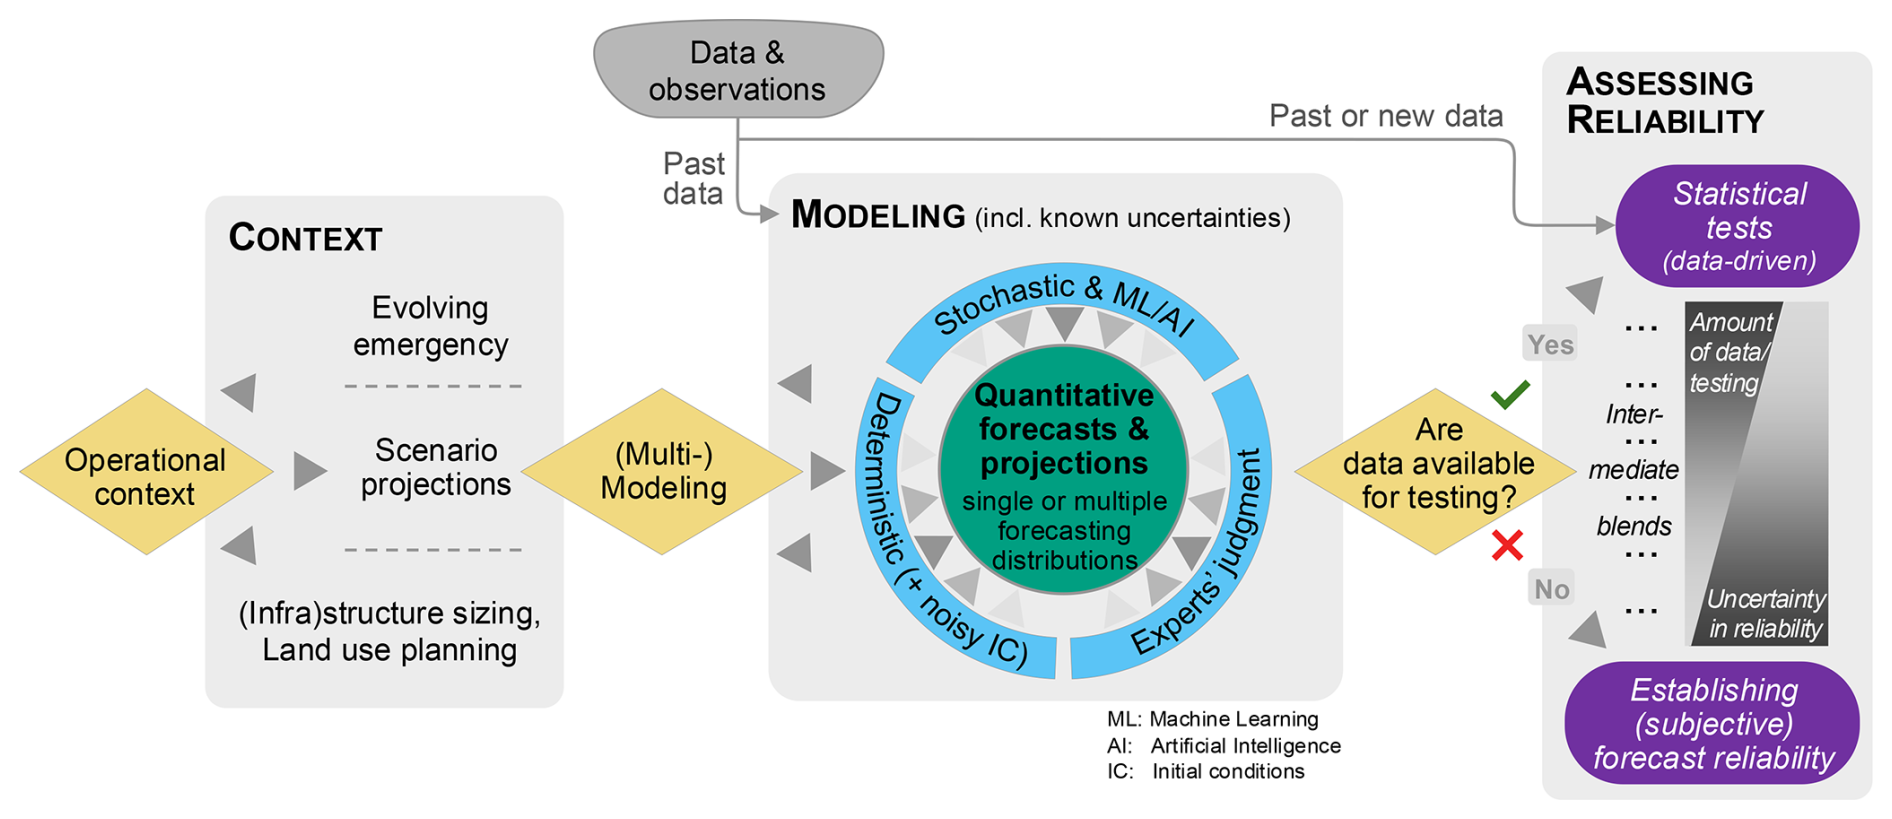
Figure 1A logical flowchart illustrating the main steps involved in building and testing a hazard forecast.
The second block covers the construction of forecasting models selection according to the context, i.e. the time horizon investigated (short- or long-term) and scenario projections (like for IPCC). Depending on the hazard, forecasting models can be of different types, for example: (i) Deterministic physics-based models, often accelerated through surrogate or reduced-order models (de Burgh-Day and Leeuwenburg, 2023; Li et al., 2023), incorporate uncertainty into their point-forecasts either by introducing random perturbations to the initial and/or boundary conditions or by augmenting deterministic point predictions with probability distributions calibrated from historical discrepancies between model predictions and observations (Glahn and Lowry, 1972; Gneiting et al., 2005; Koutsoyiannis and Montanari, 2022; Shabestanipour et al., 2023); (ii) Artificial Intelligence/Machine-Learning models that yield predictions with associated predictive errors (e.g. Mosavi et al., 2018; Reichstein et al., 2019; Mondini et al., 2023;); (iii) empirical or stochastic models derived from instrumental and/or historical data (Ogata, 1988; Gumbel, 1958; Stedinger and Cohn, 1986; Merz and Blöschl, 2008); (iv) models based on expert judgment (O'Hagan, 1998; Aspinall and Cooke, 2013). This list shows some end-members but mixed approaches are common; for example, data-driven Bayesian approaches may use different pieces of information (e.g. from data, physics, and expert judgement) to produce a combined forecast (e.g. Viglione et al., 2013), or physics-based model to produce a starting forecast that is continuously updated as soon as new data and information becomes available (e.g. Bluecat; Koutsoyiannis and Montanari, 2022; Montanari and Koutsoyiannis, 2025). Regardless of type, each model provides one probability distribution for the hazard (or risk) intensity of interest. The presence of single vs. multiple distributions strongly affects the scientific evaluation of the forecasts, communication, and use. For example, a single probability distribution yields a single probability for a specific event and implies a very good knowledge about the process and the underlying modelling procedure. Multiple distributions imply that the probability of that event is itself described by a set of probabilities rather than a single value, underlining our limited knowledge about the process.
The third block addresses forecast scientific evaluation perspective, which is essential for establishing the operational credibility of forecasts for practical use. The evaluation procedures depend critically on two key factors: the availability of data for testing and the independence of those data from the model that generates the forecasts. These factors dictate both the appropriate testing procedures and how to interpret the results. This last aspect will be deeply investigated in Sect. 5 “Evaluating the reliability and skill of forecasts”.
In Sects. 3–6, we describe all these common challenges in greater depth.
Uncertainty arises from multiple sources, which can be grouped into two broad categories in forecasting: the natural variability of the data-generating process and our limited knowledge of the true data-generating process or the limitations of its numerical representation. These are commonly referred to as aleatory variability and epistemic uncertainty, respectively (see Sect. 8). Here, we implicitly assume the existence of a true data-generating process, an assumption to which we return later in the paper.
As implied with Fig. 1, regardless of the adopted modeling approach to describe the hazard intensity of interest, the model output is a forecast intended to describe the natural variability of the process. One common challenge across different hazards stems from the existence of multiple models producing forecasts or projections. In many current practices, these distinct forecasts are aggregated into a single forecasting distribution for the hazard intensity of interest (e.g. Rougier and Beven, 2013; Beven et al., 2018a). This forecasting distribution may be constructed as a mixture of the individual distributions (although, in some fields, this is incorrectly referred to as the “mean distribution” rather than the mixture distribution) or by using other statistically sound combination methods (Gneiting and Ranjan, 2013). However, this approach is hardly satisfactory for several reasons, the most obvious one being that it does not convey an important message to the stakeholders, i.e. how much scientists believe in their final assessment. For example, stating that a hazardous event has a 15 % probability of occurring conveys nothing about whether that estimate comes from a large or small dataset, whether forecasting models agree, or whether it is merely the average of widely divergent assessments.
In fields such as climatology and seismic hazard, practitioners often separate different types of uncertainty to indicate the faith they place in their forecasts. Specifically, climate change projections and long-term seismic hazard analysis acknowledge the existence of these different uncertainties (IPCC 2021; Senior Seismic Hazard Analysis Committee (SSHAC), 1997; see also discussion at Sect. 4), even though this is done through approaches and procedures that are incommensurable (Aven and Renn, 2015). Although all of these approaches are undoubtedly important steps toward more fully incorporating and representing uncertainties in a complete forecast, many critical issues of different types remain unresolved.
3.1 Single forecasting distribution
In many practical applications, a single forecasting distribution is used, yielding one exceedance probability for the hazard intensity of interest. This implicitly assumes that the model used is the true one (i.e. no lack of knowledge of the system) and that it provides an adequate description of the system's intrinsic natural variability, as captured by the forecast probability distribution. This typically reflects strong knowledge of the system, either a well-constrained physical model with tightly estimated parameters, or an empirical model calibrated on extensive data covering the process's characteristic timescale. This probability distribution is often conveniently represented by a survival distribution, f(x), showing the exceedance probability for each hazard intensity value x. Sometimes, the survival distribution is also named CCDF, i.e. the complement of the cumulative distribution function, which is often named hazard curve in many fields. Hereafter we name this survival distribution as forecasting distribution (FD).
For example, a common practice in ocean modelling is to report a point estimate of a variable of interest produced by one model assumed to represent the process's known physics. The uncertainty associated to the point estimate can be determined by comparing the three-dimensional, spatially resolved model output with sparse, pointwise observations (Fig. 2a). This approach relies on the matchup concept (Fig. 2b), in which model outputs and observations are co-located in space and time and their values compared. The resulting differences are then analysed using standard performance metrics such as bias, root-mean-square difference, and mean absolute error (and many others). Implicitly, in this case it is assumed that the FD is normally distributed, whose mean corresponds to the deterministic point estimate (i.e. the three-dimensional spatial field of a given variable), while its variance is represented by a selected quality metric derived from the pre-computed model–observation comparisons. This variance can potentially be estimated also as a function of time (e.g. seasonally or annually) and space, by subdividing the model domain. Overall, each FD, fij(x), is given by the normal survival function with known average (point estimate) and variance for the ith spatial cell and the jth time interval.
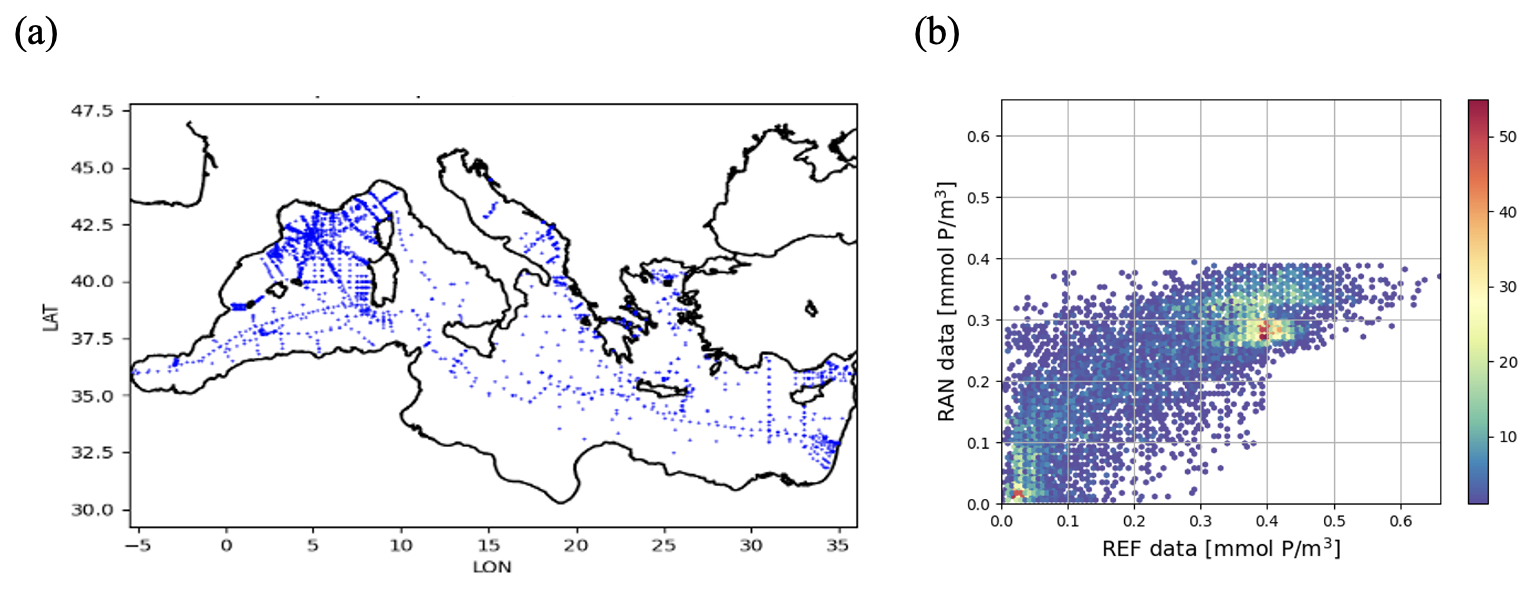
Figure 2(a) Map of the spatial distribution of the reference values of an observed variable and (b) scatter plot comparing modelled (RAN) and observed values of one variable (e.g. phosphate concentration), with colors representing point density (Cossarini et al., 2021).
Another example of using a single FD is given by an empirical model calibrated on extensive data. An example for flood forecast is given by the Bluecat model (Koutsoyiannis and Montanari, 2022; Montanari and Koutsoyiannis, 2025). Bluecat is a method to transform a deterministic prediction model into a stochastic forecasting model, therefore turning from a point prediction to the FD, f(x). Bluecat can consider multiple alternative models and use minimum uncertainty between observations and model's predictions (nearest neighbor approach) as a criterion to select the model that should be used. Eventually, also in this case, the FD, fij(x), is given by the normal survival function with known average (point estimate) and variance for the ith spatial cell and the jth time interval.
Dealing with a single FD does not present any particular scientific challenge beyond the definition of the hazard forecasting model; if we are interested in estimating the exceedance probability of one specific hazard intensity threshold, or if we want to estimate the hazard intensity that has one specific probability to be exceeded, we can get this information directly from f(x).
3.2 Multiple forecasting distributions
In many other sectors, the lack of knowledge of the process is substantial, leading to the impossibility to select a unique “trustable” model. Thus, beyond the intrinsic natural variability, there is a large uncertainty about which forecasting model is the right one (i.e. the one that describes the data-generating process), or the one that should be used (Scherbaum and Kuehn, 2011). In these cases, scientists use different models representing M alternative choices, all aiming at providing the forecast of the same hazard intensity for any specific space-time window, i.e. different FDs, fm(x), , where M is the number of FDs. To illustrate this situation, Fig. 3 shows two examples from long-term flood analysis and seismic hazard; in both cases, epistemic uncertainty is represented by alternative models reflecting different working hypotheses or numerical approximations, each producing a distinct forecast distribution (FD). In some disciplines, this kind of uncertainty is referred to as structural uncertainty (Smith and Berger, 2019), which can be regarded as a component of epistemic uncertainty.
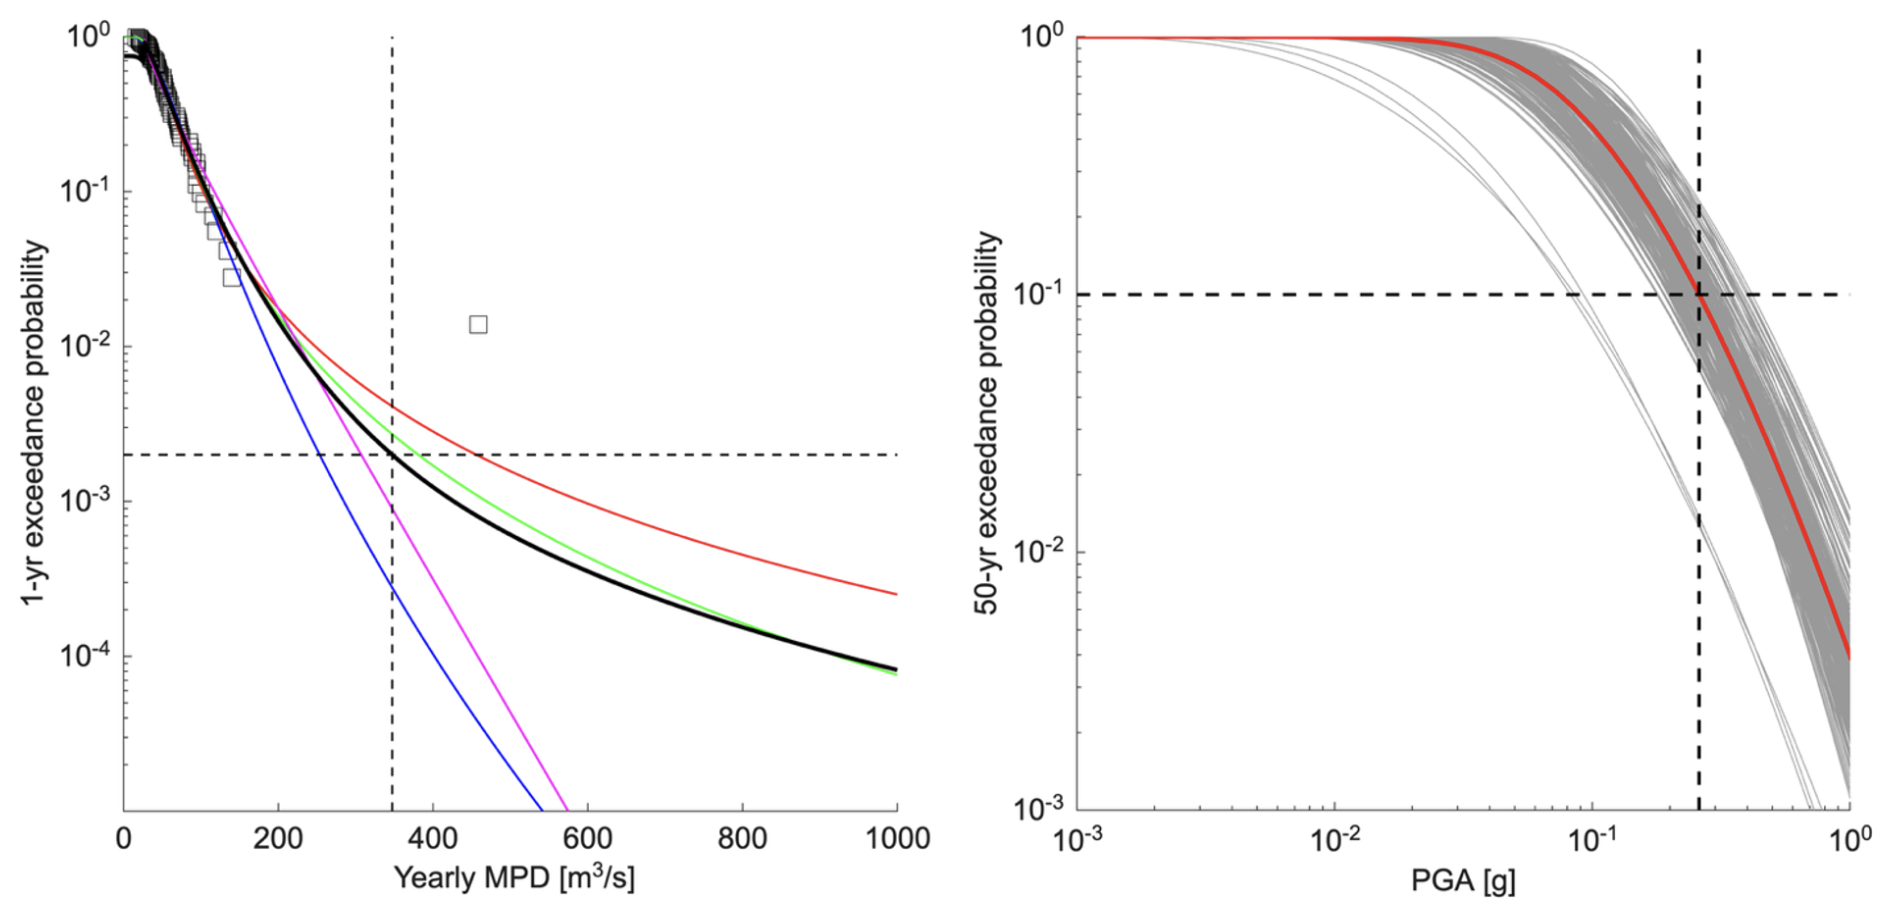
Figure 3Left panel: Four FDs, fm(x), which were defined fitting the set of observations from 1951 to 2021 (squares) with four different distributions, i.e. lognormal, Generalized Extreme Value (GEV), Pearson type 3, and Burr distributions (Chow et al., 1988; Papalexiou and Koutsoyiannis, 2013; Merz et al., 2022). The solid black line represents the mixture FD. The horizontal and vertical black dashed lines show the annual exceedance probability of 0.002 and the corresponding , respectively. Right panel: FDs of the 50-year horizontal peak ground acceleration (PGA) at L'Aquila, Italy. Each FD is shown in grey and it represents one parametrization of different 11 models that were used to build a national seismic hazard model for Italy (MPS19; Meletti et al., 2021). The red curve represents the mixture FD of all distributions. The horizontal and vertical dashed lines show the 50-years exceedance probability of 0.1 and the corresponding x0=0.26 g of the mixture FD, respectively.
For the flood analysis, the FDs represent empirical modeling of the yearly maximum peak discharges for the Kamp River at Zwettl, Austria (station 207944 – https://ehyd.gv.at/, last access: 5 October 2026) (Viglione et al., 2013); for the seismic hazard, the FDs are relative to the 50-year peak ground acceleration at L'Aquila, Italy, according to MPS19 (Meletti et al., 2021).
It is worth noting that this situation is independent from the contributing model types: models may arise from different parameterizations of the same formulation or constitute a set of conditionally independent models built from the same information. Moreover, it also transcends the level of physical understanding; the problem can occur even for processes with well-known physics, such as weather forecasting, climate change projections, and ocean modeling. Multi-model approaches are playing an increasingly important role in uncertainty quantification in ocean modeling. However, their high computational cost often necessitates a reduction in model dimensionality, for instance by adopting coarser spatial resolution or by simplifying fully three-dimensional problems to one- or zero-dimensional formulations. In this case, a new form of uncertainty arises from the incomplete description of the system and from the coexistence of multiple plausible theoretical formulations, approximations and parametrizations.
In the case of Fig. 2, when forecasting the concentration of a specific biogeochemical variable in the sea, different models may represent the same biogeochemical system by emphasizing different processes, adopting alternative closure schemes (e.g. accounting for unmodeled contributions regulating limit phytoplankton dynamics), or assuming distinct functional relationships (e.g. distinctive equations regulating a specific process). Even with a sound understanding of the underlying physics, identical initial conditions and external forcings, these modeling choices can lead to substantially different dynamical behaviors and responses. As an illustrative example, we consider different models (Models 1–5 in Fig. 4) that use distinct functional relationships of a box model representing a spatially homogeneous water body (e.g. a lake). For each model, parameter values of the distinctive functional relationships and initial conditions are perturbed to generate an ensemble of trajectories, thereby implicitly accounting for heterogeneity among individuals or species within the system. The resulting within-model variability represents the natural variability of the system around the large-scale dynamics described by the effective laws, while unresolved sub-grid-scale processes are neglected. Considering multiple models therefore generates a multi-model ensemble (Fig. 4), characterized by two distinct levels of variability: the variability among trajectories generated by each individual model and the variability arising from differences across models. This example demonstrates a feature that is indeed intrinsic in all the approaches based on multiple FDs: there is a hierarchy of uncertainties separating those arising from the natural variability described by individual models, and those associated with differences across models.
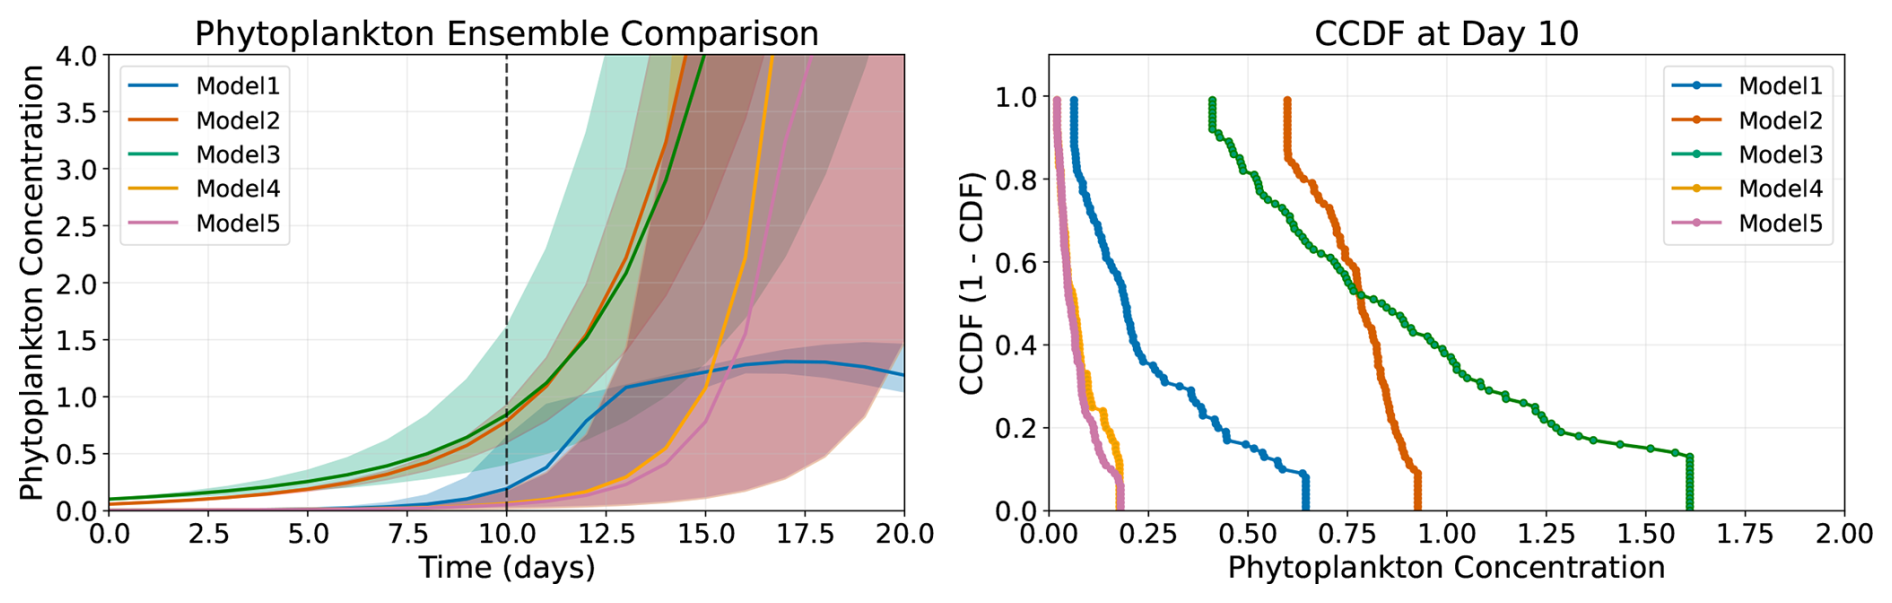
Figure 4Multi-model ensembles of biogeochemical simulations (phytoplankton concentration in mmol N m−3) performed with the Framework for Aquatic Biogeochemical Models (FABM, https://github.com/fabm-model/fabm/wiki, last access: 5 October 2026). Left panel: temporal evolution of phytoplankton concentration, showing the mean and spread for each model; the dashed vertical line marks the reference time that we want to forecast. Right panel: FDs of phytoplankton concentration at the selected time (day 10) obtained by five different models.
These cases raise important challenges in interpreting the meaning of a set of exceedance probabilities/hazard intensities for one specific hazard intensity/exceedance probability value. Usually, this problem is neglected in scientific literature, and it is ecumenically addressed by creating a “mixture” FD, , which represents the “best” model to be applied (e.g. the Bayesian model averaging; Raftery et al., 2005; Okoli et al., 2018; Gaume, 2018; Marzocchi et al., 2012, Herrmann and Marzocchi 2023), making the multi-model case similar to the single-model case with one single distribution. Here, we use a mixture distribution as the representative FD, although other combination methods may also be used to derive a representative FD (e.g. Gneiting and Ranjan, 2013).
In doing so, however, an important piece of information is lost, namely the dispersion of the individual FD, fm(x), around the representative (mixture) FD, . Hereafter, we refer to the set of individual forecast distributions as the FD-ensemble. The dispersion of this ensemble reflects our level of ignorance regarding the modeling of the hazard intensity (Marzocchi and Jordan, 2014; Zanetti et al., 2023); for example, we can have the same mixture FD, , from a FD-ensemble that have a narrow or large spread around . Conversely, if we want to preserve the set of exceedance probabilities for any hazard intensity, the forecast is not anymore a single probability – as assumed by the most common probabilistic frameworks, i.e. the frequentist and the subjective definition of probability. This aspect also raises the important question on how to test forecasts against data (if available). When one FD is used, generally the most obvious way is to compare the observed frequency of exceedance of one or more specific hazard intensity values x0, with the value given by the FD, i.e. f(x0). If the exceedance probability is given by a set of values, the problem of testing becomes much more complicated.
4.1 Probability and uncertainties
Probabilities are commonly interpreted as a mathematical descriptor of uncertainties. However, this link is much more complicated than expected. The common interpretations of probability, namely the frequentist and subjective frameworks, have been derived from contexts that are each dominated by a different kind of uncertainty: the frequentist framework considers the intrinsic random variability of the outcomes of a repeatable experiment that can be described by a frequency of one specific repeatable event of interest (e.g. rolling a dice); instead, the subjective framework (which is often mistakenly called “Bayesian” that, indeed, embraces a much wider set of interpretations; e.g. Gelman and Hennig, 2017) considers the lack of knowledge of the occurrence of one unique and non-repeatable event that is described by the concept of degree of belief (e.g. the outcome of one presidential election). In both cases, the probability is a single number with quite different meaning but, in all cases, it must satisfy the Kolmogorov axioms (Kolmogorov, 1950). For this reason, although there have been a continuous and strenuous debate among supporters of these frameworks, here we just stress that both frameworks are legitimate, if properly applied in their correct context, i.e. when one kind of uncertainty prevails.
Although scientists often favor the frequentist interpretation because probabilities are defined in terms of observable frequencies (aleatory variability), applying this framework to natural hazards is challenging. In many cases, defining the frequency of a truly repeatable experiment is challenging because every hazardous event is unique to some extent. Moreover, the frequentist interpretation does not naturally accommodate epistemic uncertainty, which inevitably involves subjective choices, such as the selection and weighting of the models used to represent alternative models or numerical approximations. In the subjective Bayesian framework, by contrast, probability quantifies a state of knowledge, and all uncertainty is therefore treated as epistemic. This framework is more flexible and broadly applicable (e.g. Beven et al., 2018b), but it is not designed to test a forecasting model against independent observations and reject it when warranted, which is a cornerstone of scientific practice (Box, 1976; AAAS, 1989; Oreskes et al., 1994; Marzocchi and Jordan 2014).
Subjective Bayesian statisticians hold different views regarding the role of model testing. For example, Lindley (2000) argued that “the rejection of a model is not a reality except in comparison with an alternative that appears better.” Similarly, Gelman (2007) wrote: “All models are wrong, and the purpose of model checking (as we see it) is not to reject a model but rather to understand the ways in which it does not fit the data available. From a subjective Bayesian point of view, the posterior distribution is what is being used to summarize inferences, so this is what we want to check.” These views are consistent with Box's well-known observation that “all models are wrong, but some are useful” (Box and Draper, 1987). In the subjective framework (e.g. Beven et al., 2018b), independent observations are incorporated through Bayesian updating to revise the state of knowledge, rather than being used to assess whether a probability distribution converges to an objectively existing data-generating process.
Hence, neither the frequentist nor the subjective Bayesian interpretation provides a unified framework for simultaneously representing aleatory variability and epistemic uncertainty. Yet, Earth systems are inherently characterized by the coexistence of both. This motivates the development of a broader probabilistic framework capable of integrating objective (frequency-based) information with subjective expert judgment, which is a long-standing challenge that remains without a universally accepted solution (e.g. Rubin, 1984; Walley, 1991; Lindley, 2000; Weichselberger, 2000; Wasserman, 2006; Coolen et al., 2011; Hansen et al., 2011; Gelman and Shalizi, 2013; Marzocchi and Jordan, 2014). Here, the term “unified” refers to a framework that coherently combines these objective and subjective frameworks within a single complete probabilistic forecast.
Before introducing the unified framework adopted here, it is useful to examine in greater depth the definitions of aleatory variability and epistemic uncertainty in the context of Earth sciences (Sect. 8), as well as the challenges associated with defining them unambiguously. It is often stated that aleatory variability is an irreducible randomness of the natural process, whereas epistemic uncertainty can, at least in principle, be reduced (e.g. Oberkampf et al., 2004; Eldred et al., 2011; Hüllermeier and Waegeman, 2021). This definition encounters some obvious conundrum: what appears to be intrinsic randomness may instead reflect incomplete understanding of the underlying physical mechanisms. As knowledge improves, part of the apparent aleatory variability may be explained deterministically and therefore reclassified as epistemic uncertainty. Consequently, the true intrinsic variability of a process (if any) cannot be identified unless epistemic uncertainty is eliminated, a condition that is rarely, if ever, achievable in practice (Marzocchi and Jordan, 2014; Beven et al., 2018b). A coherent and unambiguous definition of aleatory variability requires shifting the focus from the physical process to the data-generating process. In the idealized limit of an infinite amount of data, the FD of the data-generating process (its aleatory variability) could be estimated directly from the observations. This definition is model-independent because it relies solely on empirical evidence rather than on assumptions about the underlying physical model. Since we never have the possibility to collect a huge number of observations, we estimate this unknown FD through a FD-ensemble obtained by different models; each model has its own description of the aleatory variability which is a peculiarity of the model itself.
Under this framework, the irreducibility of the aleatory variability is strictly valid only at the model level (e.g. Der Kiureghian and Ditlevsen, 2009; Liou and Abrahamson, 2025): assuming to know the true model, the epistemic uncertainty arises solely from incomplete knowledge of its parameters; under these conditions, the acquisition of additional data and information reduces epistemic uncertainty while leaving the aleatory variability of the process essentially unchanged.
Despite difficulties in establishing a coherent hierarchy of uncertainties and the absence of a formal probabilistic framework to handle them, scientists across disciplines deem it necessary to distinguish among different types of uncertainty and keep them separated (Krzysztofowicz, 2001; Abrahamson and Bommer, 2005; IPCC 2021; Baker et al., 2021). For example, Abrahamson and Bommer (2005) state “This is not simply semantics: distinguishing between the two types of uncertainty [aleatory variability and epistemic uncertainty] is fundamental to the way that they are dealt with in the hazard calculations and how uncertainty is handled in decision making on the basis of the hazard analysis”. In climate science, IPCC introduced the dichotomy likelihood–confidence to describe two different kinds of uncertainty: Confidence expresses the qualitative degree of understanding and/or consensus among experts about the validity of a finding; likelihood expresses the chance of a defined outcome in the physical world and is estimated using also expert judgment (IPCC, 2021). Although we argue this approach is a step in the right direction, scientists raised substantive criticism (e.g. Aven and Renn, 2015; Janzwood, 2020). In particular, Aven and Renn (2015) point out to an imprecise definition of likelihood relative to probability and calling for a clear distinction and explicit definition of aleatory variability and epistemic uncertainty.
4.2 A unified probabilistic framework for handling different types of uncertainty
We introduce the unified framework using the examples described in Figs. 3 and 4. In these cases, a mathematical framework that explicitly represents different kinds of uncertainty separately may be more appropriate. This requires expressing probability as a range or a distribution, rather than as a single value. Here we describe a recent unified framework that represents both objective (frequency-based) information and subjective expert judgment as a distribution of probability, f(Φ), rather than a single probability value. Marzocchi and Jordan (2014, 2017, 2018) provide a full account of the unified framework, which has been applied to seismic, volcanic, and tsunami hazard assessment (Selva et al., 2014, 2021; Marzocchi et al., 2021b; Meletti et al., 2021; Gerstenberger et al., 2024). This unified framework is rooted in the definition of an experimental concept, external to the probabilistic model, that identifies collections of data, observed and not yet observed, judged to be stochastically exchangeable (i.e. with joint probability distributions invariant to data ordering) when conditioned on a set of explanatory variables (Draper et al., 1993). For any specific hazard intensity x0 the exchangeable sequence (experimental concept) is composed by 1 when we observe an exceedance of a specific intensity x>x0, and 0 otherwise. Pragmatically, the experimental concept is somehow related to the usefulness of the model, since the exchangeable sequence represents the set of observations we want to describe with the model itself.
According to De Finetti's theorem, an exchangeable sequence has a well-defined (and unknown) frequency. Implicitly, this means that if we collect a very long sequence for any specific hazard intensity value x0, we can build numerically the true FD, , which is the target of any forecasting model. From this perspective, we acknowledge that a natural process can never be known perfectly. Nevertheless, we assume that there exists an unknown, but true FD, , associated with the data-generating process from which the observations of the experimental concept arise. This forecast distribution represents the aleatory variability that our framework seeks to estimate. The existence of a true FD fundamentally distinguishes our framework from the subjective Bayesian interpretation discussed at the beginning of this section.
To clarify the definition of the experimental concept, consider the example of long-term seismic hazard analysis (right panel of Fig. 3). In this case, the experimental concept assumes that the exceedance or non-exceedance of a given hazard intensity threshold x0 over successive 50-year intervals is generated by the same unknown FD, . Under this assumption, the data-generating process is considered stationary, meaning that no explanatory variables are required to describe its probabilistic behavior. The definition of the experimental concept can be naturally extended to account for non-stationarity, with time acting as the conditioning explanatory variable. In this case, a correctly specified non-stationary data-generating model provides the appropriate FD at each point in time, while the interpretation of exceedance probabilities remains unchanged. The main consequence of non-stationarity is therefore not conceptual but practical: it complicates forecast reliability because observations collected at different times are generated from different forecast distributions. We will be back to this point in Sect. 5 “Evaluating the reliability and skill of forecasts”.
With this framework in mind, it is possible to define a univocal hierarchy of uncertainties. In plain language, the true exceedance probability for a specific hazard intensity value x0, , is the long-term frequency of the exchangeable sequence and it describes the aleatory variability; since it is unknown, we estimate it through a distribution of probability that is obtained by fitting the set of the random variable Φ, ϕm=fm(x0). This distribution is named extended experts' distribution, EED, whose dispersion mimics the epistemic uncertainty. The term “experts” emphasizes the subjective content of this hypothetical probability distribution that is determined by the subjective choice of the set of models that describes our knowledge about the data-generating process. These models are preferably independent (Wagenmakers et al., 2022), or, if one assumes to know the physics of the data-generating process, they may instead represent different parameterizations, or numerical approximations, of the same physical laws (de Burgh-Day and Leeuwenburg, 2023; Li et al., 2023; Liou and Abrahamson, 2025). For the sake of example, Fig. 5 shows the EEDs for the two cases described in Fig. 3 at the considered x0. Here the EEDs are built by fitting the Beta distribution to the set of ϕm. Eventually, if the true frequency (true probability, ) of the exchangeable sequence is outside this EED, we find an ontological error, or, using Donald Rumsfeld's words, an unknown unknown (see Logan, 2009; Smith and Berger, 2019). Similarly, assuming exchangeability when it does not hold (e.g. does not exist) may result in an ontological error. This requires defining an appropriate ontological null hypothesis, which will be described in detail in the Sect. 5 “Evaluating the reliability and skill of forecasts”.
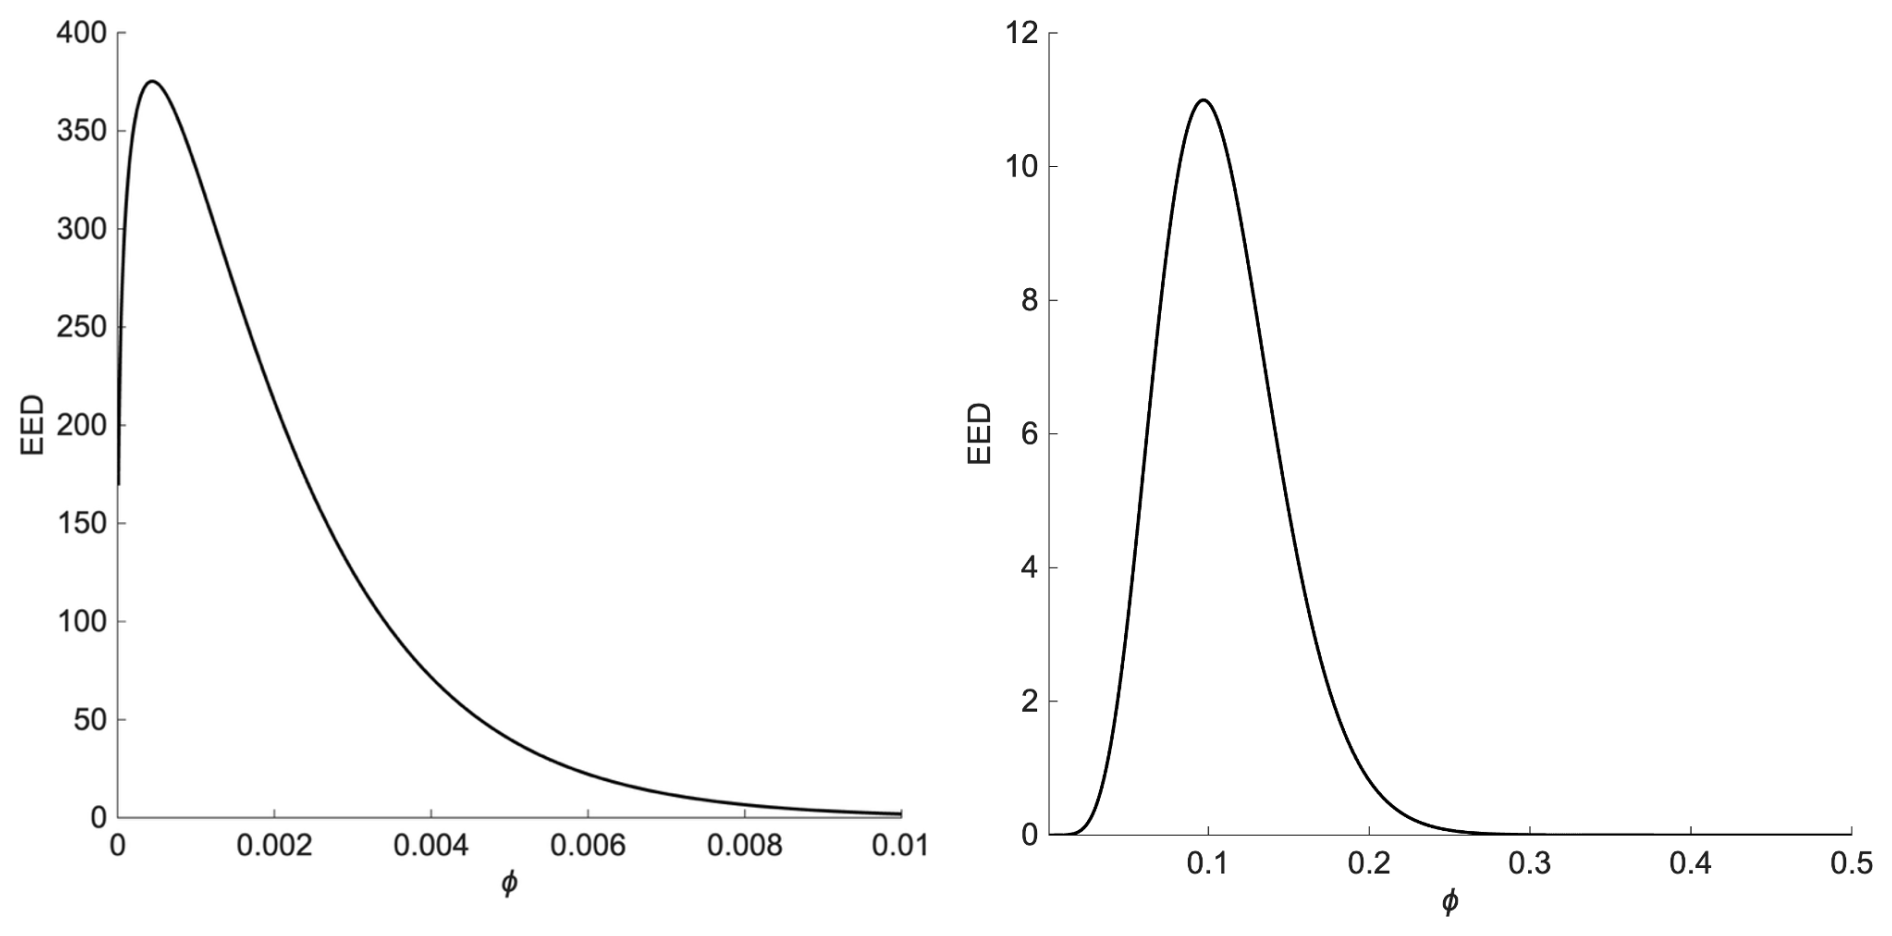
Figure 5Extended Experts' Distribution (EED) for two cases. Left panel: Beta distribution obtained from the shown in the left panel of Fig. 3. Right panel: Beta distribution obtained from the shown in the right panel of Fig. 3. A complete forecast is the collection of EEDs for each x0.
To summarize, the EED associated with a given hazard intensity, x0, is derived from a FD-ensemble and represents a PDF over the probability (frequency). If the EED is correctly specified, it bounds the range within which the true, unknown probability, , is expected to lie. Under this framework, a complete forecast can be defined quantitatively as the collection of the different EEDs conditioned to each x0. It is legitimate to use one FD only if the FD-ensemble has a sufficiently small spread, which means that the aleatory variability dominates over a negligible epistemic uncertainty.
We emphasize once again that the true aleatory variability is not a property of the underlying “true” process (which, in practice, is never fully known), but of the data-generating process defined by the experimental concept. Consequently, as the experimental concept evolves and the data-generating process is redefined (e.g. by conditioning on newly identified explanatory variables), the estimated aleatory variability may also change, even though the underlying physical process remains the same. Consider, for example, the annual exceedance probability of a given hazard intensity threshold, x0, ϕ=f(x0). If the experimental concept consists of data that are collected simply as a single annual time series, the aleatory variability, , is represented by the annual frequency of exceedances. Suppose, however, that we subsequently identify a binary variable A (A=0 or A=1) that significantly influences the exceedance probability, with exceedances being more likely when A=1. Rather than treating all years identically, we would naturally stratify the observations into two separate time series, corresponding to A=0 and A=1; these two new exchangeable time series represent two distinct experimental concepts. Although the underlying physical process has not changed, the estimated aleatory variability differs between the two series and also differs from that obtained when the data are analyzed without conditioning on A, i.e. . The only change is our improved knowledge of the process, which leads us to define new different experimental concepts (i.e. new different observational protocols), which represent different data-generating processes.
For design purposes, it is often convenient to slice horizontally through the family of FDs in Fig. 3 at a given exceedance probability ϕ0, chosen for a specific design objective. This yields a range of hazard-intensity values , rather than a single value, e.g. , raising the question of which value should be adopted for design (Okoli et al., 2018). Within our framework, we can construct a distribution of hazard intensity for the chosen ϕ0 (e.g. using a gamma distribution; see Fig. 6) and leave it to decision-makers to select the most appropriate representative value from this distribution. Indeed, this choice depends critically on the specific design requirements: for instance, the design of a nuclear power plant usually rely on high percentiles of this distribution (Ake et al., 2018), rather than on the mean or any other central estimate.
Every forecasting model is, by definition, a scientific product and must be tested against independent data (Box, 1976; AAAS, 1989; Klemeš, 1986; Schorlemmer et al., 2018). We contend that a forecast operational credibility is closely tied to the scientific reliability of the model, i.e. the model's ability to produce forecasting distribution(s) that adequately describe independent observations (Merz et al., 2024). Put differently, for societal applications the scientific reliability of a forecasting model is a necessary (sine qua non) condition for judging its credibility, before any evaluation of its effective applicability. Here, we do not dwell on specific test types (those depend heavily on the quantity and quality of available data and forecasts); rather, we focus on defining a general testing framework that can be shared across a broad set of practitioners in diverse scientific and applied domains characterized by varying time horizons, employing different model types and, crucially, facing widely varying amounts of data for testing.
Following conventions in other fields (e.g. Gneiting and Katzfuss, 2014; see also Schorlemmer et al., 2018 for seismology applications), the scientific evaluation of forecasts using statistical tests rests on two independent pillars: (1) comparing a FD with observations, and (2) assessing the relative performance (skill) of FDs generated by different models. To correctly interpret their outcomes, we clarify these two pillars and the adopted terminology in the following.
The first pillar concerns the reliability of a FD, or of a complete forecast. Broadly speaking, they are reliable when it agrees with observations. More specifically, we use the term “calibration” of a single FD (see Sect. 8) when comparing it with observations that are independent from the model that produces the FD (Laio and Tamea, 2007; Gneiting and Katzfuss, 2014; Schorlemmer et al., 2018). Note that calibration has different meanings across communities; for example, in some fields it denotes the process of estimating model parameters; while perfect terminology may not exist, we agreed on the need for clear definitions accessible to all users, which motivates the glossary appended to this paper (Sect. 8). When comparing the complete forecast (see the example of Fig. 5), which explicitly represents and keeps distinct aleatory variability and epistemic uncertainty, with independent observations, we use the term “validation” of the complete forecast (Marzocchi and Jordan, 2014).
If the data are not independent of the model's construction, we use the less ambitious term consistency. In many cases, observations are typically scarce and often not independent. Consequently, FDs are seldom fully validated or calibrated in the strict sense; instead, FDs are tested for their consistency with available observations. This distinction is substantive: for example, a flawed FD will typically fail a calibration test, but it can still pass a consistency test by overfitting the data used in its construction. In such cases, only the rejection of a consistency test is informative, as it reveals possible ontological errors or “unknown unknowns”.
Testing the calibration of a single FD and the validation of a complete forecast have profound conceptual and technical differences. When a single FD is available and independent observational data exist, the calibration compares the FD with the empirical distribution of the data. If the model is calibrated, the two distributions have to be similar. Many statistical tests exist for this purpose; a useful review is provided by Gneiting and Katzfuss (2014). One widely used technique to test a single FD is the Probability Integral Transform (PIT), a type of calibration plot: for each observed value within a forecast interval Δt, it computes the cumulative probability of that observation under the forecast distribution for Δt. For a calibrated forecast, the PIT values should be uniformly distributed (e.g. Laio and Tamea, 2007).
The validation of a complete forecast follows a different logic (see, e.g. Marzocchi and Jordan, 2014). Specifically, it consists of formulating the ontological null hypothesis, . This null hypothesis can be tested in many different ways, depending on the available data and the context (see, e.g. Marzocchi and Jordan, 2018; Gerstenberger et al., 2024; Pauli and Parolai, 2026). Pragmatically, we check if the observed frequency of exceedances for a given hazard intensity x0 is coherent with the EED, p(ϕ). The distribution p(ϕ) is built fitting the set of ϕm with a Beta distribution, though any suitably chosen distribution could be used. The choice itself is a potential source of ontological error; omitting this uncertainty is equivalent to assuming a Dirac (point-mass) distribution, which is a far stronger, and more questionable, assumption.
The validation of a complete forecast becomes more challenging in the presence of non-stationarity. In this case, it is generally impossible to estimate an empirical exceedance frequency for a given hazard threshold x0 at a specific time because only one (or very few) observations are available for each time instant. However, if the non-stationary model is correctly specified, the exceedance probabilities associated with the observations should be uniformly distributed, according to the probability integral transform (PIT) (Gneiting and Katzfuss, 2014). Although this problem has not yet been fully addressed in the literature, the PIT framework can, in principle, be generalized to account for epistemic uncertainty. Let fm(⋅) denote the FD associated with the mth model and let x(ti) be the observation at time ti. For each FD, we compute the PIT values ϕm(ti)=fm(x(ti)). For the true FD (i.e. the distribution associated with the data-generating process), the corresponding set of PIT values {ϕm(ti)} should follow a uniform distribution. When epistemic uncertainty is represented by an ensemble of M alternative FDs (), the ontological null hypothesis can be explored by requiring that the ensemble of PIT distributions adequately encompasses the uniform distribution.
The second pillar addresses relative forecasting skill across multiple FDs. The (relative) skill is measured by proper scoring rules that rank models by their ability to explain a given set of observations, without implying reliability (Gneiting and Katzfuss, 2014). The distinction matters: among competing FDs, one FD will often fit the observations better, yet all FDs might still be unreliable (i.e. fail reliability tests). Conversely, several FDs may pass reliability tests but differ substantially in skill, e.g. one may explain observations much better than the others. When observations are independent of model construction, higher skill indicates a better FD. If the same observations were used to build the FDs, superior skill may simply reflect overfitting.
In Fig. 7 we summarize the whole evaluation process and the different alternatives that depend on the availability and amount of data, the kind of test (reliability of a forecast or comparison of a set of forecasts), and the inclusion, or not, of the epistemic uncertainty in the reliability tests using dependent and independent data.
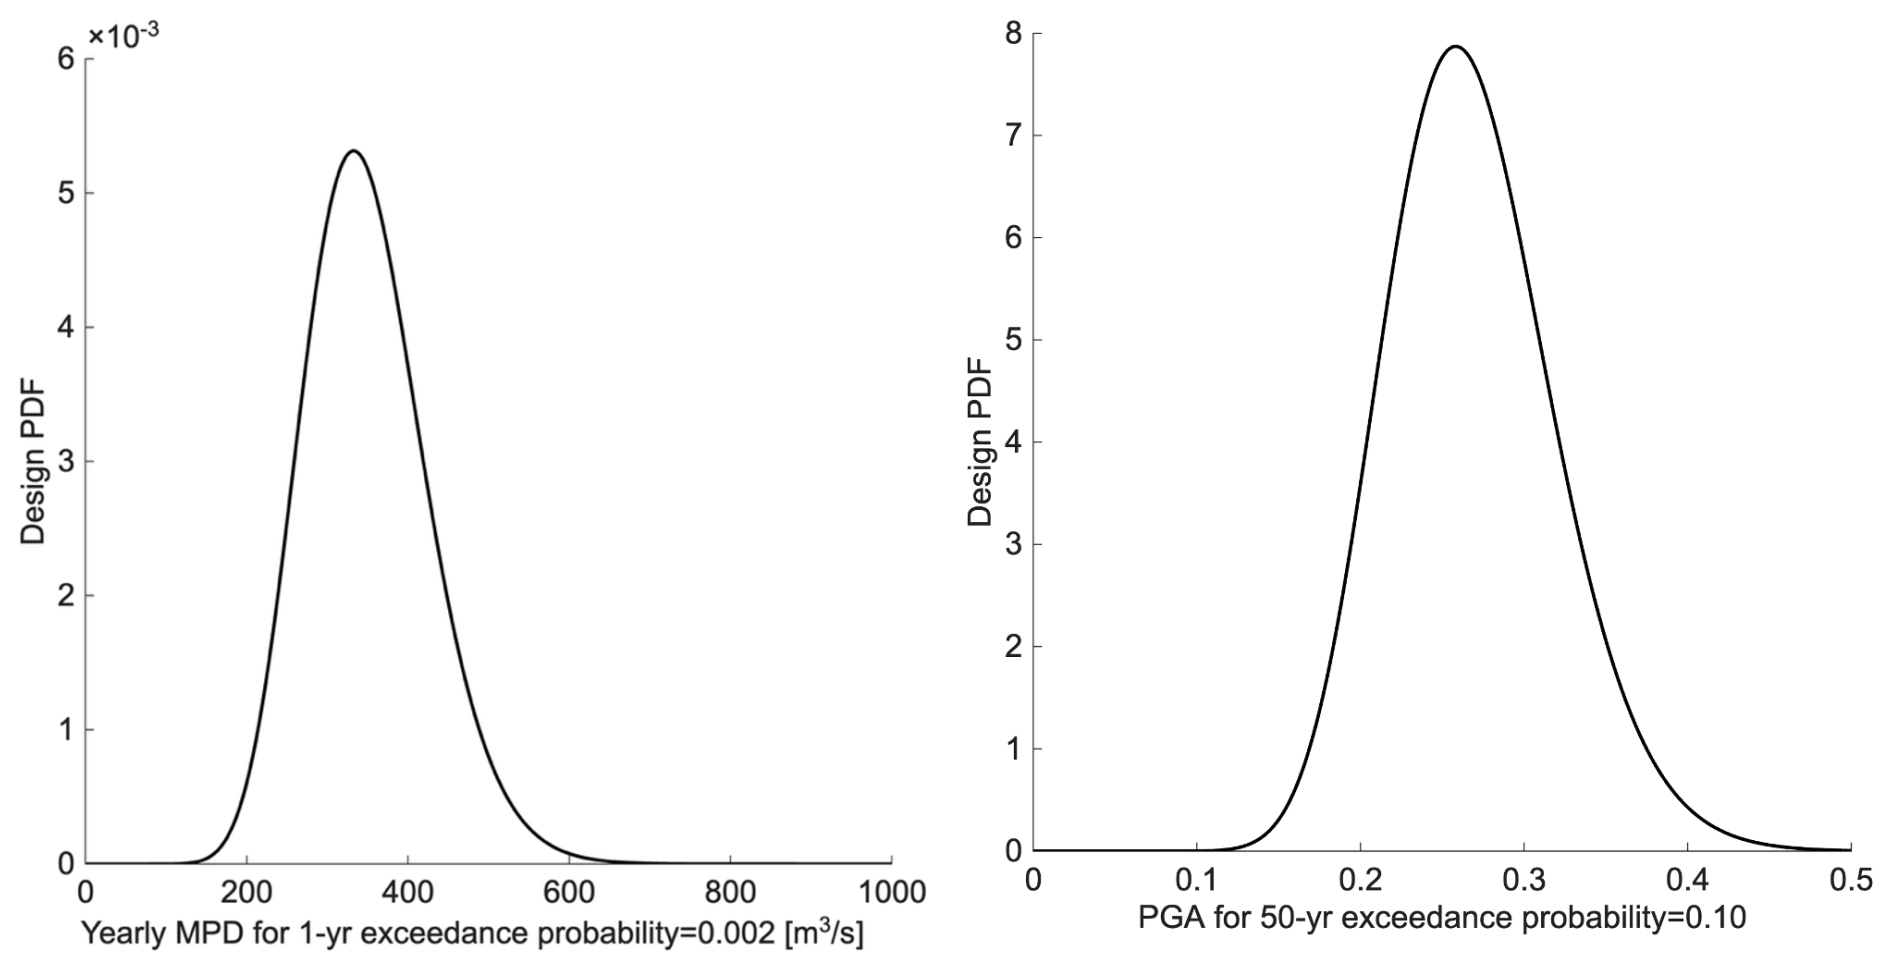
Figure 6Distribution of the design hazard intensity values for two cases. Left panel: Gamma distribution obtained from the , shown in the left panel of Fig. 3. Right panel: Gamma distribution obtained from the , shown in the right panel of Fig. 3.
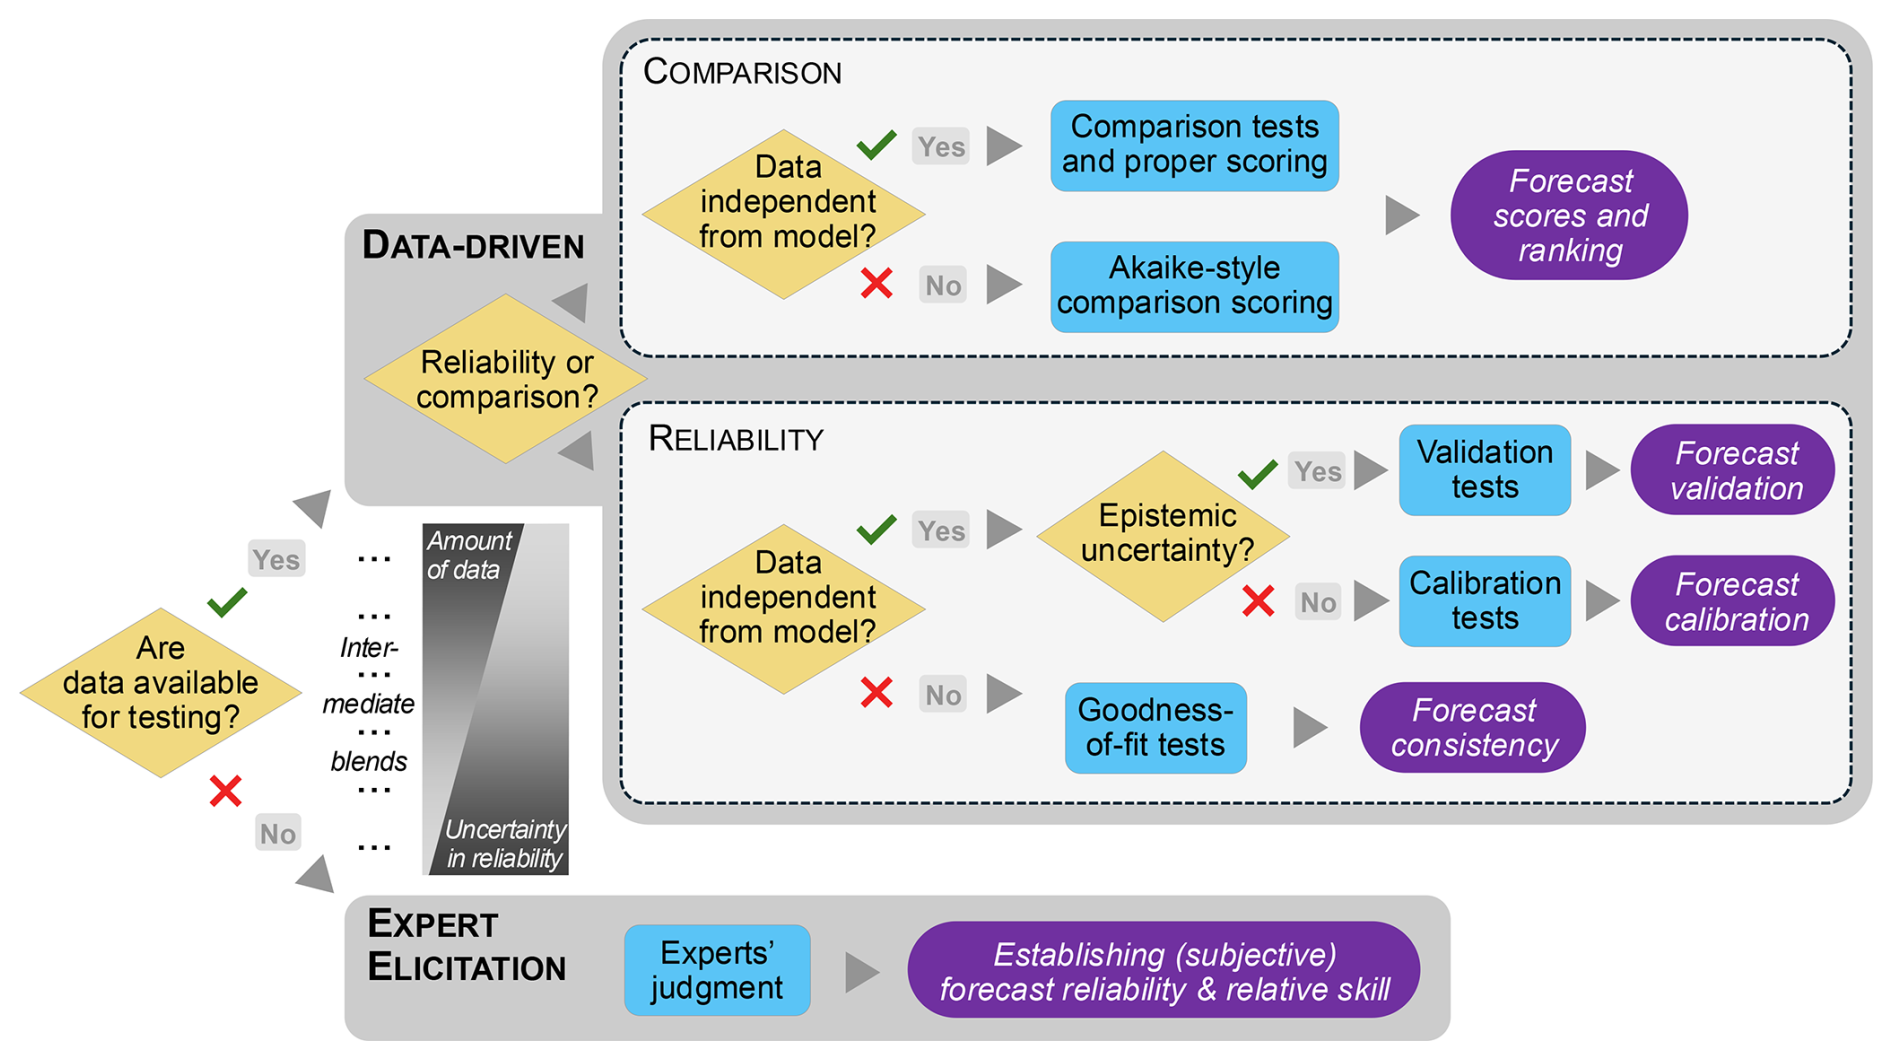
Figure 7A logical flowchart to evaluate forecasts, the last block of our framework shown in Fig. 1.
Needless to say, the least desirable situation arises when few or no observational data are available. For example, a model may be testable only over a limited range of hazard intensities, while observations of the highest, and often societally most relevant, hazard intensities are unavailable (Beven et al., 2018b). In such cases, confidence in the forecast relies primarily on the model's ability to reproduce observations within the available range and on the assumption, supported, for example, by physical understanding and expert judgment, that the model remains valid when extrapolated beyond the observed domain. In even more challenging situations, the available observations may be insufficient to perform any formal empirical testing. In these cases, expert judgment plays a fundamental role in assessing whether a given FD or FD-ensemble adequately represents the range of scientifically plausible interpretations relevant to the societal application under consideration (see the lower panel of Fig. 7). Expert elicitation may also be used to assign relative weights to alternative FDs when there is no justification for considering all of them equally plausible (Beven et al., 2018b; Selva et al., 2024). There are also intermediate cases where available data are insufficient for strong tests or were used to build the forecasting model (see box with gradients in Fig. 7); here expert judgment remains essential to interpret and contextualize the results of formal evaluations (Meletti et al., 2021).
We do not purposedly use the term “consensus”, which is widely used in many situations, because it does not have a univocal definition. For instance, in some cases, consensus represents a convergence of evidence or expert opinion toward the same assessment. Conversely, the Italian Civil Protection Code (Italian Republic, 2018) states that the scientific community “participates in the National [Civil Protection] Service by integrating in civil protection activities […] knowledge and products deriving from research and innovation activities, also already available, which have reached a level of maturity and consensus recognised by the scientific community according to the practices in use”. Under this wide perspective, consensus could also be understood as acceptance of procedures and models, not necessarily as agreement on their results (i.e. similarity).
One final point concerns the role of experts' judgment and subjectivity assessment in science (for a detailed discussion see, e.g. Marzocchi and Jordan, 2014; Hanea et al., 2021). The common view that science is inherently objective, whereas subjective judgments fall outside the scientific domain, is misleading. Scientific practice inevitably involves subjective choices and judgments. What ultimately matters is whether probabilistic models and their forecasts (FDs) can be subjected, at least in principle, to rigorous empirical tests of reliability (e.g. validation tests), regardless of the degree of subjectivity involved in their construction.
Paraphrasing Viscusi (1992), communicating uncertainties has never been a popular undertaking. This is particularly true for scientists and decision-makers. Beyond individual facility with public speaking or media, most of them receive little formal training in communication (Besley and Tanner, 2011). To address this, the RETURN project brought in communication experts to share good practices: a total of 32 professionals involved, in various capacities, in risk communication activities were interviewed. Participants operate in different organizational settings, including municipalities, Civil Protection agencies, and public research institutions, or work as freelance consultants. Their perspectives were collected through in-depth qualitative interviews conducted between December 2024–September 2025. The testimonies made it possible to reconstruct established practices, emerging approaches, and ways of conceptualizing and managing complex issues such as uncertainty. Large differences in terminology and skillsets suggest we are still in a pioneering phase of this critical component of effective risk management. No single, universally accepted risk-communication strategy exists, but several practical constraints can help guide efforts.
When discussing communication, “uncertainty” is often overly broad. Here it covers both uncertainty in hazard and risk estimates (probabilities) and uncertainty intrinsic to decision making (Dolce and Di Bucci, 2015): by definition, decision making under uncertainty implies that outcomes cannot always be “right” (van der Bles et al., 2019). Frequently these elements must be combined into a single actionable message (Mileti and Sorensen, 1990). Effective communication therefore must convey the intrinsic scientific aspects of the hazard/risk estimates and the sociopolitical dimensions that shape interpretation, such as cultural values, political interests, decision processes, media, and public discourse (Covello and Sandman, 2001; Slovic, 2000). Consequently, the communication must be not only clear and effective, but also responsible: presented so that it neither misleads nor needlessly alarms, thus enabling informed decisions. To do this, communication should account for variables such as the target audience (with its knowledge level, values, concerns), the decision-making and temporal context, the risks and consequences involved, transparency about knowledge limits, and the choice of channels and language. To achieve this, it must consider all these variables (Sellnow et al., 2017; Sellnow and Sellnow, 2019), as they impact the adoption of protective behaviors, trust in institutions, and community resilience (Paton, 2008).
One major challenge in communicating uncertainty is the generally low level of probabilistic literacy among many stakeholders, including the public, especially concerning the meaning and implications of low-probability, high-impact events. Consequently, communicators must be conscious of their role and capacity: statements made as private individuals, experts, institutional advisers, public officers, or researchers will be interpreted and weighted differently. These roles determine communication objectives, appropriate tools, and accompanying responsibilities. Media channels also differ in how they shape reception, being embedded in everyday cultural routines and practices (Moores, 1993). Thus, tailoring the message to the intended audience is essential. For example, an administration such as the Italian Civil Protection Department must manage both external communication (to the public and press) and internal technical communication within civil-protection structures and the political level. Effective external communication depends on enabling journalists to report accurately, e.g. by providing a dedicated press area during emergencies, releasing data openly, and offering training on scientific uncertainty.
For each responsible institution (e.g. civil protection agencies), communicating with the public entails challenges of expectations and language (Fischhoff, 1995; Warren and Duckett, 2026). Expectations are problematic, because detail is often mistaken for precision: non-experts may demand reliable microscale forecasts and then dismiss as wrong those forecasts that are accurate only at larger scales. Moreover, non-experts (and sometimes scientists) tend to view science deterministically, assuming that researchers will eventually be able to predict every event exactly (Wynne, 1992; Pidgeon and Fischhoff, 2011). Language is also an issue, because science often redefines common words into precise technical meanings that are lost when used externally (for example: extreme or exceptional events, error/mistake, tsunami, moderate alert – and well: uncertainty). Simplifications are sometimes necessary but also risk being misinterpreted: using traffic-light colors to convey risk seems intuitive but can produce over- or underestimation and implies sharp differences for assessments just above or below a threshold. Finally, taking care of social-psychological factors (including bonds with the specific place), as well as preventive ad hoc experiences, are ways to improve uncertainty perception, knowledge and coping by inhabitants (Ariccio et al., 2020, 2021; Stancu et al., 2020, 2025; Villagra, et al., 2021, 2023).
Empirical studies involving professionals of scientific communication identify two approaches to public communication: an “operational” approach based on data, and a “narrative” approach based on storytelling. The former offers strategies to make numbers and data digestible to the interested stakeholder, focusing on the quantitative dimension of science (Morss et al., 2008; Reyna and Brainerd, 2008). The latter uses narrative forms that people naturally use to process information. Narratives can be effective even for communicating very small probabilities associated with important risks: research shows that the understanding of risk improves when numbers are accompanied by familiar, negatively connotated examples or stories (for instance, comparing the probability of an event to the chance that a child has a nut allergy: e.g. Savadori et al., 2022). However, narratives are also risky, because they balance making raw data tangible and comprehensible against conveying subjective or value-laden content that can turn messaging into persuasion or rhetoric (Sellnow and Seeger, 2021).
Communication within a civil protection agency can be aided by the fact that many staff members have a technical-scientific background, but at the same time it is challenging because of their role of link between science and decision-making. Beyond the so-called “strategic” uncertainty that refers to uncertainty about how different actors will behave – for example, scientists may not provide timely scientific information, or politicians may not provide their threshold of acceptable risk (Di Bucci and Savadori, 2018) – the greatest challenge is certainly to define rationale and defensible mitigation actions based on the available scientific information, including its uncertainties. Decision-making often leaves no room for probabilistic nuance, because it operates in a Boolean logic: the output is a definitive decision, yes or no (March, 1994; Renn, 2008). Moving from uncertain scientific results to a definite policy is delicate and requires not only an adequate understanding on the uncertainty, but also sufficient awareness of the competences required, as well as of the responsibilities and legitimacy of the actors involved. In some cases, scientists have clarified their role within the risk-reduction process. For example, Jordan et al. (2014) advocate a hazard–risk separation principle: scientists provide hazard forecasts, sometimes including risk analysis and scenarios impact, while decision-makers set decision-making thresholds, based also on considerations other than hazard and risk modelling, such as feasibility, costs, benefits, and social priorities and potential impact of decisions (Dolce and Di Bucci, 2022). Remarkably, despite its apparent appeal, this principle is often neglected (Marzocchi et al., 2021a).
Tsunami warning systems illustrate this important aspect (Selva et al., 2021). Traditionally, in the NEAM (North-East Atlantic, Mediterranean and connected seas) region, alerts for seismically-induced tsunamis are issued using a decision matrix that assigns alert levels based on the expected characteristics of the triggering earthquake. In other areas of the world, other deterministic approaches are adopted, like best-guess scenarios or envelop models. These systems leave no room for quantifying the inevitable uncertainties, especially given the speed required for alerts in case of small basins, such as the compact Mediterranean Sea and its challenging crustal seismicity. Traditional deterministic methods like decision matrices manage uncertainty by adopting conservative choices, which are related to a certain accuracy and rates of false positives and false negatives; these rates reflect acceptable levels of risk and trade-offs between false alarms and missed alerts, but these trade-offs are often not the result of an explicit choice about the values and political responsibilities at stake. By contrast, a system that uses, for example, a weighted mixture of distributions to provide a probability distribution over possible events can link alert levels to percentiles of that distribution (e.g. Todini, 2017). Choosing percentiles allows calibrating the risk level that triggers an alert and controlling the trade-offs between false positives and false negatives. Representing uncertainty thus makes the value judgments that are the responsibility of decision-makers explicit: when uncertainty is not communicated, choices about acceptable probability thresholds, political by nature, remain implicit.
Another specific feature of uncertainty communication related to risk is whether this communication occurs in ordinary or emergency contexts. Emergencies leave less time for analytical communication and nuanced weighing of uncertainties, yet these are precisely the circumstances when scientific statements may have the greatest impact, i.e. both ignoring and exaggerating uncertainties can have larger consequences (Seeger, 2006; van der Bles et al., 2020). Emergencies also draw greater public attention to science and can often be an opportunity to improve understanding of phenomena and of their uncertainties (Birkland, 1997).
Finally, some emergencies last long enough to allow time for testing the used models; in such cases, ignoring uncertainty can erode public trust in science. In the short term, there is no time to weigh and communicate all uncertainties; in these cases, to avoid the pressure to neglect uncertainties to make messages and actions more comprehensible, the use of protocols facilitates a rapid reaction to the impending peril. These protocols should be defined in advance to leave time for a proper management of substantial uncertainties in the decision-making and communication process. In this way, protocols represent a transparent audit trail, which reduces the degree of subjective opinion in scientific communication with civil authorities and general public. Should a risk mitigation action turn out to be “wrong”, this audit trail would provide a direct means for tracking the decision process in any subsequent formal enquiry. Conveying this message effectively also requires a public education plan.
This paper has summarized the discussion of a multi-disciplinary research group within the RETURN project. The group focused on the importance of disclosing, representing, and communicating all uncertainties in forecasting natural hazards and risks. This perspective favors scientific aspects, not because they matter more than communication, but because the researchers in this group prioritize them as the underlying research is more quantitative and formalised.
Our discussions revealed that different hazard domains face common challenges, regardless of the forecasting models used. Here we summarize our suggestions for overcoming these challenges:
-
Probabilistic forecasting is the common language for representing uncertainties and bridging science and society. The most impactful events, regardless of their nature, can only be tracked probabilistically over time horizons relevant for rational risk reduction and management measures.
-
An interdisciplinary collaboration requires establishing clear, common terminology and a hierarchy of uncertainties. With standardized terms, scientists from different domains, as well as decision-makers, can understand each other.
-
A single forecast distribution is appropriate only when the underlying physical processes are adequately represented by the model without relying on excessive or overly simplified approximations, or when abundant, high-quality data are available for the hazard under consideration. Otherwise, a complete forecast should be based on an ensemble of forecast distributions (FD-ensemble, sometimes referred to as a multi-model approach) that quantifies epistemic uncertainty and delineates the range within which the true forecast distribution is likely to lie. Properly handling such an FD-ensemble requires a unified probabilistic framework.
-
Operational forecast credibility should, where feasible, be assessed also through scientific evaluation. This is carried out in many different ways depending from the problem at hand and remains a challenging task. We need a common protocol for evaluating complete forecasts that addresses the criticisms raised to date. Figure 7 sketches a starting point for achieving this goal.
-
Even the best hazard or risk assessment might be useless if it is not properly communicated to the stakeholders, users, and decision-makers. This last mile requires a significant involvement of experts in social sciences, education and communication to guarantee a transparent and appropriate release of forecasts and their uncertainties, and that they are properly understood.
-
Pre-defined protocols are a fundamental tool for justifying disaster risk management actions in which roles, responsibilities, and communication formats are clearly defined. This effort requires strong transdisciplinary collaboration among scientists, decision-makers, communication experts, and stakeholders.
By acknowledging all these aspects, we can achieve our vision of a unified framework for hazard/risk forecasting across all studied phenomena; it will treat hazards across domains in a consistent, probabilistic manner, unifying hazard and risk assessment, model evaluation, and communication.
-
Calibration of a forecast. Assessment of the comparison between a single representative FD (e.g. a mixture distribution or another combined forecast distribution) and independent observations (see Fig. 6).
-
Consistency of a forecast. Assessment of the consistency between a single representative FD (e.g. a mixture distribution or another combined forecast distribution) and observations that were used to build the FD (see Fig. 6).
-
Complete forecast. A forecast that explicitly represents and keeps distinct all recognized uncertainties. Quantitatively, it is the collection of the different EEDs conditioned on each hazard intensity x0.
-
Consensus. In line with the definition used by the Italian Civil Protection Department, the term indicates acceptance by a large majority of the relevant scientific community of knowledge and products derived from research and innovation. For the topics of interest here, it can be referred to one or more forecasting models and/or of a procedure for their experimental verification.
-
Credibility of a model. The model is deemed credible by the decision-making body, which retains sole responsibility for the credibility criteria and bears any political liability, responsibilities that may extend beyond the remit of hazard modelers.
-
Ensemble. An ensemble denotes, in a broad sense, a collection of alternative realizations or forecasting distributions generated to characterize a specific kind of uncertainty. For instance, an ensemble may consist of realizations obtained by perturbing the initial conditions of a given model (to estimate the natural variability of the model), or of forecast distributions (FDs) obtained from different parameterizations or alternative model formulations (to estimate the epistemic uncertainty).
-
Epistemic uncertainty. Uncertainty about the true FD describing the data-generating process due to lack of knowledge, data, or limitations of its numerical representation. Such uncertainties may concern uncertainties in the parameter values of a single model, or in the parametric form of the model.
-
Forecast. A probabilistic statement of the occurrence of a variable of interest (hazard intensity) related to one or more natural events within a defined space–time window. For example, the variable of interest may be ground acceleration caused by an earthquake, ash thickness produced by a volcanic eruption, wind speed, rainfall amount.
-
Forecast distribution (FD). A survival distribution, f(x), showing the exceedance probability for each hazard intensity value x. Sometimes, the survival distribution is also named CCDF, i.e. complementary cumulative distribution function, which is often named hazard curve in many fields.
-
FD-ensemble. A set of FDs, which represents alternative models reflecting different working hypotheses or numerical approximations.
-
Forecast reliability. The broad term for any statistical test that verifies compatibility of the forecast with observations; it is discriminated into forecast consistency, calibration, and validation (see Fig. 6).
-
Hazard. Event or process with the potential to cause harm to people, property, infrastructure, or the environment.
-
Hazard forecasts/hazard analysis. Forecasts of a certain potential dangerous event or process (e.g. storm, ground shaking caused by earthquakes, volcanic ash fall, climate change) over a specific spatiotemporal domain.
-
Hazard intensity. A continuous or discrete random variable that describes one aspect of the hazard that we aim to describe, e.g. a specific ground acceleration, the velocity of the wind, the intensity of the rain, the tephra-fall thickness.
-
Model. A mathematical, statistical, or computational physics-based representation of a data-generating process that maps available information (e.g. observations, initial conditions, boundary conditions, or explanatory variables) into forecasts of a specific hazard intensity of interest.
-
Model set up. The statistical procedure to select the model parameters (as single values or as intervals) based on observed data.
-
Prediction. Dichotomous (Boolean yes or no) prediction about the occurrence of a particular event in a specific space-time-magnitude domain. An event can be the occurrence of an earthquake of a given magnitude, a volcanic eruption, a landslide of a given volume, a tsunami wave of a certain height, a rainfall event with a particular intensity, etc. Predictions can be accompanied by measures of uncertainty (false alarm rates, missed event rates, etc.). A (probabilistic) forecast can always be turned into a prediction once a threshold is assigned to the hazard intensity; the reverse is not possible.
-
Risk analysis. A forecast of a specific loss of interest in a well-defined space-time window. The variable of interest may be the number of people killed or displaced, or an economic loss, etc.
-
Validation. Like forecast calibration, but for complete forecasts that keep separated aleatory variability and epistemic uncertainty.
The datasets used in this paper were employed solely for plotting purposes and were not used for any new calculations or analyses. The datasets are publicly available through the webpages cited in the paper.
RETURN-uncertainty task force: Alberoni Pier Paolo (Regional Environment Protection Agency, ARPAE, Italy), Antonelli Manuela (Politecnico di Milano, Italy), Berti Matteo (University of Bologna, Italy), Bonaiuto Marino (University of La Sapienza, Roma, Italy), Calcaterra Domenico (University of Napoli, Federico II, Italy), Capano Giliberto (University of Bologna, Italy), Cantoni Beatrice (Politecnico di Milano, Italy), Castelli Fabio (University of Firenze, Italy), Ceola Serena (University of Bologna, Italy), Comunello Francesca (University of La Sapienza, Roma, Italy), Cossarini Gianpiero (National Institute of Oceanography and Applied Geophysics, OGS, Italy), Costa Giancarlo (Politecnico di Milano, Italy), Crespi Alice (Eurac Research, Italy), Dellino Pierfrancesco (University of Bari, Italy), Devò Pietro (University of Padova, Italy), D'Agata Eugenio (Italian Civil Protection Department, Italy), Di Bucci Daniela (Italian Civil Protection Department, Italy), Diomede Tommaso (Regional Environment Protection Agency, ARPAE, Italy), Dolce Mauro (University of Napoli, Federico II, Italy), Esposito Carlo (University of Roma, La Sapienza, Italy), Freni Gabriele (University of Enna, KORE, Italy), Ghaderpour Ebrahim (University of Roma, La Sapienza, Italy), Hardenberg Jost (Politecnico Torino, Italy), Herrmann Marcus (University of Napoli, Federico II, Italy), Lagomarsino Sergio (University of Genova, Italy), Lazzari Paolo (National Institute of Oceanography and Applied Geophysics, OGS, Italy), Limongelli Mariagiuseppina (Politecnico di Milano, Italy), Massa Alessandra (University of Roma, La Sapienza, Italy), Milani Alessandro (University of Roma, La Sapienza, Italy), Morucci Sara (Italian Institute for Environmental Protection and Research, ISPRA, Italy), Neri Mattia (University of Bologna, Italy), Ongaro Malvina (Politecnico di Milano, Italy), Ponte Monica (Italferr, Ferrovie dello Stato Italiane, Italy), Ranieri Maria (University of Firenze, Italy), Reale Marco (National Institute of Oceanography and Applied Geophysics, OGS, Italy), Ricci Feliziani Fabio (Ferrovie dello Stato Italiane, Italy), Selva Jacopo (University of Napoli, Federico II, Italy), Solidoro Cosimo (National Institute of Oceanography and Applied Geophysics, OGS, Italy), Sulpizio Roberto (University of Bari, Italy), Viglione Alberto (Politecnico Torino, Italy), Xie Mei (Southwest Jiaotong University, Chengdu, China, Italy), Zuccaro Giulio (Plinius, Napoli, Italy).
WM and AM led the conceptualization. WM performed the formal analysis and wrote the original draft. AM supervised the work. The task force helped shape the ideas and contributed to reviewing and editing the manuscript.
The contact author has declared that none of the authors has any competing interests.
Publisher's note: Copernicus Publications remains neutral with regard to jurisdictional claims made in the text, published maps, institutional affiliations, or any other geographical representation in this paper. The authors bear the ultimate responsibility for providing appropriate place names. Views expressed in the text are those of the authors and do not necessarily reflect the views of the publisher.
The authors thank Dr. Francesca Pianosi and an anonymous reviewer for their helpful comments, which improved the quality and clarity of the manuscript. This study was carried out within the RETURN Extended Partnership and received funding from the European Union Next-GenerationEU (National Recovery and Resilience Plan – NRRP, Mission 4, Component 2, Investment 1.3 – D.D. 1243 2/8/2022, PE0000005).
The contents of this paper represent the authors' ideas and do not necessarily correspond to the official opinion and policies of the Italian Civil Protection Department.
This study was carried out within the RETURN Extended Partnership and received funding from the European Union Next-GenerationEU (National Recovery and Resilience Plan – NRRP, Mission 4, Component 2, Investment 1.3 – D.D. 1243 2/8/2022, PE0000005).
This paper was edited by Solmaz Mohadjer and reviewed by Francesca Pianosi and one anonymous referee.
AAAS (American Association for the Advancement of Science): Science for All Americans: A Project 2061 Report on Literacy Goals in Science, Mathematics, and Technology, American Association for the Advancement of Science, Washington, DC, ISBN 0-87168-341-5, 1989.
Abrahamson, N. A. and Bommer, J. J.: Probability and uncertainty in seismic hazard analysis, Earthq. Spectra, 21, 603–607, 2005.
Ake, J., Munson, C., Stamatakos, J., Juckett, M., Coppersmith, K., and Bommer, J.: Updated Implementation Guidelines for SSHAC Hazard Studies, Office of Nuclear Regulatory Research, U.S. Nuclear Regulatory Commission, Washington, DC, 145 pp., ADAMS Accession No. ML18282A082, 2018.
Ariccio, S., Petruccelli, I., Ganucci Cancellieri, U., Quintana, C., Villagra, P., and Bonaiuto, M.: Loving, leaving, living: evacuation site place attachment predicts natural hazard coping behavior, J. Environ. Psychol., 70, 101431, https://doi.org/10.1016/j.jenvp.2020.101431, 2020.
Ariccio, S., Lema-Blanco, I., and Bonaiuto, M.: Place attachment satisfies psychological needs in the context of environmental risk coping: experimental evidence of a link between self-determination theory and person-place relationship effects, J. Environ. Psychol., 78, 101716, https://doi.org/10.1016/j.jenvp.2021.101716, 2021.
Aspinall, W. P. and Cooke, R. M.: Quantifying scientific uncertainty from expert judgement elicitation, in: Risk and Uncertainty Assessment for Natural Hazards, edited by: Rougier, J., Sparks, S., and Hill, L. J., Cambridge University Press, Cambridge, 64–99, https://doi.org/10.1017/CBO9781139047562.005, 2013.
Aven, T. and Renn, O.: An evaluation of the treatment of risk and uncertainties in the IPCC reports on climate change, Risk Anal., 35, https://doi.org/10.1111/risa.12298, 2015.
Baker, J. W., Bradley, B. A., and Stafford, P. J.: Seismic Hazard and Risk Analysis, Cambridge University Press, Cambridge, UK, https://doi.org/10.1017/9781108425056, 2021.
Berger, J. O. and Smith, L. A.: On the statistical formalism of uncertainty quantification, Annu. Rev. Stat. Appl., 6, 433–460, https://doi.org/10.1146/annurev-statistics-030718-105232, 2019.
Besley, J. C. and Tanner, A. H.: What science communication scholars think about training scientists to communicate, Sci. Commun., 33, 239–263, https://doi.org/10.1177/1075547010386972, 2011.
Beven, K. J., Almeida, S., Aspinall, W. P., Bates, P. D., Blazkova, S., Borgomeo, E., Freer, J., Goda, K., Hall, J. W., Phillips, J. C., Simpson, M., Smith, P. J., Stephenson, D. B., Wagener, T., Watson, M., and Wilkins, K. L.: Epistemic uncertainties and natural hazard risk assessment – Part 1: A review of different natural hazard areas, Nat. Hazards Earth Syst. Sci., 18, 2741–2768, https://doi.org/10.5194/nhess-18-2741-2018, 2018a.
Beven, K. J., Aspinall, W. P., Bates, P. D., Borgomeo, E., Goda, K., Hall, J. W., Page, T., Phillips, J. C., Simpson, M., Smith, P. J., Wagener, T., and Watson, M.: Epistemic uncertainties and natural hazard risk assessment – Part 2: What should constitute good practice?, Nat. Hazards Earth Syst. Sci., 18, 2769–2783, https://doi.org/10.5194/nhess-18-2769-2018, 2018b.
Birkland, T. A.: After Disaster: Agenda Setting, Public Policy, and Focusing Events, Georgetown University Press, Washington, DC, ISBN 978-0-87840-653-1, 1997.
Box, G. E. P.: Science and statistics, J. Am. Stat. Assoc., 71, 791–799, https://doi.org/10.1080/01621459.1976.10480949, 1976.
Box, G. E. P. and Draper, N. R.: Empirical Model-Building and Response Surfaces, John Wiley and Sons, New York, USA, ISBN 978-0-471-81033-9, 1987.
Chow, V. T., Maidment, D. R., and Mays, L. W.: Applied Hydrology, McGraw-Hill, New York, ISBN 978-0-07-010810-3, 1988.
Coolen, F. P. A., Troffaes, M. C. M., and Augustin, T.: Imprecise probability, in: International Encyclopedia of Statistical Science, Springer, Berlin, Heidelberg, 645–648, https://doi.org/10.1007/978-3-642-04898-2_296, 2011.
Cossarini, G., Feudale, L., Teruzzi, A., Bolzon, G., Coidessa, G., Solidoro, C., Di Biagio, V., Amadio, C., Lazzari, P., Brosich, A., and Salon, S.: High-resolution reanalysis of the Mediterranean Sea biogeochemistry (1999–2019), Front. Mar. Sci., 8, 741486, https://doi.org/10.3389/fmars.2021.741486, 2021.
Covello, V. T. and Sandman, P. M.: Risk communication: evolution and revolution, in: Solutions to an Environment in Peril, edited by: Wolbarst, A., Johns Hopkins University Press, Baltimore, MD, 164–178, ISBN 978-0-8018-6594-7, 2001.
de Burgh-Day, C. O. and Leeuwenburg, T.: Machine learning for numerical weather and climate modelling: a review, Geosci. Model Dev., 16, 6433–6477, https://doi.org/10.5194/gmd-16-6433-2023, 2023.
Der Kiureghian, A. and Ditlevsen, O.: Aleatory or epistemic? Does it matter?, Struct. Saf., 31, 105–112, 2009.
Di Bucci, D. and Savadori, L.: Defining the acceptable level of risk for civil protection purposes: a behavioral perspective on the decision process, Nat. Hazards, 90, 293–324, https://doi.org/10.1007/s11069-017-3046-5, 2018.
Dolce, M. and Di Bucci, D.: Risk management: Roles and responsibilities in the decision-making process, in: Geoethics: Ethical Challenges and Case Studies in Earth Sciences, edited by: Wyss, M. and Peppoloni, S., Elsevier, 211–221, https://doi.org/10.1016/B978-0-12-799935-7.00018-6, 2015.
Dolce, M. and Di Bucci, D.: Building an effective collaboration between civil protection decision-makers and scientists for DRR: the Italian experience, Contributing Paper to the UN Global Assessment Report on Disaster Risk Reduction (GAR) 2022, UNDRR, 22 pp., https://www.undrr.org/publication/building-effective-collaboration-between-civil-protection-decision-makers-and (last access: 5 October 2026), 2022.
Draper, D., Hodges, J. S., Mallows, C. L., and Pregibon, D.: Exchangeability and data analysis, J. Roy. Stat. Soc. A Sta., 156, 9–37, https://doi.org/10.2307/2982858, 1993.
Eldred, M. S., Swiler, L. P., and Tang, G.: Mixed aleatory–epistemic uncertainty quantification with stochastic expansions and optimization-based interval estimation, Reliab. Eng. Syst. Safe., 96, 1092–1113, 2011.
Fischhoff, B.: Risk perception and communication unplugged: twenty years of process, Risk Anal., 15, 137–145, https://doi.org/10.1111/j.1539-6924.1995.tb00308.x, 1995.
Gaume, E.: Flood frequency analysis: the Bayesian choice, WIREs Water, 5, e1290, https://doi.org/10.1002/wat2.1290, 2018.
Gelman, A.: Comment: Bayesian Checking of the Second Levels of Hierarchical Models, Stat. Sci., 22, 349–352, https://doi.org/10.1214/07-STS235A, 2007.
Gelman, A. and Hennig, C.: Beyond subjective and objective in statistics, J. R. Stat. Soc. A Stat., 180, 967–1033, 2017.
Gelman, A. and Shalizi, C. R.: Philosophy and the practice of Bayesian statistics, Brit. J. Math. Stat. Psy., 66, 8–38, 2013.
Gerstenberger, M. C., Bora, S., Bradley, B. A., DiCaprio, C., Kaiser, A., Manea, E. F., Nicol, A., Rollins, C., Stirling, M. W., Thingbaijam, K. K. S., Van Dissen, R. J., Abbott, E. R., Atkinson, G. M., Chamberlain, C., Christophersen, A., Clark, K., Coffey, G. L., de la Torre, C. A., Ellis, S. M., Fraser, J., Graham, K., Griffin, J., Hamling, I. J., Hill, M. P., Howell, A., Hulsey, A., Hutchinson, J., Iturrieta, P. C., Johnson, K. M., Jurgens, V. O., Kirkman, R., Langridge, R. M., Lee, R. L., Litchfield, N. J., Maurer, J., Milner, K. R., Rastin, S., Rattenbury, M. S., Rhoades, D. A., Ristau, J., Schorlemmer, D., Seebeck, H., Shaw, B. E., Stafford, P. J., Stolte, A. C., Townend, J., Villamor, P., Wallace, L. M., Weatherill, G., Williams, C. A., and Wotherspoon, L. M.: The 2022 Aotearoa New Zealand National Seismic Hazard Model: process, overview, and results, B. Seismol. Soc. Am., 114, 7–36, https://doi.org/10.1785/0120230182, 2024.
Glahn, H. R. and Lowry, D. A.: The use of Model Output Statistics (MOS) in objective weather forecasting, J. Appl. Meteorol., 11, 1202–1211, 1972.
Gneiting, T. and Katzfuss, M.: Probabilistic forecasting, Annu. Rev. Stat. Appl., 1, 125–151, 2014.
Gneiting, T. and Ranjan, R.: Combining predictive distributions, Electron. J. Stat., 7, 1747–1782, https://doi.org/10.1214/13-EJS823, 2013.
Gneiting, T., Raftery, A. E., Westveld III, A. H., and Goldman, T.: Calibrated probabilistic forecasting using ensemble model output statistics and minimum CRPS estimation, Mon. Weather Rev., 133, 1098–1118, 2005.
Gumbel, E. J.: Statistics of Extremes, Columbia University Press, New York, https://doi.org/10.7312/gumb92958, 1958.
Hanea, A. M., Nane, G. F., Bedford, T., and French, S. (Eds.): Expert Judgement in Risk and Decision Analysis, Springer, Cham, Switzerland, https://doi.org/10.1007/978-3-030-46474-5, 2021.
Hansen, P. R., Lunde, A., and Nason, J. M.: The model confidence set, Econometrica, 79, 453–497, 2011.
Herrmann, M. and Marzocchi, W.: Maximizing the forecasting skill of an ensemble model, Geophys. J. Int., 234, 73–87, https://doi.org/10.1093/gji/ggad020, 2023.
Hüllermeier, E. and Waegeman, W.: Aleatoric and epistemic uncertainty in machine learning: an introduction to concepts and methods, Mach. Learn., 110, 457–506, 2021.
IPCC: Climate Change 2021: The Physical Science Basis, Contribution of Working Group I to the Sixth Assessment Report of the Intergovernmental Panel on Climate Change, edited by: Masson-Delmotte, V., Zhai, P., Pirani, A., Connors, S. L., Péan, C., Berger, S., Caud, N., Chen, Y., Goldfarb, L., Gomis, M. I., Huang, M., Leitzell, K., Lonnoy, E., Matthews, J. B. R., Maycock, T. K., Waterfield, T., Yelekçi, O., Yu, R., and Zhou, B., Cambridge University Press, Cambridge, UK and New York, NY, USA, 2391 pp., https://doi.org/10.1017/9781009157896, 2021.
Italian Republic: Legislative Decree No. 1 of 2 January 2018: Codice della protezione civile [Civil Protection Code], Gazzetta Ufficiale della Repubblica Italiana, No. 17, 22 January 2018, available at: Italian Civil Protection Department – Legislative Decree No. 1/2018, 2018.
Janzwood, S.: Confident, likely, or both? The implementation of the uncertainty language framework in IPCC special reports, Climatic Change, 162, 1655–1675, https://doi.org/10.1007/s10584-020-02746-x, 2020.
Jordan, T. H., Chen, Y.-T., Gasparini, P., Madariaga, R., Main, I., Marzocchi, W., Papadopoulos, G., Sobolev, G., Yamaoka, K., and Zschau, J.: Operational earthquake forecasting: state of knowledge and guidelines for utilization, Ann. Geophys., 54, 315–391, https://doi.org/10.4401/ag-5350, 2011.
Jordan, T. H., Marzocchi, W., Michael, A., and Gerstenberger, M.: Operational earthquake forecasting can enhance earthquake preparedness, Seismol. Res. Lett., 85, 955–959, 2014.
Klemeš, V.: Operational testing of hydrological simulation models, Hydrolog. Sci. J., 31, 13–24, https://doi.org/10.1080/02626668609491024, 1986.
Kolmogorov, A. N.: Foundations of the Theory of Probability (translated by Morrison, N.), Chelsea Publishing, Company, New York, USA, 1950, https://doi.org/10.5281/zenodo.7883088, 1950.
Koutsoyiannis, D. and Montanari, A.: Bluecat: A local uncertainty estimator for deterministic simulations and predictions, Water Resour. Res., 58, e2021WR031215, https://doi.org/10.1029/2021WR031215, 2022.
Krzysztofowicz, R.: The case for probabilistic forecasting in hydrology, J. Hydrol., 249, 2–9, https://doi.org/10.1016/S0022-1694(01)00420-6, 2001.
Laio, F. and Tamea, S.: Verification tools for probabilistic forecasts of continuous hydrological variables, Hydrol. Earth Syst. Sci., 11, 1267–1277, https://doi.org/10.5194/hess-11-1267-2007, 2007.
Li, L., Carver, R., Lopez-Gomez, I., Sha, F., and Anderson, J.: SEEDS: Emulation of Weather Forecast Ensembles with Diffusion Models, arXiv [preprint], https://doi.org/10.48550/arXiv.2306.14066, 2023.
Lindley, D. V.: The philosophy of statistics, Statistician, 49, 293–337, https://doi.org/10.1111/1467-9884.00238, 2000.
Liou, I. and Abrahamson, N.: Framework for aleatory variability and epistemic uncertainty for the ground-motion characterization based on the level of simplification, B. Seismol. Soc. Am., 115, 296–314, https://doi.org/10.1785/0120240141, 2024.
Logan, D. C.: Known knowns, known unknowns and unknown unknowns and the propagation of scientific enquiry, J. Exp. Bot., 60, 712–714, 2009.
March, J. G.: A Primer on Decision Making: How Decisions Happen, Free Press, New York, USA, ISBN 978-0-02-920035-3, 1994.
Marinacci, M.: Model uncertainty, J. Eur. Econ. Assoc., 13, 998–1076, https://doi.org/10.1111/jeea.12164, 2015.
Marzocchi, W. and Jordan, T. H.: Testing for ontological errors in probabilistic forecasting models of natural systems, P. Natl. Acad. Sci. USA, 111, 11973–11978, 2014.
Marzocchi, W. and Jordan, T. H.: A unified probabilistic framework for seismic hazard analysis, Bull. Seismol. Soc. Am., 107, 2738–2744, https://doi.org/10.1785/0120170008, 2017.
Marzocchi, W. and Jordan, T. H.: Experimental concepts for testing probabilistic earthquake forecasting and seismic hazard models, Geophys. J. Int., 215, 780–798, 2018.
Marzocchi, W., Zechar, J. D., and Jordan, T. H.: Bayesian forecast evaluation and ensemble earthquake forecasting, B. Seismol. Soc. Am., 102, 2574–2584, https://doi.org/10.1785/0120110327, 2012.
Marzocchi, W., Papale, P., Sandri, L., and Selva, J.: Reducing the volcanic risk in the frame of the hazard/risk separation principle, in: Forecasting and Planning for Volcanic Hazards, Risks, and Disasters, Vol. 2, Elsevier, Amsterdam, ISBN 978-0-12-818082-2, 545–564, 2021a.
Marzocchi, W., Selva, J., and Jordan, T. H.: A unified probabilistic framework for volcanic hazard and eruption forecasting, Nat. Hazards Earth Syst. Sci., 21, 3509–3517, https://doi.org/10.5194/nhess-21-3509-2021, 2021b.
Meletti, C., Marzocchi, W., D'Amico, V., Lanzano, G., Luzi, L., Martinelli, F., Pace, B., Rovida, A., Taroni, M., and Visini, F.: The new Italian seismic hazard model (MPS19), Ann. Geophys., 64, SE112, https://doi.org/10.4401/ag-8579 2021.
Merz, R. and Blöschl, G.: Flood frequency hydrology: 1. Temporal, spatial, and causal expansion of information, Water Resour. Res., 44, W08432, https://doi.org/10.1029/2007WR006744, 2008.
Merz, B., Basso, S., Fischer, S., Lun, D., Blöschl, G., Merz, R., Guse, B., Viglione, A., Vorogushyn, S., Macdonald, E., Wietzke, L., and Schumann, A.: Understanding heavy tails of flood peak distributions, Water Resour. Res., 58, e2021WR030506, https://doi.org/10.1029/2021WR030506, 2022.
Merz, B., Blöschl, G., Jüpner, R., Kreibich, H., Schröter, K., and Vorogushyn, S.: Invited perspectives: safeguarding the usability and credibility of flood hazard and risk assessments, Nat. Hazards Earth Syst. Sci., 24, 4015–4030, https://doi.org/10.5194/nhess-24-4015-2024, 2024.
Mileti, D. S. and Sorensen, J. H.: Communication of Emergency Public Warnings: A Social Science Perspective and State-of-the-Art Assessment, Oak Ridge National Laboratory, Oak Ridge, TN, TN, Report ORNL-6609, https://doi.org/10.2172/6137387, 1990.
Mondini, A. C., Guzzetti, F., and Melillo, M.: Deep learning forecast of rainfall-induced shallow landslides, Nat. Commun., 14, 2466, https://doi.org/10.1038/s41467-023-38135-y, 2023.
Montanari, A. and Koutsoyiannis, D.: Uncertainty estimation for environmental multimodel predictions: the BLUECAT approach and software, Environ. Modell. Softw., 188, 106419, https://doi.org/10.1016/j.envsoft.2025.106419, 2025.
Moores, S.: Interpreting Audiences: The Ethnography of Media Consumption, SAGE Publications, London, UK, ISBN 978-0-8039-8446-2, 1993.
Morss, R. E., Demuth, J. L., and Lazo, J. K.: Communicating uncertainty in weather forecasts: a survey of the US public, Weather Forecast., 23, 974–991, 2008.
Mosavi, A., Ozturk, P., and Chau, K. W.: Flood prediction using machine learning models: literature review, Water-Sui., 10, 1536, https://doi.org/10.3390/w10111536, 2018.
Oberkampf, W. L., Helton, J. C., Joslyn, C. A., Wojtkiewicz, S. F., and Ferson, S.: Challenge problems: uncertainty in system response given uncertain parameters, Reliab. Eng. Syst. Safe., 85, 11–19, 2004.
Ogata, Y.: Statistical models for earthquake occurrences and residual analysis for point processes, J. Am. Stat. Assoc., 83, 9–27, 1988.
O'Hagan, A.: Eliciting expert beliefs in substantial practical applications, J. Roy. Stat. Soc. D-Sta., 47, 21–35, https://doi.org/10.1111/1467-9884.00114, 1998.
Okoli, K., Breinl, K., Brandimarte, L., Botto, A., Volpi, E., and Di Baldassarre, G.: Model averaging versus model selection: estimating design floods with uncertain river flow data, Hydrolog. Sci. J., 63, 1913–1926, https://doi.org/10.1080/02626667.2018.1546389, 2018.
Oreskes, N., Shrader-Frechette, K., and Belitz, K.: Verification, validation, and confirmation of numerical models in the Earth sciences, Science, 263, 641–646, 1994.
Papalexiou, S. M. and D. Koutsoyiannis: Battle of extreme value distributions: a global survey on extreme daily rainfall, Water Resour. Res., 49, W07511, https://doi.org/10.1029/2012WR012557, 2013.
Paton, D.: Risk communication and natural hazard mitigation: how trust influences its effectiveness, Int. J. Glob. Environ. Issues, 8, 2–16, https://doi.org/10.1504/IJGENVI.2008.017256, 2008.
Pauli, F. and Parolai, S.: A flexible simulation-based predictive approach to compare hazard and risk models: an example application to seismic hazard, Int. J. Disast. Risk. Re., 132, 105947, https://doi.org/10.1016/j.ijdrr.2025.105947, 2026.
Pianosi, F., Sarailidis, G., Styles, K., Oldham, P., Hutchings, S., Lamb, R., and Wagener, T.: Towards global sensitivity analysis of large-scale flood loss models, Nat. Hazards Earth Syst. Sci., 26, 1727–1743, https://doi.org/10.5194/nhess-26-1727-2026, 2026.
Pidgeon, N. and Fischhoff, B.: The role of social and decision sciences in communicating uncertain climate risks, Nat. Clim. Change, 1, 35–41, https://doi.org/10.1038/nclimate1080, 2011.
Raftery, A. E., Gneiting, T., Balabdaoui, F., and Polakowski, M.: Using Bayesian model averaging to calibrate forecast ensembles, Mon. Weather Rev., 133, 1155–1174, 2005.
Reichstein, M., Camps-Valls, G., Stevens, B., Jung, M., Denzler, J., Carvalhais, N., and Prabhat, F.: Deep learning and process understanding for data-driven Earth system science, Nature, 566, 195–204, https://doi.org/10.1038/s41586-019-0912-1, 2019.
Renn, O.: Risk Governance: Coping with Uncertainty in a Complex World, Routledge, London, UK, https://doi.org/10.4324/9781849772440, 2008.
Reyna, V. F. and Brainerd, C. J.: Numeracy, ratio bias, and denominator neglect in judgments of risk and probability, Learn. Individ. Differ., 18, 89–107, 2008.
Rougier, J. and Beven, K.: Model limitations: the sources and implications of epistemic uncertainty, in: Risk and Uncertainty Assessment for Natural Hazards, edited by: Rougier, J., Sparks, R. S. J., and Hill, L. J., Cambridge University Press, Cambridge, UK, 40–63, https://doi.org/10.1017/CBO9781139047562.004, 2013.
Rubin, D. B.: Bayesianly justifiable and relevant frequency calculations for the applied statistician, Ann. Stat., 12, 1151–1172, 1984.
Seeger, M. W.: Best practices in crisis communication: an expert panel process, J. Appl. Commun. Res., 34, 232–244, 2006.
Savadori, L., Ronzani, P., Sillari, G., Di Bucci, D., and Dolce, M.: Communicating seismic risk information: the effect of risk comparisons on risk perception sensitivity, Front. Commun., 7, 743172, https://doi.org/10.3389/fcomm.2022.743172, 2022.
Scherbaum, F. and Kuehn, N. M.: Logic tree branch weights and probabilities: summing up to one is not enough, Earthq. Spectra, 27, 1237–1251, 2011.
Schorlemmer, D., Werner, M. J., Marzocchi, W., Jordan, T. H., Ogata, Y., Jackson, D. D., Mak, S., Rhoades, D. A., Gerstenberger, M. C., Hirata, N., Liukis, M., Maechling, P., Strader, A., Taroni, M., Wiemer, S., Zechar, J. D., and Zhuang, J.: The Collaboratory for the Study of Earthquake Predictability: achievements and priorities, Seismol. Res. Lett., 89, 1305–1313, 2018.
Sellnow, D. D. and Sellnow, T. L.: The IDEA model for effective instructional risk and crisis communication by emergency managers and other key spokespersons, J. Emerg. Manag., 17, 67–78, 2019.
Sellnow, D. D., Lane, D. R., Sellnow, T. L., and Littlefield, R. S.: The IDEA model as a best practice for effective instructional risk and crisis communication, Commun. Stud., 68, 552–567, https://doi.org/10.1080/10510974.2017.1375535, 2017.
Sellnow, T. L. and Seeger, M. W.: Theorizing Crisis Communication, John Wiley and Sons, Hoboken, NJ, USA, ISBN 978-1-119-61591-0, 2021.
Selva, J., Costa, A., Sandri, L., Macedonio, G., and Marzocchi, W.: Probabilistic short-term volcanic hazard in phases of unrest: a case study for tephra fallout, J. Geophys. Res., 119, 8805–8826, 2014.
Selva, J., Lorito, S., Volpe, M., Romano, F., Tonini, R., Perfetti, P., Bernardi, F., Taroni, M., Scala, A., Babeyko, A., Løvholt, F., Gibbons, S. J., Macías, J., Castro, M. J., González-Vida, J. M., Sánchez-Linares, C., Bayraktar, H. B., Basili, R., Maesano, F. E., Tiberti, M. M., Mele, F., Piatanesi, A., and Amato, A.: Probabilistic tsunami hazard analysis in the Mediterranean Sea, Nat. Commun., 12, 5677, https://doi.org/10.1038/s41467-021-25815-w, 2021.
Selva, J., Argyroudis, S., Cotton, F., Esposito, S., Iqbal, S. M., Lorito, S., Stojadinovic, B., Basili, R., Hoechner, A., Mignan, A., Pitilakis, K., Thio, H. K., and Giardini, D.: A novel multiple-expert protocol to manage uncertainty and subjective choices in probabilistic single and multi-hazard risk analyses, Int. J. Disast. Risk. Re., 110, 104641, https://doi.org/10.1016/j.ijdrr.2024.104641, 2024.
Slovic, P.: The Perception of Risk, Earthscan, London, UK, ISBN 978-1-85383-527-8, 2000.
Senior Seismic Hazard Analysis Committee (SSHAC): Recommendations for Probabilistic Seismic Hazard Analysis: Guidance on Uncertainty and Use of Experts, NUREG/CR-6372, UCRL-ID-122160, U.S. Nuclear Regulatory Commission, U.S. Department of Energy, and Electric Power Research Institute, 1997.
Shabestanipour, G., Brodeur, Z., Farmer, W. H., Steinschneider, S., Vogel, R. M., and Lamontagne, J. R.: Stochastic watershed model ensembles for long-range planning: verification and validation, Water Resour. Res., 59, e2022WR032201, https://doi.org/10.1029/2022WR032201, 2023.
Stancu, A., Ariccio, S., De Dominicis, S., Ganucci Cancellieri, U., Petruccelli, I., Ilin, C., and Bonaiuto, M.: The better the bond, the better we cope. The effects of place attachment intensity and place attachment styles on the link between perception of risk and emotional and behavioral coping, Int. J. Disast. Risk. Re., 51, 101771, https://doi.org/10.1016/j.ijdrr.2020.101771, 2020.
Stancu, A., Ariccio, S., De Dominicis, S., Ganucci Cancellieri, U., Petruccelli, I., Theodorou, A., Ilin, C., and Bonaiuto, M.: Place attachment styles predict adaptive and maladaptive conducts under flood risk: evidence via cognitive and affective coping mediation, J. Community Appl. Soc., 35, e70083, https://doi.org/10.1002/casp.70083, 2025.
Stedinger, J. R. and Cohn, T. A.: Flood frequency analysis with historical and paleoflood information, Water Resour. Res., 22, 785–793, https://doi.org/10.1029/WR022i005p00785, 1986.
Todini, E.: Flood forecasting and decision making in the new millennium. Where are We?, Water Resour. Manag., 31, 3111–3129, https://doi.org/10.1007/s11269-017-1693-7, 2017.
van der Bles, A. M., Van Der Linden, S., Freeman, A. L., Mitchell, J., Galvao, A. B., Zaval, L., and Spiegelhalter, D. J.: Communicating uncertainty about facts, numbers and science, Roy. Soc. Open Sci., 6, 181870, https://doi.org/10.1098/rsos.181870, 2019.
van der Bles, A. M., van der Linden, S., Freeman, A. L. J., and Spiegelhalter, D. J.: The effects of communicating uncertainty on public trust in facts and numbers, Proc. Natl. Acad. Sci. USA, 117, 7672–7683, https://doi.org/10.1073/pnas.1913678117, 2020.
Viglione, A., Merz, R., Salinas, J. L., and Blöschl, G.: Flood frequency hydrology: 3. A Bayesian analysis, Water Resour. Res., 49, https://doi.org/10.1029/2011WR010782, 2013.
Villagra, P., Quintana, C., Ariccio, S., and Bonaiuto, M.: Evacuation intention on the Southern Chilean coast: a psychological and spatial study approach, Habitat Int., 117, 102443, https://doi.org/10.1016/j.habitatint.2021.102443, 2021.
Villagra, P., Peña y Lillo, O., Ariccio, S., Bonaiuto, M., and Olivares-Rodríguez, C.: Effect of the Costa Resiliente serious game on community disaster resilience, Int. J. Disast. Risk. Re., 91, 103686, https://doi.org/10.1016/j.ijdrr.2023.103686, 2023.
Viscusi, W. K.: Fatal Tradeoffs: Public and Private Responsibilities for Risk, Oxford University Press, New York, USA, https://doi.org/10.1093/oso/9780195072785.001.0001, 1992.
Wagenmakers, E.-J., Sarafoglou, A., and Aczel, B.: One statistical analysis must not rule them all, Nature, 605, 423–425, https://doi.org/10.1038/d41586-022-01332-8, 2022.
Walley, P.: Statistical Reasoning with Imprecise Probabilities, Chapman and Hall, London, https://doi.org/10.1007/978-1-4899-3472-7, 1991.
Warren, G. W. and Duckett, S. M.: Risk perception and communication, plugged-in: fifty years of process, Risk Anal., 46, e70205, https://doi.org/10.1111/risa.70205, 2026.
Wasserman, L.: Frequentist Bayes is objective, Bayesian Anal., 1, 451–456, https://doi.org/10.1214/06-BA116, 2006.
Weichselberger, K.: The theory of interval probability as a unifying concept for uncertainty, Int. J. Approx. Reason., 24, 149–170, 2000.
Wynne, B.: Misunderstood misunderstanding: social identities and public uptake of science, Public Underst. Sci., 1, 281–304, 1992.
Zanetti, L., Chiffi, D., and Petrini, L.: Philosophical aspects of probabilistic seismic hazard analysis (PSHA): a critical review, Nat. Hazards, 117, 1193–1212, https://doi.org/10.1007/s11069-023-05901-6, 2023.
- Abstract
- Introduction
- Overview of the task force discussions
- Common challenges
- Modeling different uncertainties
- Evaluating the reliability and skill of forecasts
- The communication challenges
- The RETURN vision
- Glossary of terms
- Data availability
- Team list
- Author contributions
- Competing interests
- Disclaimer
- Acknowledgements
- Financial support
- Review statement
- References
- Abstract
- Introduction
- Overview of the task force discussions
- Common challenges
- Modeling different uncertainties
- Evaluating the reliability and skill of forecasts
- The communication challenges
- The RETURN vision
- Glossary of terms
- Data availability
- Team list
- Author contributions
- Competing interests
- Disclaimer
- Acknowledgements
- Financial support
- Review statement
- References