
the Creative Commons Attribution 4.0 License.
the Creative Commons Attribution 4.0 License.
 | 05 Oct 2026
Spatiotemporal patterns of global earthquake disaster impacts from a human-Earth perspective
Zekang Zhang
Yingqiao Qiu

Chaoran Xuan
Understanding how earthquake disaster impacts vary across space and time is essential for global disaster risk assessment and reduction planning. Using earthquake disaster records from the Emergency Events Database (EM-DAT) during 1980–2024, this study investigates temporal trends, multi-scale spatial patterns, centroid shifts, and factors associated with cross-national differences in earthquake fatalities. Temporal analyses reveal a divergence between recorded earthquake disaster frequency and impact consequences. While the number of recorded earthquake disaster events, affected population, and cumulative economic losses increased overall, mortality-related indicators declined, particularly after the early 2000s. Spatial analyses demonstrate substantial heterogeneity among continents, countries, and tectonic plates. Asia accounts for a large proportion of global earthquake disaster events and associated impacts, whereas the magnitude of impacts differs considerably among countries. At the global scale, the unweighted centroid of recorded earthquake disaster events shifted eastward across the three periods (1980–1994, 1995–2009, and 2010–2024), with consecutive inter-period displacements of 1872.4 and 770.4 km, respectively. Weighted centroids based on fatalities, affected population, and economic losses showed different spatial trajectories, indicating distinct spatial organizations of impact dimensions. The Geographical Detector results indicate that earthquake magnitude showed the highest explanatory power for spatial differences in fatalities (q = 0.17), and interactions among factors generally enhanced spatial associations. These findings provide a global assessment of earthquake disaster impacts by integrating temporal evolution, spatial redistribution, and associated factors, offering comparative evidence for regional risk identification, exposure management, and disaster preparedness planning.
- Article
(6877 KB) - Full-text XML
-
Supplement
(7143 KB) - BibTeX
- EndNote


Earthquake disasters remain among the most destructive natural hazards worldwide, causing profound human, economic, and infrastructural losses each year (United Nations Office for Disaster Risk Reduction (UNDRR), 2023; Daniell et al., 2017). Despite notable advances in seismology, engineering design, and emergency response systems, global earthquake losses have not declined uniformly. Instead, rapid urban expansion, population concentration in seismic belts, and intensified development in tectonically active landscapes continue to elevate exposure and reinforce event vulnerability (Cutter, 2021; Aksha and Khanal, 2019; Duzgun et al., 2011). This persistent rise in event impacts – despite improved monitoring and hazard science – illustrates a central paradox in contemporary earthquake risk: earthquake disaster impacts increasingly reflect interactions between geophysical hazards and evolving social-environmental conditions. These interactions highlight that disaster risk becomes observable through realized impacts on populations and economies.
A human–Earth perspective provides a framework for understanding why similar earthquake hazards may correspond to different disaster impacts across regions. From this perspective, earthquake impacts are viewed as the outcome of the spatial configuration of earthquake characteristics, population exposure, and socioeconomic conditions, which are associated with differences in the spatial and temporal distribution of recorded disaster consequences (Gall et al., 2009; Lee et al., 2022). Geophysically, seismic hazards are structured by plate interactions, strain accumulation, and lithospheric deformation, forming persistent seismic belts such as the Pacific Ring of Fire and the Alpine–Himalayan arc (Bird, 2003a; Kagan and Jackson, 1994). Yet similar earthquakes often produce vastly different outcomes depending on demographic exposure, infrastructure quality, governance effectiveness, and environmental fragility (Anbarci et al., 2005; Keefer et al., 2011; Wyss et al., 2023). These disparities underscore a growing recognition that earthquake disasters result from the interaction between natural hazards and socially mediated vulnerability across space (Cohen and Werker, 2008; Reid, 2013; Ismail-Zadeh, 2024).
Previous studies have demonstrated that earthquake disaster impacts are highly heterogeneous across regions and cannot be explained by seismic characteristics alone. Differences in earthquake magnitude, focal depth, and tectonic setting provide the physical context of disaster events, while variations in population distribution and economic conditions influence the spatial concentration of exposed populations and assets. Global earthquake risk assessments have shown that the combination of seismic hazard, exposure, and socioeconomic conditions is essential for understanding variations in human and economic losses across countries and regions (Jaiswal et al., 2010; Daniell et al., 2011; Silva et al., 2019). However, previous studies have often focused on individual dimensions of earthquake risk or specific regions, and the global-scale spatial relationships among earthquake characteristics, population exposure, socioeconomic conditions, and different impact outcomes remain insufficiently quantified.
Despite substantial progress in regional seismic hazard studies, global-scale analyses of earthquake disaster impacts, as distinct from seismicity alone, remain limited. Most global assessments rely on instrumental catalogs to evaluate earthquake occurrence, magnitude–frequency patterns, or aftershock clustering (Zaliapin and Ben-Zion, 2013; Kagan and Jackson, 1994). While crucial for characterizing physical processes, these studies do not explain why comparable earthquakes generate disproportionate losses across countries (Noy, 2016; Li et al., 2021; Guo et al., 2020). Recent global models of seismic exposure and vulnerability (Xofi et al., 2022) represent important advances but underrepresent governance, environmental change, and socio-economic inequality-factors identified by the Sendai Framework as root causes of escalating disaster risk (United Nations Office for Disaster Risk Reduction (UNDRR), 2023).
Moreover, the interaction effects among multiple explanatory factors remain poorly understood at the global scale. Traditional regression approaches frequently assume linearity and overlook spatial stratification, non-linear amplification, and synergistic interactions, such as those between population density and governance quality or between basic public infrastructure, precipitation, and topography (Wang et al., 2010; Hu et al., 2011; Ansari et al., 2025). Yet multi-factor interactions contribute to spatial differentiation of recorded disaster impacts within rapidly changing socio-ecological systems (Burton, 2015; Aksha and Khanal, 2019). Addressing these analytical limitations requires tools capable of detecting spatial heterogeneity and quantifying both independent and interactive effects within complex, coupled systems.
To address these gaps, this study integrates EM-DAT global event records (1980–2024), GIS-based spatial analysis, and the Geographical Detector model to examine the spatiotemporal variations and spatial associations of global earthquake disaster impacts. Specifically, we address four interrelated scientific questions:
- 1.
How have global earthquake disaster impacts changed over time?
- 2.
How are earthquake disaster impacts spatially distributed across continents, countries, and tectonic regions?
- 3.
How have the spatial distributions of global earthquake disaster impacts changed over time?
- 4.
Which earthquake characteristics, disaster-process attributes, population exposure, and socioeconomic conditions are statistically associated with spatial differences in earthquake mortality and economic losses, and how do these factors interact spatially?
By adopting a multi-scale human–Earth perspective, this study provides a globally comparable assessment of earthquake disaster impact patterns over four decades. It identifies temporal variations, spatial redistribution characteristics, and the spatial associations between earthquake attributes and human exposure conditions, providing new insights into the geographical differentiation of global earthquake impacts.

Figure 1Global spatial distribution of earthquake disaster events recorded in EM-DAT by magnitude, 1980–2024. Base map source: Standard map provided by the Ministry of Natural Resources of the People's Republic of China (https://www.tianditu.gov.cn/, last access: 30 September 2026). The base map has not been modified.
2.1 Data sources
This study used earthquake disaster records from the Emergency Events Database (EM-DAT) for the period 1980–2024 (Cred, 2024). EM-DAT is an impact-oriented global disaster database that records disasters associated with substantial human and socioeconomic consequences rather than a complete catalogue of all instrumentally detected earthquakes (Peduzzi and Herold, 2005; Rosvold and Buhaug, 2021). Events are included when they meet at least one impact-based criterion, including ≥ 10 deaths, ≥ 100 affected people, a declaration of a state of emergency, or a request for international assistance (Cred, 2023). Therefore, EM-DAT may include relatively moderate-magnitude earthquakes when they generate substantial societal impacts, while lower-impact events below inclusion thresholds may be underrepresented.
Previous studies have highlighted that disaster databases, including EM-DAT, are affected by reporting practices, data availability, and temporal variations in documentation capacity, which may introduce uncertainties into long-term comparisons (Gall et al., 2009; Guha-Sapir et al., 2012). Economic loss records are particularly subject to uncertainty because they depend on post-disaster assessments and national reporting procedures (Jones et al., 2022; Delforge et al., 2025). Accordingly, this study investigates the spatiotemporal patterns of recorded earthquake disaster impacts in EM-DAT, including fatalities, affected population, and economic losses, rather than global seismic occurrence patterns. Given the objective of assessing the geographical differentiation of documented earthquake consequences, EM-DAT provides an appropriate impact-based data source for global comparative analysis.
Transboundary earthquake events were retained as separate country-specific records because EM-DAT reports their impacts independently for each affected country. The magnitude composition and spatial distribution of the earthquake disaster records extracted from EM-DAT for the period 1980–2024 are shown in Fig. 1. The extracted records cover a broad magnitude range, with both moderate- and high-magnitude earthquakes included. The magnitude distribution by continent and period is summarized in Table S1 in the Supplement. To further evaluate the consistency of EM-DAT records, an independent comparison with the NCEI earthquake database was conducted for overlapping years (1980–2020). The temporal variations of recorded events, fatalities, and economic losses showed consistent patterns between the two databases (Fig. S1 in the Supplement).
2.2 Data processing
The EM-DAT database provides information including occurrence time, epicenter coordinates (latitude and longitude), affected countries (with ISO codes), affected population, fatalities, and economic losses. Based on these raw records, we constructed a harmonized national-level dataset through spatial matching and attribute aggregation. For each country, the following indicators were calculated: cumulative earthquake frequency, cumulative fatalities, cumulative affected population, and cumulative economic losses. Because reported impact variables in EM-DAT are compiled from disaster assessments, their completeness varies among indicators and regions. Therefore, indicator-specific analyses were based on available records, and the completeness of fatalities, affected population, and economic loss information was assessed separately (Table S2). To better capture event severity and normalized impacts, four per-event indicators were further derived: (1) Average number of affected people per event, (2) Average fatalities per event, (3) Average economic loss per event, and (4) Mortality rate (defined as fatalities relative to affected population). To improve cross-country comparability, fatalities were normalized by the annual population of the affected country, and economic losses were normalized by the corresponding national GDP before comparative analyses.
The 45-year study period (1980–2024) was divided into three consecutive 15-year intervals (1980–1994, 1995–2009, and 2010–2024). This equal-length division makes full use of the available data while ensuring comparable observation periods. It also provides sufficient earthquake disaster records within each interval for stable country-level analyses of spatial distribution, centroid migration, and explanatory factors. To improve temporal comparability, reported economic losses were adjusted for inflation using the OECD Consumer Price Index (CPI) and expressed in constant US dollars, following the approach described by Delforge et al. (2025). This standardization reduces the influence of inflation on comparisons of economic losses across years.
To evaluate whether long-term temporal patterns were sensitive to a small number of catastrophic events, sensitivity analyses were conducted by removing five extreme earthquake disasters (2004 Sumatra–Andaman earthquake and Indian Ocean tsunami, 2008 Wenchuan earthquake, 2010 Haiti earthquake, 2011 Great East Japan earthquake and tsunami, and 2023 Türkiye–Syria earthquake). The results were compared with those from the original dataset (Fig. S2 and Table S3).
3.1 Temporal variability analysis method
To characterize the temporal evolution of recorded earthquake disaster events in EM-DAT from 1980 to 2024, with emphasis on disaster impacts rather than global seismic activity, linear regression and the Mann–Kendall (MK) trend test were employed. These methods are widely applied in disaster risk and climate-related research to identify long-term trends in impact-related indicators under non-normal distributions and reporting uncertainty (Wang et al., 2021). The MK test, a non-parametric approach robust to outliers and missing values, was used to evaluate monotonic trends in eight earthquake event indicators, including frequency, fatalities, affected population, and economic losses. Before applying the MK test, lag-1 autocorrelation was examined for all annual indicators to evaluate the independence assumption of the time series. The results showed that most indicators did not exhibit significant autocorrelation, whereas the annual number of recorded events showed significant lag-1 autocorrelation (p < 0.05). Therefore, pre-whitening correction was applied to this indicator, while other indicators were analyzed using the original MK procedure (Table S4). The MK statistic S was computed following standard procedures, as follows:
where xi and xj represent two observations in the time series. The sign function returns 1, 0, or −1 depending on whether the difference is positive, zero, or negative. Fatalities, affected population, economic losses, and their event-normalized indicators exhibited strongly right-skewed distributions. These variables were transformed using log10(x+1) for regression-based temporal analysis and graphical presentation. The uncertainty of the fitted temporal trends was evaluated using 95 % confidence intervals of the linear regression estimates. The confidence bands around the fitted trends are presented in Fig. S4. The addition of 1 retained explicitly reported zero values. Annual disaster-event counts were retained on their original scale. The descriptive statistics of annual indicators showed substantial differences between mean and median values, confirming the strong skewness of impact-related variables (Table S5). The corresponding log-scale temporal patterns are additionally presented in Fig. S4.
The standardized Z value was then derived to assess trend significance:
A positive Z value indicates an upward trend, while a negative value indicates a downward trend. Significance thresholds were set at |Z|=1.28 (90 %), 1.64 (95 %), and 2.33 (99 %) (Casella and Berger, 2002). By combining linear regression slopes with MK significance testing, this approach evaluates both the magnitude and statistical significance of long-term changes in earthquake disaster impacts. Considering that several catastrophic earthquakes may disproportionately affect annual impact indicators, a sensitivity analysis was further conducted by removing five extreme disaster events (the 2004 Sumatra-Andaman earthquake and Indian Ocean tsunami, 2008 Wenchuan earthquake, 2010 Haiti earthquake, 2011 Great East Japan earthquake and tsunami, and 2023 Türkiye–Syria earthquake). The comparison between the original and extremes-removed datasets is shown in Fig. S1, with corresponding trend statistics summarized in Table S3.
3.2 Spatial variability analysis method
3.2.1 Geometric centroid analysis
Geometric centroid analysis was used to examine the spatial distribution and temporal redistribution of recorded earthquake disaster impacts during different periods. These centroids represent the statistical centers of EM-DAT-recorded disaster events or impact-weighted distributions, rather than the physical locations of earthquake sources or changes in seismic activity. For each study period, centroid coordinates were calculated using a weighted mean:
where nt is the number of earthquake disaster records in period t; i denotes the ith event; Xi and Yi are the longitude and latitude of the event, respectively; and wi is the corresponding weight. Four centroid types were calculated. The unweighted centroid (ωi=1) represents the spatial distribution of recorded earthquake disaster events, whereas the weighted centroids use fatalities, affected population, and economic losses as weights to represent the spatial distribution of different impact dimensions. Therefore, different centroid estimates describe different dimensions of earthquake disaster impacts: the unweighted centroid reflects the spatial distribution of recorded events, while weighted centroids emphasize the spatial concentration of specific societal consequences.
Centroid migration distances between consecutive periods were calculated using the Geodesic method in ArcGIS Pro under the WGS 1984 geographic coordinate system. This method measures the shortest path between two centroid locations on the reference ellipsoid, making it suitable for global-scale distance calculations while avoiding distortions associated with planar distance measurements. All migration distances are reported in kilometres.
3.2.2 Data completeness and variable-specific treatment
Reported zero values for fatalities, affected population, and economic losses were retained as valid observations and distinguished from missing values. Blank or unavailable entries were treated as missing and were not imputed. All earthquake disaster records with valid geographic coordinates were retained in the centroid analyses. The centroid analysis therefore used the full set of records with available spatial coordinates, without restricting events based on impact-variable completeness. For weighted centroid calculations, only records with available values for the corresponding weighting variable were included. For the Geographical Detector analysis, countries with missing socioeconomic, governance, environmental, healthcare, or GDP-related indicators were excluded only from the corresponding analysis, while remaining available for all other analyses. This variable-specific treatment maximized data utilization while avoiding bias introduced by artificial value imputation.
3.2.3 Uncertainty assessment of centroid location and displacement
Bootstrap uncertainty assessment. Uncertainty in centroid locations was evaluated using nonparametric bootstrap resampling. Within each study period and weighting scheme, earthquake disaster records were sampled with replacement, and the statistical centroid was recalculated for each bootstrap replicate. The 2.5th and 97.5th percentiles of the bootstrap longitude and latitude distributions were used to construct 95 % confidence intervals for centroid locations. The resulting centroid coordinates and confidence intervals are reported in Table S6.
Bootstrap confidence intervals for centroid displacement. To quantify uncertainty in centroid displacement between consecutive periods, records from each pair of study periods were independently resampled with replacement. The corresponding statistical centroids were recalculated, and their geodesic separation was computed for each bootstrap replicate. Percentile-based 95 % confidence intervals were obtained from the bootstrap displacement distribution. The observed displacement distances, bootstrap confidence intervals, and permutation-test results are summarized in Table S7. Because geodesic displacement is constrained to be non-negative, the bootstrap confidence intervals characterize uncertainty in displacement magnitude rather than statistical significance. Statistical significance was therefore evaluated using permutation tests. This distinction avoids interpreting uncertainty intervals of non-negative displacement distances as hypothesis tests, while permutation tests directly evaluate whether observed centroid shifts exceed those expected under random temporal reassignment.
3.3 Spatial stratified association analysis using the Geographical Detector model
In this study, the Geographical Detector model was applied to examine spatial statistical associations between earthquake disaster impacts and a set of geophysical and socioeconomic covariates. Unlike regression-based approaches, this method evaluates whether the spatial stratification of explanatory variables corresponds to the spatial differentiation of recorded disaster impacts. Therefore, the detected variables represent variables with statistical explanatory power for spatial heterogeneity rather than causal determinants.
Table 1Explanatory variables used in the Geographical Detector analysis of earthquake disaster impacts and data sources.

3.3.1 Response variables and explanatory variables
The Geographical Detector model was applied to examine spatial statistical associations between earthquake disaster impacts and potential explanatory variables at the event level. This method evaluates whether the spatial stratification of explanatory variables corresponds to the spatial differentiation of recorded disaster impacts. Therefore, the detected relationships represent statistical associations and explanatory power for spatial heterogeneity rather than causal effects or confirmed physical mechanisms.
Two response variables were selected to characterize different dimensions of earthquake disaster impacts: fatalities per million population and GDP-normalized economic losses. To improve comparability among countries with different population sizes and economic scales, both indicators were calculated using country-specific conditions in the corresponding earthquake occurrence year.
Fatalities per million population was calculated as:
where FPM represents fatalities per million population, F denotes the number of fatalities associated with an earthquake disaster event, and P represents the population of the affected country in the corresponding year.
GDP-normalized economic losses were calculated as:
where GDPL represents the proportion of direct economic losses relative to national GDP, L denotes the reported direct economic loss of an earthquake disaster event, and GDP represents the GDP of the affected country in the corresponding year.
These event-specific normalization procedures reduce the influence of differences in population size and economic scale among countries and provide more comparable measures of earthquake disaster impacts. Because earthquake disaster impact variables exhibited strongly right-skewed distributions, log10(x+1) transformation was applied before Geographical Detector analysis. The addition of 1 retained zero-valued observations while reducing the influence of extreme events. Summary statistics of the response variables are provided in Table S5.
The explanatory variables were selected to represent earthquake characteristics, disaster processes, and socioeconomic conditions associated with spatial differences in recorded earthquake disaster impacts. Earthquake-related variables included magnitude, focal depth, and seismotectonic type. Seismotectonic type was classified into four categories: shallow crustal earthquakes, subduction earthquakes, intraplate earthquakes, and megathrust earthquakes. Disaster-process type was included to distinguish earthquake-only disasters from earthquake–tsunami compound disasters. Socioeconomic variables included population density and GDP per capita, representing differences in population exposure and national economic conditions. The definitions, data sources, and representations of all explanatory variables are summarized in Table 1.
To ensure temporal consistency between earthquake impacts and explanatory variables, all variables were matched according to the earthquake occurrence year and the affected country. Physical earthquake characteristics were directly linked to individual earthquake records, whereas socioeconomic variables were assigned according to the corresponding country-year conditions. This event-level matching approach avoids applying contemporary socioeconomic conditions to historical earthquake disasters and provides a more consistent basis for evaluating spatial associations during the 1980–2024 study period.
Continuous explanatory variables were subsequently discretized into categorical strata before Geographical Detector analysis. The tested discretization methods, numbers of strata, and sensitivity analyses of alternative classification schemes are described in Sect. 3.3.2 and summarized in Tables S9 and S10, and Fig. S3.
3.3.2 Single-factor detector
The factor detector was applied to quantify the spatial explanatory power of individual explanatory variables for the spatial heterogeneity of earthquake disaster impacts. The q statistic measures the extent to which the spatial stratification of an explanatory variable corresponds to the spatial distribution of the response variable. Therefore, the obtained q values represent statistical spatial explanatory power rather than causal effects.
The q statistic ranges from 0 to 1, with larger values indicating stronger explanatory power of the corresponding explanatory variable for the spatial differentiation of the response variable (Wang et al., 2016). The q statistic was calculated as follows:
where q denotes the explanatory power of explanatory variable X for response variable Y, with values range of [0,1]. L represents the number of strata generated after discretizing X. Nh and N epresent the number of samples in stratum h and the total number of samples, respectively. and σ2 represent the variances of Y within stratum h and the overall dataset, respectively.
Because the Geographical Detector model requires continuous explanatory variables to be converted into categorical strata, continuous variables were discretized before factor detection. Several commonly used discretization methods, including equal interval, quantile, and natural breaks (Jenks), were tested with different numbers of strata. For each explanatory variable, the optimal discretization scheme was selected based on the combined evaluation of q-statistic performance and robustness measured by the coefficient of variation (CV). The selected discretization schemes and sensitivity comparisons among alternative classification methods are provided in Tables S9 and S15, and Fig. S3.
3.3.3 Interaction detector
The interaction detector was applied to evaluate whether the combination of two explanatory variables provides additional spatial explanatory power for earthquake disaster impacts compared with individual variables. Rather than identifying causal interactions, this method evaluates whether the joint spatial stratification of two explanatory variables corresponds to stronger spatial differentiation of the response variable. The interaction q statistic was calculated as follows:
where q(X1∩X2) denotes the joint explanatory power of two explanatory variables X1 and X2 for response variable Y. L represents the number of combined strata generated by overlaying the two explanatory variables. Nh and N represent the number of samples within combined stratum h and the total number of samples, respectively. and σ2 represents the variance of Y within combined stratum h and the overall dataset, respectively.
The interaction type was determined by comparing the interaction q value q(X1∩X2) with the individual q values of X1 and X2. Following the standard Geographical Detector classification, interactions were categorized as follows: independent enhancement when , bilinear enhancement when , and nonlinear enhancement when . All pairwise combinations of explanatory variables were evaluated to identify whether combined spatial stratification provided stronger explanatory power than individual variables alone.
3.3.4 Statistical significance and robustness assessment
The statistical significance of q statistics was evaluated using permutation tests. For each explanatory variable, the observed q statistic was compared with the distribution of q statistics obtained by randomly permuting the response variable while keeping the explanatory variable unchanged. This procedure was repeated to estimate the probability that the observed spatial explanatory power could arise by random chance.
The corresponding p values were calculated for both factor detector and interaction detector results. A smaller p value indicates stronger statistical evidence that the observed q statistic differs from random expectations. Statistical significance was assessed using a threshold of p < 0.05.
To evaluate the robustness of the Geographical Detector results, sensitivity analyses were conducted for alternative discretization schemes and numbers of strata. The stability of explanatory power under different parameter settings was assessed using variations in q statistics and coefficient of variation (CV). Detailed sensitivity results are provided in Table S10.

Figure 2emporal trends of major global earthquake disaster impact indicators and associated extreme events during 1980–2024. (a) Number of recorded earthquake disaster events; (b) fatalities per million people; (c) mortality rate (%); (d) affected population per million people; (e) economic loss per unit GDP (%); (f) fatalities per recorded event; (g) economic loss per recorded event (USD 1000); and (h) affected population per recorded event. Major extreme earthquake disaster events associated with prominent peaks are annotated in red boxes, including representative earthquake and earthquake–tsunami compound disasters. Panel (a) is presented on the original scale. Because the remaining impact indicators exhibit strongly right-skewed distributions and include zero values, panels (b)–(h) display log 10(x+1)-transformed annual values. The red lines represent linear trends fitted to the displayed values, and the blue dashed lines indicate their corresponding means.
4.1 Temporal trends and period-based variations of global earthquake disaster impacts
Inter-annual variability in global earthquake impacts from 1980 to 2024 reveals distinct and contrasting trends across different indicators (Fig. 2). Trend descriptions below refer to the transformed values for impact-related indicators and original values for event counts, following the preprocessing procedures described in Sect. 3.
The number of recorded earthquake disaster events in the EM-DAT database shows a clear upward trend (slope = 0.15). The MK test indicates that this upward trend is statistically significant after considering lag-1 autocorrelation through pre-whitening correction (Table S4). Cumulative affected population exhibits only a slight upward trend with substantial year-to-year fluctuations, while the average affected population per event shows only a marginal increase over time. Several pronounced peaks in affected population, fatalities, and economic losses correspond to major catastrophic earthquakes, including the 2004 Sumatra earthquake and Indian Ocean tsunami, the 2008 Wenchuan earthquake, the 2010 Haiti earthquake, the 2011 Tohoku earthquake, and the 2023 Türkiye–Syria earthquake. These events substantially influenced short-term fluctuations in multiple indicators.

Figure 3Analysis of changes in global earthquake event indicators from 1980 to 2024. NOE represents number of earthquakes, CNAI represents cumulative number of affected people, CEL represents cumulative economic losses, CDT represents cumulative number of fatalities, AAPE represents average number of affected people per event, AELPE represents average economic loss per event, ADPE represents average number of fatalities per event, MR represents mortality rate.
The mortality rate displays a mild downward tendency, and the MK test confirms a statistically significant decline over the study period (Table S4), indicating reduced fatalities relative to affected populations. Cumulative economic losses also show a slight but statistically insignificant upward tendency, whereas average economic loss per event demonstrates a weak declining trend. The fitted trend remains associated with considerable uncertainty due to strong inter-annual fluctuations, as reflected by the 95 % confidence intervals of regression estimates (Fig. S4). In contrast, average fatalities per event show a slight but statistically insignificant decreasing tendency (slope = −0.0055, p = 0.547), which is strongly influenced by a limited number of catastrophic earthquakes with exceptionally high fatality levels. Because this indicator is calculated as cumulative fatalities divided by the number of recorded events, its temporal variation reflects the combined effects of event frequency and extreme-event contributions. Therefore, the observed temporal variation should not be interpreted as a generalized change in fatality severity across all earthquake disasters, but rather as reflecting the greater concentration of fatalities in a small number of extreme events.
Although several catastrophic earthquakes substantially amplified short-term fluctuations in fatalities, affected population, and economic losses, sensitivity analyses excluding five extreme disasters (the 2004 Sumatra–Andaman earthquake and Indian Ocean tsunami, 2008 Wenchuan earthquake, 2010 Haiti earthquake, 2011 Great East Japan earthquake and tsunami, and 2023 Türkiye–Syria earthquake) indicate that the overall temporal tendencies remain generally consistent, although the magnitude of some trends changes (Fig. S2 and Table S3). These results suggest that annual variations in earthquake disaster impacts reflect both underlying long-term temporal patterns and episodic extreme events, rather than being solely attributable to a limited number of catastrophic disasters.
To further examine whether temporal variations reflected changes in the distributional structure of earthquake disaster events, kernel density estimation (KDE) and Gaussian mixture modeling (GMM) were applied to evaluate potential multimodal characteristics of major impact indicators across different periods. The results show that several indicators exhibit multimodal distributions, suggesting substantial heterogeneity in the composition of recorded earthquake disaster events across time periods. Detailed multimodality test results based on KDE modes, optimal GMM components, and distributional classifications are provided in Table S11, with corresponding density distributions illustrated in Fig. S5.
To further examine whether earthquake disaster impacts differed across broader temporal stages, the 45-year study period was divided into three consecutive 15-year intervals (1980–1994, 1995–2009, and 2010–2024). This period-based comparison complements the annual trend analysis by focusing on differences in impact levels among distinct time windows. Eight earthquake event indicators were examined across three consecutive 15-year periods (Fig. 3). Most indicators – including mortality rate, cumulative deaths, affected population, and their event-normalized counterparts – showed their highest values during the second period (1995–2009). In contrast, economic indicators showed a slightly different pattern: although cumulative and per-event economic losses remained high during the third period (2010–2024), their values were slightly lower than those of the second period. Earthquake frequency also increased markedly in the second period and then declined slightly in the third, while remaining above the level observed in the first period. In the most recent period, substantial reductions in cumulative and per-event fatalities and affected populations led to a pronounced decline in mortality rates. These results indicate a recent reduction in the fatality ratio of recorded earthquake disasters, occurring alongside persistently high – though slightly reduced – levels of economic exposure.
Together, the annual trend analysis and period-based comparison indicate that changes in recorded earthquake disaster event frequency were not accompanied by uniform changes in all impact indicators. Instead, different dimensions of earthquake disaster impacts exhibited distinct temporal patterns. While mortality-related indicators showed a decreasing tendency in the most recent period, economic impacts remained relatively high, and several catastrophic events continued to contribute substantially to annual fluctuations.
4.2 Multi-scale spatial patterns and redistribution of recorded earthquake disaster impacts
The spatial distribution of recorded earthquake disaster impacts reflects the combined configuration of seismic characteristics, population exposure, and socioeconomic conditions. To characterize spatial heterogeneity across different geographical contexts, analyses were conducted at three complementary scales. Continental-scale comparisons were used to identify broad regional differences in impact contributions, national-scale analyses were applied to examine cross-country heterogeneity in impact magnitude and temporal trends, and statistical centroid analysis was used to characterize temporal redistribution of recorded earthquake disaster impacts across global and tectonic-region scales. Together, these analyses describe where earthquake disaster impacts are concentrated, how their spatial patterns differ among regions, and how their statistical distributions change over time.
4.2.1 Global regional concentration of earthquake disaster impacts
Continental-scale comparisons provide a broad overview of regional differences in recorded earthquake disaster impacts during 1980–2024 (Fig. S6). Asia accounts for the largest contributions to most cumulative indicators, including the number of recorded earthquake disaster events, cumulative affected population, cumulative fatalities, and cumulative economic losses. This pattern is associated with extensive earthquake exposure, large populations, and the concentration of disaster records within major seismic regions.
However, normalized impact indicators show different continental patterns. Mortality-related indicators and average fatalities per event exhibit relatively higher contributions from some regions despite their smaller share of total recorded events, indicating that a limited number of high-impact disasters can substantially influence per-event impact metrics. Similarly, Europe shows relatively low contributions to recorded earthquake frequency but a comparatively higher contribution to average economic loss per event. The contribution of major earthquake events indicates that such continental-scale differences can be strongly affected by a small number of high-loss events (Fig. S7).
Overall, continental-scale comparisons demonstrate that the spatial distribution of earthquake disaster impacts varies substantially among impact dimensions. The continental composition of the eight earthquake impact indicators is shown in Fig. S6, while the contribution of major individual events is further examined in Fig. S7.
4.2.2 National-scale heterogeneity of earthquake disaster impacts
National-scale analyses reveal substantial spatial heterogeneity in both the magnitude and temporal characteristics of recorded earthquake disaster impacts (Fig. S8). Countries located along major seismic belts, including regions in East and Southeast Asia, the Mediterranean region, and western South America, generally exhibit higher levels of recorded earthquake events and cumulative impacts.

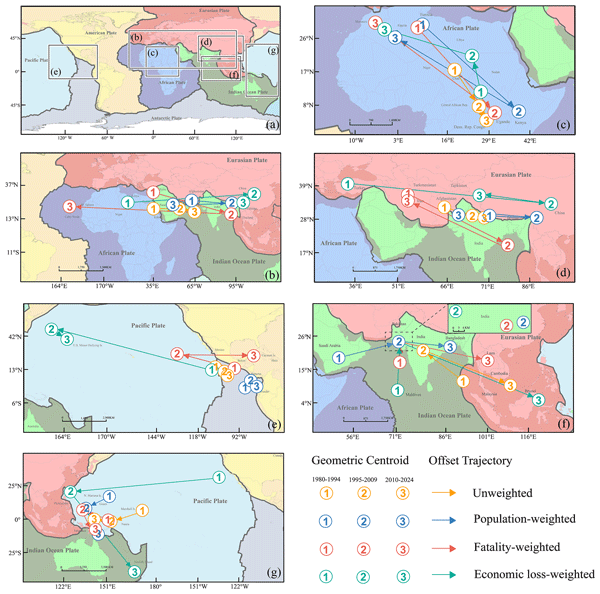
Figure 4Spatiotemporal evolution of global and plate-scale earthquake disaster impact centroids and spatial dispersion patterns from 1980 to 2024. (a) Global standard deviation ellipses and centroid trajectories of recorded earthquake disaster impacts across three periods; (b) global centroid displacement trajectory; and centroid shifts within the (c) African tectonic region, (d) Eurasian tectonic region, and (e) American tectonic region, (f) Indian Ocean tectonic region, and (g) Pacific Plate. The plate boundary data were obtained from the global plate boundary dataset (Bird, 2003b).
The spatial patterns of different impact indicators are not identical. Countries with large populations, such as China, India, and Indonesia, contribute substantially to cumulative affected population and fatalities, whereas countries with concentrated economic assets, including Japan, the United States, and several European countries, show higher levels of economic losses. These differences indicate that earthquake disaster impacts represent multiple dimensions associated with event characteristics, population exposure, and socioeconomic context.
Temporal trend statistics further reveal heterogeneous patterns among countries (Fig. S7). Significant increases or decreases occur only in specific regions and for particular indicators, while many countries show non-significant temporal variations. This suggests that changes in recorded earthquake disaster impacts do not follow a uniform global pattern but vary among national contexts.
4.2.3 Temporal redistribution of statistical centroids across tectonic regions
Statistical centroid analysis was used to characterize temporal changes in the spatial distribution of recorded earthquake disaster impacts. These centroids represent the statistical centers of EM-DAT-recorded disaster events or impact-weighted distributions, rather than physical earthquake locations or shifts in seismic activity.
At the global scale, the unweighted centroid showed a northeastward redistribution during 1980–2024 (Fig. 4a and b). The centroid moved from 21.89° N, 32.27° E in 1980–1994 to 21.75° N, 50.41° E in 1995–2009, corresponding to a displacement of 1872.4 km (p = 0.0024). It subsequently shifted to 20.72° N, 57.77° E in 2010–2024, with a smaller displacement of 770.4 km, which was not statistically significant (p = 0.1767) (Tables S6 and S7). These changes indicate temporal redistribution of recorded earthquake disaster events rather than a migration of seismic activity.
Weighted centroids showed distinct spatial patterns among different impact dimensions. During 1980–2024, population-weighted, fatality-weighted, and economic-loss-weighted centroids were located differently from the unweighted centroid, reflecting the uneven spatial distribution of affected populations, fatalities, and economic losses (Fig. 4; Table S6). For example, the fatality-weighted centroid shifted from 30.00° N, 32.82° E to 23.40° N, −26.78° E, with a displacement of 11 463.3 km between 1995–2009 and 2010–2024 (p = 0.0259), whereas economic-loss-weighted centroids showed a large but statistically uncertain shift during the same period (998.0 km, p = 0.8334) (Table S7).
At the tectonic-region scale, centroid displacement varied substantially among regions (Fig. 4c–g; Table S7). Significant shifts were mainly observed for selected weighting schemes, including the Eurasian Plate (unweighted centroid: 1011.7 km, p = 0.008; 1980–1994 to 1995–2009), the Indian Ocean Plate (unweighted centroid: 3539.5 km, p = 0.0224; 1995–2009 to 2010–2024), and several fatality-weighted trajectories. In contrast, most centroid changes on the American, Pacific, and African plates were not statistically significant. Detailed centroid coordinates, uncertainty intervals, displacement confidence intervals, and permutation-test results are provided in Tables S6 and S7.
Sensitivity analyses excluding five catastrophic earthquake disasters (the 2004 Sumatra–Andaman earthquake and Indian Ocean tsunami, the 2008 Wenchuan earthquake, the 2010 Haiti earthquake, the 2011 Great East Japan earthquake and tsunami, and the 2023 Türkiye–Syria earthquake) showed that most centroid displacement patterns remained comparable, although the magnitude of some shifts decreased after removing extreme events (Table S8).
Overall, centroid analysis reveals temporal changes in the spatial distribution of recorded earthquake disaster impacts across global and tectonic-region scales. These changes reflect variations in the statistical distribution of disaster records and impact dimensions, rather than spatial movement of earthquake sources or tectonic processes.

Figure 5Geographical Detector results for spatial explanatory power of factors associated with global earthquake disaster impacts. (a) Individual q statistics of explanatory factors for fatalities per million residents based on the factor detector; (b) interaction q statistics of factor pairs for fatalities per million residents based on the interaction detector; (c) individual q statistics of explanatory factors for standardized economic loss based on the factor detector; and (d) interaction q statistics of factor pairs for standardized economic loss based on the interaction detector.
Table 2Results of the single-factor detector for earthquake disaster impacts.

4.3 Spatial associations of global earthquake disaster impacts based on Geographical Detector
4.3.1 Individual associations of explanatory factors with earthquake impacts
The factor detector results reveal distinct differences in the spatial explanatory power of individual factors for earthquake mortality and economic impacts (Fig. 5a and c; Table 2). For mortality measured by deaths per million residents, earthquake magnitude shows the highest explanatory power (q=0.17), followed by seismotectonic type (q=0.08) and disaster process type (q=0.05). Socioeconomic exposure represented by population density and GDP per capita shows relatively lower but still detectable spatial explanatory power (q=0.04 and 0.03, respectively). Focal depth and tectonic setting exhibit limited individual explanatory power (q=0.04 and 0.03).
For economic losses normalized by GDP, magnitude remains the strongest individual factor (q=0.19), followed by population density (q=0.14) and seismotectonic type (q=0.12) (Fig. 5c; Table 2). GDP per capita shows moderate explanatory power (q=0.07), whereas focal depth, disaster process type, and tectonic setting exhibit relatively weaker individual associations (q≤0.05).
Overall, the factor detector results indicate that no single variable independently explains the spatial differentiation of earthquake impacts. Instead, earthquake magnitude and event characteristics provide relatively strong individual spatial associations, while socioeconomic exposure indicators become particularly relevant for explaining variations in economic losses.
4.3.2 Interactive associations among explanatory factors
Interaction detector results indicate widespread enhancement of spatial explanatory power when multiple factors are considered jointly (Fig. 5b and d; Tables S12–S14). For mortality outcomes, most factor pairs exhibit bilinear or nonlinear enhancement, indicating that the spatial differentiation of fatalities per million residents is better explained by combinations of earthquake characteristics and socioeconomic conditions than by individual variables alone.
Among mortality-related interactions, magnitude–population density shows the highest joint explanatory power (q = 0.33), followed by magnitude–GDP per capita (q = 0.27) and magnitude–tectonic setting (q = 0.25) (Fig. 5b; Table S13). These results indicate that the spatial differentiation of earthquake mortality is associated with the combined spatial configuration of seismic severity and population exposure.
For standardized economic loss, interaction explanatory power is generally higher than that observed for mortality (Fig. 5d; Table S14). Several factor combinations show relatively strong joint explanatory power, including population density–GDP per capita (q = 0.53), focal depth–tectonic setting (q = 0.47), and population density–focal depth (q = 0.33). These results suggest that economic impact patterns are associated with the combined spatial characteristics of earthquake processes and socioeconomic exposure.
Overall, interaction detection results demonstrate that the combination of explanatory variables provides stronger spatial explanatory power than individual factors in many cases. However, these interactions represent enhanced statistical spatial associations rather than causal relationships.
4.3.3 Comparison between mortality and economic impact patterns
The Geographical Detector results reveal different spatial association patterns between earthquake mortality and economic losses. Mortality per million residents is more closely associated with earthquake characteristics, particularly magnitude and seismotectonic context, whereas economic loss relative to GDP shows stronger associations with population exposure and socioeconomic conditions.
This difference suggests that mortality and economic consequences represent distinct dimensions of earthquake disaster impacts. Fatality outcomes are more closely related to the severity and characteristics of earthquake events, while economic losses reflect the combined spatial configuration of hazard intensity, exposed population, and economic conditions.
Importantly, these results describe statistical spatial associations at the national scale and do not imply causal relationships. Moreover, national-level analysis may mask subnational differences in exposure, vulnerability, and response capacity.
5.1 Synthesis of key findings
This study provides a multi-scale assessment of the spatiotemporal variations and spatial associations of global earthquake disaster impacts from 1980 to 2024. The temporal analyses reveal that changes in recorded earthquake disaster frequency were not accompanied by consistent changes in all impact indicators. Although the number of recorded earthquake disaster events increased over the study period, mortality rates declined, whereas economic losses remained relatively high and were strongly influenced by several extreme disasters. Similar divergence between earthquake occurrence, human losses, and economic consequences has been reported in global earthquake loss databases and risk assessments, where changes in exposure and economic concentration contribute to differences between hazard occurrence and disaster impacts (Daniell et al., 2011; Silva et al., 2019). The temporal variation in average fatalities per event identified in this study should therefore be interpreted cautiously, because this indicator combines event frequency effects with the disproportionate contribution of a small number of catastrophic earthquakes rather than representing a generalized increase in disaster impact severity.
Spatial analyses further demonstrate that earthquake occurrences and earthquake impacts exhibit distinct spatial configurations. Recorded earthquake disasters remain concentrated along major tectonic regions, including the Pacific Ring of Fire and the Alpine–Himalayan belt; however, the spatial distributions of fatalities, affected populations, and economic losses are not identical to the distribution of event frequency. Previous global earthquake risk studies have emphasized that disaster consequences depend not only on seismic hazard characteristics but also on the spatial distribution of exposed populations and economic assets (Jaiswal et al., 2010; Silva et al., 2019). Consistent with this perspective, the differences between unweighted and impact-weighted centroid trajectories in this study indicate that different impact dimensions represent distinct spatial organizations of earthquake disaster consequences rather than simple variations in earthquake occurrence.
The Geographical Detector analysis further reveals that earthquake characteristics, population exposure, and socioeconomic conditions exhibit different levels of spatial explanatory power for earthquake mortality and economic losses. Interaction analyses show that combinations of multiple factors generally correspond to stronger spatial differentiation than individual factors alone. These results are consistent with the principle of spatial stratified heterogeneity underlying the Geographical Detector framework, which evaluates how explanatory variables correspond to spatial variations in geographic phenomena (Wang et al., 2010, 2016). Importantly, these associations represent statistical spatial correspondence rather than causal mechanisms.
Overall, this study extends global earthquake impact assessments beyond the description of earthquake occurrence patterns by integrating temporal trends, multi-scale spatial analyses, and interaction-based spatial association analysis. The findings provide a comparative understanding of how earthquake characteristics, population exposure, and socioeconomic conditions jointly correspond to heterogeneous disaster impacts across regions, supporting global-scale earthquake risk assessment and preparedness planning.
5.2 Possible explanations for the observed spatiotemporal patterns
5.2.1 Spatial organization of earthquake characteristics, exposure, and disaster impacts
The weighted centroid analyses reveal distinct spatial organizations among different dimensions of earthquake disaster impacts. While unweighted centroids mainly represent the distribution of recorded earthquake disaster events, population-, fatality-, and economic loss-weighted centroids reflect different spatial patterns of human and economic consequences. These differences indicate that earthquake impacts are not spatially identical to earthquake occurrence patterns, but are associated with the configuration of earthquake characteristics, population exposure, and socioeconomic conditions.
Population- and fatality-weighted centroids show stronger concentration in regions where active tectonic settings overlap with high population exposure, consistent with previous global earthquake risk assessments emphasizing the importance of hazard-exposure relationships in explaining differences in disaster consequences (Jaiswal et al., 2010; Silva et al., 2019). The Geographical Detector results further indicate that earthquake characteristics, population density, and socioeconomic conditions exhibit different levels of spatial explanatory power, while their combinations correspond to stronger spatial differentiation than individual factors alone.
In contrast, economic loss-weighted centroids show greater concentration toward regions with high economic activity and asset accumulation, reflecting differences between the spatial patterns of human losses and economic losses (Daniell et al., 2011; Silva et al., 2019). Overall, centroid variations represent changes in the spatial distribution of recorded earthquake disaster impacts rather than migration of seismic activity or changes in tectonic processes.
5.2.2 Data uncertainty and robustness assessment
Although EM-DAT is one of the most widely used global disaster databases, uncertainties related to database inclusion criteria and reporting consistency should be considered when interpreting the results. EM-DAT records earthquake disasters based on reported impacts rather than providing a complete catalogue of all earthquake occurrences. Therefore, temporal variations in recorded disaster events may reflect a combination of changes in disaster frequency, impact thresholds, population exposure, and reporting practices. The increasing number of recorded earthquake disasters identified in this study should consequently be interpreted as changes in recorded disaster impacts rather than direct evidence of increasing global seismic activity.
The robustness of temporal patterns was evaluated through multiple sensitivity analyses. Because event-normalized indicators are affected by the number and composition of recorded events, metrics such as average fatalities per event may reflect both changes in event frequency and the disproportionate contribution of extreme disasters. These indicators were therefore interpreted as supplementary measures of event-level impact characteristics rather than independent evidence of systematic changes in earthquake disaster severity. Excluding the five most catastrophic earthquake disasters (the 2004 Sumatra–Andaman earthquake and Indian Ocean tsunami, 2008 Wenchuan earthquake, 2010 Haiti earthquake, 2011 Great East Japan earthquake and tsunami, and 2023 Türkiye–Syria earthquake) resulted in generally consistent temporal patterns, although the magnitude of some trends changed (Fig. S2 and Table S3). Sensitivity analyses using different earthquake magnitude subsets (Mw ≥ 5, Mw ≥ 6, and Mw ≥ 7) also showed that the overall interpretation of earthquake impact heterogeneity remained stable under different event compositions (Table S15).
Uncertainty in spatial redistribution analysis was assessed using bootstrap resampling of centroid locations and displacement distances. Because centroid estimates can be sensitive to individual high-impact events, confidence intervals were derived from resampled centroid distributions rather than from single observed estimates. The resulting uncertainty ranges of centroid locations and migration distances are summarized in Table S6. Therefore, centroid variations are interpreted as changes in the statistical distribution of recorded earthquake disaster impacts rather than migration of seismic activity or changes in tectonic processes.
The robustness of the Geographical Detector results was further examined through sensitivity analyses of variable discretization schemes. Alternative classification methods and numbers of strata were compared, and the selected schemes showed relatively stable q-statistic values across different settings (Fig. S3 and Tables S11 and S12). These results support the stability of the identified spatial associations. However, the q statistic and interaction results represent statistical explanatory power and enhanced spatial correspondence among factors, rather than causal effects or dynamic mechanisms.
Several limitations should still be considered when interpreting the findings. The completeness and accuracy of EM-DAT records may vary among countries and periods, particularly for economic loss information. In addition, GDP-normalized economic losses represent losses relative to aggregate global economic output and should not be interpreted as a direct measure of the economic burden experienced by individual affected countries. Finally, the national-scale analysis may mask subnational differences in exposure and disaster impacts.
5.2.3 Implications for earthquake risk assessment and preparedness planning
The spatial differentiation identified in this study provides implications for earthquake risk assessment and preparedness planning. Previous global earthquake risk assessments have demonstrated that disaster consequences are associated with not only seismic hazard characteristics but also the spatial distribution of exposed populations and economic assets (Jaiswal et al., 2010; Silva et al., 2019). Consistent with this perspective, the Geographical Detector results indicate that earthquake characteristics, population density, and socioeconomic conditions exhibit different levels of spatial explanatory power for earthquake mortality and economic losses. Therefore, regions where severe earthquake characteristics overlap with high population density or concentrated economic assets may represent priority areas for comparative risk screening and scenario-based assessment.
The distinction between mortality-related and economic-loss-related patterns further suggests that different impact dimensions require differentiated assessment strategies. Areas characterized by the combination of strong earthquake characteristics and dense population exposure may require greater attention to potential human losses and emergency preparedness, whereas regions with concentrated economic assets may require additional consideration of potential economic disruption. Similar distinctions between human and economic consequences have been emphasized in global earthquake loss assessments, where exposure characteristics strongly influence the distribution of observed impacts (Daniell et al., 2011; Silva et al., 2019).
Furthermore, the centroid analyses demonstrate that the spatial distribution of earthquake occurrences does not fully represent the distribution of disaster consequences. Therefore, earthquake risk assessment and preparedness planning should incorporate both seismic information and spatial exposure characteristics rather than relying solely on the location or frequency of earthquake events. These findings support integrated approaches that combine hazard characterization with exposure assessment for global-scale earthquake risk management.
5.2.4 Future research directions
Several limitations identified in this study provide directions for future research at the global scale. First, although EM-DAT enables long-term comparison of recorded earthquake disaster impacts, differences in reporting practices, data completeness, and disaster inclusion criteria may affect temporal and regional comparability. Future research could integrate and cross-validate multiple global disaster databases to better characterize these uncertainties and improve the consistency of long-term global earthquake impact assessments.
Second, future studies could further integrate globally consistent, time-varying datasets on earthquake characteristics, population exposure, economic conditions, and disaster preparedness. Such integration would allow more systematic assessment of the spatial associations between earthquake characteristics, exposure, socioeconomic conditions, and recorded disaster impacts across regions and time periods.
Third, future research could examine whether these spatial associations and impact patterns remain stable as population distribution, economic development, and exposure patterns change over time. This would help improve understanding of the evolving geography of earthquake disaster impacts and strengthen global-scale comparative risk assessment under changing socioeconomic conditions.
This study investigated the spatiotemporal evolution and spatial differentiation of global earthquake disaster impacts from 1980 to 2024 by integrating temporal analysis, multi-scale spatial assessment, centroid-based metrics, and Geographical Detector analysis.
The results reveal a temporal divergence between recorded earthquake disaster frequency and impact consequences. Although recorded earthquake disasters and cumulative economic losses increased over the study period, mortality-related indicators showed an overall declining tendency, indicating that different dimensions of earthquake impacts follow distinct temporal trajectories.
Spatial analyses demonstrate substantial heterogeneity across continents, countries, and tectonic regions. While earthquake disasters remain concentrated along major tectonic belts, the spatial distributions of fatalities, affected populations, and economic losses differ markedly. Human and economic impacts also show distinct spatial patterns, reflecting differences in the spatial distributions of population and economic exposure. Centroid analyses further reveal differences in the spatial organization of these impact dimensions. These patterns represent the spatial distribution and redistribution of recorded disaster impacts and should not be interpreted as changes in global seismic activity.
The Geographical Detector results indicate that earthquake characteristics, population density, and socioeconomic conditions are statistically associated with spatial differences in earthquake impacts, while factor interactions generally correspond to stronger spatial differentiation than individual factors alone. The differences between human and economic impacts also suggest that earthquake disaster risk cannot be fully characterized by a single impact dimension. Global earthquake risk assessment and preparedness should therefore consider hazard characteristics together with population and economic exposure, while accounting for the different spatial expressions of human and economic consequences.
The earthquake event data used in this study were obtained from the Emergency Events Database (EM-DAT). Socioeconomic, environmental, governance, and health-related datasets were collected from publicly accessible international databases, including the World Bank and the World Health Organization. Processed data and analysis code supporting the findings of this study are available from the corresponding author upon reasonable request.
The supplement related to this article is available online at https://doi.org/10.5194/nhess-26-4807-2026-supplement.
Zekang Zhang: formal analysis, data curation, visualization, writing – original draft preparation, manuscript formatting; Yingqiao Qiu: methodology; Yanjun Ye: conceptualization, writing – review and editing, supervision; Chaoran Xuan: data curation. All authors have read and agreed to the published version of the manuscript.
The contact author has declared that none of the authors has any competing interests.
Publisher's note: Copernicus Publications remains neutral with regard to jurisdictional claims made in the text, published maps, institutional affiliations, or any other geographical representation in this paper. The authors bear the ultimate responsibility for providing appropriate place names. Views expressed in the text are those of the authors and do not necessarily reflect the views of the publisher.
The authors would like to thank the Editor, Seda Yolsal-Çevikbilen, and the anonymous reviewers for their constructive comments and suggestions on earlier versions of the manuscript, which helped improve the clarity and quality of this work.
This paper was edited by Seda Yolsal-Çevikbilen and reviewed by Tuna Eken and three anonymous referees.
Aksha, S. K. and Khanal, S.: An analysis of social vulnerability to natural hazards in Nepal, Int. J. Disast. Risk Sc., 10, 310–324, https://doi.org/10.1007/s13753-018-0192-7, 2019.
Anbarci, N., Escaleras, M., and Register, C. A.: Earthquake fatalities: The interaction of nature and political economy, J. Public Econ., 89, 1907–1933, https://doi.org/10.1016/j.jpubeco.2004.08.002, 2005.
Ansari, A., Al-Awadhi, T., Al-Rawas, G., and Al-Busaidi, A.: Integrated GIS–AHP based assessment of earthquake vulnerability and risk in residential areas of Al-Seeb, Muscat Governorate (Oman), Sci. Rep., 15, 17618, https://doi.org/10.1038/s41598-025-17618-6, 2025.
Bird, P.: An updated digital model of plate boundaries, Geochem. Geophy. Geosy., 4, 1027, https://doi.org/10.1029/2001gc000252, 2003a.
Bird, P.: PB2002: Plate Boundary and Tectonic Data (2003), data set, http://peterbird.name/oldFTP/PB2002/ (last access: 30 September 2026), 2003b.
Burton, I.: The forensic investigation of root causes and the post-2015 framework for disaster risk reduction, International J. Disast. Risk Re., 12, 1–2, https://doi.org/10.1016/j.ijdrr.2014.08.006, 2015.
Casella, G. and Berger, R. L.: Statistical Inference, 2nd edn., Duxbury/Thomson Learning, Pacific Grove, CA, ISBN 9780534243128, 2002.
Cohen, C. and Werker, E. D.: The political economy of “natural” disasters, J. Conflict Resolut., 52, 795–819, https://doi.org/10.1177/0022002708322157, 2008.
CRED: Protocols: https://doc.emdat.be/_print/docs/protocols/ (last access: 30 September 2026), 2023.
CRED: EM-DAT – The International Disaster Database, https://www.emdat.be/ (last access: 30 September 2026), 2024.
Cutter, S. L.: The changing nature of hazard and disaster risk in the Anthropocene, Annals of the American Association of Geographers, 111, 819–827, https://doi.org/10.1080/24694452.2020.1744423, 2021.
Daniell, J. E., Khazai, B., Wenzel, F., and Vervaeck, A.: The CATDAT damaging earthquakes database, Nat. Hazards Earth Syst. Sci., 11, 2235–2251, https://doi.org/10.5194/nhess-11-2235-2011, 2011.
Daniell, J. E., Vervaeck, A., Wenzel, F., and Khazai, B.: The worldwide economic impact of earthquake disasters, Int. J. Disast. Risk Re., 21, 261–271, https://doi.org/10.1016/j.ijdrr.2016.11.002, 2017.
Delforge, D., Wathelet, V., Below, R., Sofia, C. L., Tonnelier, M., van Loenhout, J. A. F., and Speybroeck, N.: EM-DAT: the Emergency Events Database, Int. J. Disast. Risk Re., 124, 105509, https://doi.org/10.1016/j.ijdrr.2025.105509, 2025.
Duzgun, H. S. B., Yucemen, M. S., Kalaycioglu, H. S., Celik, K., Kemec, S., Ertugay, K., and Deniz, A.: An integrated earthquake vulnerability assessment framework for urban areas, Nat. Hazards, 59, 917–947, https://doi.org/10.1007/s11069-011-9808-6, 2011.
Gall, M., Borden, K. A., and Cutter, S. L.: When Do Losses Count? Six Fallacies of Natural Hazards Loss Data, B. Am. Meteorol. Soc., 90, 799–810, https://doi.org/10.1175/2008BAMS2721.1, 2009.
Guha-Sapir, D., Vos, F., Below, R., and Ponserre, S.: Annual disaster statistical review 2011: The numbers and trends, Centre for Research on the Epidemiology of Disasters (CRED), Brussels, Belgium, https://hdl.handle.net/2078.5/203598 (last access: 1 October 2026), 2012.
Guo, X., Xu, Y., and Li, H.: Assessing social vulnerability to earthquake disaster using county-level data: A case study in Hanzhong City, China, Int. J. Disast. Risk Re., 49, 101632, https://doi.org/10.1016/j.ijdrr.2020.101632, 2020.
Hasterok, D., Halpin, J. A., Collins, A. S., Hand, M., Kreemer, C., Gard, M. G., and Glorie, S.: New Maps of Global Geological Provinces and Tectonic Plates, Earth-Sci. Rev., 231, 104069, https://doi.org/10.1016/j.earscirev.2022.104069, 2022.
Hu, Y., Wang, J., Li, X., Ren, D., and Zhu, J.: Geographical detector-based risk assessment of under-five mortality in the 2008 Wenchuan Earthquake, China, PLoS ONE, 6, e21427, https://doi.org/10.1371/journal.pone.0021427, 2011.
Ismail-Zadeh, A.: Earthquakes yes, disasters no, npj Nat. Hazards, 1, https://doi.org/10.1038/s44304-024-00049-0, 2024.
Jaiswal, K., Wald, D., and Porter, K.: A Global Building Inventory for Earthquake Loss Estimation and Risk Management, Earthq. Spectra, 26, 731–748, https://doi.org/10.1193/1.3450316, 2010.
Jones, R. L., Guha-Sapir, D., and Tubeuf, S.: Human and economic impacts of natural disasters: can we trust the global data?, Sci. Data, 9, 572, https://doi.org/10.1038/s41597-022-01667-x, 2022.
Kagan, Y. Y. and Jackson, D. D.: Long-term probabilistic forecasting of earthquakes, J. Geophys. Res., 99, 13685–13700, https://doi.org/10.1029/94JB00500, 1994.
Keefer, P., Neumayer, E., and Plümper, T.: Earthquake propensity and the politics of mortality prevention, World Dev., 39, 1530–1541, https://doi.org/10.1016/j.worlddev.2011.02.010, 2011.
Lee, S., Dodge, J., and Chen, G.: The cost of social vulnerability: An integrative conceptual framework for assessing financial risks in natural disasters, Nat. Hazards, 114, 691–712, https://doi.org/10.1007/s11069-022-05408-6, 2022.
Li, Y., Zhou, Y., and Wang, L.: Impact of economic development levels on the mortality rates of Asian earthquakes, Int. J. Disast. Risk Re., 62, 102409, https://doi.org/10.1016/j.ijdrr.2021.102409, 2021.
Noy, I.: The economics of natural disasters: A survey, International Review of Environmental and Resource Economics, 9, 71–108, https://doi.org/10.1561/101.00000068, 2016.
Peduzzi, P. and Herold, H. D. C.: Mapping Disastrous Natural Hazards Using Global Datasets, Nat. Hazards, 35, 265–289, https://doi.org/10.1007/s11069-004-5703-8, 2005.
Reid, P.: Disasters and social inequalities, Sociology Compass, 7, 878–894, https://doi.org/10.1111/soc4.12080, 2013.
Rosvold, E. L. and Buhaug, H.: GDIS, a global dataset of geocoded disaster locations, Sci. Data, 8, 61, https://doi.org/10.1038/s41597-021-00846-6, 2021.
Silva, V., Amo-Oduro, D., Calderon, A., Costa, C., Dabbeek, J., Despotaki, V., Martins, L., Pagani, M., Rao, A., Simionato, M., Vigano, D., Yepes-Estrada, C., and Crowley, H.: Assessing seismic hazard and risk globally for an earthquake resilient world, United Nations Office for Disaster Risk Reduction (UNDRR), Contributing Paper to GAR 2019, https://www.undrr.org/quick/11723 (last access: 30 September 2026), 2019.
Sims, K., Reith, A., Bright, E., McKee, J., and Rose, A.: LandScan Global 2021 (2021), Oak Ridge National Laboratory [data set], https://doi.org/10.48690/1527702, 2022.
United Nations Office for Disaster Risk Reduction (UNDRR): Global Assessment Report on Disaster Risk Reduction 2023 (GAR2023), UNDRR, Geneva, https://www.undrr.org/gar (last access: 30 September 2026), 2023.
U.S. Geological Survey: ANSS Comprehensive Earthquake Catalog (ComCat), U.S. Geological Survey, https://earthquake.usgs.gov/data/comcat/ (last access: 30 September 2026), 2026.
Wang, J. F., Li, X. H., Christakos, G., Liao, Y. L., Zhang, T., Gu, X., and Zheng, X. Y.: Geographical Detectors-Based Health Risk Assessment and its Application in the Neural Tube Defects Study of the Heshun Region, China, Int. J. Geogr. Inf. Sci., 24, 107–127, https://doi.org/10.1080/13658810802443457, 2010.
Wang, J. F., Zhang, T. L., and Fu, B. J.: A measure of spatial stratified heterogeneity, Ecol. Indic., 67, 250–256, https://doi.org/10.1016/j.ecolind.2016.02.052, 2016.
Wang, X., Xia, J., Dong, B., Zhou, M., and Deng, S.: Spatiotemporal distribution of flood disasters in Asia and influencing factors in 1980–2019, Nat. Hazards, 108, 2721–2738, https://doi.org/10.1007/s11069-021-04798-3, 2021.
World Bank: Environmental, social, and governance (ESG) data, https://databank.worldbank.org/source/environment-social-and-governance-(esg)-data (last access: 22 July 2025), 2025.
Wyss, M., Speiser, M., and Tolis, S.: Earthquake fatalities and potency, Nat. Hazards, 119, 1091–1106, https://doi.org/10.1007/s11069-022-05627-x, 2023.
Xofi, M., Gkimisi, A., and Karatza, M.: Exposure and physical vulnerability indicators to assess seismic risk, GeoRisk: Assessment and Management of Risk for Engineered Systems and Geohazards, 16, 209–226, https://doi.org/10.1080/19475705.2022.2068457, 2022.
Zaliapin, I. and Ben-Zion, Y.: Earthquake clusters in Southern California I: Identification and stability, J. Geophys. Res.-Sol. Ea., 118, https://doi.org/10.1002/jgrb.50179, 2013.