
Articles | Volume 26, issue 10
https://doi.org/10.5194/nhess-26-4741-2026
© Author(s) 2026. This work is distributed under
the Creative Commons Attribution 4.0 License.
the Creative Commons Attribution 4.0 License.
https://doi.org/10.5194/nhess-26-4741-2026
© Author(s) 2026. This work is distributed under
the Creative Commons Attribution 4.0 License.
the Creative Commons Attribution 4.0 License.
Research article
| 
02 Oct 2026
Research article |
| 02 Oct 2026
| 02 Oct 2026
RHITA: a web tool for real-time detection of extreme weather events
Greta Cazzaniga
Laboratoire des Sciences du Climat et de l'Environnement, UMR 8212 CEA-CNRS-UVSQ, Université Paris-Saclay, IPSL, 91191 Gif-sur-Yvette, France
Anastasia Akakpo-Numado
Laboratoire des Sciences du Climat et de l'Environnement, UMR 8212 CEA-CNRS-UVSQ, Université Paris-Saclay, IPSL, 91191 Gif-sur-Yvette, France
Patrick Brockmann
Laboratoire des Sciences du Climat et de l'Environnement, UMR 8212 CEA-CNRS-UVSQ, Université Paris-Saclay, IPSL, 91191 Gif-sur-Yvette, France
Adrien Burq
Laboratoire des Sciences du Climat et de l'Environnement, UMR 8212 CEA-CNRS-UVSQ, Université Paris-Saclay, IPSL, 91191 Gif-sur-Yvette, France
Mathieu Vrac
Laboratoire des Sciences du Climat et de l'Environnement, UMR 8212 CEA-CNRS-UVSQ, Université Paris-Saclay, IPSL, 91191 Gif-sur-Yvette, France
Davide Faranda
CORRESPONDING AUTHOR

Laboratoire des Sciences du Climat et de l'Environnement, UMR 8212 CEA-CNRS-UVSQ, Université Paris-Saclay, IPSL, 91191 Gif-sur-Yvette, France
London Mathematical Laboratory, 8 Margravine Gardens, London, W6 8RH, UK
Laboratoire de Météorologie Dynamique/IPSL, École Normale Supérieure, PSL Research University, Sorbonne Université, École Polytechnique, IP Paris, CNRS, Paris, 75005, France
Related authors
Roberto Nebuloni, Maximilian Graf, Greta Cazzaniga, François Mercier, and Maxime Turko
Earth Syst. Sci. Data, 18, 7455–7473, https://doi.org/10.5194/essd-18-7455-2026, https://doi.org/10.5194/essd-18-7455-2026, 2026
Short summary
Short summary
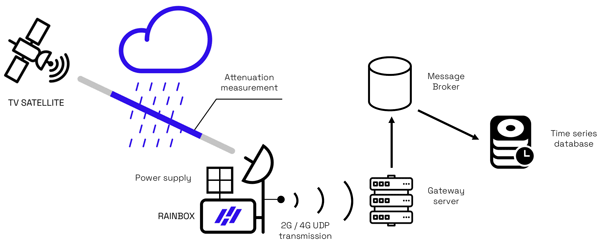
We describe the OpenSat4Weather public dataset, which provides time series of received power from 215 TV-SAT satellite microwave links located in Southern France over a five-month observation period and at 1-min resolution. These data can be processed to gather indirect rainfall intensity measurements. OpenSat4Weather also includes concurrent data from operational rain gauges and weather radars, and ERA5 0°C isotherm height data, to derive the wet fraction of the satellite-to-ground path.
Greta Cazzaniga, Carlo De Michele, Michele D'Amico, Cristina Deidda, Antonio Ghezzi, and Roberto Nebuloni
Hydrol. Earth Syst. Sci., 26, 2093–2111, https://doi.org/10.5194/hess-26-2093-2022, https://doi.org/10.5194/hess-26-2093-2022, 2022
Short summary
Short summary
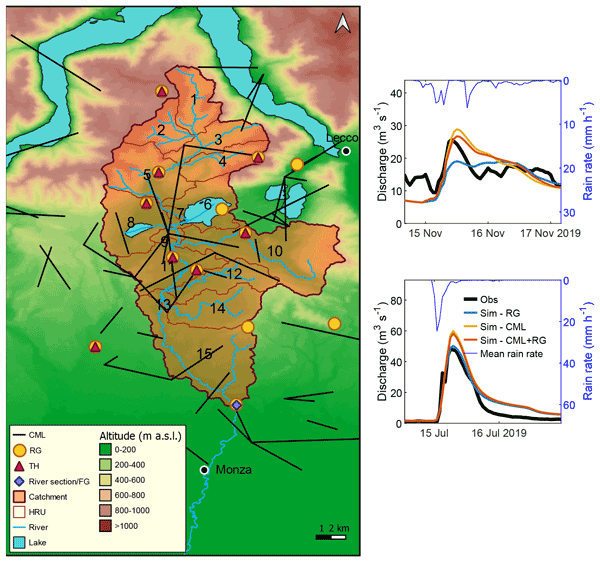
Rainfall estimates are usually obtained from rain gauges, weather radars, or satellites. An alternative is the measurement of the signal loss induced by rainfall on commercial microwave links (CMLs). In this work, we assess the hydrologic response of Lambro Basin when CML-retrieved rainfall is used as model input. CML estimates agree with rain gauge data. CML-driven discharge simulations show performance comparable to that from rain gauges if a CML-based calibration of the model is undertaken.
Roberto Nebuloni, Maximilian Graf, Greta Cazzaniga, François Mercier, and Maxime Turko
Earth Syst. Sci. Data, 18, 7455–7473, https://doi.org/10.5194/essd-18-7455-2026, https://doi.org/10.5194/essd-18-7455-2026, 2026
Short summary
Short summary
We describe the OpenSat4Weather public dataset, which provides time series of received power from 215 TV-SAT satellite microwave links located in Southern France over a five-month observation period and at 1-min resolution. These data can be processed to gather indirect rainfall intensity measurements. OpenSat4Weather also includes concurrent data from operational rain gauges and weather radars, and ERA5 0°C isotherm height data, to derive the wet fraction of the satellite-to-ground path.
Adrien Burq, Jean Jouhaud, Victor Xing, Victor Bouvier, Vincent Forcadell, Mateusz Taszarek, Mathieu Vrac, and Davide Faranda
EGUsphere, https://doi.org/10.5194/egusphere-2026-4363, https://doi.org/10.5194/egusphere-2026-4363, 2026
Short summary
Short summary
Lightning is a small-scale process that climate and weather models cannot compute exactly, so it must be approximated. Here we build a deep learning model that predicts lightning across a whole region at once, using inputs from the whole region, and compare it to models that predict each pixel separately. Using this larger-scale information proves beneficial: our model outperforms the single-pixel ones. We also identify the spatial scale and the environmental predictors that matter most.
Ségolène Crossouard, Soulivanh Thao, Thomas Dubos, Masa Kageyama, Mathieu Vrac, and Yann Meurdesoif
Geosci. Model Dev., 19, 5907–5931, https://doi.org/10.5194/gmd-19-5907-2026, https://doi.org/10.5194/gmd-19-5907-2026, 2026
Short summary
Short summary
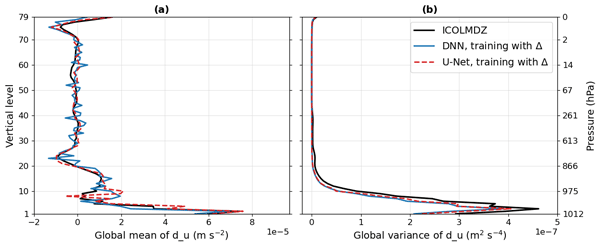
Current atmospheric models are limited by the computational time required for physical processes, known as physical parameterizations. To address this, we developed neural network-based emulators to replace these parameterizations in the IPSL climate model, using a simplified aquaplanet setup and a realistic configuration. We found that incorporating some physical knowledge, such as latent variables, into the learning process can improve predictions.
Grégoire Jacquemin, Mathieu Vrac, Xavier Freulon, and Denis Allard
EGUsphere, https://doi.org/10.5194/egusphere-2026-3269, https://doi.org/10.5194/egusphere-2026-3269, 2026
This preprint is open for discussion and under review for Natural Hazards and Earth System Sciences (NHESS).
Short summary
Short summary
The outputs of climate simulations can be used to project the evolution of compound events in terms of frequency, but they are known to be statistically biased. This study evaluates three bias correction methods on two extremal statistics. Results show that bias correction is necessary to improve the statistical characterization of compound events. This work also reveals that the evolution of compound events in the simulations is preserved by the bias correction methods most of the time.
Tom Dörffel, Natalia Mikula, Lisa Schielicke, Theresa Kiszler, Davide Faranda, Berengere Dubrulle, and Nikki Vercauteren
EGUsphere, https://doi.org/10.5194/egusphere-2026-2918, https://doi.org/10.5194/egusphere-2026-2918, 2026
Short summary
Short summary
We investigate how two different indicators related to measures of energy transfer can be used to assess the dynamics of tropical cyclones. One indicator is based on the energy redistribution across length-scales and the other one is based on more fundamental thermodynamic principles. This research demonstrates the potential of these indicators of being used as predictors for the intensity change of tropical cyclones even in under-resolved simulations.
Clara Naldesi, Nathalie Bertrand, Davide Faranda, and Mathieu Vrac
EGUsphere, https://doi.org/10.5194/egusphere-2026-1466, https://doi.org/10.5194/egusphere-2026-1466, 2026
Short summary
Short summary
The public increasingly needs to know whether and how climate change influences specific extreme events. ClimaMeter is a scientific tool designed to address this demand. This paper reviews the ClimaMeter methodology, focusing on how it estimates the relative roles of natural variability and climate change. We propose a more flexible and general approach within the same framework, enabling a more nuanced assessment of natural variability.
Yoann Robin, Mathieu Vrac, Aurélien Ribes, Occitane Barbaux, and Philippe Naveau
Geosci. Model Dev., 19, 2349–2372, https://doi.org/10.5194/gmd-19-2349-2026, https://doi.org/10.5194/gmd-19-2349-2026, 2026
Short summary
Short summary
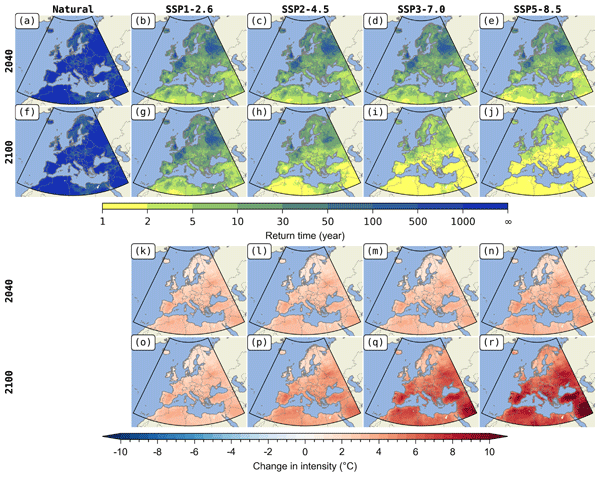
We describe an improved method and the associated free licensed package ANKIALE (ANalysis of Klimate with bayesian Inference: AppLication to extreme Events) for estimating the statistics of temperature extremes. This method uses climate model simulations (including multiple scenarios simultaneously) to provide a prior of the real-world changes, constrained by the observations. The method and the tool are illustrated via an application to temperature over Europe until 2100, for four scenarios.
Tommaso Alberti, Davide Faranda, Mohamed Foudad, Erika Coppola, Lia Rapella, Rachel Burbidge, Miguel A. C. Teixeira, and Paul Williams
EGUsphere, https://doi.org/10.5194/egusphere-2026-1178, https://doi.org/10.5194/egusphere-2026-1178, 2026
Short summary
Short summary
We developed TurboMeter to study whether climate change is making airplane turbulence stronger. By comparing current atmospheric conditions with similar past situations, we find that most turbulence events in 2024 were intensified by human-caused climate change, especially over the North Atlantic, East Asia, and the United States. This work shows that climate change is already affecting flight safety and highlights the need for climate-informed planning in aviation.
Valerio Lembo, Gabriele Messori, Davide Faranda, Vera Melinda Galfi, Rune Grand Graversen, and Flavio Emanuele Pons
Weather Clim. Dynam., 7, 453–473, https://doi.org/10.5194/wcd-7-453-2026, https://doi.org/10.5194/wcd-7-453-2026, 2026
Short summary
Short summary
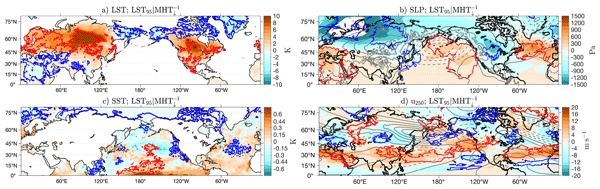
Hemispheric heatwaves have fundamental implications for ecosystems and societies. They are studied together with large-scale atmospheric dynamics, through the lens of poleward heat transports by planetary-scale waves. Extremely weak transports of heat towards the North Pole are found to be associated with hemispheric heatwaves in the Northern Hemisphere mid-latitudes. Therefore, we conclude that heat transports are a possible indicator and a precursor of concurrent hemispheric heatwaves.
Davide Faranda, Lucas Taligrot, Pascal Yiou, and Nada Caud
Geosci. Commun., 9, 115–125, https://doi.org/10.5194/gc-9-115-2026, https://doi.org/10.5194/gc-9-115-2026, 2026
Short summary
Short summary
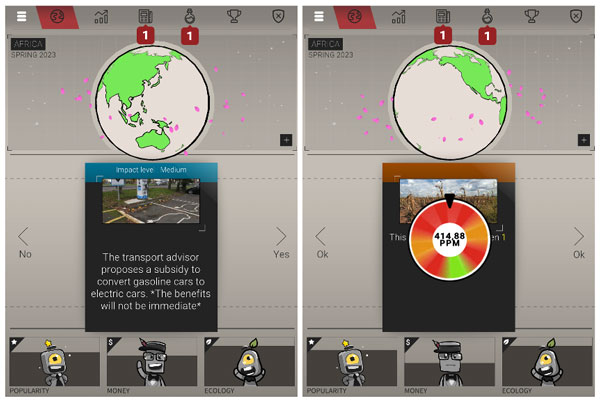
We developed a free online game called ClimarisQ to help people better understand climate change and extreme weather. By playing the game, users learn how decisions about the environment, money, and public opinion affect future risks. We studied how players reacted and found that the game makes climate issues easier to grasp and encourages discussion. This shows that interactive tools like games can support learning and action on climate and environmental challenges.
Joséphine Schmutz, Mathieu Vrac, Bastien François, and Burak Bulut
Nat. Hazards Earth Syst. Sci., 26, 881–900, https://doi.org/10.5194/nhess-26-881-2026, https://doi.org/10.5194/nhess-26-881-2026, 2026
Short summary
Short summary
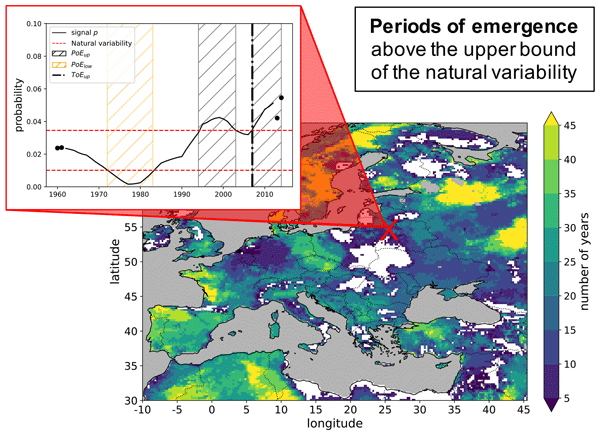
In recent years, Europe has faced severe hot and dry events affecting biodiversity, agriculture, and health. Understanding past significant variation in their occurrence is key for adaptation. This paper identifies emerging hotspots in Europe and North Africa. Since the 1970s, the Iberian Peninsula, Maghreb, and Central Europe have seen more frequent events, driven by rising temperature maxima, while Eastern Europe has experienced a decline due to changes in drought.
Guillaume Evin, Benoit Hingray, Guillaume Thirel, Agnès Ducharne, Laurent Strohmenger, Lola Corre, Yves Tramblay, Jean-Philippe Vidal, Jérémie Bonneau, François Colleoni, Joël Gailhard, Florence Habets, Frédéric Hendrickx, Louis Héraut, Peng Huang, Matthieu Le Lay, Claire Magand, Paola Marson, Céline Monteil, Simon Munier, Alix Reverdy, Jean-Michel Soubeyroux, Yoann Robin, Jean-Pierre Vergnes, Mathieu Vrac, and Eric Sauquet
Hydrol. Earth Syst. Sci., 30, 1023–1051, https://doi.org/10.5194/hess-30-1023-2026, https://doi.org/10.5194/hess-30-1023-2026, 2026
Short summary
Short summary
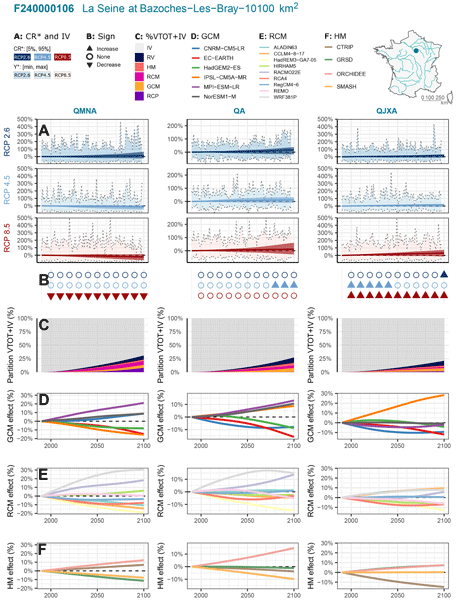
Explore2 provides hydrological projections for 1,735 French catchments. Using QUALYPSO (Quasi-Ergodic Analysis of Climate Projections Using Data Augmentation), this study assesses uncertainties, including internal variability. By the end of the century, low flows are projected to decline in southern France under high emissions, while other indicators remain uncertain. Emission scenarios and regional climate models are key uncertainty sources. Internal variability is often as large as climate-driven changes.
Davide Faranda, Thibault Guinaldo, Francisco Pastor, Tommaso Alberti, and Samira Khodayar
EGUsphere, https://hal.science/hal-05289765v1, https://hal.science/hal-05289765v1, 2026
Short summary
Short summary
The Mediterranean Sea experienced a record-breaking heatwave in summer 2025. We compared this event to similar patterns from past decades to see how a warmer climate changed its strength. We found that today's warmer background added about 1.5 °C to the sea surface, making the heatwave far more intense and widespread. This shows how climate change is turning ordinary weather patterns into extreme events, with major impacts on marine life, coastal communities, and economies.
Pradeebane Vaittinada Ayar, Stella Bourdin, Davide Faranda, and Mathieu Vrac
Nat. Hazards Earth Syst. Sci., 25, 4655–4672, https://doi.org/10.5194/nhess-25-4655-2025, https://doi.org/10.5194/nhess-25-4655-2025, 2025
Short summary
Short summary
Tracking tropical cyclones (TCs) remains a matter of interest for investigating observed and simulated tropical cyclones. In this study, Random Forest (RF), a machine learning approach, is considered to track TCs. RF associates the TC occurrence or absence with different atmospheric configurations. Compared to trackers found in the literature, it shows similar performance for tracking TCs, better control over false alarms, more flexibility, and reveals key variables for TCs' detection.
Emmanouil Flaounas, Stavros Dafis, Silvio Davolio, Davide Faranda, Christian Ferrarin, Katharina Hartmuth, Assaf Hochman, Aristeidis Koutroulis, Samira Khodayar, Mario Marcello Miglietta, Florian Pantillon, Platon Patlakas, Michael Sprenger, and Iris Thurnherr
Weather Clim. Dynam., 6, 1515–1538, https://doi.org/10.5194/wcd-6-1515-2025, https://doi.org/10.5194/wcd-6-1515-2025, 2025
Short summary
Short summary
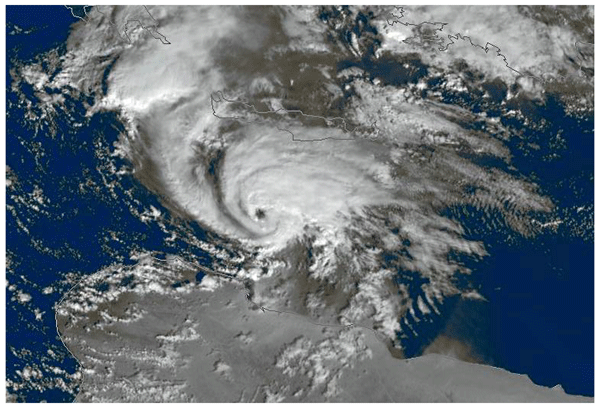
Storm Daniel (2023) is one of the most catastrophic storms ever documented in the Mediterranean. Our results highlight the different dynamics and therefore the different predictability skill of precipitation, its extremes and impacts that have been produced in Greece and Libya, the two most affected countries. Our approach concerns an analysis of the storm by articulating dynamics, weather prediction, hydrological and oceanographic implications, climate extremes, and attribution theory.
Germain Bénard, Marion Gehlen, and Mathieu Vrac
EGUsphere, https://doi.org/10.5194/egusphere-2025-4680, https://doi.org/10.5194/egusphere-2025-4680, 2025
Preprint archived
Short summary
Short summary
Climate change is transforming ocean ecosystem dynamics. We used causality methods to study how the relationships between ocean physics and biogeochemistry will change in the North Atlantic over the next century. By analyzing five different climate models, we discovered that environmental drivers' influence on ocean productivity evolves in complex ways under global warming. One environmental driver can become of major importance while others can become irrelevant.
Lia Rapella, Tommaso Alberti, Davide Faranda, and Philippe Drobinski
Weather Clim. Dynam., 6, 1339–1363, https://doi.org/10.5194/wcd-6-1339-2025, https://doi.org/10.5194/wcd-6-1339-2025, 2025
Short summary
Short summary
Extreme weather events pose increasing challenges for aviation, including flight disruptions and infrastructure damage. This study examines the influence of anthropogenic climate change on four recent major storms across Europe, the USA, and East Asia. Our research underscores the growing intensity of extreme storms, driven by human-induced climate change, stressing the need to adapt aviation strategies to an increasingly hazardous environment.
Paul C. Astagneau, Raul R. Wood, Mathieu Vrac, Sven Kotlarski, Pradeebane Vaittinada Ayar, Bastien François, and Manuela I. Brunner
Hydrol. Earth Syst. Sci., 29, 5695–5718, https://doi.org/10.5194/hess-29-5695-2025, https://doi.org/10.5194/hess-29-5695-2025, 2025
Short summary
Short summary
To study floods and droughts that are likely to change in the future, we use climate projections from climate models. However, we first need to adjust the systematic biases of these projections at the catchment scale before using them in hydrological models. Our study compares statistical methods that can adjust these biases but specifically for climate projections that enable a quantification of internal climate variability. We provide recommendations on the most appropriate methods.
Denis Allard, Mathieu Vrac, Bastien François, and Iñaki García de Cortázar-Atauri
Hydrol. Earth Syst. Sci., 29, 4711–4738, https://doi.org/10.5194/hess-29-4711-2025, https://doi.org/10.5194/hess-29-4711-2025, 2025
Short summary
Short summary
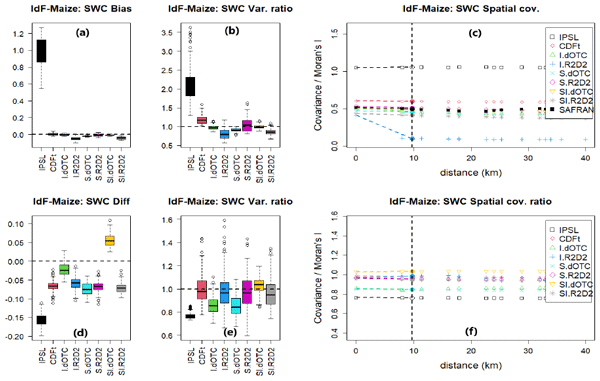
Atmospheric variables from climate models often present biases relative to the past. In order to use these models to assess the impact of climate change on processes of interest, it is necessary to correct these biases. We tested several Multivariate Bias Correction Methods (MBCMs) for 5 physical variables that are input variables for 4 process models. We provide recommendations regarding the use of MBCMs when multivariate and time dependent processes are involved.
Kerry Emanuel, Tommaso Alberti, Stella Bourdin, Suzana J. Camargo, Davide Faranda, Emmanouil Flaounas, Juan Jesus Gonzalez-Aleman, Chia-Ying Lee, Mario Marcello Miglietta, Claudia Pasquero, Alice Portal, Hamish Ramsay, Marco Reale, and Romualdo Romero
Weather Clim. Dynam., 6, 901–926, https://doi.org/10.5194/wcd-6-901-2025, https://doi.org/10.5194/wcd-6-901-2025, 2025
Short summary
Short summary
Storms strongly resembling hurricanes are sometimes observed to form well outside the tropics, even in polar latitudes. They behave capriciously, developing very rapidly and then dying just as quickly. We show that strong dynamical processes in the atmosphere can sometimes cause it to become much colder locally than the underlying ocean, creating the conditions for hurricanes to form but only over small areas and for short times. We call the resulting storms "CYCLOPs".
Robin Noyelle, Davide Faranda, Yoann Robin, Mathieu Vrac, and Pascal Yiou
Weather Clim. Dynam., 6, 817–839, https://doi.org/10.5194/wcd-6-817-2025, https://doi.org/10.5194/wcd-6-817-2025, 2025
Short summary
Short summary
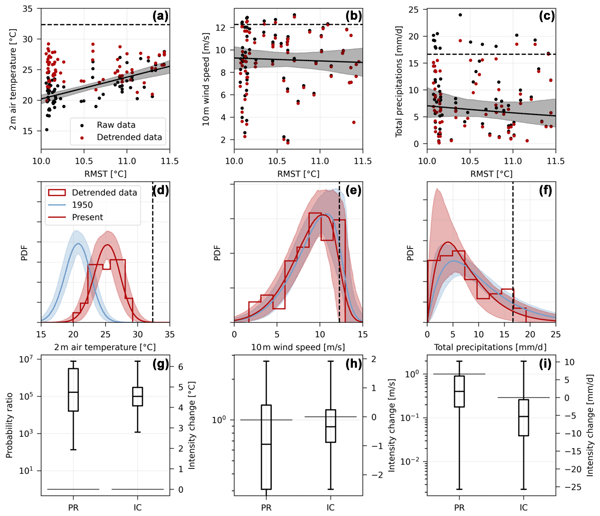
Properties of extreme meteorological and climatological events are changing under human-caused climate change. Extreme event attribution methods seek to estimate the contribution of global warming in the probability and intensity changes of extreme events. Here we propose a procedure to estimate these quantities for the flow analogue method, which compares the observed event to similar events in the past.
Duncan Pappert, Alexandre Tuel, Dim Coumou, Mathieu Vrac, and Olivia Martius
Weather Clim. Dynam., 6, 769–788, https://doi.org/10.5194/wcd-6-769-2025, https://doi.org/10.5194/wcd-6-769-2025, 2025
Short summary
Short summary
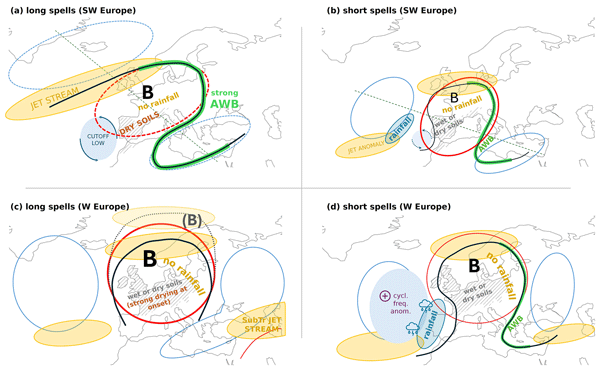
This study compares the dynamical structures that characterise long-lasting (persistent) and short hot spells in Western Europe. We find differences in large-scale atmospheric flow patterns during the events and particular soil moisture evolutions, which can account for the variation in event duration. There is variability in how drivers combine in individual events. Understanding persistent heat extremes can help improve their representation in models and ultimately their prediction.
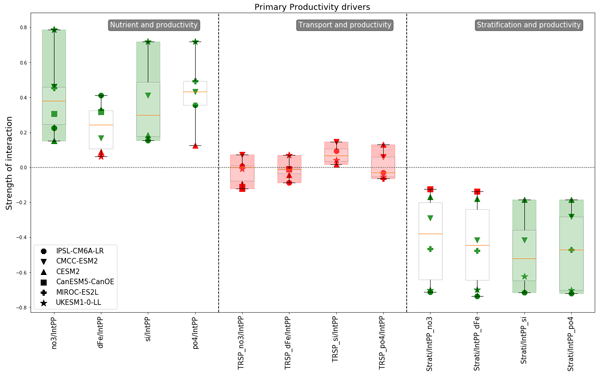
Germain Bénard, Marion Gehlen, and Mathieu Vrac
Earth Syst. Dynam., 16, 1085–1102, https://doi.org/10.5194/esd-16-1085-2025, https://doi.org/10.5194/esd-16-1085-2025, 2025
Short summary
Short summary
We introduce a novel approach to compare Earth system model output using a causality-based approach. The analysis of interactions between atmospheric, oceanic and biogeochemical variables in the North Atlantic subpolar gyre highlights the dynamics of each model. This method reveals potential underlying causes of model differences, offering a tool for enhanced model evaluation and improved understanding of complex Earth system dynamics under past and future climates.
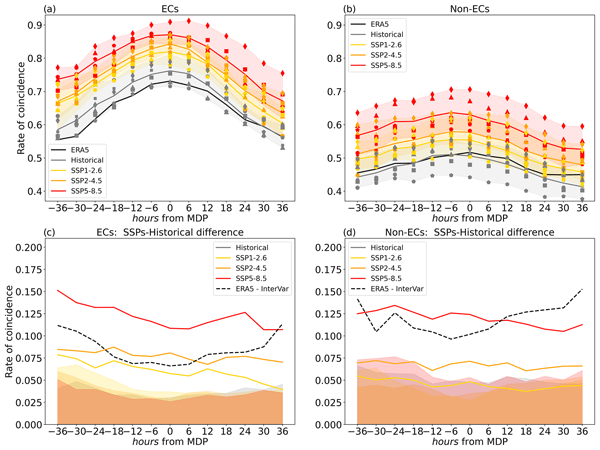
Ferran Lopez-Marti, Mireia Ginesta, Davide Faranda, Anna Rutgersson, Pascal Yiou, Lichuan Wu, and Gabriele Messori
Earth Syst. Dynam., 16, 169–187, https://doi.org/10.5194/esd-16-169-2025, https://doi.org/10.5194/esd-16-169-2025, 2025
Short summary
Short summary
Explosive cyclones and atmospheric rivers are two main drivers of extreme weather in Europe. In this study, we investigate their joint changes in future climates over the North Atlantic. Our results show that both the concurrence of these events and the intensity of atmospheric rivers increase by the end of the century across different future scenarios. Furthermore, explosive cyclones associated with atmospheric rivers last longer and are deeper than those without atmospheric rivers.
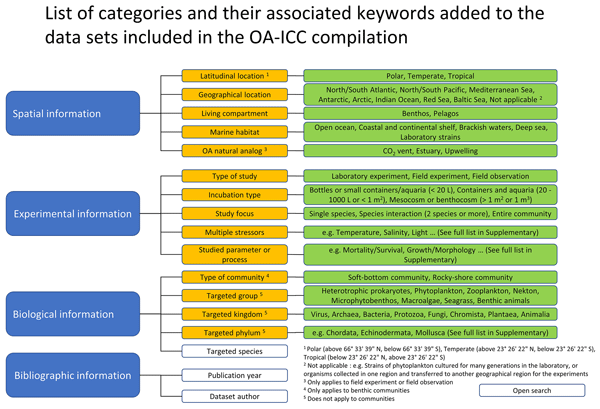
Yan Yang, Patrick Brockmann, Carolina Galdino, Uwe Schindler, and Frédéric Gazeau
Earth Syst. Sci. Data, 16, 3771–3780, https://doi.org/10.5194/essd-16-3771-2024, https://doi.org/10.5194/essd-16-3771-2024, 2024
Short summary
Short summary
Studies investigating the effects of ocean acidification on marine organisms and communities have been steadily increasing. To facilitate data comparison, a data compilation hosted by the PANGAEA Data Publisher was initiated in 2008 and is updated on a regular basis. By November 2023, a total of 1501 datasets (~25 million data points) from 1554 papers have been archived. To filter and access relevant biological response data from this compilation, a user-friendly portal was launched in 2018.
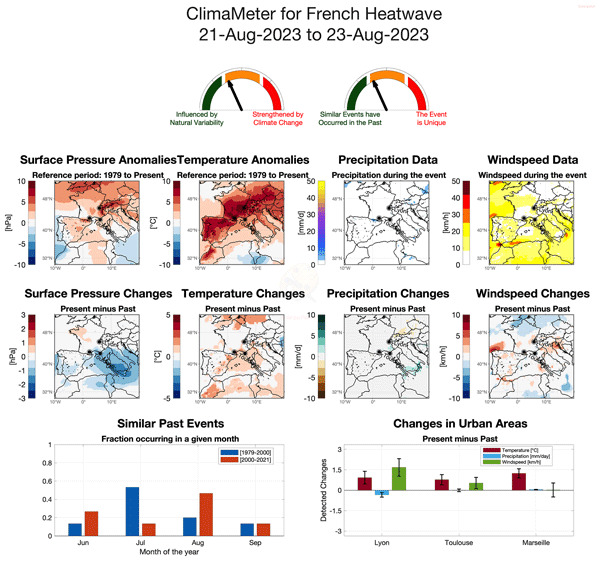
Davide Faranda, Gabriele Messori, Erika Coppola, Tommaso Alberti, Mathieu Vrac, Flavio Pons, Pascal Yiou, Marion Saint Lu, Andreia N. S. Hisi, Patrick Brockmann, Stavros Dafis, Gianmarco Mengaldo, and Robert Vautard
Weather Clim. Dynam., 5, 959–983, https://doi.org/10.5194/wcd-5-959-2024, https://doi.org/10.5194/wcd-5-959-2024, 2024
Short summary
Short summary
We introduce ClimaMeter, a tool offering real-time insights into extreme-weather events. Our tool unveils how climate change and natural variability affect these events, affecting communities worldwide. Our research equips policymakers and the public with essential knowledge, fostering informed decisions and enhancing climate resilience. We analysed two distinct events, showcasing ClimaMeter's global relevance.
Mathieu Vrac, Denis Allard, Grégoire Mariéthoz, Soulivanh Thao, and Lucas Schmutz
Earth Syst. Dynam., 15, 735–762, https://doi.org/10.5194/esd-15-735-2024, https://doi.org/10.5194/esd-15-735-2024, 2024
Short summary
Short summary
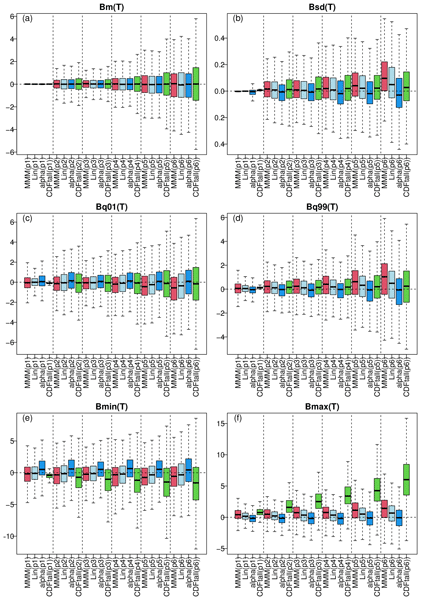
We aim to combine multiple global climate models (GCMs) to enhance the robustness of future projections. We introduce a novel approach, called "α pooling", aggregating the cumulative distribution functions (CDFs) of the models into a CDF more aligned with historical data. The new CDFs allow us to perform bias adjustment of all the raw climate simulations at once. Experiments with European temperature and precipitation demonstrate the superiority of this approach over conventional techniques.
Moctar Dembélé, Mathieu Vrac, Natalie Ceperley, Sander J. Zwart, Josh Larsen, Simon J. Dadson, Grégoire Mariéthoz, and Bettina Schaefli
Proc. IAHS, 385, 121–127, https://doi.org/10.5194/piahs-385-121-2024, https://doi.org/10.5194/piahs-385-121-2024, 2024
Short summary
Short summary
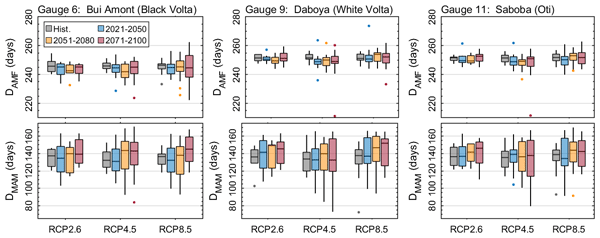
This study assesses the impact of climate change on the timing, seasonality and magnitude of mean annual minimum (MAM) flows and annual maximum flows (AMF) in the Volta River basin (VRB). Several climate change projection data are use to simulate river flow under multiple greenhouse gas emission scenarios. Future projections show that AMF could increase with various magnitude but negligible shift in time across the VRB, while MAM could decrease with up to 14 days of delay in occurrence.
Lucas Fery and Davide Faranda
Weather Clim. Dynam., 5, 439–461, https://doi.org/10.5194/wcd-5-439-2024, https://doi.org/10.5194/wcd-5-439-2024, 2024
Short summary
Short summary
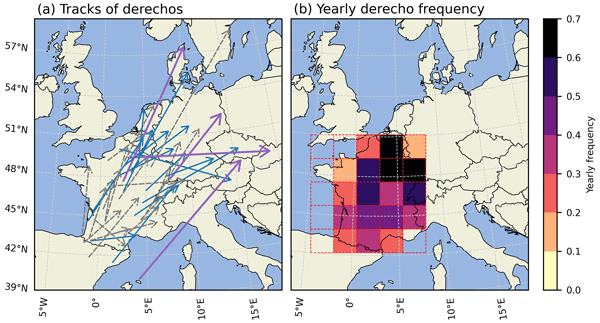
In this study, we analyse warm-season derechos – a type of severe convective windstorm – in France between 2000 and 2022, identifying 38 events. We compare their frequency and features with other countries. We also examine changes in the associated large-scale patterns. We find that convective instability has increased in southern Europe. However, the attribution of these changes to natural climate variability, human-induced climate change or a combination of both remains unclear.
Matthew J. McGrath, Ana Maria Roxana Petrescu, Philippe Peylin, Robbie M. Andrew, Bradley Matthews, Frank Dentener, Juraj Balkovič, Vladislav Bastrikov, Meike Becker, Gregoire Broquet, Philippe Ciais, Audrey Fortems-Cheiney, Raphael Ganzenmüller, Giacomo Grassi, Ian Harris, Matthew Jones, Jürgen Knauer, Matthias Kuhnert, Guillaume Monteil, Saqr Munassar, Paul I. Palmer, Glen P. Peters, Chunjing Qiu, Mart-Jan Schelhaas, Oksana Tarasova, Matteo Vizzarri, Karina Winkler, Gianpaolo Balsamo, Antoine Berchet, Peter Briggs, Patrick Brockmann, Frédéric Chevallier, Giulia Conchedda, Monica Crippa, Stijn N. C. Dellaert, Hugo A. C. Denier van der Gon, Sara Filipek, Pierre Friedlingstein, Richard Fuchs, Michael Gauss, Christoph Gerbig, Diego Guizzardi, Dirk Günther, Richard A. Houghton, Greet Janssens-Maenhout, Ronny Lauerwald, Bas Lerink, Ingrid T. Luijkx, Géraud Moulas, Marilena Muntean, Gert-Jan Nabuurs, Aurélie Paquirissamy, Lucia Perugini, Wouter Peters, Roberto Pilli, Julia Pongratz, Pierre Regnier, Marko Scholze, Yusuf Serengil, Pete Smith, Efisio Solazzo, Rona L. Thompson, Francesco N. Tubiello, Timo Vesala, and Sophia Walther
Earth Syst. Sci. Data, 15, 4295–4370, https://doi.org/10.5194/essd-15-4295-2023, https://doi.org/10.5194/essd-15-4295-2023, 2023
Short summary
Short summary
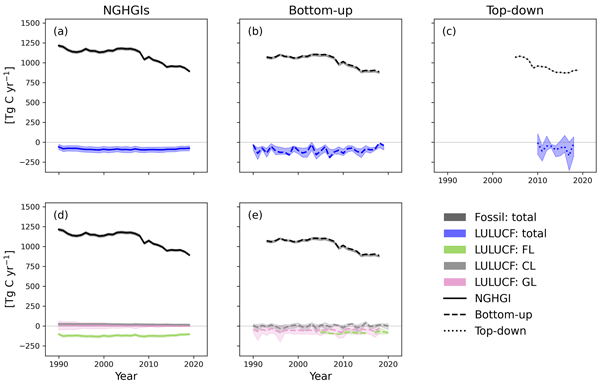
Accurate estimation of fluxes of carbon dioxide from the land surface is essential for understanding future impacts of greenhouse gas emissions on the climate system. A wide variety of methods currently exist to estimate these sources and sinks. We are continuing work to develop annual comparisons of these diverse methods in order to clarify what they all actually calculate and to resolve apparent disagreement, in addition to highlighting opportunities for increased understanding.
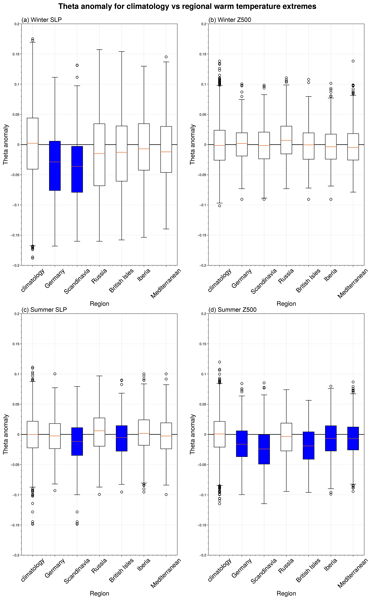
Emma Holmberg, Gabriele Messori, Rodrigo Caballero, and Davide Faranda
Earth Syst. Dynam., 14, 737–765, https://doi.org/10.5194/esd-14-737-2023, https://doi.org/10.5194/esd-14-737-2023, 2023
Short summary
Short summary
We analyse the duration of large-scale patterns of air movement in the atmosphere, referred to as persistence, and whether unusually persistent patterns favour warm-temperature extremes in Europe. We see no clear relationship between summertime heatwaves and unusually persistent patterns. This suggests that heatwaves do not necessarily require the continued flow of warm air over a region and that local effects could be important for their occurrence.
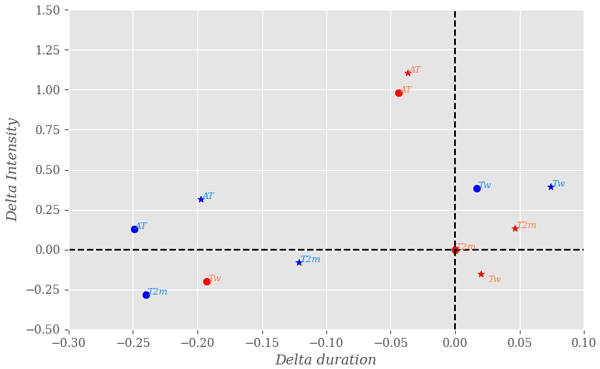
Cedric Gacial Ngoungue Langue, Christophe Lavaysse, Mathieu Vrac, and Cyrille Flamant
Nat. Hazards Earth Syst. Sci., 23, 1313–1333, https://doi.org/10.5194/nhess-23-1313-2023, https://doi.org/10.5194/nhess-23-1313-2023, 2023
Short summary
Short summary
Heat waves (HWs) are climatic hazards that affect the planet. We assess here uncertainties encountered in the process of HW detection and analyse their recent trends in West Africa using reanalysis data. Three types of uncertainty have been investigated. We identified 6 years with higher frequency of HWs, possibly due to higher sea surface temperatures in the equatorial Atlantic. We noticed an increase in HW characteristics during the last decade, which could be a consequence of climate change.
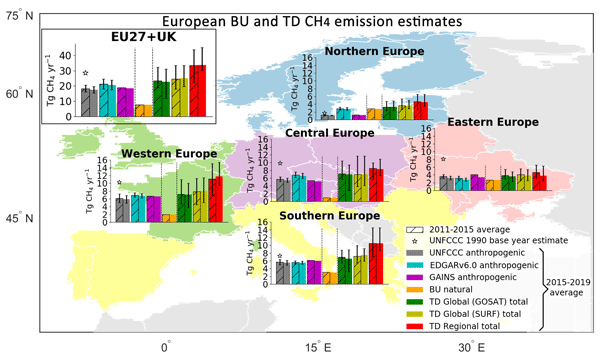
Ana Maria Roxana Petrescu, Chunjing Qiu, Matthew J. McGrath, Philippe Peylin, Glen P. Peters, Philippe Ciais, Rona L. Thompson, Aki Tsuruta, Dominik Brunner, Matthias Kuhnert, Bradley Matthews, Paul I. Palmer, Oksana Tarasova, Pierre Regnier, Ronny Lauerwald, David Bastviken, Lena Höglund-Isaksson, Wilfried Winiwarter, Giuseppe Etiope, Tuula Aalto, Gianpaolo Balsamo, Vladislav Bastrikov, Antoine Berchet, Patrick Brockmann, Giancarlo Ciotoli, Giulia Conchedda, Monica Crippa, Frank Dentener, Christine D. Groot Zwaaftink, Diego Guizzardi, Dirk Günther, Jean-Matthieu Haussaire, Sander Houweling, Greet Janssens-Maenhout, Massaer Kouyate, Adrian Leip, Antti Leppänen, Emanuele Lugato, Manon Maisonnier, Alistair J. Manning, Tiina Markkanen, Joe McNorton, Marilena Muntean, Gabriel D. Oreggioni, Prabir K. Patra, Lucia Perugini, Isabelle Pison, Maarit T. Raivonen, Marielle Saunois, Arjo J. Segers, Pete Smith, Efisio Solazzo, Hanqin Tian, Francesco N. Tubiello, Timo Vesala, Guido R. van der Werf, Chris Wilson, and Sönke Zaehle
Earth Syst. Sci. Data, 15, 1197–1268, https://doi.org/10.5194/essd-15-1197-2023, https://doi.org/10.5194/essd-15-1197-2023, 2023
Short summary
Short summary
This study updates the state-of-the-art scientific overview of CH4 and N2O emissions in the EU27 and UK in Petrescu et al. (2021a). Yearly updates are needed to improve the different respective approaches and to inform on the development of formal verification systems. It integrates the most recent emission inventories, process-based model and regional/global inversions, comparing them with UNFCCC national GHG inventories, in support to policy to facilitate real-time verification procedures.
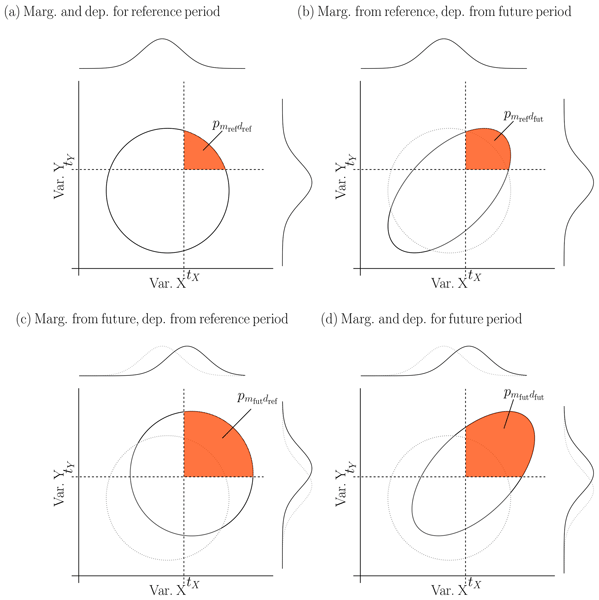
Bastien François and Mathieu Vrac
Nat. Hazards Earth Syst. Sci., 23, 21–44, https://doi.org/10.5194/nhess-23-21-2023, https://doi.org/10.5194/nhess-23-21-2023, 2023
Short summary
Short summary
Compound events (CEs) result from a combination of several climate phenomena. In this study, we propose a new methodology to assess the time of emergence of CE probabilities and to quantify the contribution of marginal and dependence properties of climate phenomena to the overall CE probability changes. By applying our methodology to two case studies, we show the importance of considering changes in both marginal and dependence properties for future risk assessments related to CEs.
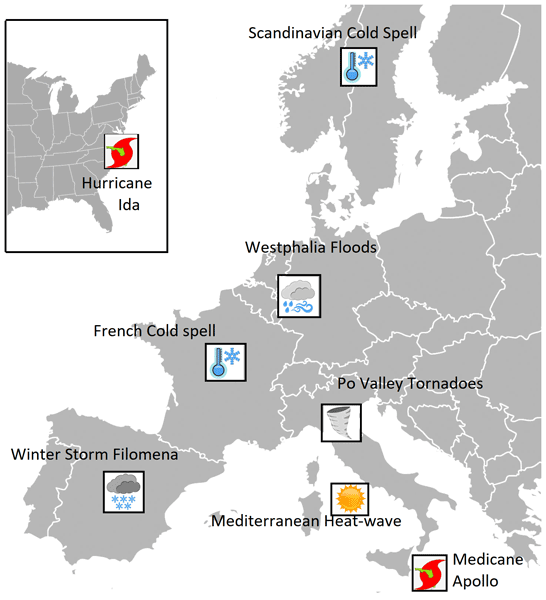
Davide Faranda, Stella Bourdin, Mireia Ginesta, Meriem Krouma, Robin Noyelle, Flavio Pons, Pascal Yiou, and Gabriele Messori
Weather Clim. Dynam., 3, 1311–1340, https://doi.org/10.5194/wcd-3-1311-2022, https://doi.org/10.5194/wcd-3-1311-2022, 2022
Short summary
Short summary
We analyze the atmospheric circulation leading to impactful extreme events for the calendar year 2021 such as the Storm Filomena, Westphalia floods, Hurricane Ida and Medicane Apollo. For some of the events, we find that climate change has contributed to their occurrence or enhanced their intensity; for other events, we find that they are unprecedented. Our approach underscores the importance of considering changes in the atmospheric circulation when performing attribution studies.

Antoine Grisart, Mathieu Casado, Vasileios Gkinis, Bo Vinther, Philippe Naveau, Mathieu Vrac, Thomas Laepple, Bénédicte Minster, Frederic Prié, Barbara Stenni, Elise Fourré, Hans Christian Steen-Larsen, Jean Jouzel, Martin Werner, Katy Pol, Valérie Masson-Delmotte, Maria Hoerhold, Trevor Popp, and Amaelle Landais
Clim. Past, 18, 2289–2301, https://doi.org/10.5194/cp-18-2289-2022, https://doi.org/10.5194/cp-18-2289-2022, 2022
Short summary
Short summary
This paper presents a compilation of high-resolution (11 cm) water isotopic records, including published and new measurements, for the last 800 000 years from the EPICA Dome C ice core, Antarctica. Using this new combined water isotopes (δ18O and δD) dataset, we study the variability and possible influence of diffusion at the multi-decadal to multi-centennial scale. We observe a stronger variability at the onset of the interglacial interval corresponding to a warm period.
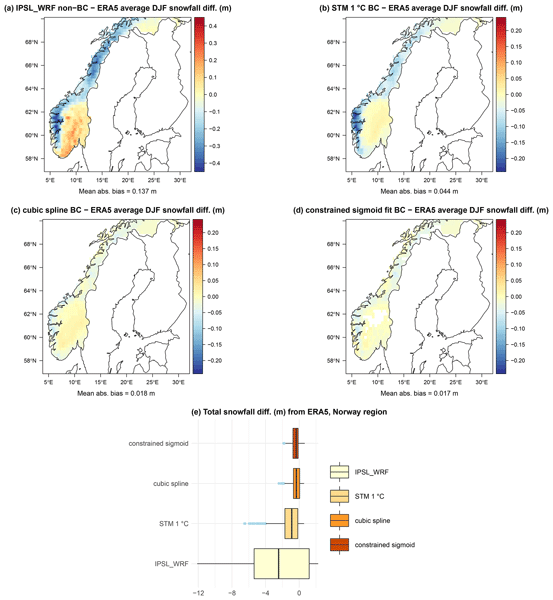
Flavio Maria Emanuele Pons and Davide Faranda
Adv. Stat. Clim. Meteorol. Oceanogr., 8, 155–186, https://doi.org/10.5194/ascmo-8-155-2022, https://doi.org/10.5194/ascmo-8-155-2022, 2022
Short summary
Short summary
The objective motivating this study is the assessment of the impacts of winter climate extremes, which requires accurate simulation of snowfall. However, climate simulation models contain physical approximations, which result in biases that must be corrected using past data as a reference. We show how to exploit simulated temperature and precipitation to estimate snowfall from already bias-corrected variables, without requiring the elaboration of complex, multivariate bias adjustment techniques.
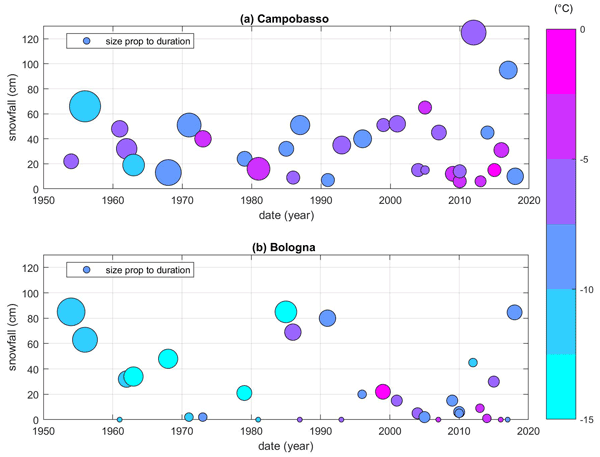
Miriam D'Errico, Flavio Pons, Pascal Yiou, Soulivanh Tao, Cesare Nardini, Frank Lunkeit, and Davide Faranda
Earth Syst. Dynam., 13, 961–992, https://doi.org/10.5194/esd-13-961-2022, https://doi.org/10.5194/esd-13-961-2022, 2022
Short summary
Short summary
Climate change is already affecting weather extremes. In a warming climate, we will expect the cold spells to decrease in frequency and intensity. Our analysis shows that the frequency of circulation patterns leading to snowy cold-spell events over Italy will not decrease under business-as-usual emission scenarios, although the associated events may not lead to cold conditions in the warmer scenarios.
Greta Cazzaniga, Carlo De Michele, Michele D'Amico, Cristina Deidda, Antonio Ghezzi, and Roberto Nebuloni
Hydrol. Earth Syst. Sci., 26, 2093–2111, https://doi.org/10.5194/hess-26-2093-2022, https://doi.org/10.5194/hess-26-2093-2022, 2022
Short summary
Short summary
Rainfall estimates are usually obtained from rain gauges, weather radars, or satellites. An alternative is the measurement of the signal loss induced by rainfall on commercial microwave links (CMLs). In this work, we assess the hydrologic response of Lambro Basin when CML-retrieved rainfall is used as model input. CML estimates agree with rain gauge data. CML-driven discharge simulations show performance comparable to that from rain gauges if a CML-based calibration of the model is undertaken.
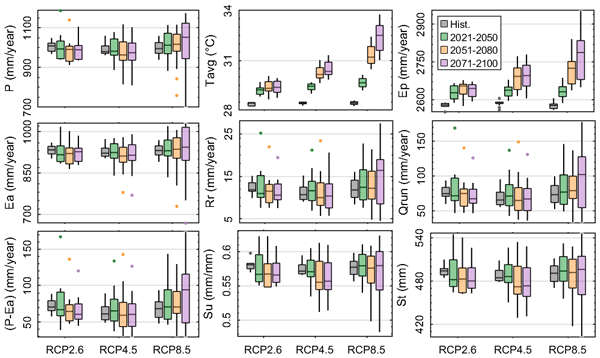
Moctar Dembélé, Mathieu Vrac, Natalie Ceperley, Sander J. Zwart, Josh Larsen, Simon J. Dadson, Grégoire Mariéthoz, and Bettina Schaefli
Hydrol. Earth Syst. Sci., 26, 1481–1506, https://doi.org/10.5194/hess-26-1481-2022, https://doi.org/10.5194/hess-26-1481-2022, 2022
Short summary
Short summary
Climate change impacts on water resources in the Volta River basin are investigated under various global warming scenarios. Results reveal contrasting changes in future hydrological processes and water availability, depending on greenhouse gas emission scenarios, with implications for floods and drought occurrence over the 21st century. These findings provide insights for the elaboration of regional adaptation and mitigation strategies for climate change.
Bérengère Dubrulle, François Daviaud, Davide Faranda, Louis Marié, and Brice Saint-Michel
Nonlin. Processes Geophys., 29, 17–35, https://doi.org/10.5194/npg-29-17-2022, https://doi.org/10.5194/npg-29-17-2022, 2022
Short summary
Short summary
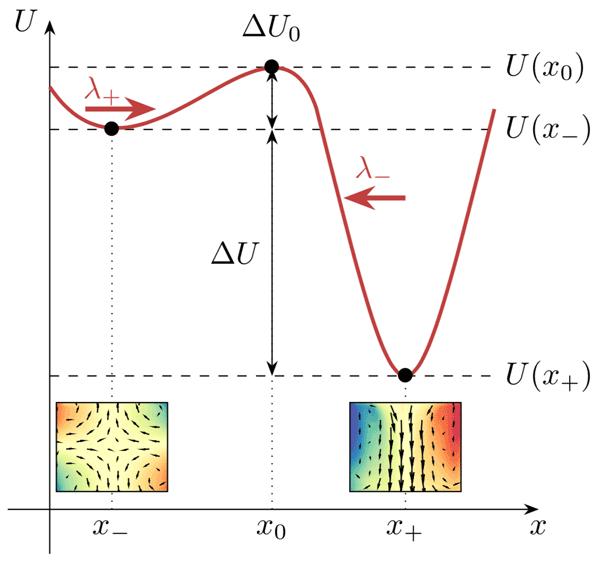
Present climate models discuss climate change but show no sign of bifurcation in the future. Is this because there is none or because they are in essence too simplified to be able to capture them? To get elements of an answer, we ran a laboratory experiment and discovered that the answer is not so simple.
Yoann Robin and Mathieu Vrac
Earth Syst. Dynam., 12, 1253–1273, https://doi.org/10.5194/esd-12-1253-2021, https://doi.org/10.5194/esd-12-1253-2021, 2021
Short summary
Short summary
We propose a new multivariate downscaling and bias correction approach called
time-shifted multivariate bias correction, which aims to correct temporal dependencies in addition to inter-variable and spatial ones. Our method is evaluated in a
perfect model experimentcontext where simulations are used as pseudo-observations. The results show a large reduction of the biases in the temporal properties, while inter-variable and spatial dependence structures are still correctly adjusted.
Cited articles
André, J., d'Andrea, F., Drobinski, P., and Muller, C.: Regimes of precipitation change over Europe and the Mediterranean, J. Geophys. Res.-Atmos., 129, e2023JD040413, https://doi.org/10.1029/2023JD040413, 2024. a
Cammalleri, C. and Toreti, A.: A generalized density-based algorithm for the spatiotemporal tracking of drought events, J. Hydrometeorol., 24, 537–548, 2023. a
Cazzaniga, G.: gcazzaniga/rhita, GitHub, https://github.com/gcazzaniga/rhita, last access: 2 September 2026. a
Christiansen, B., Alvarez-Castro, C., Christidis, N., Ciavarella, A., Colfescu, I., Cowan, T., Eden, J., Hauser, M., Hempelmann, N., Klehmet, K., Lott, F., Nangini, C., van Oldenborgh, G. J., Orth, R., Stott, P., Tett, S., Vautard, R., Wilcox, L., and Yiou, P.: Was the cold European winter of 2009/10 modified by anthropogenic climate change? An attribution study, J. Climate, 31, 3387–3410, 2018. a
Croitoru, A.-E., Piticar, A., and Burada, D. C.: Changes in precipitation extremes in Romania, Quatern. Int., 415, 325–335, 2016. a
Delforge, D., Wathelet, V., Below, R., Sofia, C. L., Tonnelier, M., van Loenhout, J. A., and Speybroeck, N.: EM-DAT: the emergency events database, Int. J. Disast. Risk Re., 124, 105509, https://doi.org/10.1016/j.ijdrr.2025.105509, 2025. a, b, c, d
Djalante, R., Holley, C., Thomalla, F., and Carnegie, M.: Pathways for adaptive and integrated disaster resilience, Nat.Hazards, 69, 2105–2135, 2013. a
ECMWF (European Centre for Medium-Range Weather Forecasts): IFS Documentation CY49R1 - Part IV: Physical Processes, Chap. 4, ECMWF, https://doi.org/10.21957/c731ee1102, 2024. a
ECMWF (European Centre for Medium-Range Weather Forecasts): ECMWF Real-Time Forecasts Open Data, ECMWF [data set], https://doi.org/10.21957/open-data, 2025. a
Faranda, D., Pascale, S., and Bulut, B.: Persistent anticyclonic conditions and climate change exacerbated the exceptional 2022 European-Mediterranean drought, Environ. Res. Lett., 18, 034030, https://doi.org/10.1088/1748-9326/acbc37, 2023. a, b
GDACS: Overall Red Flood Alert in Spain, https://www.gdacs.org/documentmaps_IP.aspx?eventid=1102983&eventtype=FL (last access: 13 November 2024), 2024. a
Guo, Y., Gasparrini, A., Armstrong, B. G., Tawatsupa, B., Tobias, A., Lavigne, E., Coelho, M. d. S. Z. S., Pan, X., Kim, H., Hashizume, M., Honda, Y., Guo, Y.-L. L., Wu, C.-F., Zanobetti, A., Schwartz, J. D., Bell, M. L., Scortichini, M., Michelozzi, P., Punnasiri, K., Li, S., Tian, L., Garcia, S. D. O., Seposo, X., Overcenco, A., Zeka, A., Goodman, P., Dang, T. N., Dung, D. V., Mayvaneh, F., Saldiva, P. H. N., Williams, G., and Tong, S.: Heat wave and mortality: a multicountry, multicommunity study, Environmental Health Persp., 125, 087006, https://doi.org/10.1289/EHP1026, 2017. a
Helama, S., Sohar, K., Läänelaid, A., Bijak, S., and Jaagus, J.: Reconstruction of precipitation variability in Estonia since the eighteenth century, inferred from oak and spruce tree rings, Clim. Dynam., 50, 4083–4101, https://doi.org/10.1007/s00382-017-3862-z, 2018. a
Hersbach, H., Bell, B., Berrisford, P., Biavati, G., Horányi, A., Muñoz Sabater, J., Nicolas, J., Peubey, C., Radu, R., Rozum, I., Schepers, D., Simmons, A., Soci, C., Dee, D., and Thépaut, J.-N.: ERA5 hourly data on single levels from 1959 to present, Copernicus Climate Change Service (C3S) Climate Data Store (CDS) [data set], https://doi.org/10.24381/cds.adbb2d47, 2018. a
Hisi, A. N., Robin, Y., Faranda, D., and Vrac, M.: CDSupdate: A meta-interface for ERA5 download request, management and storage, SoftwareX, 28, 101965, https://doi.org/10.1016/j.softx.2024.101965, 2024. a
Hofstätter, M., Lexer, A., Homann, M., and Blöschl, G.: Large-scale heavy precipitation over central Europe and the role of atmospheric cyclone track types, Int. J. Climatol., 38, e497–e517, 2018. a
Holton, J. R. and Hakim, G. J.: An introduction to dynamic meteorology, Vol. 88, Academic Press, ISBN: 9780123848666, 2013. a
IPCC: Climate Change 2021: The Physical Science Basis. Contribution of Working Group I to the Sixth Assessment Report of the Intergovernmental Panel on Climate Change, Cambridge University Press, Cambridge, United Kingdom and New York, NY, USA, https://doi.org/10.1017/9781009157896, 2021. a, b, c, d
Jézéquel, A., Faranda, D., Drobinski, P., and Lionello, P.: Extreme Event Attribution in the Mediterranean, Int. J. Climatol., e8799, https://doi.org/10.1002/joc.8799, 2025. a
Juba, B. and Le, H. S.: Precision-recall versus accuracy and the role of large data sets, Proceedings of the AAAI Conference on Artificial Intelligence, 33, 4039–4048, 2019. a
Kautz, L.-A., Martius, O., Pfahl, S., Pinto, J. G., Ramos, A. M., Sousa, P. M., and Woollings, T.: Atmospheric blocking and weather extremes over the Euro-Atlantic sector – a review, Weather Clim. Dynam., 3, 305–336, https://doi.org/10.5194/wcd-3-305-2022, 2022. a
Kendall, M. G.: Rank correlation methods., Griffin, ISBN 0852641990, 1948. a
Lorenz, R., Stalhandske, Z., and Fischer, E. M.: Detection of a climate change signal in extreme heat, heat stress, and cold in Europe from observations, Geophys. Res. Lett., 46, 8363–8374, 2019. a
Luo, M., Lau, N.-C., Liu, Z., Wu, S., and Wang, X.: An observational investigation of spatiotemporally contiguous heatwaves in China from a 3D perspective, Geophys. Res. Lett., 49, e2022GL097714, https://doi.org/10.1029/2022GL097714, 2022. a
Madsen, H., Lawrence, D., Lang, M., Martinkova, M., and Kjeldsen, T. R.: Review of trend analysis and climate change projections of extreme precipitation and floods in Europe, J. Hydrol., 519, 3634–3650, https://doi.org/10.1016/j.jhydrol.2014.11.003, 2014 a
Mann, H. B.: Nonparametric tests against trend, Econometrica, 13, 245–259, https://doi.org/10.2307/1907187, 1945. a
Mathbout, S., Lopez-Bustins, J., Royé, D., Martin-Vide, J., Bech, J., and Rodrigo, F.: Observed changes in daily precipitation extremes at annual timescale over the eastern Mediterranean during 1961–2012, Pure Appl. Geophys., 175, 3875–3890, 2018. a
Matthes, H., Rinke, A., and Dethloff, K.: Recent changes in Arctic temperature extremes: warm and cold spells during winter and summer, Environ. Res. Lett., 10, 114020, https://doi.org/10.1088/1748-9326/10/11/114020, 2015. a
Messori, G., Segalini, A., and Ramos, A. M.: Climatology and trends of concurrent temperature extremes in the global extratropics, Earth Syst. Dynam., 15, 1207–1225, https://doi.org/10.5194/esd-15-1207-2024, 2024. a
Monteleone, B., Borzí, I., Bonaccorso, B., and Martina, M.: Quantifying crop vulnerability to weather-related extreme events and climate change through vulnerability curves, Nat. Hazards, 116, 2761–2796, 2023. a
Nissen, K. M. and Ulbrich, U.: Increasing frequencies and changing characteristics of heavy precipitation events threatening infrastructure in Europe under climate change, Nat. Hazards Earth Syst. Sci., 17, 1177–1190, https://doi.org/10.5194/nhess-17-1177-2017, 2017. a
Ouzeau, G., Soubeyroux, J.-M., Schneider, M., Vautard, R., and Planton, S.: Heat waves analysis over France in present and future climate: Application of a new method on the EURO-CORDEX ensemble, Climate Services, 4, 1–12, 2016. a
Pardo, S. K. and Paredes-Fortuny, L.: Uneven evolution of regional European summer heatwaves under climate change, Weather and Climate Extremes, 43, 100648, https://doi.org/10.1016/j.wace.2024.100648, 2024. a
Paredes-Fortuny, L. and Khodayar, S.: Understanding the Magnification of Heatwaves over Spain: Relevant changes in the most extreme events, Weather and Climate Extremes, 42, 100631, https://doi.org/10.1016/j.wace.2023.100631, 2023. a
Pescaroli, G. and Alexander, D.: Understanding compound, interconnected, interacting, and cascading risks: a holistic framework, Risk Anal., 38, 2245–2257, https://doi.org/10.1111/risa.13128, 2018. a
Publications Office of the European Union: EuroVoc, European Union, EUR-Lex, https://eur-lex.europa.eu/browse/eurovoc.html?params=72,7206,914#arrow_914 (last access: 20 June 2025), 2025. a
Ruml, M., Gregorić, E., Vujadinović, M., Radovanović, S., Matović, G., Vuković, A., Počuča, V., and Stojičić, D.: Observed changes of temperature extremes in Serbia over the period 1961–2010, Atmos. Res., 183, 26–41, 2017. a
Sen, P. K.: Estimates of the regression coefficient based on Kendall's tau, J. Am. Stat. Assoc., 63, 1379–1389, 1968. a
Silversmith, W.: cc3d: Connected components on multilabel 3D images, GitHub, https://github.com/seung-lab/connected-components-3d/tree/3.4.0 (last access: 6 June 2025), 2021. a
Theil, H.: A rank-invariant method of linear and polynomial regression analysis, Indagationes Mathematicae, 12, 386–392, 1950. a
Tilloy, A., Malamud, B. D., and Joly-Laugel, A.: A methodology for the spatiotemporal identification of compound hazards: wind and precipitation extremes in Great Britain (1979–2019), Earth Syst. Dynam., 13, 993–1020, https://doi.org/10.5194/esd-13-993-2022, 2022. a
Toreti, A., Bavera, D., Acosta Navarro, J., Cammalleri, C., De Jager, A., Di Ciollo, C., Hrast Essenfelder, A., Maetens, W., Magni, D., Masante, D., Mazzeschi, M., Niemeyer, S., and Spinoni, J.: Drought in Europe August 2022, Tech. Rep. EUR 31192 EN, Publications Office of the European Union, Luxembourg, jRC130493, ISBN 978-92-76-55855-2, https://doi.org/10.2760/264241, 2022. a
Tripathy, K. P. and Mishra, A. K.: How unusual is the 2022 European compound drought and heatwave event?, Geophys. Res. Lett., 50, e2023GL105453, https://doi.org/10.1029/2023GL105453, 2023. a
UNDRR: The Sendai Framework Terminology on Disaster Risk Reduction, “Disaster”, https://www.undrr.org/terminology/disaster (last access: 13 November 2024), 2017. a
Van Oldenborgh, G. J., Mitchell-Larson, E., Vecchi, G. A., De Vries, H., Vautard, R., and Otto, F.: Cold waves are getting milder in the northern midlatitudes, Environ. Res. Lett., 14, 114004, https://doi.org/10.1088/1748-9326/ab4867, 2019. a
Vezzoli, R., Mercogliano, P., and Pecora, S.: A brief introduction to the concept of return period for univariate variables, CMCC Research Paper, SSRN 2195426, 2012. a
Vikhamar-Schuler, D., Isaksen, K., Haugen, J. E., Tømmervik, H., Luks, B., Schuler, T. V., and Bjerke, J. W.: Changes in winter warming events in the Nordic Arctic Region, J. Climate, 29, 6223–6244, 2016. a
Volosciuk, C., Maraun, D., Semenov, V. A., Tilinina, N., Gulev, S. K., and Latif, M.: Rising Mediterranean sea surface temperatures amplify extreme summer precipitation in central Europe, Scientific Reports, 6, 32450, https://doi.org/10.1038/srep32450, 2016. a, b
Zeder, J. and Fischer, E. M.: Observed extreme precipitation trends and scaling in Central Europe, Weather and Climate Extremes, 29, 100266, https://doi.org/10.1016/j.wace.2020.100266, 2020. a
Zscheischler, J., Martius, O., Westra, S., Bevacqua, E., Raymond, C., Horton, R. M., van den Hurk, B., AghaKouchak, A., Jézéquel, A., Mahecha, M. D., Maraun, D., Ramos, A. M., Ridder, N. N., Thiery, W., and Vignotto, E.: A typology of compound weather and climate events, Nature Reviews Earth & Environment, 1, 333–347, https://doi.org/10.1038/s43017-020-0060-z, 2020. a
Short summary
Extreme weather events are becoming more frequent and severe, creating a strong need for rapid and reliable information. We developed an open tool that automatically detects and tracks heatwaves, cold spells, heavy rain, and strong winds across Europe, both in real time and in past decades. By comparing current events with long historical records, the tool shows how unusual an event is and reveals clear increases in heatwaves, while other hazards show more mixed changes.
Extreme weather events are becoming more frequent and severe, creating a strong need for rapid...


Altmetrics
Final-revised paper
Preprint