
the Creative Commons Attribution 4.0 License.
the Creative Commons Attribution 4.0 License.
 | 02 Oct 2026
RHITA: a web tool for real-time detection of extreme weather events
Greta Cazzaniga
Anastasia Akakpo-Numado
Patrick Brockmann
Adrien Burq
Mathieu Vrac
Davide Faranda

Extreme weather hazards are increasing and stakeholders need rapid, transparent information during unfolding events. We present RHITA (Real-time Hazard Identification and Tracking Algorithm), an open-source framework and web tool for near real-time detection and tracking of weather-related hazards over Europe. RHITA identifies grid cells exceeding local quantile thresholds, groups them into spatial clusters, and links clusters through time to reconstruct three-dimensional events in longitude, latitude, and time. For each event, RHITA provides intensity, extent and duration metrics and estimates rarity through return periods derived from a long historical record. RHITA is operated with ECMWF open forecasts for daily monitoring and ERA5 reanalysis for a consistent historical archive from 1950 to 2024. We target four hazards: heatwaves, cold spells, heavy precipitation and strong winds. Key spatial and temporal parameters are optimized against EM-DAT disaster records (2000 to 2023). Applying RHITA to ERA5 yields a European climatology of hazard events and reveals robust increases in heatwave frequency, intensity and affected area, a decline in cold spell frequency, and more heterogeneous signals for heavy precipitation and strong winds at the continental scale. RHITA provides open access data and an interactive interface to support rapid hazard characterization, event contextualization and downstream risk analysis.
- Article
(3142 KB) - Full-text XML
-
Supplement
(2476 KB) - BibTeX
- EndNote


Extreme weather events, including heatwaves, droughts, thunderstorms, and cyclones, pose significant threats to human lives and ecosystems (IPCC, 2021; Guo et al., 2017; Monteleone et al., 2023). Data from the Emergency Events Database (EM-DAT, Delforge et al., 2025) indicate that in 2024, 393 natural hazard-related disasters were recorded. These events led to 16 753 fatalities and affected 167.2 million people, with an estimated USD 241.95 billion in economic losses.
Disasters typically result from the interaction of three key factors: hazard (e.g., extreme rainfall), exposure (e.g., populations in flood-prone areas or critical infrastructure such as power substations near rivers), and vulnerability (e.g., weak buildings collapsing during inundations) (UNDRR, 2017). Climate change is increasing the likelihood and intensity of hazards, while urbanization, population growth, and increasingly interconnected infrastructure amplify exposure and vulnerability (IPCC, 2021). Together, these dynamics are making disasters more complex and uncertain (Djalante et al., 2013).
Recent events illustrate these interactions. Severe floods struck southeastern Spain on 29–30 October 2024, triggered by stationary extreme storms associated with a cut-off low. The disaster resulted in over 200 casualties, the highest number of fatalities in a European flood event since 1967. More than 400 people were displaced, and hundreds of thousands were left without access to water and electricity, particularly in the Valencian Community (GDACS, 2024). In 2022, Europe experienced one of the most severe compound drought and heatwave events in recent history, affecting large parts of the continent (Tripathy and Mishra, 2023). The impacts were particularly strong in the Iberian Peninsula, France, Italy, the Northwest Balkans, Germany, the Netherlands, Poland, and Scandinavia (Faranda et al., 2023). Record summer temperatures exacerbated drought conditions, causing water shortages and fueling widespread wildfires (Toreti et al., 2022; Faranda et al., 2023).
During and after disasters, stakeholders such as emergency responders and policymakers require rapid impact assessments to evaluate cascading risks and support decision-making (Pescaroli and Alexander, 2018). At the same time, the public, media, and insurers seek information on the rarity and underlying causes of extreme events. Understanding these causes is essential to distinguish between impacts driven primarily by hazard intensity and those linked to exposure or vulnerability. In this work, we focus on the hazard component and aim to characterize its role in disaster outcomes.
We introduce RHITA (Real-time Hazard Identification and Tracking Algorithm), a framework embedded in a public web tool (available at https://data.ipsl.fr/rhita/, last access: 2 September 2026). RHITA provides a rapid spatio-temporal characterization of extreme events and evaluates their rarity based on multiple features, including average and maximum intensity, duration, and impacted area. The framework is designed for near real-time applications, while also being applied to historical data to construct a climatology of three-dimensional events. This dual use supports both immediate post-event analysis and longer-term resilience planning and statistical studies.
Previous studies have proposed methodologies to detect and characterize specific types of extreme events. For instance, Lagrangian approaches have been used to track extreme precipitation events and quantify their spatial extent, duration, and severity (Nissen and Ulbrich, 2017). Operational systems, such as those developed by Météo-France, identify heatwaves and cold spells using multiple threshold-based criteria applied to national-scale temperature data (Ouzeau et al., 2016). For droughts, advanced techniques including three-dimensional DBSCAN clustering have been employed to track spatiotemporal evolution (Cammalleri and Toreti, 2023). The 3D connected components (CC3D) algorithm (Silversmith, 2021) has also been applied to the spatio-temporal tracking of heatwaves using gridded temperature data (Luo et al., 2022). More generally, clustering approaches are increasingly used to identify compound climate extremes (Tilloy et al., 2022; Messori et al., 2024). However, these methods are often hazard-specific, rarely designed for real-time applications, and seldom provide open-access databases within a unified multi-hazard framework.
The RHITA algorithm is designed to be flexible and applicable across multiple hazard types, both in real time and retrospectively. The associated website provides daily updates on the evolution of detected extreme events, including heatwaves, cold spells, and storms, based on their hazard components: extreme temperatures, water deficits, heavy precipitation, and strong winds. This enables a rapid comparison of ongoing events against historical benchmarks in terms of duration, intensity, and spatial extent. By quantifying these characteristics, RHITA contributes to the assessment of hazard severity, a key component of climate risk alongside exposure and vulnerability.
The website features an interactive interface aimed at supporting a wide range of users, with visualizations of hazard evolution, filtering by event type or severity, and exploration of metrics such as impacted area, duration, and intensity. It also allows the investigation of compound events, such as concurrent heatwaves or successive storms, which are particularly relevant for risk assessment in contexts where multi-hazard interactions amplify impacts (Zscheischler et al., 2020).
The remainder of this paper is organized as follows. Section 2 describes the data sources, Sect. 3 details the detection algorithm and presents the training procedure. Section 4 presents the results of applying RHITA's algorithm to reanalysis data for the period 1950–2024 to create a climatology of spatio-temporal extreme events. The discussion and the conclusion are respectively provided in Sects. 5 and 6. Finally, in Appendix A, the functionalities of the web platform are illustrated.
2.1 Climate data
We rely on two datasets: (1) operational forecasts from the European Centre for Medium-Range Weather Forecasts (ECMWF) (ECMWF, 2025) and (2) the ERA5 reanalysis dataset (Hersbach et al., 2018), covering the period 1950–2024. ECMWF forecasts are used operationally for real-time event tracking, while ERA5 is employed to construct the historical catalogue of events. The variables considered are daily mean temperature at 2 m above ground level, accumulated daily precipitation, and daily maximum sustained wind speed. The analysis focuses on Europe, within the geographical domain [30° N, 75° N, 30° W, 40° E].
The operational single-level forecasts are produced with the ECMWF Integrated Forecasting System (IFS) (ECMWF, 2024) and are distributed under the ECMWF open data license (https://apps.ecmwf.int/datasets/licences/general/, last access: 20 June 2025). We use the Atmospheric Model high-resolution 15 d forecast (HRES), provided at a spatial resolution of 0.25° × 0.25°, with four forecast cycles per day (00:00, 06:00, 12:00, and 18:00 UTC). For consistency and timeliness, we retain only the forecasts initialized at 00:00 UTC, which are disseminated between 05:45 and 06:12 UTC according to the ECMWF schedule.
For each forecast, we use temperature at 2 m and neutral wind components at 10 m (u and v) at 3-hourly lead times (3, 6, 9, 12, 15, 18, 21, and 24 h), as well as accumulated precipitation at 24 h lead time. Daily mean temperature at 2 m is computed by averaging the eight 3-hourly temperature values. Daily maximum sustained wind speed is calculated by first deriving wind speed at each lead time as and then retaining the maximum value over the day.
ERA5 reanalysis data are obtained from the Copernicus Climate Data Store (https://cds.climate.copernicus.eu/, last access: 2 September 2026) at a spatial resolution of 0.25° × 0.25°, with a typical latency of about five days. We retrieve daily variables using the CDSupdate Python package (Hisi et al., 2024), which directly provides daily aggregates. The same variables as for the forecasts are used: daily mean temperature at 2 m, 24 h accumulated precipitation, and daily maximum wind speed.
Events detected in real time using forecast data are re-evaluated every six months using ERA5 reanalysis and subsequently integrated into the historical database. We expect only limited differences between the two products, as ERA5 is initialized from ECMWF operational analyses at zero lead time.
2.2 Natural disasters data
We use the International Disasters Database (EM-DAT, Delforge et al., 2025; https://public.emdat.be, last access: 2 September 2026) as a reference dataset for optimizing the RHITA algorithm parameters. EM-DAT is the most comprehensive global database of disasters and catalogues high-impact events at the country level, including those driven by natural and technological hazards. For each recorded event, the database provides information such as casualties, economic losses, temporal extent, and event magnitude. Data are compiled from a wide range of sources, including UN agencies, non-governmental organizations, reinsurance companies, research institutes, and press agencies. Owing to this diversity, the dataset is not fully homogeneous and may contain reporting gaps and biases (Delforge et al., 2025).
The objective of RHITA is to construct a historical catalogue of significant disasters that is consistent with EM-DAT while offering a more quantitative and dynamical representation of events from the perspective of the underlying hazards. Focusing on Europe, we align EM-DAT with our optimization framework by filtering events based on the disaster type and disaster subtype fields. This results in three event categories: heatwaves, cold spells, and storms. The detailed filtering criteria are summarized in Table 1.
Table 1EM-DAT filtering criteria for extreme event categorization.

Although EM-DAT data are available from 1900 onward, records prior to 2000 are particularly affected by reporting biases and inconsistencies (Delforge et al., 2025). For this reason, we restrict the analysis to the period 2000–2023.
3.1 RHITA algorithm
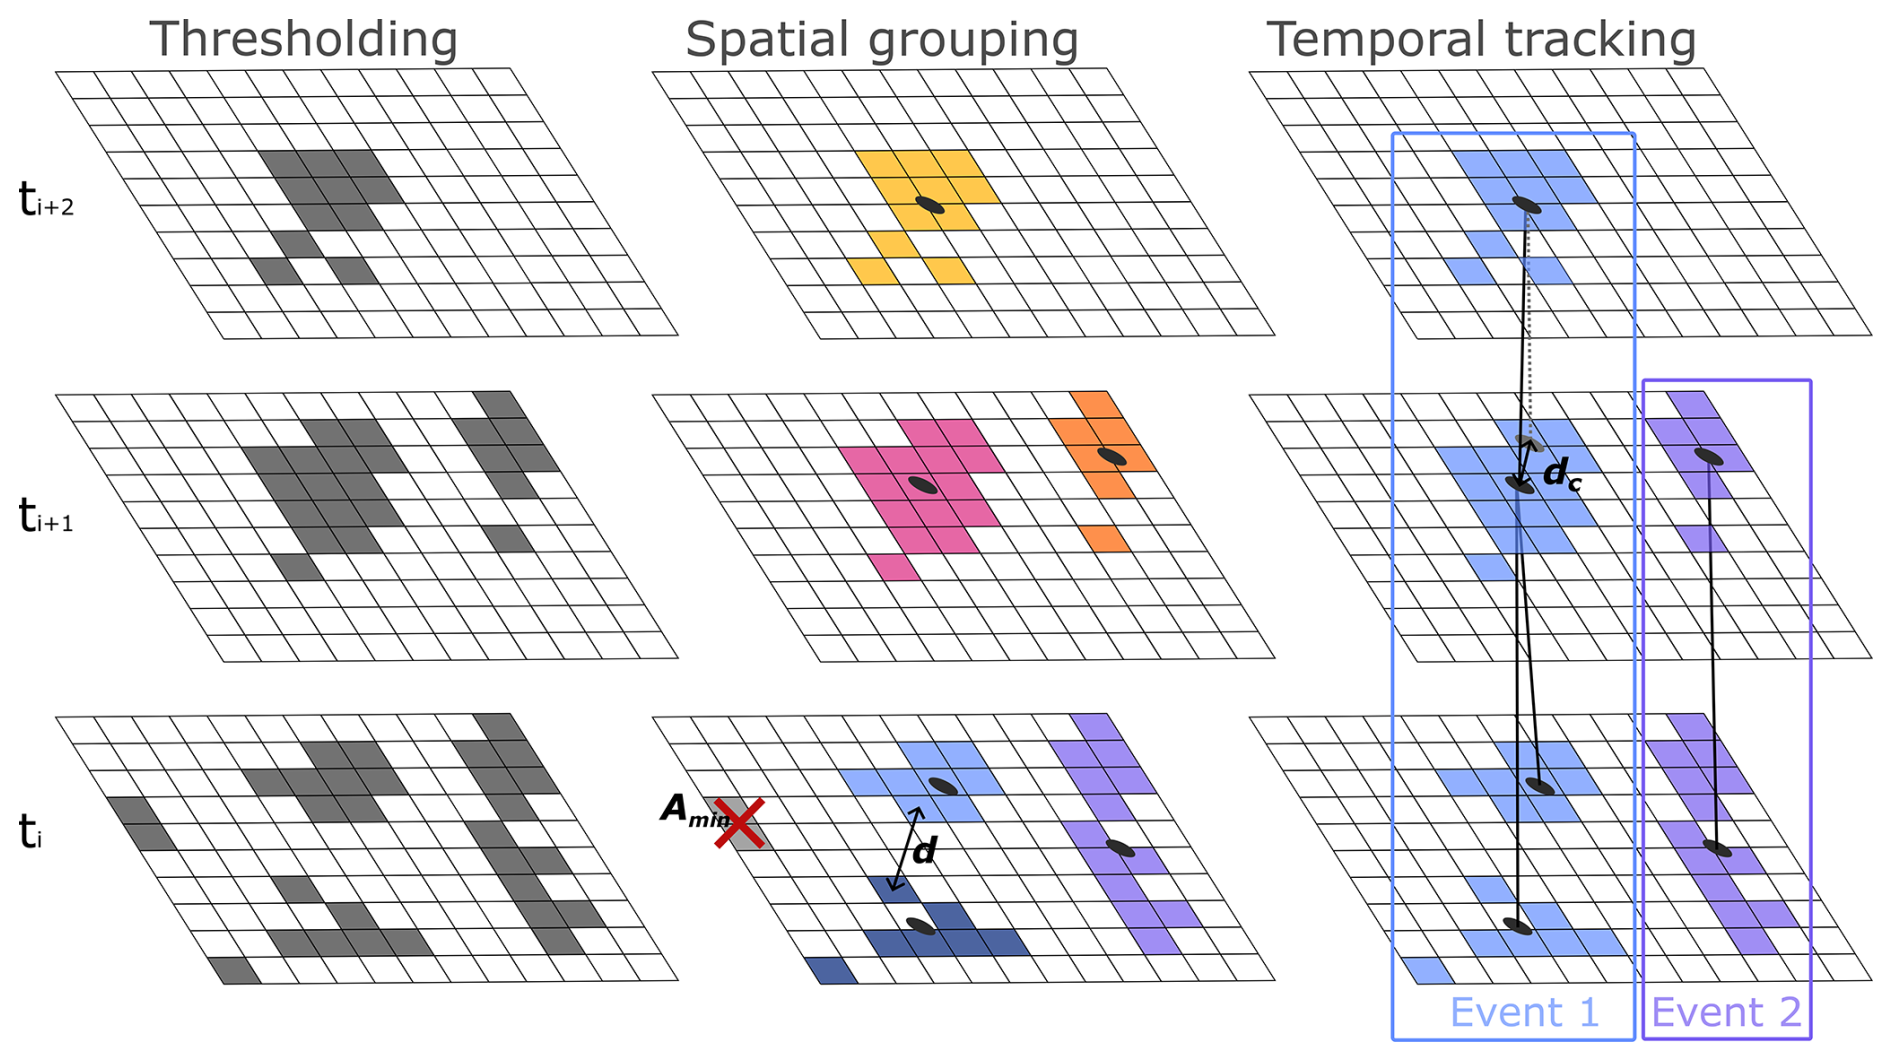
The RHITA algorithm is implemented as a Python package (https://github.com/gcazzaniga/rhita, last access: 2 September 2026) developed for the spatio-temporal detection of hazards associated with extreme weather events. The algorithm processes three-dimensional gridded datasets (longitude, latitude, time) in three main steps, described below and illustrated in Fig. 1.
-
Thresholding. Identification of grid cells exceeding a quantile-based or fixed threshold q, computed or selected over a historical reference period.
-
Spatial grouping. At each time step, neighboring grid cells exceeding q are spatially grouped using a distance threshold d. The area of each spatial cluster is computed, and clusters with an area smaller than a minimum threshold Amin are discarded (e.g., the event marked by a red cross at time ti in Fig. 1). Event centroids are then computed for each retained cluster.
-
Temporal tracking. Event centroids are linked across consecutive time steps using a centroid distance threshold dc. If the distance between two centroids at successive time steps is smaller than dc, the corresponding clusters are considered part of the same evolving event. This step naturally allows for event merging and splitting (see Event 1 in Fig. 1).
The algorithm depends on four key parameters: the quantile-based threshold q, the spatial distance threshold d, the minimum event area Amin, and the centroid linking distance dc. These parameters must be selected to reflect the relevant spatial and temporal scales of each hazard type. For the threshold q, we use the 0.99 quantile for extreme high temperatures, extreme winds, and heavy precipitation, and the 0.01 quantile for extreme low temperatures. Quantiles are computed at each gridpoint using all days from the 1950–2023 reference period.
This choice represents a trade-off: the threshold must be sufficiently extreme to identify intense events, while remaining sensitive enough to capture less intense but potentially impactful events driven by long duration, large spatial extent, or high vulnerability of affected areas. Using quantile-based thresholds allows adaptation to local climatological conditions, although it also implies sensitivity to the chosen reference period. The remaining parameters (d, Amin, dc) are optimized independently for each hazard type. The optimization procedure is described in Sect. 3.2.
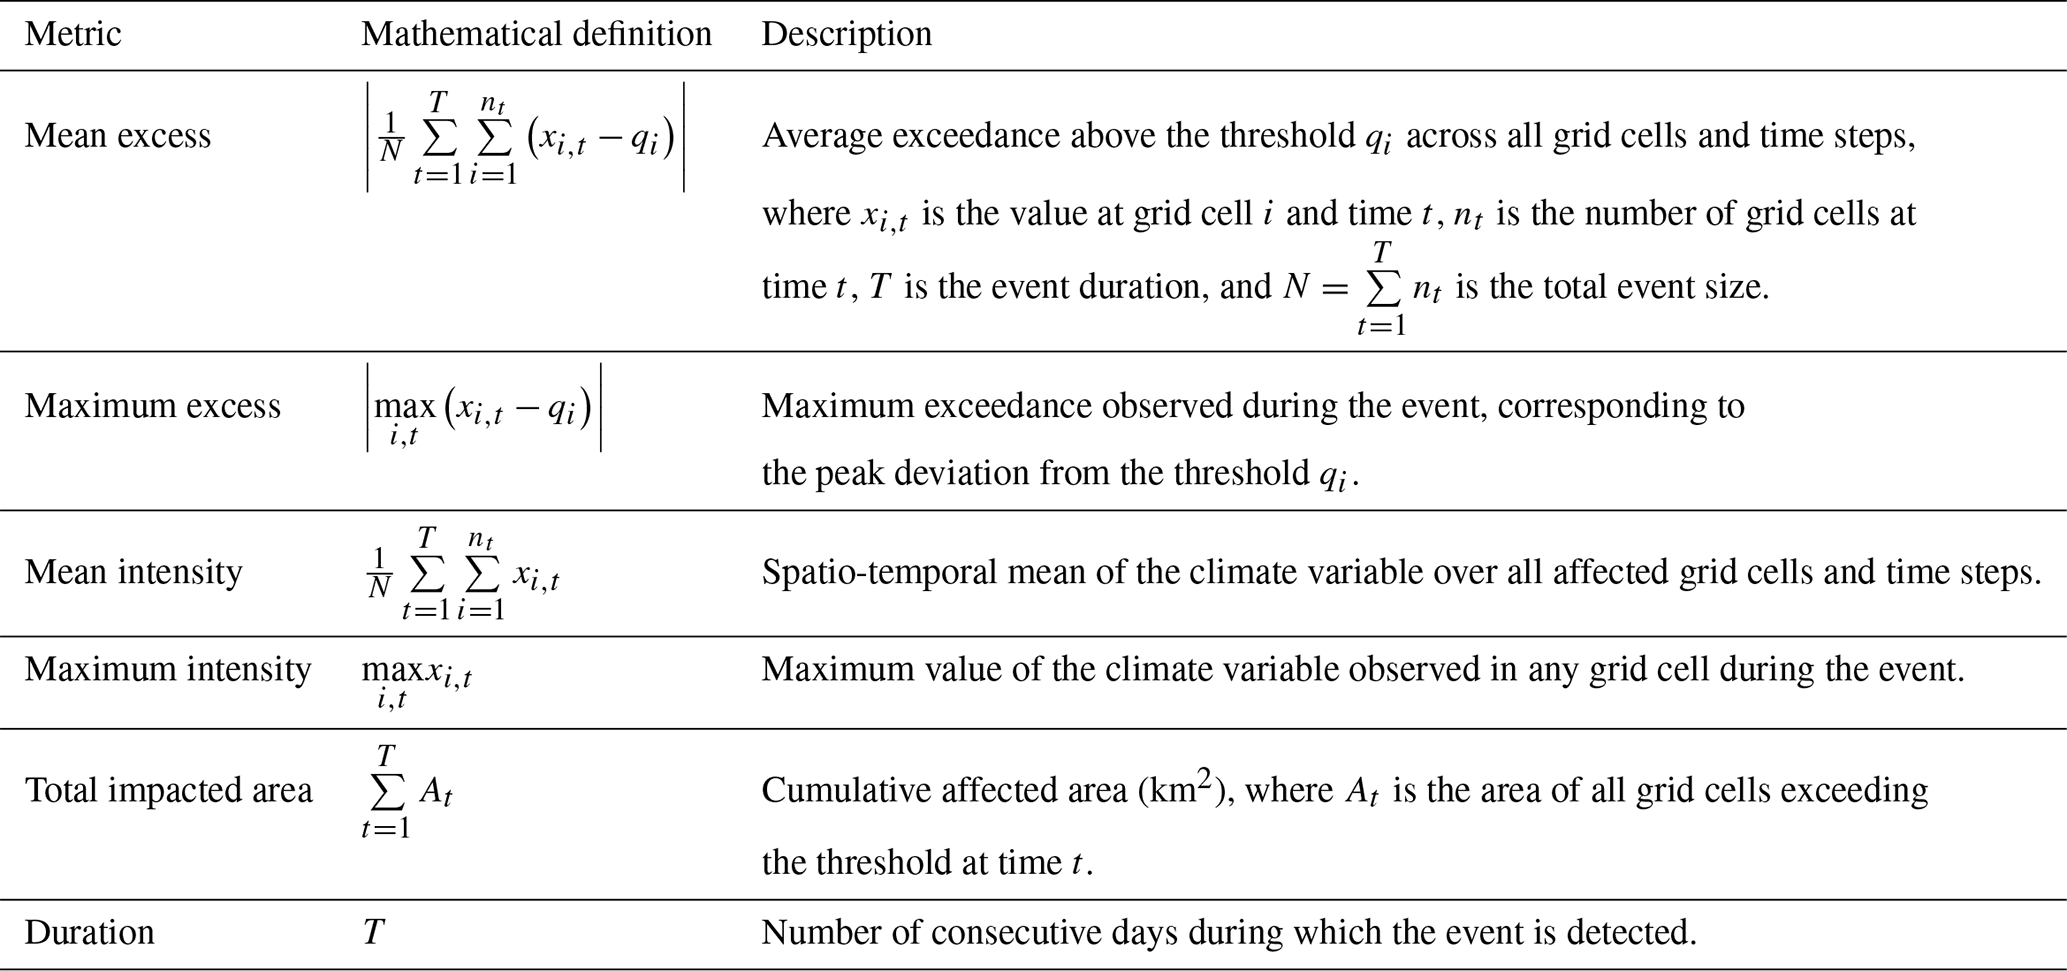
Once events are detected, several metrics are computed to characterize their intensity, extent, and duration. These metrics are listed in Table 2, together with their mathematical definitions. For each hazard type and for metrics such as mean excess, maximum excess, total impacted area, and duration, we estimate the return period RP over the full historical time series and the entire European domain, as a measure of event rarity. The return period of a metric m is computed following Vezzoli et al. (2012) as
where λ = , μ is the mean annual event occurrence rate, and FM(m) denotes the cumulative distribution function of metric m.
Table 2Name, mathematical definition, and description of the metrics used to characterize the three-dimensional events.
In this study, RHITA is applied to detect heatwaves, cold spells, and storms using ERA5 reanalysis and ECMWF forecast data. In principle, however, the algorithm can be applied to any gridded dataset to provide a Lagrangian detection of spatio-temporal extreme events.
3.2 Parameters optimization
As described in Sect. 2.2, the EM-DAT database is used as a reference dataset for optimizing the RHITA parameters d, Amin, and dc. The optimization objective is to maximize the detection of extreme weather events associated with significant societal impacts.
For each hazard type, physically plausible parameter ranges are defined based on the characteristic spatial and temporal scales of the underlying atmospheric processes (see Sect. S1 of the Supplement for details). A regular parameter grid is constructed, and a grid search is performed to evaluate all parameter combinations.
First, we identify all parameter triplets that maximize the detection sensitivity – the so-called recall in machine learning terminology (Juba and Le, 2019), defined as
A positive detection is defined as an algorithm-detected event that satisfies two conditions: (1) spatial overlap with at least one country affected according to the EM-DAT record, and (2) temporal overlap within a ±10 d window around the EM-DAT event start or end dates. This temporal tolerance reflects the typical time scales of extreme weather phenomena, ranging from a few hours to one or two weeks (Holton and Hakim, 2013).
Whenever multiple parameter triplets achieve the same maximum sensitivity, the optimal configuration is selected by minimizing the cost function S:
where ns is the number of erroneously split events, nc the number of erroneously merged events, Ndet the total number of events detected by the algorithm, and Nobs the number of events in the reference dataset.
The cost function consists of three normalized terms, each bounded between 0 and 1:
-
a splitting penalty quantifying erroneous event fragmentation;
-
a merging penalty quantifying erroneous event aggregation;
-
a counting discrepancy penalty quantifying deviations in the total number of events.
Because the reference dataset is affected by reporting gaps and biases inherent to human-compiled disaster databases, false positives (i.e., algorithm-detected events absent from EM-DAT) are intentionally not penalized in the optimization procedure. For the same reason, the sensitivity values reported here should be interpreted as a partial evaluation of the algorithm against documented, impact-relevant events, rather than as a comprehensive assessment of its meteorological detection skill: events that are meteorologically extreme but do not appear in the impact-oriented EM-DAT record are not necessarily missed detections in a physical sense, and a full quantification of detection skill would require an independent meteorological reference not available here.
Heatwaves are identified as temperatures exceeding the 0.99 quantile, while cold spells correspond to temperatures below the 0.01 quantile. For heavy precipitation and wind extremes, the 0.99 quantile of daily accumulated precipitation and daily maximum sustained wind speed is used, respectively. For all hazard types, a minimum event duration threshold of three consecutive days is imposed.
The optimization is performed using EM-DAT records from 2000 to 2023, which are randomly split into training and validation sets. Two-thirds of the years are used for training, while the remaining one-third is used for validation. The optimized parameters for each hazard type are reported in Table 3. The optimization procedure yields sensitivities exceeding 0.75 for all hazards except cold spells.
Table 3Optimized RHITA parameters for the detection of heatwaves, cold spells, heavy precipitation, and strong wind events.

Heatwaves and cold spells are optimized jointly, as reported in Table 3. This choice is motivated by the fact that temperature extremes over Europe are strongly linked to recurrent large-scale meteorological patterns, in particular quasi-stationary anticyclonic circulation and atmospheric blocking (Kautz et al., 2022). However, the algorithm exhibits lower detection skill for cold spells in both the training and validation phases. A plausible explanation is that cold spells are reported between 2 and 3 times more frequently than heatwaves in the EM-DAT database. This higher reporting rate likely includes many moderate events, whereas the algorithm applies a symmetric detection threshold designed to capture only the most extreme occurrences, leading to a larger fraction of missed cold spell events. However, using separate thresholds would implicitly calibrate the algorithm to EM-DAT reporting biases; our choice of a symmetric threshold preserves a physically based and comparable definition of temperature extremes.
Parameters for heavy precipitation are optimized separately using EM-DAT records filtered specifically for storm-related events (see Table 1). For wind detection, we adopt the same parameter set as for heavy precipitation. This choice reflects the difficulty of isolating wind-specific disasters in EM-DAT, as no single, unambiguous criterion exists to identify events driven exclusively by strong winds. Consequently, sensitivity metrics are not reported for wind events.
To construct the European climatology, only detected events that, at least at one time step, impact a European country are retained. Events occurring entirely outside European countries within the analysis domain (e.g., exclusively over North Africa) are excluded from the climatology presented here.
4.1 Spatial distribution of detected hazards
Over Europe, RHITA detects a total of 760 heatwaves, 681 cold spells, 805 heavy precipitation events, and 686 strong wind events over the period 1950–2024. All detected events within the analysis domain are available for browsing and downloading through the RHITA web tool.
Figure 2 shows the spatial distribution of detected hazards across European countries. For each country, a pie chart represents the relative proportion of the four hazard types: heatwaves (red), cold spells (blue), extreme wind events (orange), and heavy precipitation events (light blue). In Southern Europe, RHITA detects a predominance of heatwaves and extreme wind events in Spain and Portugal. In Italy and Greece, as well as in most Western European countries, extreme precipitation and extreme wind events represent the largest fraction of detected hazards. In the United Kingdom and Ireland, heatwaves account for a substantial share of detected events, with Ireland also exhibiting frequent strong wind events, while cold spells contribute more strongly in the United Kingdom. Central and Eastern Europe are characterized by a dominant contribution from heavy precipitation and wind events, with heatwaves generally detected more often than cold spells. In Northern Europe, the detected events are more evenly distributed across the four hazard types.
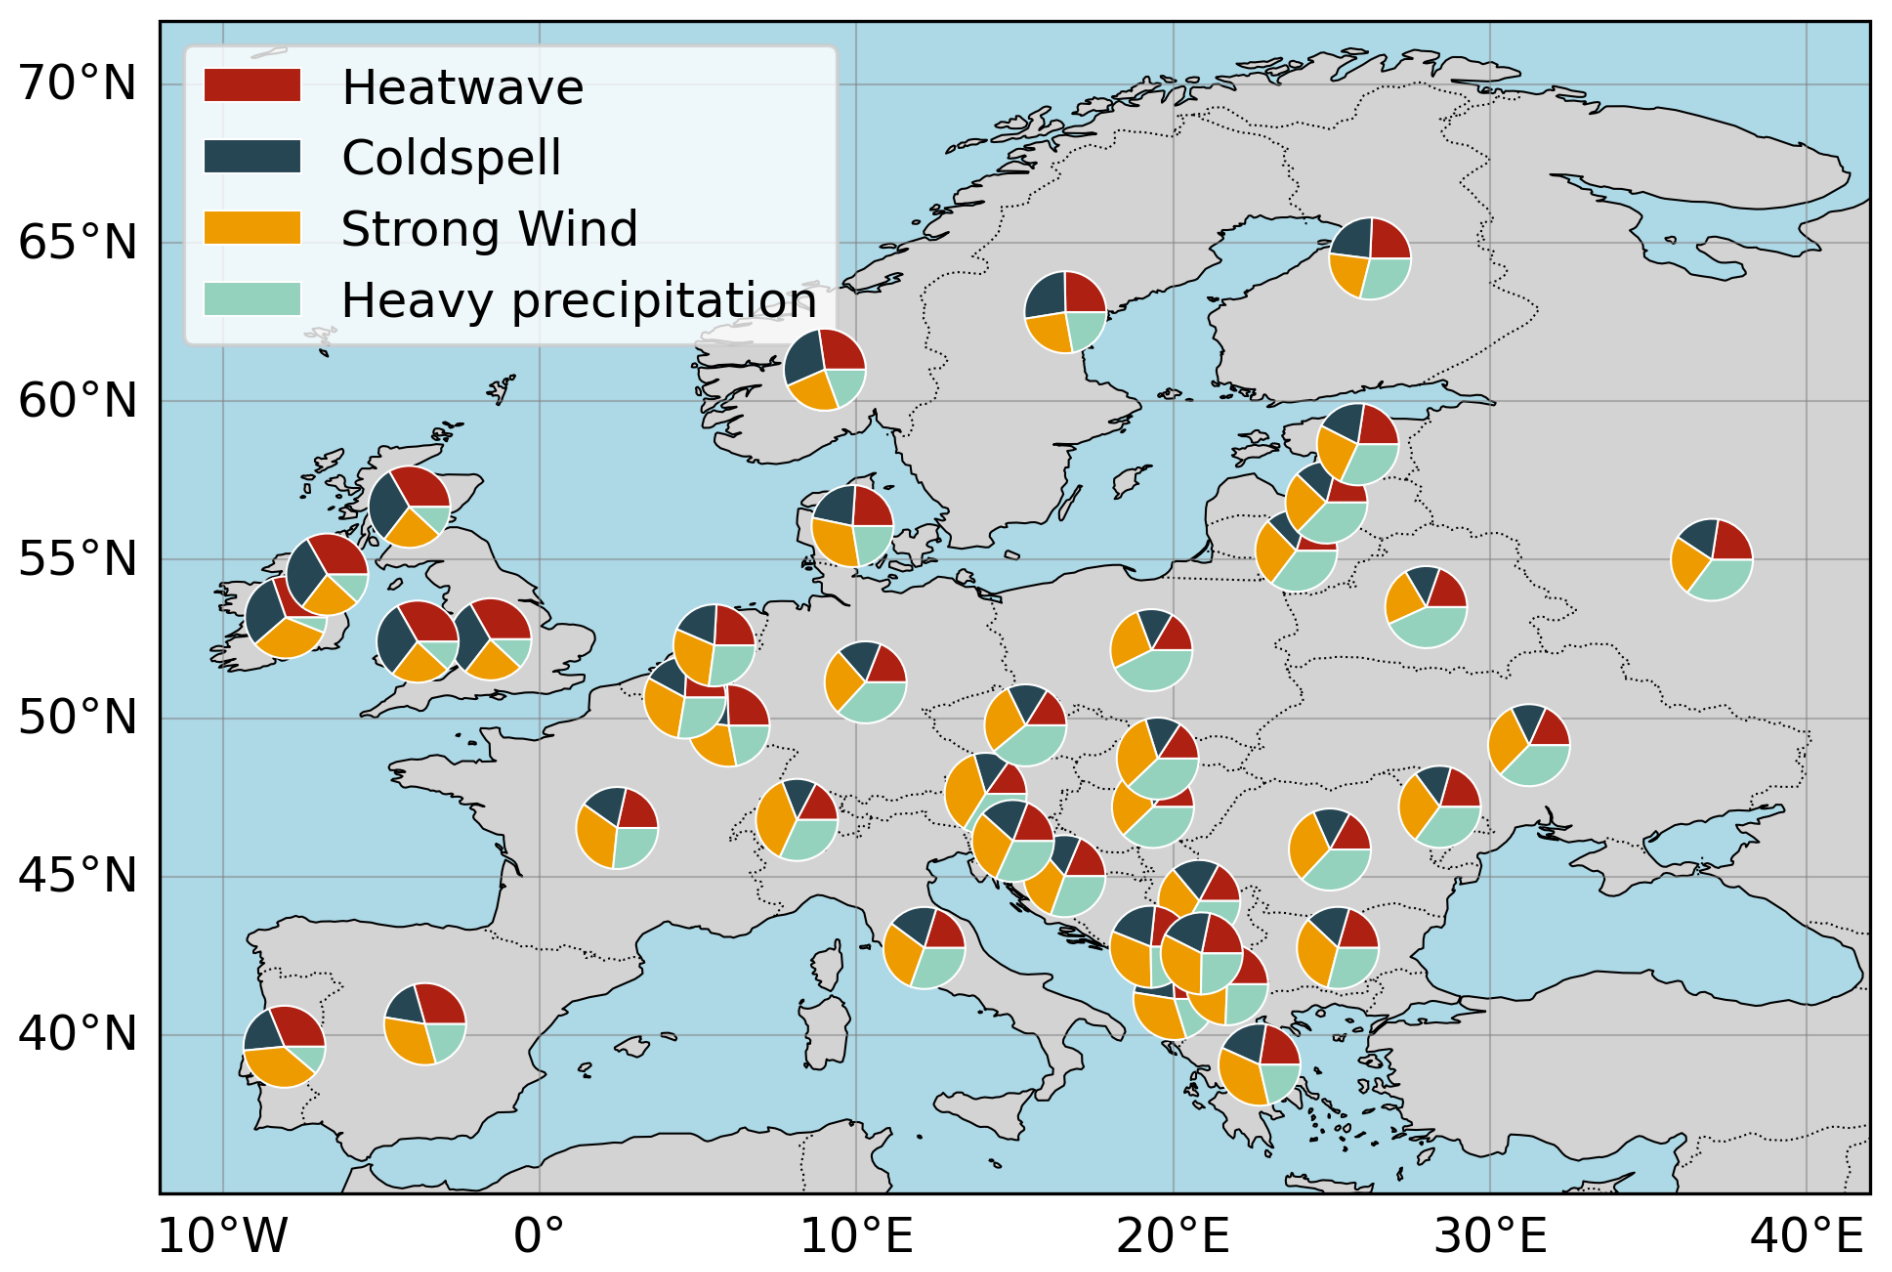
Figure 2Spatial distribution of extreme weather events across Europe as detected by RHITA.
It is important to note that this aggregation is based on the geographical impact footprint of the detected events. Consequently, a single event can contribute to multiple countries when its spatial extent affects more than one national territory.
4.2 Trends in event frequency across European subregions
To investigate large-scale spatial patterns in the temporal evolution of extreme event frequencies, detected events were aggregated by European subregions. The subregions considered are Central and Eastern Europe, Northern Europe, Southern Europe, and Western Europe, following the EuroVoc classification maintained by the Publications Office of the European Union (Publications Office of the European Union, 2025). The list of countries included in each subregion is provided in Sect. S2.
For each subregion and hazard type, trends in yearly event frequency were assessed using the Mann–Kendall test (Mann, 1945; Kendall, 1948). When statistically significant, the magnitude of change was quantified using Theil-Sen’s slope estimator (Theil, 1950; Sen, 1968). Figure 3 summarizes the results, showing the change in yearly event frequency per decade for statistically significant trends only.
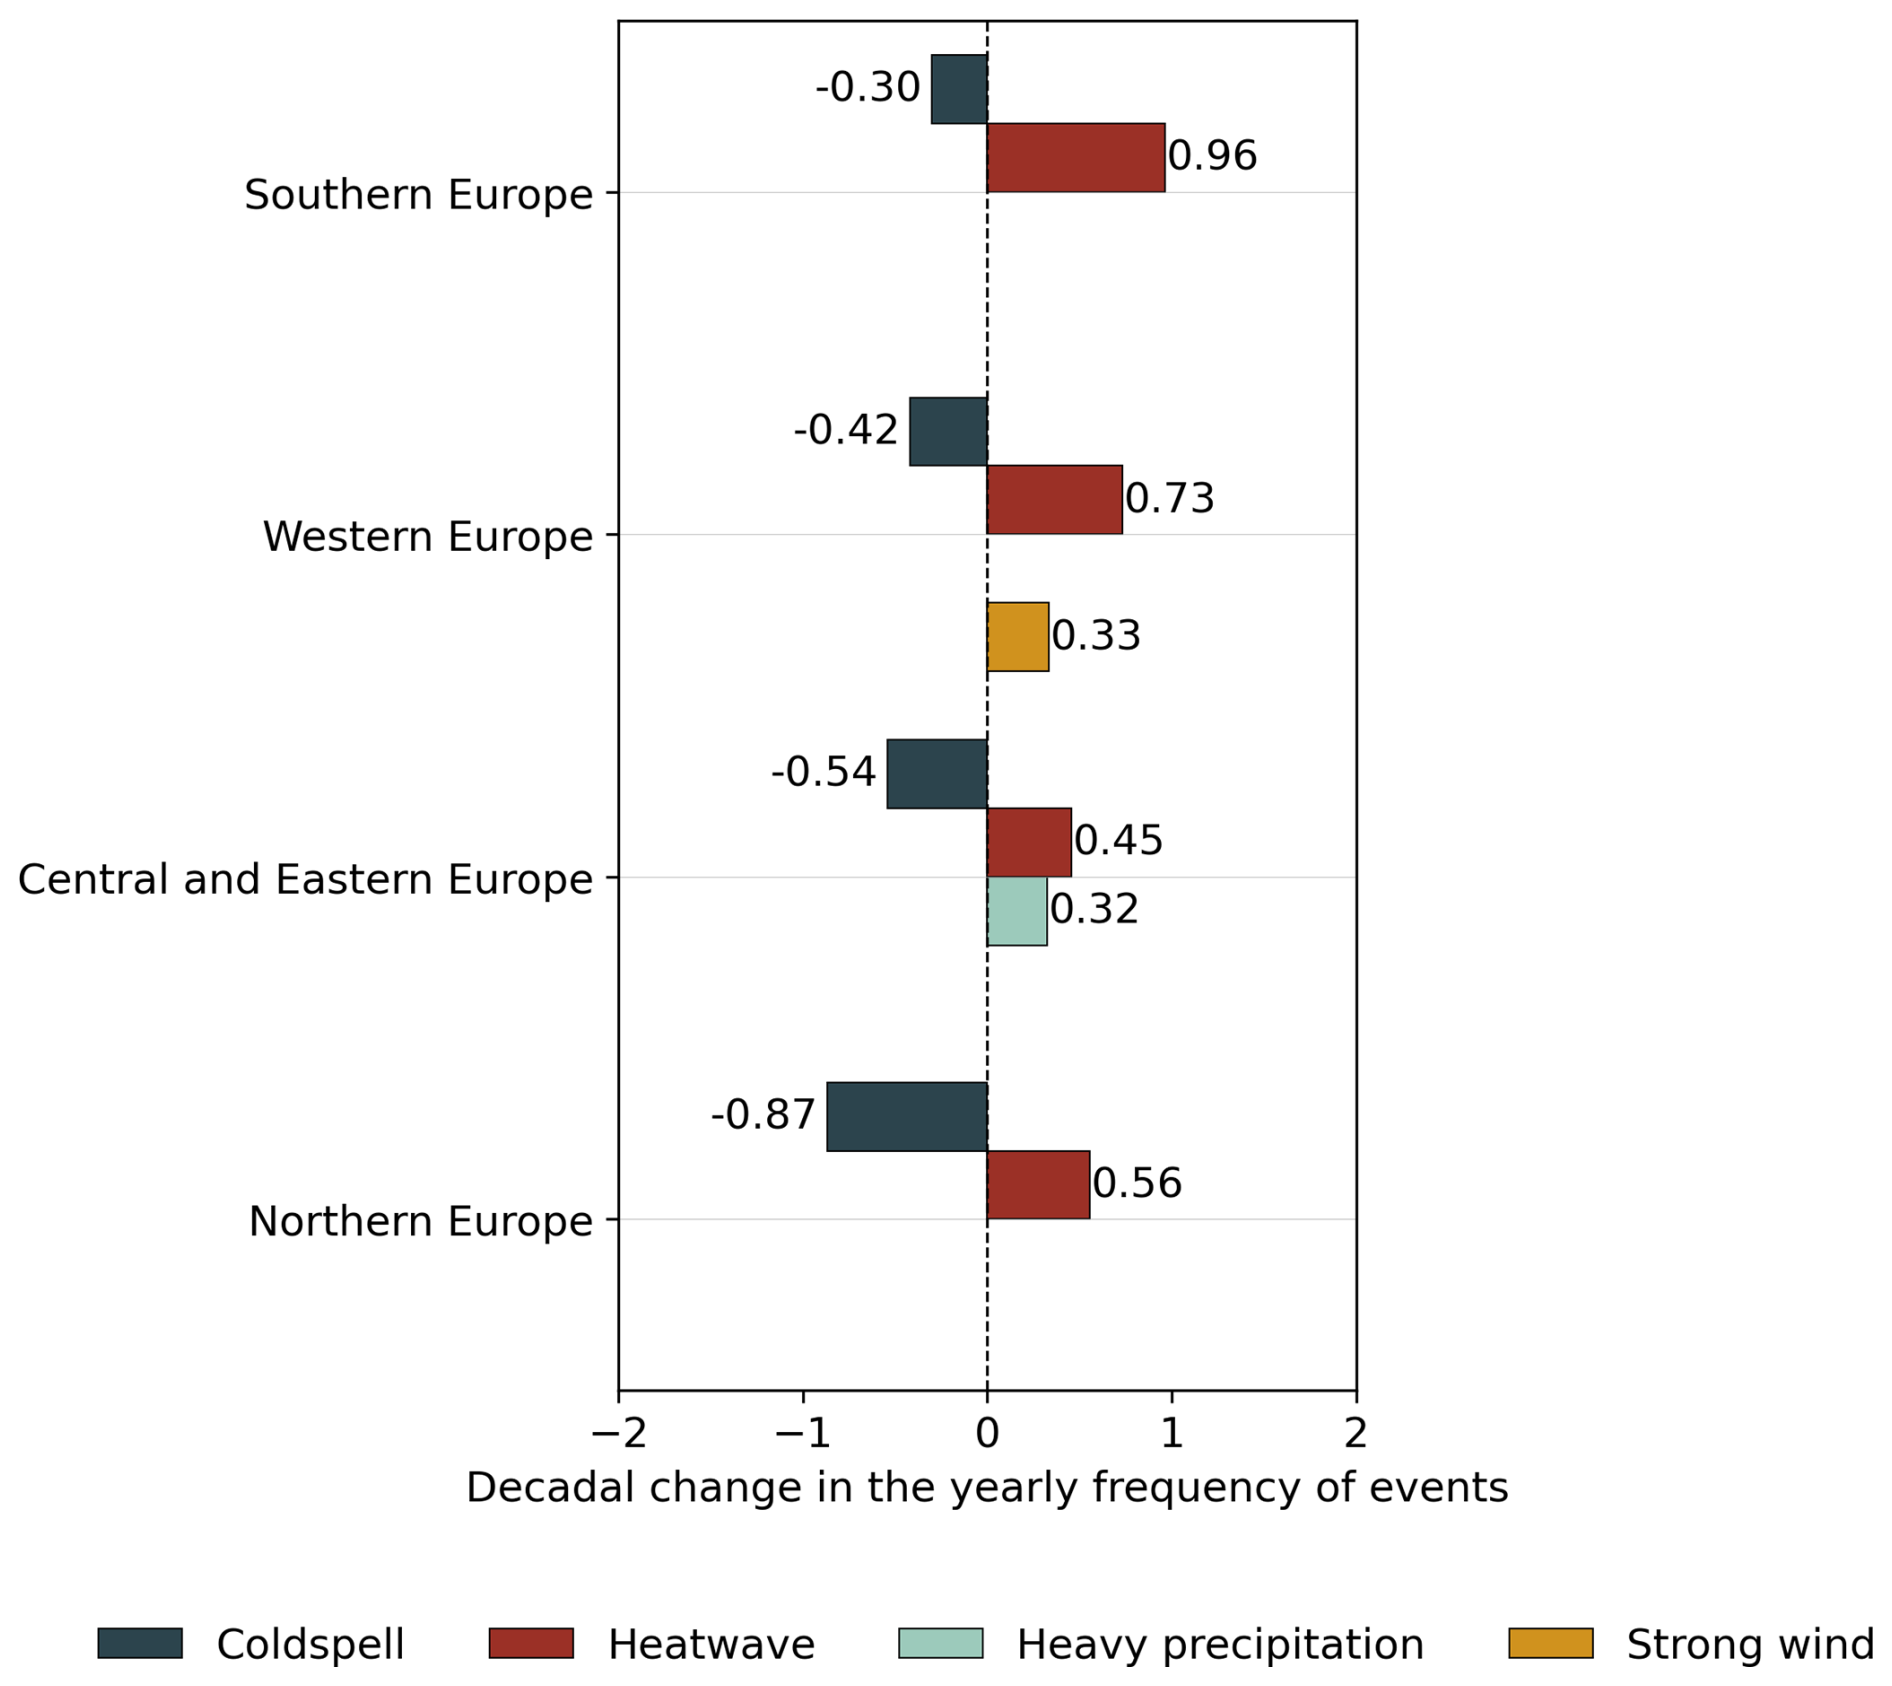
Figure 3Decadal changes in the yearly number of events aggregated by European subregion and hazard type. Only statistically significant trends are shown.
Heatwaves exhibit a robust and significant increase in frequency across all four European subregions. The strongest increase is detected in Southern Europe, with an increase of 0.96 events per year per decade, followed by Western Europe (+0.73), Northern Europe (+0.56), and Central and Eastern Europe (+0.45). Cold spells display an opposite behavior, with decreasing frequencies, particularly in Northern Europe, where the yearly frequency declines by approximately 0.87 events per decade.
Trends in heavy precipitation and strong wind events are more heterogeneous across subregions. Nevertheless, a significant increase in strong wind events is detected in Western Europe (+0.33 events per year per decade), along with a significant increase in heavy precipitation events (+0.32 events per year per decade).
4.3 Trends in hazard characteristics at the European scale
In addition to event frequency, trends in event characteristics were analyzed at the European scale using the metrics defined in Table 2: mean excess, maximum excess, total impacted area, and duration. Trend detection was performed over the 1950–2024 period using the Mann–Kendall test at a 5 % significance level, with trend magnitude estimated using Theil–Sen's slope. This analysis is performed on the aggregated European climatology. As a result, regional-scale signals may be partially masked by spatial averaging. All figures supporting this analysis are provided in Sect. S3.
Heatwaves exhibit statistically significant increasing trends in several metrics. The maximum excess temperature increases by 0.07 °C per decade, while the mean excess increases by 0.02 °C per decade. The total impacted area per event also shows a significant increase of approximately 80 000 km2 per decade, corresponding to roughly twice the surface area of Switzerland. No statistically significant trend is detected for event duration.
Cold spells display negative slopes for maximum excess temperature, mean excess temperature, and total impacted area. However, none of these trends are statistically significant at the 5 % level. A statistically significant trend is detected for event duration, but the associated slope is close to zero, indicating a negligible change over the analyzed period.
For heavy precipitation events, no statistically significant trends are detected for any of the analyzed metrics. The trends in maximum excess (p = 0.094) and mean excess (p = 0.072) are close to the significance threshold, while total impacted area (p = 0.493) and duration (p = 0.851) show no evidence of systematic change.
Extreme wind events show no statistically significant trends in mean or maximum excess, nor in total impacted area. A statistically significant trend is detected for event duration; however, the associated slope is close to zero, indicating no substantial change in duration over time.
The climatology of weather-related hazards over Europe derived from RHITA highlights changes that are broadly consistent with the current scientific understanding summarized in the IPCC (2021). In particular, the detected increase in the frequency, intensity (as measured by maximum and mean excess temperature), and spatial extent of heatwaves across European subregions is consistent with a large body of observational and attribution studies documenting rising temperature extremes across Central and Eastern (Ruml et al., 2017; Lorenz et al., 2019), Southern (Pardo and Paredes-Fortuny, 2024; Paredes-Fortuny and Khodayar, 2023), and Northern Europe (Matthes et al., 2015; Vikhamar-Schuler et al., 2016). Similarly, the decreasing frequency of cold spells detected by RHITA aligns with documented long-term declines in winter cold extremes across Europe (Christiansen et al., 2018; Van Oldenborgh et al., 2019).
For heavy precipitation, RHITA detects a significant increase in event frequency in Central and Eastern Europe, in agreement with regional studies reporting positive trends in precipitation extremes in this region (Croitoru et al., 2016; Volosciuk et al., 2016; Zeder and Fischer, 2020). At the continental scale, however, no statistically significant trends are detected for precipitation intensity, duration, or impacted area. This absence of a uniform European-scale signal is consistent with previous findings showing that trend detection in precipitation extremes is highly sensitive to the selected region, season, and metric (Hofstätter et al., 2018; André et al., 2024; Mathbout et al., 2018; Jézéquel et al., 2025). Evidence for increasing precipitation extremes is more frequently reported for specific seasons, particularly summer and winter, rather than year-round averages (Volosciuk et al., 2016; Madsen et al., 2014; Helama et al., 2018). Aggregating across all seasons and over the spatially diverse European continent likely masks distinct regional and seasonal signals.
Although not statistically significant at the 5 % level, the positive slopes detected for precipitation intensity metrics, with p values close to the significance threshold (maximum excess: p = 0.094; mean excess: p = 0.072), suggest a tendency toward more intense events. This behavior is consistent with the IPCC (2021), which assesses a likely intensification of heavy precipitation across Europe. However, these results should be interpreted with caution, as they do not constitute robust continental-scale evidence and may reflect the combined influence of heterogeneous regional trends and methodological aggregation choices.
This study introduces RHITA, a framework for the detection and tracking of weather-related hazards using gridded meteorological data, and applies it to construct a climatology of extreme events over Europe. By combining operational forecasts with reanalysis data, RHITA enables both near real-time monitoring and retrospective analysis of heatwaves, cold spells, heavy precipitation events, and strong wind events. The results derived from the European climatology are consistent with established findings in the literature, particularly regarding increasing heatwave frequency, intensity, and spatial extent, as well as declining cold spell occurrence. For heavy precipitation and strong wind events, the analysis highlights more heterogeneous and less robust continental-scale signals, underscoring the sensitivity of trend detection to spatial aggregation and event definition. Several limitations of the RHITA framework should be acknowledged. The use of quantile-based thresholds and a minimum event duration implies that some impactful but moderately intense or short-lived events may not be detected. The reliance on ERA5 and ECMWF data at 0.25° resolution limits the ability to capture small-scale convective phenomena, such as localized thunderstorms, potentially impacting the detection of short-lived extreme precipitation events. In addition, RHITA focuses exclusively on the hazard component of extreme events and does not attempt to characterize the underlying atmospheric dynamics or the resulting impacts in terms of exposure and vulnerability. As with any event-based methodology, the definition of what constitutes an extreme event remains partly subjective and dependent on parameter choices. In this respect, while the influence of the detection parameters is discussed qualitatively, the robustness of the reported event counts and trends under alternative parameter configurations – in particular variations in the quantile threshold q – was not empirically evaluated in the present study. A systematic sensitivity analysis, quantifying the effects of plausible variations in the quantile threshold and in the spatial and temporal parameters on the detected event statistics and resulting trends, will be undertaken in future work to assess the robustness of the findings further. Within these constraints, RHITA provides a consistent and transparent framework for identifying and characterizing hazard events across multiple types and time scales. Its design allows parameters to be adapted to different datasets, regions, and applications, making it suitable for both scientific analyses and operational monitoring contexts. Importantly, the same framework can be directly applied to climate model simulations, enabling the construction of consistent hazard-based climatologies under future climate scenarios. This opens the possibility to assess projected changes in event frequency, intensity, duration, and spatial extent in a manner that is directly comparable to present-day diagnostics. The open availability of the data and tools supports reproducibility and facilitates further investigation of extreme weather hazards under both current and future climate conditions.
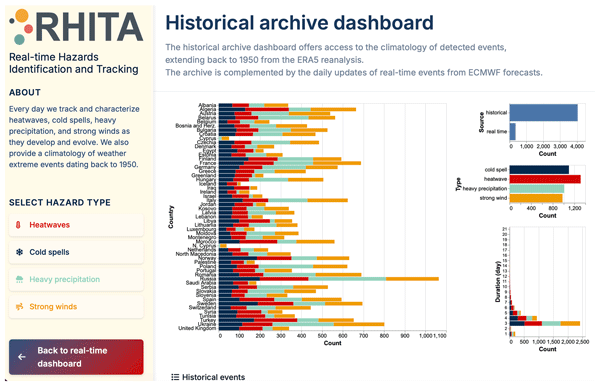
The RHITA web tool, developed by the Institut Pierre-Simon Laplace (IPSL), is accessible at https://data.ipsl.fr/rhita/. The platform provides an interface for visualizing, exploring, and downloading the events detected by the RHITA algorithm. It is organized into two main sections: the Real-time dashboard and the Historical archive. Figures A1 and A2 show screenshots of these two interfaces.
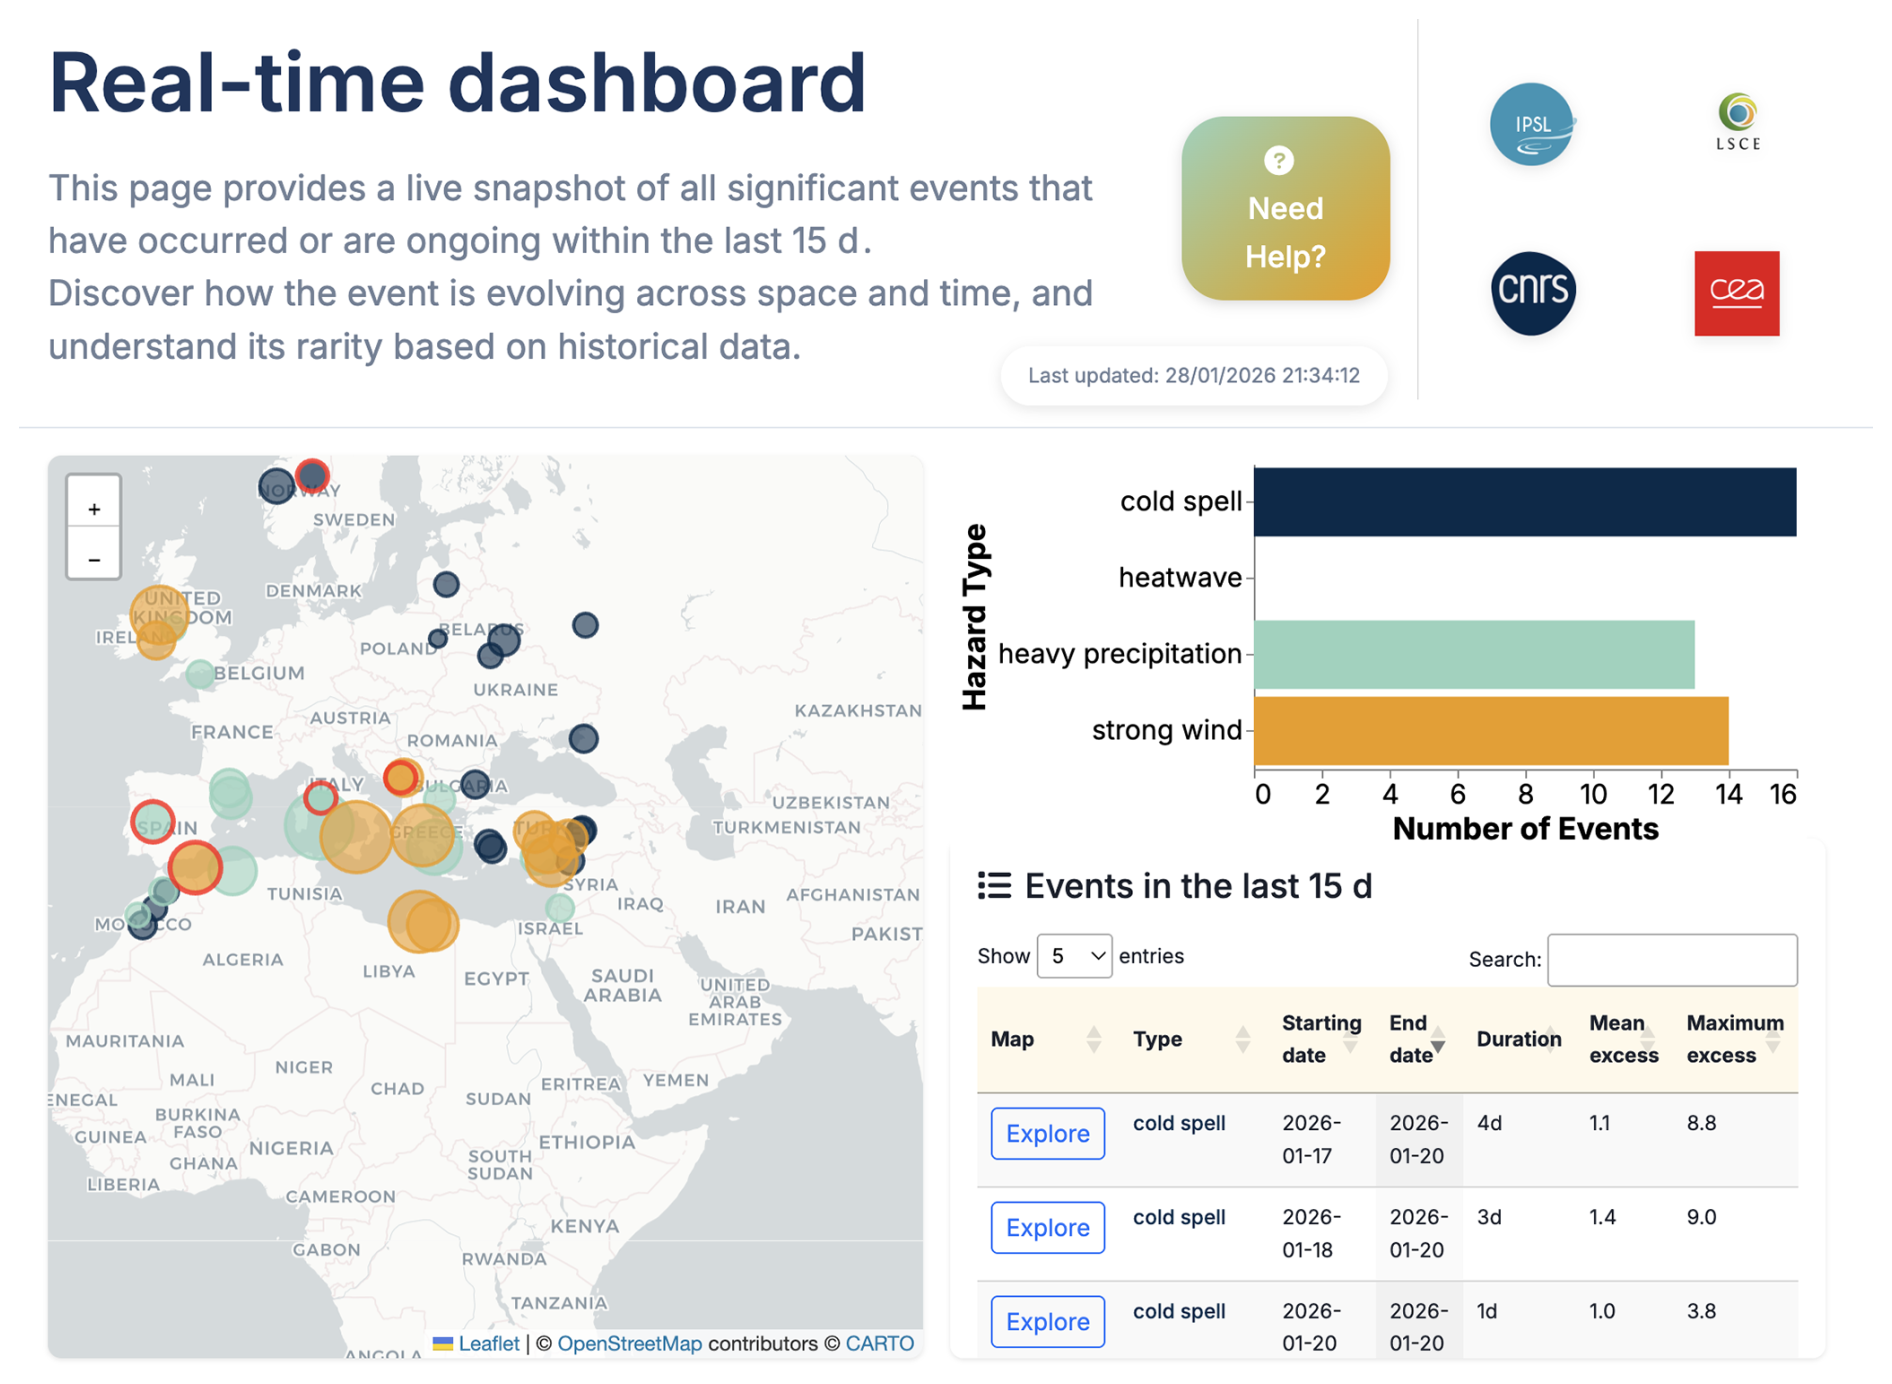
Figure A1Real-time dashboard of the RHITA web tool. Screenshot from the RHITA website taken on 28 January 2026. The figure displays events affecting Europe between 14 and 28 January 2026. Small cold spell events are visible in northern and western Europe, while larger events are detected over southern Europe, particularly southern Italy. © The authors.
A filtering panel located in the left sidebar applies to both dashboards. This panel allows users to select a specific hazard type (heatwave, cold spell, strong wind, or heavy precipitation), and the selection is propagated dynamically to all figures displayed within the dashboard.
The real-time dashboard focuses on events detected over a recent time window, extending from the previous fifteen days up to the current day. It is structured around three main components. First, an interactive map displays the centroids of the detected events as bubbles. The bubble size is proportional to the Total impacted area metric (see Table 2), providing a visual indication of the relative spatial extent of ongoing or recent events, while the bubble color denotes the hazard type. Second, a table lists all events shown on the map, together with their main attributes. Third, a bar plot summarizes the total number of detected events by hazard type. Across all components, a consistent color convention is used: red for heatwaves, dark blue for cold spells, yellow for strong wind events, and light blue for heavy precipitation events.
Selecting an event on the map opens a dedicated page displaying its spatio-temporal evolution. This page includes an interactive map, implemented through a Web Map Service (WMS), which allows users to explore the geographical footprint of the event and its evolution over time. In addition to the visual representation, the page reports the full set of event metrics defined in Table 2, the estimated rarity of the event relative to the ERA5-based climatology, and the event start and end dates.
The Historical archive provides access to the complete catalog of detected events from 1950 to 2024. This section includes statistical summary tables and graphical representations of event characteristics. In the upper panel, a multivariate scatter plot displays events over time, with event duration plotted against date. Bubble size is scaled according to the maximum excess metric, normalized between 0 and 100 to allow comparability across different hazard types. This temporal overview is complemented by bar charts (see Fig. A2) showing the total number of events grouped by country or by hazard type, as well as the distribution of event durations across the full archive.
When filtering events by country, some trajectories may appear that do not directly intersect the geographical boundaries of the selected country. This behavior arises because trajectories represent the centroids of detected events, whereas a country is considered affected when at least one grid cell belonging to the event’s spatial extent overlaps with that country.
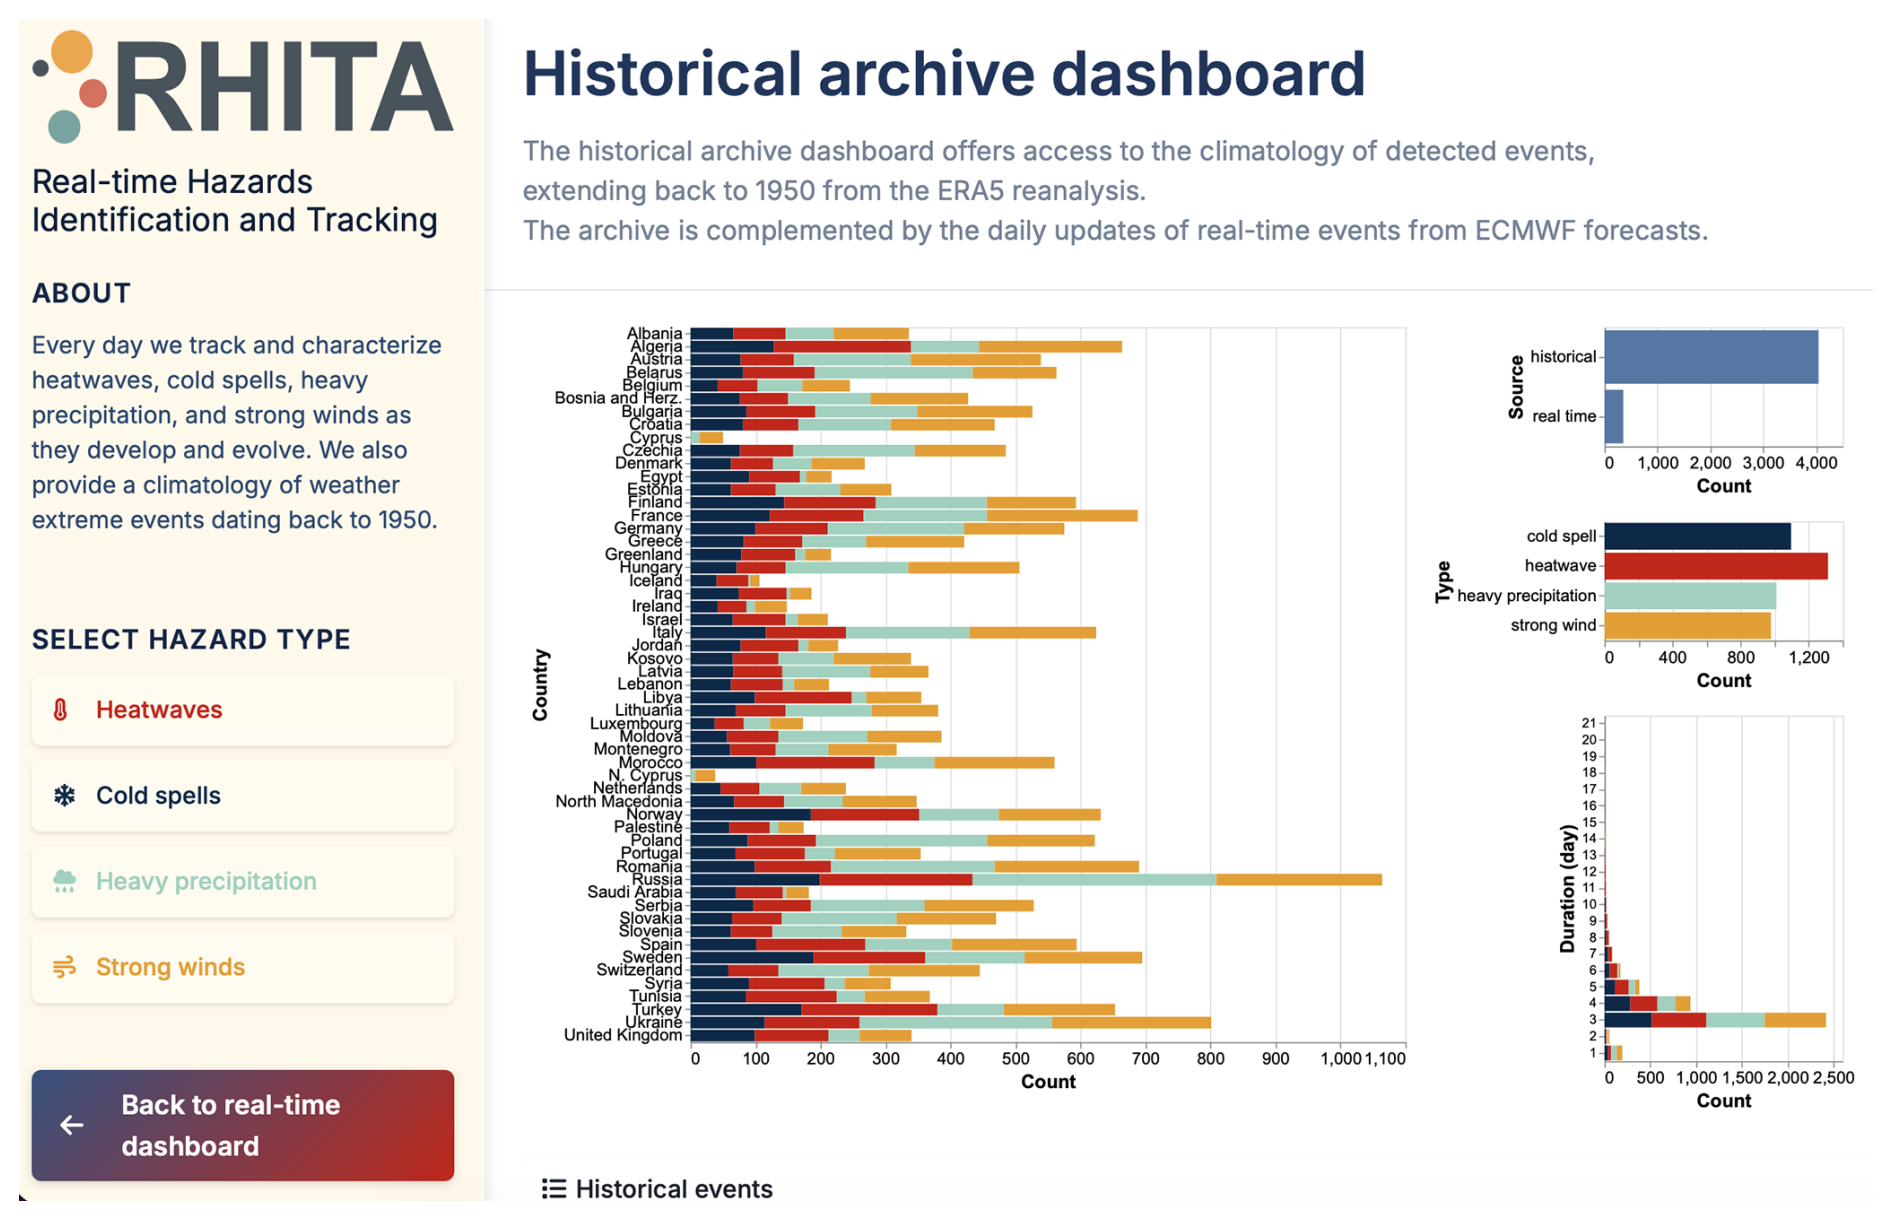
Figure A2Historical archive dashboard of the RHITA web tool. Screenshot from the RHITA website taken on 28 January 2026. The figure displays the bar charts summarizing the statistics of the hazards climatology grouped by country or hazard. © The authors.
The RHITA algorithm is implemented as an open-source Python package available at https://github.com/gcazzaniga/rhita (Cazzaniga, 2026). The meteorological data used in this analysis are openly available from the following sources: ERA5 reanalysis data can be accessed through the Copernicus Climate Data Store at https://cds.climate.copernicus.eu/ (last access: 2 September 2026), while ECMWF operational forecast data are available via their Open Data portal at https://data.ecmwf.int/ (last access: 2 September 2026). The disaster event records were obtained from the EM-DAT database (https://www.emdat.be/, last access: 2 September 2026). The RHITA web tool, presented in this study, is accessible at https://data.ipsl.fr/rhita/ (last access: 2 September 2026).
The supplement related to this article is available online at https://doi.org/10.5194/nhess-26-4741-2026-supplement.
GC coded the tool, performed the analysis. GC, DF and MV conceived the methodology. GC, PB designed the user interface. All authors contributed to writing and reviewing the article.
The contact author has declared that none of the authors has any competing interests.
Publisher's note: Copernicus Publications remains neutral with regard to jurisdictional claims made in the text, published maps, institutional affiliations, or any other geographical representation in this paper. The authors bear the ultimate responsibility for providing appropriate place names. Views expressed in the text are those of the authors and do not necessarily reflect the views of the publisher.
We acknowledge useful discussions with the members of the PowDev consortium and in particular Anne Barros, with Aglaé Jezequel, Matthieu Belin, Lou Madonnet, Pascal Yiou, Erika Coppola, Tommaso Alberti, Gabriele Messori and Marco Zanchi. We also acknowledge fruitful exchanges within the MedCyclones COST Action (CA19109) and the FutureMed COST Action (CA22162) communities. The authors gratefully acknowledge the financial support of the European Union (EU) and the Agence Nationale de la Recherche (ANR).
This research has been supported by the Agence Nationale de la Recherche (grant nos. ANR-22-PETA-0016 “PowDev”, ANR-23-CE56-0002 “Templex”, ANR-22-EXTR-0005) and the EU's Horizon 2020 (grant no. 101003469).
This paper was edited by Brunella Bonaccorso and reviewed by Milad Basirifard and one anonymous referee.
André, J., d'Andrea, F., Drobinski, P., and Muller, C.: Regimes of precipitation change over Europe and the Mediterranean, J. Geophys. Res.-Atmos., 129, e2023JD040413, https://doi.org/10.1029/2023JD040413, 2024. a
Cammalleri, C. and Toreti, A.: A generalized density-based algorithm for the spatiotemporal tracking of drought events, J. Hydrometeorol., 24, 537–548, 2023. a
Cazzaniga, G.: gcazzaniga/rhita, GitHub, https://github.com/gcazzaniga/rhita, last access: 2 September 2026. a
Christiansen, B., Alvarez-Castro, C., Christidis, N., Ciavarella, A., Colfescu, I., Cowan, T., Eden, J., Hauser, M., Hempelmann, N., Klehmet, K., Lott, F., Nangini, C., van Oldenborgh, G. J., Orth, R., Stott, P., Tett, S., Vautard, R., Wilcox, L., and Yiou, P.: Was the cold European winter of 2009/10 modified by anthropogenic climate change? An attribution study, J. Climate, 31, 3387–3410, 2018. a
Croitoru, A.-E., Piticar, A., and Burada, D. C.: Changes in precipitation extremes in Romania, Quatern. Int., 415, 325–335, 2016. a
Delforge, D., Wathelet, V., Below, R., Sofia, C. L., Tonnelier, M., van Loenhout, J. A., and Speybroeck, N.: EM-DAT: the emergency events database, Int. J. Disast. Risk Re., 124, 105509, https://doi.org/10.1016/j.ijdrr.2025.105509, 2025. a, b, c, d
Djalante, R., Holley, C., Thomalla, F., and Carnegie, M.: Pathways for adaptive and integrated disaster resilience, Nat.Hazards, 69, 2105–2135, 2013. a
ECMWF (European Centre for Medium-Range Weather Forecasts): IFS Documentation CY49R1 - Part IV: Physical Processes, Chap. 4, ECMWF, https://doi.org/10.21957/c731ee1102, 2024. a
ECMWF (European Centre for Medium-Range Weather Forecasts): ECMWF Real-Time Forecasts Open Data, ECMWF [data set], https://doi.org/10.21957/open-data, 2025. a
Faranda, D., Pascale, S., and Bulut, B.: Persistent anticyclonic conditions and climate change exacerbated the exceptional 2022 European-Mediterranean drought, Environ. Res. Lett., 18, 034030, https://doi.org/10.1088/1748-9326/acbc37, 2023. a, b
GDACS: Overall Red Flood Alert in Spain, https://www.gdacs.org/documentmaps_IP.aspx?eventid=1102983&eventtype=FL (last access: 13 November 2024), 2024. a
Guo, Y., Gasparrini, A., Armstrong, B. G., Tawatsupa, B., Tobias, A., Lavigne, E., Coelho, M. d. S. Z. S., Pan, X., Kim, H., Hashizume, M., Honda, Y., Guo, Y.-L. L., Wu, C.-F., Zanobetti, A., Schwartz, J. D., Bell, M. L., Scortichini, M., Michelozzi, P., Punnasiri, K., Li, S., Tian, L., Garcia, S. D. O., Seposo, X., Overcenco, A., Zeka, A., Goodman, P., Dang, T. N., Dung, D. V., Mayvaneh, F., Saldiva, P. H. N., Williams, G., and Tong, S.: Heat wave and mortality: a multicountry, multicommunity study, Environmental Health Persp., 125, 087006, https://doi.org/10.1289/EHP1026, 2017. a
Helama, S., Sohar, K., Läänelaid, A., Bijak, S., and Jaagus, J.: Reconstruction of precipitation variability in Estonia since the eighteenth century, inferred from oak and spruce tree rings, Clim. Dynam., 50, 4083–4101, https://doi.org/10.1007/s00382-017-3862-z, 2018. a
Hersbach, H., Bell, B., Berrisford, P., Biavati, G., Horányi, A., Muñoz Sabater, J., Nicolas, J., Peubey, C., Radu, R., Rozum, I., Schepers, D., Simmons, A., Soci, C., Dee, D., and Thépaut, J.-N.: ERA5 hourly data on single levels from 1959 to present, Copernicus Climate Change Service (C3S) Climate Data Store (CDS) [data set], https://doi.org/10.24381/cds.adbb2d47, 2018. a
Hisi, A. N., Robin, Y., Faranda, D., and Vrac, M.: CDSupdate: A meta-interface for ERA5 download request, management and storage, SoftwareX, 28, 101965, https://doi.org/10.1016/j.softx.2024.101965, 2024. a
Hofstätter, M., Lexer, A., Homann, M., and Blöschl, G.: Large-scale heavy precipitation over central Europe and the role of atmospheric cyclone track types, Int. J. Climatol., 38, e497–e517, 2018. a
Holton, J. R. and Hakim, G. J.: An introduction to dynamic meteorology, Vol. 88, Academic Press, ISBN: 9780123848666, 2013. a
IPCC: Climate Change 2021: The Physical Science Basis. Contribution of Working Group I to the Sixth Assessment Report of the Intergovernmental Panel on Climate Change, Cambridge University Press, Cambridge, United Kingdom and New York, NY, USA, https://doi.org/10.1017/9781009157896, 2021. a, b, c, d
Jézéquel, A., Faranda, D., Drobinski, P., and Lionello, P.: Extreme Event Attribution in the Mediterranean, Int. J. Climatol., e8799, https://doi.org/10.1002/joc.8799, 2025. a
Juba, B. and Le, H. S.: Precision-recall versus accuracy and the role of large data sets, Proceedings of the AAAI Conference on Artificial Intelligence, 33, 4039–4048, 2019. a
Kautz, L.-A., Martius, O., Pfahl, S., Pinto, J. G., Ramos, A. M., Sousa, P. M., and Woollings, T.: Atmospheric blocking and weather extremes over the Euro-Atlantic sector – a review, Weather Clim. Dynam., 3, 305–336, https://doi.org/10.5194/wcd-3-305-2022, 2022. a
Kendall, M. G.: Rank correlation methods., Griffin, ISBN 0852641990, 1948. a
Lorenz, R., Stalhandske, Z., and Fischer, E. M.: Detection of a climate change signal in extreme heat, heat stress, and cold in Europe from observations, Geophys. Res. Lett., 46, 8363–8374, 2019. a
Luo, M., Lau, N.-C., Liu, Z., Wu, S., and Wang, X.: An observational investigation of spatiotemporally contiguous heatwaves in China from a 3D perspective, Geophys. Res. Lett., 49, e2022GL097714, https://doi.org/10.1029/2022GL097714, 2022. a
Madsen, H., Lawrence, D., Lang, M., Martinkova, M., and Kjeldsen, T. R.: Review of trend analysis and climate change projections of extreme precipitation and floods in Europe, J. Hydrol., 519, 3634–3650, https://doi.org/10.1016/j.jhydrol.2014.11.003, 2014 a
Mann, H. B.: Nonparametric tests against trend, Econometrica, 13, 245–259, https://doi.org/10.2307/1907187, 1945. a
Mathbout, S., Lopez-Bustins, J., Royé, D., Martin-Vide, J., Bech, J., and Rodrigo, F.: Observed changes in daily precipitation extremes at annual timescale over the eastern Mediterranean during 1961–2012, Pure Appl. Geophys., 175, 3875–3890, 2018. a
Matthes, H., Rinke, A., and Dethloff, K.: Recent changes in Arctic temperature extremes: warm and cold spells during winter and summer, Environ. Res. Lett., 10, 114020, https://doi.org/10.1088/1748-9326/10/11/114020, 2015. a
Messori, G., Segalini, A., and Ramos, A. M.: Climatology and trends of concurrent temperature extremes in the global extratropics, Earth Syst. Dynam., 15, 1207–1225, https://doi.org/10.5194/esd-15-1207-2024, 2024. a
Monteleone, B., Borzí, I., Bonaccorso, B., and Martina, M.: Quantifying crop vulnerability to weather-related extreme events and climate change through vulnerability curves, Nat. Hazards, 116, 2761–2796, 2023. a
Nissen, K. M. and Ulbrich, U.: Increasing frequencies and changing characteristics of heavy precipitation events threatening infrastructure in Europe under climate change, Nat. Hazards Earth Syst. Sci., 17, 1177–1190, https://doi.org/10.5194/nhess-17-1177-2017, 2017. a
Ouzeau, G., Soubeyroux, J.-M., Schneider, M., Vautard, R., and Planton, S.: Heat waves analysis over France in present and future climate: Application of a new method on the EURO-CORDEX ensemble, Climate Services, 4, 1–12, 2016. a
Pardo, S. K. and Paredes-Fortuny, L.: Uneven evolution of regional European summer heatwaves under climate change, Weather and Climate Extremes, 43, 100648, https://doi.org/10.1016/j.wace.2024.100648, 2024. a
Paredes-Fortuny, L. and Khodayar, S.: Understanding the Magnification of Heatwaves over Spain: Relevant changes in the most extreme events, Weather and Climate Extremes, 42, 100631, https://doi.org/10.1016/j.wace.2023.100631, 2023. a
Pescaroli, G. and Alexander, D.: Understanding compound, interconnected, interacting, and cascading risks: a holistic framework, Risk Anal., 38, 2245–2257, https://doi.org/10.1111/risa.13128, 2018. a
Publications Office of the European Union: EuroVoc, European Union, EUR-Lex, https://eur-lex.europa.eu/browse/eurovoc.html?params=72,7206,914#arrow_914 (last access: 20 June 2025), 2025. a
Ruml, M., Gregorić, E., Vujadinović, M., Radovanović, S., Matović, G., Vuković, A., Počuča, V., and Stojičić, D.: Observed changes of temperature extremes in Serbia over the period 1961–2010, Atmos. Res., 183, 26–41, 2017. a
Sen, P. K.: Estimates of the regression coefficient based on Kendall's tau, J. Am. Stat. Assoc., 63, 1379–1389, 1968. a
Silversmith, W.: cc3d: Connected components on multilabel 3D images, GitHub, https://github.com/seung-lab/connected-components-3d/tree/3.4.0 (last access: 6 June 2025), 2021. a
Theil, H.: A rank-invariant method of linear and polynomial regression analysis, Indagationes Mathematicae, 12, 386–392, 1950. a
Tilloy, A., Malamud, B. D., and Joly-Laugel, A.: A methodology for the spatiotemporal identification of compound hazards: wind and precipitation extremes in Great Britain (1979–2019), Earth Syst. Dynam., 13, 993–1020, https://doi.org/10.5194/esd-13-993-2022, 2022. a
Toreti, A., Bavera, D., Acosta Navarro, J., Cammalleri, C., De Jager, A., Di Ciollo, C., Hrast Essenfelder, A., Maetens, W., Magni, D., Masante, D., Mazzeschi, M., Niemeyer, S., and Spinoni, J.: Drought in Europe August 2022, Tech. Rep. EUR 31192 EN, Publications Office of the European Union, Luxembourg, jRC130493, ISBN 978-92-76-55855-2, https://doi.org/10.2760/264241, 2022. a
Tripathy, K. P. and Mishra, A. K.: How unusual is the 2022 European compound drought and heatwave event?, Geophys. Res. Lett., 50, e2023GL105453, https://doi.org/10.1029/2023GL105453, 2023. a
UNDRR: The Sendai Framework Terminology on Disaster Risk Reduction, “Disaster”, https://www.undrr.org/terminology/disaster (last access: 13 November 2024), 2017. a
Van Oldenborgh, G. J., Mitchell-Larson, E., Vecchi, G. A., De Vries, H., Vautard, R., and Otto, F.: Cold waves are getting milder in the northern midlatitudes, Environ. Res. Lett., 14, 114004, https://doi.org/10.1088/1748-9326/ab4867, 2019. a
Vezzoli, R., Mercogliano, P., and Pecora, S.: A brief introduction to the concept of return period for univariate variables, CMCC Research Paper, SSRN 2195426, 2012. a
Vikhamar-Schuler, D., Isaksen, K., Haugen, J. E., Tømmervik, H., Luks, B., Schuler, T. V., and Bjerke, J. W.: Changes in winter warming events in the Nordic Arctic Region, J. Climate, 29, 6223–6244, 2016. a
Volosciuk, C., Maraun, D., Semenov, V. A., Tilinina, N., Gulev, S. K., and Latif, M.: Rising Mediterranean sea surface temperatures amplify extreme summer precipitation in central Europe, Scientific Reports, 6, 32450, https://doi.org/10.1038/srep32450, 2016. a, b
Zeder, J. and Fischer, E. M.: Observed extreme precipitation trends and scaling in Central Europe, Weather and Climate Extremes, 29, 100266, https://doi.org/10.1016/j.wace.2020.100266, 2020. a
Zscheischler, J., Martius, O., Westra, S., Bevacqua, E., Raymond, C., Horton, R. M., van den Hurk, B., AghaKouchak, A., Jézéquel, A., Mahecha, M. D., Maraun, D., Ramos, A. M., Ridder, N. N., Thiery, W., and Vignotto, E.: A typology of compound weather and climate events, Nature Reviews Earth & Environment, 1, 333–347, https://doi.org/10.1038/s43017-020-0060-z, 2020. a