
the Creative Commons Attribution 4.0 License.
the Creative Commons Attribution 4.0 License.
 | 01 Sep 2026
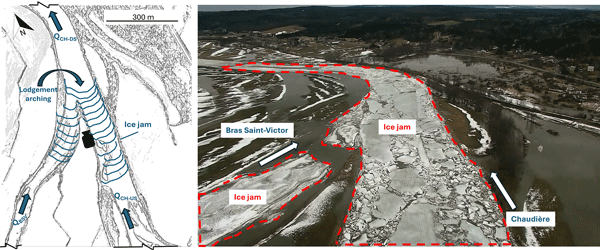
Ice jam formation at river confluences: comprehensive field investigation and comparison to laboratory-derived predictive equations
Laurence Charbonneau

Tadros Ghobrial
Jennifer Nafziger
Catherine Blouin
Gabriel Pelchat
Ice jams can cause significant damages to riverine communities during breakup season, with annual government expenditures related to ice jam floods averaging CAD 70 million in Québec alone (Ouranos, 2023). Tributaries often play an important role, leading to complex spatial ice processes and occasional flooding. The behaviour of tributaries during breakup as well as their impact on the initiation of ice jams at confluences is very site-specific and depends on ice, morphological and hydrometeorological conditions. The objectives of this study are to characterize the interaction between tributary and main river ice during breakup, to quantify hydro-environmental factors controlling breakup sequences and jam formation at confluences, and to evaluate the applicability of laboratory-derived ice jam formation mechanisms to these real-world systems. These objectives were achieved through a comprehensive field monitoring program of four confluences in Québec, Canada (three on the Chaudière River and one on the Sainte-Anne River) over four consecutive winters (2021–2024). Field monitoring included continuous water temperature and depth, time-lapse photography, drone surveys and meteorological data. The results showed that distinct ice jam formation mechanisms were identified at each confluence. At Sainte-Anne and Bras-du-Nord confluence, a flow impact mechanism consistently produced ice jams when the flow from ice-free tributary restricted ice passage in the main river. At Chaudière and Du Loup confluence, the presence of a downstream ice control structure maintained a stationary ice cover at the confluence, forcing a jam to form on the tributary. At Chaudière and Famine confluence as well as at Chaudière and Bras Saint-Victor confluence, morphological controls including depositional bars, islands and bridge piers at the tributary mouth were found to be preventing ice evacuation at the confluence. These observations were then compared to those developed in the laboratory by Ettema and Muste (2001). Laboratory-derived equations could be used to predict jam formation at the confluence on the Sainte-Anne River, where the governing mechanism was well-defined and hydraulic parameters were adequately constrained, with bank shear stress values ranging from 1.15 to 16.32 N m−2 consistent with values reported in the literature. At Chaudière and Famine confluence, the jam formation was also correctly predicted, though with a significant discrepancy in ice thickness estimates, suggesting the need for improved integration of discharge parameters. At other sites, the complexity of the field setting or data limitations limited the comparison with the laboratory framework to a qualitative assessment.
- Article
(13984 KB) - Full-text XML
-
Supplement
(3173 KB) - BibTeX
- EndNote


Ice jam flooding is a frequent phenomenon in northern rivers, causing extensive property damage and ecosystem disruption (Beltaos and Prowse, 2001). In Québec alone, the average annual cost of flooding was approximately CAD 70 million between 1991 and 2013, with the 2019 spring breakup events including those on the Chaudière River which directly motivated this study, costing an estimated of CAD 438 million in government expenditures (Ouranos, 2023). Furthermore, ice jam floods are disproportionately costly relative to their frequency because they account for approximately one third of flood events but result in two thirds of total flood damages in regions where detailed records are available (Beltaos and Prowse, 2001). On the Chaudière River, 51 ice jams were documented over just two consecutive winter seasons (Ghobrial et al., 2023), illustrating the frequency and concentration of these events in the study area. Ice jams form when incoming ice discharge exceeds local ice transport capacity, typically at locations with geometric or hydraulic constraints such as river bends, slope reductions, bridges and confluences (Hicks, 2009; Beltaos, 2008). River confluences often play an important role during the breakup season, leading to complex spatial ice processes and frequent ice jam flooding (Rice et al., 2008). The behaviour of tributaries during breakup as well as their impact on the initiation of ice jams near the confluences is very site specific and depends on ice, morphological and hydrometeorological conditions. Smaller tributaries can breakup before main rivers due to their steeper gradients, narrower channels and warmer water temperatures, often resulting in tributary ice being jammed at its mouth (Michel, 1972; De Munck et al., 2017, 2011). Many field observations of ice dynamics at confluences were conducted on branching confluences (i.e., river deltas). Bergeron and Roy (1988) studied the effects of ice jams at a delta on the morphology of the riverbed, while Martel (2019) looked at the structure of the flow at the vicinity of a confluence underneath the ice. Beltaos et al. (2012) studied the Mackenzie River Delta and found that the jams in the delta channels were initiated by the ice jam release waves from the upper reach and consisted of a surface accumulation of ice blocks and plates which created increased roughness. Nafziger et al. (2019) observed ice jam dynamics in the Hay River Delta and determined that the ice always began consolidating (i.e., compacting into a stable, rigid mass) at the upstream end of the jam and stopped at the toe (the jam's downstream end), prompting a rejection wave that caused an alternating pattern of ice movement between two adjacent channels of the delta. Field data have been used to develop numerical models aimed at improving our understanding of jamming processes and flow distribution at confluences using 1-D (e.g., Blackburn et al., 2015; Zhang et al., 2017) and 2-D (e.g., Brayall and Hicks, 2012) models. Field data has also been used to develop prediction models for the reoccurrences of ice jams at confluences (e.g., Massie et al., 2002; McDonald et al., 2002).
Few observations have been made on merging confluences (i.e., a tributary merging with a main river), despite documented field examples of ice jam formation at such junctions in North America (Rice et al., 2008). Prowse (1986) conducted a six-year field investigation of ice jams at the confluence of Liard and Mackenzie Rivers in Canada's Northwest Territories, identifying two dominant controls (stationary ice cover and presence of deltaic bars). Turcotte et al. (2014) provided a qualitative description of the impacts of upstream tributaries on the downstream channels' freeze-up and breakup processes on the Montmorency River. They showed that dynamic ice processes both affect and are affected by the thermal and hydrological regimes of the steeper tributaries. The most comprehensive study on jamming processes at merging confluences was conducted by Ettema and Muste (2001) and Ettema et al. (1999) utilizing extensive laboratory experiments on a small-scale hydraulic model based on observed conditions at real-life confluences. The authors described a total of seven processes leading to ice jams at confluences, which can be grouped based on ice, hydraulic, and morphological conditions, as listed below.
-
Ice conditions:
- 1.
An ice run from the tributary meeting a stationary or slow-moving ice cover at the confluence;
- 2.
An ice run discharging into a channel where the water is still or sluggish;
- 3.
Large pieces of ice merging together from both channels and forming an arching jam at the confluence;
- 1.
-
Hydraulic conditions:
- 4.
Jamming where the elevated upstream lateral pressure from the tributary is greater than the driving force of the ice moving downstream in the main channel;
- 5.
Jamming due to flow impact when one of the channels (which is free of ice) has a strong enough flow to prevent ice runs in the other channel to evacuate freely;
- 4.
-
Morphological conditions:
- 6.
Jamming at confluence bar in the main channel where a bar has developed just downstream from the tributary, ice may be coming from one or both channels and, although formed in the main river, the jam may extend into the tributary;
- 7.
Ice grounding on confluence deltaic bars occurring in the case of a discordant-bed confluence where the bed levels of the two confluent channels differ significantly in level and slope.
- 6.
Ettema and Muste (2001) identified the different factors leading to confluence jamming, including the relative location of the dividing streamline as well as the flow-separation zone between the two flows, the concentration of incoming ice in each channel and the backwater effect created by ice congestion in the confluence. Based on their extensive model testing, they proposed simplified force balance equations for predicting specific ice jam formation at confluences for jamming due to merging ice runs (process 3), jamming due to flow impact (process 5) and jamming due to confluence bars (process 6) only, as these were the only mechanisms for which sufficient data were available to derive predictive relationships. Nevertheless, the validity of these simplified equations has never been evaluated with field data.
In summary, many past studies have focused on ice jams at branching junctions in deltas and, to the best of the authors' knowledge, there has not been a comprehensive field study on the hydrometeorological, morphological and river ice conditions affecting breakup processes and jamming at merging confluences. In addition, there is insufficient field data and observations to evaluate the ice jam processes presented by Ettema and Muste (2001) or the applicably of their laboratory-derived equations for jam initiation at confluences. Consequently, the objectives of this study are three-fold: (1) to characterize the interaction between tributary and main river ice during breakup; (2) to quantify hydrometeorological factors controlling breakup sequences and jam formation at confluences; and (3) to evaluate the applicability of laboratory-derived equations of ice jam formation to field cases. To do so, four river confluences across two watersheds in Québec, Canada, were monitored over four consecutive winters (2021 to 2024). Field investigation included continuous measurement of hydraulic, meteorological and surface ice conditions at several locations along each confluence. This field data and results from hydraulic models were then used to validate the applicability of laboratory-developed ice jam prediction equations related to each confluence. The paper is structured as follows: field observations at each of the four confluences are first presented for a representative year specific to each site, addressing objectives 1 and 2, followed by a dedicated section bringing together the comparisons to the Ettema and Muste (2001) laboratory framework for all four confluences, addressing objective 3. This structure separates the field documentation from the model validation.
The locations of studied confluences with their main tributary rivers are shown in Fig. 1. The study sites include the confluence of the Sainte-Anne River (STA) with the Bras-du-Nord River (BDN) (Fig. 1a), and three confluences along the Chaudière River (CH): with the Du Loup (DL), Famine (FA) and Bras Saint-Victor (BSV) Rivers (Fig. 1c). These locations were selected for their documented history of frequent ice jam flooding and represent diverse morphological and hydraulic conditions. Although spring breakup occurs between mid-March and mid-April, there are also mid-winter breakup events on the studied rivers which could sometimes lead to ice jam floodings (Turcotte et al., 2020). The morphological characteristics of each study site are summarized in Table 1.
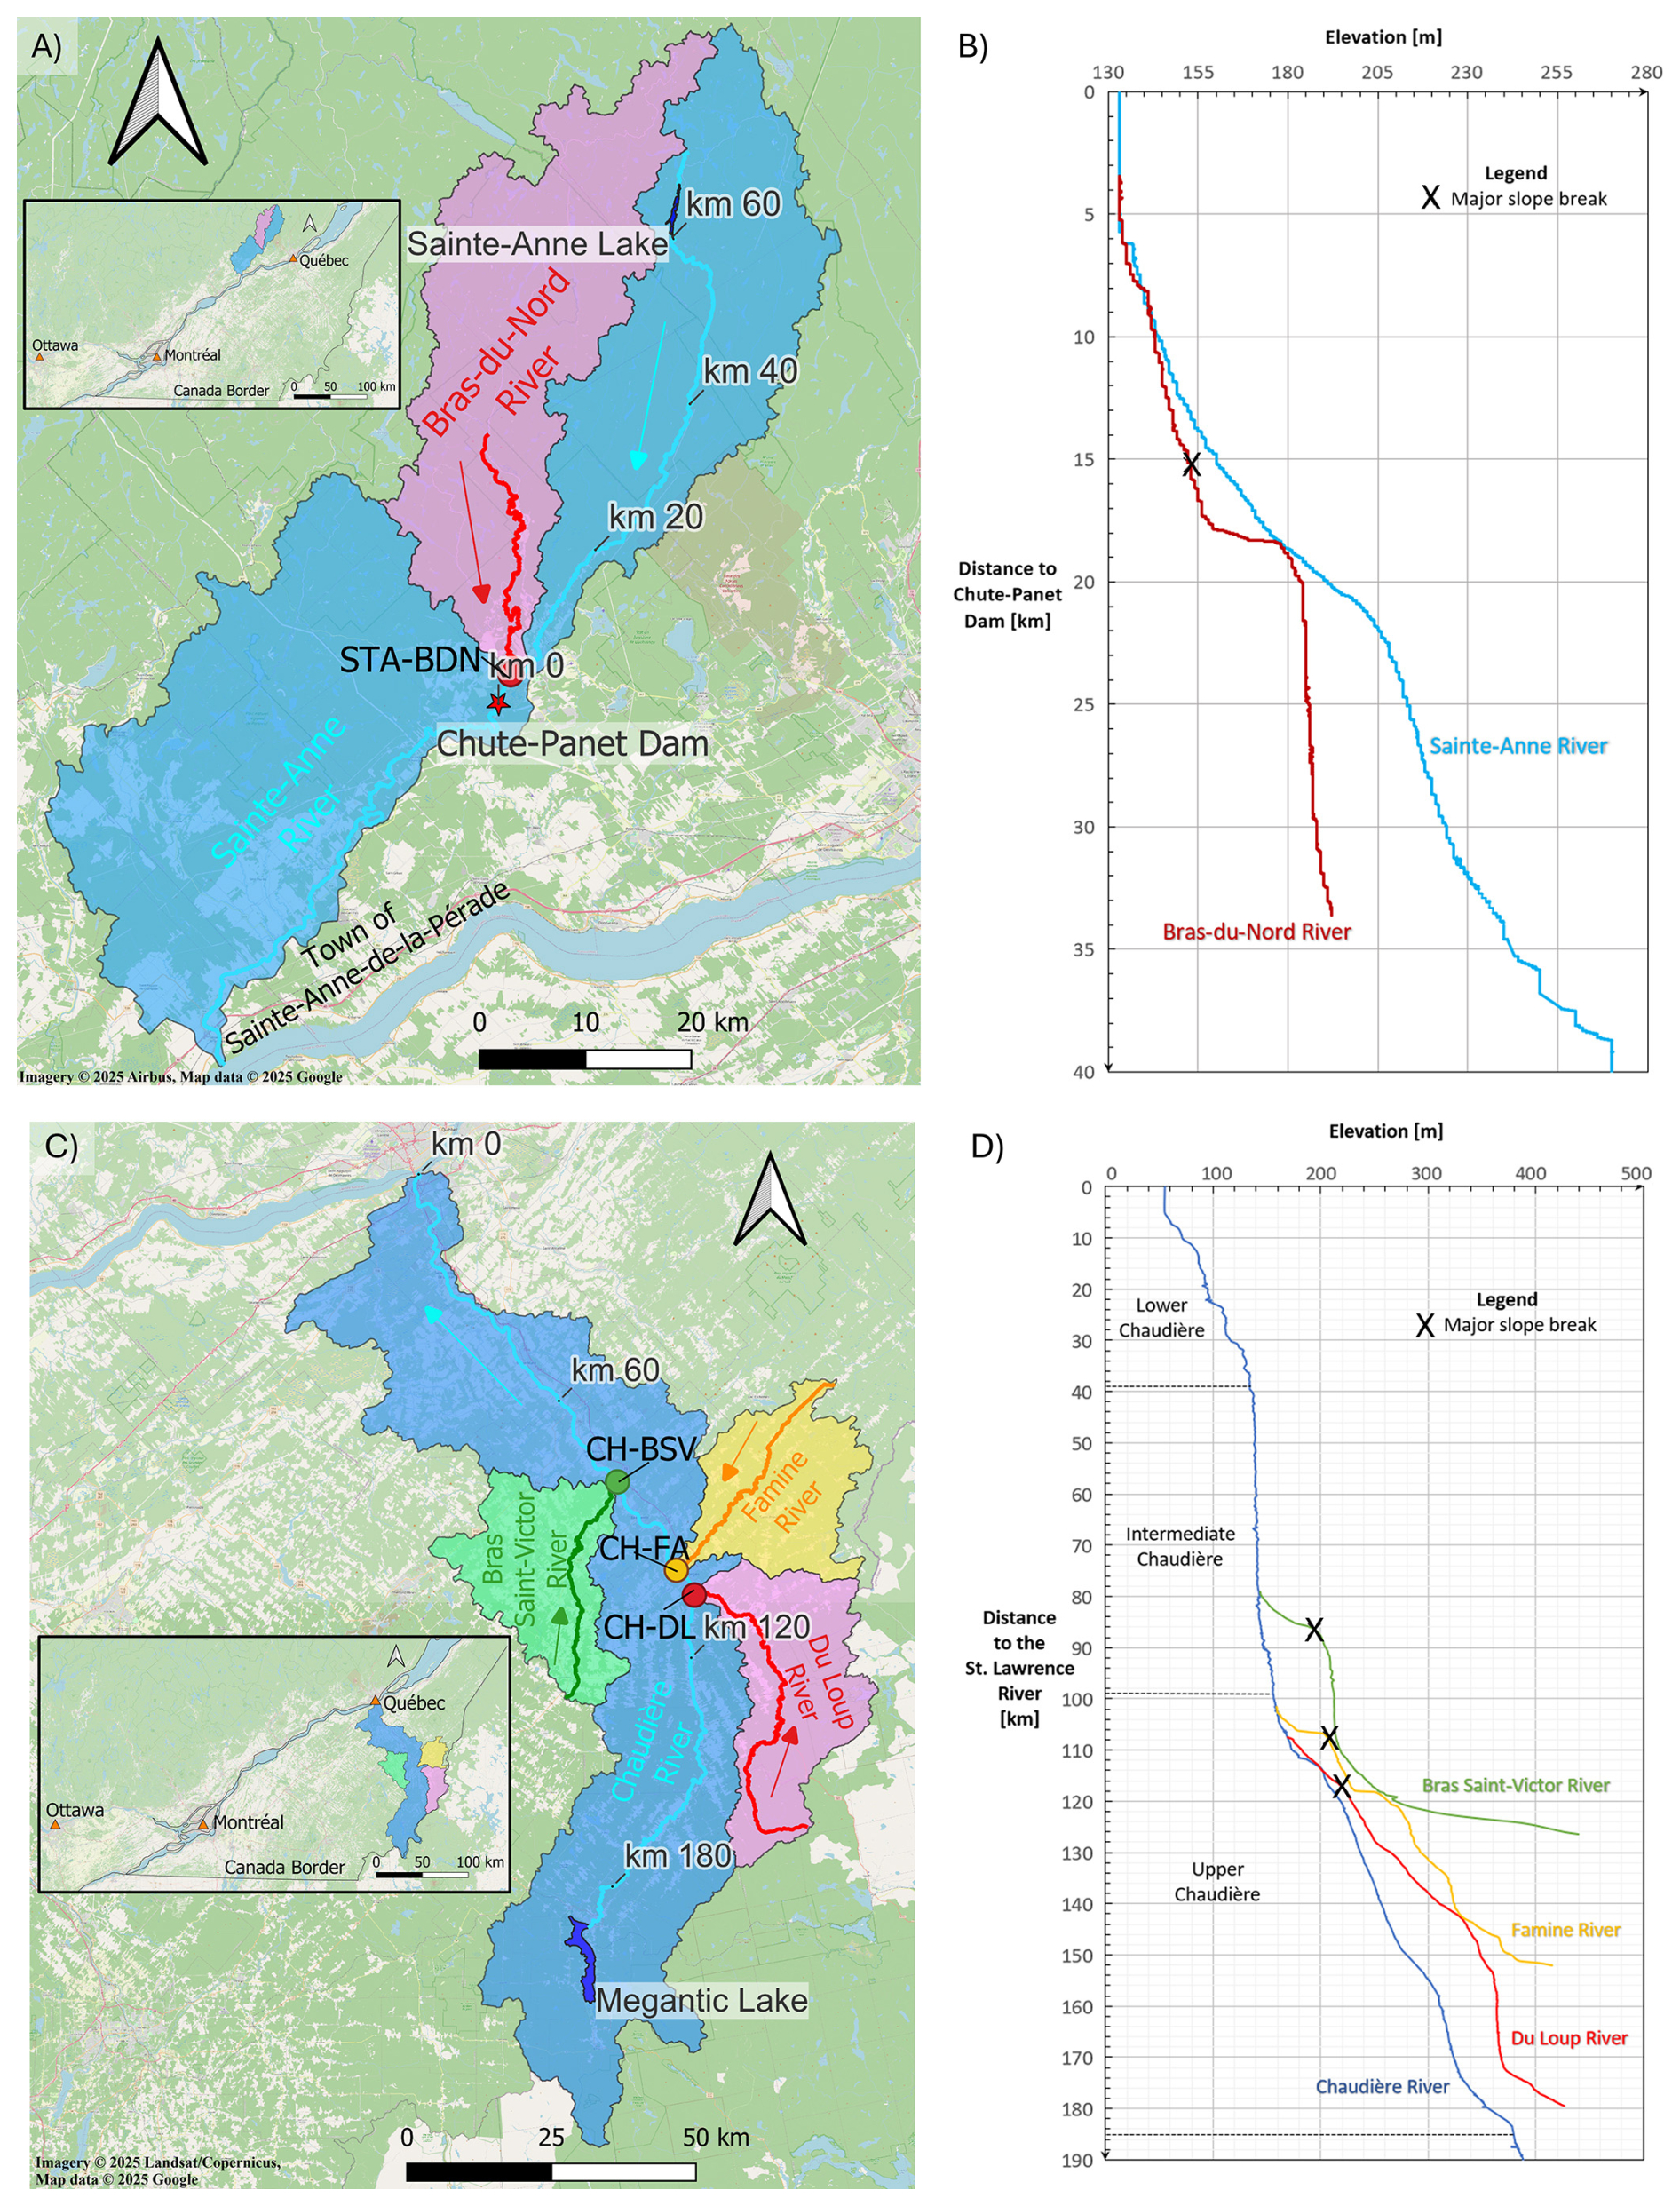
Figure 1Maps showing study areas (A) watersheds and river course for the Sainte-Anne River with location inset in Canada (Imagery © 2025 Airbus, Map data © 2025 Google; Google, 2025b), (B) elevation profiles of the Sainte-Anne River, (C) watersheds and river course for the Chaudière River with location inset in Canada (Imagery © 2025 Landsat/Copernicus, Map data © 2025 Google; Google, 2025b) and (D) elevation profiles of the Chaudière River.
Table 1Morphological characteristics for all study rivers.
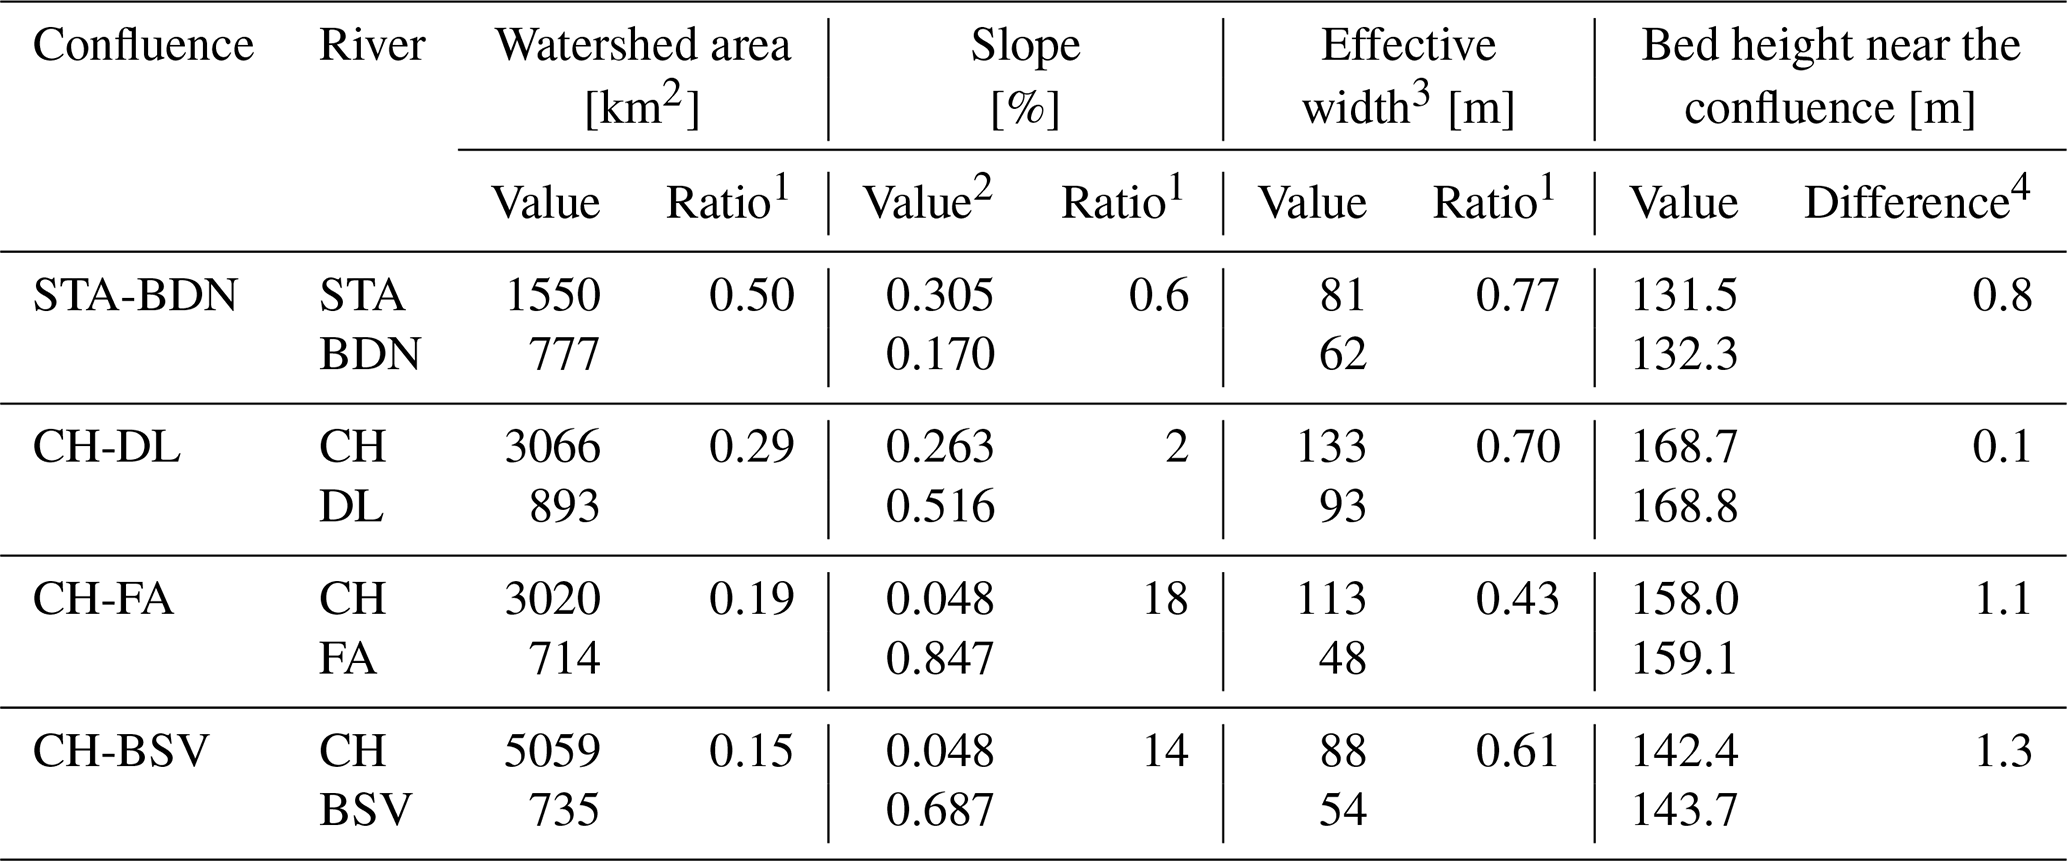
1 Tributary/main river. 2 Downstream reach of the tributary is considered from the mouth to a major slope break which corresponds to km 15.2 for BDN, km 9.7 for DL, km 6.1 for FA and km 7.4 for BSV (see Fig. 1). 3 Averaged over a distance equivalent to about 5 times the width of the river at the confluence, upstream from the mouth in the tributary and downstream from the confluence in the main river (after Bonner and Brunner, 1996). 4 Tributary minus main river.
STA originates from the Sainte-Anne Lake and flows south for 123 km to the north shore of the St. Lawrence River at the Town of Sainte-Anne-de-la-Pérade. While the total watershed drains 2706 km2, this study focuses exclusively on the area upstream of the Chute-Panet Dam (the downstream boundary of the study reach at km 0), covering 1550 km2. BDN is the largest tributary within the STA watershed: it drains 777 km2, is 48 km long, and joins STA 3.3 km upstream of the Chute-Panet Dam. Figure 2 shows the STA-BDN confluence study area. There are two ice control structures located on the STA upstream of the confluence and were designed to mitigate ice-related flooding at the Town of Saint-Raymond between km 5 and 3. The first structure is at km 6 and consists of a weir with piers and the second structure is a staggered concrete blocks arrangement on the riverbed at km 10 (Pourshahbaz et al., 2023). An iron bridge with no piers is located downstream of the confluence at km 2.2, creating additional flow constrictions and may influence ice accumulation and jamming. Also, there are two islands at the mouth of BDN. Based on the bed level difference of 0.8 m near the confluence and a slope ratio of 0.60 between the tributary and the main river (Table 1), the STA-BDN can be classified as a discordant bed confluence (Charbonneau et al., 2024). While discordant bed confluences typically exhibit a steeper tributary (Chang, 1988), at this study site the slope at the mouth of the BDN decreased from 0.577 % to 0.170 % due to sediment accumulation (Fig. 1b). These apparent deltas point bars directly upstream of the confluence regulate the tributary discharge before it enters the confluence (Fig. 2a). The BDN's higher invert bed level relative to the STA, deflects flow towards the STA, as laboratory studies have confirmed that flow interaction at confluences is deflected towards the channel with lower bed elevation (Biron et al., 1996). Consequently, the STA discharge appears to be constrained towards its left bank.
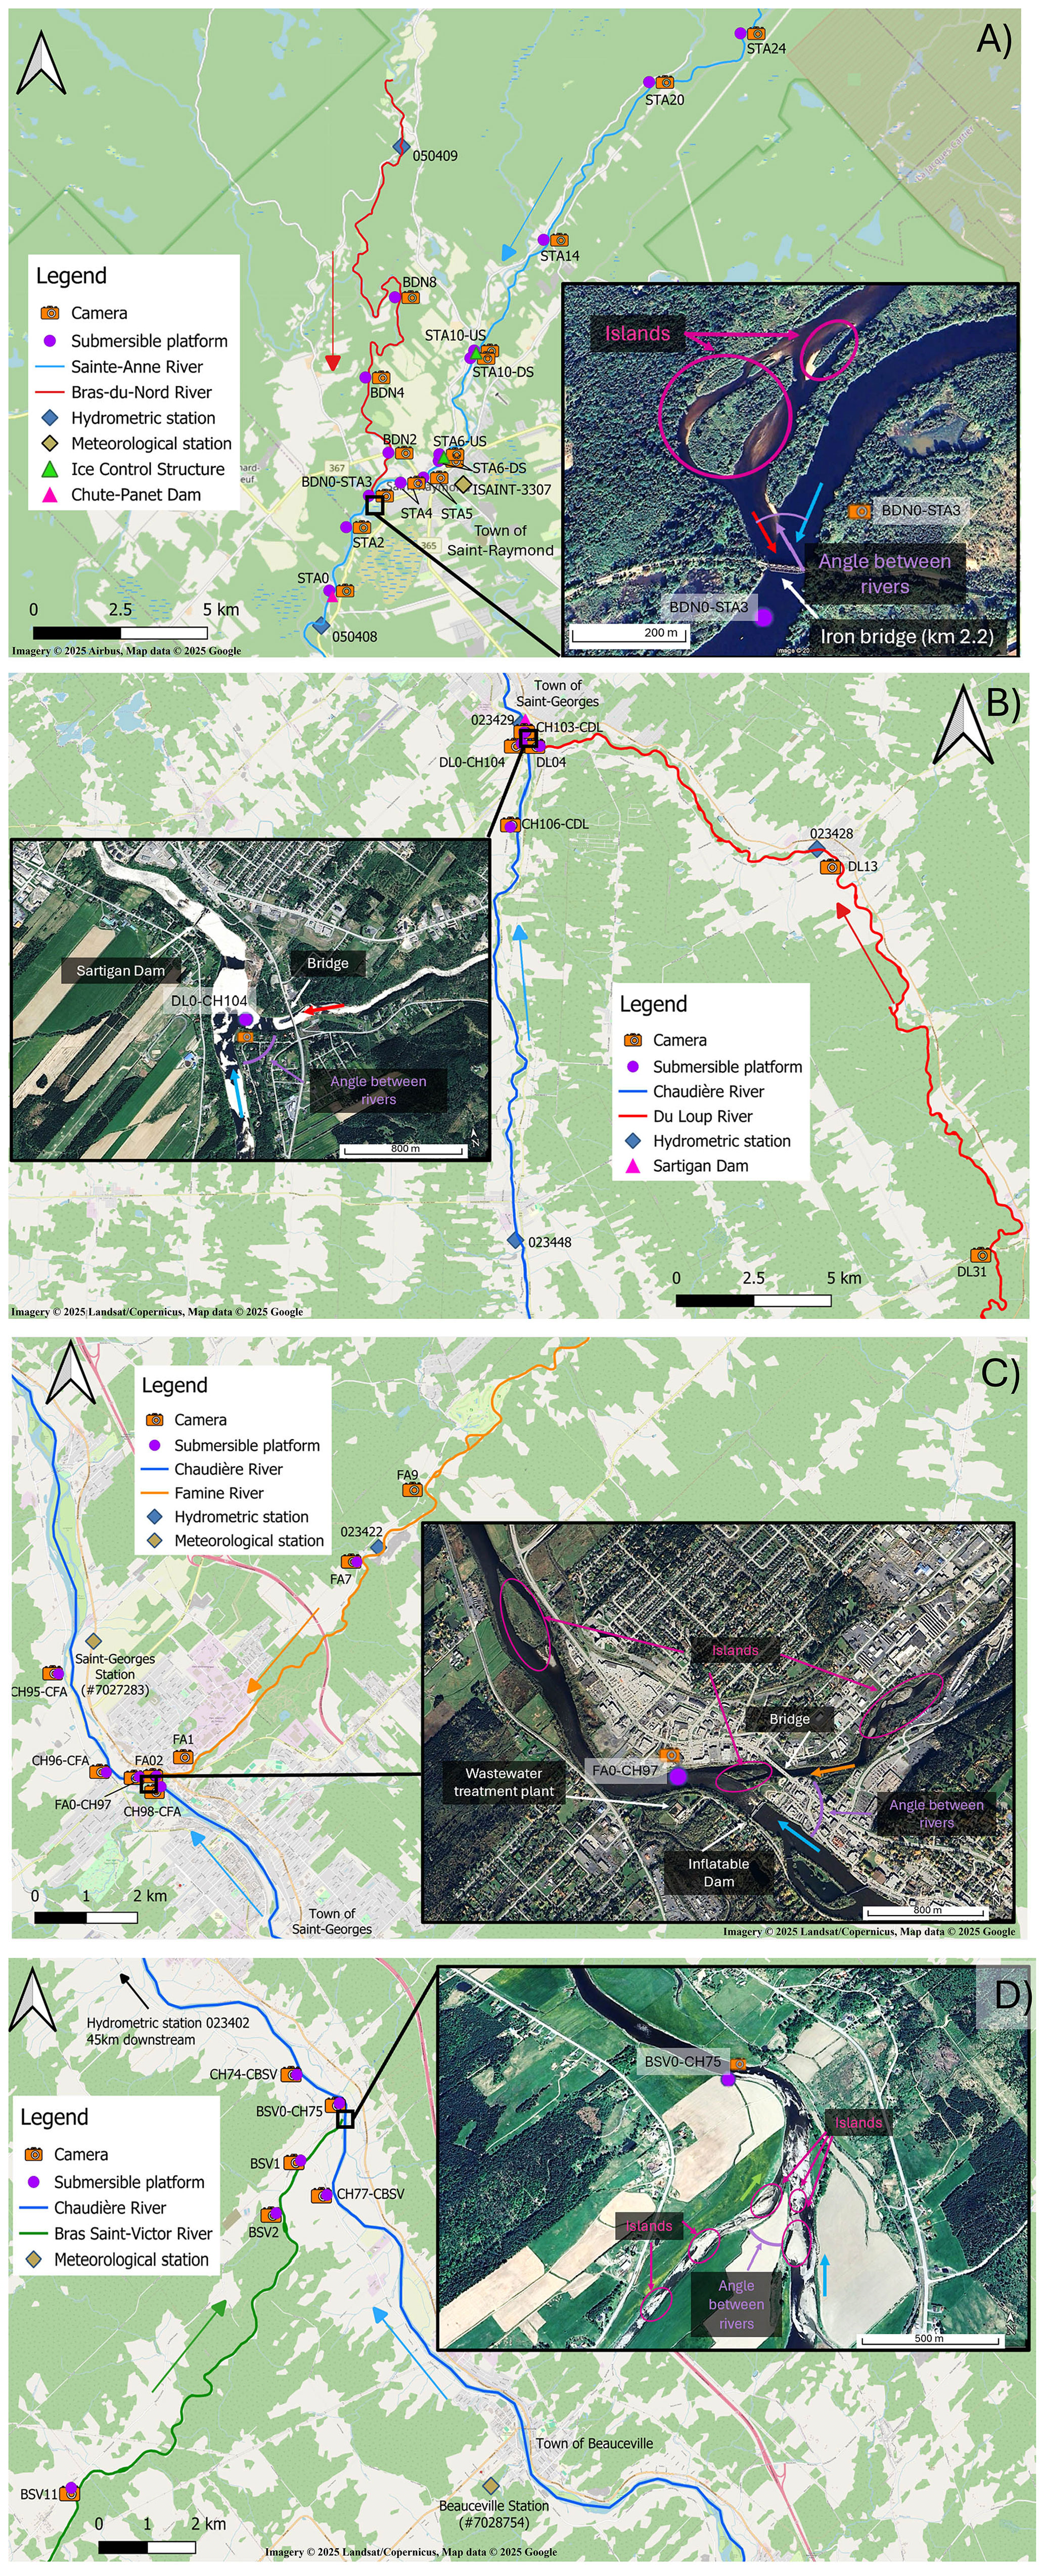
Figure 2Study sites showing instrumentation locations at each measurement sites with their respective site ID for (A) STA-BDN, (B) CH-DL, (C) CH-FA, and (D) CH-BSV. The insert is an aerial zoomed in photo of the confluence to highlight the morphological features (A) Imagery © 2025 Airbus, Map data © 2025 Google; (B, C, D) Imagery © 2025 Landsat/Copernicus, Map data © 2025 Google) (Google, 2025a, b). The sites ID in these figures indicates the river where the instrument was located followed by its stationing from the downstream boundary (Chute-Panet Dam for STA and Innergex Dam for CH).
CH originates from Mégantic Lake and flows north for 192 km to discharge into the St. Lawrence River, with a total watershed area of 6694 km2. The Innergex Dam is located 4 km upstream of the mouth of CH, marking km 0. The river can be divided into three reaches with distinct bed slopes, namely the upper (km 185 to km 99, slope: 0.263 %), intermediate (km 99 to km 39, slope: 0.048 %) and lower (from km 39 to the mouth, slope: 0.210 %) reaches (Fig. 1d), with a mean annual discharge of 114 m3 s−1. Spring freshet on the CH represents approximately 60 % of its annual flow volume and is partially responsible for its frequent ice-jam floods (Biron et al., 2020). At each confluence, the bed morphology, either concordant or discordant, governs local sediment-depositional patterns, which in turn determine where ice grounding is most likely to occur during low-discharge periods. Figure 2b shows the CH-DL confluence, which is located at km 103.4 of CH. At about 0.8 km downstream of the confluence, there is an ice control structure (the Sartigan Dam, km 102.6 of CH), which was designed to retain the ice from the upper reach of the CH to reduce the risk of ice jam flooding on the downstream reaches (Pourshahbaz et al., 2023). The CH-DL is the only CH confluence that exhibits a concordant bed configuration (Rhoads, 2020), with the invert bed level of the CH only 0.1 m lower than that of the DL (Table 1). Despite the tributary slope being twice as steep as that of the main river, these similar bed levels enable discharges and sediments to merge without significant sediment deposition at the junction. However, bridge piers and a sand bar create local restrictions near the mouth of DL. A concordant bed bathymetry typically includes a zone of sediment scour whose position aligns with that of the dividing streamline. This dividing streamline represents the hydraulic boundary separating the discharges from the two rivers, with the flow deflection zone forming in the main river upstream of the streamline and the flow separation zone developing downstream along the bank where the tributary joins (Ettema and Muste, 2001). The depth of this sediment scour zone was estimated at 2.7 m with the bathymetric survey of the confluence. This value is consistent with the prediction of 2.9 m from Best (1988)'s relationship, using the confluence angle of 88° and average discharge ratios. At the downstream end of this scour region, transported sediments commonly become entrapped and accumulate in the flow separation zone, forming a large bar (Ettema and Muste, 2001). This sedimentary deposit is visible downstream of the confluence on the right bank of the CH (Fig. 2b). Figure 2c shows the CH-FA confluence, (km 97.5, CH). Bars and a highway bridge at the mouth reduce the effective width of FA, and additional bars are present in the CH downstream of the confluence. The FA and CH riverbeds are discordant, with the two rivers exhibiting significantly different slopes, with the FA having a slope 18 times steeper than the CH (Table 1). This slope difference, combined with the 1 m bed level difference where the tributary is positioned above the main river, creates favorable conditions for the sediment-depositional patterns characteristic of discordant bed confluences. The notable underwater drop at the confluence further enhances sediment deposition processes, resulting in accumulations deposited in a fan-shaped pattern where the FA joins the CH (Fig. 2c). During periods of low discharges, ice grounding can occur on these depositional features. Figure 2d shows the CH-BSV confluence, located at km 75.3 of the CH. Like CH-FA, this confluence exhibits a discordant bed configuration with the two rivers displaying a slope ratio of 14 (Table 1). Bars of sediment form at the confluence, where ice grounding can occur during low discharge periods.
3.1 Instrumentation and data sources
Field monitoring was conducted at the four confluences over four consecutive winters from 2021 to 2024. Table 2 summarizes the monitoring equipment deployed at each site for each year, indicating whether water level, water temperature, and ice observations (Ice obs.) were collected at each location. Ice observations refer to ice state and surface concentration. The number of instrumented locations at each confluence ranged between 6 and 13 sites. In some cases, two cameras were installed at the same river stationing to capture both directions, and in two cases, instruments were also installed upstream and downstream of an ice control structure, thus at the same measuring site.
Table 2Details of monitoring sites at each confluence for each year of the study period.
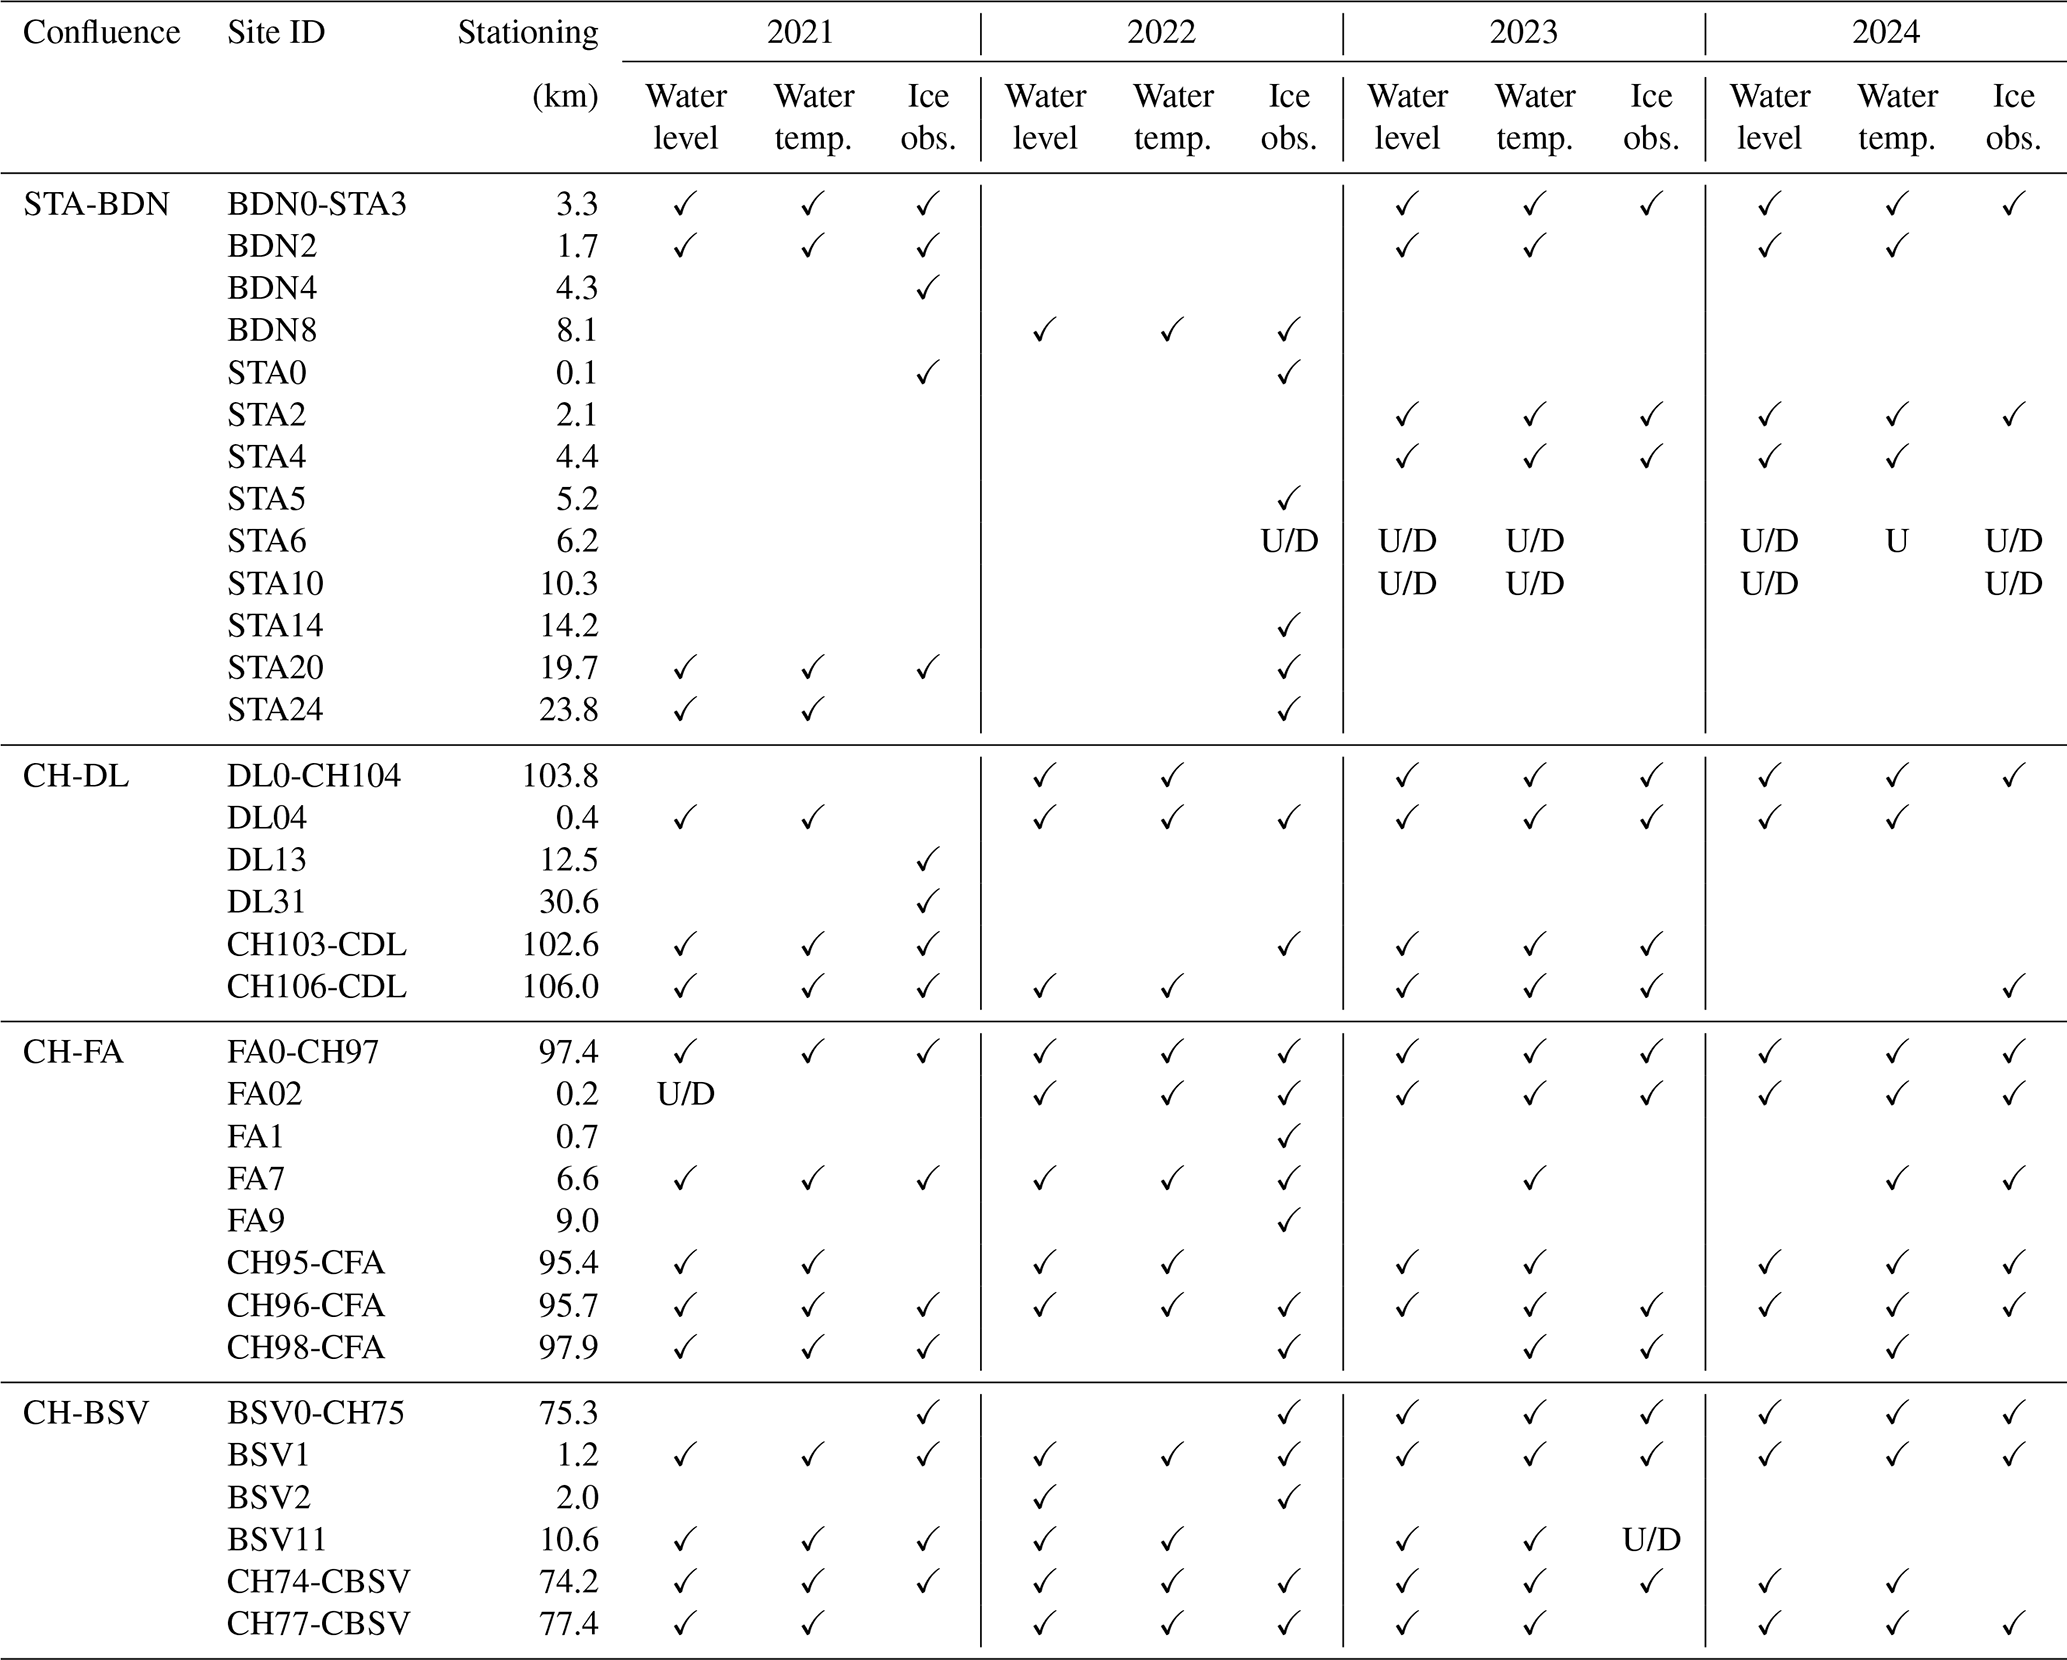
Note: U refers to an upstream view or location and D to a downstream view or location at the same site.
Submersible platforms containing temperature (RBRsolo3T®, accuracy ±0.002 °C) and pressure (HOBO U20L-01®, accuracy ±0.1 % FS) sensors were deployed at several locations including: (1) upstream of the confluence on the main river, (2) upstream of the confluence on the tributary, (3) within the confluence, and (4) downstream of the confluence on the main river, where conditions allowed. The sensors were housed within two PVC pipes, secured with fitted plastic rings and closed with bolts in holes that permitted water circulation while maintaining sensor stability. Each pipe was mounted to an 11 kg metal plate and the platform was anchored to the riverbed using rebar spikes. To prevent displacement by ice movement, chains were welded to each plate and secured to the riverbed using additional metal stakes. The data recording intervals varied between instruments and from year to year but were 1–15 min for the temperature sensors and 4 min to 24 h for the pressure sensors. Surface ice dynamics were documented through time-lapse cameras (Brinno BCC100®, photo interval: 20–120 min). Drone flights were conducted at each site 1 to 6 times per year, during periods of potential ice movements such as a significant rise in air temperature, after precipitation events, and when river discharge was forecast to increase. Images from the European Space Agency's Sentinel-2 satellite (∼ 5 d frequency when not cloudy), were acquired through the Sentinel-HUB® platform (Sentinel-HUB, 2025).
River discharge was obtained from multiple hydrometric stations operated by the Centre d'expertise hydrique du Québec (CEHQ, 2025). The location of all hydrometric stations and their ID numbers are shown in Fig. 2. The CEHQ operates one hydrometric station on the STA River just downstream of Chute-Panet Dam (ID 050408, km 0.0, watershed area: 1546 km2) and another on the BDN River (ID: 050409, km 16.6 from the mouth, watershed area: 646 km2). Three relevant stations reporting discharge data on the CH River, namely St. Martin station (ID 023448, km 120.5, watershed area: 2009 km2) upstream of the CH-DL confluence, St. Georges station (ID 023429, km 102.6, watershed area: 3085 km2) downstream of the Sartigan Dam, and Saint-Lambert-de-Lauzon (ID 023402, km 25.6, watershed area: 5820 km2). In addition, the CEHQ has a hydrometric station on the DL River (ID 023428, km 10.8 from the mouth, watershed area: 806 km2) and on the FA River (ID 023422, km 6.6 from the mouth, watershed area: 696 km2). All discharge data were obtained at 15 min intervals when available or as daily averages and correspond to CEHQ ice-corrected values when available, or to open water values otherwise.
Meteorological data was collected from the closest meteorological station(s) to the sites. For STA-BDN, air temperature and atmospheric pressure were acquired from a municipal weather station (Station #ISAINT3307; ISAINT3307 Weather Underground, 2025) in Saint-Raymond (Fig. 2a), while precipitation (daily rainfall and snowfall) and total snow on the ground were obtained from the Ministère de l'Environnement de la Lutte contre les Changements Climatiques, de la Faune et des Parcs (MELCCFP, 2025) of Québec weather station Sainte-Christine (#7017000) located in the municipality of Saint-Basile, approximately 15 km downstream of the confluence. For CH confluences, air temperature and atmospheric pressure were acquired from the Beauceville weather station (ID 7028754, Fig. 2d) operated by Environment and Climate Change Canada (ECCC, 2025), and the precipitation (daily rainfall and snowfall) and total snow on the ground were obtained from the St-Georges weather station (ID 7027283, Fig. 2c) operated by the MELCCFP. Ice thicknesses for the STA-BDN confluence were acquired from ice surveys done by the town of Saint-Raymond at various locations along the rivers, except for the year of 2024 when transects were done on each reach by the Université Laval research team as detailed by Charbonneau et al. (2025). For CH-FA, ice thicknesses were measured by the Université Laval research team in 2021, 2022, and 2023.
3.2 Data analysis
The typical ice breakup sequence for each confluence was analysed through the time series of measured meteorological and hydrometric data to identify characteristic patterns and critical thresholds. Discharge at each confluence mouth was determined by scaling the discharge from hydrometric stations' locations to the confluence location using the ratio of the watershed area at the confluence (Table 1) to the watershed area of the corresponding hydrometric station. For the STA-BDN, the upstream STA discharge was calculated by subtracting the scaled BDN discharge (ID 050409) from the downstream scaled STA discharge (ID 050408). For the CH-BSV, BSV discharge was estimated by subtracting combined upstream scaled contributions (CH: ID 023429 and FA: ID023422) from the downstream scaled measurement (CH: ID 023402). The discharge ratio (Qr) was defined as the ratio of the tributary discharge to the main river discharge.
Cumulative degree-days of freezing (CDDF) and Cumulative degree-day of thawing (CDDT) were calculated to represent the ice cover resistance at the end of the winter and the ice cover weakening by breakup time, respectively. CDDF calculations were initiated when daily air temperatures remained below 0 °C for three consecutive days starting on the first of October, while subsequent positive temperatures were ignored (Bilello, 1980). CDDT calculations were initiated when daily air temperatures exceeded −5 °C for three consecutive days from the first of February, with only daily temperatures above −5 °C contributing to the cumulative sum (Turcotte et al., 2025). The cumulative degree-day ratio (CDDr) was defined as the ratio of CDDT to CDDF, which reflects the degree of thermal weakening of the ice cover at the end of the winter season.
Time-lapse images, drone flights and satellite imagery were analysed to determine the ice type and estimate surface coverage and ice “state” during the breakup period, based on four ice conditions: open-water (less than 50 % ice coverage), ice cover (more than 50 % stationary ice coverage), ice run (moving ice covering at least 20 % of the surface) and ice jam (broken stationary ice accumulation). All data were processed using MATLAB code created by the Université Laval research team and synchronized to a 1 h timestep using linear interpolation between available measurements.
Of the seven ice jam formation processes identified by Ettema and Muste (2001), predictive force balance equations were only developed for three: jamming due to merging ice runs (process 3), jamming due to flow impact (process 5), and jamming due to confluence bars (process 6). This section therefore focuses exclusively on these three processes because for the remaining mechanisms, no predictive equations exist in the literature and the comparison with the laboratory framework is qualitative. The morphological and hydraulic characteristics of each confluence were compared with established laboratory study cases by Ettema and Muste (2001) to identify analogous experimental conditions and ice jam formation thresholds. Field-measured parameters including confluence angle, channel width ratio and discharge ratio were matched with corresponding laboratory experiments to verify predictive ice jam location. The forces and parameters used for each process are illustrated in Fig. 3.
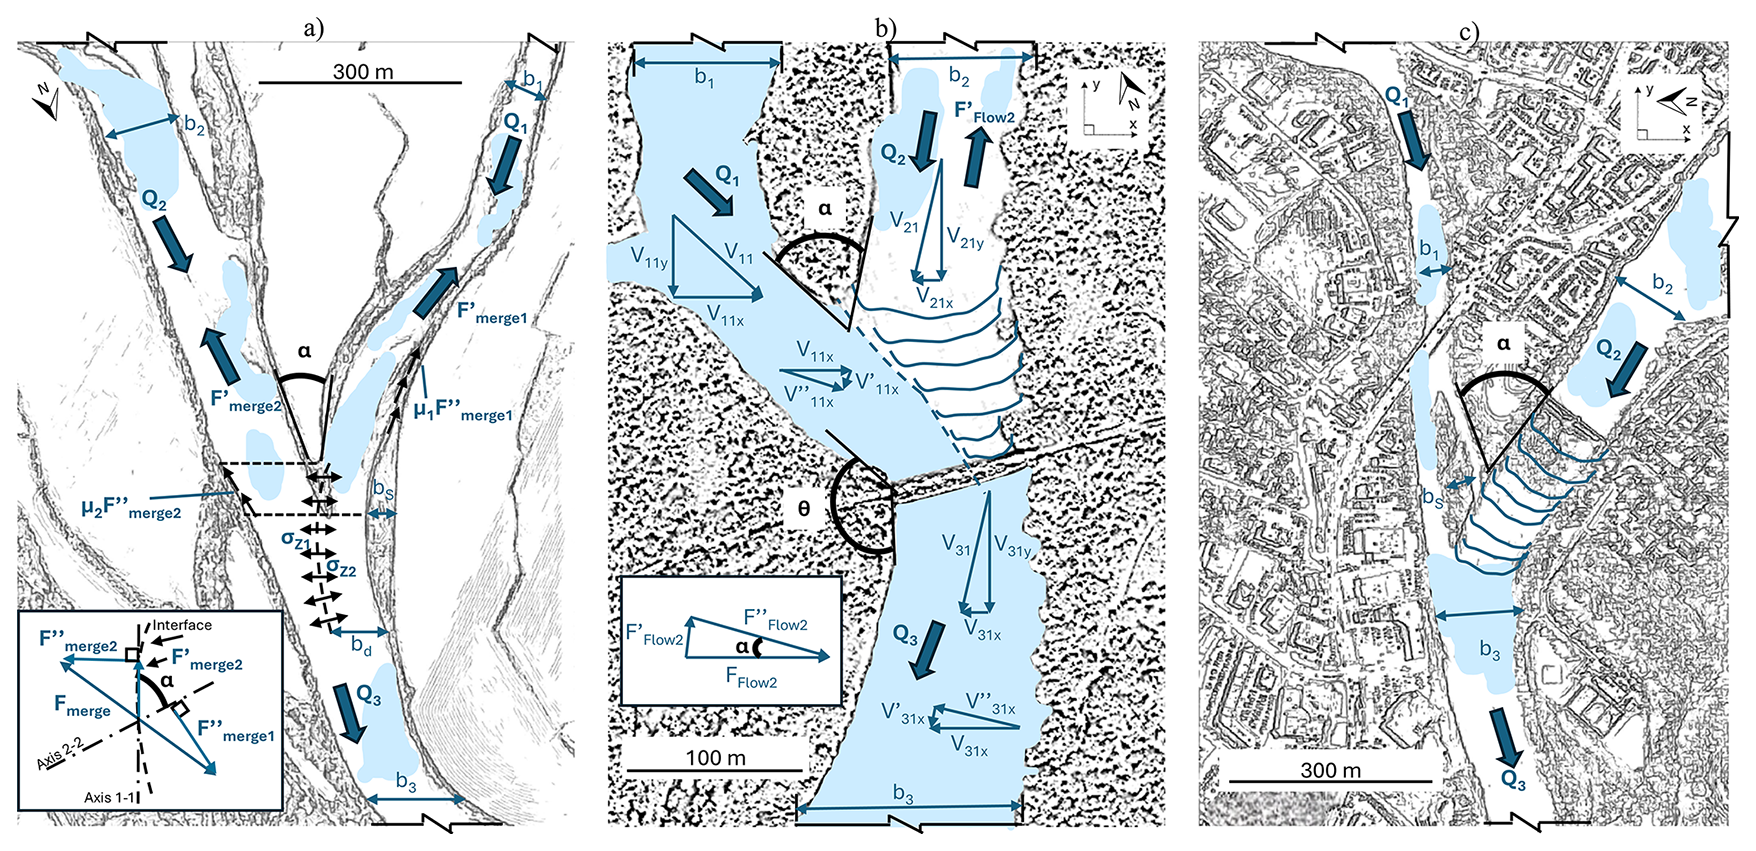
Figure 3Visual representation of the forces applied showing (a) a plan view of the ice jam due to merging ice runs at CH-BSV (process 3), (b) a plan view of the flow impact mechanism at STA-BDN (process 5) and (c) a plan view of the ice jam due to a confluence bar at CH-FA (process 6). The light blue in the background corresponds to ice free.
4.1 Merging ice runs (process 3)
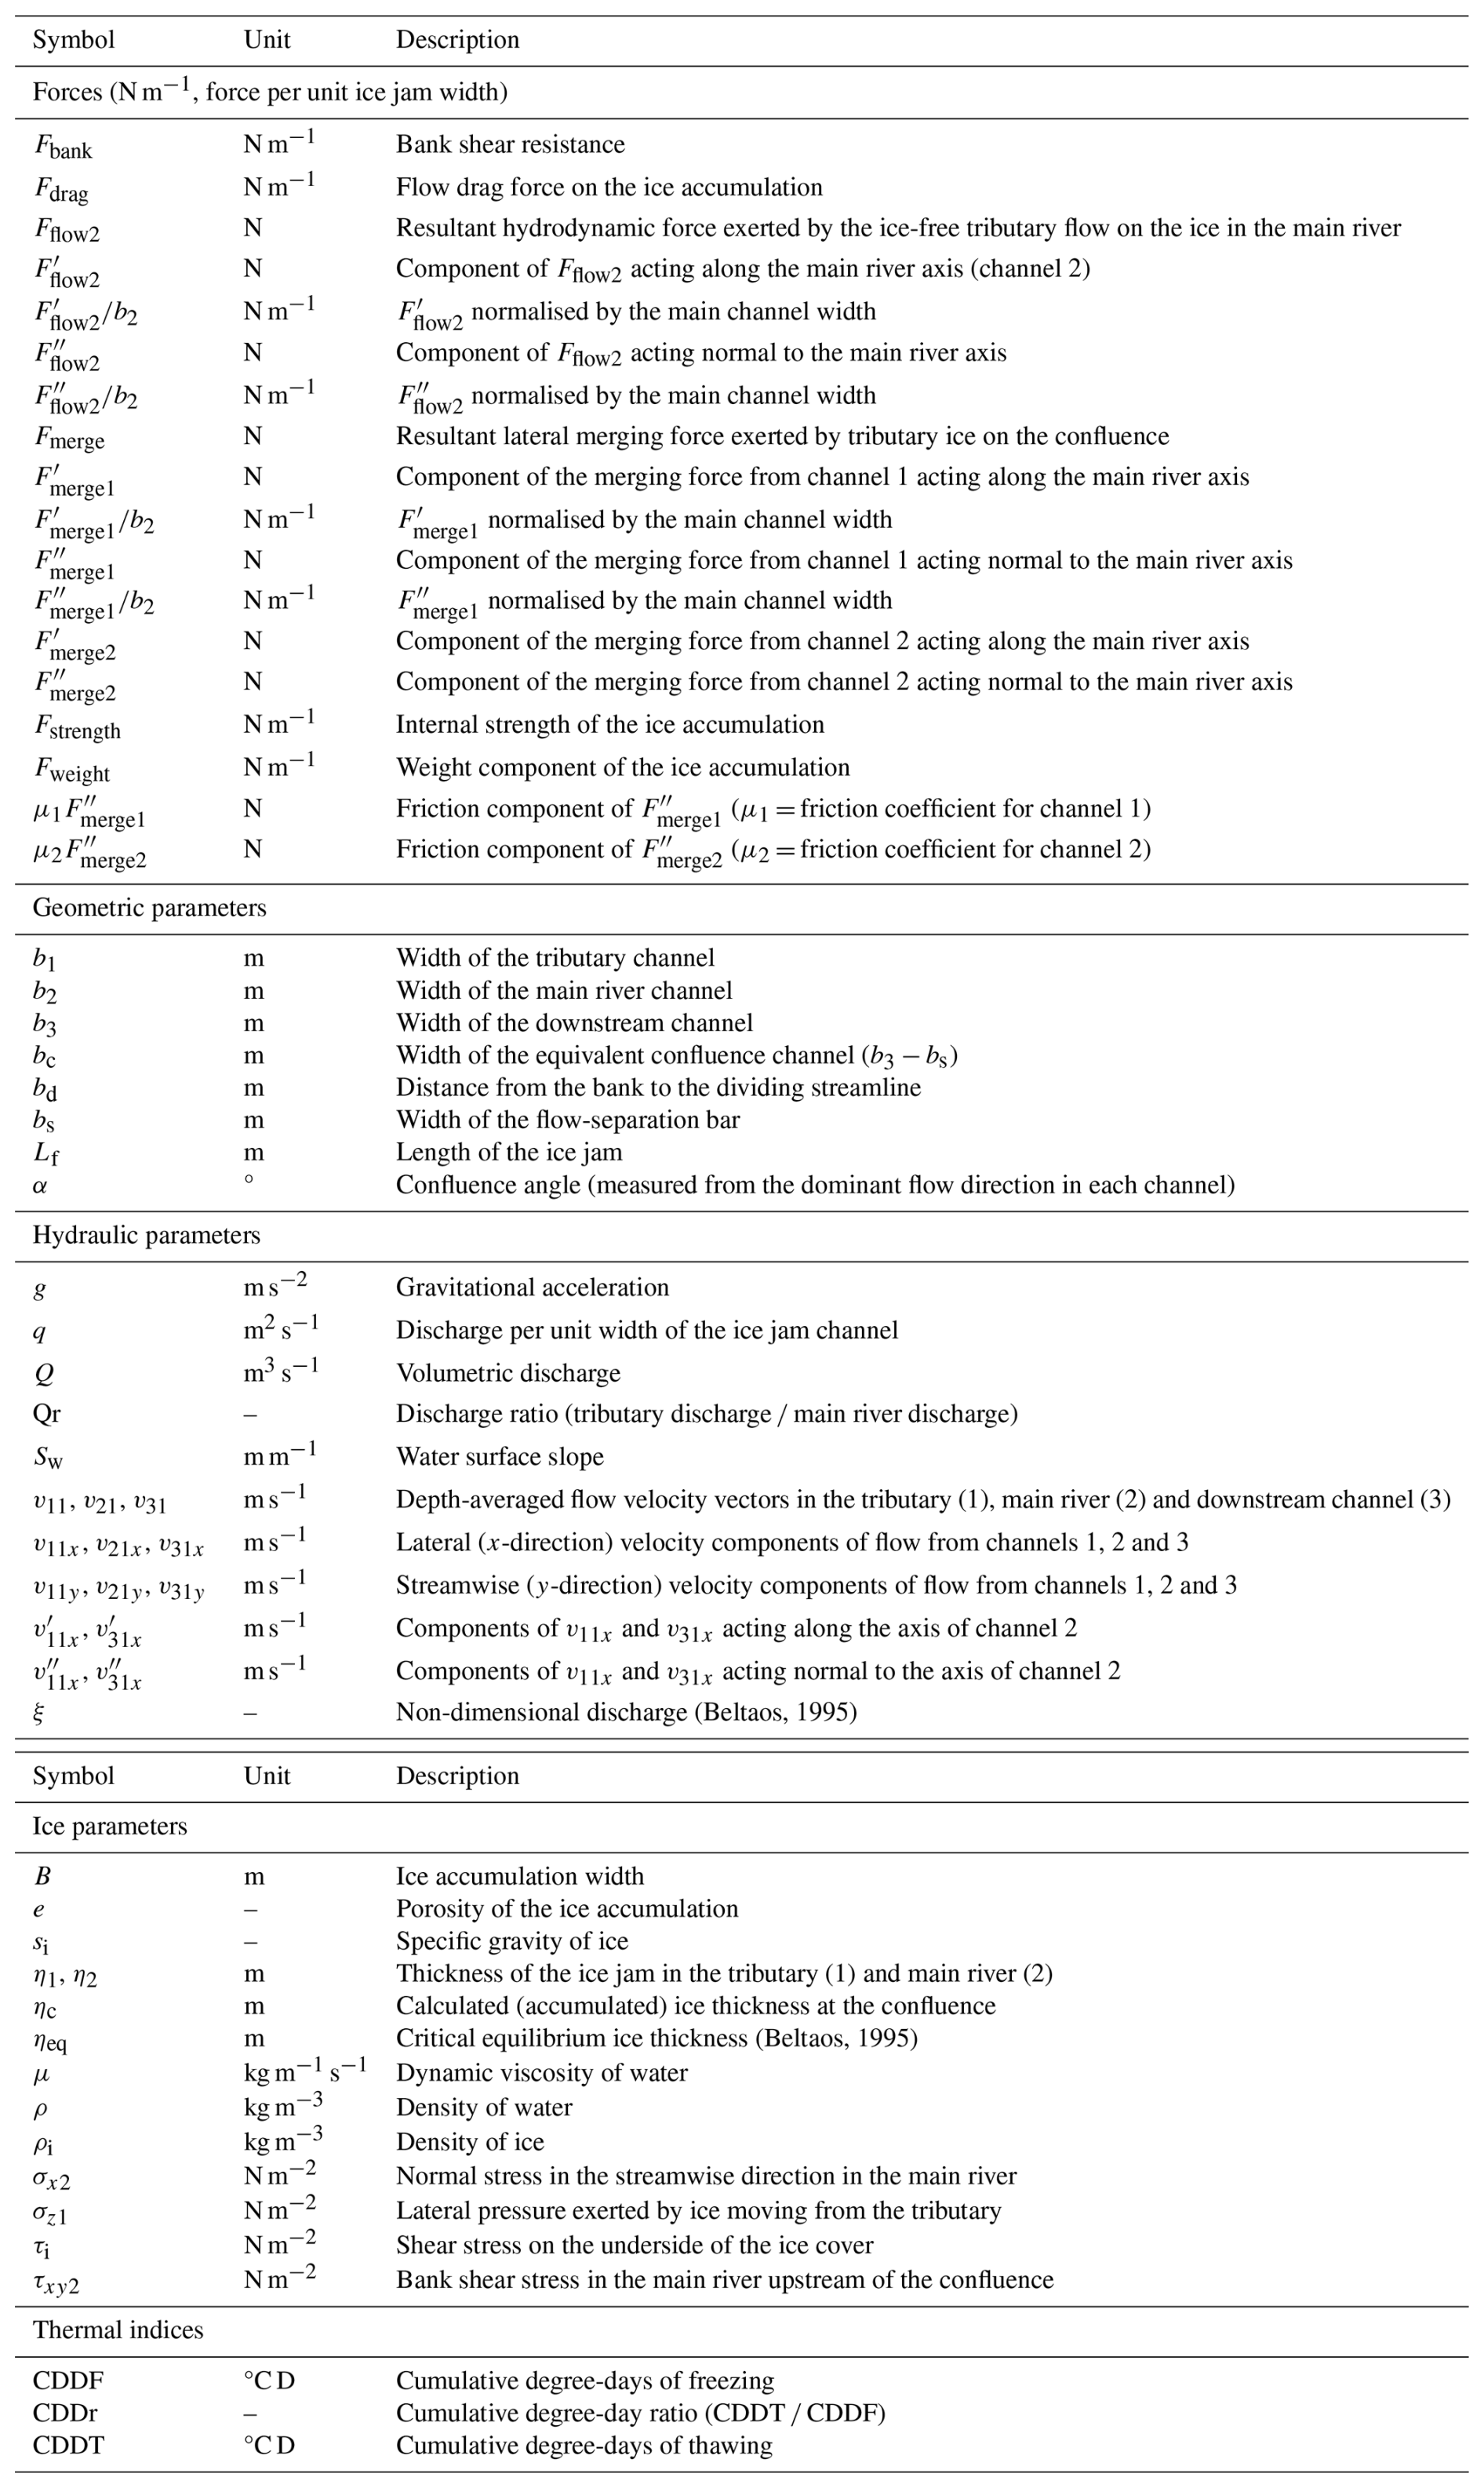
Ice jam formation resulting from merging ice runs is expressed by the force-balance Eq. (1) and considers six forces (expressed in N m−1, force normalized to the ice jam width): the flow drag force (Fdrag), the ice accumulation weight (Fweight), the ice accumulation strength (Fstrength), the bank shear resistance (Fbank), and the merging forces of the lateral pressure exerted by ice moving from the tributary multiplied by the contact area normal and parallel to the direction of flow in the main river axis ( and , respectively, where b2 is the width of the main channel). Ice jam formation occurs when the net force in Eq. (1) equals or falls below zero. Figure 3a shows a visual representation of the lateral pressure applied in Eq. (1).
Equation (1) can be expanded into Eq. (2) as follows:
with the normal stress in the streamwise direction σx [N m−2] with e referring to the porosity of ice [–] that can be obtained by Eq. (3):
where the indices i, 1 and 2 refer to the ice, the tributary and the main river, respectively, τi [N m−2] is the shear stress on the underside of the cover, ρ [kg m−3] is the density of water, ρi [kg m−3] is the density of ice, η [m] is the thickness of the ice run, x refers to the distance across the channel, si [–] is the specific gravity of ice, Lf [m] is the jam length, g [m s−2] is the gravitational acceleration, Sw [m m−1] is the slope of water surface, τxy [N m−2] is the shear stress at the bank, σz [N m−2] is the lateral pressure exerted by the ice moving from the corresponding channel, bd [m] is the distance to the dividing streamline, b [m] is the width of the channel, μ [–] is the dynamic fluid viscosity of water, bs [m] is the width of the flow separation bar and finally α [°] is the angle between the channels at the confluence measured from the dominant flow direction from each channel.
4.2 Flow impact (process 5)
This mechanism occurs when the ice-free flow from the tributary exerts enough force to push ice into the main river, where it accumulates and blocks the flow, leading to jam formation. This process is expressed by the force-balance Eq. (4) and considers six forces (expressed in N m−1, force normalized to the ice jam width) with the same first forces from Eq. (1) which are: the flow drag force (Fdrag), the ice accumulation weight (Fweight), the ice accumulation strength (Fstrength) and the bank shear resistance (Fbank), with the hydrodynamic reaction forces acting along and normal to the main river axis ( and , respectively, where b2 is the width of the main channel), which stabilize the jam. Ice jam formation occurs when the net force summation in Eq. (4) equals or falls below zero.
Equation (4) can be expanded into Eq. (5) as follows:
where the index 3 refers to the reach downstream of the confluence, Q [m3 s−1] is the flow, v11x and v31x [m s−1] are the lateral velocity components of flow from channel 1 and 3 through the confluence control volume, and [m s−1] are the component of v11x and v31x acting along the axis of channel 2, and finally and [m s−1] are the component of v11x and v31x acting normal to the axis of channel 2. These forces are represented graphically on Fig. 3b.
4.3 Confluence bars (process 6)
The ice jam occurs when the accumulated ice thickness (ηc [m]) equals or less than the critical equilibrium ice thickness (ηeq [m]) proposed by Beltaos (1995) in straight channels as presented by Eq. (6). The width of the equivalent channel (bc [m]) is also equal to the width of the downstream channel (b3 [m]) minus the width of bars (bs [m]).
To estimate the equilibrium jam thickness from the Beltaos (1995) relationship, it is necessary to calculate the non-dimensional discharge (ξ) of Eq. (7)
where q is the discharge per unit width of the ice jam channel [m2 s−1] and B is the accumulation width [m]. Visual presentation of the parameters is shown on Fig. 3c.
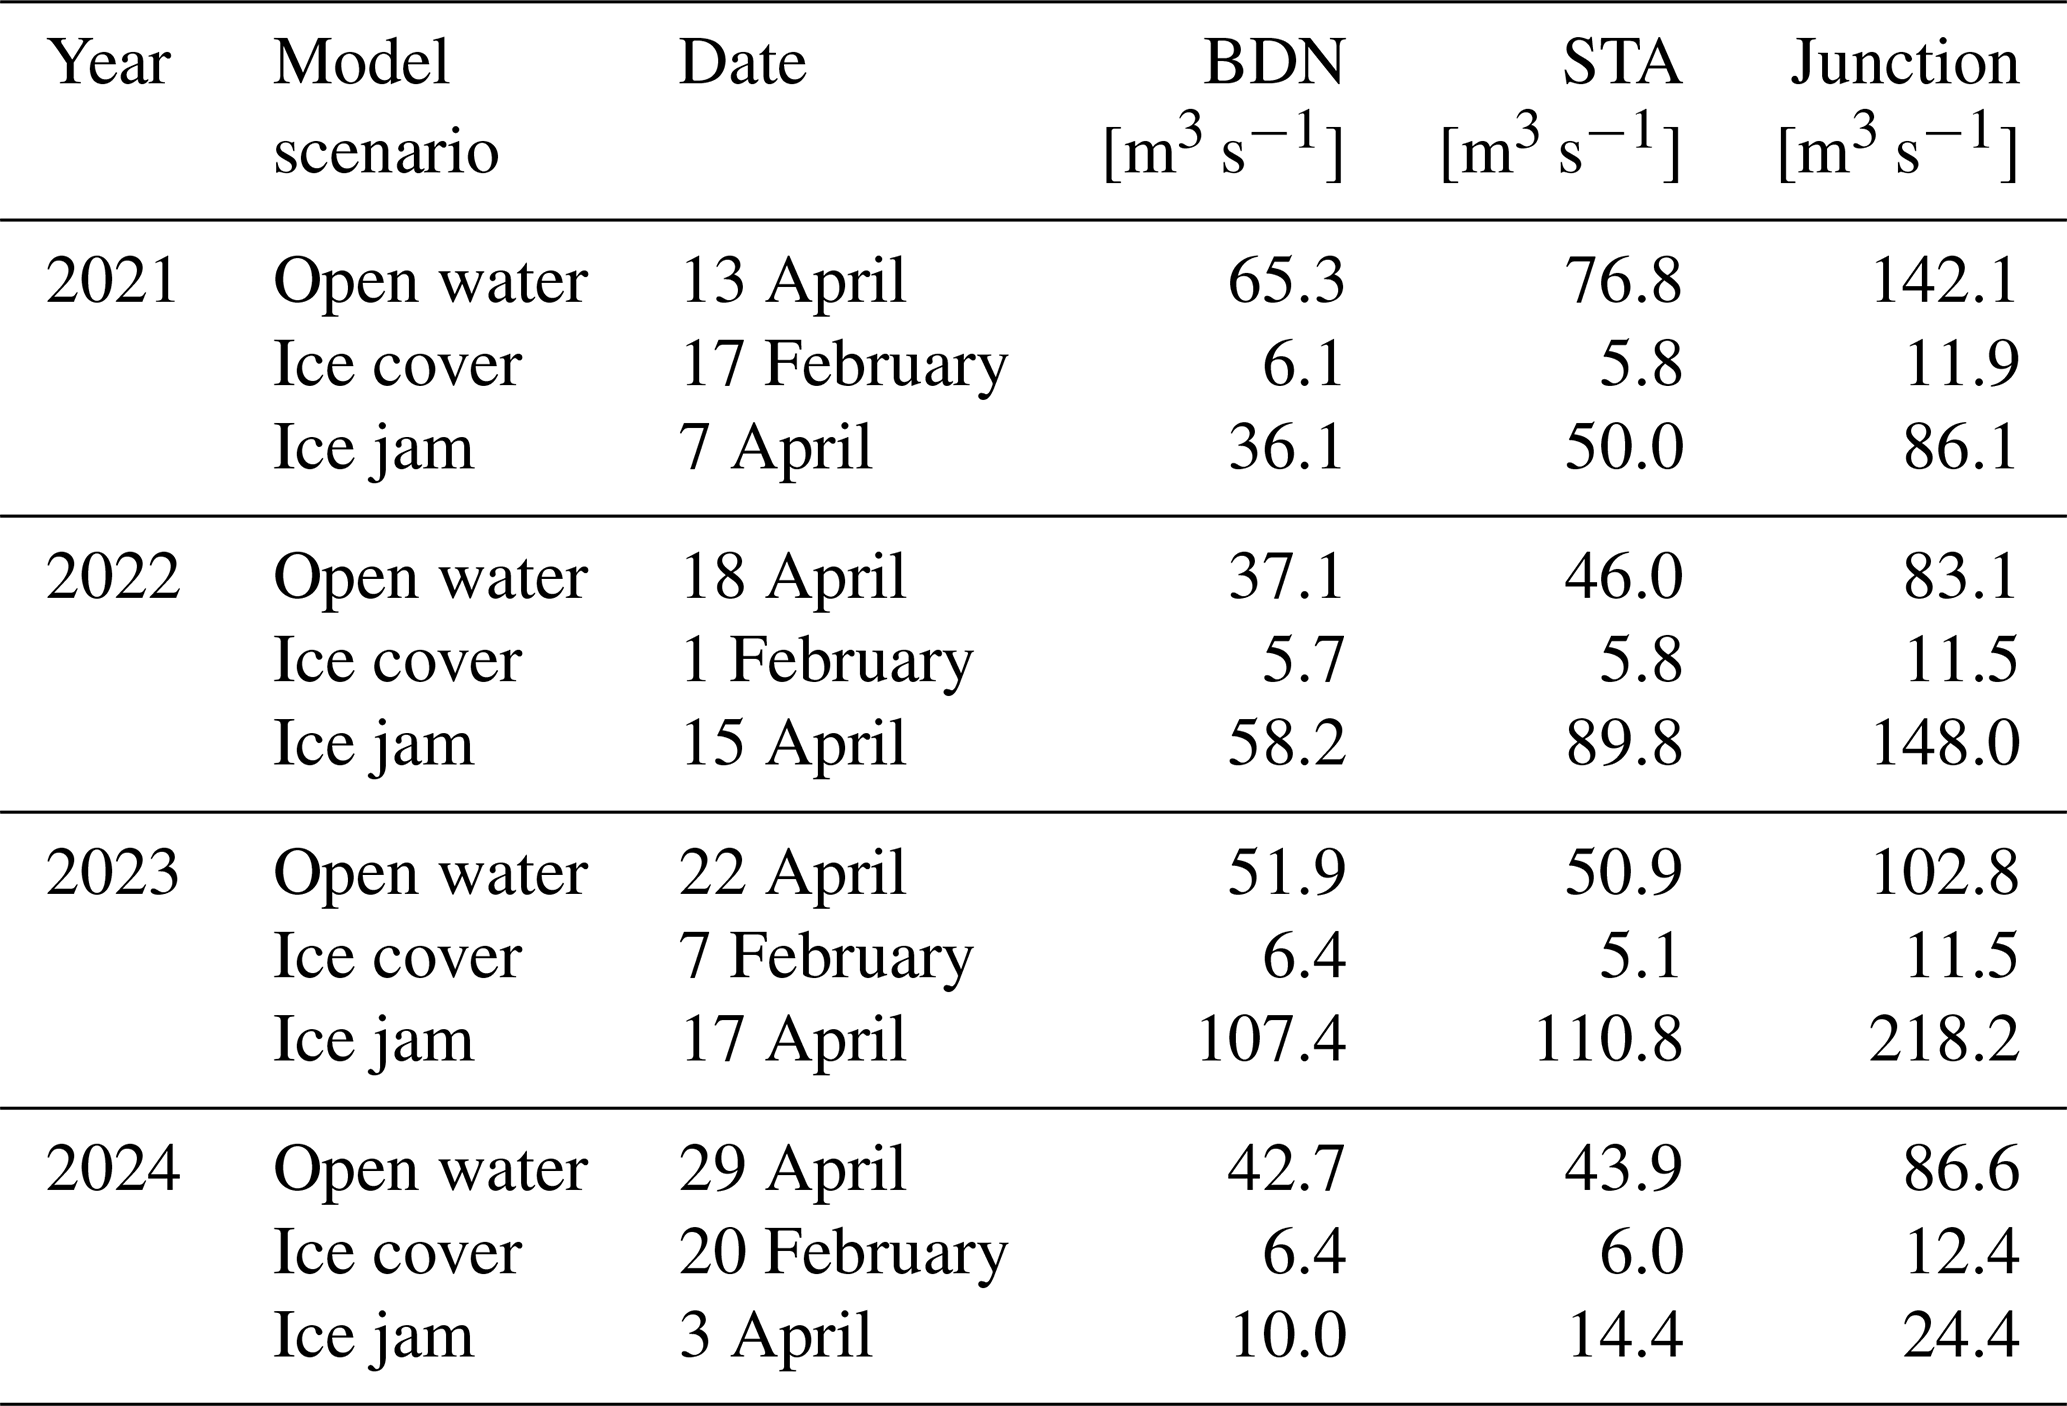
To validate the equations developed by Ettema and Muste (2001), it is essential to estimate the hydraulic parameters which were not measured in the field such as flow velocity and shear stresses during ice jam formation events. For this purpose, a steady state one-dimensional hydraulic network model was developed for the STA-BDN confluence using HEC-RAS 6.4.1 (US Army Corps of Engineers, 2025) to simulate flow and ice conditions across the study period. Three scenarios were simulated for each season (12 simulations in total): (1) an open water scenario to calibrate channel bed roughness coefficients, (2) an ice cover scenario to calibrate under-ice roughness parameters for stable ice cover conditions, and (3) an ice jam scenario which incorporated the calibrated bed and ice cover roughness coefficients to calibrate ice jam roughness to match the observed water levels. Ice jam length was estimated from field observations. The default HEC-RAS values for the ice jam strength parameters (i.e. K1 = 0.33, ϕ = 45°, e = 0.4) and critical toe velocity (Vmax = 1.524 m s−1) were used in these simulations (after Beltaos and Tang, 2013). Upstream boundary conditions were based on measured discharges on both rivers upstream of the confluence for each respective year, with downstream boundaries established to critical depth at the Chute-Panet Dam, which is a free overflow spillway structure. Table 3 summarizes discharge input data for each scenario at STA-BDN.
Table 3Discharge data for all model simulations of the studied years of STA-BDN.
The model geometry was based on river bathymetry surveys conducted by the Université Laval research team in 2015. The STA reach extended 11.7 km from the Chute-Panet Dam (3 km downstream of the confluence) to Rang du Nord stream (8.7 km upstream of the confluence). On the STA reach upstream of the confluence, the model incorporated 162 cross-sections, two bridges and one ice control structure. The downstream model section on the STA encompassed 48 cross-sections and one bridge. The BDN reach spanned 4.9 km from the confluence to Mendoza Drolet Street, including 98 cross-sections and one bridge. Attempts to model CH-BSV were constrained by data limitations due to insufficient bathymetric data for the BSV tributary which prevented the development of a reliable hydraulic model for this confluence, limiting the analysis of the predictive equation. The processes observed in the CH-DL and CH-FA confluences did not require the development of a hydraulic model.
The results are presented for STA-BDN first, as it is the only confluence studied on the Sainte-Anne River and the site for which the most complete quantitative comparison with the laboratory-derived equations was achievable. The three Chaudière River confluences are then presented in order from upstream to downstream along the river: CH-DL (km 103.4), CH-FA (km 97.5), and CH-BSV (km 75.3).
6.1 Bras-du-Nord and Sainte-Anne confluence
The ice breakup dynamics at STA-BDN were analysed over four winters. In all four years, the ice cleared in the BDN tributary before the STA. The tributary's water and ice flow constricted the passage of ice on the STA resulting in the formation of ice jams in the main river. This can be categorized as a flow impact process based on Ettema and Muste (2001). The same processes and sequence were consistently observed despite the variations in breakup timing, meteorological drivers and discharge magnitudes (Sect. S1 in the Supplement).
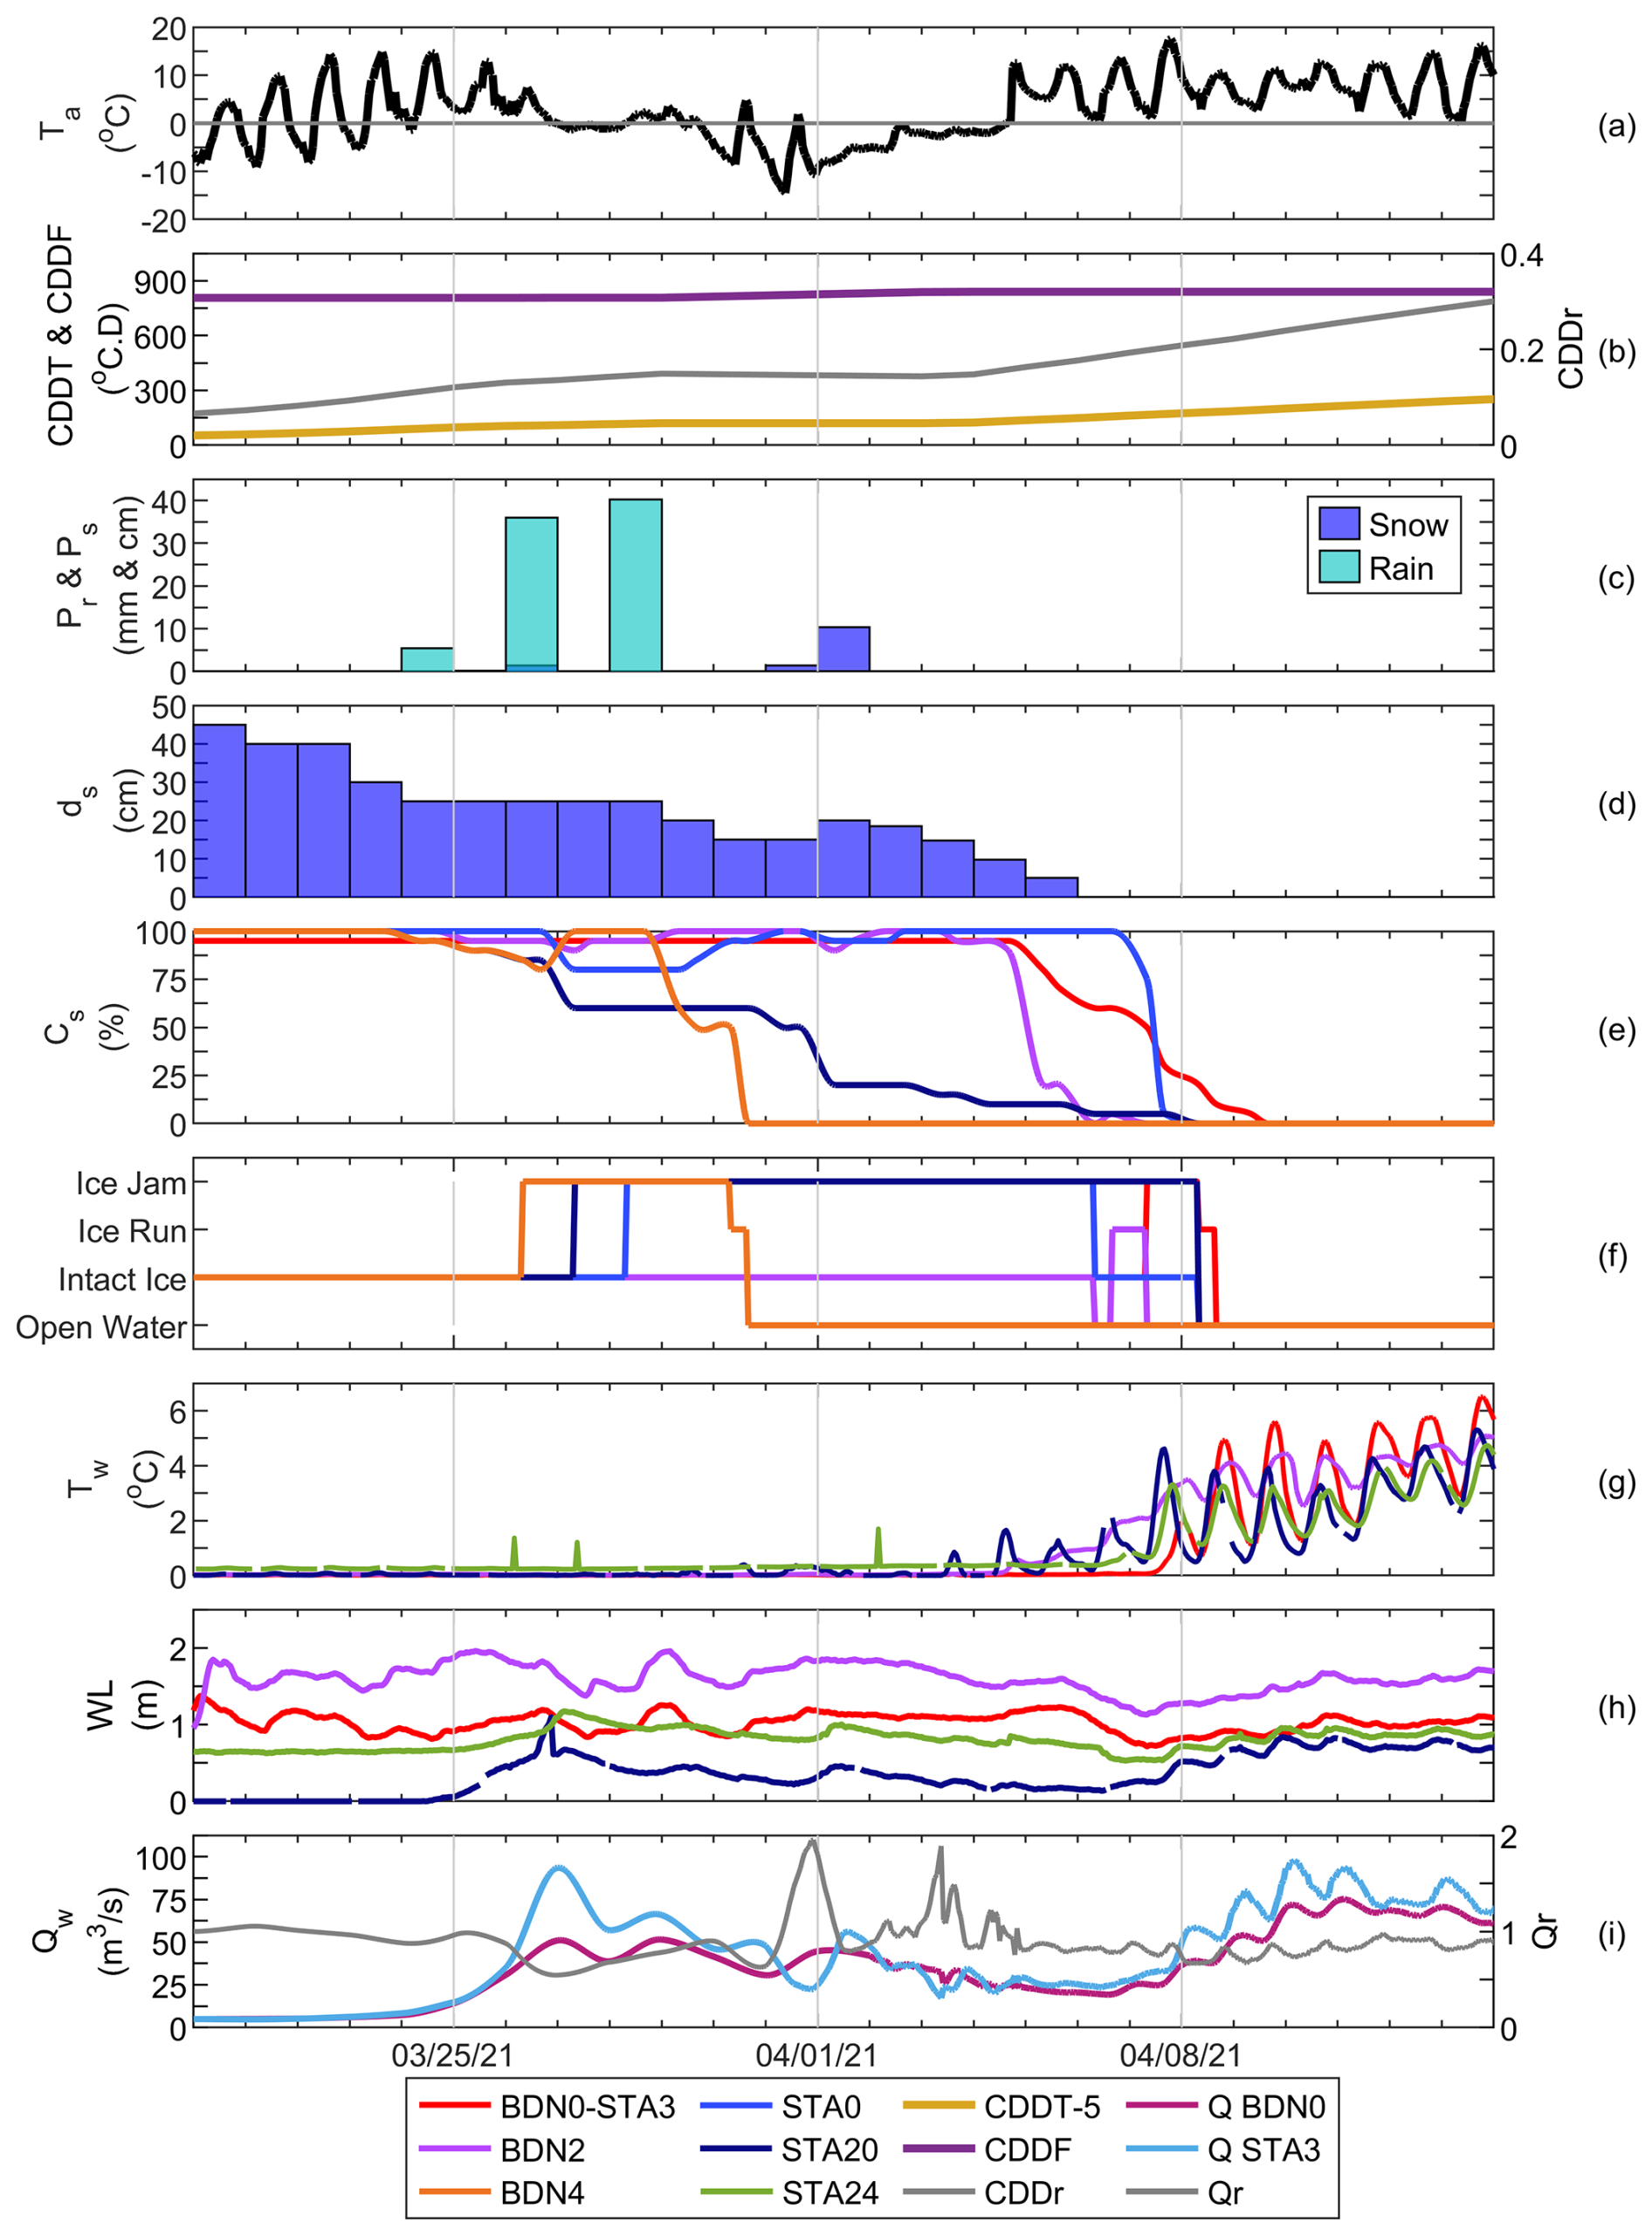
Figure 4Time series of hydrometeorological conditions during the 2021 breakup at STA-BDN (20 March to 14 April 2021) showing (a) air temperature, (b) CDDT, CDDF and CDDr, (c) daily precipitation, (d) snow on ground, (e) surface ice concentration, (f) ice states, (g) water temperature, (h) water level above the pressure probe and (i) discharge and Qr.
The results of the meteorological, hydraulic and ice conditions for the 2021 breakup are represented in Fig. 4 and discussed here as an example of the field data analysed during each breakup. A detailed summary of the other three breakups is available in Sect. S1. During the 2021 breakup period, the air temperatures started to rise steadily until reaching an average positive temperature on 22 March and remained positive except from 30 March to 4 April when the air temperatures dropped below freezing, reaching −15 °C on 31 March (Fig. 4a). Two rain events on 24 and 26 March totalling 40 mm (Fig. 4c) resulted in a peak discharge on 27 March of 93.1 m3 s−1 in the STA and 51.1 m3 s−1 in the BDN, for a Qr of 0.55 (Fig. 4i). On this day, the CDDT reached 109.5 °C D while the CDDF reached 807.4 °C D, resulting in a CDDr of 0.14 (Fig. 4b).
The breakup occurred from upstream to downstream in both the STA and BDN rivers (Fig. 4e). Consequently, three ice jams formed (Fig. 4f). Firstly, an ice jam formed at the upstream site in the tributary (BDN4) on 26 March and released on 30 March. A second ice jam formed upstream in the main river (STA20) on 27 March and stayed in place until 8 April (Fig. 4f). By this date, the CDDT had accumulated 174.6 °C D and the CDDr was 0.21 (Fig. 4b). The formation of this ice jam is also clearly visible in the 0.5 m spike in the water level (Fig. 4h). The third ice jam formed downstream of the confluence at the Chute-Panet Dam (STA0) on 28 March and released on 6 April. The water temperatures started rising at the most upstream sites on the STA (STA24 and STA20) from 3 April (Fig. 4g). The downstream site in the tributary (BDN2), located in the meander, was open on 6 April, the same day the snow on the ground completely melted (Fig. 4d, e). A few ice runs on 7 April led to the formation of a fourth ice jam at the confluence (BDN0-STA3), while the main river remained ice covered. On 7 April the discharge increased again, likely in response to snowmelt within the watershed, and reached 32.2 m3 s−1 in the STA and 25.1 m3 s−1 in the BDN for a Qr of 0.78 (Fig. 4i). On 8 April, the ice jam at the confluence was released. The confluence was the last site to become ice free.
6.2 Du Loup and Chaudière confluence
The ice breakup dynamics at CH-DL were analysed over four winters. In general, breakups at CH-DL occurred from upstream to downstream. The breakup tended to begin in the CH, where ice accumulates upstream of the confluence due to the stationary ice cover maintained by the Sartigan Dam, forming an ice jam. Ice on the tributary responds similarly, causing ice jams later in the season. The dam's stationary ice cover was therefore the primary cause of the ice jam formation at this site. The same processes and sequence were consistently observed in 2021, 2022, and 2024 despite variations in breakup timing, meteorological drivers, and discharge magnitudes (Sect. S2). The 2023 breakup, however, presented a contrasting thermally dominated scenario where gradual melting prevented significant ice accumulation against the dam's stationary ice cover, resulting in a relatively jam free breakup sequence (Fig. S5).
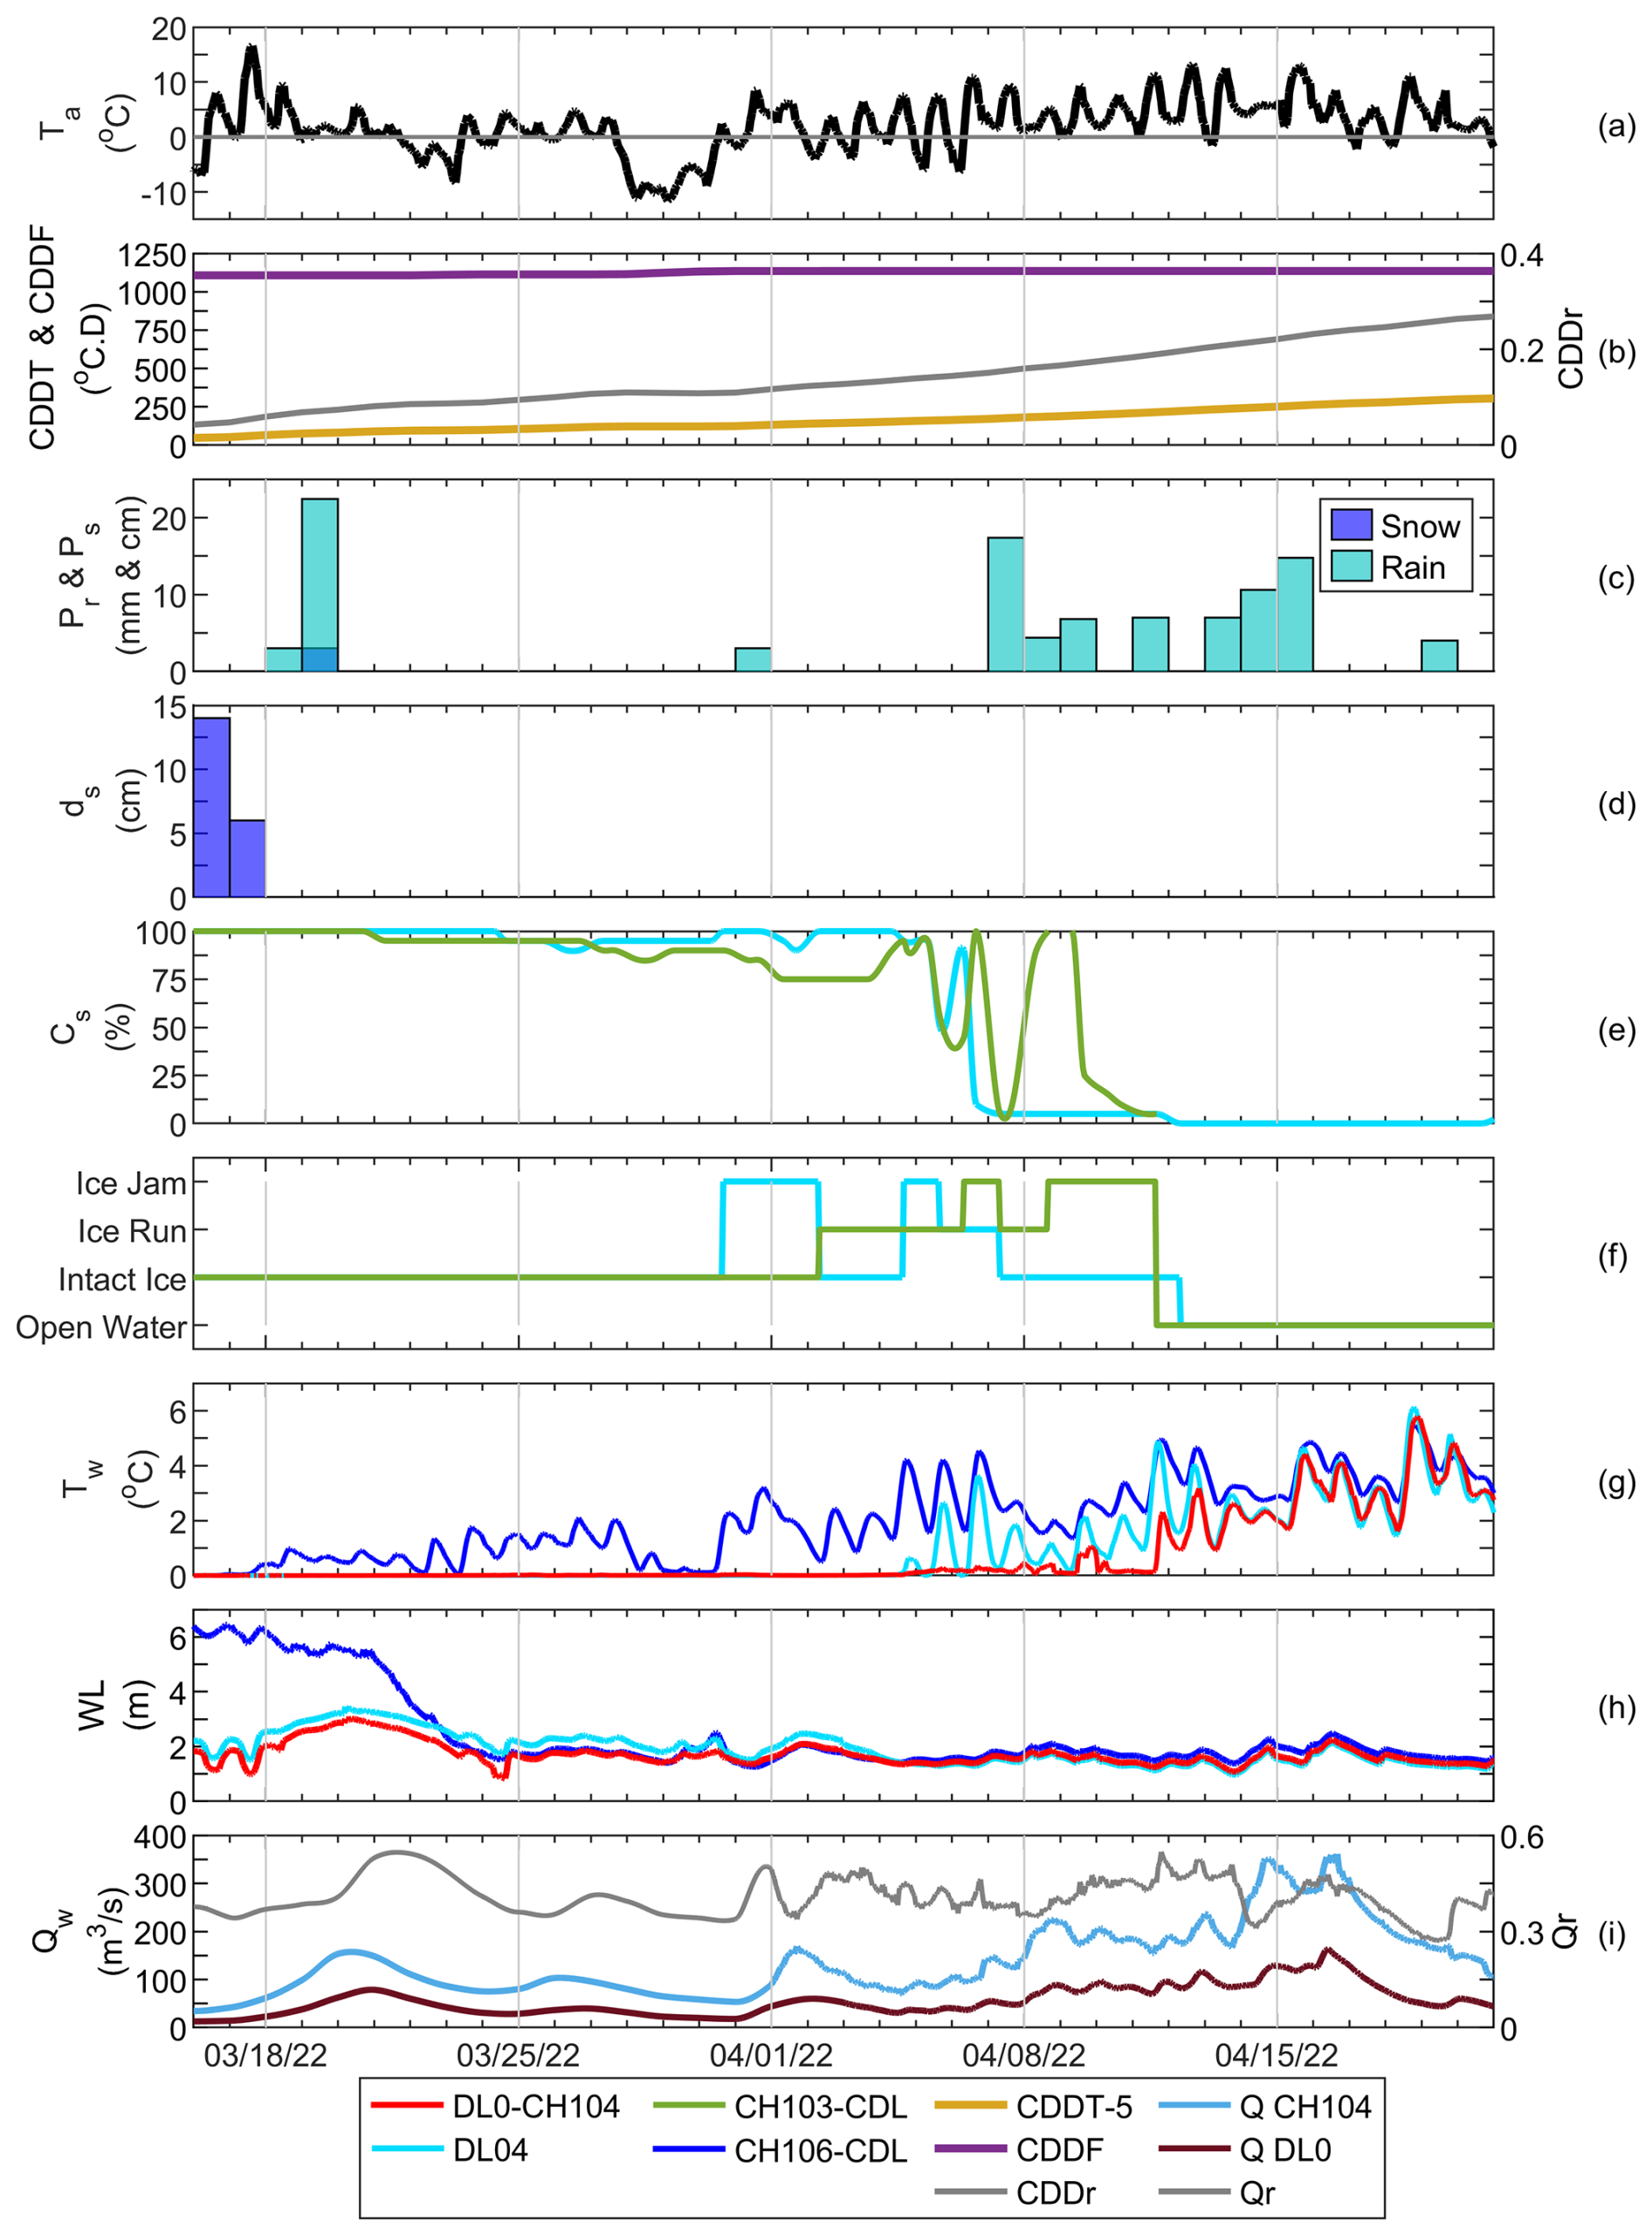
Figure 5Time series of hydrometeorological conditions during the 2022 breakup at CH-DL (16 March to 21 April 2022) showing (a) air temperature, (b) CDDT, CDDF and CDDr, (c) daily precipitation, (d) snow on ground, (e) surface ice concentration, (f) ice states, (g) water temperature, (h) water level above the pressure probe and (i) discharge and Qr.
The meteorological, hydraulic and ice conditions for the 2022 breakup are presented in Fig. 5 and discussed here as an example of the field data analysed during each breakup. The detailed summary of the other three breakups is available in Sect. S2. The breakup occurred in two stages. First, coinciding with complete snowmelt, a 25 mm rainfall event on 18 and 19 March rendered the site upstream of the confluence in the CH ice free (Fig. 5c, d). By this date, the CDDT had reached 76.0 °C D, while the CDDF reached 1107.0 °C D, resulting in a CDDr of 0.07 (Fig. 5b). Discharge in the CH was 81.2 m3 s−1, increasing to 157.4 m3 s−1 on 20 March (Fig. 5i). The water level at this site subsequently declined, dropping 3 m in 2 d following the opening of the Sartigan Dam gates on 21 March (Fig. 5h). The second stage of the breakup occurred in April at the site downstream of the confluence (CH103-CDL), which lost most of its ice cover on 7 April (Fig. 5e). The tributary had begun its breakup the previous day, on 6 April. By this date, the CDDT had reached 164 °C D and the CDDr was 0.14 (Fig. 5b). Discharges began to rise gradually from this date, initially at 96.4 m3 s−1 in the CH and 39.5 m3 s−1 in the DL, yielding a Qr of 0.41 (Fig. 5i). Subsequently, given the increases in water temperatures at the confluence (DL0-CH104) from 11 April, it was inferred that this site was in open water by that time (Fig. 5g).
It was inferred that an ice jam formed upstream of the confluence from 28 to 30 March, given the sudden drop in water temperature at the site upstream of the confluence on the CH (CH106-CDL) from 28 to 30 March, followed by a 1 m drop in water level. This ice jam likely formed after ice accumulated on the stationary ice cover directly upstream of the Sartigan Dam (Fig. 5g, h). An ice jam also formed at the mouth of the tributary (DL04) and at the confluence (DL0-CH104) shortly thereafter, as observed during a drone flight from 31 March to 2 April. A second ice jam formed and released at this site on the night of 4 to 5 April. Despite the dam, these ice runs releases formed ice jams downstream of the dam (CH103-CDL) from 6 to 7 April and again from 8 to 11 April. The mouth of the tributary was the last site to become completely ice free on 12 April. Following a sequence of rainfall from 7 to 16 April, maximum seasonal discharges were reached on 16 April, at 351.0 m3 s−1 in the CH and 163.6 m3 s−1 in the DL, yielding a Qr of 0.47 (Fig. 5c, i).
6.3 Famine and Chaudière confluence
The ice breakup dynamics at CH-FA were analysed over four winters. Across all study years, ice jam formation at this confluence is consistently driven by three key morphological constraints: multiple islands within the confluence zone obstructing ice movement, highway-bridge 173 restricting ice passage and discharge in the tributary, and the inflatable dam structure in the main river influencing discharge and ice evacuation downstream. These controls create predictable jam formation locations, particularly at the tributary mouth (FA02) where bridge restrictions and accumulation banks consistently trap ice. The severity and duration of jams depend on discharge required to overcome these physical restrictions, while breakup timing varies (Sect. S3). The results of the meteorological, hydraulic and ice conditions for the 2023 breakup are represented in Fig. 6 and discussed here as an example of the field data analysed during each breakup. The detailed synopsis of the other three breakups is available in Sect. S3.
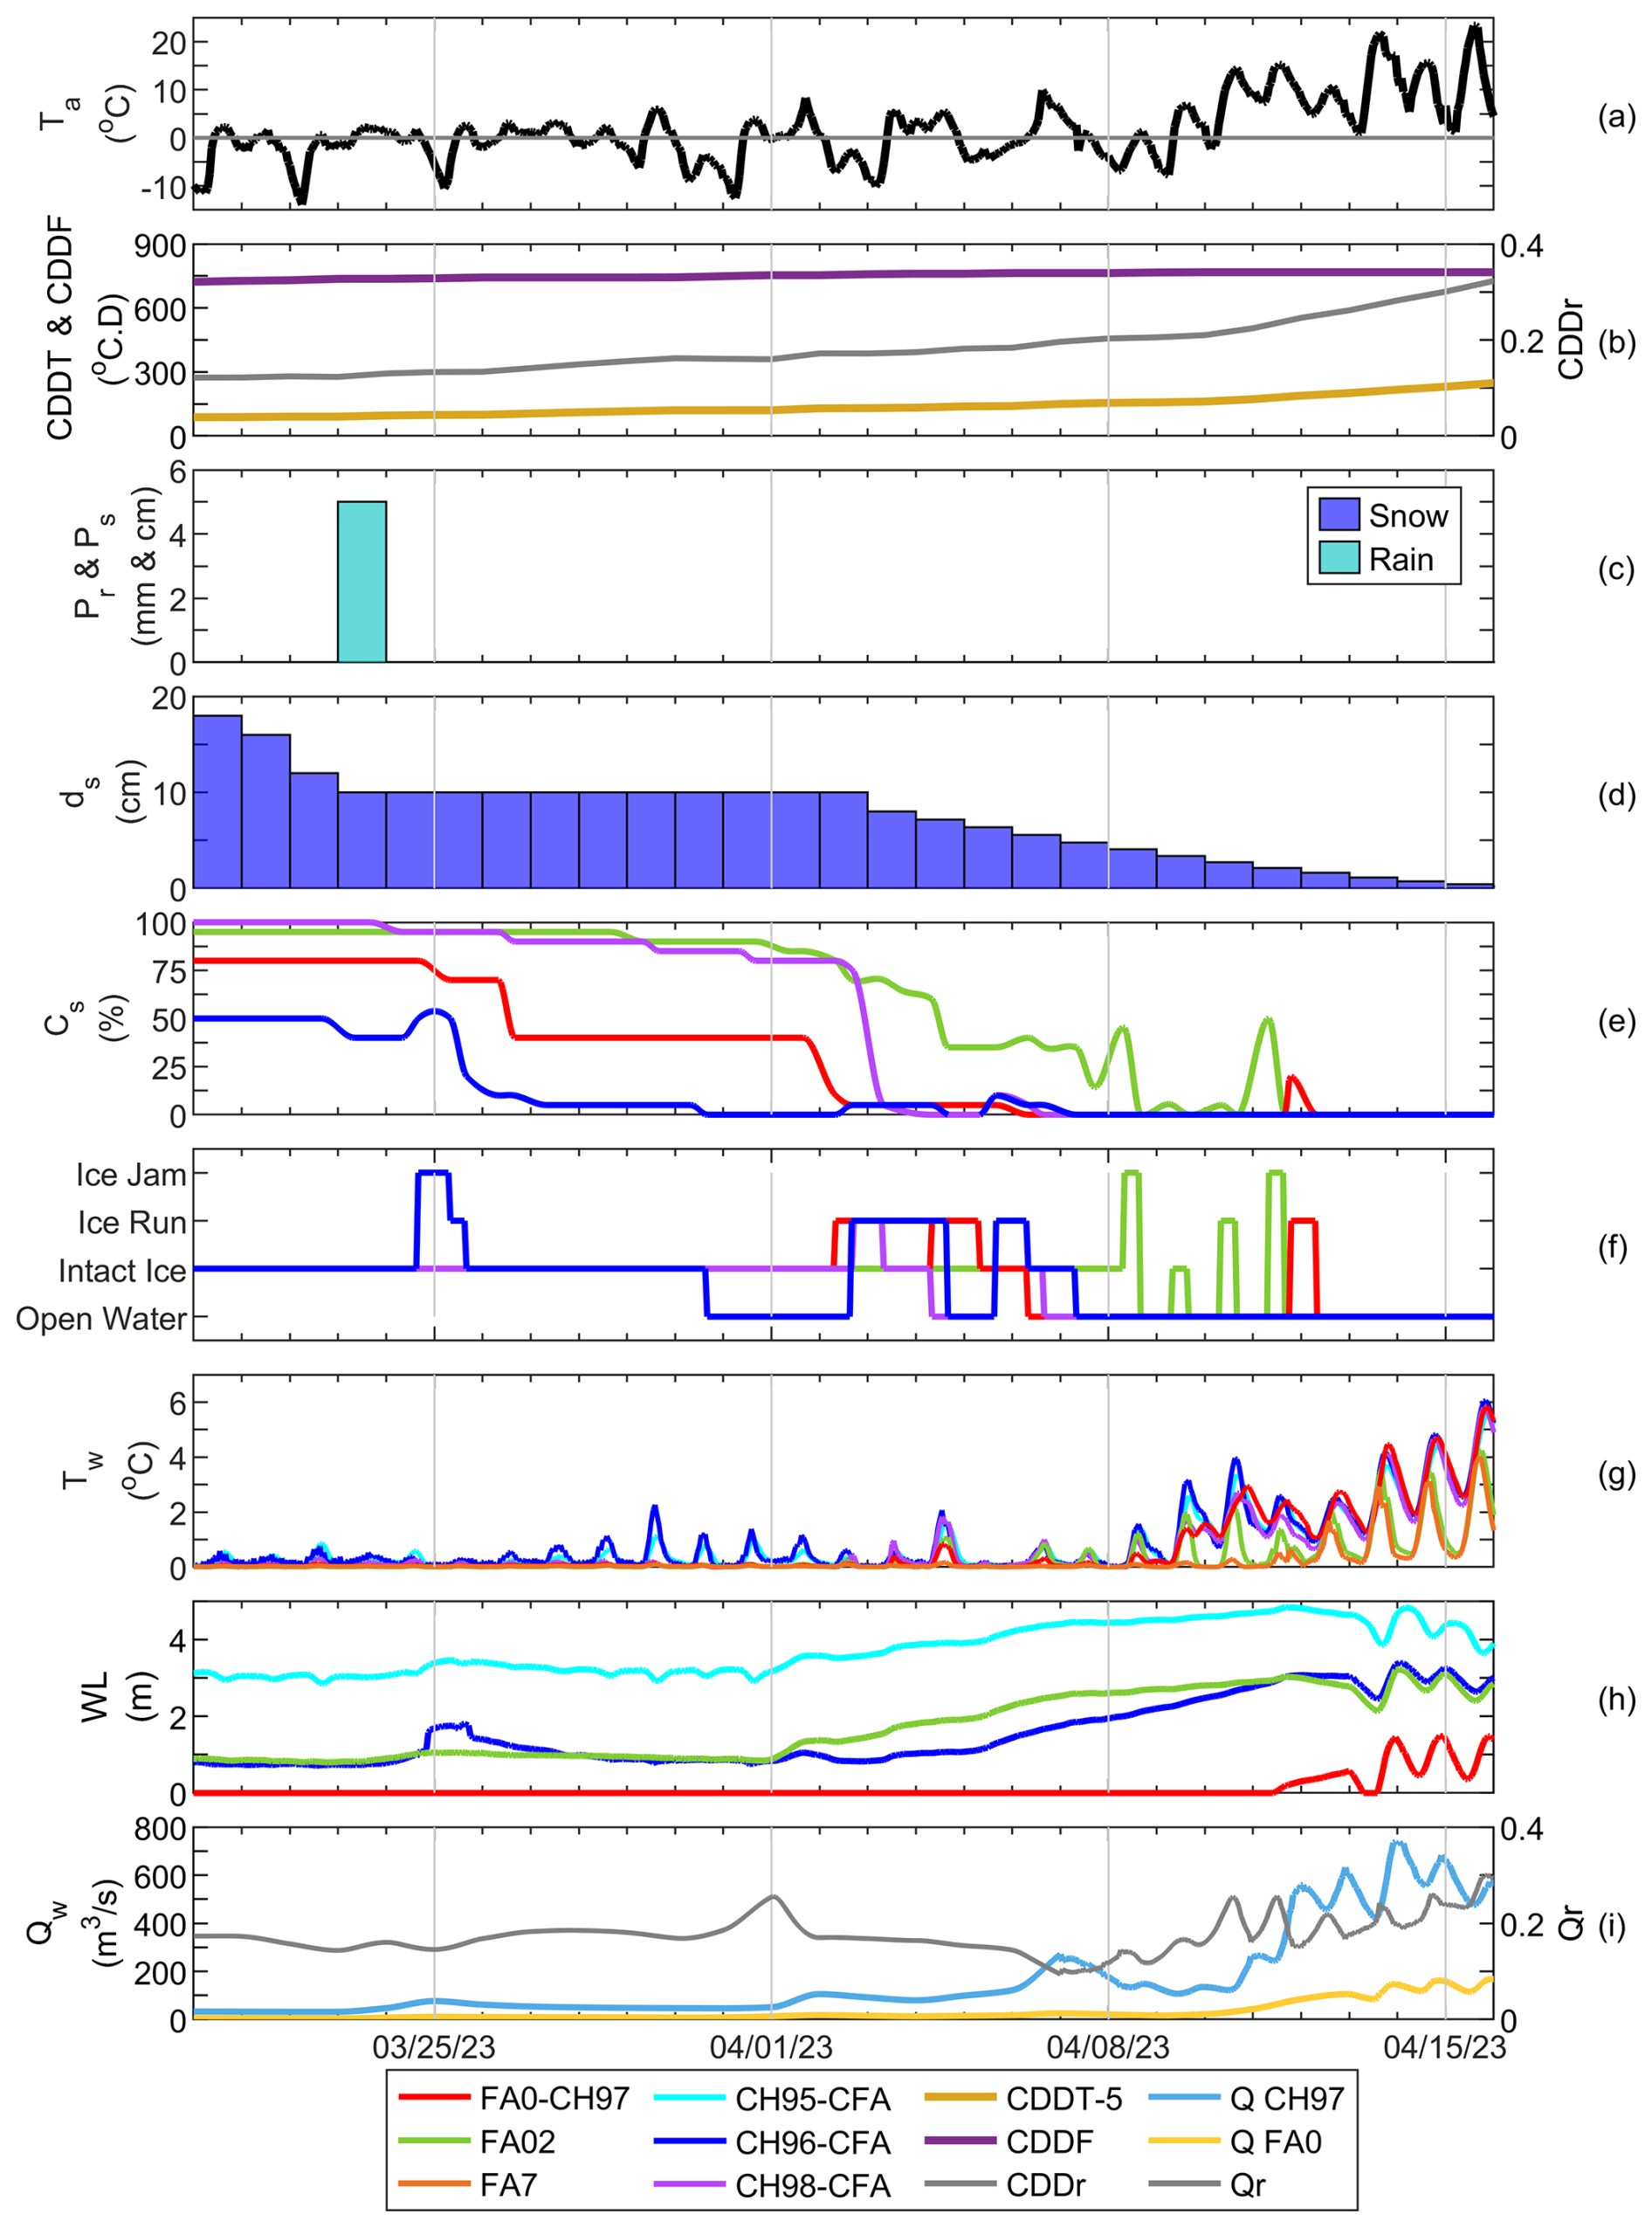
Figure 6Time series of hydrometeorological conditions during the 2023 breakup at CH-FA (20 March to 16 April 2023) showing (a) air temperature, (b) CDDT, CDDF and CDDr, (c) daily precipitation, (d) snow on ground, (e) surface ice concentration, (f) ice states, (g) water temperature, (h) water level above the pressure probe and (i) discharge and Qr.
The 2023 breakup at CH-FA occurred from downstream to upstream, first in the CH, then in the tributary. The site downstream of the confluence lost its ice cover first due to warmer water from the treatment plant, while morphological controls at the tributary mouth induced ice jam formation requiring high discharge to clear. In 2023, despite the onset of breakup in March, air temperatures did not become consistently positive until 9 April (Fig. 6a). Following 5 mm of rainfall on 23 March, discharge in the CH increased slightly to 75.0 m3 s−1 on 25 March (Fig. 6c, i). By 2 April, when most sites lost their ice cover, the CDDT had reached 129.6 °C D, while the CDDF reached 753.7 °C D, resulting in a CDDr of 0.17 (Fig. 6b). Discharge also began to increase from that day, starting at 105.4 m3 s−1 in the CH and 17.9 m3 s−1 in the FA, for a Qr of 0.17 (Fig. 6i).
An ice jam formed downstream of the confluence in the main river (CH96-CFA) during the night of 24 and 25 March following the rainfall event and was released the latter day. This blockage raised the water level by 1 m at this site (Fig. 6h). The water level at the site further downstream (CH95-CFA) also rose, suggesting the ice jam was spreading. The ice cover downstream of the confluence was released first, probably because it was affected by hot water discharges from the Saint-Georges wastewater treatment plant located approximately 1 km upstream (Fig. 6f). The effect of the water treatment plant is also visible in warmer water temperature peaks downstream of the confluence (CH95-CFA and CH96-CFA) throughout the breakup (Fig. 6g). The confluence itself (FA0-CH97) did not experience any ice jams but allowed ice runs to pass through on 2 and 3 April from the upstream CH site (CH98-CFA). These ice runs then spread to the downstream confluence site (CH96-CFA) from 2 to 4 April. A second sequence of ice runs spread from the confluence (FA0-CH97) from 4 to 5 April, continuing downstream (CH96-CFA) from 5 to 6 April. The confluence became ice free first on 6 April, followed by the upstream CH site (CH98-CFA) on the same day and the downstream site (CH96-CFA) on 7 April. A short ice jam subsequently formed at the tributary mouth (FA02) on 8 April. Ice runs coming from upstream of the tributary on April 10 formed a second jam at this site on 11 April, which evacuated as ice runs into the confluence during the night of 11 and 12 April. The discharge required to clear this ice was 46.0 m3 s−1 in the FA due to bank accumulations and the restriction from the highway-bridge 173 (Fig. 6i). Maximum seasonal discharge was reached on 14 April, following complete snow melt, reaching 734.4 m3 s−1 in the CH and 154.3 m3 s−1 in the FA, for a Qr of 0.21 (Fig. 6d, i).
6.4 Bras Saint-Victor and Chaudière confluence
The ice breakup dynamics at CH-BSV were analysed over four winters. Breakup dynamics at CH-BSV were variable and controlled by the interplay between thermal and hydraulic processes. Two distinct breakup patterns were observed: hydraulically driven breakups (2021 and 2024) characterized by a rapid discharge increase and mechanical ice failure and thermally driven breakups (2022 and 2023) dominated by gradual melting. Ice jams at the confluence were triggered by cascading effects from upstream jam formation and release, creating sequential jams at the confluence as released ice becomes trapped at successive hydraulic restrictions. The sequence of breakup progression varies between years depending on dominant driving mechanisms (see the detailed summaries of breakups 2021 to 2023 in Sect. S4).
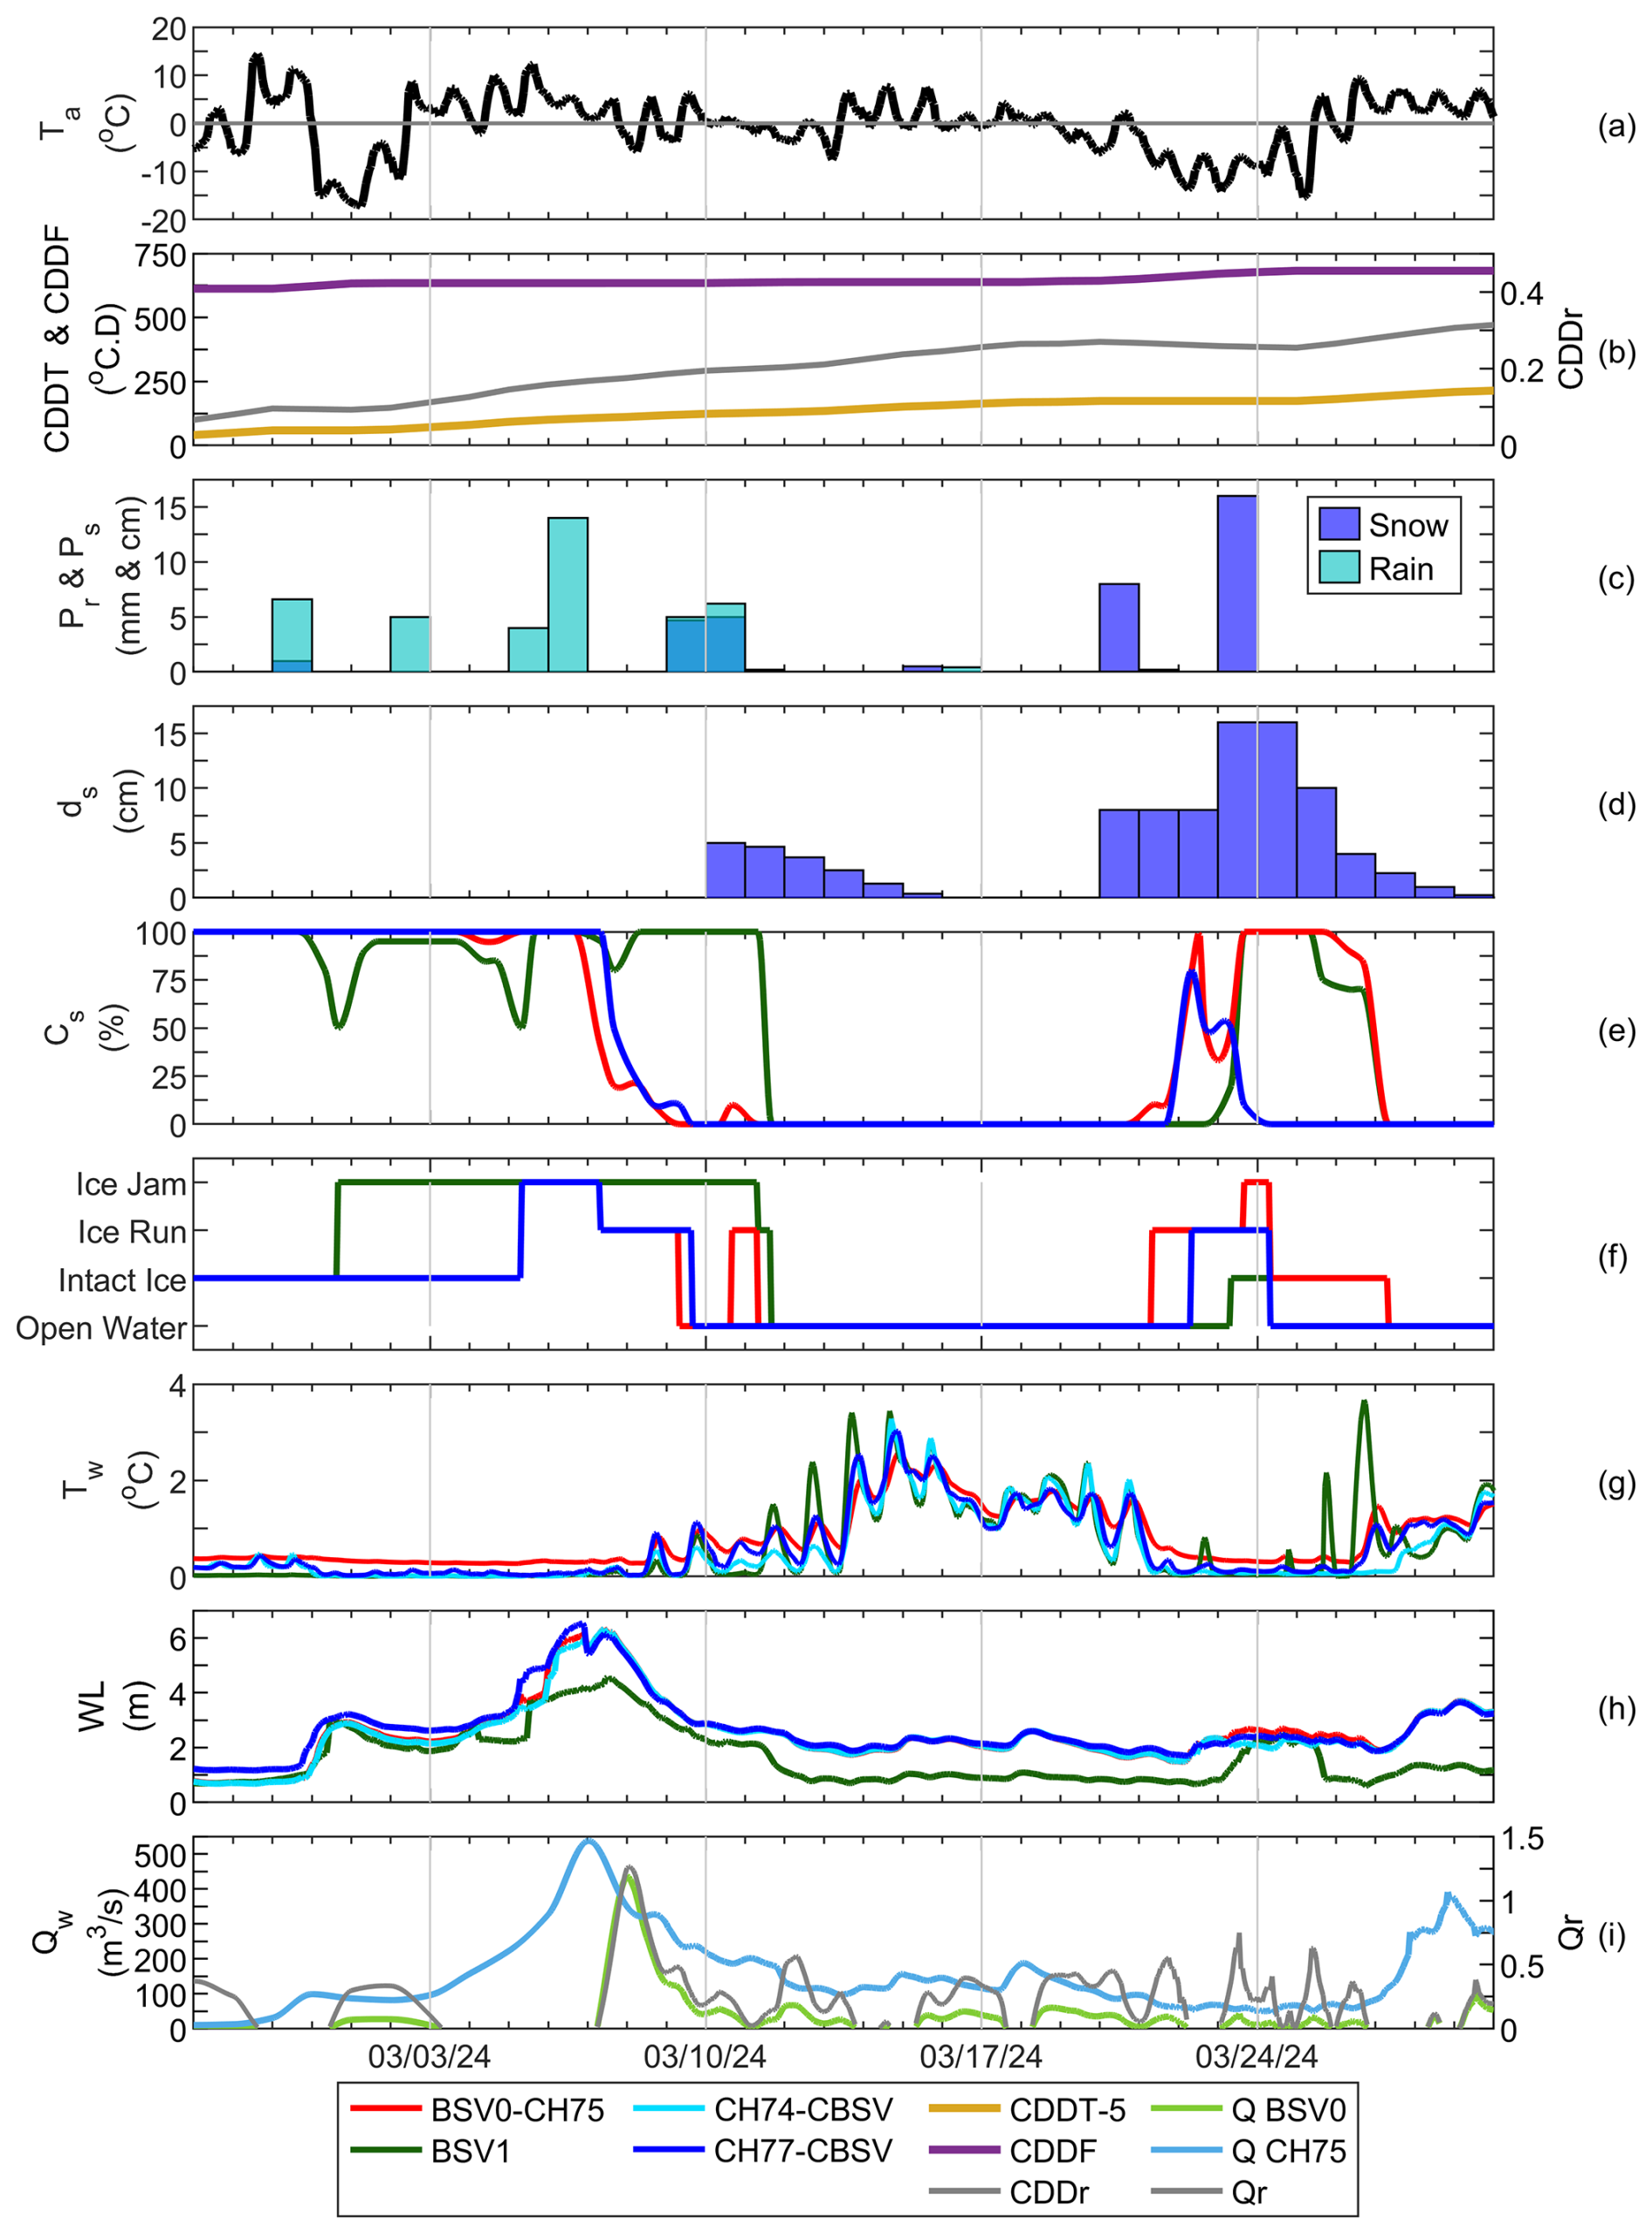
Figure 7Time series of hydrometeorological conditions during the 2024 breakup at CH-BSV (26 February to 30 March 2024) showing (a) air temperature, (b) CDDT, CDDF and CDDr, (c) daily precipitation, (d) snow on ground, (e) surface ice concentration, (f) ice states, (g) water temperature, (h) water level above the pressure probe and (i) discharge and Qr.
The results of the meteorological, hydraulic and ice conditions for the 2024 breakup are represented in Fig. 7 and discussed here as an example of the field data analysed during each breakup. During the 2024 breakup period, several freeze-thaw cycles were observed. The onset of breakup in the tributary on 29 February coincided with the coldest temperatures, reaching a minimum of −17 °C (Fig. 7a). By 7 March, when breakup reached the confluence, the CDDT reached 100.6 °C D, while the CDDF reached 634.5 °C D, resulting in a CDDr of 0.16 (Fig. 7b). Breakup at the confluence coincided with the season's maximum discharges, which increased rapidly starting 29 February. Following rainfall totalling 18 mm on 5 and 6 March, discharge reached 535.4 m3 s−1 in the CH and 433.6 m3 s−1 in the BSV on 7 March, for a Qr of 0.81 with water levels rising approximately 3.5 m at all observation sites (Fig. 7c, h, i).
The 2024 breakup at CH-BSV was hydraulically driven with rapid discharge increases leading to mechanical ice failure. Ice release spread from the tributary to the confluence, then to the CH in a downstream to upstream pattern. The confluence geometry created hydraulic bottlenecks where converging discharges facilitated repeated jam formation from upstream ice releases. The 2024 breakup began with gradual ice cover melting in the tributary, with melting moving upstream starting 29 February (Fig. 7e). Following a ∼ 7 mm rainfall on 28 February, an ice jam formed at the tributary mouth (BSV1) on 29 February, coincident with a ∼ 2 m water level rise at all sites (Fig. 7c, h). This ice jam did not release until 11 March (Fig. 7f). Ice jams then formed simultaneously on the CH upstream of the confluence (CH77-CBSV) and at the confluence itself (BSV0-CH75) on 5 March, before being released as ice runs from 7 to 9 March, with the confluence (BSV0-CH75) becoming ice free a few hours before the upstream CH site (CH77-CBSV). A second ice jam formed at the confluence (BSV0-CH75) during the night of 10 to 11 March as upstream ice was released. Water temperatures at all sites began to rise on 9 March, including at the downstream confluence site (CH74-CBSV), suggesting it was ice free by that date (Fig. 7g). These temperatures then dropped by approximately 3 °C around 23 March, coinciding with a 16 mm of snowfall and colder air temperatures reaching −12.4 °C (Fig. 7a, c, g). A second breakup sequence occurred at the confluence, again from downstream to upstream, and driven by further snowmelt (Fig. 7d). After ice runs were observed during the day on 22 to 23 March, an ice jam formed overnight 23 to 24 March, and then released. Ice runs at the upstream CH site (CH77-CBSV) from 22 to 24 March contributed to ice jam formation at the confluence. With colder air and water temperatures, an ice cover temporarily reformed at the confluence (BSV0-CH75) until 27 March (Fig. 7a, f, g). The ice cover had also reformed at the tributary mouth (BSV1) on 23 March, melting simultaneously with the confluence on 27 March. By this date, all observation sites were ice free.
7.1 Bras-du-Nord and Sainte-Anne confluence
With the confluence angle of STA-BDN estimated at 55° and the channel width ratio of 0.77, these field conditions can be compared with the laboratory case study of Ettema et al. (1999), which considered a 45° angle between rivers and a channel width ratio of 0.74. This laboratory experiment showed that Qr of 0.6 consistently resulted in ice jam in the main river. Similarly, field observations showed ice jam formation at the confluence in the main river occurred in all four years, and the Qr exceeded 0.6 in all years (Qr = 0.61, 0.71, 0.79 and 0.69 for 2021, 2022, 2023, and 2024, respectively).
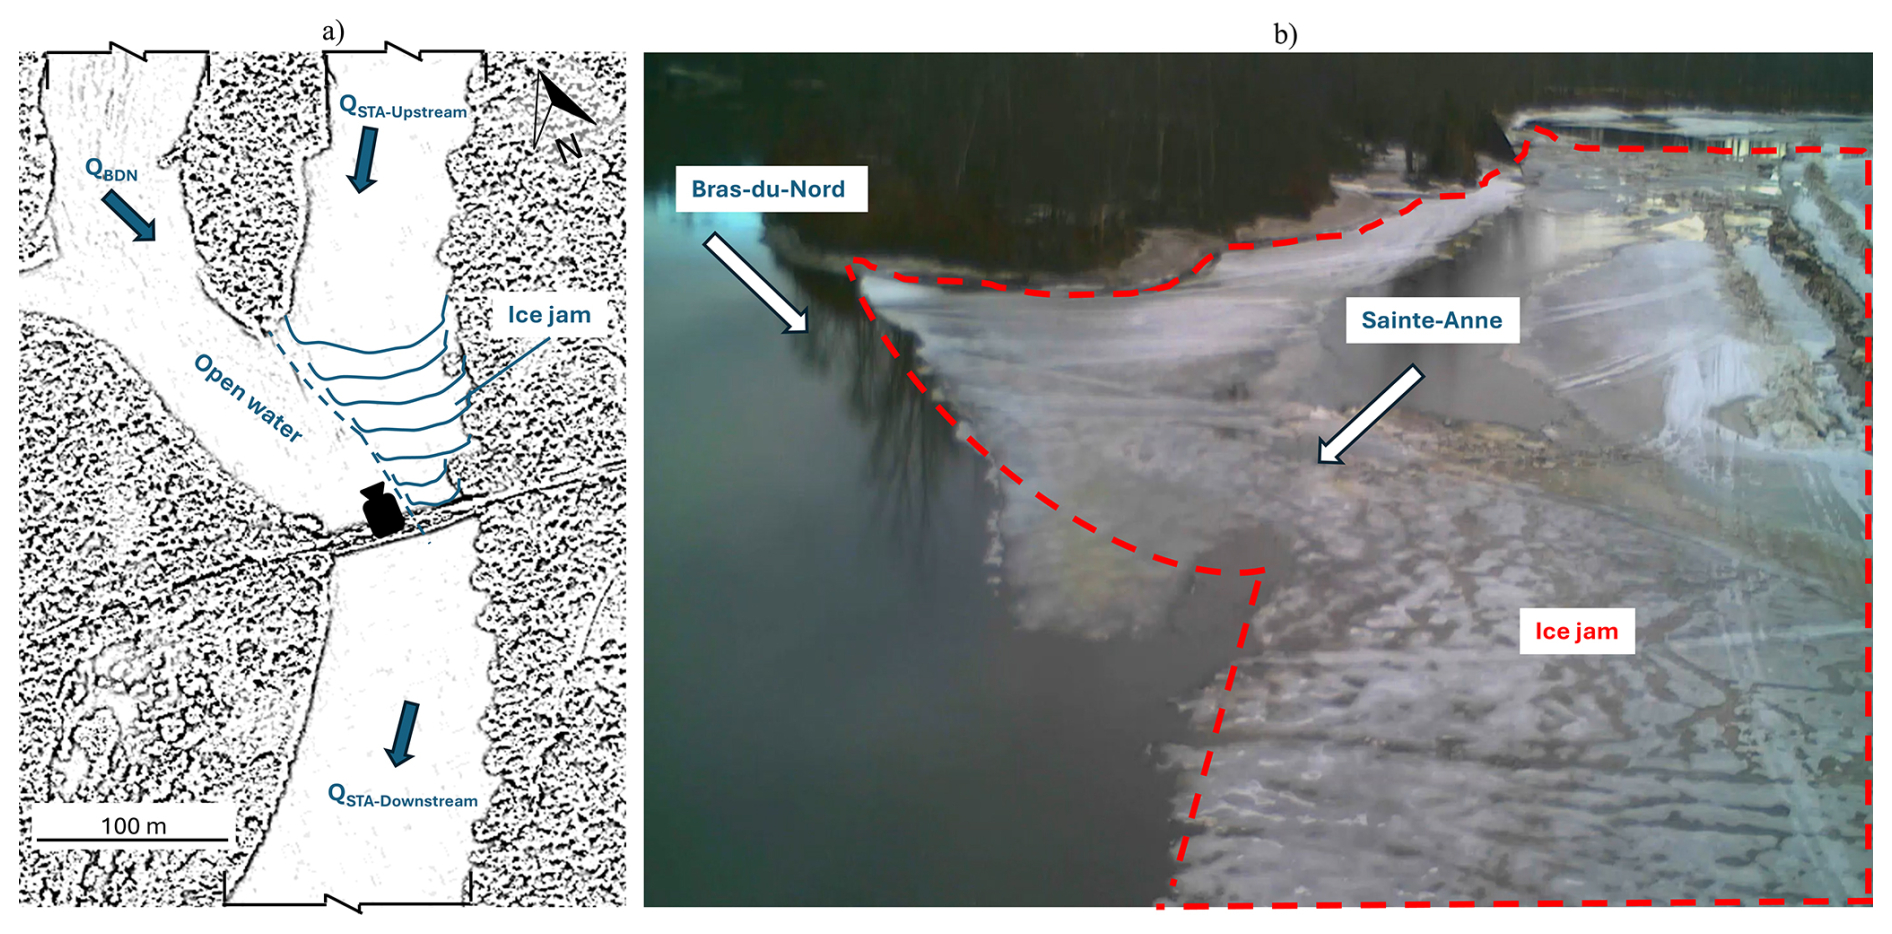
Figure 8Jamming due to flow impact with (a) a schematic representation and (b) a picture taken at site BDN0-STA3 on 7 April 2021, looking upstream towards the flow as represented by the camera symbol in panel (a), where the ice jam appeared at STA-BDN. The red dotted line in panel (b) represents the ice jam caused by the effect of flow impact from the BDN on the ice in STA.
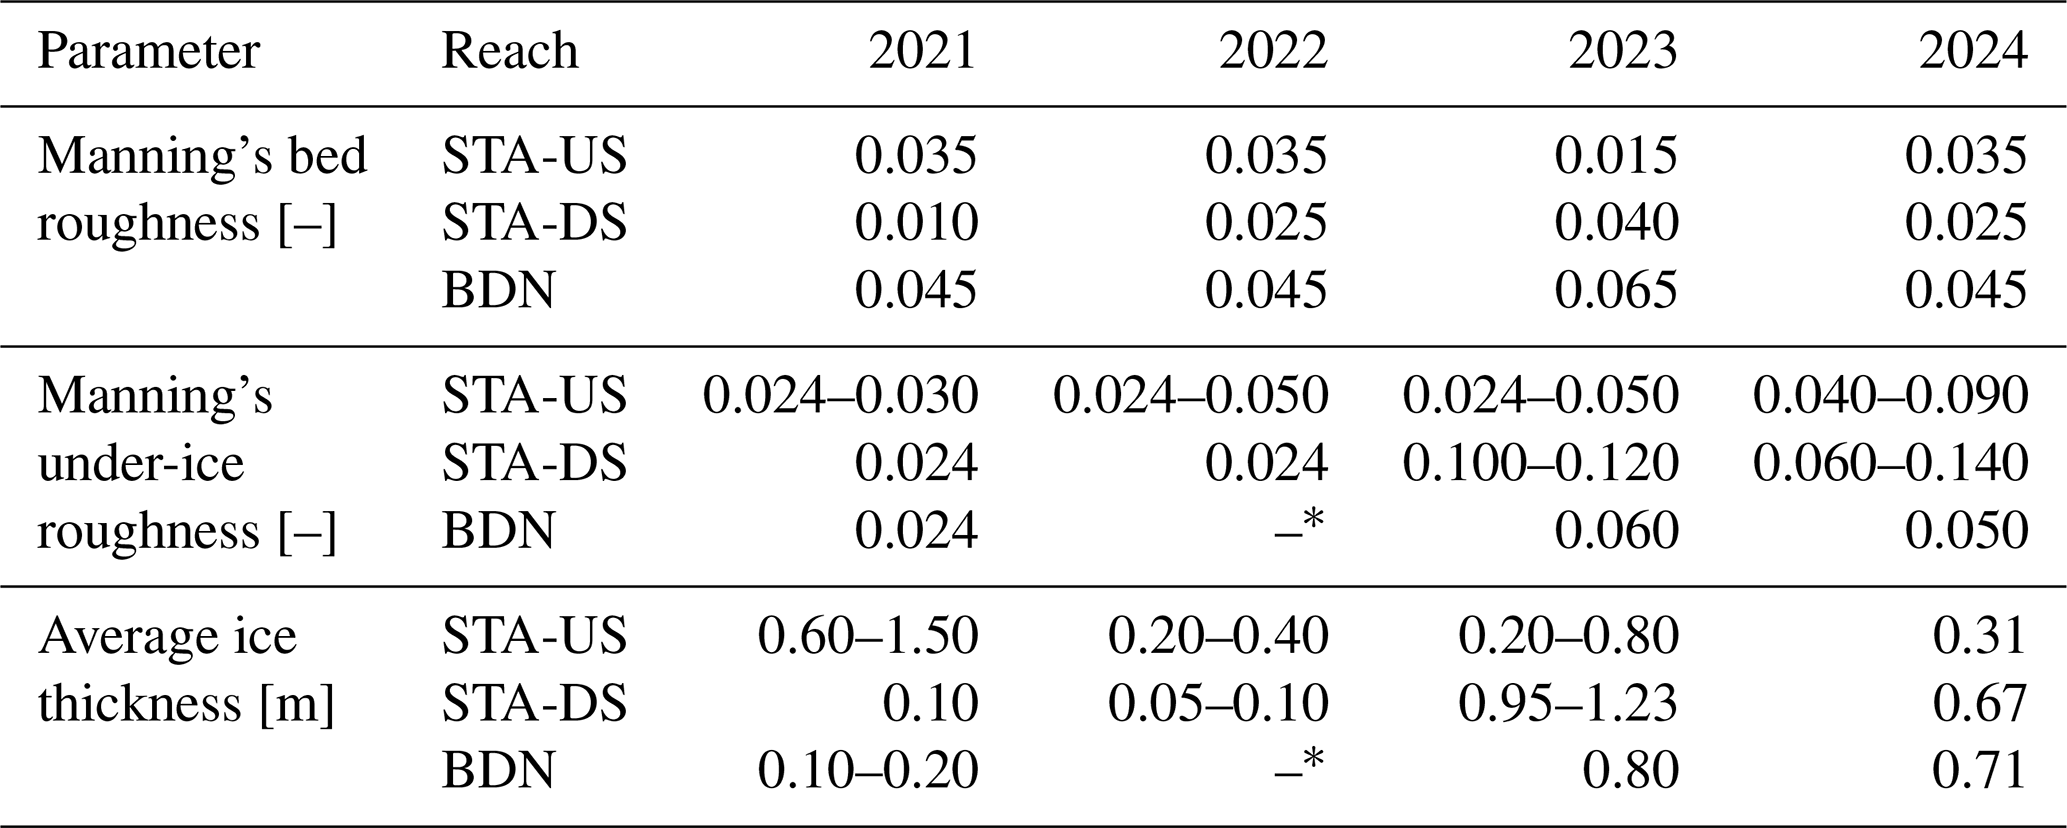
Table 4Range of calibrated parameters of the HEC-RAS ice jam simulations of the study period at STA-BDN.
∗ No data because the reach was open.
The scenario where an ice jam in the main river caused by flow impact from the tributary (process 5) occurs at the STA-BDN confluence is illustrated in Fig. 8. Equation (5) for this mechanism was tested for the four years of the study period using information from field observations and hydraulic modeling. Table 4 shows the calibrated hydraulic parameters over the study period and Fig. 9 shows an example of the final calibration of the ice jam model for the year 2021. For 2021, the ice jam length was estimated of 2000 m with the toe located at the confluence (BDN0-STA3) and the head at STA5. It should be noted that the ice thickness and under-ice roughness in the three reaches were adjusted from the ice cover simulation to calibrate the ice jam simulation for all studied periods. Across all years, calibrated parameters showed considerable variability, consistent with the diverse hydraulic and ice conditions observed during different breakup events. The three calibrated parameter types present specific measurement challenges in the field. The under-ice Manning roughness coefficient depends on the highly irregular and spatially variable texture of the ice underside, which forms under dynamic conditions and cannot be measured non-intrusively. The bed roughness can in principle be estimated from grain size distributions under open water conditions, but its simultaneous calibration with the under-ice roughness means that both parameters are adjusted to match a single observed water level time series. Because both parameters influence total hydraulic resistance in similar ways, they cannot be fully decoupled, a well-known equifinality problem in hydraulic modelling (Beven, 2006). The wide range of calibrated values in Table 4 reflects this combined uncertainty and should not be interpreted as true physical variability of the parameters.
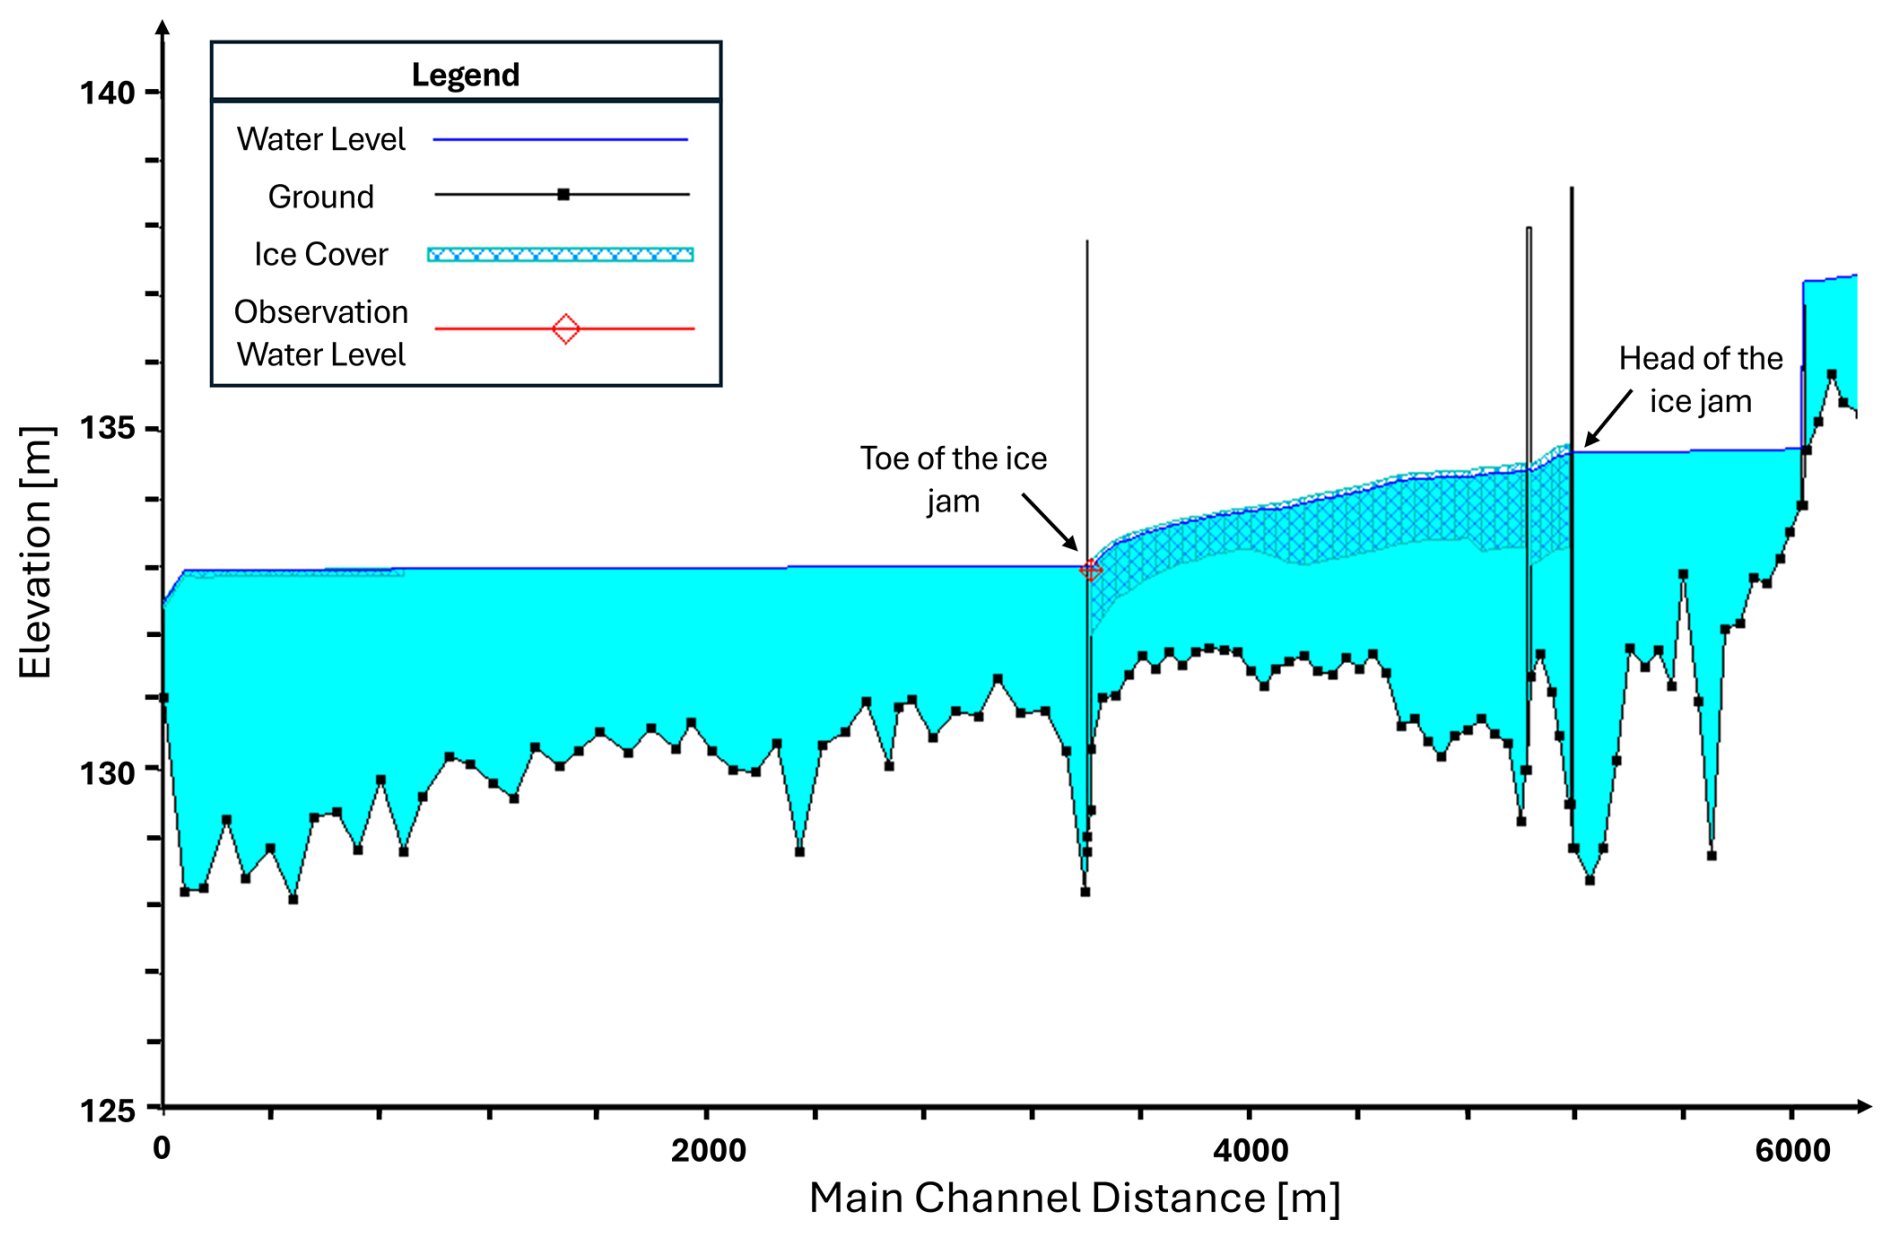
Table 5Values of the parameters used in the ice jam balance equation for all years of the study period at STA-BDN.
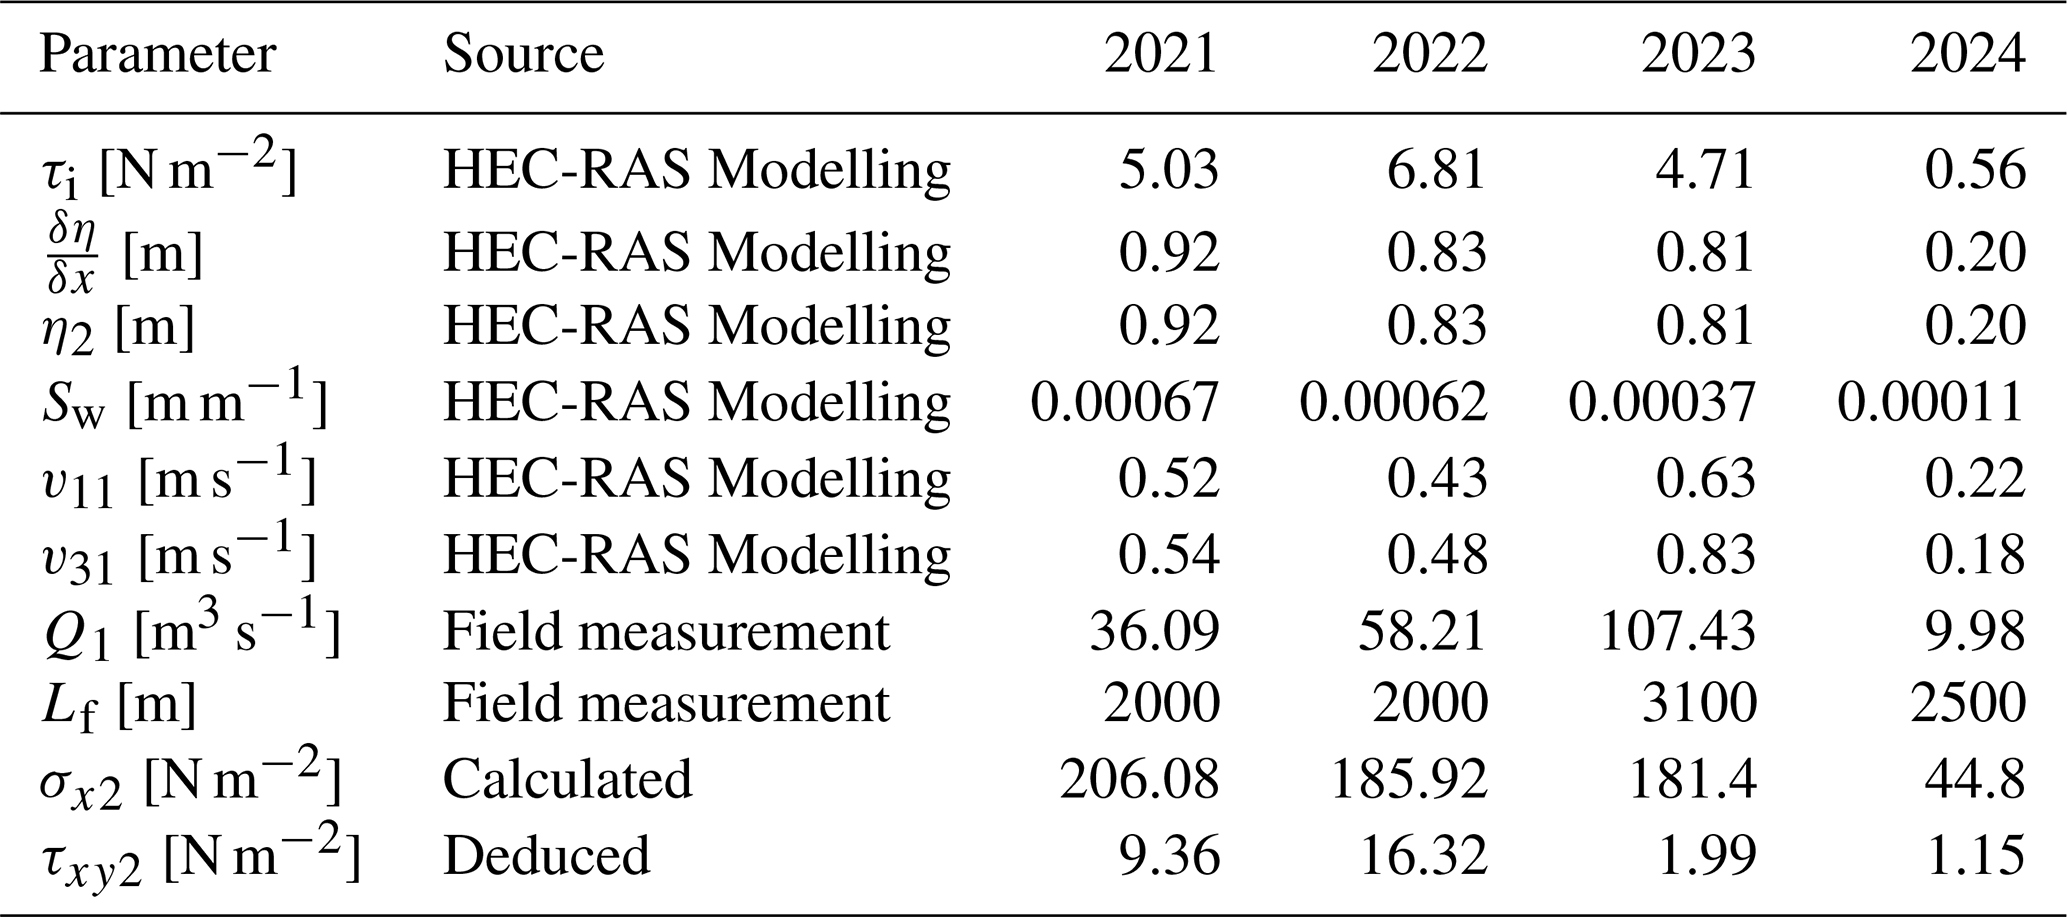
Table 5 shows the values of parameters used in Eq. (5) for all years, specifying their respective sources, either hydraulic modelling, field measurements, calculated or deduced to satisfy ice jam formation criteria. Several constants were used for all years, including: ice density (ρi) = 917 km m−3, the water density (ρ) = 1000 kg m−3, the gravitational acceleration (g) = 9.81 m s−2, the dynamic fluid viscosity of water (μ) = 0.00157 and the porosity of ice accumulation (e) = 0.4 (after Beltaos and Tang, 2013). The morphological parameters were also kept the same for all years, including angle (α) of 55° between the two rivers and a width of the STA (b2) of 80.6 m. The discharge from the tributary (Q1) ranged from 10 to 107 m3 s−1, while the length of the ice jam (Lf) and the normal stresses along the main river in the flow direction (σx2), ranged from 2000 to 3100 m and from 45 to 206 N m−2, respectively. According to Eq. (5), an ice jam at the confluence is formed when the shear stress at the bank in the STA upstream the confluence (τxy2) reaches a specific threshold. The bank shear stress was deduced so that the sum of the forces is equal to zero for each observed ice jam event and ranged from 1.15 to 16.32 N m−2 (Table 5). These values are consistent with the values between 0.52 and 23.87 N m−2 reported for a similar river study conducted on the Nelson River in Manitoba by Zare et al. (2015). The minimum value of 1.15 N m−2 (observed in 2024) may represent the bank shear stress required for ice jam formation at this location. The uncertainty in the deduced bank shear stress is inherently linked to the combined measurement and modeling uncertainties mentioned in the discussion.
7.2 Du Loup and Chaudière confluence
At the CH-DL confluence, the Sartigan Dam creates a stationary ice cover barrier. Moving ice from both rivers collides directly with the dam's stationary ice cover before reaching the sedimentation bar in the flow separation zone downstream in the confluence. This consistent pattern aligns with one of the ice jam formation mechanisms defined by Ettema and Muste (2001): an ice run blocked by stationary or slow-moving ice in the outflow channel (process 1) (Fig. 10). This mechanism represents one of the simplest yet most common jamming scenarios in river ice dynamics (Tuthill and Mamone, 1997). Due to its straightforward nature, no specific predictive equations have been developed, as it is governed by basic principles of ice transport and obstruction.
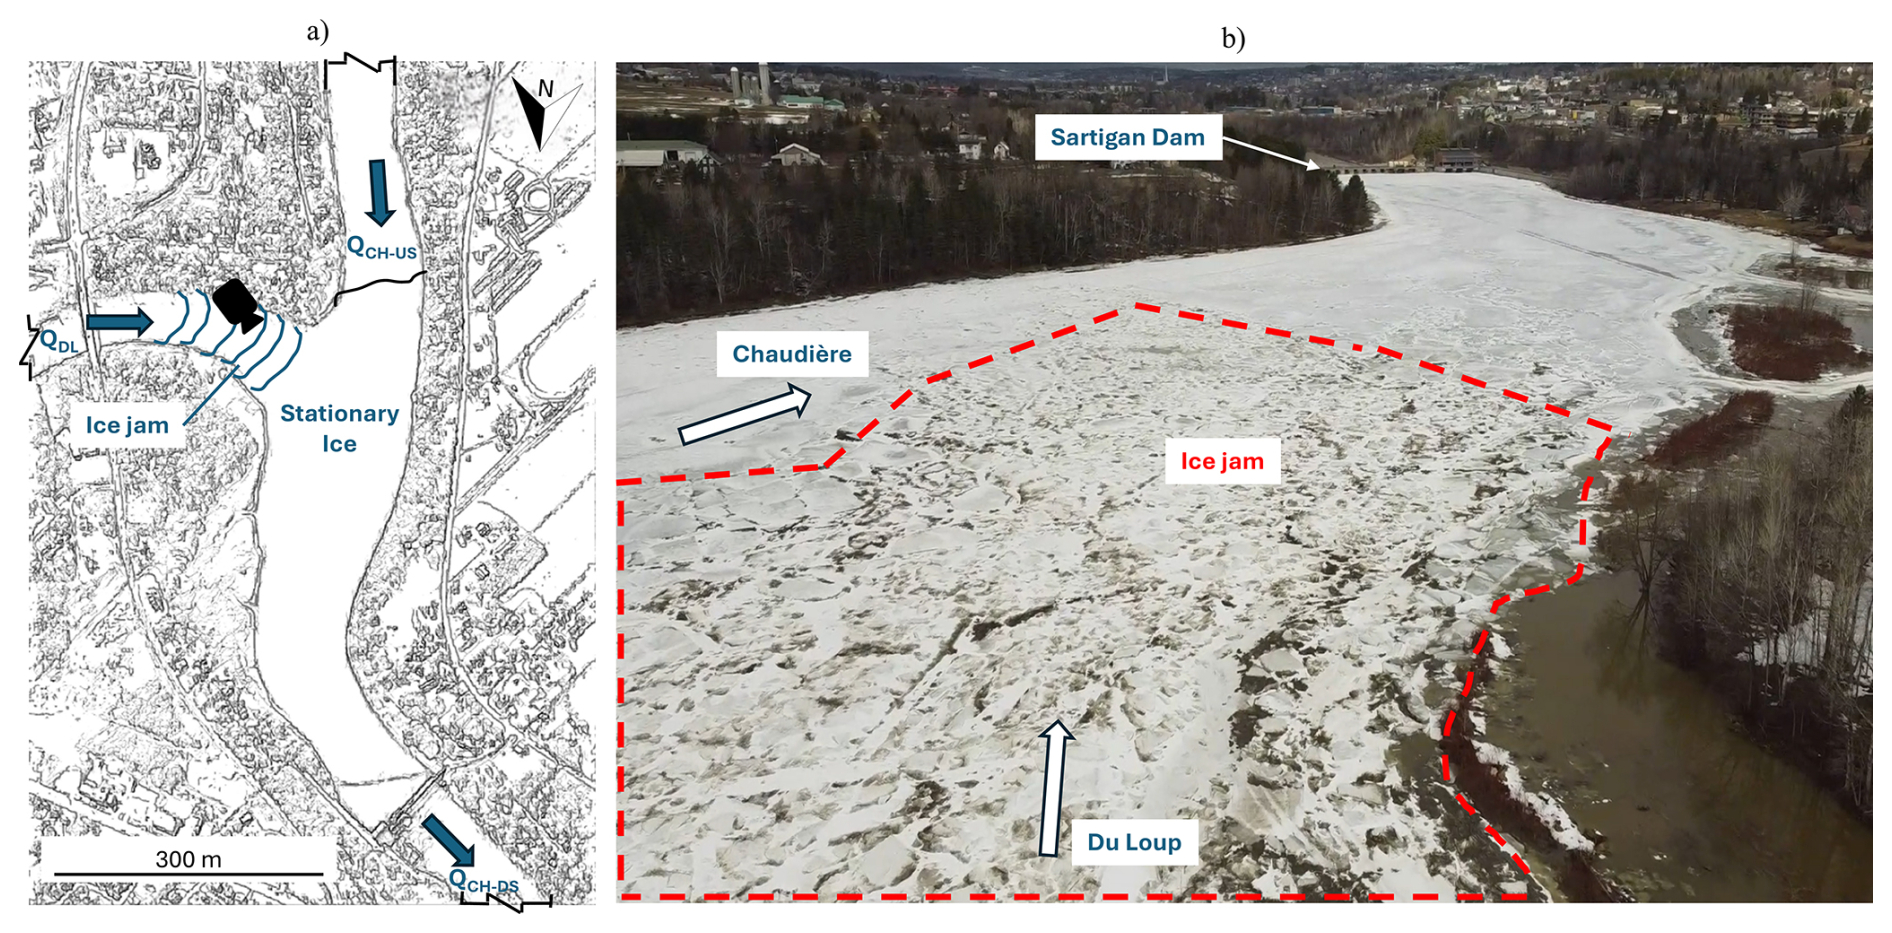
Figure 10Jamming due to stationary ice with (a) a visual representation and (b) a drone picture taken at site DL0-CH104 on 31 March 2022, looking downstream in the flow direction as represented by the camera symbol in panel (a) where the ice jam appeared at CH-DL.
Nevertheless, it was possible to compare the location of ice jam formation at this confluence with one of the laboratory cases based on morphological parameters. For the 90° concordant bed laboratory confluence with discharge ratio Qr of and width ratio of 0.67, the ice jam consistently formed in the tributary channel. However, field observations at this confluence demonstrate that ice jams form almost simultaneously in both the main river upstream of the confluence and at the tributary mouth. Additionally, the discharge ratios recorded during ice jam formation at this site (Qr of 0.64, 0.33, and 0.47 for 2021, 2022, and 2024 respectively, with an average of 0.48 ± 0.16) encompass a much broader range of variability than the controlled laboratory conditions yet consistently produce the same jamming mechanism regardless of this hydraulic variability.
The hydraulic processes at CH-DL are dominated by the interaction between typical concordant confluence dynamics and artificial flow control imposed by the Sartigan Dam. This hydraulic control mechanism creates predictable patterns of ice jam formation, with variations driven mainly by meteorological conditions affecting the melting rate of the stationary ice cover rather than underlying hydraulic processes. The only year that did not form an ice jam upstream of the stationary ice cover was 2023 which experienced a thermally dominated breakup occurring later in the season. This breakup occurred in early April with a CDDr of approximately 0.22, indicating significantly higher thermal energy available for ice cover melting compared to the 2021, 2022, and 2024 breakups, which occurred in late March with lower CDDr values of 0.14, 0.11 and 0.16, respectively.
7.3 Famine and Chaudière confluence
With the confluence angle of the CH-FA estimated at 40° and a channel width ratio of 0.43, these field conditions can be compared with laboratory cases from Ettema et al. (1999). Field observations reveal that ice jams formed at discharge ratios of 0.21, 0.17, 0.15, and 0.20 for 2021, 2022, 2023, and 2024, respectively. These ratios are lower than those investigated in laboratory studies for a similar confluence angle of 45° and the closest width ratio tested of 0.67, where the comparable case examined discharge ratios around 0.67. This difference can be attributed to factors not considered in laboratory experiments: the discordant bed with significant slope variations, and the presence of islands upstream of the confluence. These morphological features cause ice jams requiring high tributary discharges to dislodge, explaining why ice jam formation occurs at lower discharge ratios than predicted by laboratory studies.
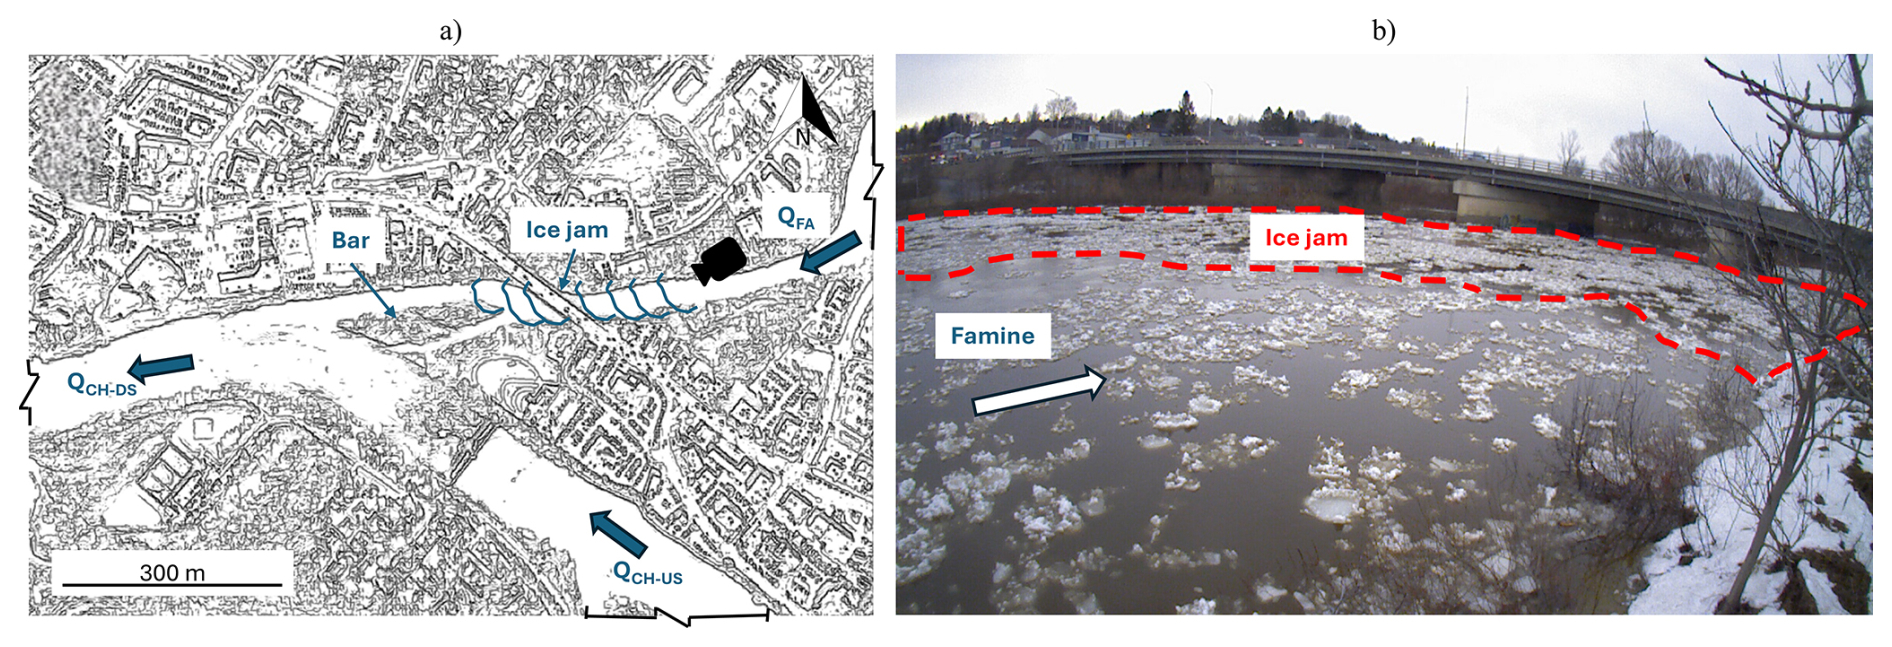
Figure 11Jamming on depositional fan with (a) a visual representation and (b) a picture taken at site FA02 on 11 April 2023, looking downstream in the flow direction of FA as represented by the camera symbol in panel (a), where the ice jam appeared at the mouth of the FA.
This ice jam formation mechanism at CH-FA is similar to both the confluence bar mechanism (process 6) and the jamming on depositional fans (process 7) identified by Ettema and Muste (2001) as shown in Fig. 11. This type of morphological control is consistent with field observations at the Liard River confluence in the north of Canada, where similar deltaic deposits and islands were found to cause ice grounding and arching at the tributary mouth (Prowse, 1986). This process is enhanced by the flow constrictions from the highway-bridge at CH-FA. Although the processes observed are similar to both processes 6 and 7, equations are only provided for process 6. Therefore Eqs. (6) and (7) (process 6) were tested at this confluence. These equations were tested for the first three years for which ice thickness was measured in the field. Table 6 shows the parameters values used for the tested years.
Table 6Values of the parameters used in the ice jam balance equation for three years (2021, 2022 and 2023) at CH-FA. Bold values indicate the calculated (ηc) and equilibrium (ηeq) ice thicknesses compared in the text.
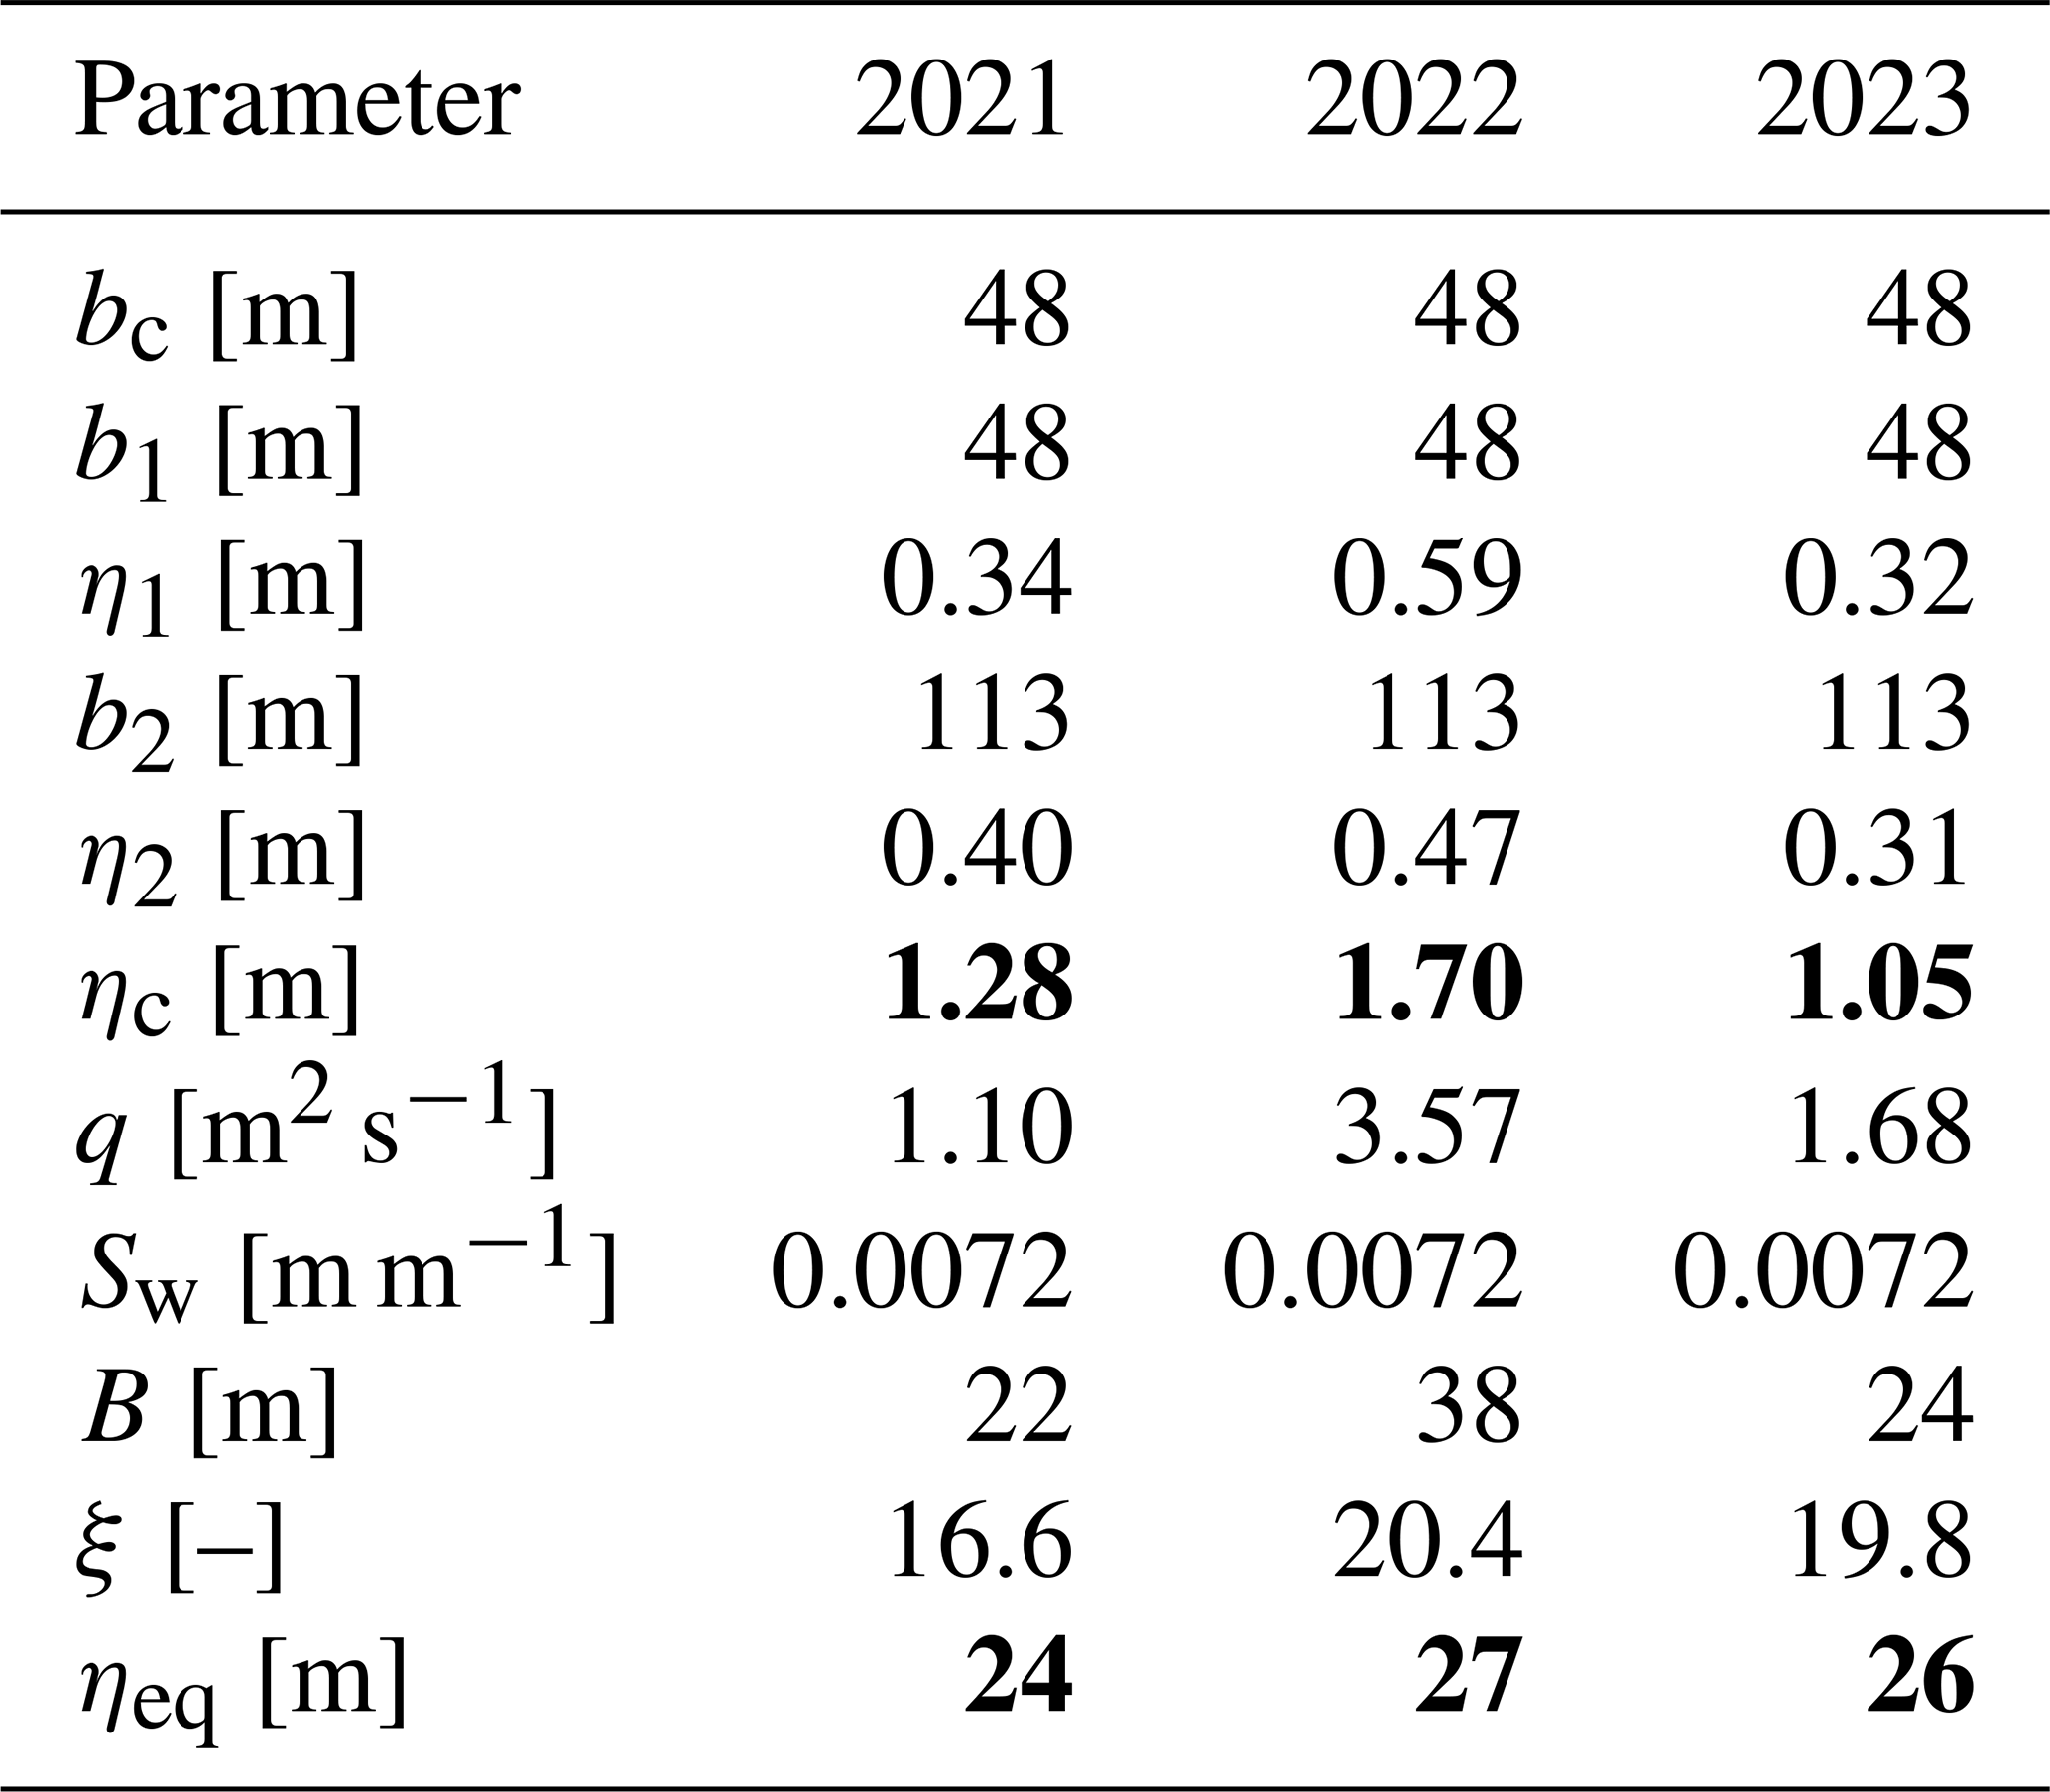
For all years tested, calculated ice thicknesses (ηc) are a lot lower than equilibrium ice thicknesses (ηeq) predicted with Beltaos (1995)'s relationship (Table 6). This large discrepancy can be explained by the nature of the morphological jamming mechanism, which occurs specifically under low flow conditions where ice grounds on the elevated bed and depositional accumulations. The calculated ice thickness does not incorporate discharge parameters, while the equilibrium ice thickness relationship includes flow conditions in its formulation, suggesting that integrating discharge into the predictive equation could improve accuracy and reduce this significant discrepancy. The uncertainty in the calculated and equilibrium ice thicknesses is discussed in the context of overall model validation uncertainty in the discussion.
7.4 Bras Saint-Victor and Chaudière confluence
With a confluence angle of ∼ 58° and the channel width ratio of 0.63, the field conditions at CH-BSV present limited comparability with laboratory cases documented by Ettema et al. (1999). At CH-BSV, ice jams formed at discharge ratios of 0.12, 0.73, 0.54 and 0.38 for 2021, 2022, 2023, and 2024, respectively, with an average of 0.44 ± 0.26. Most of these ratios fall outside the range investigated in laboratory studies for similar confluence angles, where comparable cases typically examined discharge ratios around 0.67 for a 45° angle and width ratio of 0.67. Larger confluence angles can alter flow deflection patterns and increase turbulence at the junction, potentially creating more favourable conditions for ice accumulation at lower discharge ratios and jamming than would be predicted from experiments conducted at smaller angles (Penna et al., 2018). Additionally, at CH-BSV, the ice jamming process is complicated by upstream ice jams that subsequently migrate downstream and become trapped at the confluence, creating extensive composite ice jams. This cascading mechanism, where multiple upstream jams merge to form a large-scale ice obstruction, represents a complex natural process not replicated in controlled laboratory conditions. The presence of morphological features upstream further creates local flow constrictions that promote this sequential ice accumulation pattern. Therefore, breakup processes at this confluence likely involves a combination of mechanisms identified by Ettema and Muste (2001). These includes jamming due to arching ice pieces (process 3) and jamming due to bars (process 6). For process 3, ice runs become mechanically interlocked and form stable arches spanning the river width as shown in Fig. 12. Process 6 is also possibly occurring due to the morphological characteristics of the confluence. A predictive equation was specifically developed for the jamming due to merging ice runs mechanism (Eq. 2). Nevertheless, testing this equation was not feasible due to insufficient bathymetric data needed for hydraulic modeling, the complexity of ice processes occurring at the confluence, and the availability of its ice related measurements.
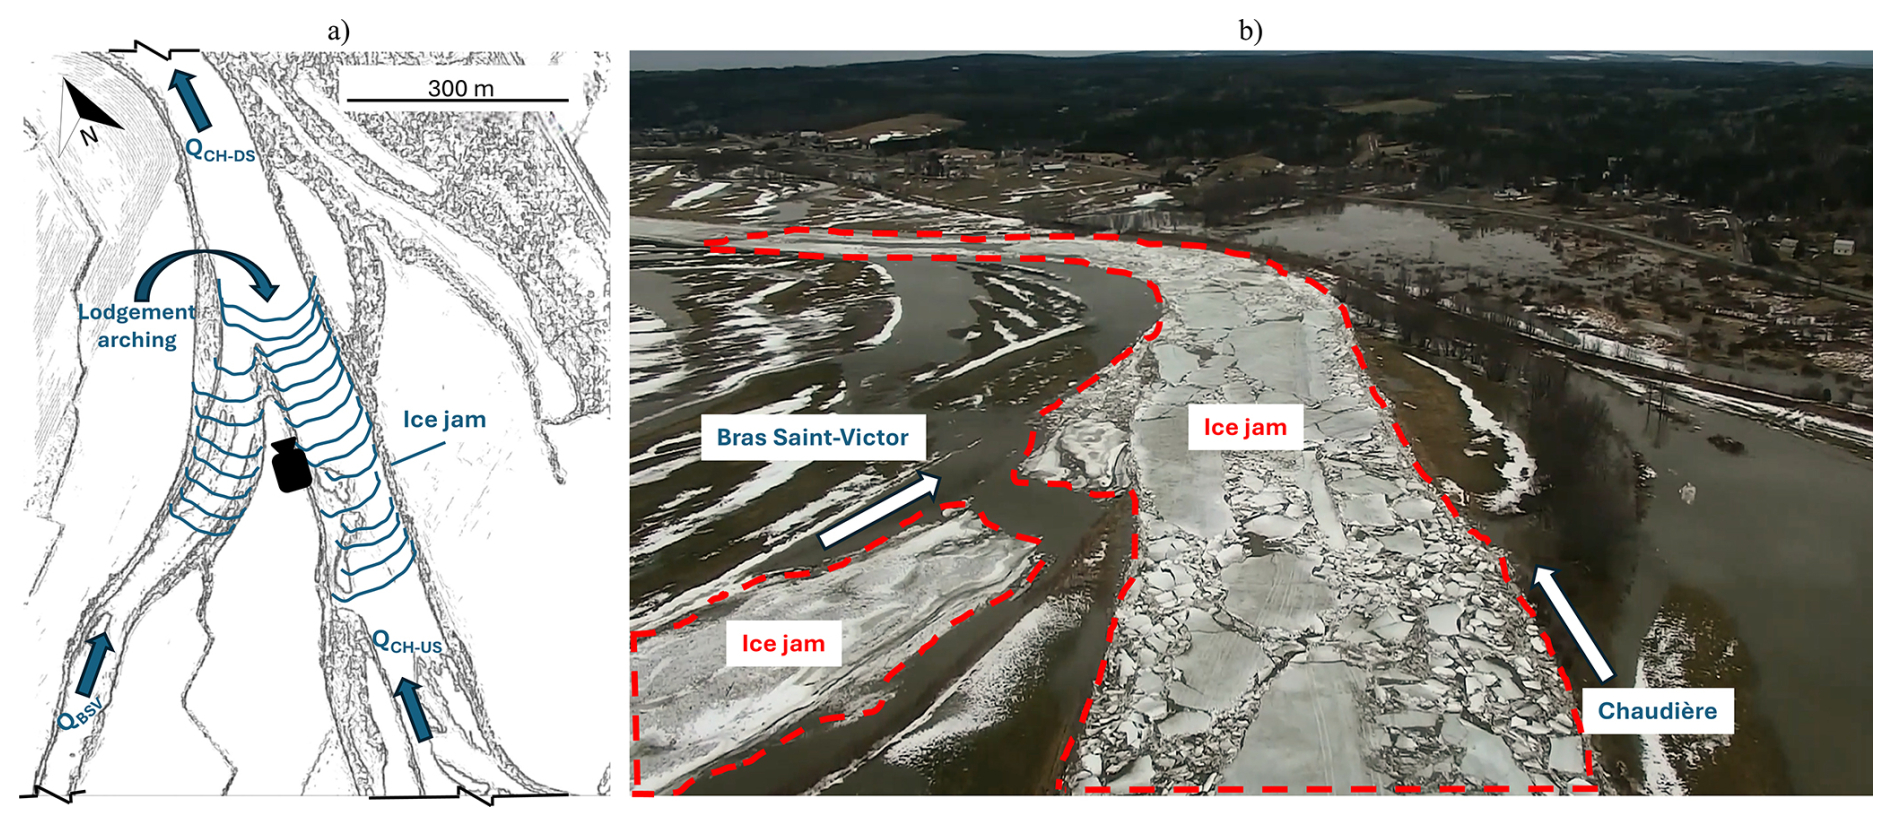
Figure 12Jamming of arching ice pieces with (a) a visual representation and (b) a drone picture taken at site BSV0-CH75 on 6 March 2024, looking downstream in the flow direction as represented by the camera symbol in panel (a), where the ice jam occurred at CH-BSV.
The analysis of ice jam formation at river confluences in a real-life context presents several sources of uncertainty that must be acknowledged when interpreting results and applying predictive frameworks. Data collection represents a challenge in this field study, arising from the inherent difficulties of monitoring dynamic ice processes in winter conditions (Beltaos and Prowse, 2001). The temporal resolution of monitoring equipment varied across instruments and years, creating potential gaps in capturing ice jam formation and corresponding parameters. Furthermore, the spatial distribution of monitoring equipment, while strategically placed to capture confluence dynamics, may not have fully represented the heterogeneous ice conditions across the entire study reach. Also, the reliance on visual observations from time-lapse cameras and drone flights, though valuable for understanding ice dynamics, introduces subjective interpretation of ice states and surface concentrations that could vary between observers or be influenced by lighting and weather conditions during image capture.
Hydraulic modeling uncertainties constitute another source of error in this analysis. The successful development of models for only STA-BDN, while CH-BSV's model was constrained by data limitations, highlights the importance of adequate bathymetric and ice condition data for reliable model calibration. The calibration process itself introduces uncertainty, as the adjustment of roughness coefficients and ice thickness values to match observed conditions may not represent the actual physical processes (Pappenberger et al., 2005). Also, the discharge measurements may not have represented the exact flow conditions at the confluence at the same temporal resolution due to travel time and routing effects between measurement points. In summary, the wide ranges of calibrated parameters presented in Table 4, suggest that these values may be compensating for unmodeled physical processes or measurement errors rather than reflecting true physical properties, which is common when modeling river ice hydraulics (Beven, 2006). Future work will focus on a global sensitivity analysis to assess the relative effect of each parameter on the model outputs, which would allow a more rigorous quantification of the contribution of each uncertainty source to the overall model validation uncertainty.
The empirical formulations developed by Ettema and Muste (2001) were derived under controlled laboratory conditions with simplified geometries that rarely match the complexity of natural river systems. The extrapolation of these equations to field conditions requires several assumptions regarding parameter values that are difficult to measure or estimate accurately in natural settings. Nevertheless, this study represents, to the authors' knowledge, the first attempt to correlate laboratory-derived equations developed by Ettema and Muste (2001) with real-world ice jam formation conditions at natural river confluences. The application of these equations to field observations provides insights into the transferability of controlled experimental results to complex natural systems. The validation of the flow impact mechanism equation at STA-BDN demonstrates that laboratory-derived force balance approaches can yield meaningful predictions when appropriate morphological and hydraulic analogues exist between experimental and field conditions.
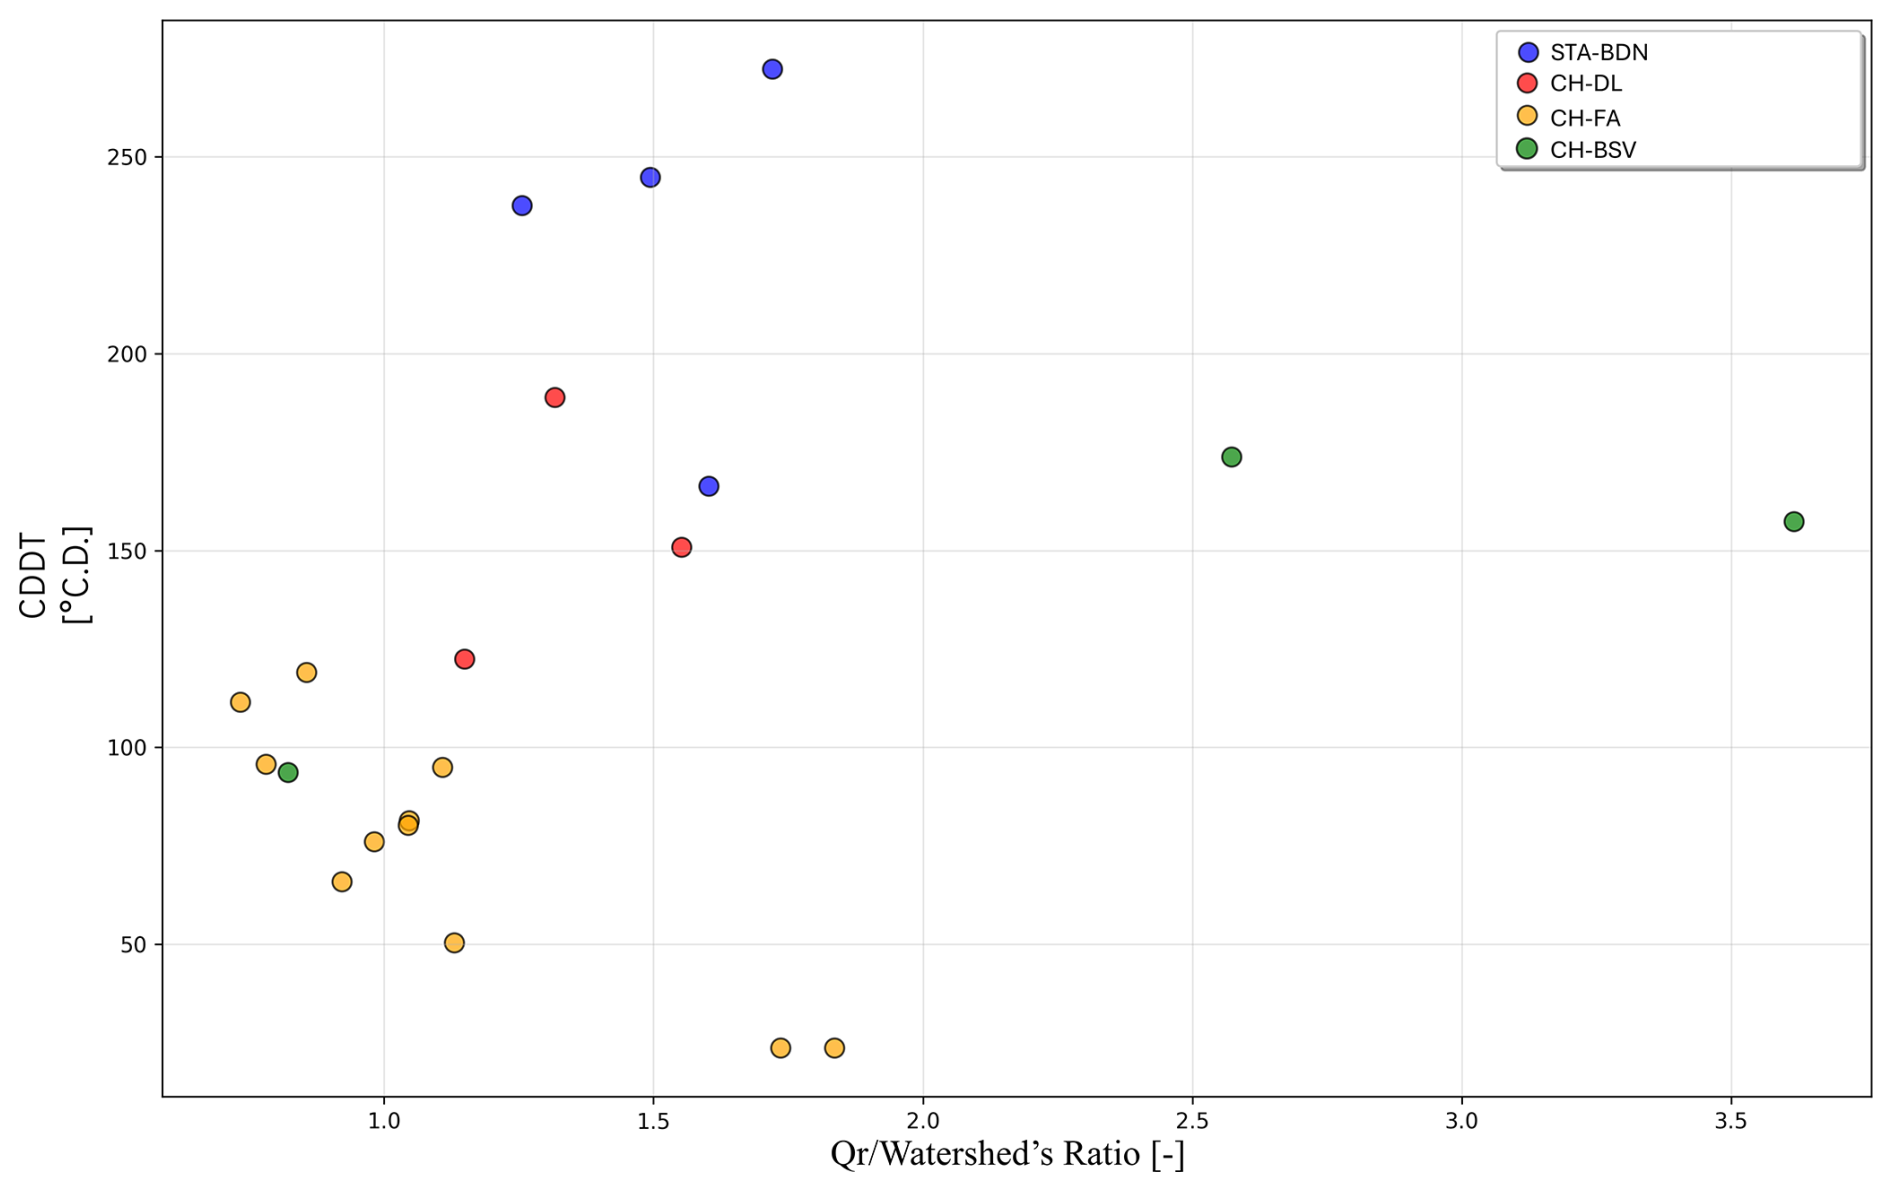
Figure 13Relationship between discharge ratio (Qr) divided by the Watershed's Ratio (from Table 1) and cumulative degree-days of thawing (CDDT) on the ice jam day at the confluence site over the study period for all four confluences studied.
The physics-based laboratory equations require extensive field campaigns and data analysis work. These resources might not be always available for ice jam flood forecasting agencies. Nevertheless, the data collected in this study, provides an opportunity to investigate empirical methods to predict ice jam formation at confluences. Turcotte et al. (2020) presented an empirical relation between the CDDT and the discharge leading to ice jam floods in rivers. The premise is that the discharge could represent the driving forces while the CDDT could represent the ice resistance. This model was adapted to the confluence setup by replacing the discharge value by the discharge ratio Qr divided by the watershed's ratio (i.e., the watershed of the tributary divided by the watershed of the main river) (Table 1). This ratio could be explained as a non-dimensional unit discharge at the confluence which is plotted against the CDDT as shown in Fig. 13.
As shown in Fig. 13, the ice jams at the STA-BDN require the greater values of CDDT, i.e., greater thermal weakening of the ice cover, before any ice jam formation occurs. This can be explained by the fact that this confluence is the most northern site with colder air temperatures and consequently thicker ice covers. Similarly, the ice cover on the CH-DL is supported by the downstream Sartigan Dam, and therefore, would require a certain level of heat input before breakup start and ice jams form. The CH-BSV appears to require the stronger hydraulic driving forces to form a jam at the confluence. Nevertheless, the processes at this confluence are very complex which is apparent from the wide range of conditions for ice jam formation during the study period. The CH-FA presents a typical case where a trend line can be plotted that highlight the decrease of CDDT with the increase of discharge. This means that an ice jam can form at a high CDDT but low discharge, or high discharge and lower CDDT. Note, that at this confluence, there are much more observed ice jams because several ice jams formed and released during each breakup.
In summary, this preliminary analysis confirms that empirical models are site-specific but could potentially be used to predict ice jam formation at confluences. Nevertheless, future work should focus on developing river ice hydraulic models capable of simulating ice dynamics at confluences, as such models have not yet been developed. While physically based hydraulic models would provide comprehensive insights into the underlying processes, simpler empirical or data-driven models requiring fewer parameters offer practical advantages for operational flood management by reducing data acquisition complexity and computational burden during critical decision-making periods. Data-driven models should be used alongside the physically based models to evaluate the physical basis of their predictions and provide an additional source of verification. Fortunately, the amount of data collected during this study provides an opportunity to develop such data-driven models to predict ice jam formation at confluences. This will be the focus of future research.
This four-year field study of ice jam formation at river confluences in Québec, Canada, represents the first validation of laboratory-derived predictive equations under natural conditions. Through continuous monitoring of four distinct confluences that are the Bras-du-Nord and Sainte-Anne confluence (STA-BDN), the Du Loup and Chaudière confluence (CH-DL), the Famine and Chaudière confluence (CH-FA) and the Bras Saint-Victor and Chaudière confluence (CH-BSV) from 2021 to 2024, this research analyse interactions between tributary and main river ice dynamics during breakup events, while demonstrating both the potential and limitations of applying controlled laboratory findings to real-world river systems.
The study identified and characterized four distinct ice jam formation mechanisms for each confluence corresponding to processes previously documented in laboratory studies by Ettema and Muste (2001). At STA-BDN, the flow impact mechanism consistently produced ice jams at the confluence each year of the study period while the tributary was ice free. The laboratory-derived equation developed for this mechanism could also be validated by considering bank shear stress values ranging from 1.15 to 16.32 N m−2 depending on the year, which is consistent with the literature. CH-DL demonstrated jamming due to stationary ice cover created by the Sartigan Dam, overriding natural morphological controls. CH-FA exhibited jamming on depositional fans, where morphological controls at the tributary mouth created predictable jam formation locations. The laboratory-derived equation for this mechanism could also correctly predict jam formation, though the large discrepancy between calculated and equilibrium ice thicknesses suggests the need for improved integration of discharge parameters into the equation. Finally, CH-BSV showed complex jamming patterns involving arching ice pieces and merging ice runs, complicated by cascading effects from upstream jam formations and morphological controls. This mechanism was not defined directly by the laboratory studies of Ettema and Muste (2001) and corresponds more to a combination of two or three mechanisms. These findings demonstrate that while laboratory-derived relationships can provide valuable insights into natural ice jam processes, their application requires careful consideration of site-specific conditions and parameter uncertainties. Indeed, the weak correlations observed between most parameter combinations with all four confluences for all the study period for predicting ice jam formation underscore the site-specific criteria with the importance of morphological controls that cannot be easily quantified or generalized across different confluence types. The study's limitations highlight considerations for future research and operational applications. Data collection challenges in winter conditions, hydraulic modeling uncertainties and the inherent complexity of extrapolating laboratory results to natural systems instead of the opposite, all contribute to prediction uncertainties. From a practical standpoint, this research provides operational guidance for ice jam flood management. The identification of discharge ratio and cumulative degree-day of thawing as the most critical monitoring parameters offers a streamlined approach to real-time jam prediction that balances accuracy with data accessibility. The site-specific nature of jam formation mechanisms reinforces the need for confluence-specific monitoring and prediction strategies rather than universal approaches.
The broader implications of this work extend beyond ice jam prediction to the fundamental understanding of river ice processes in a changing climate. As winter temperatures continue to rise and precipitation patterns shift, the relative importance of thermal versus hydraulic breakup mechanisms may change, potentially altering the effectiveness of current predictive approaches (Turcotte et al., 2020). The documented sensitivity of jam formation to discharge ratios and thermal conditions suggests that climate change could impact ice jam frequency and severity at northern river confluences. Future research should prioritize the expansion of monitoring networks to include additional confluence types and climatic conditions, enabling the development of more robust predictive relationships. The integration of remote sensing technologies, including satellite imagery as detailed by Trudel et al. (2025) with the satellite SWOT, could address data collection limitations while providing higher spatial and temporal resolution of ice conditions. The development of machine learning approaches trained on the extensive datasets generated by this study could potentially identify complex parameter relationships that traditional statistical analyses have failed to reveal. However, such approaches must be carefully validated to ensure physical plausibility and avoid overfitting to site-specific conditions (Berti et al., 2025).
In summary, this study demonstrates that laboratory-derived understanding of ice jam formation processes can provide insights into natural river systems, but their application requires consideration of site-specific conditions and inherent uncertainties. The identification of critical monitoring parameters and confluence-specific thresholds advances operational ice jam prediction capabilities, while highlighting the interplay between morphological, hydraulic and thermal processes that govern ice dynamics at river confluences.
| BDN | Bras-du-Nord River |
| BSV | Bras Saint-Victor River |
| CH | Chaudière River |
| CH-BSV | Confluence of the Chaudière and Bras Saint-Victor Rivers |
| CH-DL | Confluence of the Chaudière and Du Loup Rivers |
| CH-FA | Confluence of the Chaudière and Famine Rivers |
| DL | Du Loup River |
| FA | Famine River |
| STA | Sainte-Anne River |
| STA-BDN | Confluence of the Sainte-Anne and Bras-du-Nord Rivers |
| CDDF | Cumulative Degree-Days of Freezing |
| CDDT | Cumulative Degree-Days of Thawing |
| CDDr | Cumulative Degree-Day ratio (CDDT CDDF) |
| Qr | Discharge ratio (tributary main river) |
| CEHQ | Centre d'expertise hydrique du Québec |
| CRIPE | Committee on River Ice Processes and the Environment |
| ECCC | Environment and Climate Change Canada |
| FRQNT | Fonds de recherche du Québec – Nature et Technologies |
| IAHR | International Association for Hydro-Environment Engineering and Research |
| MELCCFP | Ministère de l'Environnement, de la Lutte contre les Changements Climatiques, de la Faune et des Parcs du Québec |
| MSP | Ministère de la Sécurité Publique du Québec |
| HEC-RAS | Hydrologic Engineering Center – River Analysis System (US Army Corps of Engineers) |
| 1-D/2-D | One-dimensional/two-dimensional |
| ICS | Ice Control Structure |
The code to analyze and display the data was developed by the River Ice research group of Université Laval as part of the team's internal data-processing infrastructure. As it is not the sole property of the authors of this manuscript, it is not publicly released at this time, but it could be made available upon request.
All datasets used in this study are available at Borealis, the Canadian Dataverse Repository, under a CC-BY 4.0 license on the following repository: https://doi.org/10.5683/SP4/QTWLIR (Charbonneau et al., 2026).
Field photos and videos are not publicly released at this time due to their large file size, but they could be made available upon request.
Results for additional field season are available in the Supplement. The supplement related to this article is available online at https://doi.org/10.5194/nhess-26-4201-2026-supplement.
L.C.: Conceptualization, Data curation, Formal analysis, Investigation, Methodology, Software, Visualization, Writing – original draft, Writing – review & editing. T.G: Conceptualization, Funding acquisition, Methodology, Project administration, Resources, Supervision, Validation, Writing – review & editing. J.N.: Supervision, Validation, Writing – review & editing. C.B.: Data curation. G.P.: Data curation.
The contact author has declared that none of the authors has any competing interests.
Publisher's note: Copernicus Publications remains neutral with regard to jurisdictional claims made in the text, published maps, institutional affiliations, or any other geographical representation in this paper. The authors bear the ultimate responsibility for providing appropriate place names. Views expressed in the text are those of the authors and do not necessarily reflect the views of the publisher.
This research project was supported by Québec's Ministère de la Sécurité Publique (MSP) under the FLUTEIS project (number CPS 18-19-26). We would also like to acknowledge the funding provided by a scholarship from the Fonds de recherche du Québec – Nature et Technologies (FRQNT) to the first author. Finally, we would like to thank Amandine Pierre, Éric Boucher, Christian Juneau, Clara Fruit and Ehab Zidan (Université Laval) as well as the Town of Saint-Raymond for their contribution to the field work, as well as Sean Boyd (Université Laval) for his contribution to the code development.
This research has been supported by Québec's Ministère de la Sécurité Publique (MSP) under the FLUTEIS project (grant no. CPS 18-19-26). The first author was additionally supported by a scholarship from the Fonds de recherche du Québec – Nature et Technologies (FRQNT) (grant no. 336101; https://doi.org/10.69777/336101, FRQNT, 2022).
This paper was edited by Andreas Günther and reviewed by Robert Ettema and one anonymous referee.
Beltaos, S.: River Ice Jams, Water Resources Publications, LLC, Highlands, United States of America, ISBN 978-0-918334-87-9, 1995.
Beltaos, S.: River ice breakup, Water Resources Publications, LLC, ISBN 978-1-887201-50-6, 2008.
Beltaos, S. and Prowse, T. D.: Climate impacts on extreme ice-jam events in Canadian rivers, Hydrol. Sci. J., 46, 157–181, https://doi.org/10.1061/(ASCE)0733-9429(2001)127:8(650), 2001.
Beltaos, S. and Tang, P.: Applying HEC-RAS to simulate river ice jams: snags and practical hints, CGU HS Committee on River Ice Processes and the Environment, Edmonton, Canada, 16 pp., https://cripe.ca/docs/beltaos-tang-2013-pdf (last access: 23 December 2025), 2013.
Beltaos, S., Carter, T., and Rowsell, R.: Measurements and analysis of ice breakup and jamming characteristics in the Mackenzie Delta, Canada, Cold Reg. Sci. Technol., 82, 110–123, https://doi.org/10.1016/j.coldregions.2012.05.013, 2012.
Bergeron, N. and Roy, A.: Les effets d'un embâcle sur la morphologie du lit d'une confluence de cours d'eau, Géogr. Phys. Quatern., 42, 191–196, https://doi.org/10.7202/032725ar, 1988.
Berti, Z., Nafziger, J., and Kovachis, N.: Challenges of Forecasting Extreme Ice-Jam Flood Events Using Machine Learning Models: A Case Study at Fort McMurray, 23rd Workshop on the Hydraulics of Ice Covered Rivers, St. John's, Canada, CRIPE, 12 pp., https://cripe.ca/docs/berti-et-al-2025-pdf (last access: 23 December 2025), 2025.
Best, J. L.: Sediment transport and bed morphology at river channel confluences, Sedimentology, 35, 481–498, https://doi.org/10.1111/j.1365-3091.1988.tb00999.x, 1988.
Beven, K.: A manifesto for the equifinality thesis, J. Hydrol., 320, 18–36, https://doi.org/10.1016/j.jhydrol.2005.07.007, 2006.
Bilello, M. A.: Maximum Thickness and Subsequent Decay of Lake, River and Fast Sea Ice in Canada and Alaska, Special Report 80-6, 160 pp., https://doi.org/10.18739/A2FF3M027, 1980.
Biron, P., Best, J. L., and Roy, A. G.: Effect of bed discordance on flow dynamics at open channel confluences, J. Hydraul. Eng., 122, 676–682, https://doi.org/10.1061/(ASCE)0733-9429(1996)122:12(676), 1996.
Biron, P., Boucher, E., Taha, W., Martel, J., and Fournier, A.: Comité expert visant à identifier des solutions porteuses pour la réduction de la vulnérabilité des risques liés à l'inondation par embâcles de glace sur la rivière Chaudière. Rapport Final, Ministère de l'Environnement, de la Lutte contre les changements climatiques, de la Faune et des Parcs, Québec, https://www.cubiq.ribg.gouv.qc.ca/notice?id=p%3A%3Ausmarcdef_0001246807&locale=fr (last access: 23 December 2025), 2020.
Blackburn, J., She, Y., Hicks, F., and Nafziger, J.: Ice effects on flow distributions in the Mackenzie Delta, 18th Workshop on the Hydraulics of Ice Covered Rivers, Québec City, Canada, CRIPE, https://cripe.ca/publications/proceedings/workshop-18 (last access: 23 December 2025), 2015.
Bonner, V. and Brunner, G.: Bridge Hydraulic Analysis with HEC-RAS, Hydrologic Engineering Center, US Army Corps of Engineers, Technical Paper No. 151, Davis, CA, 17 pp., https://babel.hathitrust.org/cgi/pt?id=uc1.31210024979765&seq=21 (last access: 23 December 2025), 1996.
Brayall, M. and Hicks, F. E.: Applicability of 2-D modeling for forecasting ice jam flood levels in the Hay River Delta, Canada, Can. J. Civil Eng., 39, 701–712, https://doi.org/10.1139/l2012-056, 2012.
Centre d'expertise hydrique du Québec (CEHQ): Direction de l'expertise hydrique, Banque de données hydriques (BDH), Ministère de l'Environnement et de la Lutte contre les changements climatiques, available at: https://www.cehq.gouv.qc.ca/atlas-hydroclimatique/stations-hydrometriques/index.htm (last access: 23 December 2025), 2025.
Chang, H. H.: Fluvial processes in river engineering, Wiley, New York, ISBN 0-89464-737-7, 1988.
Charbonneau, L., Blouin, C., and Ghobrial, T.: Field study of breakup dynamics at a river confluence: a case study on the Sainte-Anne River, Québec, 27th IAHR International Symposium on Ice, Book of Proceedings, Vol. 1, 79–91, Zenodo, https://doi.org/10.5281/zenodo.14507764, 2024.
Charbonneau, L., Ghobrial, T., and Nafziger, J.: Predicting ice jam formation at a confluence using hydraulic modelling and empirical relations: A case study on the Sainte-Anne River, Québec, 23rd Workshop on the Hydraulics of Ice Covered Rivers, St. John's, Canada, CRIPE, 16 pp., https://cripe.ca/docs/charbonneau-et-al-2025-pdf (last access: 23 December 2025), 2025.
Charbonneau, L., Ghobrial, T., Pelchat, G., and Blouin, C.: Winter Hydrometric and Ice Cover Monitoring Dataset for River Confluences on the Chaudière and Sainte-Anne Rivers, Québec, Canada (2020–2024), V1.1, Borealis [data set], https://doi.org/10.5683/SP4/QTWLIR, 2026.
De Munck, S., Gauthier, Y., Bernier, M., Poulin, J., and Chokmani, K.: Preliminary development of a geospatial model to estimate a river channel's predisposition to ice jams, CGU HS Committee on River Ice Processes and the Environment, Winnipeg, Canada, CRIPE, https://cripe.ca/publications/proceedings/workshop-16 (last access: 23 December 2025), 2011.
De Munck, S., Gauthier, Y., Bernier, M., Chokmani, K., and Légaré, S.: River predisposition to ice jams: a simplified geospatial model, Nat. Hazards Earth Syst. Sci., 17, 1033–1045, https://doi.org/10.5194/nhess-17-1033-2017, 2017.
Environment and Climate Change Canada (ECCC): Historical Data – Daily Data Report, https://climate.weather.gc.ca/climate_data/daily_data_e.html (last access: 23 December 2025), 2025.
Ettema, R. and Muste, M.: Laboratory observations of ice jams in channel confluences, J. Cold Reg. Eng., 15, 34–58, https://doi.org/10.1061/(ASCE)0887-381X(2001)15:1(34), 2001.
Ettema, R., Muste, M., and Kruger, A.: Ice jams in river confluences, CRREL Report 99-6, US Army Corps of Engineers, Cold Regions Research & Engineering Laboratory, 70 pp., https://apps.dtic.mil/sti/tr/pdf/ADA365480.pdf (last access: 23 December 2025), 1999.
Fonds de recherche du Québec – Nature et Technologies (FRQNT): Étude de l'effet des confluences de rivières sur la possibilité de formation des embâcles de glace, Bourses de maîtrise en recherche, grant no. 336101, https://doi.org/10.69777/336101, 2022.
Ghobrial, T., Pelchat, G., and Morse, B.: A comprehensive field investigation of the dynamic break-up processes on the Chaudière River, Québec, Canada, Hydrol. Res., 54, 797–817, https://doi.org/10.2166/nh.2023.137, 2023.
Google: Google Earth, https://earth.google.com (last access: 23 December 2025), 2025a.
Google: Google Maps, https://www.google.com/maps (last access: 23 December 2025), 2025b.
Hicks, F.: An overview of river ice problems: CRIPE07 guest editorial, Cold Reg. Sci. Technol., 55, 175–185, https://doi.org/10.1016/j.coldregions.2008.09.006, 2009.
ISAINT3307 Weather Underground: Personal Weather Station monthly data – ISAINT3307, https://www.wunderground.com/dashboard/pws/ISAINT3307 (last access: 23 December 2025), 2025.
Martel, N.: Analyse de la structure de l'écoulement à une confluence de cours d'eau en présence d'un couvert de glace, Mémoire, Université du Québec à Rimouski, Rimouski, Québec, Canada, https://semaphore.uqar.ca/id/eprint/1504/ (last access: 23 December 2025), 2019.
Massie, D. D., White, K. D., and Daly, S. F.: Application of neural networks to predict ice jam occurrence, Cold Reg. Sci. Technol., 35, 115–122, https://doi.org/10.1016/S0165-232X(02)00056-3, 2002.
McDonald, R., White, K. D., Daly, S. F., and Massie, D. D.: Implementation of an ice jam predictor with user interface, in: Proceedings of the 16th IAHR International Symposium on Ice, Dunedin, New Zealand, 220–227, https://www.iahr.org/library/infor?pid=19878 (last access: 23 December 2025), 2002.
Michel, B.: Properties and processes of river and lake ice, in: Proceedings of the IAHS Symposium on the Role of Snow and Ice in Hydrology, Banff, Alberta, 454–481, https://unesdoc.unesco.org/ark:/48223/pf0000009641 (last access: 23 December 2025), 1972.
Ministère de l'Environnement et de la Lutte contre les changements climatiques, de la Faune et des Parcs du Québec (MELCCFP): Daily climate summary, https://www.environnement.gouv.qc.ca/climat/donnees/sommaire.asp (last access: 23 December 2025), 2025.
Nafziger, J., She, Y., and Hicks, F.: Dynamic river ice processes in a river delta network, Cold Reg. Sci. Technol., 165, 275–287, https://doi.org/10.1016/j.coldregions.2018.09.005, 2019.
Ouranos: High water and flooding – Impacts, Ouranos Consortium on Regional Climatology and Adaptation to Climate Change, https://www.ouranos.ca/en/climate-phenomena/high-water-and-flooding-impacts (last access: 23 December 2025), 2023.
Pappenberger, F., Beven, K., Horritt, M. and Blazkova, S.: Uncertainty in the calibration of effective roughness parameters in HEC-RAS using inundation and downstream level observations, J. Hydrol., 302, 46–69, 2005.
Penna, N., De Marchis, M., Canelas, O. B., Napoli, E., Cardoso, A. H., and Gaudio, R.: Effect of the junction angle on turbulent flow at a hydraulic confluence, Water, 10, 469, https://doi.org/10.3390/w10040469, 2018.
Pourshahbaz, H., Ghobrial, T., and Shakibaeinia, A.: Field monitoring of river ice processes in the vicinity of ice control structures in the province of Quebec, Canada, Can. J. Civil Eng., 50, https://doi.org/10.1139/cjce-2023-0087, 2023.
Prowse, T. D.: Ice jam characteristics, Liard–Mackenzie Rivers confluence, Can. J. Civ. Eng., 13, 653–665, https://doi.org/10.1139/l86-100, 1986.
Rhoads, B. L.: The dynamics of river confluences, in: River Dynamics – Geomorphology to Support Management, Cambridge University Press, Cambridge, 269–293, https://doi.org/10.1017/9781108164108, 2020.
Rice, S. P., Roy, A. G., and Rhoads, B. L. (Eds.): River Confluences, Tributaries and the Fluvial Network, John Wiley & Sons, Chichester, UK, https://doi.org/10.1002/9780470760383, 2008.
Sentinel-HUB: EO Browser, Sinergise v1.21.1, Planet Labs Company, https://browser.dataspace.copernicus.eu/?zoom=5&lat=50.16282&lng=20.78613&demSource3D="MAPZEN"&cloudCoverage=30&dateMode=SINGLE (last access: 23 December 2025), 2025.
Trudel, M., Siles, G., Foucher, S., Biancamaria, S., Ghribi, T., and Mandeville, A.: Potential of the new satellite SWOT (Surface Water Ocean Topography) for monitoring lake and river ice, 23rd Workshop on the Hydraulics of Ice Covered Rivers, St. John's, Canada, CRIPE, 12 pp., https://cripe.ca/publications/proceedings/workshop-23 (last access: 23 December 2025), 2025.
Turcotte, B., Morse, B., and Anctil, F.: Cryologic continuum of a steep watershed, Hydrol. Process., 28, 809–822, https://doi.org/10.1002/hyp.9629, 2014.
Turcotte, B., Morse, B., and Pelchat, G.: Impact of climate change on the frequency of dynamic breakup events and on the risks of ice-jam floods in Québec, Canada, Water, 12, 2891, https://doi.org/10.3390/w12102891, 2020.
Turcotte, B., Pelchat, G., and Ghobrial, T.: Correction of the degree-day approach to take solar radiation into account in breakup forecast models, 23rd Workshop on the Hydraulics of Ice Covered Rivers, St. John's, Canada, CRIPE, 7 pp., https://cripe.ca/publications/proceedings/workshop-23 (last access: 23 December 2025), 2025.
Tuthill, A. and Mamone, A. C.: Selection of confluence sites with ice problems for structural solutions, CRREL Special Report 97-4, US Army Cold Regions Research and Engineering Laboratory, Hanover, NH, https://searchworks.stanford.edu/view/8421118 (last access: 23 December 2025), 1997.
US Army Corps of Engineers: HEC-RAS River Analysis System – HEC-RAS Release Notes 6.4.1, Hydrologic Engineering Center, https://www.hec.usace.army.mil/confluence/rasdocs/rasrn/6.4.1 (last access: 23 December 2025), 2025.
Zare, S. G., Moore, S. A., Rennie, C. D., Seidou, O., Ahmari, H., and Malenchak, J.: Boundary shear stress in an ice-covered river during breakup, J. Hydraul. Eng., 141, 04015017, https://doi.org/10.1061/(ASCE)HY.1943-7900.0001081, 2015.
Zhang, F., Mosaffa, M., Chu, T., and Lindenschmidt, K.-E.: Using remote sensing data to parameterize ice jam modeling for a northern inland delta, Remote Sens., 9, 306, https://doi.org/10.3390/w9050306, 2017.
- Abstract
- Introduction
- Study sites
- Field measurements
- Laboratory-derived equations for ice jam formations at confluences established by Ettema and Muste (2001)
- Hydraulic modeling
- Description of breakup dynamics
- Comparison to laboratory-derived formulations
- Discussion
- Conclusions
- Appendix A: List of Symbols
- Appendix B: List of Abbreviations
- Code availability
- Data availability
- Video supplement
- Author contributions
- Competing interests
- Disclaimer
- Acknowledgements
- Financial support
- Review statement
- References
- Supplement
- Abstract
- Introduction
- Study sites
- Field measurements
- Laboratory-derived equations for ice jam formations at confluences established by Ettema and Muste (2001)
- Hydraulic modeling
- Description of breakup dynamics
- Comparison to laboratory-derived formulations
- Discussion
- Conclusions
- Appendix A: List of Symbols
- Appendix B: List of Abbreviations
- Code availability
- Data availability
- Video supplement
- Author contributions
- Competing interests
- Disclaimer
- Acknowledgements
- Financial support
- Review statement
- References
- Supplement