the Creative Commons Attribution 4.0 License.
the Creative Commons Attribution 4.0 License.
 | 10 Jun 2026
Consistency of seismic hazard estimates from a physics-based earthquake simulator: a case study in south-eastern Spain
Octavi Gómez-Novell
Francesco Visini
Paula Herrero-Barbero
José A. Álvarez-Gómez
Julián García-Mayordomo
Estimating seismic hazard is crucial for enhancing societal resilience and risk mitigation strategies. Probabilistic Seismic Hazard Analysis (PSHA) is the current standard framework, traditionally relying on empirical earthquake rupture forecasts (ERFs) and ground-motion models. In this framework, physics-based earthquake cycle simulators are emerging as powerful tools in PSHA, capable of replicating observed seismicity and seismic hazard statistics. Here, we present a quantitative consistency evaluation of physics-based PSHA models at the Eastern Betic Shear Zone in south-eastern Spain against both historical macroseismic intensity data and instrumental ground shaking records. We use synthetic catalogues from RSQSim earthquake-cycle simulations to construct two physics-based ERFs that we pipeline into a PSHA calculation. Results indicate that the physics-based ERFs derived from the best-performing simulation model, previously ranked against empirical benchmarks, achieve the best overall agreement with observed macroseismic intensities and acceleration records at 10 sites, outperforming both the lower-performing simulation and a traditional area-source model. Our findings highlight that the incorporation of physics-based models into PSHA is appropriate, inherently enabling the inclusion of fault-system rupture complexity and interactions, all key challenges in PSHA. We also advocate for the hybridization of physics-based models with traditional approaches in PSHA to better capture epistemic uncertainties in the hazard representation.
- Article
(11329 KB) - Full-text XML
-
Supplement
(3286 KB) - BibTeX
- EndNote


Estimating seismic hazard is essential for enhancing societal resilience, guiding building codes, informing insurance companies and supporting risk assessments and public policies aimed at mitigating earthquake impacts. Probabilistic seismic hazard analysis (PSHA), formalized by the efforts of Cornell (1968) and Esteva (1967, 1968), remains the current standard framework. PSHA combines an earthquake rupture forecast (ERF) with empirical ground-motion models (GMMs) to estimate the probability of exceeding different shaking intensity measures. Commonly, an ERF is made of two components: a distributed seismicity model, or area source model, describing the occurrence of earthquakes not associated with well-identified fault sources, and a fault source model when sufficient information for fault characterization is available (e.g., Gerstenberger et al., 2020; Visini et al., 2021; Danciu et al., 2024).
The use of active faults in PSHA is well-established in high-strain regions such as California (Field et al., 2014), the Marmara Region in Turkey (e.g., Chartier et al., 2021), and New Zealand (Gerstenberger et al., 2024). Fault-based models have also been applied successfully in moderate-to-low strain areas like, e.g., south-eastern Spain, Italy, France, and Malawi (e.g., García-Mayordomo et al., 2007; Scotti et al., 2014; Gómez-Novell et al., 2020; Valentini et al., 2017; Rivas-Medina et al., 2018; Williams et al., 2023). One of the advantages of considering fault sources is the incorporation of long-term fault-slip rates, which provide insights into the seismic moment release over multiple seismic cycles and help avoid biases arising from short-term variability. These rates are directly linked to earthquake recurrence through geological moment accumulation (Brune, 1968). Another key advantage is that fault-based models allow for a more precise representation of the spatial distribution of the seismic hazard along active fault structures, mitigating smoothing effects of distributed sources that might return less accurate seismic hazard estimates.
Conventional empirical fault-based PSHA models, often assume uniform seismic release on faults, as well as fault source independence during ruptures. Geological observations, however, reveal pronounced spatial on-fault variability in ruptures and, thus, heterogeneity in the seismic release (e.g., Hergert and Heidbach, 2010; Reitman et al., 2022; Roberts, 2007), often controlled by factors such as fault geometry, stress interaction or off-fault damage (e.g., Cappa et al., 2014; Iezzi et al., 2018; Nicol et al., 1996). All of these features, strongly influence earthquake recurrence and ground shaking estimates (e.g., Cowie et al., 2012; Faure Walker et al., 2019; Wang and Barbot, 2024; Rodríguez Piceda et al., 2025). In addition, observations show that faults do not always rupture independently; instead, multi-fault ruptures frequently occur in large earthquakes, as exemplified by the 1992 Mw 7.1 Landers, 2002 Mw 7.9 Denali, and 2016 Mw 7.8 Kaikōura earthquakes.
Modern fault-based PSHA models now accommodate multi-fault ruptures, as their consideration allows for more accurate representations of the seismic hazard. The Uniform California Earthquake Rupture Forecast (UCERF3; Field et al., 2014), followed by the 2022 Aotearoa New Zealand National Seismic Hazard Model (Gerstenberger et al., 2024), pioneered a new methodology by exploring all plausible fault section-to-section ruptures (multi-fault ruptures), moving beyond more classical rigid segmentation approaches, and allowing for more accurate representations of fault system behavior in PSHA. Similarly, Visini et al. (2020) compared alternative approaches for modeling multi-fault ruptures in PSHA and demonstrated that incorporating finite-to-finite ruptures and spatial slip-rate variability significantly affects hazard estimates, further emphasizing the importance of accounting for fault-system complexity.
All the same, PSHA still faces several challenges nowadays. First, instrumental, historical and geological datasets are yet incomplete in most regions due to short observational time windows of seismicity catalogues (e.g., Mohammed et al., 2014), uncertainties and biases in magnitude estimates of historical seismicity (e.g., Rong et al., 2011), and dating uncertainties in geology that hamper from a good chronological control of pre-historic seismicity (Gómez-Novell et al., 2023) and can strongly affect important seismic hazard metrics like recurrence (e.g., Kempf and Moernaut, 2021; Lombardi et al., 2025). Second, the incorporation of true physics-based parameters such as fault geometry and friction into the ERFs is not resolved, yet widely known to control earthquake occurrence, fault rupture interaction and their evolution over the seismic cycle. Currently, definitions of fault rupture connectivity in PSHA are achieved by establishing ad-hoc empirical rupture plausibility filters that are based on the analyses of fault system physical features, such as fault geometric configurations, Coulomb stress compatibility and, recently, criteria observed from earthquake cycle simulations (e.g., Milner et al., 2022).
As a response to these challenges, physics-based earthquake cycle modeling is emerging as a powerful complementary tool for seismic hazard assessment (e.g., Rafiei et al., 2022, in Alborz, Khodaverdian et al., 2016, in NW Iran, or the work by Shaw et al., 2018, in the US). These earthquake simulators inherently account for fault friction and stress interactions to model the physical processes governing earthquake rupture. This allows them to reproduce the spatiotemporal patterns of slip variability within fault systems and multi-fault interactions without requiring these behaviours to be predefined as inputs. Also, these models can contribute to overcoming completeness limitations of seismic catalogues, especially in regions of low seismicity or scarce records.
Published studies demonstrate that in many regions of active faulting the magnitude-frequency distributions of simulated earthquakes are comparable to the ones obtained with historical and instrumental earthquakes (e.g., Herrero-Barbero et al., 2021; Shaw et al., 2022), while simulated spatiotemporal rupture patterns are consistent with paleoseismic observations (e.g., Howarth et al., 2021). This agreement supports the use of earthquake cycle simulators to inform both seismicity models and seismic hazard parameters (Delogkos et al., 2023). One paradigmatic milestone is the work by Shaw et al. (2018), which demonstrated that RSQSim reproduces hazard statistics in California consistently with UCERF3 hazard estimates. Other studies have expanded applications to national scale seismic hazard assessments in New Zealand (Niroula et al., 2025), non-ergodic PSHA frameworks (Milner et al., 2021) or logic-tree weighting (Chartier et al., 2021). Despite this, efforts to validate the performance of seismic hazard estimates from physics-based simulators against independent observations are still largely needed for their proper implementation into real-world hazard applications.
In this work, we use synthetic earthquake catalogues from published multi-cycle simulations for the Eastern Betic Shear Zone (EBSZ), a low-to-moderate strain active fault system in southern Spain (Fig. 1). We pipeline simulated ruptures into PSHA models for the region using a GMM. We then evaluate the predictive performance of these physics-based PSHA models against both historical macroseismic intensity data and instrumental ground shaking records. Figure 2 illustrates the workflow from simulated rupture sets to PSHA and model testing: a pipeline of simulated earthquake ruptures into PSHA and a consistency testing approach.
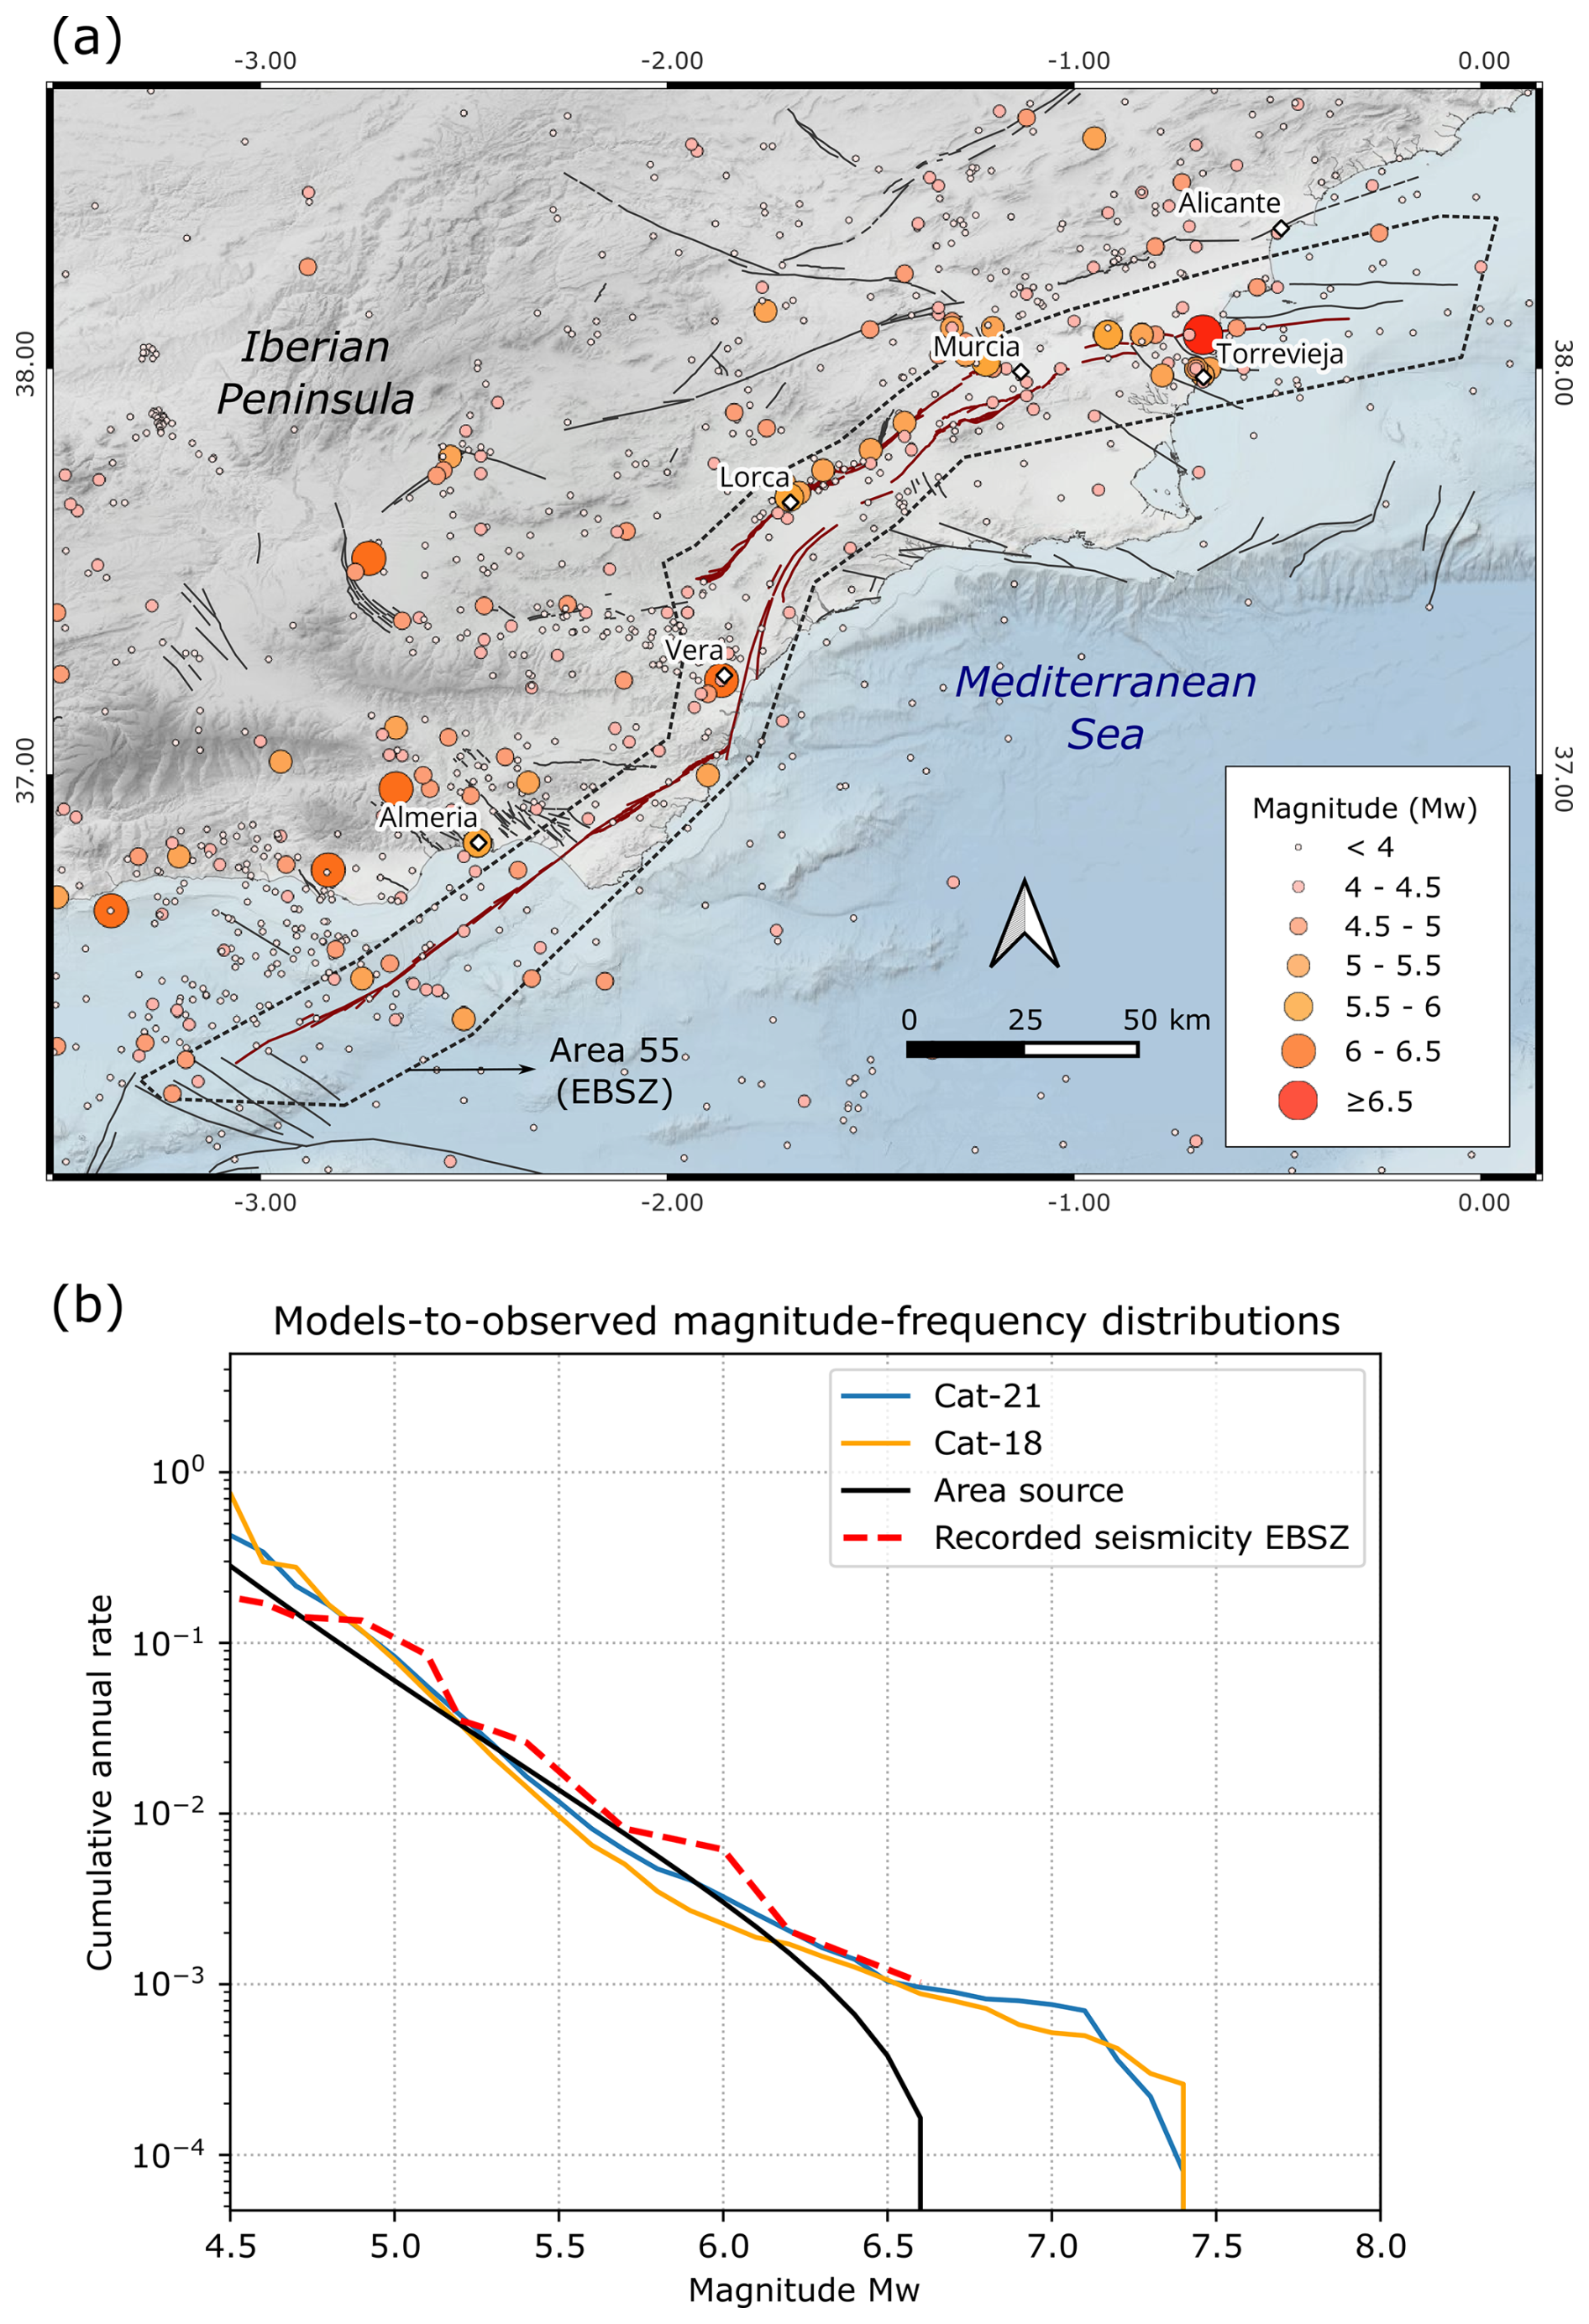
Figure 1(a) Map location of the Eastern Betic Shear Zone and seismicity from the IGN (2025) seismic catalogue, comprising from year 1048 to 2025. Fault traces are from the QAFI v4 database (IGME, 2022) and area source 55 from the ZESIS database (IGME, 2015). (b) Magnitude-frequency distributions (MFDs) for the two synthetic physics-based earthquake catalogues explored in this study (Cat-21 and Cat-18 from Herrero-Barbero et al., 2021) and for the area source 55 posterior to re-cluster correction (see text for details). Model MFDs are compared with the earthquake rates computed from the EBSZ zone instrumental and historical catalogue, covering the 1048–2022 period (Pascual-Sánchez et al., 2023).
Our main objectives with this study are to: (i) test the agreement of seismic hazard estimates from physics-based ERFs with observations in SE Spain, (ii) evaluate the performance of physics-based approaches over more traditional empirical methods in PSHA, and (iii) discuss the potential impact of simulated models for next generation seismic hazard assessments, particularly in low-to-moderate strain regions.
To our knowledge, this study represents one of the first attempts to evaluate consistency of physics-based PSHA against observations in Europe, offering a potential step forward for the integration of simulation-based approaches into the future of seismic hazard assessment, not only in Europe, but in a worldwide context. The results presented in this study are encouraging and highlight the potential of physics-based earthquake cycle models as a robust and viable alternative in the suite of fault-based approaches for PSHA. In this line, physics-based based models can also be relevant to explore the high-impact, low-probability events, as they can have severe consequences in a region and require efficient decision-making strategies under uncertainty.
While the modeling framework could be further enhanced by incorporating additional components, such as novel simulators like MCQSim (Zielke and Mai, 2023) or advanced physics-based ground motion models like CyberShake (Graves et al., 2011), this work represents a first systematic attempt to evaluate consistency of PSHA outcomes from an earthquake simulator against empirical observations, supporting the continued development and application of such approaches in seismic hazard analysis.
The methodological core of this work consists of two steps (Fig. 2). First, we develop a method that pipelines RSQSim earthquake cycle simulation outputs into seismic hazard calculations. Second, we perform a quantitative consistency analysis of the simulation-based seismic hazard statistics with macroseismic and instrumental observations. We deploy this approach in southern Spain to test the applicability and consistency of physics-based models for PSHA in any adapted framework. The method is generalizable to any output of physics-based earthquake cycle simulators, not only RSQSim.
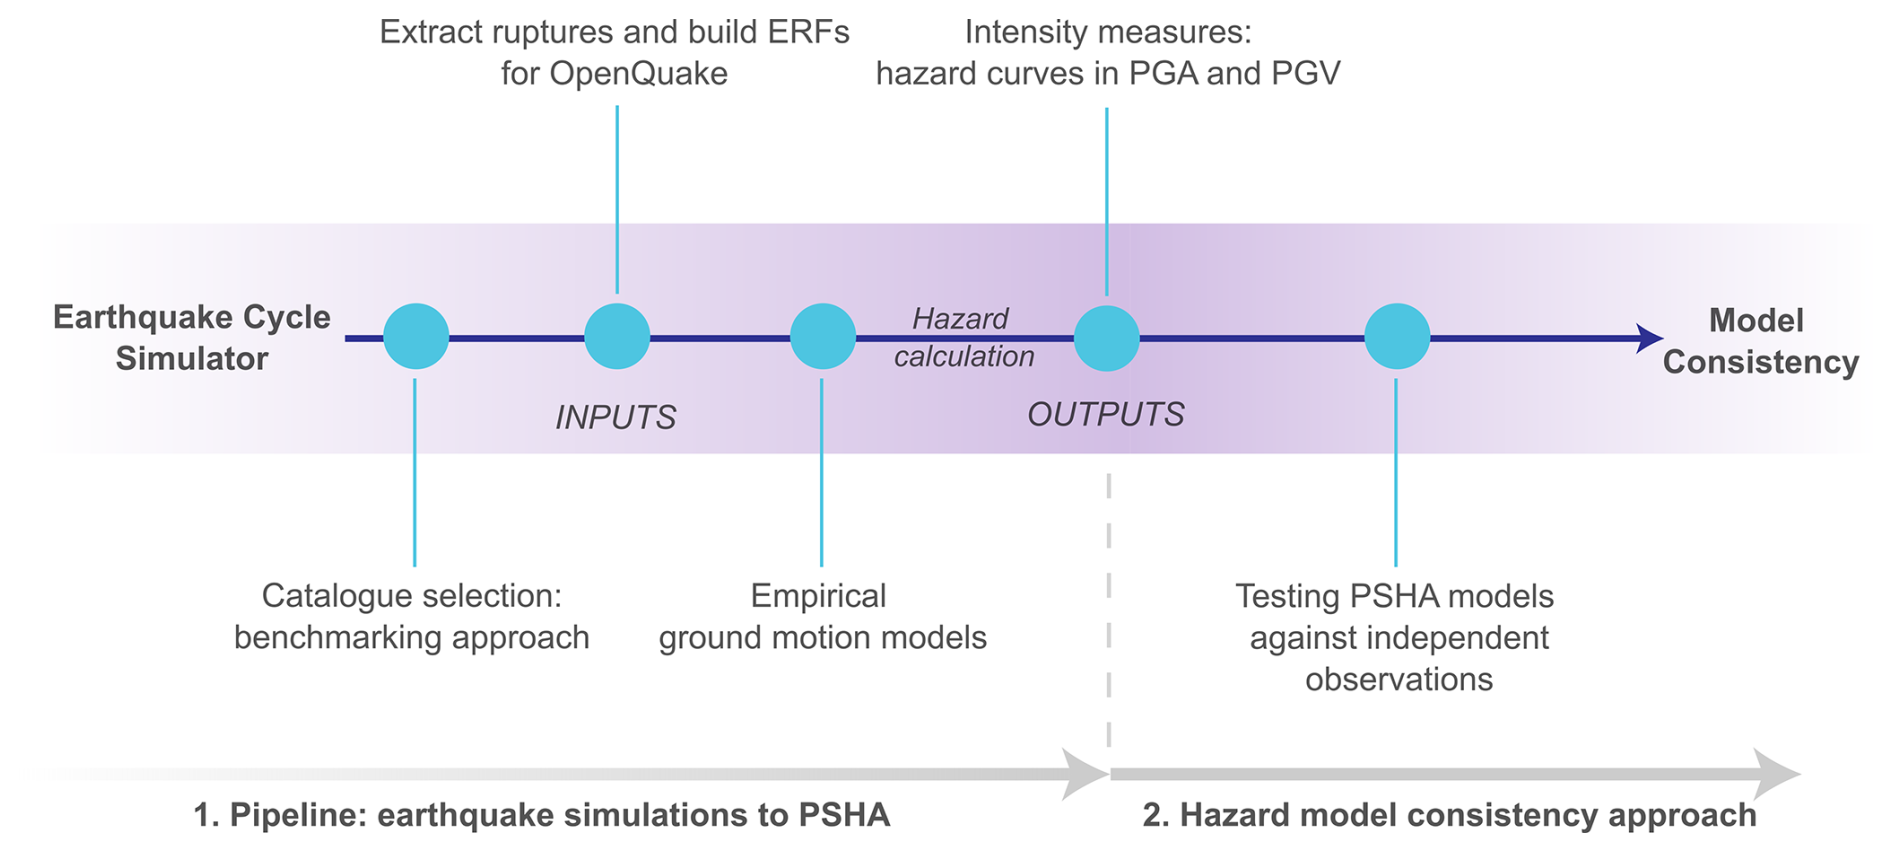
Figure 2Workflow of this study. This study combines a multicycle earthquake rupture simulator with empirical ground motion models. Probabilistic seismic hazard outputs are compared against macroseismic and instrumental observations.
2.1 The RSQSim simulator
RSQSim is a boundary element model developed by Richards-Dinger and Dieterich (2012) and based on the rate-and-state friction law introduced by Dieterich (1979). RSQSim incorporates four primary approximations to elasto-dynamics: (1) the seismic cycle is defined by three states: healing, nucleation and seismic rupture; (2) stress interactions between elements are quasi-static and elastic, neglecting dynamic stress transfer; (3) seismic sliding occurs at a fixed slip rate; and (4) the seismic rupture is resolved by using a quasi-dynamic approximation. These simplifications enable a computationally efficient simulation of long seismic sequences by allowing adaptive time stepping only during state changes, significantly reducing computational cost. Although RSQSim is not equivalent to fully dynamic models, previous studies (e.g., Richards-Dinger and Dieterich, 2012) show that it can reproduce key features of earthquake physics, including clustering and delayed nucleation, yielding realistic emergent seismic sequences.
2.2 The Eastern Betic Shear Zone fault model and RSQSim catalogues
For our study, we use the synthetic RSQSim catalogues of the Eastern Betic Shear Zone (EBSZ) from Herrero-Barbero et al. (2021). The EBSZ (Fig. 1) is an active fault system located at the Eastern Betic Cordillera of the south-eastern Iberian Peninsula. The fault system represents the onshore continuation of the Trans-Alboran Shear Zone (De Larouzière et al., 1988) and it is primarily composed of strike-slip faults, many of which also exhibit reverse slip component.
2.2.1 Fault model
The EBSZ, as modeled by Herrero-Barbero et al. (2021), consists of six main seismogenic faults. This fault system extends over approximately 400 km and comprises 16 oblique-reverse, left-lateral strike-slip fault segments, with seismogenic depths ranging between 8 and 12 km (Fig. 3). The Herrero-Barbero et al. (2021) model depicts the geometric characteristics of the EBSZ faults along strike and in the down-dip direction, based on the main geometrical and segmentation characteristics compiled in the Quaternary Active Faults Database of Iberia – QAFI – database (IGME, 2022; García-Mayordomo et al., 2017). Fault segmentation within the EBSZ is mainly constrained by fault zone geometry, seismicity patterns, and variations in the hanging wall topography, while seismogenic crustal depths are consistent with seismotectonic studies from south-eastern Spain (Herrero-Barbero et al., 2021).
For modeling purposes, the faults were simplified from the QAFI database to a single fault trace, smoothing out small-scale complexities such as secondary branches, relay zones, and horsetail splays, while preserving first-order along-strike bends and variations in dip angle at depth, as these are relevant for the overall fault geometry at the scale of the simulation. Fault surfaces are discretized into triangular elements of ∼1 km2. Geological fault slip rates and kinematics (rake angle) are assigned uniformly to the faults' surfaces based on published literature data available for each one of the faults. Detailed information on fault geometries, slip rates, and rake assigned to each fault can be found in Herrero-Barbero et al. (2021).
2.2.2 Synthetic catalogues and model selection
The first step of our approach is model selection (Fig. 2). For our analysis, we select two of the eleven RSQSim synthetic earthquake catalogues computed by Herrero-Barbero et al. (2021): Cat-21 and Cat-18 (Fig. 1b). These two catalogues correspond to the best and worst performing models, respectively, in the benchmark analysis by Gómez-Novell et al. (2025a). This study proposes a ranking scheme based on how well each catalogue matches four reference metrics that are applied to the EBSZ: rupture area-magnitude and average displacement-magnitude scaling laws, agreement with a target magnitude-frequency distribution (MFD), with b value=1.0, and consistency with paleoearthquake data. We select these end-member models of the EBSZ benchmarking ranks to: (i) evaluate sensitivity of results to proper model selection, and (ii) propose a performance-based model weighting scheme for epistemic uncertainty exploration in PSHA, hypothesizing that all models pass our statistical tests.
The models share the same fault system model but have different frictional input parameters, namely initial normal and shear stresses, and a–b coefficients of the rate and state law (Table 1). In terms of initial normal stress, Cat-21 considers an increasing normal stress gradient of 20 MPa km−1 with depth following a lithostatic overburden stress profile, while Cat-18 considers a constant 140 MPa normal stress (Table 1). Initial shear stress is assumed constant at 60 MPa for both models. It is important to consider that, in the simulations, shear stress tends to evolve in relation to the normal stress, particularly during the spin-up phase – i.e., the phase where stress conditions evolve from the initial conditions into an internally-consistent stress regime. That is, even if a constant initial shear stress is paired with a depth-variable normal stress, the shear stress ends up evolving into a depth dependent profile (Mika Liao et al., 2024). In terms of friction, the a and b coefficients of the rate-and-state law used come from experimental rock studies at the EBSZ (Niemeijer and Vissers, 2014; Rodríguez-Escudero, 2017). The rest of input parameters, including slip speed, reference slip speed, state variable and characteristic slip distance, are default inputs in RSQSim (Herrero-Barbero et al., 2021).
Table 1Input parameters of the selected RSQSim models from Herrero-Barbero et al. (2021) at the Eastern Betic Shear Zone.
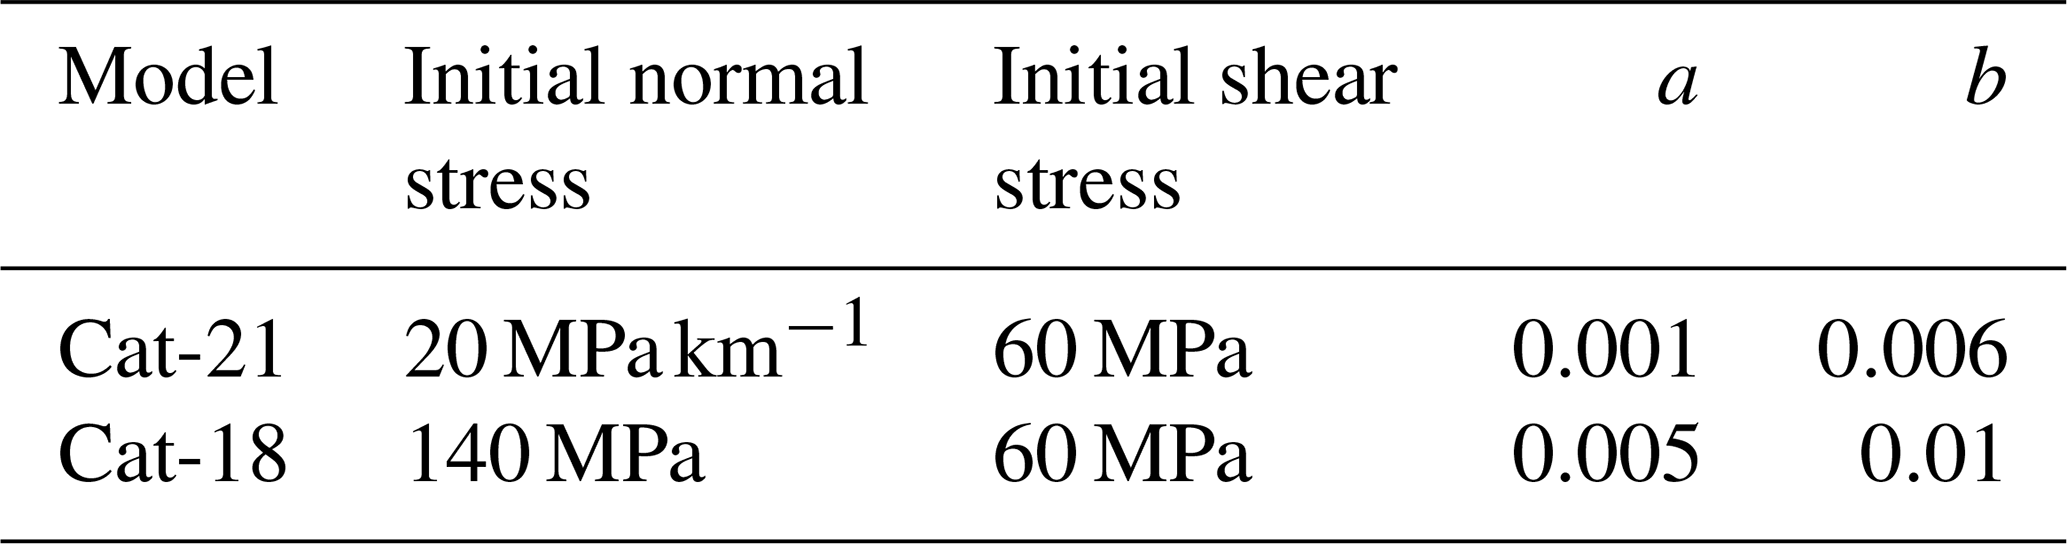
Both catalogues are 100 kyr long with earthquakes of Mw>4. For each catalogue we discard the first 10 kyr to ensure that the modeling has diverged from its initial conditions (spin-up phase) and that the seismic cycle is stable and the model conditions have reached internal consistency. We then analyse the following 50 kyr of ruptures from each catalogue. The catalogue duration is determined after a sensitivity analysis on earthquake recurrence variability (see Fig. S1), which demonstrates that 50 kyr-long sub-catalogues are enough to produce stable earthquake rates and inter-event times compared to the whole 100 kyr catalogue. Such a shorter rupture catalogue also reduces computational demand on the subsequent hazard models without impacting the hazard estimates.
As shown in Fig. 1b, the MFDs of the selected simulation models (Cat-21 and Cat-18) show relatively good agreement with the recorded instrumental and historical rates for the 1048–2022 period (IGN, 2022; Pascual-Sánchez et al., 2023). The recorded seismicity reaches magnitudes up to Mw 6.7 (Fig. 1b), while the simulated catalogues allow to extend magnitudes to Mw 7.4, more consistent with fault geological estimates in the region (e.g., paleoseismic studies).
2.3 Pipeline to integrate simulated earthquake ruptures into probabilistic seismic hazard assessment
For each simulated catalogue (Cat-21 and Cat-18), we consider synthetic earthquakes of Mw≥5.5 consistent with regional practices and to ensure that we capture only fault-related seismicity relevant to the hazard modeling, as smaller magnitudes are more likely to happen also outside the faults considered here. It is a common practice in PSHA to adopt a magnitude threshold to distinguish earthquakes associated with identified faults from those attributed to background (or distributed) seismogenic sources. This approach aims to ensure the completeness and consistency of the fault-related seismic catalogue. For instance, Gómez-Novell et al. (2020) adopt a threshold magnitude of Mw 4 for the EBSZ, while Valentini et al. (2017) apply a Mw 5.5 threshold for the Italian territory. In Europe, Danciu et al. (2024) use a higher threshold of Mw 6.0, while in models such as UCERF and those applied in New Zealand (e.g., Stirling et al., 2012), this threshold is often set to Mw 7.0.
Instead of using the simulated earthquake ruptures to assign occurrence rates to specific faults as in classical seismic hazard, we consider the three-dimensional geometry of each one of the ruptures in the simulated catalogues to construct the source models for the earthquake rupture forecasts (ERFs). This facilitates to capture the inherent spatial complexities and patterns of earthquake ruptures within the EBSZ system and propagate them to the hazard. Our approach follows that introduced by Shaw et al. (2018) to integrate RSQSim ruptures into PSHA calculations in California or Niroula et al. (2025) in New Zealand.
The rupture outputs generated by RSQSim, as well as by other boundary-element simulators such as MCQSim, consist of a list of fault elements, often triangular, involved in individual earthquake events. As such, for each simulated rupture we extract the grid of barycentres of the triangular fault elements activated. In Fig. 3b, we show some examples of ruptures for the Cat-21 model, whereas videos showing the rupture occurrence along the EBSZ in the 50 kyr-long simulations for both Cat-21 and Cat-18 are available at the Zenodo repository (Gómez-Novell et al., 2025b). Each rupture grid is incorporated into a source model as a characteristic source and following the “Gridded Surface” representation in OpenQuake (Pagani et al., 2014; OpenQuake Documentation), where individual fault ruptures are represented as a mesh of geo-spatially located points forming a discrete surface. Each rupture is assigned an annual occurrence rate of the inverse of the temporal length of the catalogue (50 kyr), hence . The full stack of Gridded Surfaces for both catalogues (Cat-21 and Cat-18), considering their corresponding spatial extensions, magnitudes, rake and annual occurrence rates, directly constitute the ERFs that are used by OpenQuake to compute the seismic hazard. With this formulation, the calculations do not lose or alter information from the simulations. For one, complex rupture geometries are preserved in the hazard as each simulated rupture is treated as a unique grid source. For another, while each rupture has a single occurrence on the catalogue, similar ruptures occur in the simulations and, ultimately, the stack of all rupture occurrences determines the rates at the fault system level, exactly as emerging from the simulated catalogues.
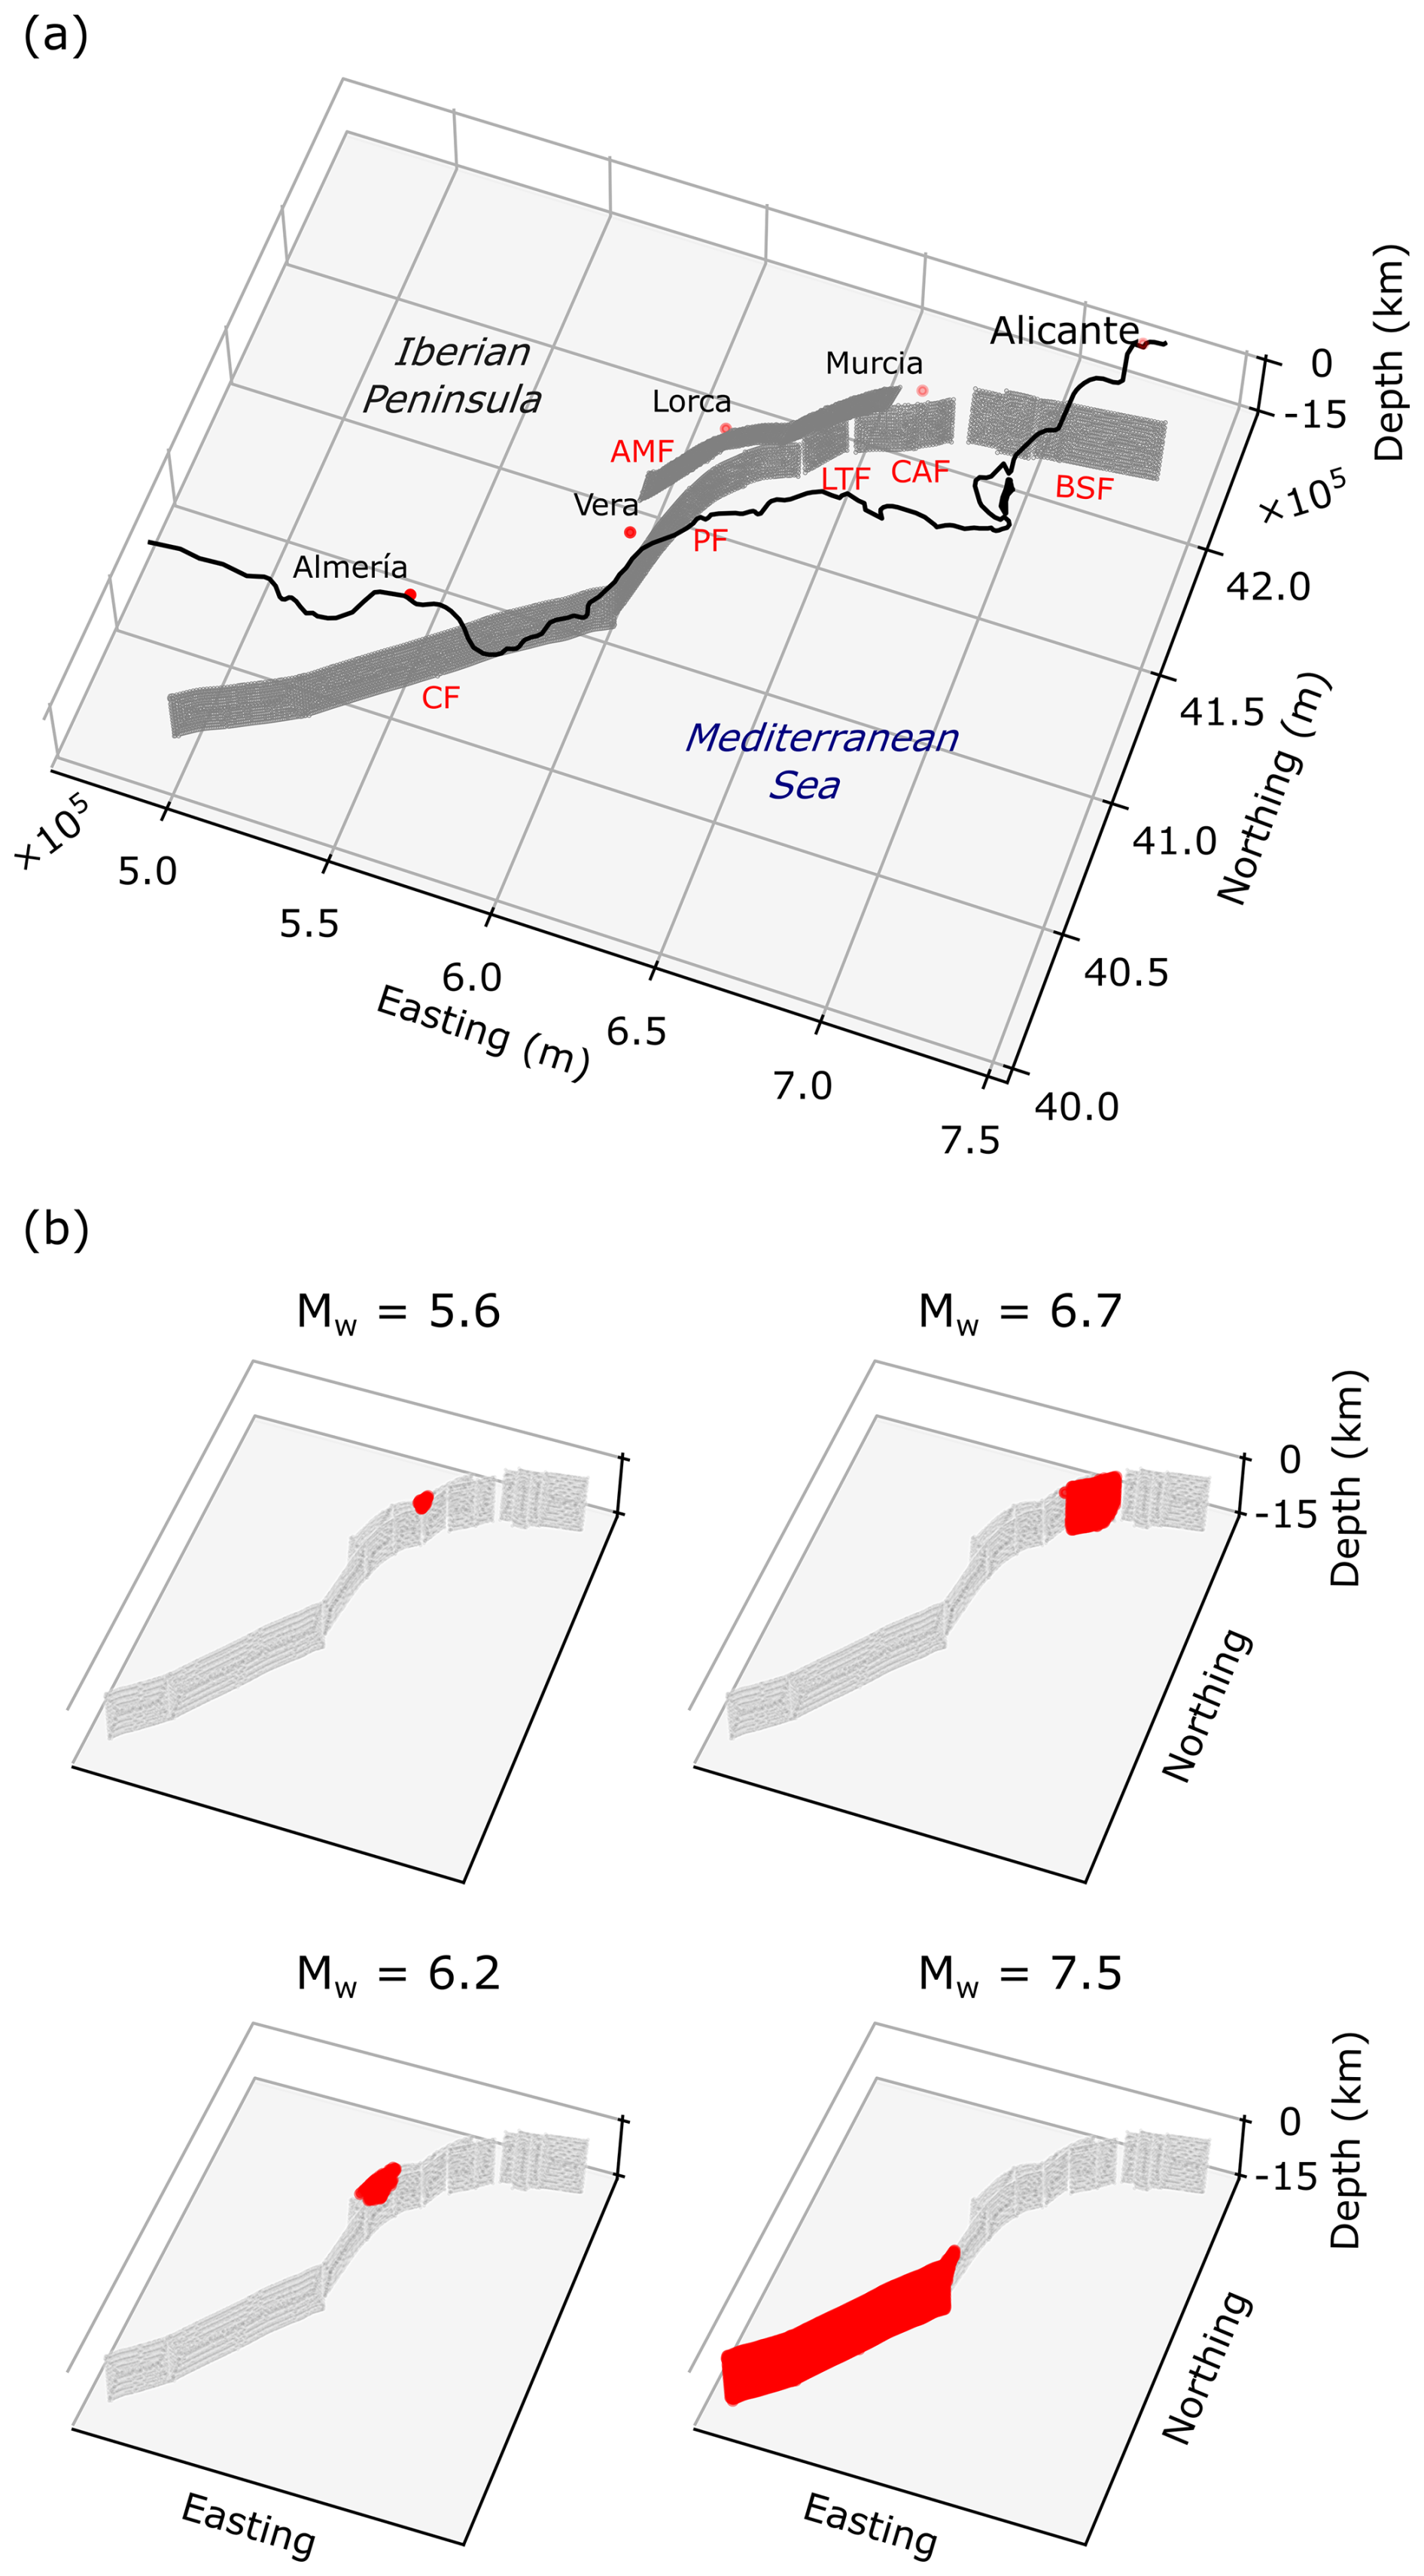
Figure 3(a) Scheme of the Eastern Betic Shear Zone (EBSZ) fault model. AMF, Alhama de Murcia fault; BSF, Bajo Segura fault; CAF, Carrascoy fault; CF, Carboneras fault; LTF, Los Tollos fault; PF, Palomares fault. See Herrero-Barbero et al. (2021) for fault parameter details. (b) Four examples of earthquake ruptures for four different magnitudes. The red areas are the barycentres of the patches of the triangular mesh involved in each rupture.
Because the temporal distribution of ruptures directly affects the fitness of time-independency assumptions in PSHA, we first evaluated whether the simulated catalogues can be treated as time-independent. Given that the simulated catalogues used are not declustered, we investigated the plausibility of constructing time-independent ERFs by testing the temporal distribution of simulated ruptures against the null hypothesis of a Poisson process. To this aim, we employed the Kolmogorov–Smirnov (KS) test to evaluate the statistical agreement between the empirical distribution of rupture occurrences and the theoretical cumulative distribution function (CDF) of a Poisson process, following the formulation adopted in the European Seismic Hazard Model 2020 (Danciu et al., 2021, 2024). Specifically, we computed the maximum distance between the empirical CDF of simulated rupture times and the idealized Poisson CDF expected from a uniformly distributed dataset. This distance was then compared to a reference distribution of distances generated from synthetic random datasets drawn from a uniform distribution over the same time window of the simulated ruptures (Fig. 4). The null hypothesis of temporal uniformity is accepted or rejected based on a 95 % confidence level.
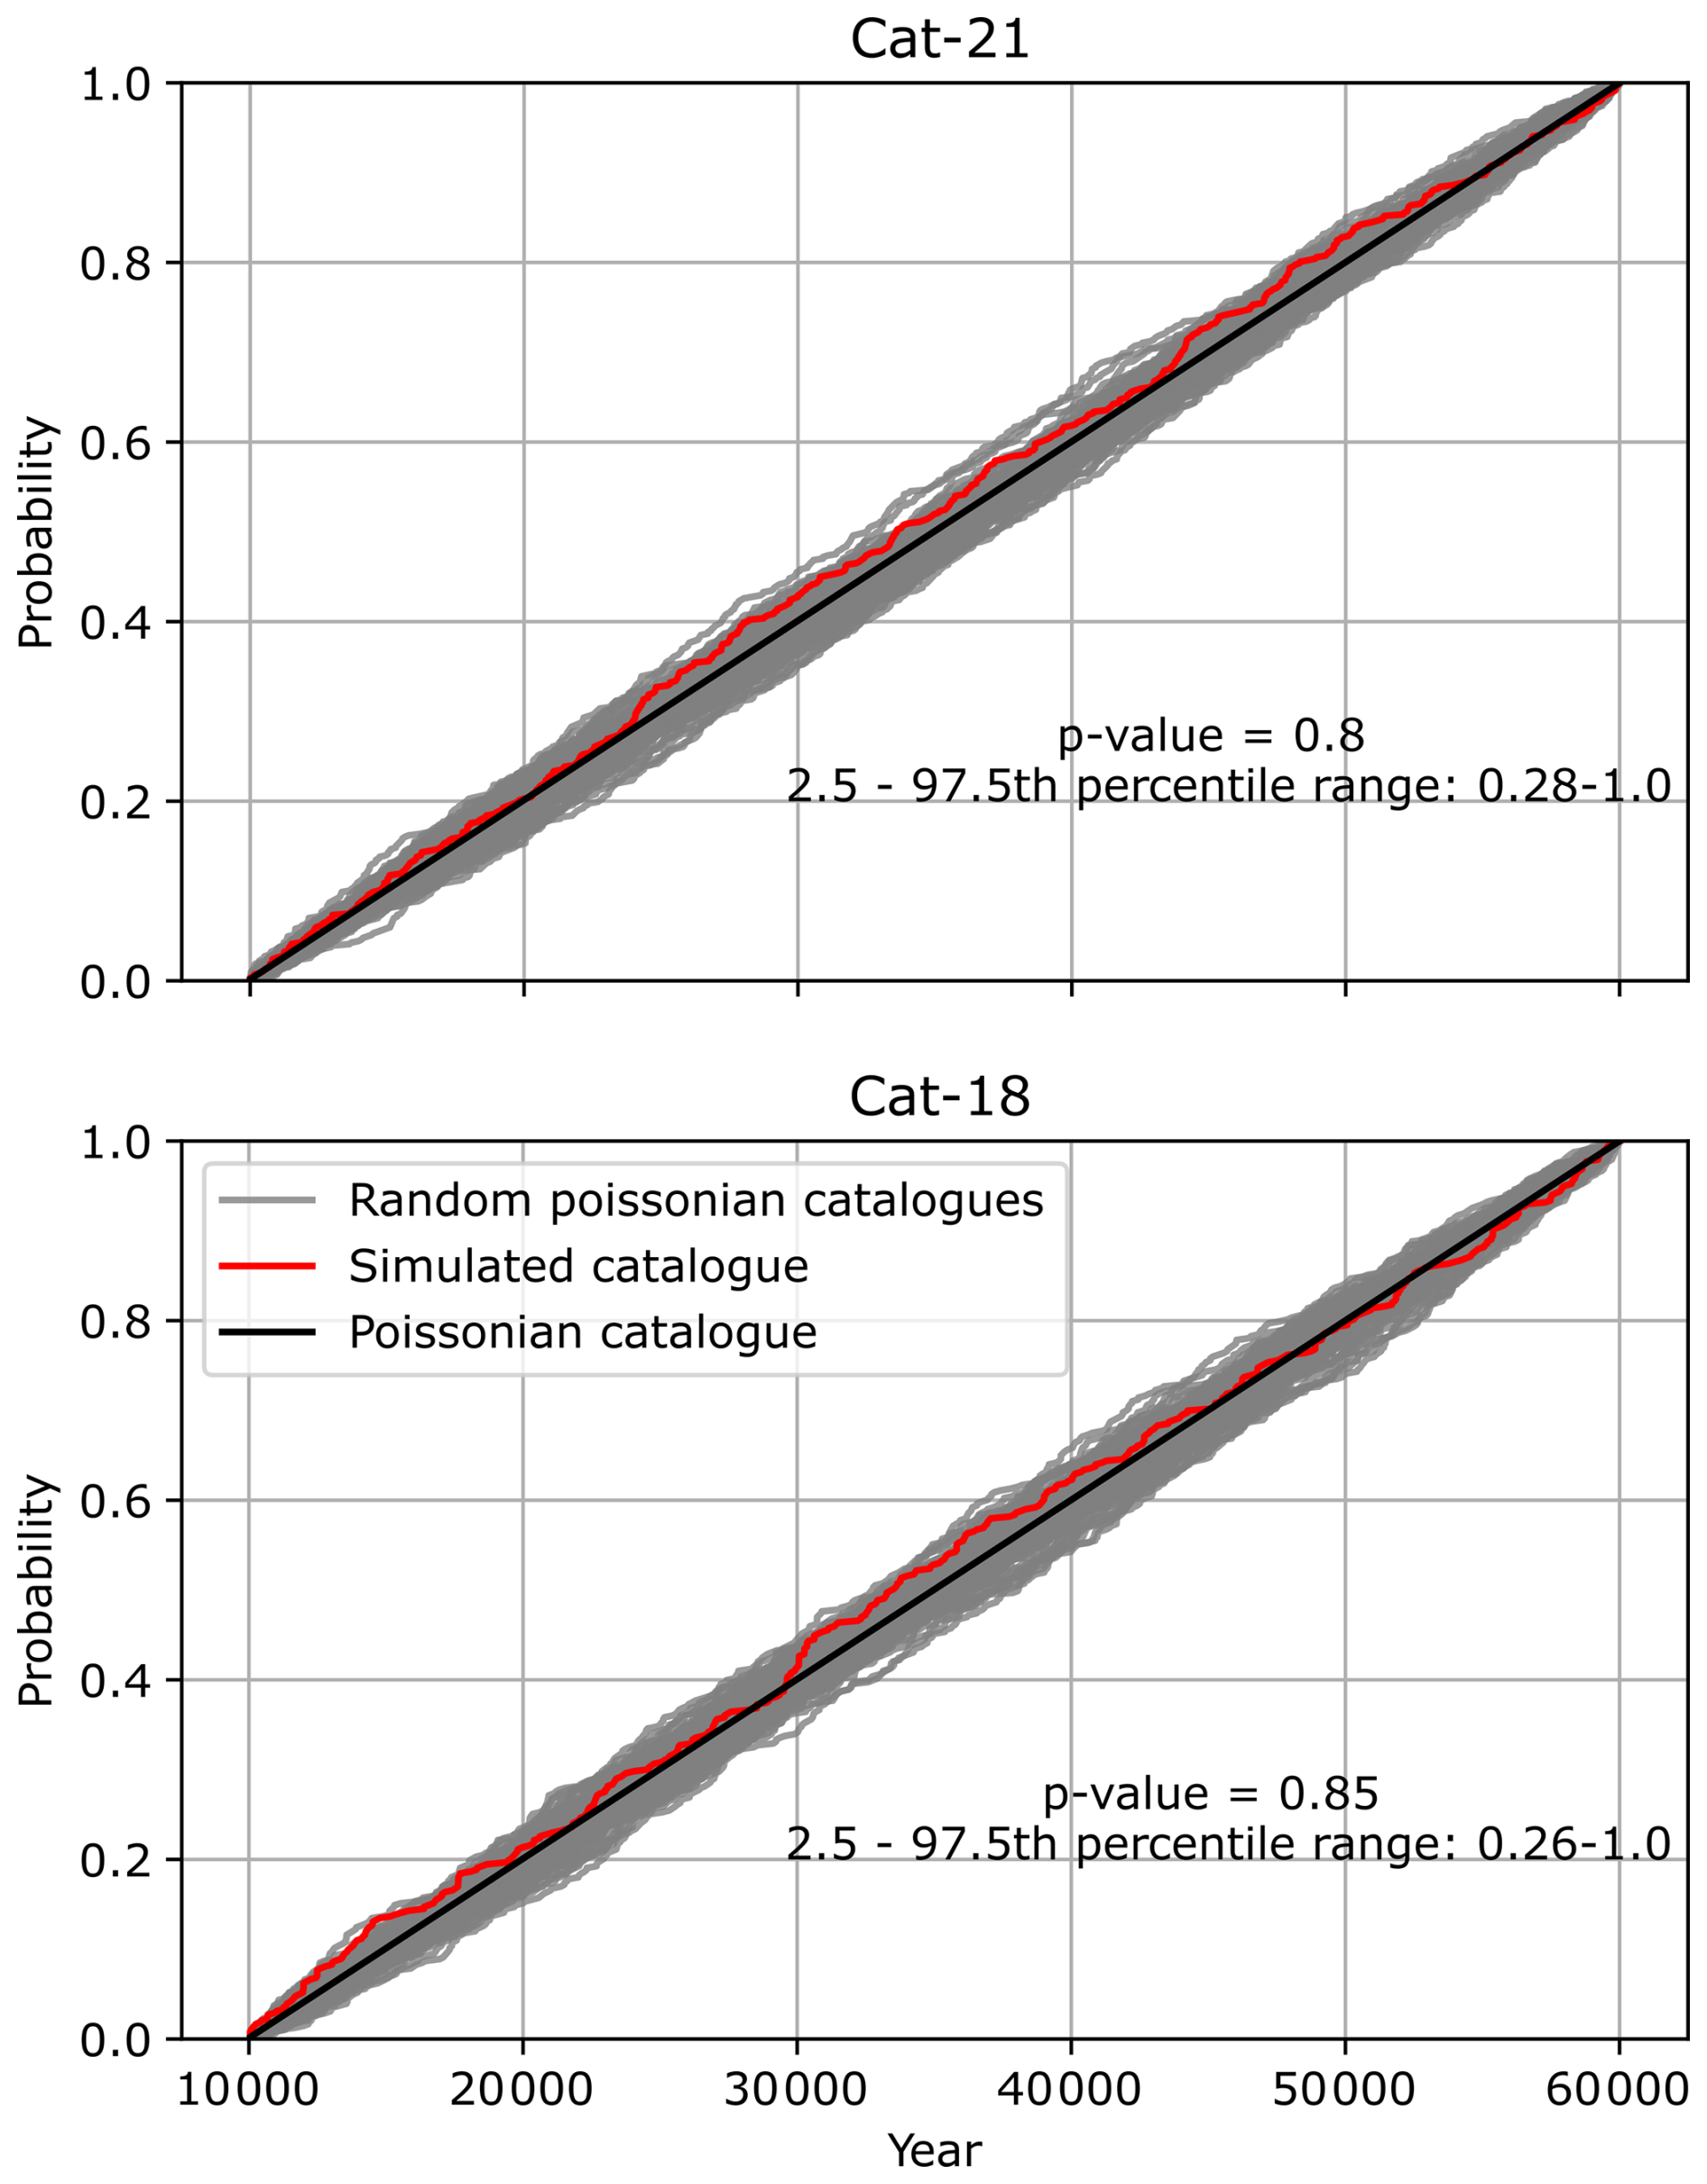
Figure 4Kolmogorov–Smirnov (KS) test results for the temporal distribution of simulated ruptures in the Cat-21 (top) and Cat-18 (bottom) catalogues. The empirical cumulative distribution functions (CDFs) of rupture occurrence times (red curves) are compared against the theoretical CDFs expected from a Poisson process (black dashed lines). The grey lines represent CDFs of rupture occurrence times generated by random sampling from a uniform distribution over the same time window of the simulated ruptures.
It is important to highlight that the distance metric defined by Danciu et al. (2024) represents a modified version of the classical KS distance. In particular, the distance between empirical and idealized Poisson CDFs is compared to a reference distribution of distances obtained from random synthetic datasets generated from perturbed realizations of the null hypothesis. This modification accounts for limitations in standard declustering techniques, which may fail to remove aftershocks from earthquake catalogues completely. Such residual clustering often manifests as a concave deviation in the normalized cumulative number time series relative to the theoretical expectation derived from a well-declustered Poissonian catalogue (see Fig. 4 and Danciu et al., 2021). Since our simulated catalogues do not exclude aftershocks or foreshocks, the use of this modified KS distance is particularly appropriate. It inherently accommodates the presence of such clustering by avoiding penalization of these deviations in the cumulative number time series, thus preventing them from biasing the goodness-of-fit assessment. In Fig. 4, we show the comparison of the CDFs obtained with the aforementioned process for Cat-21 and Cat-18. The Poisson process cannot be rejected for both catalogues given that the p value is within the 95 % confidence level of the synthetic datasets.
We compute ground shaking, expressed in terms of peak ground acceleration and velocity (PGA, in units of g; PGV in cm s−1) using the OpenQuake software (Pagani et al., 2014) within a “Classical” PSHA framework, according to the own OpenQuake nomenclature. This approach follows the standard methodology for hazard integration as formulated by Cornell (1968), McGuire (1976), and later refined by Field et al. (2003), allowing for the computation of hazard curves and maps by combining the simulated ERF of finite ruptures and GMMs. For ground motion prediction, we adopt the model by Bindi et al. (2014). This GMM estimates the geometric mean of horizontal ground motion components and uses the Joyner–Boore distance (Rjb) as the distance metric. The model is calibrated on a comprehensive dataset of shallow crustal earthquakes in Europe, making it suitable for application in the study area.
2.4 Model consistency against observations
In general, it is considered that a model shows good predictive performance when its predictions agree with observations. If the observations are independent of the model, this testing is referred to as validation (Marzocchi and Jordan, 2014; Schorlemmer et al., 2018). However, when observations have been used, directly or indirectly, in building the model, the appropriate term is consistency. This distinction is far from semantic: while a flawed model typically fails a validation test, it may still pass a consistency test by overfitting the data. Therefore, in practice, only the rejection of a consistency test is meaningful, as it highlights structural errors in the model, often termed “unknown unknowns” (Marzocchi and Jordan, 2014). In our application, we evaluate consistency by testing whether observations are statistically compatible with model predictions under the Poisson assumption.
In PSHA, especially in low-deformation regions, observations are typically limited and rarely independent of the model. As a result, PSHAs are generally assessed for consistency rather than validation. This is typically done by comparing model outputs to a set of observations (Stein et al., 2015). The most straightforward choice for such observations is ground shaking observations at specific sites.
A general framework for testing PSHA performance can be expressed as:
where y is ground shaking and g(Y) is the statistical distribution of the random variable Y, derived from the PSHA. The forecast-observation comparison is made through pairs of the form (g,y), where g is the forecast from the mean hazard model f(x) and y is the observed value (Gneiting and Katzfuss, 2014).
A commonly used consistency/validation test in PSHA involves comparing the number of observed exceedances of ground motion thresholds to the expected number. In regions with low strain rates, such as Italy, D'Amico et al. (2024) proposed a scoring procedure that compares hazard curves to time series of macroseismic observations (or “seismic histories”) at selected sites. In this study, we test the expected number of exceedances against both macroseismic observations and recorded levels of ground shaking. The general procedure is the same for the two types of observations; however, given the treatment necessary in the use of macroseismic data, we describe separately the two tests.
In this second part of our approach (Fig. 2), we test the two physics-based hazard models for Cat-21 and Cat-18, for which the use of the term “validation” is appropriate since the observational data were not used in model construction, and an area source model, for which the term “consistency check” is more appropriate. This is because the Gutenberg–Richter parameters of this area source model are derived from earthquake catalogues significantly based on macroseismic intensities (see details on the ZESIS database; IGME, 2015). The area source hazard model is computed using the Gutenberg–Richter parameters of area “55” from the ZESIS model (García-Mayordomo, 2015; IGME, 2015), modeled as a truncated distribution (Fig. 1b), and considering the same GMM as for Cat-21 and Cat-18 models. Area “55” is an area defined to encompass the geological and seismogenic features of the EBSZ fault system, and hence is appropriate for comparison with the fault-based seismic hazard we perform for the simulated catalogues. Despite the mentioned terminology, for better clarity we use the term consistency to describe all analyses against observations. Remarkably, our testing approach performs a joint model analysis, meaning that we test the final hazard outputs instead of the different seismic hazard components, namely the ERF and GMM.
Rate-and-state simulators model full earthquake sequences, including foreshocks and aftershocks. Even though we demonstrate that, at the scale of the fault system, the catalogues follow a Poissonian process (Fig. 4), these catalogues have not been de-clustered. This means that the earthquake ruptures we pipeline to PSHA might reflect time-dependent behavior linked to the spontaneous earthquake interactions emerging from the simulator. To ensure consistency in the analysis, we performed a re-clustering to the occurrence rates of the area source model, because the Gutenberg–Richter fit parameters from this model are based on a de-clustered catalogue (IGN-UPM, 2013). We apply the cluster correction proposed by Marzocchi and Taroni (2014) to the magnitude-frequency distribution of the area source model. Marzocchi and Taroni (2014) define multiplicative coefficients to calculate non-declustered (complete) frequencies for magnitude values starting from their declustered values.
The adoption of an area source-based ERF for PSHA plays an important role in both the qualitative and quantitative evaluation of fault-related impacts, particularly in terms of the spatial distribution of seismic hazard. Statistical tests are primarily used to assess the relative performance of competing models and to identify those that cannot be rejected; therefore, an area source-based approach offers complementary value. By producing a spatially smoothed representation of seismic hazard, it serves as an effective tool for visualizing and quantifying the regional influence and performance of physics-based models.
2.4.1 Macroseismic consistency test
The first step in the procedure for using macroseismic data involves selecting a set of localities to evaluate the consistency of PSHA models with available macroseismic observations. We select here five sites that correspond to prominent cities along the EBSZ: Lorca, Murcia, Almería, Torrevieja and Vera. All sites are located along or at a distance shorter than 10 km from the EBSZ faults, except Almería, which is located at approximately 20 km from the faults. This close distance criterion is used to ensure that the macroseismic records are related to the faults within the EBSZ fault system rather than seismicity from distant sources. This is because epicenters close to the EBSZ faults are more likely to be generated by such sources (e.g., Yazdi and Garcia-Mayordomo, 2024). Instead, macroseismic intensities recorded from earthquakes whose epicentral area is outside the EBSZ cannot be confidently related to the faults in the model and, therefore, cannot be used for testing the physics-based models.
For each site, we built two datasets: (i) A set of observed macroseismic intensity (MI) values (see Table S1 in the Supplement) and (ii) a set of expected MI values derived from the hazard models. To compare these datasets, we need to estimate the completeness time intervals for each intensity degree in the observed MI catalogue, that is, the periods in which earthquake effects above a certain intensity are assumed to be reported. These intervals are computed using the statistical procedure of Albarello et al. (2001), which returns a probability density function of the completeness time for each desired intensity threshold. To be coherent with the ERFs, we retain intensity data related to earthquakes with magnitudes Mw≥5.5.
According to D'Amico et al. (2024), macroseismic observations with uncertain intensity values (e.g., MI 6–7) are treated in two hypotheses: Option 1 – assigned to the lower MI value (e.g., MI 6); Option 2 – assigned to the higher MI value (e.g., MI 7). For each MI threshold we compute their completeness functions applying the Albarello et al. (2001) procedure. Then, as described in D'Amico et al. (2024), we use the medians and 75th percentiles of the completeness functions to investigate the uncertainty in the assessment of the starting year of the completeness period. By combining the treatment of the uncertainty of the half-degree of the macroseismic intensities with the starting years of the completeness function (Tc), we obtain four estimates of the pairs “starting time of completeness – number of observed data” for each intensity level at each site:
-
Option 1 and the median of the completeness functions (median Tc value)
-
Option 1 and the 75th percentile Tc
-
Option 2 and the median Tc
-
Option 2 and the 75th percentile Tc
To compute the number of expected intensity data at each site, we start from the RSQSim-derived hazard curves in PGV computed considering site-specific Vs30 values (see Table S2) taken from the soil classification from Herrero-Barbero et al. (2023), which encompasses the whole EBSZ. To each city, we assign the upper Vs30 value from the range corresponding to the soil class type. While this geology-based approach provides a practical framework for assigning Vs30 values across the region, it may be affected by local uncertainties when applied to specific sites, such as lateral variations in stiffness within a given geological unit. Nevertheless, it remains a common method for regional-scale applications where in-situ measurements are lacking. Hazard maps are computed considering a uniform Vs30 of 600 m s−1 to facilitate recognition of spatial patterns of hazard estimates at a regional scale. Also, the selected Vs30 value corresponds to class B soils ( m s−1), which is the average of the Vs30 values across the entire EBSZ according to the map by Herrero-Barbero et al. (2023). We use PGV as the hazard measure because it is the best predictive instrumental measure of macroseismic intensity according to Gomez-Capera et al. (2020). Similarly, Cataldi et al. (2021) conclude that PGV-based equations are the most optimal to predict macroseismic intensities, along with PGA.
In Fig. 5, we show the computational flow to derive the number of expected intensity data from the hazard curves. From the hazard curve expressed as the annual frequency of exceedance (AFoE) of PGV levels, we first calculate the annual frequency of occurrence (AFoO; Fig. 5a), which corresponds to the incremental counterpart of the AFoE. For each PGV level, we build the conditional probability of being an MI level (Fig. 5b) using the Ground Motion Intensity Conversion Equation (GMICE) by Gómez-Capera et al. (2020). These equations establish a probability distribution to each MI level, which is related to a ground shaking measure (i.e., PGV). Then, we multiply the annual occurrence rate of each PGV level by the corresponding probability of MI levels from the GMICE to obtain the annual rate of occurrence of MI (λ(MI)) as a function of PGV (Fig. 5c):
Here, λ(xj) is the annual occurrence rate for the jth level of PGV, and P(MI|xj) is the conditional probability of a PGV level being an MI level from the GMICE.
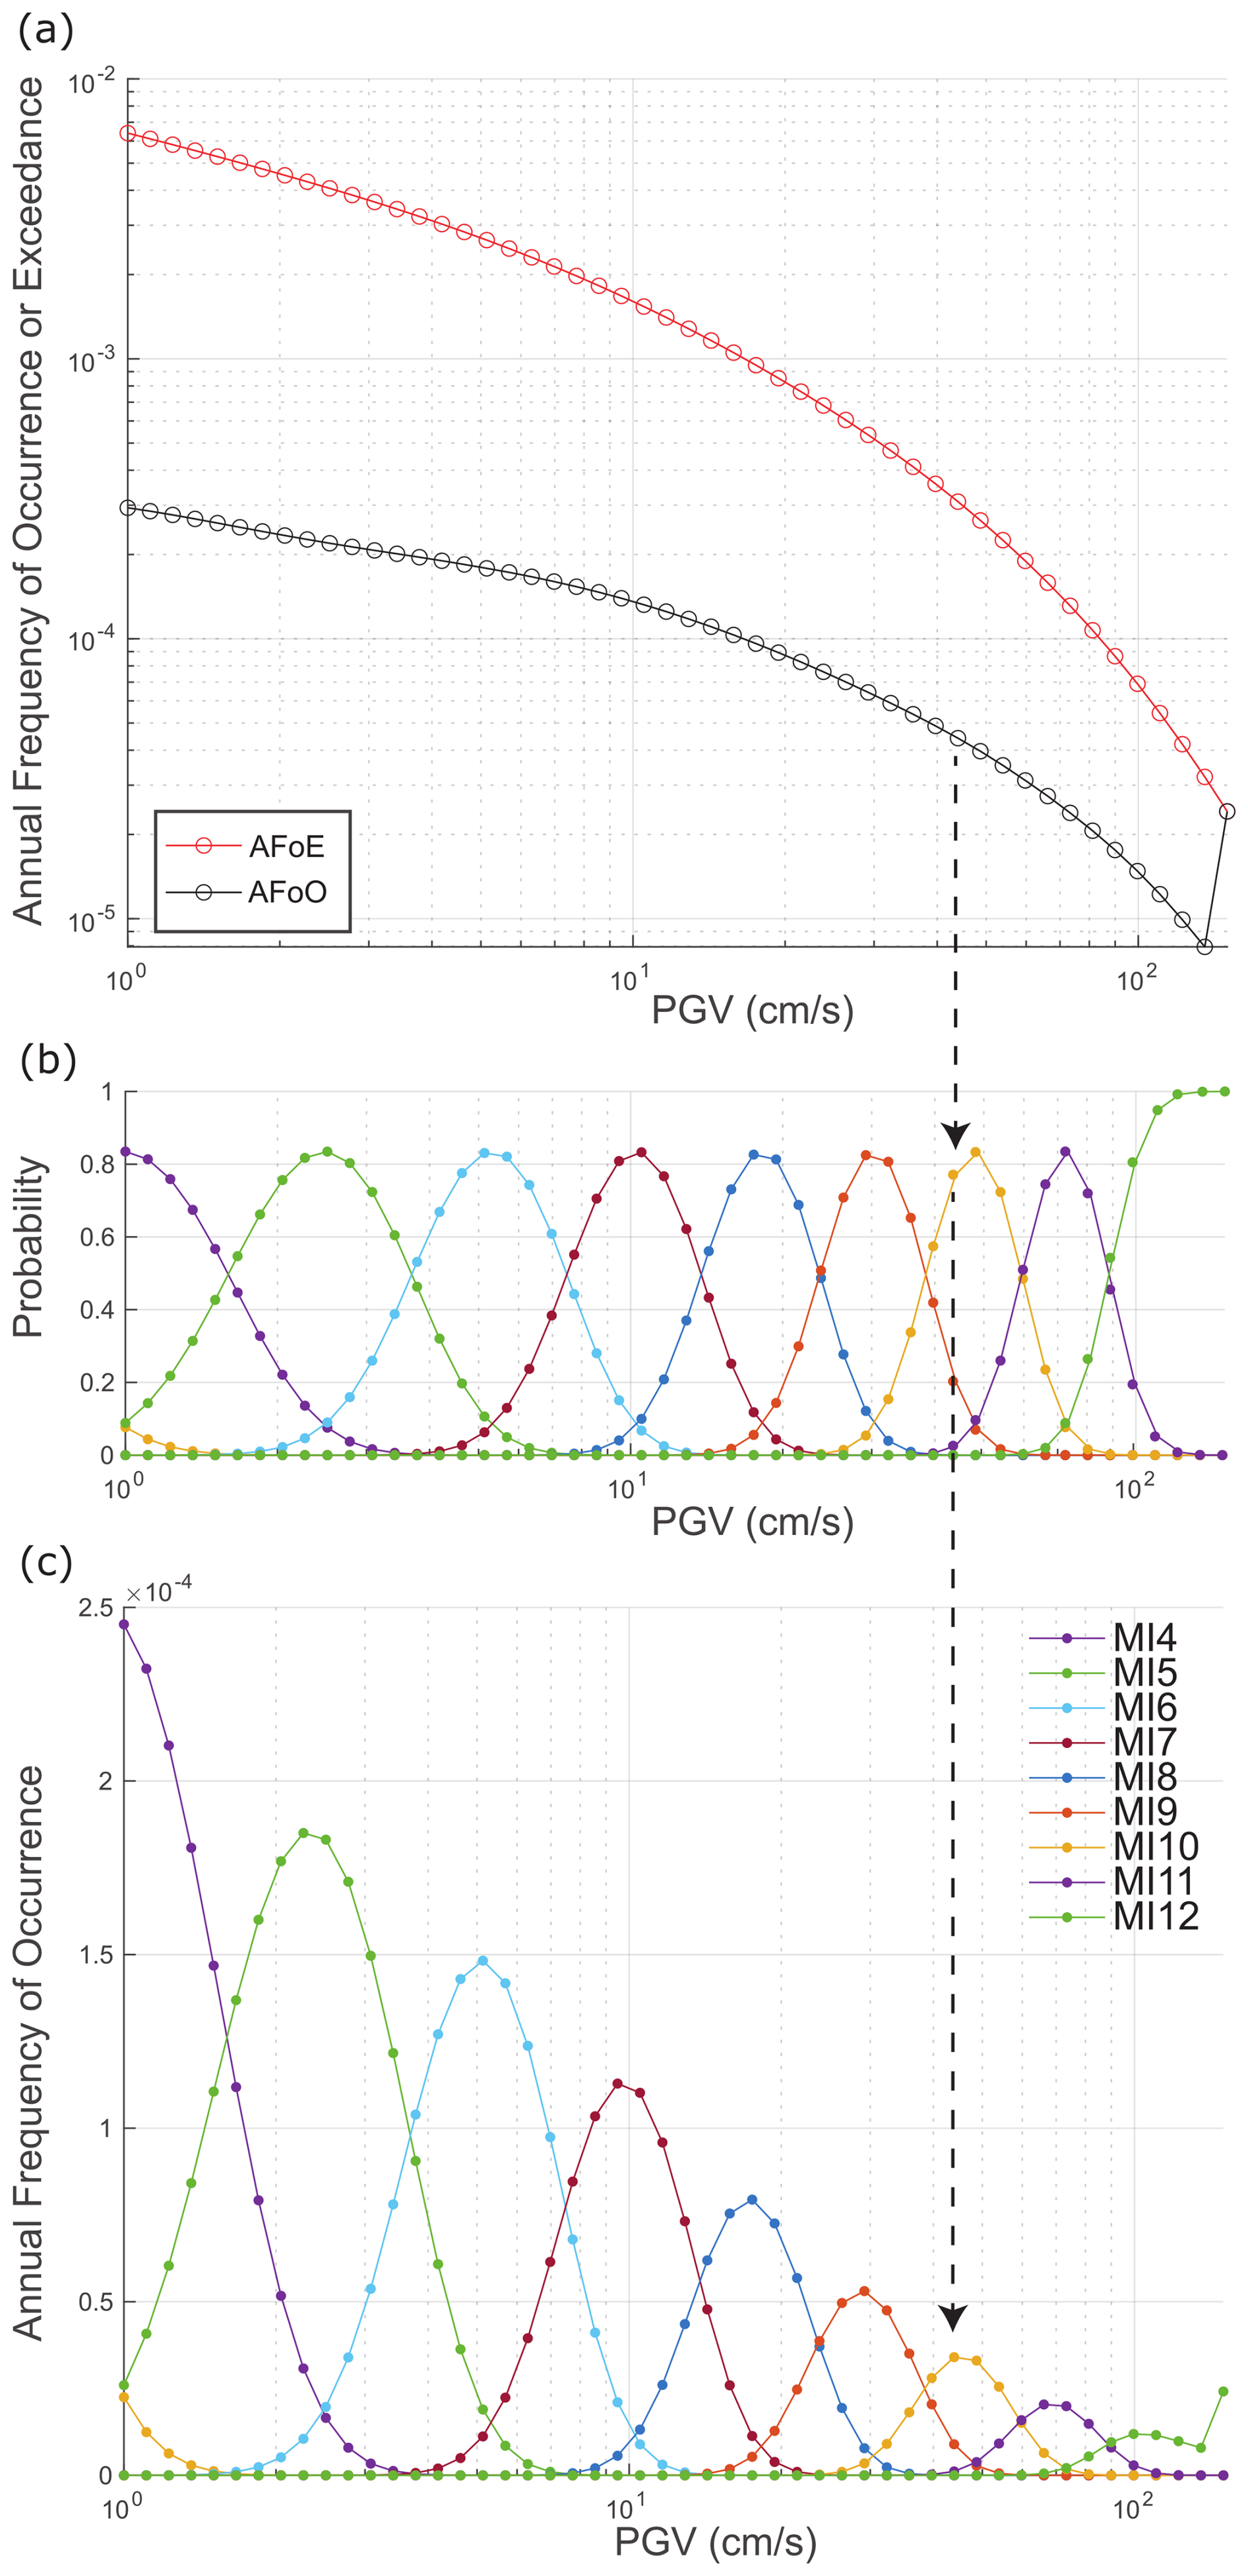
Figure 5(a) Example of a hazard curve for a site, expressed in terms of annual frequency of exceedance and occurrence of PGV (AFoE and AFoO). (b) PDF of the relationship between PGV and MI as proposed in Gomez-Capera et al. (2020). (c) Annual frequency of occurrence of MI from 4 to 12 as a function of PGV for a site. The arrow illustrates an example of the procedure: the annual frequency of occurrence value (AFoO) in terms of PGV (black circle in panel a) is multiplied by the probability of corresponding to Modified Intensity levels 9, 10, or 11 (b), to obtain the annual frequency of occurrence of MI as a function of PGV as shown in panel (c). This procedure is repeated for each PGV value in the hazard curve. Then, all the corresponding annual frequencies of occurrence for each MI are summed to obtain the final annual frequency of occurrence per MI level. Note that the jump in the annual frequency of occurrence distribution of MI 12 at large PGVs is a numerical artifact related to larger PGV levels being concentrated at the last intensity bin (MI 12) in the GMICE, and the incremental rates from the hazard curve showing a jump at large PGVs. This artifact occurs at extremely low occurrence rates that do not influence the consistency test results.
The occurrence rates of each MI are summed and multiplied by the corresponding length of completeness periods (from the four completeness estimates above) to determine the expected number of intensity data for each MI threshold. Importantly, the number of expected intensities per MI threshold follows a Poisson distribution.
For each site and MI threshold, four observed-expected intensity pairs are produced, corresponding to the four different completeness year estimates (Tc): the median and 75th-percentile estimates of the completeness function, and the two options of intensity degree uncertainty (Options 1 and 2).
We perform the statistical test by computing the p value from the tails of the Poisson distribution, as described by Zechar et al. (2010). Here, F is the right-continuous Poisson cumulative distribution function and, if the number of observations (Nobs) exceeds the expected count (Nexp), the p value is calculated as:
Conversely, if the Nobs is less than or equal to the Nexp, the p value is given by:
These two p-value calculations address specific questions: the p value from the former case indicates whether the forecast is too low compared to observations, while the latter assesses if it's too high.
For each MI, we compute the average p value across the four cases. Subsequently, to compare the performance of the tested catalogues, we calculated the logarithm of the averaged p value (LogP).
2.4.2 Ground shaking consistency test
For sites with ground shaking data recorded at seismic stations, the computational workflow is more straightforward. We consider a set of five accelerometer stations located near the fault system: EXLO, ENIJ, M04, EXTO and EXVE2 (Fig. 6), continuously operational over the last decades. These stations correspond to the Spanish Instituto Geográfico Nacional (IGN) Seismic Alert Network. Data from these stations, including station coordinates and records, have been obtained from the IGN Seismic Alert Network Stations database (IGN 2025, https://www.ign.es/web/ca/ign/portal/sis-area-sismicidad, last access: 30 October 2025).
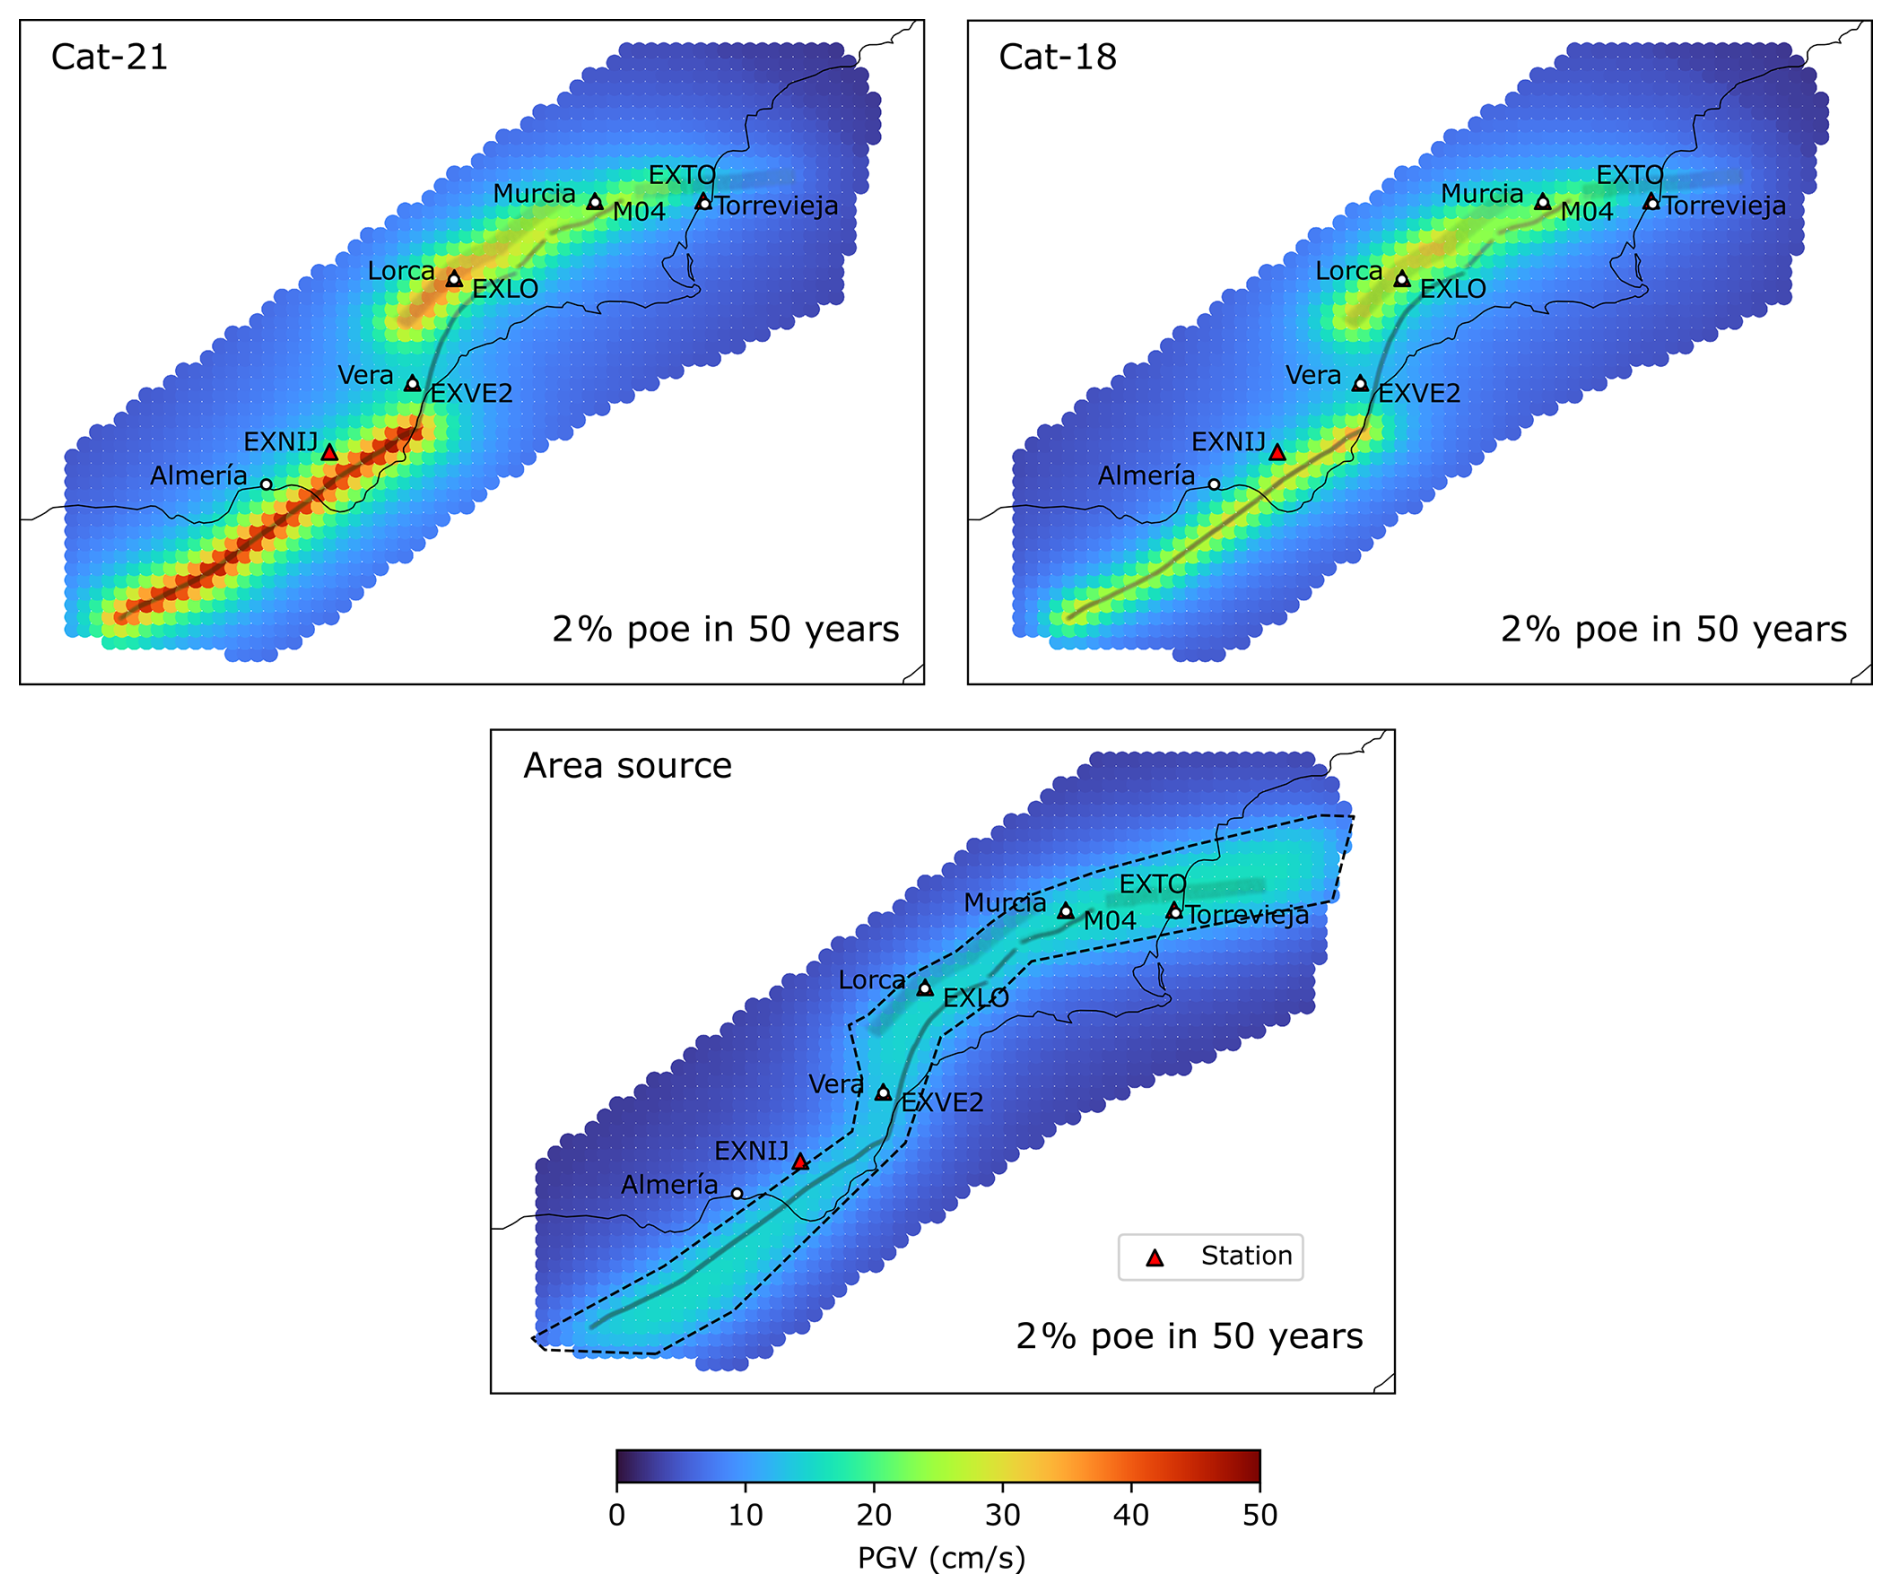
Figure 6PGV hazard maps for 2 % probability of exceedance in 50 years (homogeneous Vs30 = 600 m s−1) computed using the OpenQuake software for both the simulator-based catalogues (Cat-21 and Cat-18 from Herrero-Barbero et al., 2021) and the area source model: Zone 55 from ZESIS model (García-Mayordomo, 2015; IGME, 2015). White circles and triangles show, respectively, selected localities and accelerometer station sites for consistency tests.
We compute hazard curves for peak ground acceleration (PGA) at the mentioned sites, incorporating site-specific Vs30 values provided by the Instituto Geográfico Nacional (IGN) and available in Table S2. We obtain the expected number of exceedances by multiplying the annual frequency of exceedance by each station operational period: 1989–2025 for EXLO, 2002–2025 for EXNIJ, 2008–2025 for M04, 1993–2025 for EXTO and 2012–2025 for EXVE2. We then compute the p values between both the observed and expected exceedances using Eqs. (3) and (4), and we calculate their logarithms (LogP) to compare model performance.
3.1 Seismic hazard estimates
Figures 6 and 7 show the hazard results at the EBSZ obtained from the physics-based earthquake simulations of Cat-21 and Cat-18, as well as those from the area source model. Hazard maps are for PGV at 2 % probability of exceedance in 50 years for soil B conditions. We selected this probability of exceedance over more typical exceedances in design purposes (e.g., 10 % probability in 50 years) because our aim is to develop a methodological framework to compute and test physics-based ERFs in PSHA, not to produce results intended for building applications, as these would require further testing and validation.
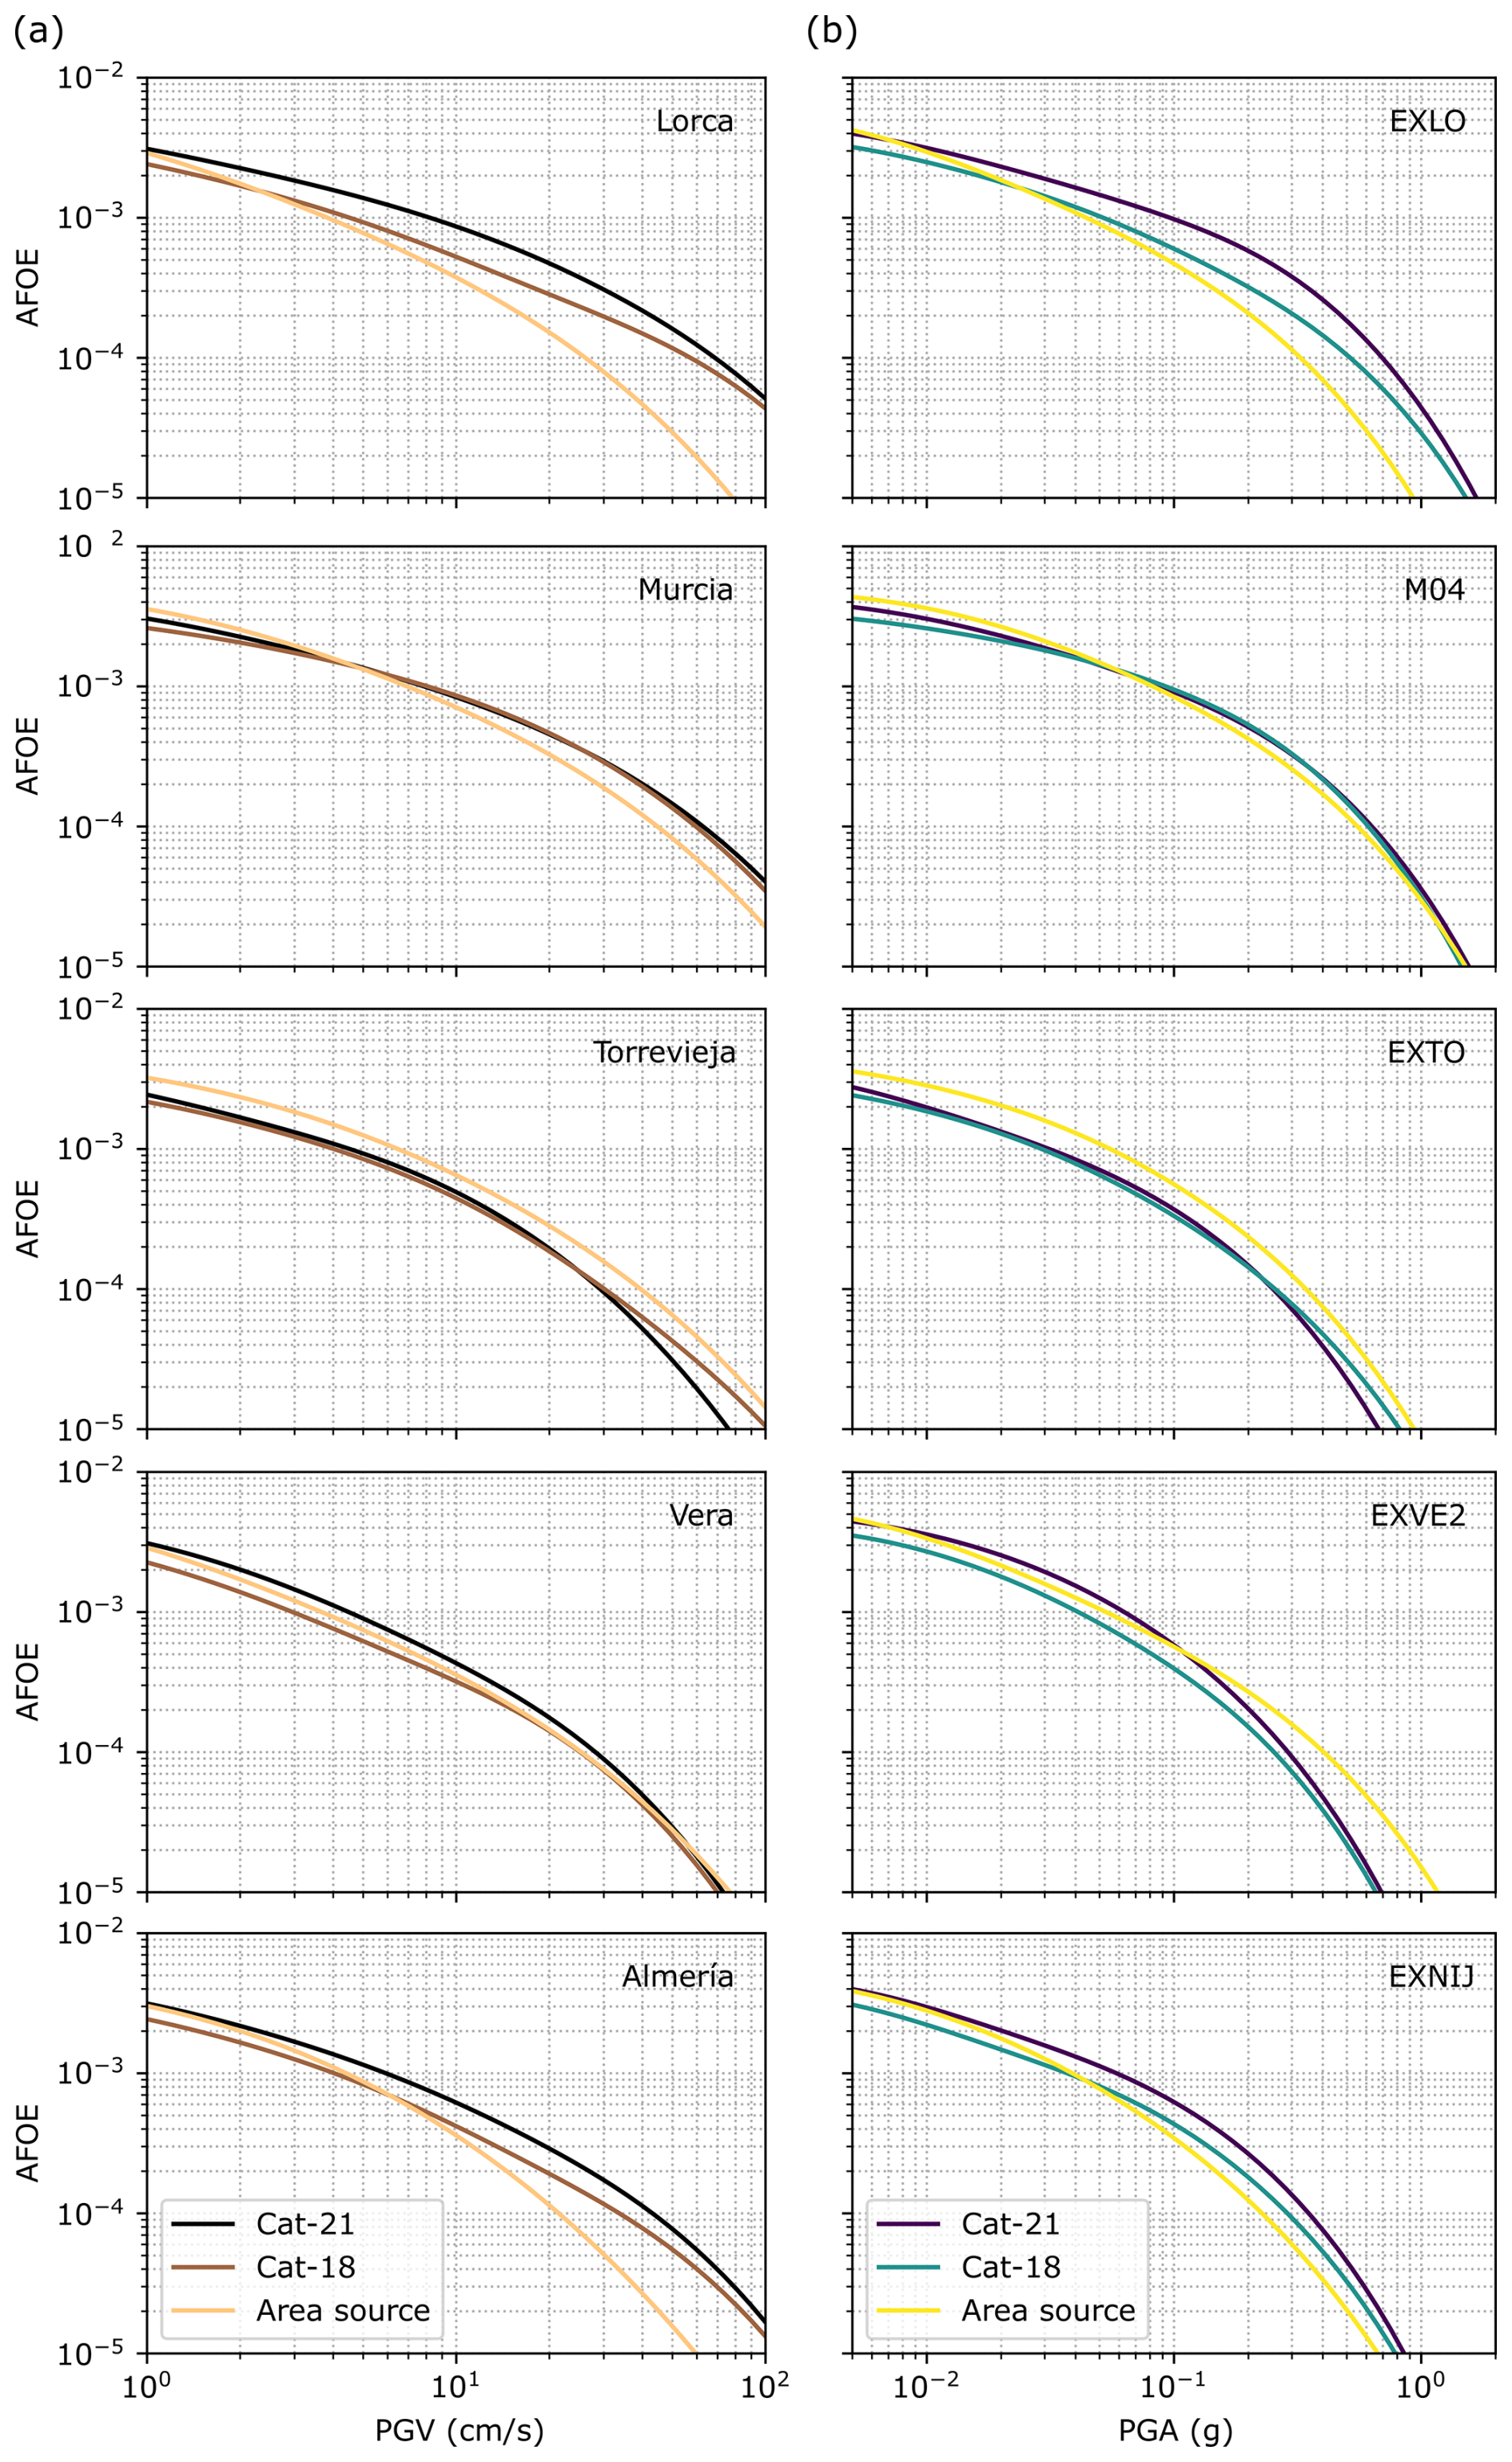
Figure 7(a) Hazard curves for PGV for the five selected sites and three different hazard models. (b) Hazard curves for PGA for the five selected stations and three different hazard models. AFOE: Annual frequency of exceedance. Vs30 for each site and station are provided in Table S2.
Hazard maps of Cat-21 and Cat-18 (Fig. 6) show generally higher PGV values than the area source model, exceeding approximately 20 cm s−1 in the regions along the fastest slipping major faults of the EBSZ: the Alhama de Murcia and Carboneras faults (see map in Fig. 3a for location). Conversely, the map obtained using the area source model (Fig. 6) results in a smoother spatial distribution of PGV within the area source (area 55 of the ZESIS model), with the highest values below 20 cm s−1 inside the modelled area.
Remarkably, out of the physics-based seismic hazard maps, Cat-21 is the one returning highest PGV values. This has to do with the fact that Cat-21 returns higher earthquake rates than Cat-18 for magnitudes above 5.5 (see Fig. 1b). PGV peaks at around 50 cm s−1 along the Carboneras fault, which is the fault with higher estimated slip rate (at 1.1–1.3 mm yr−1; see Herrero-Barbero et al., 2021). Such discrepancy in earthquake rates lies on the differences in the frictional parameters and initial stresses of both models, as fault system geometry, slip rates and hazard calculation set up remain constant across models.
In Fig. 7a, we show the hazard curves for PGV at the selected cities. In Lorca, Murcia and Almeria cities, Cat-21 and Cat-18 return remarkably higher hazard estimates than the area source model at AFoE <0.001. All three sites are located near prominent, higher slipping faults of the EBSZ, the Alhama de Murcia, Carrascoy and Carboneras faults, respectively (see Herrero-Barbero et al., 2021). These faults control the higher rates of physics-based models at large magnitudes Mw>6 compared to area-source model (Fig. 1b). Conversely, at larger AFoE >0.001 the area source model predicts similar or even higher hazard values to the physics-based models due to higher earthquake rates of the area source model in the Mw 5.5–6 range (Fig. 1b). This behavior is particularly visible for Cat-18, as the overall earthquake rates and hazard of this model are lower than for Cat-21 (Figs. 1b and 6, respectively).
In detail, physics-based models show the highest seismic hazard in Lorca with Cat-21 due to the influence of the Alhama de Murcia fault, similarly to Almería with the Carboneras fault (Fig. 6). However, in Murcia, the high hazard values of the physics-based models are likely due to the amplification effect on PGV generated by the low Vs30 value (150 m s−1). The Carrascoy fault slips at a rate about a half of the Alhama de Murcia and Carboneras faults, yet the hazard values are comparable to Lorca and higher than Almeria at AFoE < 0.001. (Fig. 7a). Conversely, in Torrevieja, seismic hazard curves consistently show lower AFoE for both simulated models compared to the area source model, as the activity rates in the nearby Bajo Segura fault do not raise hazard levels above the area source model (Fig. 6). In Vera, the slightly higher hazard for the physics-based models over the area source model (Fig. 7a) can be explained by the influence of the Carboneras and Alhama de Murcia faults, as the effect of the nearby Palomares fault is practically null (Fig. 6).
The area source model provides hazard curves that are less variable across sites and AFoEs than the simulated models due to the smoother spatial distribution of the hazard in this model (see Fig. 6). Among these, the curve for Almería shows the lowest values of AFoE in this model, especially for larger PGV values, because it is located outside the area source. Conversely, the highest hazard values of the area source model are shown in Torrevieja and Murcia due to the lower Vs30 values in these cities compared to other cities (Lorca and Vera, both at 360 m s−1; see Table S2).
Figure 7b, we show the hazard curves for PGA at the seismic stations. The results of the hazard curves for these station locations are interchangeable with those made for the cites, as most stations are located within them or in very similar settings (e.g., EXNIJ is also outside the area source limit; Fig. 6).
3.2 Consistency tests
In Fig. 8, we show an example of the comparison between the four pairs of observed and expected intensities per MI threshold, while Fig. 9 presents the analysis for PGA at accelerometric stations. In Fig. 8, we recall that the four pairs correspond to different estimates of the completeness periods (median value and the 75th percentile of the completeness function) and the two options for treating uncertain half intensity degrees. The examples are for the localities of Almería and Lorca for the Cat-21, Cat-18 and area source models, whereas the complete set of comparisons is given in the Supplement. We represent the observed number of exceedances with black edge circles and the expected numbers with the red squares. In addition, we plot the resulting mean p value for each MI, with a blue circle (values on the right-side y axis). The horizontal dashed line marks the confidence level of 0.05 of p value, above which we cannot reject the null hypothesis.
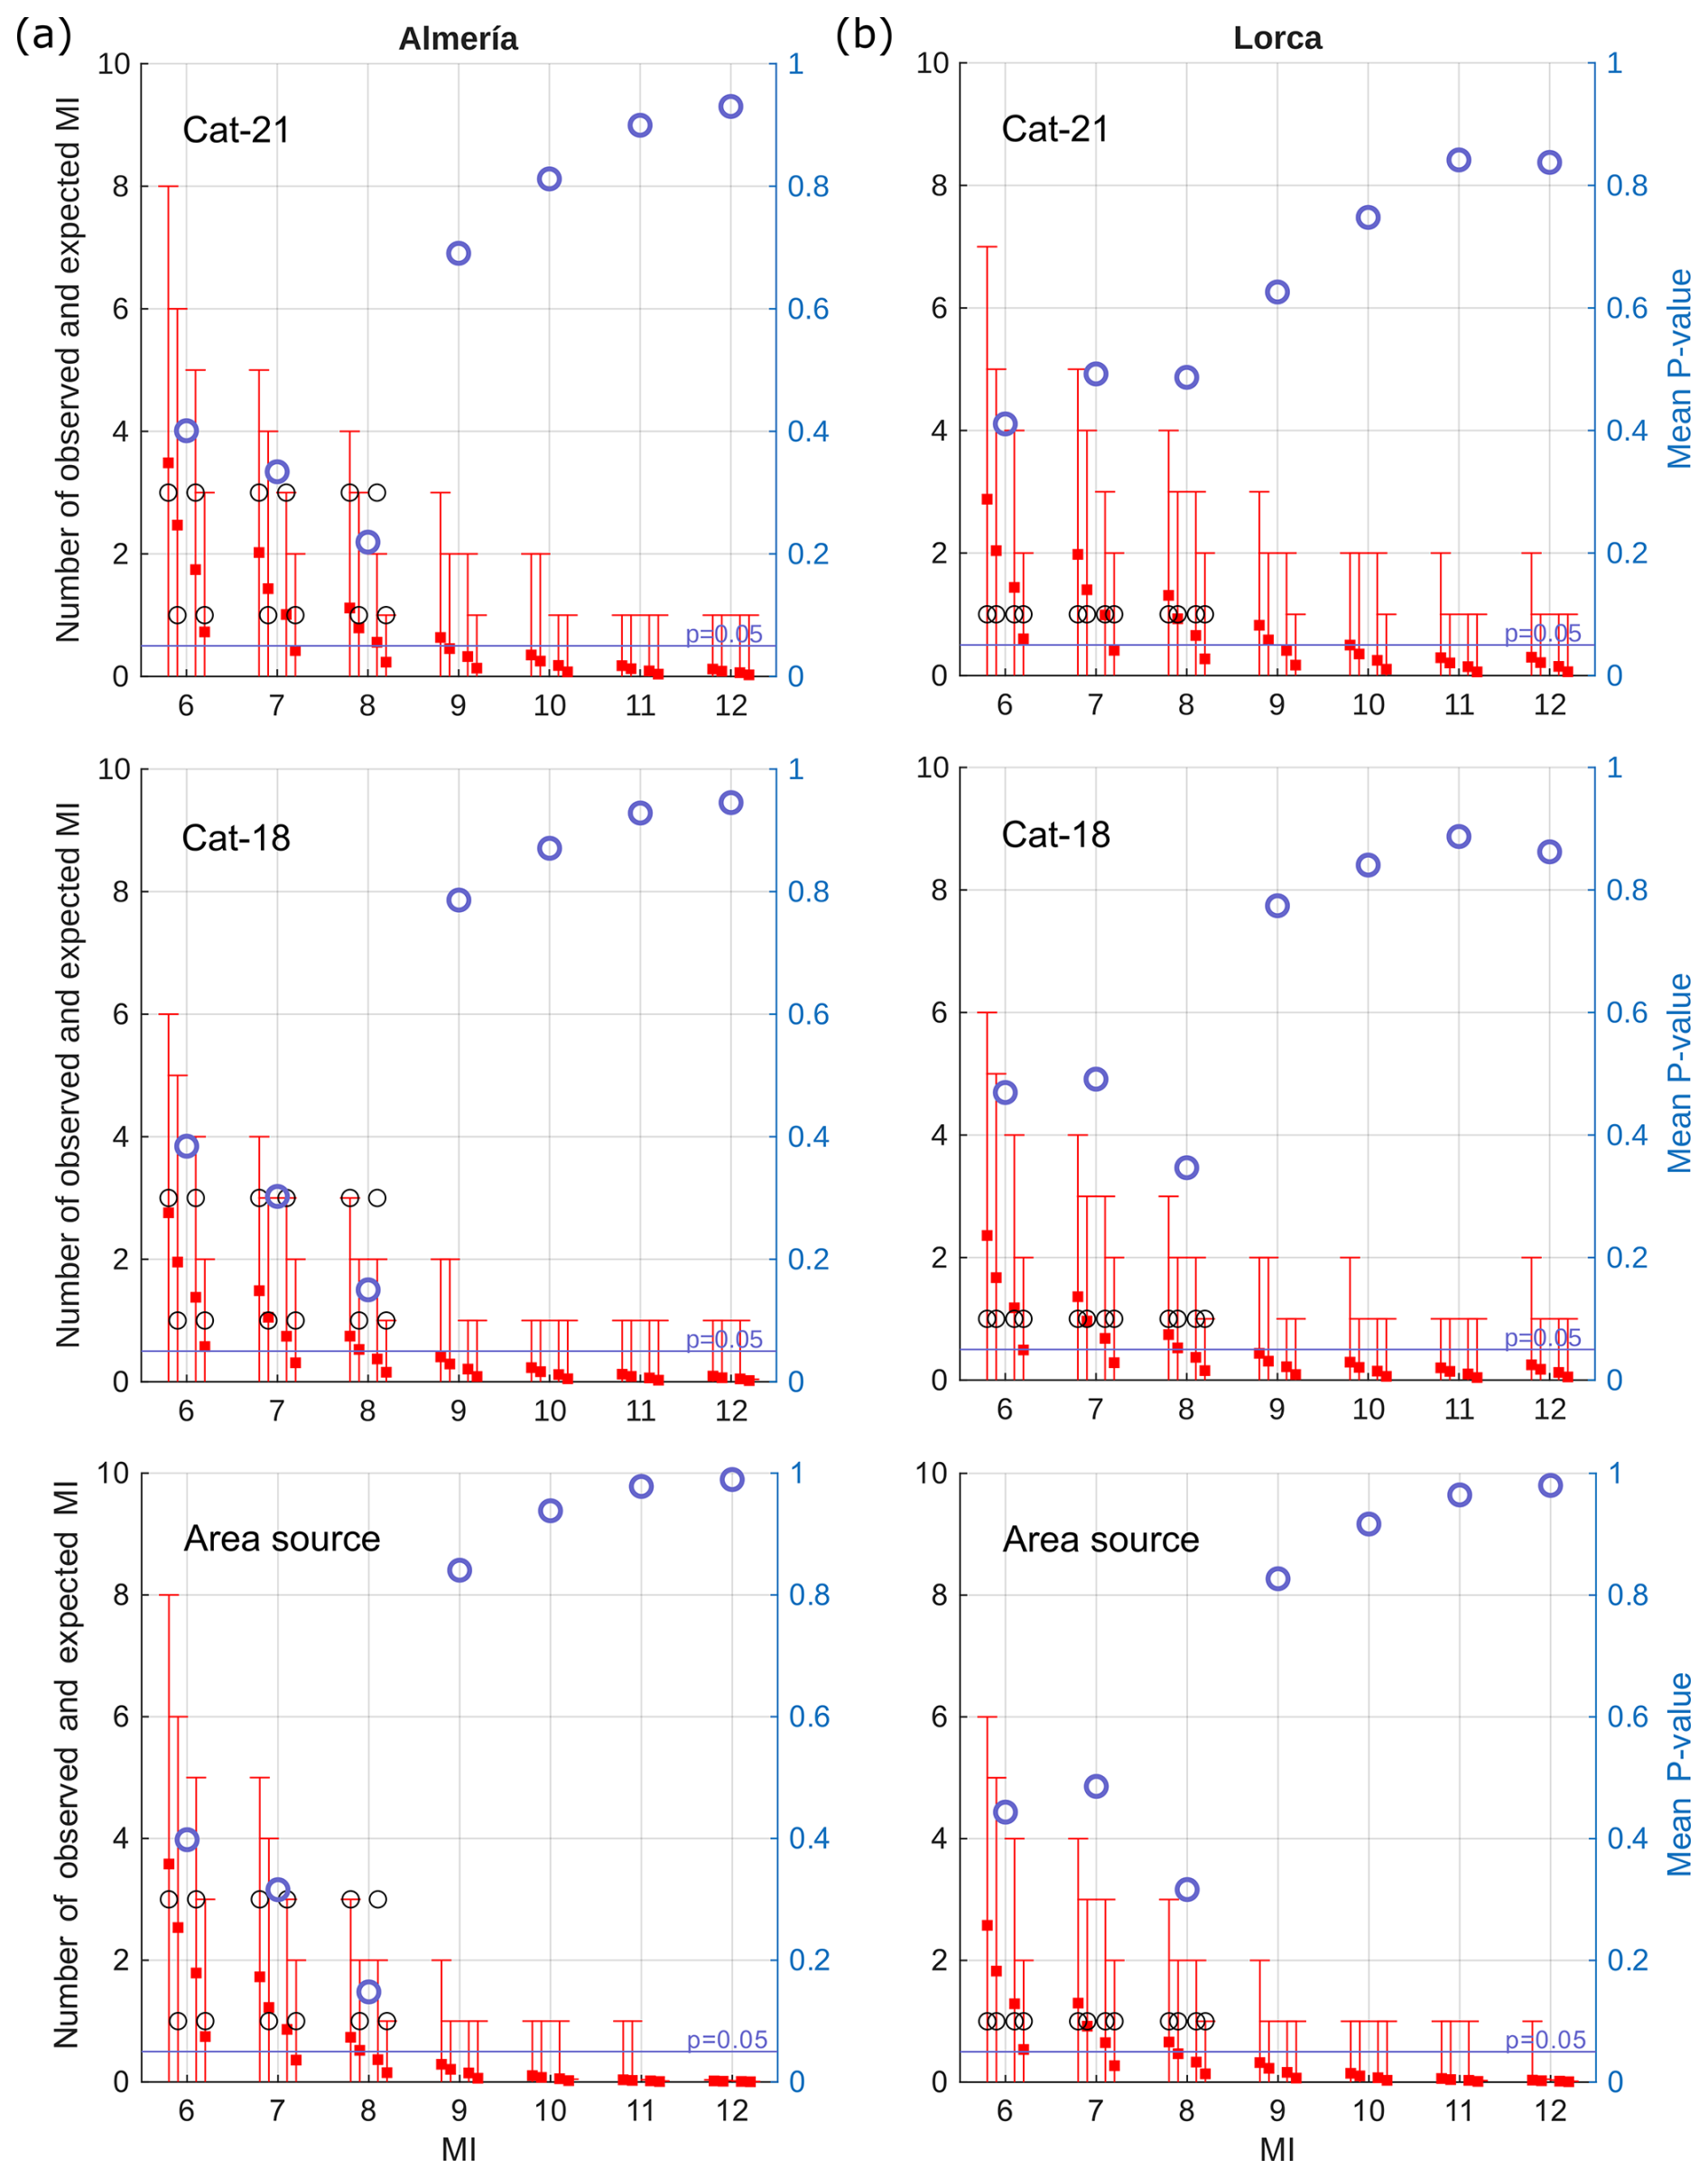
Figure 8Comparison, for different MI thresholds, between the number of observed macroseismic data and the number of expected intensities from Cat-21, Cat-18, and area source models in (a) Almería and (b) Lorca. Key: black edge circles are the observed number of exceedances; the red squares are the expected numbers from the hazard models, with vertical bars representing the 2.5th and 97.5th percentiles of the Poisson distribution of the expected MI; blue edge circles are the mean p values (values on the right-side y axis). Comparison graphs for the rest of the sites are available in Fig. S2.
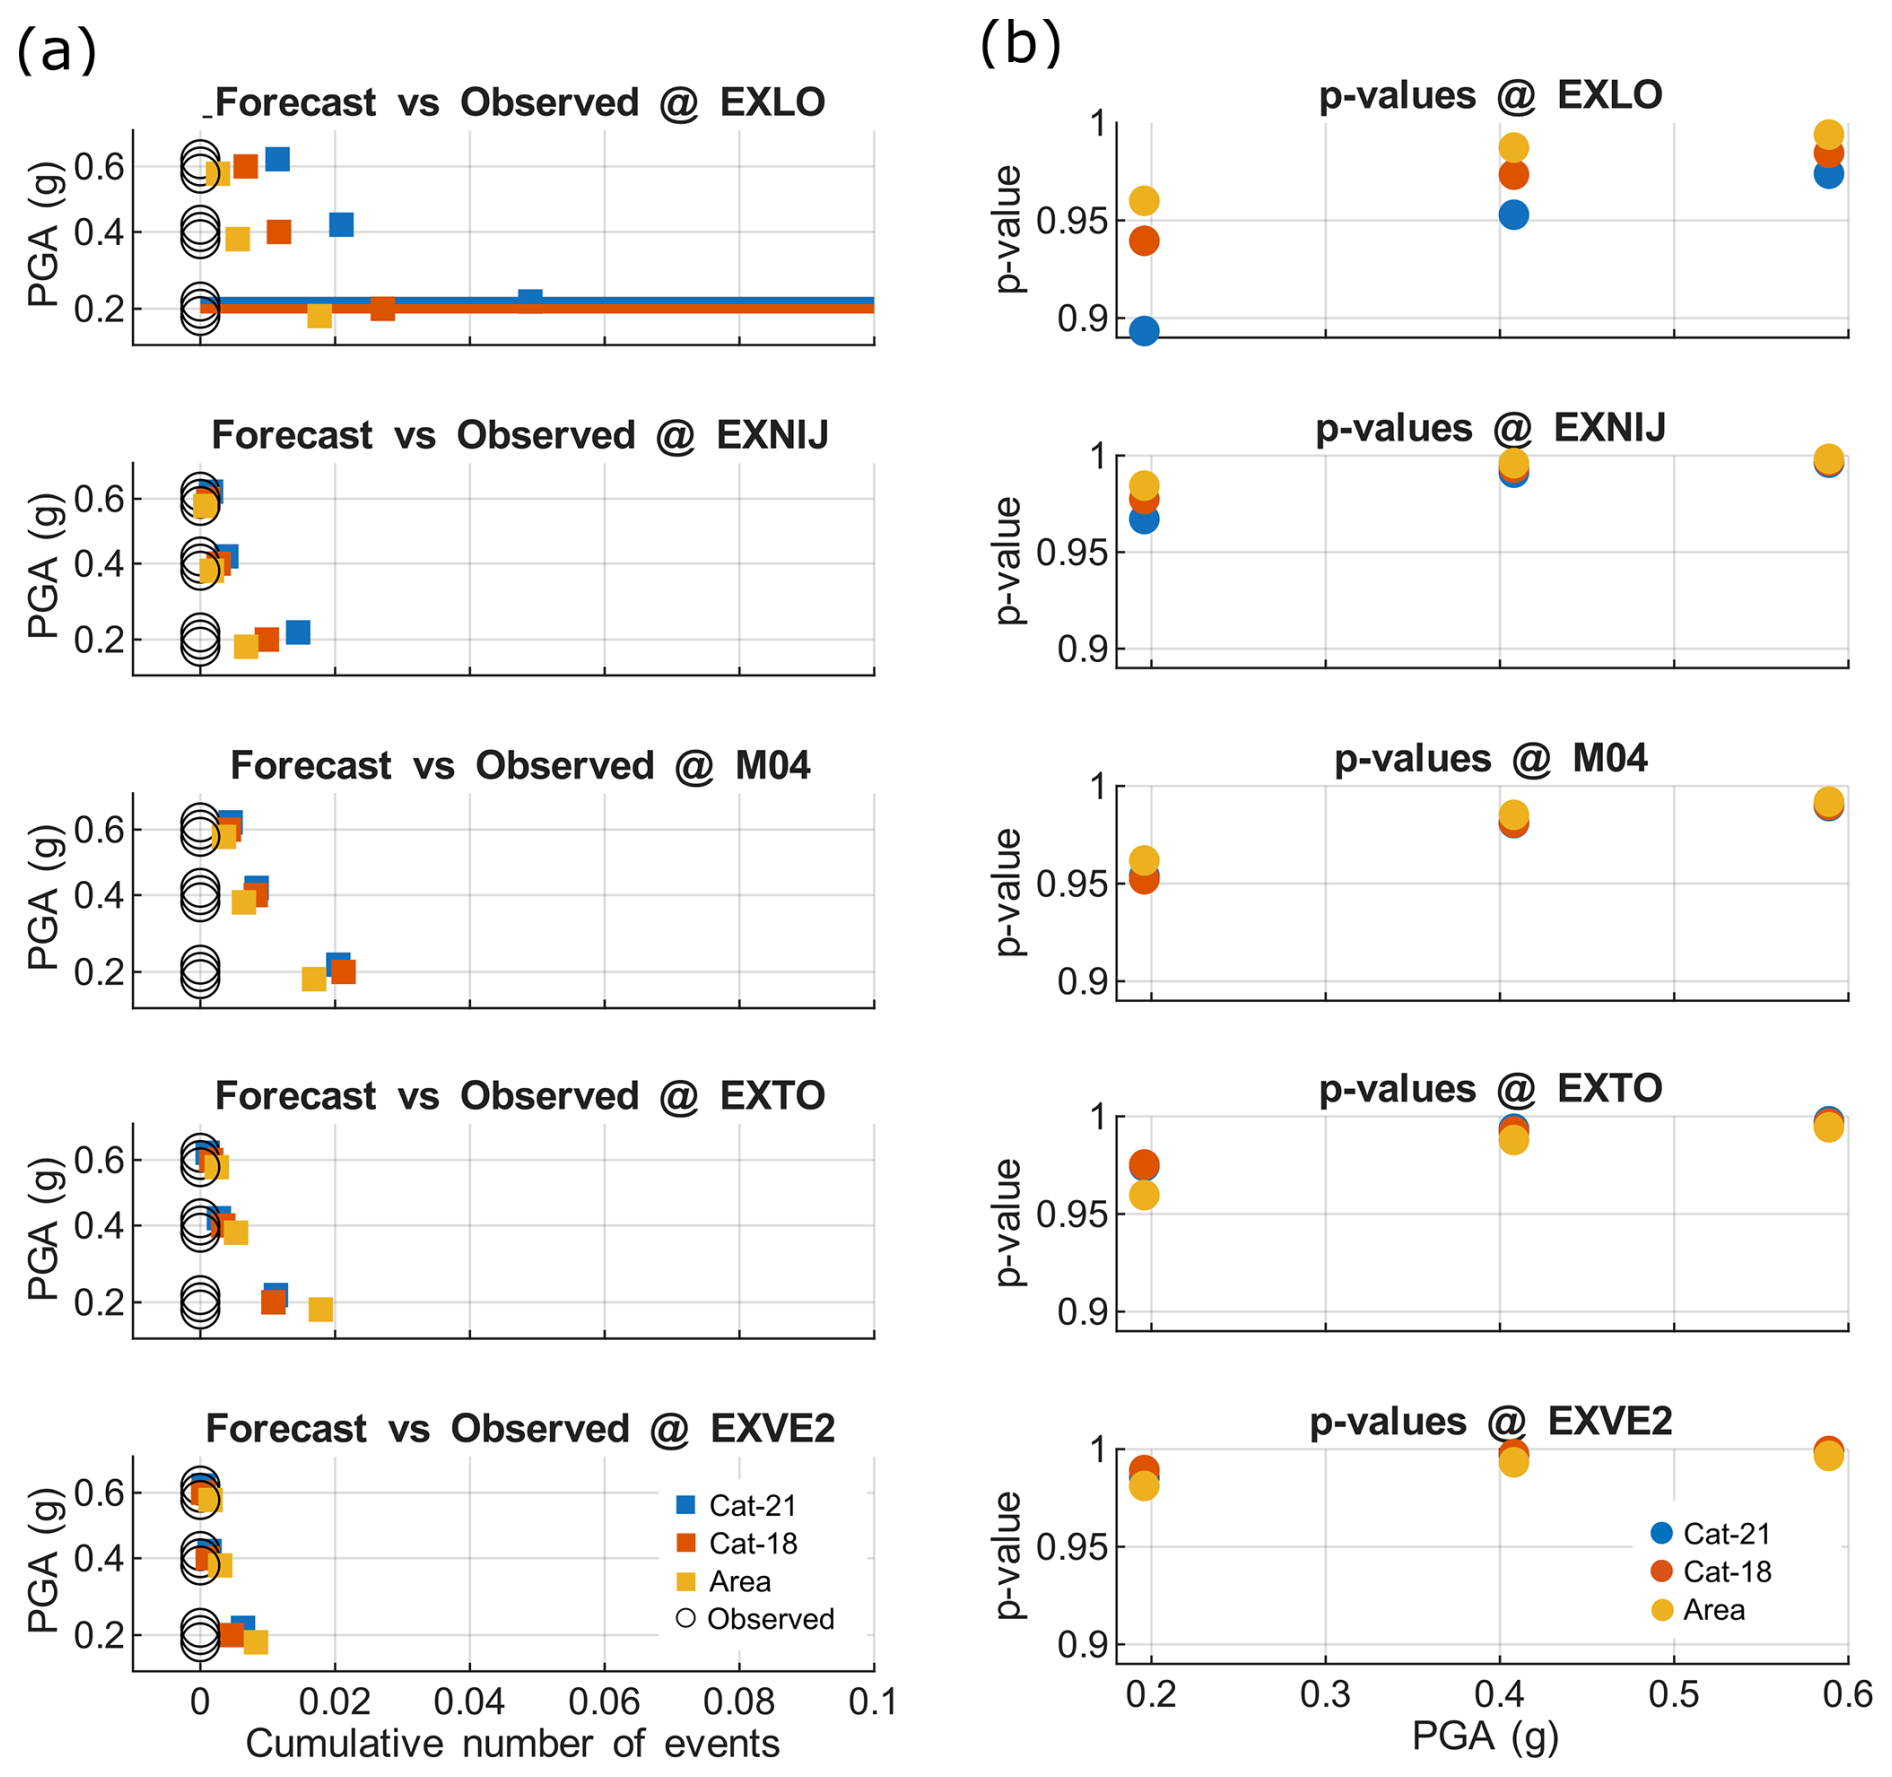
Figure 9(a) Observed vs. forecasted number of exceedances for the different models at different PGA thresholds and at each station location related to Mw≥5.5 events. (b) p values at different PGA thresholds for each station representing closeness between the number of recorded instrumental PGA exceedances corresponding to Mw≥5.5 and the PGA exceedances from the hazard models Cat-21, Cat-18 and area source.
All models show p values above the 0.05 confidence level, highlighting overall good agreement between models and observations. We observe a first-order shift of p values between MI 8 and MI 9 due to the absence of MI greater than 8 in the catalogue, but all models tend to furnish a consistent number of expected values for MI 6–MI 8, which basically means that no models over-predict the observations. A slight tendency to under-predict the observations is instead noticeable with the Cat-18 and the area source model for the MI 8 at the Almeria site, with p values closer to the 0.05 threshold.
Regarding the PGA thresholds at four seismic stations located in the EBSZ (Fig. 9), we present the p-value analysis between the observed and expected number of exceedances. A particularly informative case occurs when zero exceedances are observed at a station, as it is the case of the EBSZ for Mw≥5.5. In such cases, the comparison with model expectations is especially relevant, as it allows us to exclude models that predict unrealistically high hazard levels. When no exceedances are recorded during the observational period, any model that forecasts a significantly non-zero number of exceedances is likely overestimating the hazard at that location. Under these circumstances, the model yielding the lowest expected number of exceedances is statistically the most consistent with observations. This is a direct consequence of Poisson-based testing, wherein the probability of observing zero events decreases rapidly as the expected number increases. Hence, if all models predict non-zero exceedances, the one with the lowest expected rate will return the highest p value and, thus, cannot be rejected based on observational evidence (i.e., it is the one with better performance). This approach provides a straightforward yet effective method to discriminate between competing hazard models in data-scarce regions, where even the absence of observed exceedances carries meaningful information.
Figure 9b shows the p-value analysis between the observed and expected PGA exceedances in the different stations and for each model. For all stations, except EXTO and EXVE2, the area source model provides the highest p values, inferring superior performance over the simulated catalogues. However, this agreement might reflect model self-consistency, since the low number of expected exceedances of Mw≥5.5 in area source 55 for short-term periods are largely inherited from the lack of Mw≥5.5 instrumental records compared to the physics-based models. Conversely, EXTO and EXVE2 show superior performance of simulation-based hazard models over the area source model. In this case, the smoothing effect of the area source model leads to overprediction in regions where the influence of nearby active faults in the hazard is less prominent. This is further evidence that simulated catalogues might improve the spatial distribution of the hazard at near-fault locations. Figure 9a depicts this effect, with physics-based models predicting larger number of events for all PGA thresholds in all stations except EXTO and EXVE2.
The consistency analysis demonstrates how this testing strategy is particularly effective for identifying models that tend to overpredict shaking intensity, allowing us to refine hazard estimates and increase model performance at the site scale.
3.3 Model performance assessment
In Fig. 10, we present the LogP scores obtained for the three tested hazard models, Cat-21, Cat-18, and the area source model, across five localities and four instrumental stations. These scores, which are the logarithm of the p values from the previous tests, quantify the statistical agreement between observed and expected exceedances of ground-motion thresholds, both in terms of MI and PGA. We recall here that higher (less negative) LogP values indicate a better agreement with the observed data, as they correspond to higher p values under the Poisson-based statistical framework used for model evaluation.
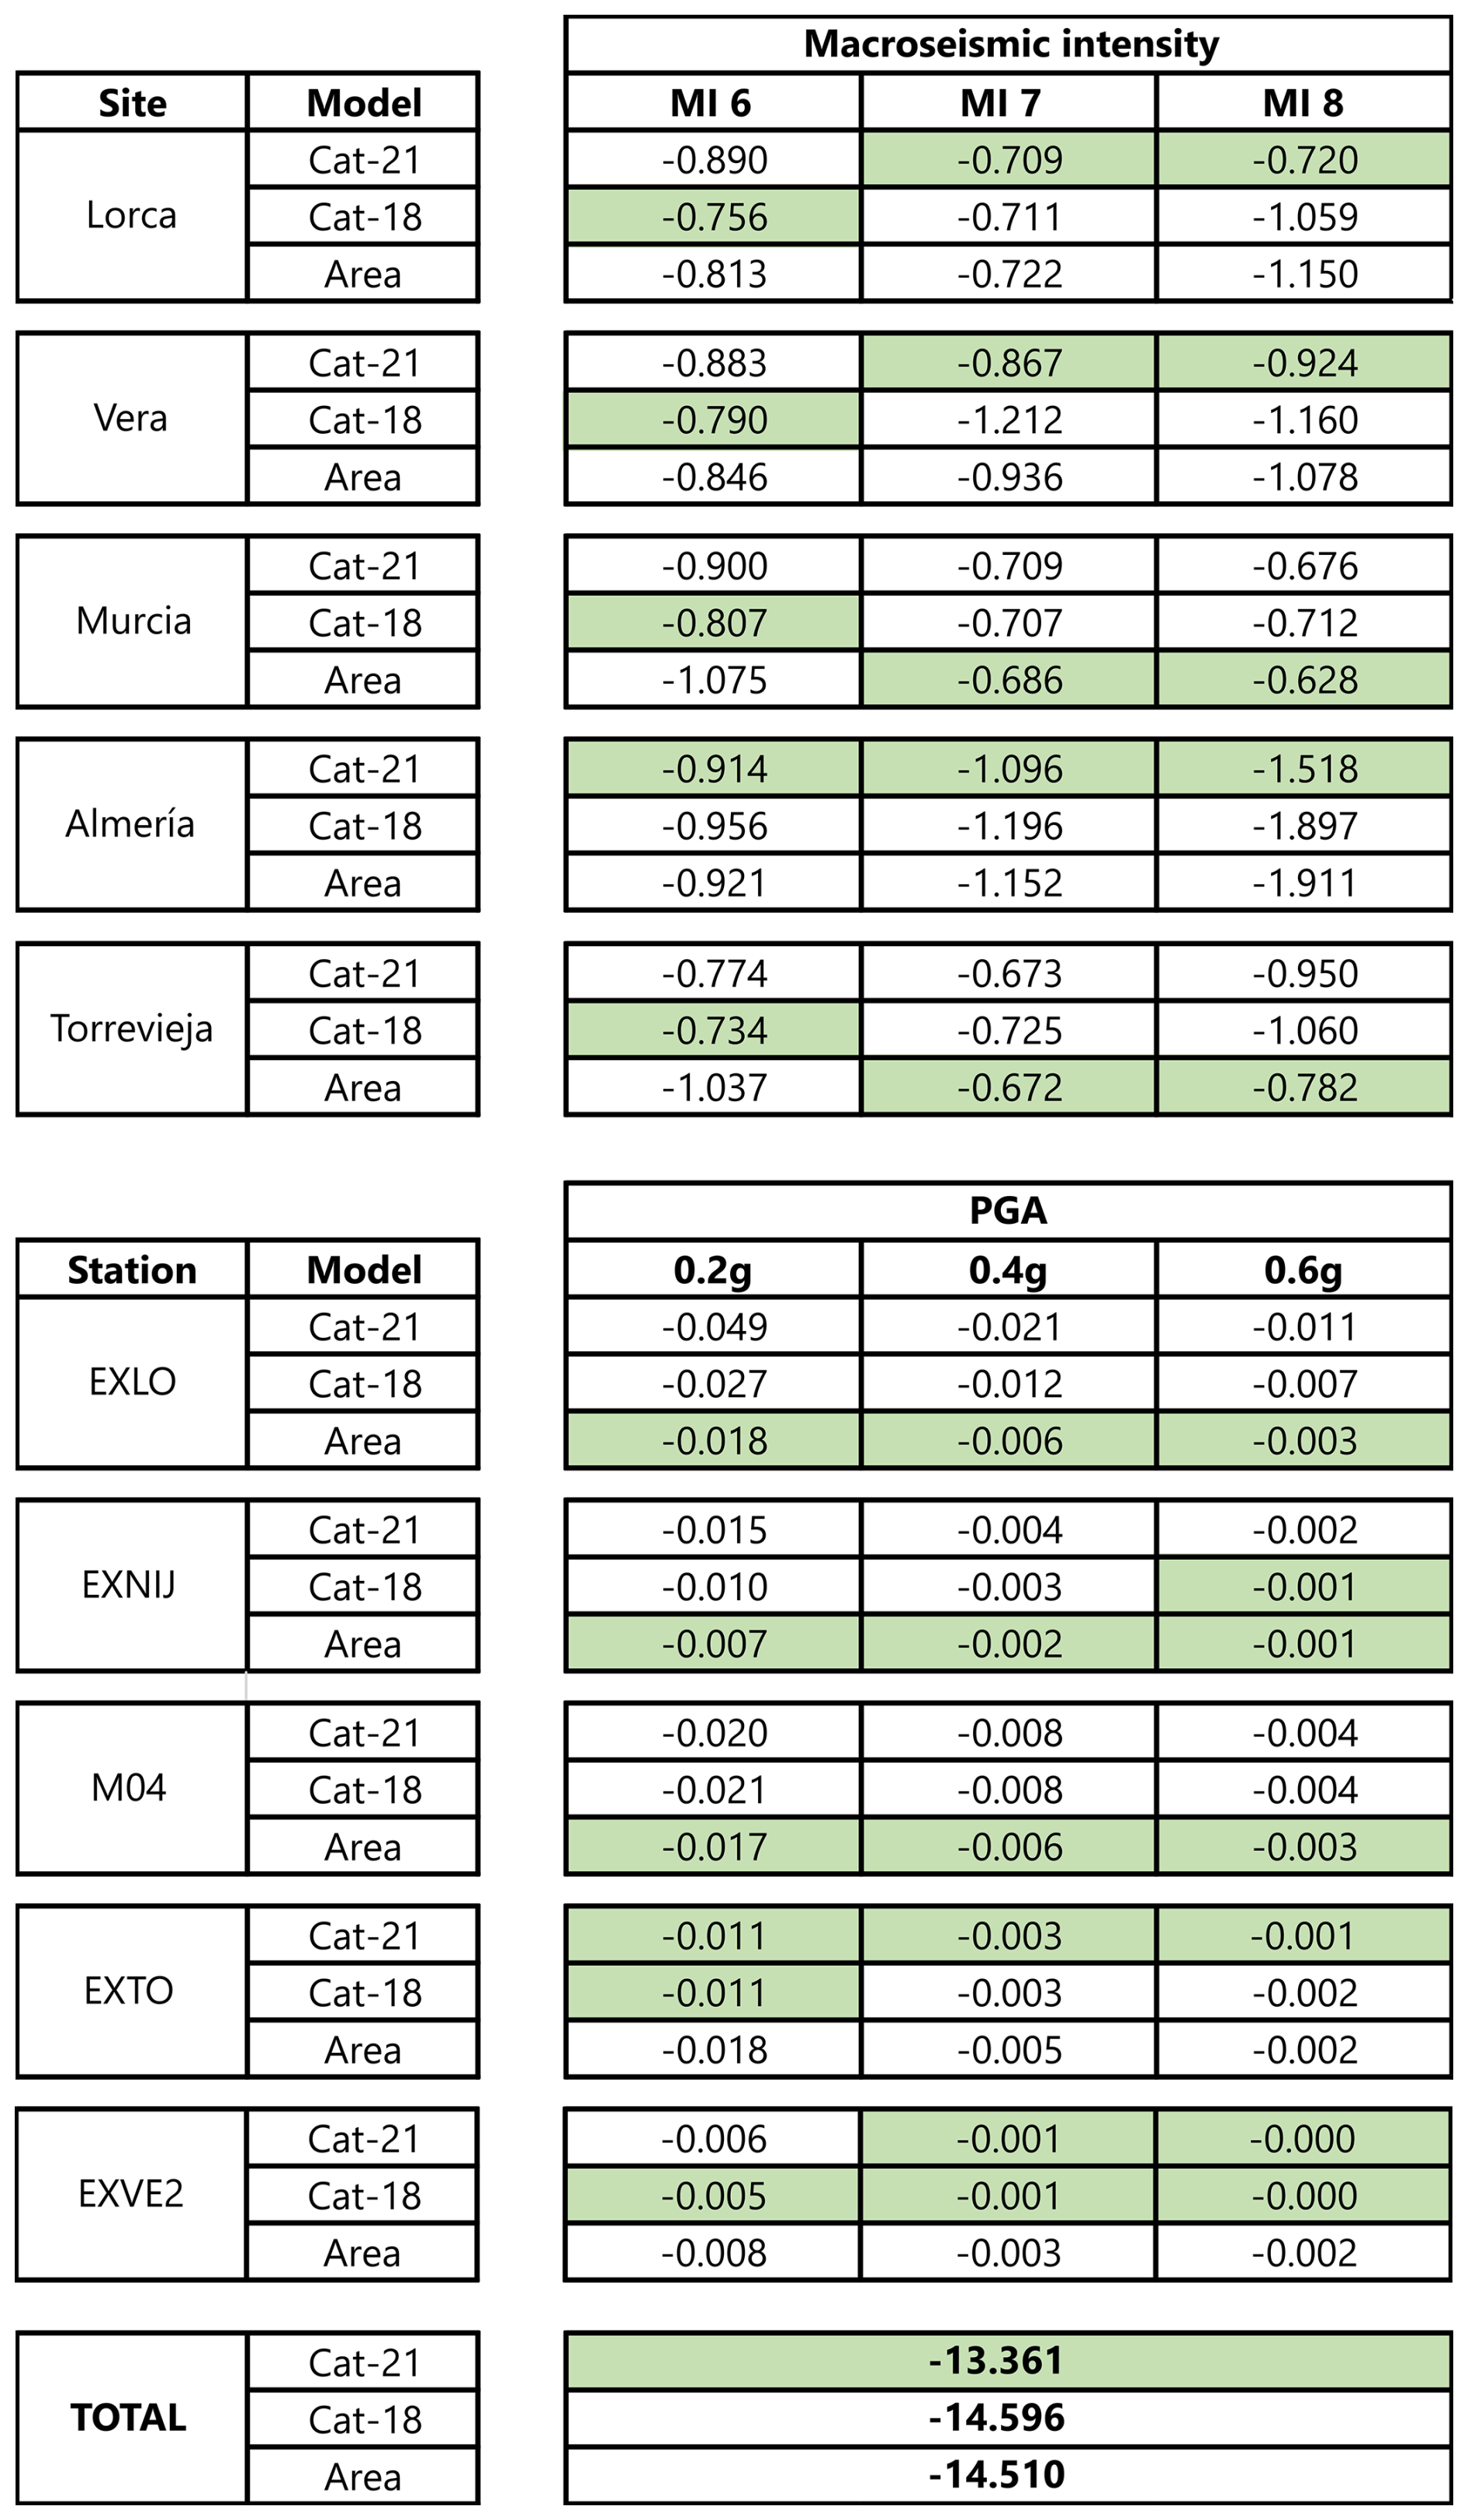
Figure 10LogP scores obtained for the three tested hazard models, Cat-21, Cat-18, and the area source model, across five localities and five instrumental stations. With green background, we mark the best model for each situation.
At the site-specific level, the Cat-21 model generally outperforms both Cat-18 and the area source model across the tested MI thresholds (MI ≥6, MI ≥7, and MI ≥8). Specifically: (i) for MI ≥ 6, Cat-21 yields the best (least negative) log-likelihood values at Almería; (ii) for MI ≥7, Cat-21 performs best at Lorca, Vera, and Almeria and; (iii) for MI ≥8, Cat-21 returns the highest likelihood at Lorca, Vera, and Almería. In contrast, the Cat-18 model performs slightly better at MI ≥6 thresholds in all sites <10 km from active faults (Lorca, Vera Murcia and Torrevieja) due to slight overprediction in Cat-21 (Fig. S2). Also, the area source model performs better in Murcia and Torrevieja for MI ≥7, as the physics-based models underestimate the exceedances in these locations. In these locations, where nearby active faults have less influence on the hazard (Fig. 6), the observations showcase a potential bias toward higher values because of the short completeness period of the different macroseismic intensity classes. That is, the completeness periods are shorter (few hundreds of years) than full earthquake cycles on those individual faults (thousands of years; see analysis of the catalogues by Herrero-Barbero et al., 2021).
In terms of instrumental data (PGA in Fig. 10), the LogP values indicate that the area source model outperforms the other models in most stations. However, differences are minor compared to the MI test as evidenced by the generally lower (closer to 0) p values. In these stations, the simulated catalogues slightly overpredict the observations relative to the area source model. This may be explained by the fact that the station records span, at best, 36 years, a considerably short time window to properly capture the Mw≥5.5 seismicity in a region where recurrence intervals average around 100 years (see Fig. S1 and the MFDs in Fig. 1b). Given that earthquake activity rates are highly variable over time, as illustrated by Herrero-Barbero et al. (2021) in the simulated catalogues, short observational periods are more likely to be affected by such variability, difficulting the accurate characterization of seismicity rates in the area source model. Conversely, the simulated catalogues perform better in Torrevieja and Vera, where active faults have low activity rates that do not influence the hazard significantly (Fig. 6). In these cases, the smoothing effect of the area source model distributes the hazard more evenly across the area source, leading to overestimated forecasts.
The overall model performance is assessed by computing the sum of LogP values across all macroseismic and instrumental thresholds. This global score aggregates all testing metrics so that the best-worst model pairs are not necessarily the ones that out- and under-perform in all metrics, respectively, but those that show the better-worse balance. Such a scheme ensures independence among metrics and avoids overfitting of the models to specific observation tests that might bias the scoring. This analysis returns a final summed LogP score of −13.361 for Cat-21, −14.596 for Cat-18 and −14.510 for the area source model. These results highlight that Cat-21 overall offers the most consistent predictions when both macroseismic intensities and acceleration records are considered, underscoring its potential in reproducing both short and long-term shaking patterns and damage, respectively.
The results presented in this study evaluate the viability of physics-based earthquake simulators for PSHA in low-to-moderate strain regions. On the one hand, we develop a pipeline approach to accurately include simulation-based earthquake ruptures, including complex rupture geometries, into PSHA calculations. On the other hand, we compute the probabilistic seismic hazard from two best and worst performing synthetic catalogues by Herrero-Barbero et al. (2021) at the EBSZ. Upon this we assess whether these models adequately reproduce the spatial variability in hazard by comparing them to macroseismic and ground shaking observations.
4.1 Pipeline of simulations to PSHA
Earthquake cycle simulators allow the generation of large earthquake rupture datasets, including complex multi-fault rupture geometries. However, such complexities are generally disregarded for PSHA as the most straightforward way to work with the simulator outputs is to use synthetic catalogues to assign earthquake rates to each specific fault source (e.g., Khodaverdian et al., 2016; Rafiei et al., 2022). This simplification deprecates earthquake rupture complexity (including multi-fault ruptures) and downgrades the accurate spatial representation of seismic hazard, as most engines, like OpenQuake, distribute earthquake ruptures uniformly over fault surfaces based only on the earthquake occurrence rates. Instead, the treatment of the simulated ruptures individually as finite characteristic sources allows to preserve physical features of ruptures within the fault system. As such, this formulation inherently allows the representation of multi-fault rupture complexity, preferent rupture concentration zones linked to fault geometry and rupture asymmetry, among others, onto the spatial distribution of the hazard. This physics-based approach can overcome difficulties frequently found in the definition and inclusion of multi-fault ruptures in fault-based PSHA, which require establishing pre-defined segmentation rules (e.g., Field et al., 2014; Chartier et al., 2017), usually based on empirical statistics on earthquake ruptures rather than on fully physics-based criteria.
The inclusion of detailed rupture geometries can be a critical benefit in some hazard assessments as spatial rupture representations govern the source-to-site distances, a key parameter in GMMs. Depending on the specific GMM, distances may be defined in terms of hypocentral, rupture, or Joyner-Boore distances, with those relying on hypocentral or rupture distances being particularly sensitive to the initiation location and final geometry of the rupture, respectively.
4.2 Seismic hazard results
Our results demonstrate that earthquake cycle simulations do not only reproduce the large-scale hazard patterns observed in the EBSZ, but they also capture the localized differences seen in empirical data. This means that, for one, physics-based models depict the influence of major faults in the territorial hazard. For another, the hazard results from physics-based estimates agree with local macroseismic and station records across the region. The agreement is not only quantitative (in terms of likelihood and statistical tests) but also spatially coherent across a range of return periods and intensities.
The overall better performance of the physics-based model Cat-21 compared to the area source model in the combined LogP scoring for macroseismic intensities and ground shaking, highlights the simulator's ability to generate realistic hazard statistics. Its ability to incorporate detailed fault geometry, long-term slip rates, and rupture behaviour into the ERF contributes to capturing key aspects of seismic hazard in regions with mapped active faults. Notably, the model's performance is strong in an area with sparse historical seismicity like the EBSZ, addressing a critical gap in conventional PSHA for low-to-moderate strain regions.
The physics-based model Cat-21 outperforms the area-source model against macroseismic empirical data, while the opposite happens for instrumental ground shaking observations. On the one hand, the hazard models from synthetic catalogues are influenced by larger magnitudes at higher rates than the area source model (see MFDs in Fig. 1). These magnitudes and rates reflect long-term behaviour of the fault system, which might explain the better agreement of this physics-based model to longer-term observations of the catalogue (macroseismic data). On the other hand, the more accurate spatial distribution of hazard along fault in the simulator-based models, likely resolves better the expected exceedances from macroseismic data compared to the area source model, which has a smoothing effect on hazard estimates. In terms of ground shaking, the area source model generally returns lower expected PGA exceedances for the short-term (station operational period) investigation time compared to the physics-based models at the station locations. In this case, even though the performance gap is less pronounced, the area source model performs slightly better than the physics-based models. This effect is likely a reflect of the self-consistency between the seismic catalogue – scarce in large magnitudes compared to the physics-based models – and the area source model, which is partly derived from the same catalogue (see Sect. 3).
Larger differences between the hazard from simulated models, especially our preferred catalogue Cat-21, and the area source model are found for smaller probabilities of exceedance (Fig. S3) – i.e., long-term hazard estimates. This pattern highlights one of the fundamental problems at the EBSZ and many other low-to-moderate strain regions: incomplete instrumental, historical and even geological datasets to properly characterize large magnitude occurrence. In this sense, the good performance of the simulated Cat-21 underscores the simulator's physical ability to reproduce consistent hazard statistics, especially for the long-term, and reinforces that one of the core values of physics-based simulators is their capability to improve completeness for long-term estimates. This result is aligned with previous findings in high seismicity regions like California (Shaw et al., 2018). However, the choice of simulation model is one crucial step in PSHA as it directly impacts the hazard estimates. In fact, in some cases, physics-based simulations can perform worse than statistical models like area sources, a feature that we observe for the synthetic catalogue Cat-18 (Fig. 10). This has to do with a central aspect of physics-based simulations, the parametrization, which can significantly influence the resulting simulated earthquake statistics. These parameters include the initial stress conditions, namely normal and shear stresses, frictional parameters of the fault such as the rate (a) and state (b) coefficients and other parameters like slip rate variability or fault geometry. In this study, we applied a benchmarking method that uses a proper scoring algorithm (Gómez-Novell et al., 2025a) to select the two synthetic catalogues that perform best and worst from the eleven computed by Herrero-Barbero et al. (2021). The method scores the catalogues based on their fit to a widely accepted scaling relationship, to a standard Gutenberg–Richter magnitude frequency distribution with a b value of 1, and the rates of paleoearthquakes at the EBSZ. This ensures that the consistency results for physics-based model Cat-21 are suitable for seismic hazard applications in the study area, while the results for Cat-18 highlight the relevance of choosing a proper model design in a physics-based framework.
4.3 Limitations
4.3.1 Model setup and parameters
Besides the advantages, there are limitations in our physics-based approach. In terms of the RSQSim models, it is important to highlight that these assume important simplifications in the driving friction parameters, as well as fault geometries and properties. First, initial friction and stressing conditions (variables of the rate-and-state law, shear stress) are considered uniform throughout the whole EBSZ faults. Despite this common practice in earthquake cycle simulations allows a reliable and realistic approximation to real catalogue statistics (e.g., Shaw et al., 2018, 2022; Delogkos et al., 2023), recent research has shown that the inclusion of friction and stressing variability (e.g, depth dependent) is able to produce more realistic earthquake rupture patterns as well as improving statistical features of the simulated MFDs and hypocentral depth distributions (Mika Liao et al., 2024).
Second, fault geometry and prescribed slip rates are also simplified in the EBSZ model. Faults are simplified into single surfaces, while slip rate is mostly assumed uniform in each fault throughout its whole surface. Similar to initial stress and friction conditions, simplified geometries and slip rate profiles can lead to less realistic features in the simulated catalogues. For instance, uniform slip rates are known to generate stress concentrations at the fault edges under the back-slip loading applied by RSQSim (Shaw, 2019), similar to low stress conditions near surface in depth-variable models. These stress perturbations can result in an unrealistically high number of earthquake hypocenters at these fault edge locations. Figure S4 shows depth distributions of earthquake hypocenters in the simulations for different magnitude thresholds. In Cat-21, a considerable amount of shallow earthquake hypocenters is present due to the low normal stress conditions near surface in this model (Fig. S5). Conversely, in Cat-18, earthquakes nucleate along the whole seismogenic depth, with higher concentration at the bottom due to back-slip effects paired with a uniform normal stress profile.
Despite this, in a rupture-based PSHA approach like ours, the overall coherence of the rupture geometry is more important than the nucleation point, so the impact to the hazard is likely limited. Although earthquakes might nucleate at overly shallow fault depths and fault tip locations, the overall placement – and outline – of the rupture is what determines the source-to-site distances, not the hypocenter. When using centroids as a proxy to the rupture placement on fault (Fig. S6), we observe that most ruptures tend to develop towards deeper parts of the fault regardless of the nucleation point. This is especially relevant for larger Mw>6 earthquakes, which are the ones that tend to control the lower probabilities of exceedance (long-term). In addition to all this, the Joyner and Boore distance employed further mitigates this issue, as the metric considers only the surface projection of the rupture, not its depth. In a fault system like the EBSZ, with most faults having high angle to subvertical dips, the sensitivity of source-to-site distances with rupture depth is likely minimal. Similarly, the centroid analysis indicates that ruptures develop along the whole fault length despite of fault-edge nucleation.
Having said that, for site-specific hazard purposes, the consideration of detailed earthquake nucleation locations and source-to-site distances is likely more relevant than in the current application. As such, detailed fault geometry characterization and slip rate profiles are needed. For instance, Delogkos et al. (2023) demonstrated that the inclusion of complexity in fault geometries and variable slip rate profiles along-strike and down dip, allowed to improve the simulated catalogues by removing characteristic behaviour and improving hypocenter depth distributions. Similarly, Allam et al. (2019) identified that fault roughness enhanced predictability in earthquake rupture location, which can be a critical point in earthquake rupture-dependent approaches like the present one.
The EBSZ is a complex fault system, where faults are generally composed by several fault strands with complex geometric links at depth, frictional properties, and slip rate partitioning (e.g., Herrero-Barbero et al., 2020; Gómez-Novell et al., 2022; Martín-Banda et al., 2021; Yazdi and García-Mayordomo, 2024). Considering complexity in fault friction, geometry and slip rate might help further refining the simulated catalogues and improve the accuracy of seismic hazard estimates, especially in a physics-based approach where the spatial variability component is key to the hazard. These epistemic uncertainties could be treated in a systematic way in the framework of a PSHA through the use of a logic tree approach in which the weight of each branch could be assigned by the fit to selected testing benchmarks (e.g., macroseismic intensities and ground shaking).
4.3.2 Model consistency
Validation of synthetic rupture sets through comparison with independent observational datasets, considered the gold standard in testing procedures, provides a robust mean to assess the predictive capability of region-specific physics-based models. In our study, we performed proper validation tests against both macroseismic and instrumental datasets for the simulated catalogues because validation data is not used for the physics-based modeling. Fault geometries, friction and slip rates come from geological datasets in the region (see Herrero-Barbero et al., 2021, for details), while model benchmarking is driven by their agreement with global empirical relationships and regional paleoseismic data not used for the validation step. In contrast, the performance of the area source model can only be assessed through consistency because the EBSZ seismic catalogue was the basis to develop the seismic parameters of the area source in the ZESIS database. In the consistency case, only the poorer performance of the area source model against the Cat-21 model in the macroseismic data tests is meaningful as it highlights lower adequacy of the model compared to the physics-based approach. Conversely, the superior performance in the ground shaking analysis reflects self-consistency rather than true predictive adequacy.
Extending the testing scheme beyond the current joint model to the different components of the seismic hazard models might improve robustness of the approach. For instance, disaggregated testing of model components, including ERF validation through comparisons between region-specific observed and simulated earthquake rates, and independent GMM evaluation would allow for a more complete assessment of the model quality by attributing performance to the individual components. At the same time, this would help to assess the contributions of the different components to the joint model performance.
Incorporating additional constraints from paleoseismic records or geological indicators into model evaluation would also help extend the applicability and robustness of the models for hazard curve testing, and would also introduce independence in area source consistency checks. For instance, in the EBSZ case, geological data is not used to define area source parameters, hence a consistency test with paleoseismic data would be fully independent.
4.3.3 Magnitude threshold
A limitation of our work, like in most fault-based PSHA studies, is the selection of the Mw 5.5 threshold above which ruptures are considered for the analysis, because with such selection comes the assumption that all earthquakes above that threshold are caused by the faults in the model. At the EBSZ, especially within the area source 55 (IGME, 2015), there is consensus that most moderate-to-large earthquakes are caused by the main known fault systems, supported by decades of seismicity and paleoseismic research (e.g., Sanz de Galdeano, et al., 2020). As such, most Mw≥5.5 earthquakes at the EBSZ have been attributed to the faults considered in this study (e.g., Yazdi and García-Mayordomo, 2024). Despite this, our magnitude threshold might also be debatable because Mw<5.5 earthquakes have also been caused by EBSZ faults, the most recent one being the 2011 Mw 5.1 Lorca earthquake (Martínez-Díaz et al., 2012). Leaving such earthquakes out removes the opportunity to test the models against non-zero observations at different stations. To tackle this limitation, we performed an alternative analysis considering a lower Mw 5.0 threshold. This implies extracting all ruptures of Mw≥5.0 from the simulated catalogues and re-computing hazard calculations as well as the consistency tests. The main difference in this case is that the macroseismic data includes intensity records from the 2011 Mw 5.1 Lorca earthquake and that station observations are not all zero, but include the PGA values from this same event. Macroseismic and station records are extracted from the IGN (2025) database for the different stations, and PGA for the 2011 earthquake is computed as the mean between N–S and E–W accelerometer components (Table S3). All analyses in figures from this secondary test are available in the Supplement (Figs. S7–S10).
Considering a lower magnitude threshold rejects the poissonian process for Cat-18 (Fig. S7), meaning that earthquake occurrence in this catalogue cannot be treated as time-independent. Consequently, the subsequent hazard analysis (based on the Poisson assumption) is less meaningful. Despite this, the analysis raises some insightful points as we discuss.
In this test, the area source model outperforms both simulated catalogues for the combined macroseismic and PGA consistency analyses, although performances are very similar between Cat-21 and the area source model. In general discrepancies between observations and models are larger, evidenced by larger LogP values (Fig. S9), but smaller between models. Although the score rank patterns observed for the Mw 5.5 assumption are similar (i.e., overforecasting and underforecasting of observations; Figs. S8 and S9), here, the area source model performs better in more intensity measure level classes, particularly for macroseismic data, while Cat-21 steps down as the best-performing model in some locations. As such, for instance, cities like Lorca, Murcia and Torrevieja all perform better in the area source model for the MI 6 class, while Cat-21 is not the best performing model anymore in Lorca for MI ≥ 7 (Fig. S10).
The larger (worse) LogP scores and the overall better performance of the area source model suggest that the consideration of magnitudes below Mw 5.5 on faults (simulated catalogues) is less appropriate. That is, the magnitudes below this threshold might be related to other fault sources not considered in the current study (e.g., secondary faults) and, therefore, they do not necessarily follow the MFD of the faults considered. In addition, the overall increase in the LogP scores for the area source model compared to the previous models suggests that Mw<5.5 are less adequate to explain observations within the region and might evidence issues in the seismicity assignation to the EBSZ area source 55. Smaller magnitudes increase epicentral location uncertainties for historical events, and historical events compose most of the Mw>5 seismicity assigned to area source 55. In fact, 67 % of the Mw≥4 earthquakes at the EBSZ are previous to 1962 with epicentral errors larger than 10–20 km (IGN-UPM, 2013; García-Mayordomo, 2005). Thus, lowering the magnitude threshold increases the chances of inaccuracies in the seismicity assignation to the area source that might explain the lower performance. Cat-18 remains the model with the poorest performance, further highlighting the relevance of a proper benchmarking of the simulations prior to the hazard assessment.
Accounting for the magnitude threshold limitations depicted in this analysis is important for PSHA, and underscores the importance of combining fault-based approaches with distributed source methods to better capture the whole range of epistemic uncertainties in the hazard, especially for regulatory hazard evaluations.
4.4 Implications for low-to-moderate strain regions
We evaluate the performance of seismic hazard estimates from physics-based earthquake rupture forecasts in southern Spain, compared to a traditional area source model. To do so, we compare the hazard models to empirical observations on macroseismic intensity and ground shaking in the region. The physics-based models inherently incorporate fault rupture complexity including multi-fault ruptures, and long-term fault interaction across seismic cycles in 50 kyr long catalogues. When physics-based models are properly parametrized to match empirical earthquake observations (Cat-21), we find that they outperform the area source model for the macroseismic data, while the area source model shows better consistency for the ground shaking tests. These results suggest that the physics-based approach can estimate long-term hazard better than area sources, a fact that can be of high value and broad applicability in low-to-moderate strain regions, where long-term fault behaviour is particularly uncertain, and hazard estimates are usually restricted to the available seismic catalogues. Moreover, the physics-based models allow a better spatial representation of the hazard along the fault zones, which can help to prioritize hazard mitigation strategies and territorial planning in the region.
As opposed to other fault-based approaches, such as analytical developments based on seismicity rate modeling, earthquake cycle simulators inherently incorporate physical constraints on fault rupturing into the simulated earthquake catalogues. On the one hand, this minimises potential biases in expert judgment introduced during the definition of earthquake rupture complexity and fault interaction. On the other hand, these simulators allow to model earthquake catalogues beyond the recorded seismicity. This feature is particularly useful in low-to-moderate strain regions like the EBSZ, where the historical earthquake catalogue is scarce compared to the long recurrence periods of active faults (Herrero-Barbero et al., 2021).
Nevertheless, area source models remain a valuable component of probabilistic seismic hazard analysis, even if they are incomplete for large events in the instrumental records. In this study, the area source model shows good consistency with PGA exceedances at short observational periods and second-to-best performance in the macroseismic intensity tests (above Cat-18). Their flexibility, broad applicability, and robustness, especially at low shaking thresholds or in regions where detailed fault data are lacking, make them essential tools in regional-scale assessments. In particular, their tendency to smooth the hazard over space can provide conservative estimates in data-scarce zones and complement the more localized/detailed outputs of fault-based approaches. This would be particularly relevant for a larger-scale regional approach, since outside the EBSZ most faults in southern Spain lack the detailed information required to support the type of modeling presented here.
The overall good agreement between models and observations, indicates that physics-based and area source models should be viewed as complementary, rather than competing. A combined use of both, for instance, within a logic-tree framework, may offer a more complete representation of epistemic uncertainties, highlighting the strengths of each modeling approach. In this context, the integration of physics-based earthquake rupture forecasts into broader hazard modeling strategies can enhance the resolution and accuracy of hazard estimates, without compromising the stability offered by more traditional models.
We recommend integrating physics-based PSHA models to better account for large lower-frequency events combined with traditional approaches that model historical and instrumental data for background low-to-moderate magnitude events, within an ensemble or logic tree framework. For instance, given that all models passed the statistical tests, they could be weighted in a logic tree based on their performance in such tests – i.e., the global LogP scoring. Alternatively, zonified and physics-based models could be combined into a single model, tackling short-term and long-term estimates, respectively. This combined approach between physics-based and data-driven models is well established in fields such as hydrological and climate sciences, and referred to as hybrid modelling (e.g., Hussain et al., 2021; Liu et al., 2025). Hybridization is also well established in empirical PSHA models through the combination of distributed seismicity and fault sources, but not using physics-based approaches. Hybrid empirical and physics-based models would enable the consideration of epistemic uncertainties linked to data and modeling approaches, while retaining the complexity of rupture processes inherent to earthquake cycle models. In addition to that, physics-based models can explore further important sources of uncertainty, such as the temporal variability in the hazard, and therefore address known limitations of current approaches, as noted by Gerstenberger et al. (2020). This can be achieved by comparing simulated catalogues of variable durations (e.g., 10 vs. 50 kyr), providing insights into the time dependence of hazard. Finally, coupling RSQSim with dynamic ground-motion models (e.g., Milner et al., 2021) may improve shaking estimates, particularly for near-fault sites.
Our simulator-to-hazard pipeline together with the proposed hazard testing workflow are easily transferrable and broadly applicable to other regions and tectonic settings, allowing for an easy implementation to PSHA routines in the future.
This study presents the development and evaluation of physics-based probabilistic seismic hazard models in the Eastern Betic Shear Zone (EBSZ), a low-to-moderate strain fault system in southern Spain. Using long-term RSQSim earthquake cycle simulation models by Herrero-Barbero et al. (2021), we construct two earthquake rupture forecasts (ERF) corresponding to the best and worst performing catalogues according to a benchmark analysis: Cat-21 and Cat-18, respectively. We pipeline them into a PSHA calculation using the OpenQuake Engine and compare their hazard outputs with those from a classical area source model (ZESIS model). The performance of the three models is evaluated with consistency tests against both macroseismic intensity observations over the last millennium and ground motion records.
Our results show that the Cat-21 model provides the best agreement out of all three, outperforming the area source model, particularly at sites located near the faults with faster rates, and across the range of intensity thresholds and selected ground-motion levels. The performance of Cat-21, especially to long-term macroseismic data, highlights the value of incorporating complex fault rupture geometries and long-term recurrence in PSHA, both inherent products of earthquake cycle simulators. These features are especially relevant in regions where empirical data are sparse or heterogeneously distributed, and therefore fault behaviour characterization becomes particularly challenging. Despite this, the classical area source approach also shows good agreement with observed macroseismic intensities and accelerometric exceedances, highlighting the complementarity of both approaches to better capture epistemic uncertainties in seismic hazard.
Physics-based models, when properly calibrated, produce credible large-scale hazard patterns and also capture the localized variability in seismic hazard associated with near-fault effects. Thus, our findings support that the integration of physics-based ERFs within more standardized PSHA workflows is feasible and effective. First, earthquake simulators are able to introduce the physical features of fault behaviour into seismic hazard assessment, including complex fault ruptures and fault system scale long-term fault interaction. Second, these simulators allow to extend earthquake catalogues beyond instrumental and historical coverages, overcoming completeness limitations of seismicity catalogues and offering a complementary approach to purely empirical methods (e.g., Gutenberg–Richter distributions or spatial smoothing). Future developments should aim at combining simulator-based ERFs with advanced ground motion simulation tools to deploy fully physics-based PSHA. Additionally, paleoseismological data can be used for further validating model outputs.
Earthquake cycle simulators represent robust tools ready to be implemented in next-generation PSHA, not only for low-to-moderate strain, tectonically complex regions, but also across fault systems worldwide. Importantly, our study pinpoints that physics-based models require proper benchmarking against empirical seismic and geological observations before being pipelined into a PSHA calculation.
The RSQSim code, developed by Richards-Dinger and Dieterich (2012), can be obtained from the authors upon request. The code to convert earthquake simulator ruptures to OpenQuake format inputs is stored at a GitHub respository: https://doi.org/10.5281/zenodo.20442522 (Gómez-Novell, 2026).
Seismic hazard models, including input files and hazard results, are available in a Zenodo repository under the CC-BY 4.0 license (https://doi.org/10.5281/zenodo.19471309, Gómez-Novell et al., 2025b).
The supplement related to this article is available online at https://doi.org/10.5194/nhess-26-2691-2026-supplement.
OGN: Conceptualization, Methodology, Software, Validation, Formal Analysis, Investigation, Data Curation, Writing (original Draft Preparation), Visualization; FV: Conceptualization, Methodology, Software, Validation, Formal Analysis, Investigation, Data Curation, Writing (original Draft Preparation), Visualization; PHB: Investigation, Data Curation, Writing (review and editing); JAAG: Investigation, Resources, Funding acquisition, Writing (review and editing); JGM: Investigation, Resources, Funding acquisition, Writing (review and editing).
The contact author has declared that none of the authors has any competing interests.
Publisher's note: Copernicus Publications remains neutral with regard to jurisdictional claims made in the text, published maps, institutional affiliations, or any other geographical representation in this paper. The authors bear the ultimate responsibility for providing appropriate place names. Views expressed in the text are those of the authors and do not necessarily reflect the views of the publisher.
We thank editor Veronica Pazzi and three anonyomus reviewers whose comments allowed us to improve the manuscript. We also thank Luis Cabañas at the Instituto Geográfico Nacional (IGN) for providing data regarding accelerometric stations.
This research work was funded by the European Commission – NextGenerationEU, through Momentum CSIC Programme: Develop Your Digital Talent (project GDxGT; ref. MMT24-IGME-02) and by the Model_SHaKER project (ref. PID2021-124155NB-C31) funded by Spanish State Research Agency. Julián García-Mayordomo is supported by the NSOURCES project (ref. PID2020119772RB-I00) funded by Spanish State Research Agency. Paula Herrero-Barbero is supported from a Juan de la Cierva fellowship funded by the Spanish Ministry of Science, Innovation and Universities.
The article processing charges for this open-access publication were covered by the CSIC Open Access Publication Support Initiative through its Unit of Information Resources for Research (URICI).
This paper was edited by Veronica Pazzi and reviewed by three anonymous referees.
Albarello, D., Camassi, R., and Rebez, A.: Detection of space and time heterogeneity in the completeness of a seismic catalog by a statistical approach: an application to the Italian area, B. Seismol. Soc. Am., 91, 1694–1703, https://doi.org/10.1785/0120000058, 2001.
Allam, A. A., Kroll, K. A., Milliner, C. W. D., and Richards-Dinger, K. B.: Effects of fault roughness on coseismic slip and earthquake locations, J. Geophys. Res.-Sol. Ea., 124, 11336–11349 https://doi.org/10.1029/2018JB016216, 2019.
Bindi, D., Massa, M., Luzi, L., Ameri, G., Pacor, F., Puglia, R., and Augliera, P.: Pan-European ground-motion prediction equations for the average horizontal component of PGA, PGV, and 5 %-damped PSA at spectral periods up to 3.0 s using the RESORCE dataset, B. Earthq. Eng., 12, 391–430, https://doi.org/10.1007/s10518-013-9525-5, 2014.
Brune, J. N.: Seismic moment, seismicity, and rate of slip along major fault zones, J. Geophys. Res., 73, 777–784, https://doi.org/10.1029/JB073i002p00777, 1968.
Cappa, F., Perrin, C., Manighetti, I., and Delor, E.: Off-fault long-term damage: A condition to account for generic, triangular earthquake slip profiles, Geochem. Geophy. Geosy., 15, 1476–1493, https://doi.org/10.1002/2013GC005182, 2014.
Cataldi, L., Tiberi, L., and Costa, G.: Estimation of MCS intensity for Italy from high quality accelerometric data, using GMICEs and Gaussian Naïve Bayes classifiers, B. Earthq. Eng., 19, 2325–2342, https://doi.org/10.1007/s10518-021-01064-6, 2021.
Chartier, T., Scotti, O., and Lyon-Caen, H.: SHERIFS: Open-Source Code for Computing Earthquake Rates in Fault Systems and Constructing Hazard Models, Seismol. Res. Lett., 90.4, 1678–1688, https://doi.org/10.1785/0220180332%E2%80%8B%E2%80%8B%E2%80%8B%E2%80%8B%E2%80%8B%E2%80%8B, 2019.
Chartier, T., Scotti, O., Lyon-Caen, H., Richard-Dinger, K., Dieterich, J. H., and Shaw, B. E.: Modelling earthquake rates and associated uncertainties in the Marmara Region, Turkey, Nat. Hazards Earth Syst. Sci., 21, 2733–2751, https://doi.org/10.5194/nhess-21-2733-2021, 2021.
Cornell, C. A.: Engineering Seismic Risk Analysis, B. Seismol. Soc. Am., 58, 1583–1606, https://doi.org/10.1785/BSSA0580051583, 1968.
Cowie, P. A., Roberts, G. P., Bull, J. M., and Visini, F.: Relationships between fault geometry, slip rate variability and earthquake recurrence in extensional settings, Geophys. J. Int., 189, 143–160, https://doi.org/10.1111/j.1365-246X.2012.05378.x, 2012.
D'Amico, V., Visini, F., Rovida, A., Marzocchi, W., and Meletti, C.: Scoring and ranking probabilistic seismic hazard models: an application based on macroseismic intensity data, Nat. Hazards Earth Syst. Sci., 24, 1401–1413, https://doi.org/10.5194/nhess-24-1401-2024, 2024.
Danciu, L., Nandan, S., Reyes, C., Basili, R., Weatherill, G., Beauval, C., Rovida, A., Vilanova, S., Sesetyan, K., Bard, P.-Y., Cotton, F., Wiemer, S., and Giardini, D.: The 2020 update of the European Seismic Hazard Model: Model Overview, EFEHR Technical Report 001, v1.0.0, https://doi.org/10.12686/a15, 2021.
Danciu, L., Giardini, D., Weatherill, G., Basili, R., Nandan, S., Rovida, A., Beauval, C., Bard, P.-Y., Pagani, M., Reyes, C. G., Sesetyan, K., Vilanova, S., Cotton, F., and Wiemer, S.: The 2020 European Seismic Hazard Model: overview and results, Nat. Hazards Earth Syst. Sci., 24, 3049–3073, https://doi.org/10.5194/nhess-24-3049-2024, 2024.
De Larouzière, F., Bolze, J., Bordet, P., Hernandez, J., Montenat, C., and d'Estevou, P. O.: The Betic segment of the lithospheric Trans-Alboran shear zone during the Late Miocene, Tectonophysics, 152, 41–52, https://doi.org/10.1016/0040-1951(88)90028-5, 1988.
Delogkos, E., Howell, A., Seebeck, H., Shaw, B. E., Nicol, A., Mika Liao, Y.-W., and Walsh, J. J.: Impact of Variable Fault Geometries and Slip Rates on Earthquake catalogues From Physics-Based Simulations of a Normal Fault, J. Geophys. Res.-Sol. Ea., 128, e2023JB026746, https://doi.org/10.1029/2023JB026746, 2023.
Dieterich, J. H.: Modeling of rock friction: 1. Experimental results and constitutive equations, J. Geophys. Res., 84, 2161–2168, https://doi.org/10.1029/JB084iB05p02161, 1979.
Esteva, L.: Criterios para la construcción de espectros para diseño sísmico, Proceedings of XII Jornadas Sudamericanas de Ingeniería Estructural y III Simposio Panamericano de Estructuras, Caracas, 1967, Boletín del Instituto de Materiales y Modelos Estructurales, Universidad Central de Venezuela, No. 19, 1967.
Esteva, L.: Bases para la formulación de decisiones de diseño sísmico, PhD thesis, Universidad Autónoma Nacional de México, https://repositorio.unam.mx/contenidos/66310 (last access: 30 May 2026), 1968.
Faure Walker, J. P., Visini, F., Roberts, G., Galasso, C., McCaffrey, K., and Mildon, Z.: Variable Fault Geometry Suggests Detailed Fault-Slip-Rate Profiles and Geometries Are Needed for Fault-Based Probabilistic Seismic Hazard Assessment (PSHA), B. Seismol. Soc. Am., 109, 110–123, https://doi.org/10.1785/0120180137, 2019.
Field, E. H., Jordan, T. H., and Cornell, C. A.: OpenSHA – A developing Community-Modeling Environment for Seismic Hazard Analysis, Seismol. Res. Lett., 74, 406–419, https://doi.org/10.1785/gssrl.74.4.406, 2003.
Field, E. H., Arrowsmith, R. J., Biasi, G. P., Bird, P., Dawson, T. E., Felzer, K. R., Jackson, D. D., Johnson, K. M., Jordan, T. H., Madden, C., Michael, A. J., Milner, K. R., Page, M. T., Parsons, T., Powers, P. M., Shaw, B. E., Thatcher, W. R., Weldon, R. J., and Zeng, Y.: Uniform California Earthquake Rupture Forecast, version 3 (UCERF3) – The time-independent model, B. Seismol. Soc. Am., 104, 1122–1180, https://doi.org/10.1785/0120130164, 2014.
García-Mayordomo, J.: Caracterización y análisis de la peligrosidad sísmica en el sureste de España, PhD thesis, Universidad Complutense de Madrid, Madrid, Spain, https://aplicaciones.ciencia.gob.es/teseo/#/tesis/O124642/detalle (last access: 30 May 2026), 2005.
García-Mayordomo, J.: Creación de un modelo de zonas sismogénicas para el cálculo del mapa de peligrosidad sísmica de España, Instituto Geológico y Minero de España, Madrid, 125 pp., ISBN 978-84-7840-964-8, 2015.
García-Mayordomo, J., Gaspar-Escribano, J. M., and Benito, B.: Seismic hazard assessment of the Province of Murcia (SE Spain): analysis of source contribution to hazard, J. Seismol., 11, 453–471, https://doi.org/10.1007/s10950-007-9064-0, 2007.
García-Mayordomo, J., Martín-Banda, R., Insua-Arévalo, J. M., Álvarez-Gómez, J. A., Martínez-Díaz, J. J., and Cabral, J.: Active fault databases: building a bridge between earthquake geologists and seismic hazard practitioners, the case of the QAFI v.3 database, Nat. Hazards Earth Syst. Sci., 17, 1447–1459, https://doi.org/10.5194/nhess-17-1447-2017, 2017.
Gerstenberger, M. C., Marzocchi, W., Allen, T., Pagani, M., Adams, J., Danciu, L., Field, E. H., Fujiwara, H., Luco, N., Ma, F., Meletti, C., and Petersen, M. D.: Probabilistic Seismic Hazard Analysis at Regional and National Scales: State of the Art and Future Challenges, Rev. Geophys., 58, e2019RG000653, https://doi.org/10.1029/2019RG000653, 2020.
Gerstenberger, M. C., Van Dissen, R., Rollins, C., DiCaprio, C., Thingbaijim, K. K. S., Bora, S., Chamberlain, C., Christophersen, A., Coffey, G. L., Ellis, S. M., Iturrieta, P., Johnson, K. M., Litchfield, N. J., Nicol, A., Milner, K. R., Rastin, S. J., Rhoades, D., Seebeck, H., Shaw, B. E., Stirling, M. W., Wallace, L., Allen, T. I., Bradley, B. A., Charlton, D., Clark, K. J., Fraser, J., Griffin, J., Hamling, I. J., Howell, A., Hudson‐Doyle, E., Hulsey, A., Jurgens, V. O., Kaiser, A. E., Kirkman, R., Langridge, R. M., Maurer, J., Rattenbury, M. S., Ristau, J., Schorlemmer, D., Townend, J., Villamor, P., and Williams, C.: The seismicity rate model for the 2022 Aotearoa New Zealand National Seismic Hazard Model, B. Seismol. Soc. Am., 114, 182–216, https://doi.org/10.1785/0120230165, 2024.
Gneiting, T. and Katzfuss, M.: Probabilistic Forecasting, Annu. Rev. Stat. Appl., 1, 125–151, https://doi.org/10.1146/annurev-statistics-062713-085831, 2014.
Gómez-Capera, A. A., D'Amico, M., Lanzano, G., Locati, M., and Santulin, M.: Relationships between ground motion parameters and macroseismic intensity for Italy, B. Earthq. Eng., 18, 5143–5164, https://doi.org/10.1007/s10518-020-00905-0, 2020.
Gómez-Novell, O.: Simulator to Openquake: release 1, Zenodo [code], https://doi.org/10.5281/zenodo.20442522, 2026.
Gómez-Novell, O., García-Mayordomo, J., Ortuño, M., Masana, E., and Chartier, T.: Fault System-Based Probabilistic Seismic Hazard Assessment of a Moderate Seismicity Region: The Eastern Betics Shear Zone (SE Spain), Front. Earth Sci., 8, 579398, https://doi.org/10.3389/feart.2020.579398, 2020.
Gómez-Novell, O., Ortuño, M., García-Mayordomo, J., Insua-Arévalo, J. M., Rockwell, T. K., Baize, S., Martínez-Díaz, J. J., Pallàs, R., and Masana, E.: Improved geological slip rate estimations in the complex Alhama de Murcia Fault zone (SE Iberia) and its implications for fault behavior, Tectonics, 41, e2022TC007465, https://doi.org/10.1029/2022TC007465, 2022.
Gómez-Novell, O., Pace, B., Visini, F., Faure Walker, J., and Scotti, O.: Deciphering past earthquakes from the probabilistic modeling of paleoseismic records – the Paleoseismic EArthquake CHronologies code (PEACH, version 1), Geosci. Model Dev., 16, 7339–7355, https://doi.org/10.5194/gmd-16-7339-2023, 2023.
Gómez-Novell, O., Visini, F., Pace, B., Álvarez-Gómez, J. A., and Herrero-Barbero, P.: A Benchmarking Method to Rank the Performance of Physics-Based Earthquake Simulations, Seismol. Res. Lett., 96, 231–243, https://doi.org/10.1785/0220240027, 2025a.
Gómez-Novell, O., Visini, F., Herrero-Barbero, P., Álvarez-Gómez, J. A., and García-Mayordomo, J.: Earthquake cycle seismic hazard models for the Eastern Betic Shear Zone, Zenodo [data set], https://doi.org/10.5281/zenodo.19471309, 2025b.
Graves, R., Jordan, T. H., Callaghan, S., Deelman, E., Field, E., Juve, G., Kesselman, C., Maechling, P., Mehta, G., Milner, K., Okaya, D., Small, P., and Vahi, K.: CyberShake: A physics-based seismic hazard model for southern California, Pure Appl. Geophys., 168, 367–381, https://doi.org/10.1007/s00024-010-0161-6, 2011.
Hergert, T. and Heidbach, O.: Slip-rate variability and distributed deformation in the Marmara Sea fault system, Nat. Geosci., 3, 132–135, https://doi.org/10.1038/ngeo739, 2010.
Herrero-Barbero, P., Álvarez-Gómez, J. A., Martínez-Díaz, J. J., and Klimowitz, J.: Neogene Basin inversion and recent slip rate distribution of the northern termination of the Alhama de Murcia Fault (Eastern Betic Shear Zone, SE Spain), Tectonics, 39, 1–25, https://doi.org/10.1029/2019TC005750, 2020.
Herrero-Barbero, P., Álvarez-Gómez, J. A., Williams, C., Villamor, P., Insua-Arévalo, J. M., Alonso-Henar, J., and Martínez-Díaz, J. J.: Physics-based earthquake simulations in slow-moving faults: A case study from the eastern Betic shear zone (SE Iberian Peninsula), J. Geophys. Res.-Sol. Ea., 126, e2020JB021133, https://doi.org/10.1029/2020JB021133, 2021.
Herrero-Barbero, P., Álvarez-Gómez, J. A., Tsige, M., and Martínez-Díaz, J. J.: Deterministic seismic hazard analysis from physics-based earthquake simulations in the Eastern Betics (SE Iberia), Eng. Geol., 327, 107364 https://doi.org/10.1016/j.enggeo.2023.107364, 2023.
Howarth, J. D., Barth, N. C., Fitzsimons, S. J., Richards-Dinger, K., Clark, K. J., Biasi, G. P., Cochran, U. A., Langridge, R. M., Berryman, K. R., and Sutherland, R.: Spatiotemporal clustering of great earthquakes on a transform fault controlled by geometry, Nat. Geosci., 14, 314–320, https://doi.org/10.1038/s41561-021-00721-4, 2021.
Hussain, F., Wu, R.-S., and Wang, J.-X.: Comparative study of very short-term flood forecasting using physics-based numerical model and data-driven prediction model, Nat. Hazards, 107, 249–284, https://doi.org/10.1007/s11069-021-04582-3, 2021.
Iezzi, F., Mildon, Z., Walker, J. F., Roberts, G., Goodall, H., Wilkinson, M., and Robertson, J.: Coseismic Throw Variation Across Along-Strike Bends on Active Normal Faults: Implications for Displacement Versus Length Scaling of Earthquake Ruptures, J. Geophys. Res.-Sol. Ea., 123, 9817–9841, https://doi.org/10.1029/2018JB016732, 2018.
Instituto Geográfico Nacional (IGN) – Universidad Politécnica de Madrid (UPM): Actualización de Mapas de Peligrosidad Sísmica de España 2012, https://doi.org/10.7419/162.05.2017, 2013.
Instituto Geográfico Nacional (IGN): Catálogo de Terremotos, IGN, https://doi.org/10.7419/162.03.2022, 2022.
Instituto Geográfico Nacional (IGN): Seismic Alert Network Stations, https://www.ign.es/web/ca/ign/portal/sis-area-sismicidad (last access: 30 October 2025), 2025.
Instituto Geológico y Minero de España (IGME): ZESIS: Base de Datos de Zonas Sismogénicas de la Península Ibérica y territorios de influencia para el cálculo de la peligrosidad sísmica en España, https://info.igme.es/zesis (last access: 15 September 2025), 2015.
Instituto Geológico y Minero de España (IGME): QAFI v4: Quaternary-Active Faults Database of Iberia, https://info.igme.es/qafi/ (last access: 30 July 2025), 2022.
Kempf, P. and Moernaut, J.: Age uncertainty in recurrence analysis of paleoseismic records, J. Geophys. Res.-Sol. Ea., 126, e2021JB021996, https://doi.org/10.1029/2021JB021996, 2021.
Khodaverdian, A., Zafarani, H., Rahimian, M.: Using a physics-based earthquake simulator to evaluate seismic hazard in NW Iran, Geophys. J. Int., 206, 379–394, https://doi.org/10.1093/gji/ggw157, 2016.
Liu, B., Yun, X., Pan, B., Xu, X., Gaffney, P. P. J., Lu, H., Luo, L., Sun, G., and Tang, Q.: Assess the impacts of climatic change and human activities on streamflow and floods by using a hybrid-physics-data (HPD) model: a case study in the Lancang–Mekong River Basin, Earth Syst. Hydrol. Reg. Stud., 61, 102763, https://doi.org/10.1016/j.ejrh.2025.102763, 2025.
Lombardi, A. M., Cinti, F. R., and Pantosti, D.: Paleoearthquakes modelling and effects of uncertainties on probability assessment of next fault ruptures: the case of Central Italy surface faulting earthquakes, Geophys. J. Int., 241, 1327–1347, https://doi.org/10.1093/gji/ggaf105, 2025.
Martín-Banda, R., Insua-Arévalo, J. M., and García-Mayordomo, J.: Slip Rate Variation During the Last ∼210 ka on a Slow Fault in a Transpressive Regime: The Carrascoy Fault (Eastern Betic Shear Zone, SE Spain), Front. Earth Sci., 8, 1–21, https://doi.org/10.3389/feart.2020.599608, 2021.
Martínez-Díaz, J. J., Bejar-Pizarro, M., Álvarez-Gómez, J. A., Mancilla, Pérez, F. de L., Stich, D., Herrera G., and Morales, J.: Tectonic and seismic implications of an intersegment rupture: The damaging May 11th 2011 Mw 5.2 Lorca, Spain, earthquake, Tectonophysics, 546–547, 28–37, https://doi.org/10.1016/j.tecto.2012.04.010, 2012.
Marzocchi W. and Jordan, T. H.: Testing for ontological errors in probabilistic forecasting models of natural systems, P. Natl. Acad. Sci. USA, 111, 11973–11978, https://doi.org/10.1073/pnas.1410183111, 2014.
Marzocchi W. and Taroni, M.: Some thoughts on declustering in probabilistic seismic hazard analysis, B. Seismol. Soc. Am., 104, 1838–1845, https://doi.org/10.1785/0120130300, 2014.
McGuire, R. K.: FORTRAN computer program for seismic risk analysis, Open-File report 76–67, United States Department of the Interior, Geological Survey, 102 pp., https://doi.org/10.3133/ofr7667, 1976.
Milner, K. R., Shaw, B. E., Goulet, C. A., Richards-Dinger, K. B., Callaghan, S., Jordan, T. H., Dieterich, J. H., and Field, E. H.: Toward Physics-Based Nonergodic PSHA: A Prototype Fully Deterministic Seismic Hazard Model for Southern California, B. Seismol. Soc. Am., X., 1–18, https://doi.org/10.1785/0120200216, 2021.
Milner, K. R., Shaw, B. E., and Field, E. H.: Enumerating plausible multifault ruptures in complex fault systems with physical constraints, B. Seismol. Soc. Am., 112, 1806–1824, https://doi.org/10.1785/0120210322, 2022.
Mika Liao, Y.-W, Fry, B., Howell, A., Williams, C. A., Nicol, A., and Rollins, C.: The role of heterogeneous stress in earthquake cycle models of the Hikurangi–Kermadec subduction zone, Geophys. J. Int., 239, 574–590, https://doi.org/10.1093/gji/ggae266, 2024.
Mohammed, T., Atkinson, G. M., and Assatourians, K.: Uncertainty in recurrence rates of large magnitude events due to short historic catalogs, J. Seismol., 18, 565–573, https://doi.org/10.1007/s10950-014-9428-1, 2014.
Nicol, A., Watterson, J., Walsh, J. J., and Childs, C.: The shapes, major axis orientations and displacement patterns of fault surfaces, J. Struct. Geol., 18, 235–248, https://doi.org/10.1016/S0191-8141(96)80047-2, 1996.
Niemeijer, A. R. and Vissers, R. L. M.: Earthquake rupture propagation inferred from the spatial distribution of fault rock frictional properties, Earth Planet. Sc. Lett., 396, 154–164, https://doi.org/10.1016/j.epsl.2014.04.010, 2014.
Niroula, G. P., Stirling, M. W., Williams, J., and Gerstenberger, M.: Testing and evaluation of the first-generation earthquake rupture simulations for New Zealand, B. Seismol. Soc. Am., 115, 2263–2278, https://doi.org/10.1785/0120250006, 2025.
Pagani, M., Monelli, D., Weatherill, G., Danciu, L., Crowley, H., Silva, V., Henshaw, P., Butler, L., Nastasi, M., and Panzeri, L.: OpenQuake Engine: An Open Hazard (and Risk) Software for the Global Earthquake Model, Seismol. Res. Lett., 85, 692–702, https://doi.org/10.1785/0220130087, 2014.
Pascual-Sánchez, E., García-Mayordomo, J., and Álvarez-Gómez, J. A., Catálogo sísmico actualizado para el cálculo de la peligrosidad sísmica en España, IGN/UPM/UCM/IGME, Zenodo [data set], https://doi.org/10.5281/zenodo.10286171, 2023.
Rafiei, M., Khodaverdian, A., and Rahimian, M.: A Probabilistic Physics-Based Seismic Hazard Model for the Alborz Region, Iran, S, B. Seismol. Soc. Am., 112, 2141–2155, https://doi.org/10.1785/0120210238, 2022.
Reitman, N. G., Mueller, K. J., and Tucker, G. E.: Surface slip variability on strike-slip faults, Earth Surf. Proc. Land., 47, 908–935, https://doi.org/10.1002/esp.5294, 2022.
Richards-Dinger, K. and Dieterich, J. H.: RSQSim earthquake simulator, Seismol. Res. Lett., 83, 983–990, https://doi.org/10.1785/0220120105, 2012.
Roberts, G. P.: Fault orientation variations along the strike of active normal fault systems in Italy and Greece: Implications for predicting the orientations of subseismic-resolution faults in hydrocarbon reservoirs, AAPG Bull., 91, 1–20, https://doi.org/10.1306/08300605146, 2007.
Rivas-Medina, A., Benito, B., and Gaspar-Escribano, J. M.: Approach for combining fault and area sources in seismic hazard assessment: application in south-eastern Spain, Nat. Hazards Earth Syst. Sci., 18, 2809–2823, https://doi.org/10.5194/nhess-18-2809-2018, 2018.
Rodríguez-Escudero, E.: Implicaciones de la Estructura Interna de una Zona de Falla Activa en la Génesis de Terremotos, PhD thesis, Universidad Autónoma de Madrid, http://hdl.handle.net/10486/682976 (last access: 30 May 2026), 2017.
Rodriguez Piceda, C., Mildon, Z., Andrews, B. J., Visini, F., Ampuero, J. P., and Van Den Ende, M.: Spatially heterogenous Holocene slip rates drive seismic sequence variability on normal faults, Seismica, 4, https://doi.org/10.26443/seismica.v4i2.1682, 2025.
Rong, Y., Mahdyiar, M., Shen-Tu, B., and Shabestari, K.: Magnitude problems in historical earthquake catalogues and their impact on seismic hazard assessment, Geophys. J. Int., 187, 1687–1698, https://doi.org/10.1111/j.1365-246X.2011.05226.x, 2011.
Sanz de Galdeano, C., Azañón, J. M., Cabral, J., Ruano, P., Alfaro, P., Canora, C., Ferrater, M., García-Tortosa, F. J., García-Mayordomo, J., Gràcia, E., Insua-Arévalo, J. M., Jiménez Bonilla, A., Lacan, P. G., Marín-Lechado, C., Martín-Banda, R., Martín González, F., Martínez-Díaz, J. J., Martín-Rojas, I., Masana, E., Ortuño, M., Pedrera, A., Perea, H., and Simón, J. L.: Active faults in Iberia, in: The Geology of Iberia: A Geodynamic Approach, edited by: Quesada, C. and Oliveira, J. T., Regional Geology Reviews, Springer, Cham, 33–75, https://doi.org/10.1007/978-3-030-10931-8_4, 2020.
Schorlemmer, D., Werner, M. J., Marzocchi, W., Jordan, T. H., Ogata, Y., Jackson, D. D., Mak, S., Rhoades, D. A., Gerstenberger, M. C., Hirata, N., Liukis, M., Maechling, P. J., Strader, A., Taroni, M., Wiemer, S., Zechar, J. D., and Zhuang, J.: The collaboratory for the study of earthquake predictability: achievements and priorities, Seismol. Res. Lett., 89, 1305–1313, https://doi.org/10.1785/0220180053, 2018.
Scotti, O., Clément, C., and Baumont, D.: Seismic hazard for design and verification of nuclear installations in France: regulatory context, debated issues and ongoing developments, Boll. Geofis. Teor. Appl., 55, 135–148, https://doi.org/10.4430/bgta0080, 2014.
Shaw, B. E.: Beyond Backslip: Improvement of Earthquake Simulators from New Hybrid Loading Conditions, B. Seismol. Soc. Am., 109, 2159–2167, https://doi.org/10.1785/0120180128, 2019.
Shaw, B. E., Milner, K. R., Field, E. H., Richards-Dinger, K., Gilchrist, J. J., Dieterich, J. H., and Jordan, T. H.: A physics-based earthquake simulator replicates seismic hazard statistics across California, Sci. Adv., 4, eaau0688, https://doi.org/10.1126/sciadv.aau0688, 2018.
Shaw, B. E., Fry, B., Nicol, A., Howell, A., and Gerstenberger, M.: An earthquake simulator for New Zealand, B. Seismol. Soc. Am., 112, 763–778, https://doi.org/10.1785/0120210087, 2022.
Stein, S., Spencer, B. D., and Brooks, E. M.: Metrics for Assessing Earthquake-Hazard Map Performance, B. Seismol. Soc. Am., 105, 2160–2173, https://doi.org/10.1785/0120140164, 2015.
Stirling, M., McVerry, G., Gerstenberger, M., Litchfield, N., Dissen, R., Berryman, K., Barnes, P., Wallace, L., and Villamor, P.: National seismic hazard model for New Zealand: 2010 update, B. Seismol. Soc. Am., 102, 1514–1542, https://doi.org/10.1785/0120110170, 2012.
Valentini, A., Visini, F., and Pace, B.: Integrating faults and past earthquakes into a probabilistic seismic hazard model for peninsular Italy, Nat. Hazards Earth Syst. Sci., 17, 2017–2039, https://doi.org/10.5194/nhess-17-2017-2017, 2017.
Visini, F., Valentini, A., Chartier, T., Scotti, O., and Pace, B.: Computational tools for relaxing the fault segmentation in probabilistic seismic hazard modelling in complex fault systems, Pure Appl. Geophys., 175, 1–23, https://doi.org/10.1007/s00024-019-02114-6, 2020.
Visini, F., Pace, B., Meletti, C., Marzocchi, W., Akinci, A., Azzaro, R., Barani, S., Barberi, G., Barreca, G., Basili, R., Bird, P., Bonini, M., Burrato, P., Busetti, M., Carafa, M. M. C., Cocina, O., Console, R., Corti, G., D’Agostino, N., D'Amico, S., D’Amico, V., Dal Cin, M., Falcone, G., Fracassi, U., Gee, R., Kastelic, V., Lai, C. G., Langer, H., Maesano, F. E., Marchesini, A., Martelli, L., Monaco, C., Murru, M., Peruzza, L., Poli, M. E., Pondrelli, S., Rebez, A., Rotondi, R., Rovida, A., Sani, F., Santulin, M., Scafidi, D., Selva, J., Slejko, D., Spallarossa, D., Tamaro, A., Tarabusi, G., Taroni, M., Tiberti, M. M., Tusa, G., Tuvè, T., Valensise, G., Vannoli, P., Varini, E., Zanferrari, A., and Zuccolo, E.: Earthquake Rupture Forecasts for the MPS19 Seismic Hazard Model of Italy, Ann. Geophys., 64, SE220, https://doi.org/10.4401/ag-8608, 2021.
Wang, B. and Barbot, S.: Rupture segmentation on the East Anatolian fault (Turkey) controlled by along-strike variations in long-term slip rates in a structurally complex fault system, Geology, https://doi.org/10.1130/G52403.1, 2024.
Williams, J. N., Werner, M. J., Goda, K., Wedmore, L. N. J., De Risi, R., Biggs, J., Mdala, H., Dulanya, Z., Fagereng, Å., Mphepo, F., and Chindandali, P.: Fault-based probabilistic seismic hazard analysis in regions with low strain rates and a thick seismogenic layer: a case study from Malawi, Geophys. J. Int., 233, 2172–2207, https://doi.org/10.1093/gji/ggad060, 2023.
Yazdi, P. and García-Mayordomo, J.: Active fault interaction in the Eastern Betic Cordillera: A model of coseismic and postseismic stress transfer following historical earthquakes in SE Spain, Tectonics, 43, e2024TC008383, https://doi.org/10.1029/2024TC008383, 2024.
Zechar, J. D., Gerstenberger, M. C., and Rhoades, D.: Likelihood-based tests for evaluating space-rate-magnitude earthquake forecasts, B. Seismol. Soc. Am., 100, 1184–1195, https://doi.org/10.1785/0120090192, 2010.
Zielke, O. and Mai, P. M.: MCQsim: A multicycle earthquake simulator, B. Seismol. Soc. Am., 113, 889–908, https://doi.org/10.1785/0120220248, 2023.