the Creative Commons Attribution 4.0 License.
the Creative Commons Attribution 4.0 License.
 | 16 Jan 2026
Rockfall triggering and meteorological variables in the Dolomites (Italian Eastern Alps)
Francesca N. Bonometti
Giuseppe Dattola
Paolo Frattini
Giovanni B. Crosta
Alpine areas are experiencing substantial changes in both temperature and rainfall intensity, both critical triggers for rockfall events. To better understand these evolving climatic scenarios in the Dolomites from 1970 to 2019 and their implications for historical rockfall occurrences, we developed a novel approach based on the frequency analysis of meteorological variables.
Our analysis considered key climate variables including mean air temperature, precipitation, thermal amplitude, freeze-thaw cycles, and icing, examined at various aggregation scales. Results unequivocally show a significant warming trend, with the highest warming rates (up to 0.3 °C per decade) observed during spring. This warming has led to an earlier onset of summer and a delayed end of winter, altering seasonal lengths. We also detected a notable decline in cold-related phenomena, with an estimated decrease of 7.3 freeze-thaw days and 2.2 icing days per decade. Precipitation patterns are changing too, with an increasing frequency of high-intensity rainfall events, particularly in winter, and a reduction in low-intensity events across all seasons. The Rescaled Adjusted Partial Sums (RAPS) method further confirmed long-term precipitation trends, revealing that climatic evolution is driven by shifts in variable frequencies rather than just extreme values. Employing a Bayesian method, we investigated the conditional probability of rockfall occurrences knowing that a meteorological variable is within a given range. Our findings reveal several key correlations: in the last decade high-intensity rainfall correlates with rockfalls in autumn, showing conditional probabilities of 12.4 % below 1000 m and 22.2 % between 1000–2000 m. Mean air temperature correlates with rockfalls in summer, for instance, with a 12.7 % probability for 21–24 °C between 1000–2000 m, and in autumn, such as a 2.2 % probability for 17.6–20.8 °C above 2000 m. Temperature amplitude shows high rockfall probabilities in spring, reaching 28.6 % for 8.8–9.9 °C below 1000 m, and in winter, with a 5.8 % probability for 9–10 °C between 1000–2000 m. Beyond these meteorological links, rockfall frequency exhibits three main peaks: November, February-April, and August. Regarding rockfall source aspect, north component has significant increment from 1970–1999 to 2000–2025 (from 4 % to 12 % +3 %) above 2000 m, a pattern likely linked to permafrost thawing. This study underscores the critical influence of changing climate dynamics on rockfall activity in Alpine environments, providing quantitative links between specific meteorological shifts and rockfall occurrence.
- Article
(14390 KB) - Full-text XML
-
Supplement
(18652 KB) - BibTeX
- EndNote


Rockfalls are sudden and dangerous landslide events where rock blocks detach from steep cliffs and move rapidly downslope through free-falling, bouncing, rolling, and sliding (Varnes, 1978). These phenomena pose significant hazards to human lives, structures, and infrastructure, varying widely in volume and impact (Bunce et al., 1997; Crosta and Agliardi, 2004; Hilker et al., 2009; Volkwein et al., 2011; Zhao et al., 2017). Numerous intrinsic and external parameters, which vary considerably in space and time, can trigger rockfalls (Volkwein et al., 2011). These include earthquakes (Valagussa et al., 2014), intense rainfall (Palladino et al., 2018), snowmelt, permafrost degradation (Ravanel et al., 2017), freeze-thaw cycles (Matsuoka and Sakai, 1999), and ground temperature oscillations (Luethi et al., 2015; Palau et al., 2024; Stoffel et al., 2024), both in cold and warm conditions. Understanding the evolution of slopes in response to climate change, and its impact on rockfall frequency and seasonality, is therefore crucial (Davies et al., 2001; Fischer et al., 2006; Stoffel and Huggel, 2012; Corò et al., 2015; Palau et al., 2024).
Mountain regions, particularly the Alps, have experienced significant temperature increases over the last 150 years (Pepin et al., 2022; Schär et al., 2004), with annual mean warming rates in the Alps of approximately 0.5 °C per decade since 1980 (Böhm et al., 2001; Allen and Huggel, 2013). These accelerated changes in the Alpine environment exacerbate rockfall activity. The impacts of climate change in the Alps manifest as: (i) a substantial rise in temperature (Beniston, 2006; Brunetti et al., 2009; Gobiet et al., 2014), (ii) increased frequency and intensity of extreme events like floods, droughts, rockfalls, and landslides (Gariano and Guzzetti, 2016; Palladino et al., 2018), and (iii) more frequent medium and extreme precipitation events, particularly during autumn and winter (Krautblatter and Moser, 2009; Schmidli and Frei, 2005). A direct consequence of global warming is the accelerated degradation of permafrost in many high-mountain, steep rock slope environments (Noetzli et al., 2003; Gobiet et al., 2014; Draebing and Krautblatter, 2019; Courtial-Manent et al., 2024; Salzmann et al., 2007). This degradation significantly impacts slope stability, as warming air temperatures at high altitudes alter the thermal and hydraulic conditions of the rock mass (Gruber and Haeberli, 2007) and reduce rock mass shear strength by modifying active layer thickness and fracture conditions (Davies et al., 2001; Krautblatter et al., 2013).
The widespread effects of changing mean and extreme temperatures and precipitation are expected to influence both the temporal frequency and magnitude of future mass movements across the Alps. Numerous studies have established the relationship between rockfall occurrence and climate conditions in the Alpine environment. For instance, correlations have been found with freeze-thaw cycles (Frayssines and Hantz, 2006; D'Amato et al., 2016), rainfall and minimum temperature (Delonca et al., 2014), and seasonality. Macciotta et al. (2015, 2017) highlighted the importance of freeze-thaw in early spring, while Perret et al. (2006) observed a positive correlation with temperature in early summer. More recently, Stoffel et al. (2024) analyzed a 100-year rockfall time-series in the Swiss Alps, revealing that interannual and decadal rockfall activity correlates with summer air temperatures, increasing with warmer conditions. This pattern, observed during the Early Twentieth Century Warming (ETCW) and since the mid-1980s, strongly suggests that degrading permafrost contributes to slope instability and rockfalls, with other factors (e.g., snow cover, ground heat, and soil moisture) influencing interannual variations.
Previous research, such as that by Paranunzio et al. (2015, 2016, 2019), Viani et al. (2020), and Paranunzio and Marra (2024), proposed a nonparametric method to characterize relationships between climate variables and slope failures by analyzing climate anomalies associated with different time aggregations. This method, based on ranking climatic variable values (in ascending order for a specific scale aggregation) and computing a probability of anomalies, links extreme climate values with rockfall events, but does not fully account for their frequency. However, during periods of climate change, variations in frequency occur across the entire range of meteorological variables, not just at their extremes. These changes can also influence the onset of rockfalls.
The aim of this study is therefore to calculate the spatial and temporal frequency variations of various climate variables in the eastern Italian Alps in order to understand climate evolution and its impact on the distribution of rockfall frequency at different elevations. To this end, we propose a new method that builds on Paranunzio's method (Paranunzio et al., 2015) to include the frequencies of both anomalous and non-anomalous climate variables affecting rockfall events. This refined method was applied to a comprehensive database of rockfall events within the study area.
This paper is organized as follows: Sect. 2 describes in detail the study area and the collection of rockfall and climate data. Section 3 describes the methodology used for climate analysis and rockfall characterization. Section 4 presents the results of the analyses. Section 5 discusses some issues with previous work. Finally, the conclusion reports on the correlation between climate change and rockfall events.
2.1 Study area
The study area, encompassing approximately 24 500 km2 in the eastern Italian Alps, includes the Trentino-Alto Adige Region, along with the provinces of Belluno (Veneto region), Pordenone and Udine (Friuli Venezia Giulia region). This area is home to the Dolomites region, a group of carbonate platforms within the Southern European Alps, a south-vergent Neogene thrust-and-fold belt, which constitutes a structural unit of the Alpine chain (Doglioni, 1987; Bosellini et al., 2003). The Periadriatic Lineament, a major fault system of Oligocene-Neogene age, separates the Dolomites from the Austroalpine Unit. A small portion of the Tauern tectonic window, where the lower Penninic Unit crops out, is also present in the northernmost sector of Bolzano Province (Aurina Valley) (Dal Piaz et al., 2003; Corò et al., 2015).
The bedrock of the study area consists of various lithologies. It ranges from Permian terrigenous deposits, such as the Val Gardena Sandstone (sandstone with conglomerates) and the Bellerophon Formation (dolostone with gypsum), to early Cretaceous carbonate rocks. These carbonate formations include the Werfen Formation, Serla Dolostones, Contrin Formation, Marmolada Limestone, Sciliar Formation, Cassiano Dolostones, Raibl Formation, and Dolomia Principale Formation, characterized by grey dolostone with oolites, breccias, limestone and claystone. These successions are prevalent in the province of Belluno, Trento, Pordenone and Udine. In the central Trentino-Alto Adige region, the “Gruppo Vulcanico Atesino” comprises volcanic rocks (pyroclastic flow, with subordinate domes and lavas) that can reach a thickness of 2000 metres. Additionally, the province of Bolzano, particularly north and northwest of the Periadriatic Lineament, features micaschists, phyllites and gneisses (Corò et al., 2015) (Fig. 1).
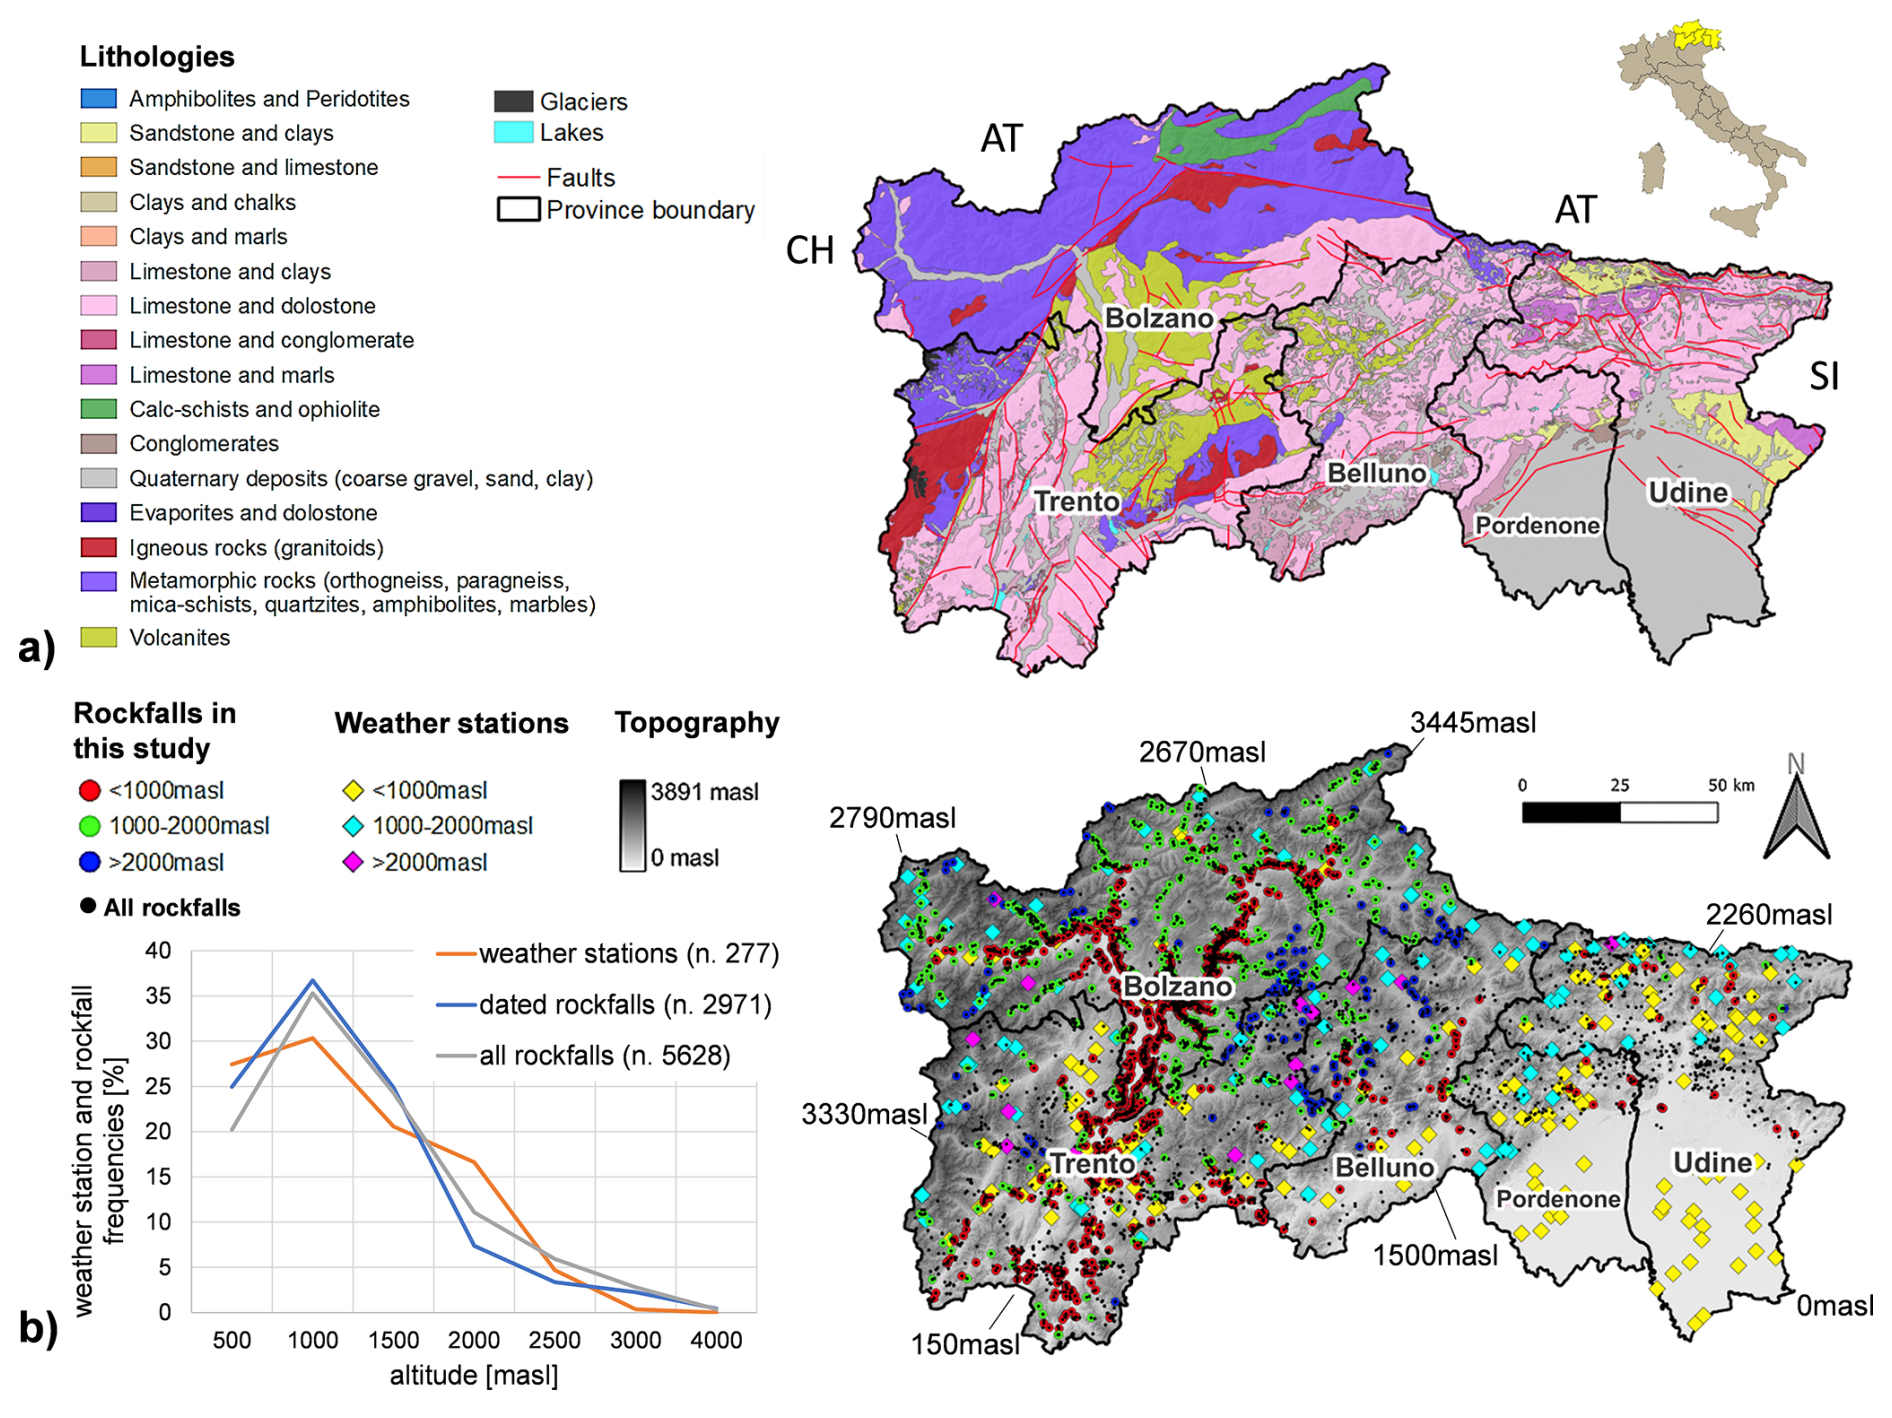
Figure 1(a) Geological setting of the study area (lithology modified from regional open source data). (b) Location and distribution according to altitude of 277 weather station (diamonds), 5628 rockfall data (black dots) and 2971 dated rockfall events (dots) used in the analyses. Meteorological stations: 87 in Trento Province, 46 in Bolzano Province, 30 in Belluno Province, 37 in Pordenone Province and finally 77 in Udine Province. The monitoring network considered from SCIA are: Idrografica, Regionale and Sinottica. Rockfall events are located: 410 in Trento Province, 2391 in Bolzano Province, 132 in Belluno Province, 9 in Pordenone Province and 29 in Udine Provinces.
The local morphology is primarily controlled by the geological and structural settings, characterized by rock types with varying mechanical properties (Frattini et al., 2008). These rocks underwent significant folding and faulting, followed by uplift during various phases of the Alpine orogeny. Pleistocene glaciations further dramatically reshaped the landscape. Throughout the study area, the landscape is distinctly marked by landforms such as cirques and U-shaped valleys, sculpted by glacial tongues that occupied the region during the Last Glacial Maximum (LGM) and retreated to the highest valleys during the Late glacial period (Bassetti and Borsato, 2005).
The study area is characterized by highly irregular topography, defined by large valley bottoms and significant altitudinal variations. Major valleys, such as Val d'Adige, Valsugana, Riva del Garda, and Valle del Piave, are situated at elevations below 400 m a.s.l., contrasting sharply with peaks exceeding 3000 m a.s.l. Notable high-altitude features include the Ortles (3900 m), the Presanella Group (3500 m), Marmolada (3350 m), and Antelao (3264 m). At these elevations, the literature confirms the presence of permafrost defined as ground material remaining at or below 0 °C for at least two consecutive years. In the specific study area, the Alpine Permafrost Index Map (APIM) (Boeckli et al., 2012) indicates permafrost presence at elevations exceeding 2500 m a.s.l. on north-facing slopes and above 2700 m a.s.l. on south-facing slopes. The distribution of permafrost demonstrates a high frequency on rock walls with orientations predominantly ranging between 300 and 50° N.
The region's climate is alpine with continental characteristics and exhibits significant local variations due to microclimates. The Belluno Valley and the Po basin in the Friuli Venezia Giulia Region are influenced by humid breezes from the Adriatic Sea (Desiato et al., 2005). In contrast, the internal mountainous areas experience a typically continental climate, characterised by cold winters and mild summers. Rainfall mainly occurs as brief summer thunderstorms, whereas autumn rainfall is more prolonged (Corò et al., 2015; Frattini et al., 2008).
2.2 Data collection
To investigate the relationship between climate variation and rockfall events (as reported in Sect. 3), a comprehensive record of meteorological variables and rockfall data was essential. The methods used for data acquisition are detailed below.
2.2.1 Meteo-climatic time-series
Meteorological time-series data were collected from the SCIA website (https://scia.isprambiente.it/, last access: 10 November 2024; Desiato et al., 2011; Padulano et al., 2021). To ensure a homogeneous dataset, only weather stations with complete daily time-series of climatic variables were included. This selection process resulted in 277 out of 1244 weather stations being selected (Fig. 1). The selected climatic variables were total daily rainfall, daily minimum temperatures, and daily maximum temperatures. The daily time-series covered the period from 1 January 1970 to 31 December 2019.
For each climatic variable, a dataset was generated, containing: (i) an identification code for each station, (ii) the coordinates of each station, and (iii) daily values for the respective climatic variable.
2.2.2 Rockfall catalogue
A new rockfall dataset was compiled from 5628 events gathered from various sources: (i) 5432 from the Italian Landslide Inventory project (IFFI https://idrogeo.isprambiente.it/, last access: 12 November 2024; Trigila et al., 2007), (ii) 112 rockfalls from the Geomorphological impacts of Climate change in the Alps (GeoClimAlp https://geoclimalp.irpi.cnr.it/, last access: 12 November 2024; Nigrelli et al., 2024) database, (iii) 18 from Gruppo Rete Ferroviaria Italiana (RFI) dataset, and (iv) 66 from online news sources (https://www.ildolomiti.it/, last access: 12 November 2024; https://www.ladige.it/, last access: 12 November 2024; https://www.guidedolomiti.com/tag/frane-crolli/, last access: 12 November 2024). To establish a correlation between climatic variables and rockfall events, it was crucial to have information on the day, month, and year of occurrence. Therefore, 2971 events (out of the initial 5628) were considered, as complete date information was available for these events (Fig. 1). A comprehensive dataset was generated for these events, including: identification code (ID), coordinates (), date of event (dd/mm/yyyy), and the associated three closer weather station.
The proposed method aims to assess both the variation of climatic conditions in an area and the effects of this variation on rockfall occurrence. This analysis computes the frequency of meteorological data by creating sampled time-series from recorded weather station data, a procedure detailed in the following sub-sections. Differently from Paranunzio et al. (2015, 2016), which focused on identifying anomalies in meteorological variables time series, this method emphasizes the frequency of statistical samples of meteorological variables within their characteristic value ranges defined as the interval between the maximum and minimum values obtained from the used time series.
The measured meteorological variables from the weather station used in this study were consistent with those in Paranunzio et al. (2015, 2016): daily minimum air temperature T0, daily maximum air temperature T1, and daily precipitation R.
Derived meteorological variables included: daily mean air temperature, Tm, and daily air temperature amplitude, ). To analyse the effects induced by both freeze-thaw cycles and icing, two Boolean variables were introduced: freeze-thaw cycle, CFT, which is 1 if the cycle occurs (T0≤0 °C and T1> 0 °C), and icing, I, which is true (1) if both T0 and T1 are negative. These derived climatic variables were selected based on previous studies indicating their potential to trigger rockwall instabilities in the alpine environment (Douglas, 1980; Sandersen et al., 1997; Matsuoka and Sakai, 1999; Frayssines and Hantz, 2006; Letortu, 2013; D'Amato et al., 2016; Macciotta et al., 2017).
3.1 Computed time-series of meteorological variables
Daily measurements of meteorological variables do not directly capture the effects of multi-day processes. To address this, computed time-series were derived from the original data using various computational methods that account for multi-day aggregation scales (Sa). Consider a time series of a meteorological variable:
where Vi represents the meteorological variable value, Di is the corresponding date, and nt is the length of the time-series (i.e., the number of record values). Computed time-series can be derived using three basic procedures: mean, addition and subtraction.
For the mean procedure, the new time-series is obtained by computing the average as shown in Eq. (2):
where avg is the average operator, is the mean of the values within the closed interval . Consequently, the mean time-series takes the form:
For the addition procedure, new values are computed as indicated in Eq. (4):
The resulting new time-series is expressed as in Eq. (5):
Finally, in the subtraction procedure, the new values are computed using the following formula:
and the new time-series takes the form:
For the CFT (freeze-thaw cycle) and I (icing) time-series, the computed time-series align directly with the original ones, after that they are aggregated as the other meteorological variables.
3.2 Sampled time-series
Once the computed time-series were obtained, sampled time-series were derived using a reference date set Dr and a temporal scale St. Let De be a selected date. The set of reference dates Dr set is defined by Eq. (8):
This set includes the chosen date and corresponding dates with same day and month but from different years. The number of years used for the analysis depends on the dates available in the computed time-series. The sample time-series is then obtained from the computed time-series using the following condition:
In this context, Dr∈Dr represent the reference dates, is the value from the computed time-series according to the procedures outlined in the previous sub-section, and is the value in the sample time-series.
3.3 Bayesian method
The influence of a weather variable on rockfall events can be analysed using the Bayesian method (Bayes, 1763) to determine the conditional probability of rockfall occurrence (Rf) under the condition that a meteorological variable is within a given range. Consider a time series of a meteorological variable, where its range is divided into specific intervals. Let Rf represent the set of rockfall events under analysis, and Mi the set of recorded data falling within a specific ith interval of the meteorological variable.
The conditional probability P(Rf | Mi) that rockfall events occur, conditioned on the meteorological variable being within the range ith, can be obtained as follows:
where P(Rf) is the overall rockfall daily probability, calculated dividing the number of rockfall events by the number of days of observation; P(Mi) is the daily probability of the meteorological variable falling within the ith range, calculated dividing the number of days with the variable within that range by the number of observation days; and P(Mi | Rf) is the probability of the meteorological variable being in the ith interval when a rockfall event occurs, calculated as the number of rockfall events occurred with the variable within that range divided by the total number of rockfall events.
To apply this method, a time series of the selected meteorological variable for the study area must be used. This involves averaging the time-series data from all considered stations. For each day within the measurement interval, the value of the meteorological variable is the mean of the values from all stations included in the analysis. After processing this new time-series with the proposed approach, a sample time-series is obtained, which is then used in the Bayesian method. For the icing and freeze-thaw time-series, both spatial mean, maximum and minimum values of the maximum and minimum temperatures were considered.
3.4 Climate analysis
For the climate analysis, only meteorological stations with time-series spanning five decades (1970–2019) were selected, aligning with climatological standards established by the World Meteorological Organization (WMO, 1989). While WMO generally recommends 30-year periods for climatological normals, it also acknowledges provisional normals based on observations extending over at least ten years at continental or global scales (WMO, 1989). Given the restricted study area, a ten-year interval was deemed sufficient. Therefore, only meteo-stations with complete time-series from 1970 to 2019 were included in the following analyses.
The procedures outlined in previous sections were employed to derive both calculated and sampled time-series, using an aggregation scale and a temporal scale St=45 d. For the CFT and I variables, an aggregation scale Sa={7} and a temporal scale were used. The results were then grouped into five decades. For each decade, the values of each variable were divided into ten bins, and their corresponding frequencies were computed. For the CFT and I variables, the frequency of persistence was computed, defined as the number of continuous days for which CFT and I are respectively true. This computation aimed to evaluate temporal variations in the frequency of each variable.
3.5 Rockfall and climate indices
The described methodology requires meteorological variable time-series as input. However, a significant challenge arises from the spatial discontinuity of input data: rockfall source locations rarely coincide with fixed weather station locations. Consequently, direct, point-specific meteorological time series for the precise rockfall source are typically unavailable.
To overcome this issue of spatial data scarcity, two distinct methods were employed to derive the necessary meteorological time series.
The first method involves assigning the time-series data directly associated with the closest meteorological station (nearest neighbour) to the rockfall source location.
where Vrf(t) is the rockfall source time-series, and the Vn(t) is the time series for the closest weather station. This approach, however, does not account for the fact that meteorological variables vary significantly with both elevation and spatial location. These variations are crucial because weather stations and rockfall sources typically have different elevations and spatial locations, meaning that a single weather station's time series may not accurately represent the rockfall site. To address these limitations, the following procedure was adopted. First, the weather stations were connected using a Delaunay triangulation, considering only their horizontal coordinates. Each rockfall source point then falls within one of the triangles of this triangulation. The vertices of this triangle are three weather stations, referred to as nodal weather stations, which are associated with that specific rockfall event source. The time series from these nodal weather stations were subsequently used to calculate the time series at the rockfall event source.
To obtain the rockfall site weather time-series, two corrections were applied. The altitude correction adjusts temperature time-series values using the following mathematical expressions Eq. (12):
Here Vi(t) is the variable value recorded by the nodal weather stations, zi is the nodal weather elevation, zrf is the rockfall elevation, c is the vertical gradient correction (with c=0.0065 °C m−1 according to Stull, 2000), and represents the corrected weather variable values. This simple linear approach, which is based on a constant vertical gradient, has been used despite the fact that is expected that warming in mountain regions depends on elevation (Pepin et al., 2015; Nigrelli et al., 2018; Pepin et al., 2022).
The spatial correction computes the site weather time-series based on the spatial positions of the nodal stations using the following relationship:
where are the weight functions that depend on the positions of the nodal weather stations, and (x,y) represents the coordinates of the rockfall event source. The weight functions, ranging between 0 and 1, were computed by imposing a linear interpolation between the weather stations' values according to their spatial positions. This correction was applied to temperature. Figure 2 provides a schematic representation of the rockfall source, P, and the surrounding weather stations (S1, S2 and S3) forming a triangle used in the time-series computations.
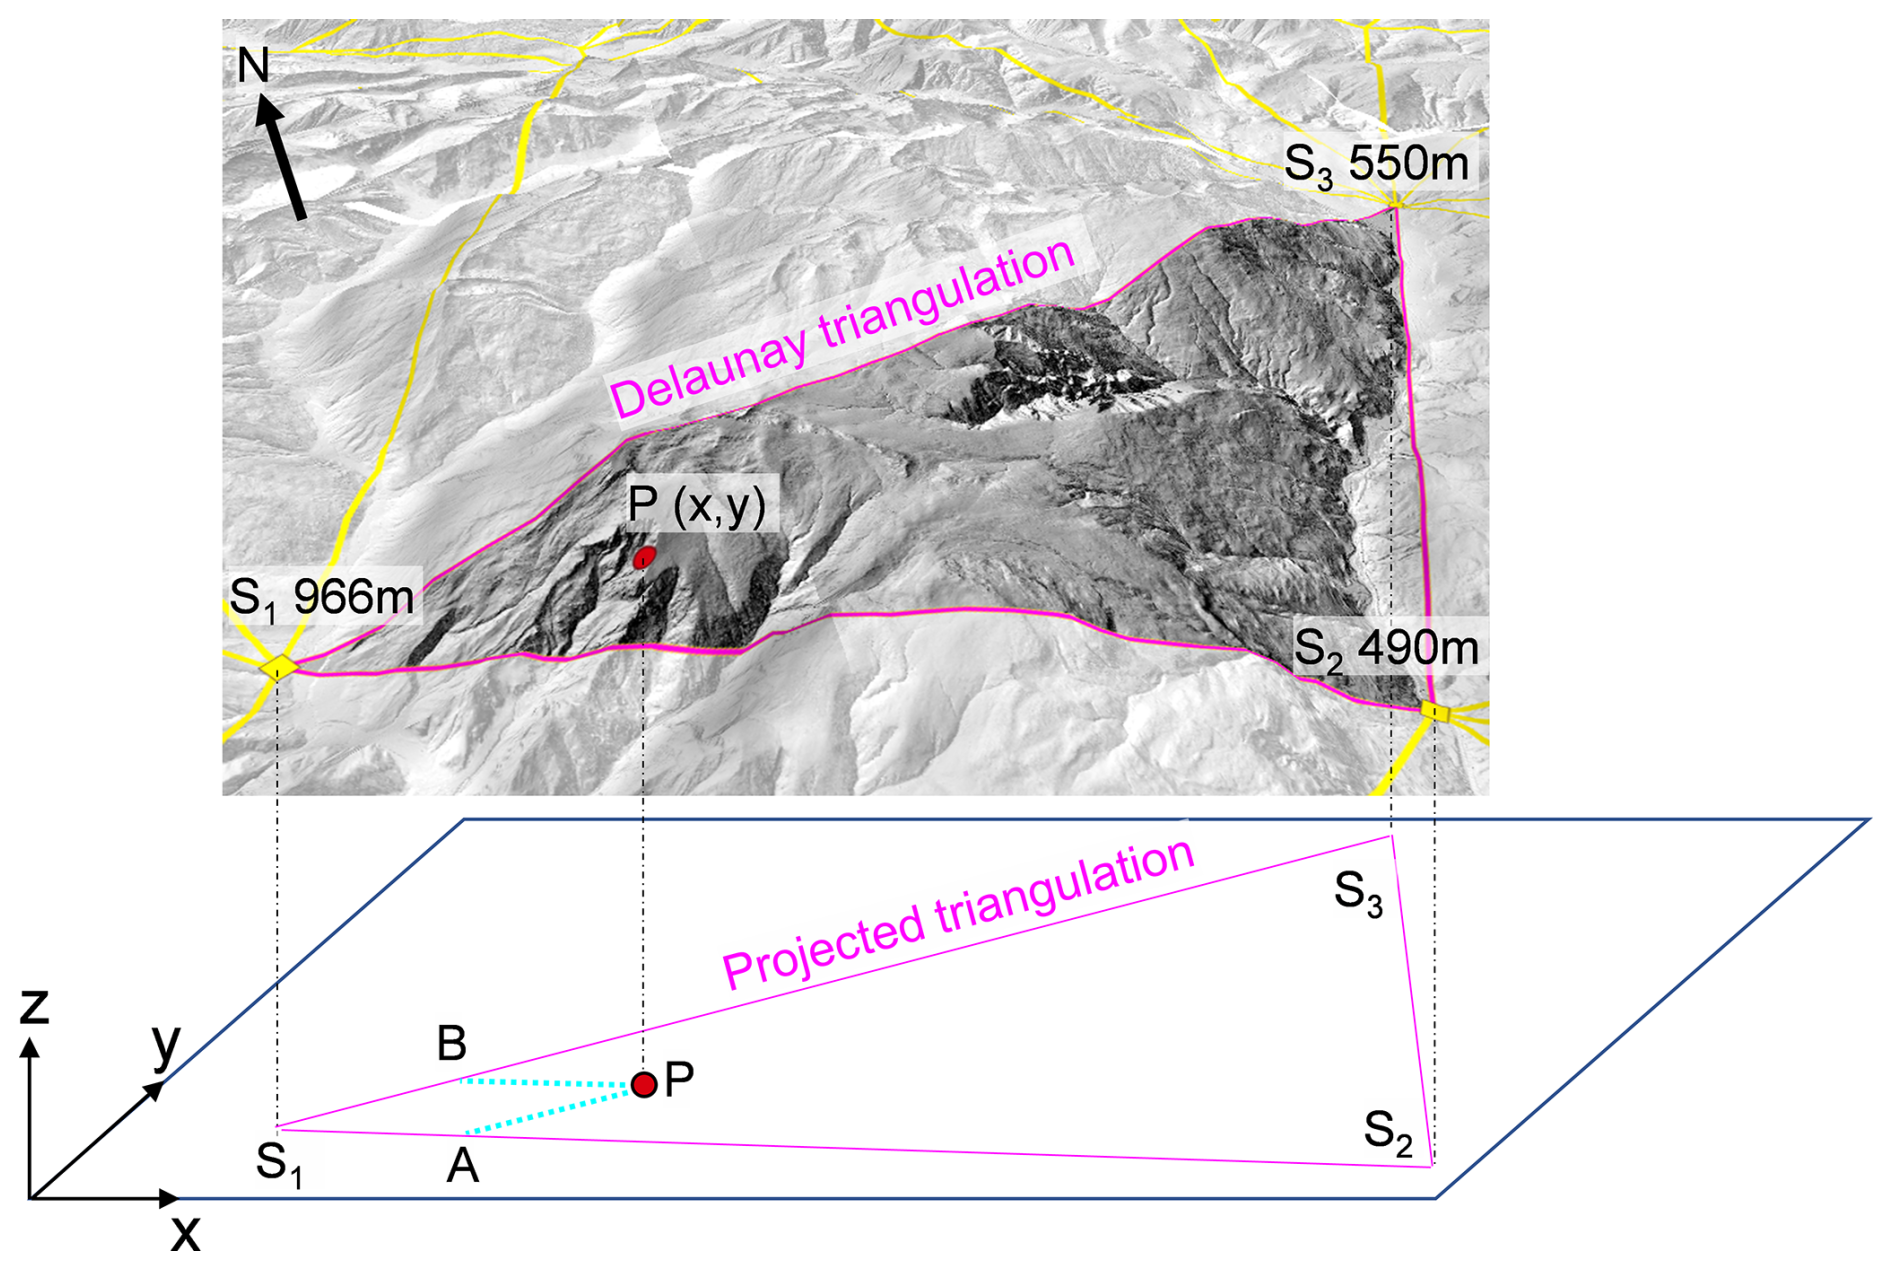
Figure 2Schematic representation of the rockfall source point P and the weather stations (S1,S2 and S3) positions forming a triangle used int time-series computations. Points A and B are the inclined projections of the point P along the edges and .
Once Vrf(t) was computed for all meteorological variables, the computed time-series and sampled time-series were subsequently obtained. This triangulation approach partially compensates for the problem of sparse weather stations that may be distant from the landslide points. However, it assumes an even spatial distribution of weather stations and a linear trend in the variables, both of which may not be accurate in complex terrain.
3.6 Rescaled Adjusted Partial Sums (RAPS)
To visualize long-term trends, fluctuations, and periodicities climatic records, the Rescaled Adjusted Partial Sums (RAPS) approach, proposed by Garbrecht and Fernandez (1994), was employed. This method is a powerful tool for analysing time series data, particularly in hydrology and meteorology, as it facilitates the detection of irregularities and fluctuations (e.g., temperature, precipitation) that might not be evident using traditional analysis techniques. RAPS involves rescaling the partial sums of deviations from the mean of a time series, enabling the identification of significant changes or trends over time. It provides a visual representation and analysis of cumulative deviations from the mean, scaled by the standard deviation, to reveal underlying patterns and trends in the data. This technique is particularly effective for identifying breakpoints and subperiods within the data, making it valuable for studying long-term climatic trends and periodicities (Garbrecht and Fernandez, 1994; Đurin et al., 2022). Mathematically, the RAPS value at time k can be expressed with the following Eq. (14):
where RAPSk is the rescaled adjusted partial sum at time ( represents the individual data points in the time series, is the mean of the time series, and Sy is the standard deviation of the time series. In this study, the RAPS method was utilized to compare its conclusions with those obtained from the proposed approach.
Rockfall events are initiated by various mechanisms that contribute to rock mass degradation, leading to a progressive reduction in rock mass strength. This is particularly prevalent in areas with steep slopes, sparse vegetation, or permafrost. This study specifically focuses on the effects of meteorological variables in triggering rockfall events. Over recent decades, observed changes in climate conditions have resulted in variations in meteorological variables, thereby altering degradation rates and the probability of rockfall initiation. Consequently, this influences the temporal and spatial distribution of rockfall events. Using the methodology proposed in the Sect. 3, the following analysis demonstrates the impact of climate change on rockfall occurrences.
For the purpose of this work, three sets of meteorological stations were considered.
Set A comprises all 277 selected stations and was used for the Bayesian method to analyse the frequency of climate variables.
Set B contains 18 stations chosen from the original 277. These stations were specifically selected because they have a complete time series spanning the entire period from 1970 to 2019 with no data gaps. Results for mean air temperature and precipitation are presented at a 90 d aggregation scale, while results for freeze-thaw cycles are presented at 7 d scale. This enabled the observation of detailed short-term changes while avoiding overlap with other months. Additional results are provided in the Supplement for completeness (Sect. S1).
Set C consists of 12 weather stations with complete time series. These stations were selected to analyse long-term trends at different elevations (below 1000 m, between 1000 and 2000 m, and above 2000 m a.s.l.). To ensure the selected stations were homogeneous, four stations were chosen for each elevation range. Two distinct periods were considered: 1970–2019 for stations below 2000 m and 1985–2019 for stations above 2000 m a.s.l.
4.1 Climate analysis
4.1.1 Rainfall
Rainfall is a critical triggering factor for rockfalls, particularly when exhibiting high intensity. Water infiltration into rock mass discontinuities increases water pore pressure, melts ice within fractures, erodes discontinuity infillings, and dissolve cementing materials, all of which contribute to the onset of rockfalls (Delonca et al., 2014; Palladino et al., 2018; Nissen et al., 2022).
The evolution of rainfall was analyzed across different decades and seasons, utilizing a 90 d aggregation scale. The results, presented in terms of frequency, are displayed in Fig. 3. Apart from minor fluctuations between decades, particularly noticeable above 2000 m of elevation during spring (illustrated in Fig. S2), a general trend shows an increase in the frequency of high-height rainfall events, concomitantly leading to a proportional decrease in low-height events. The most substantial increase in the frequency of large rainfall amounts is observed during the winter and autumn seasons. This behaviour becomes more pronounced with increasing aggregation scale, as the cumulative effect of three months of accumulated rainfall is considered (refer to Sect. S1.1 for results at other aggregation scales).
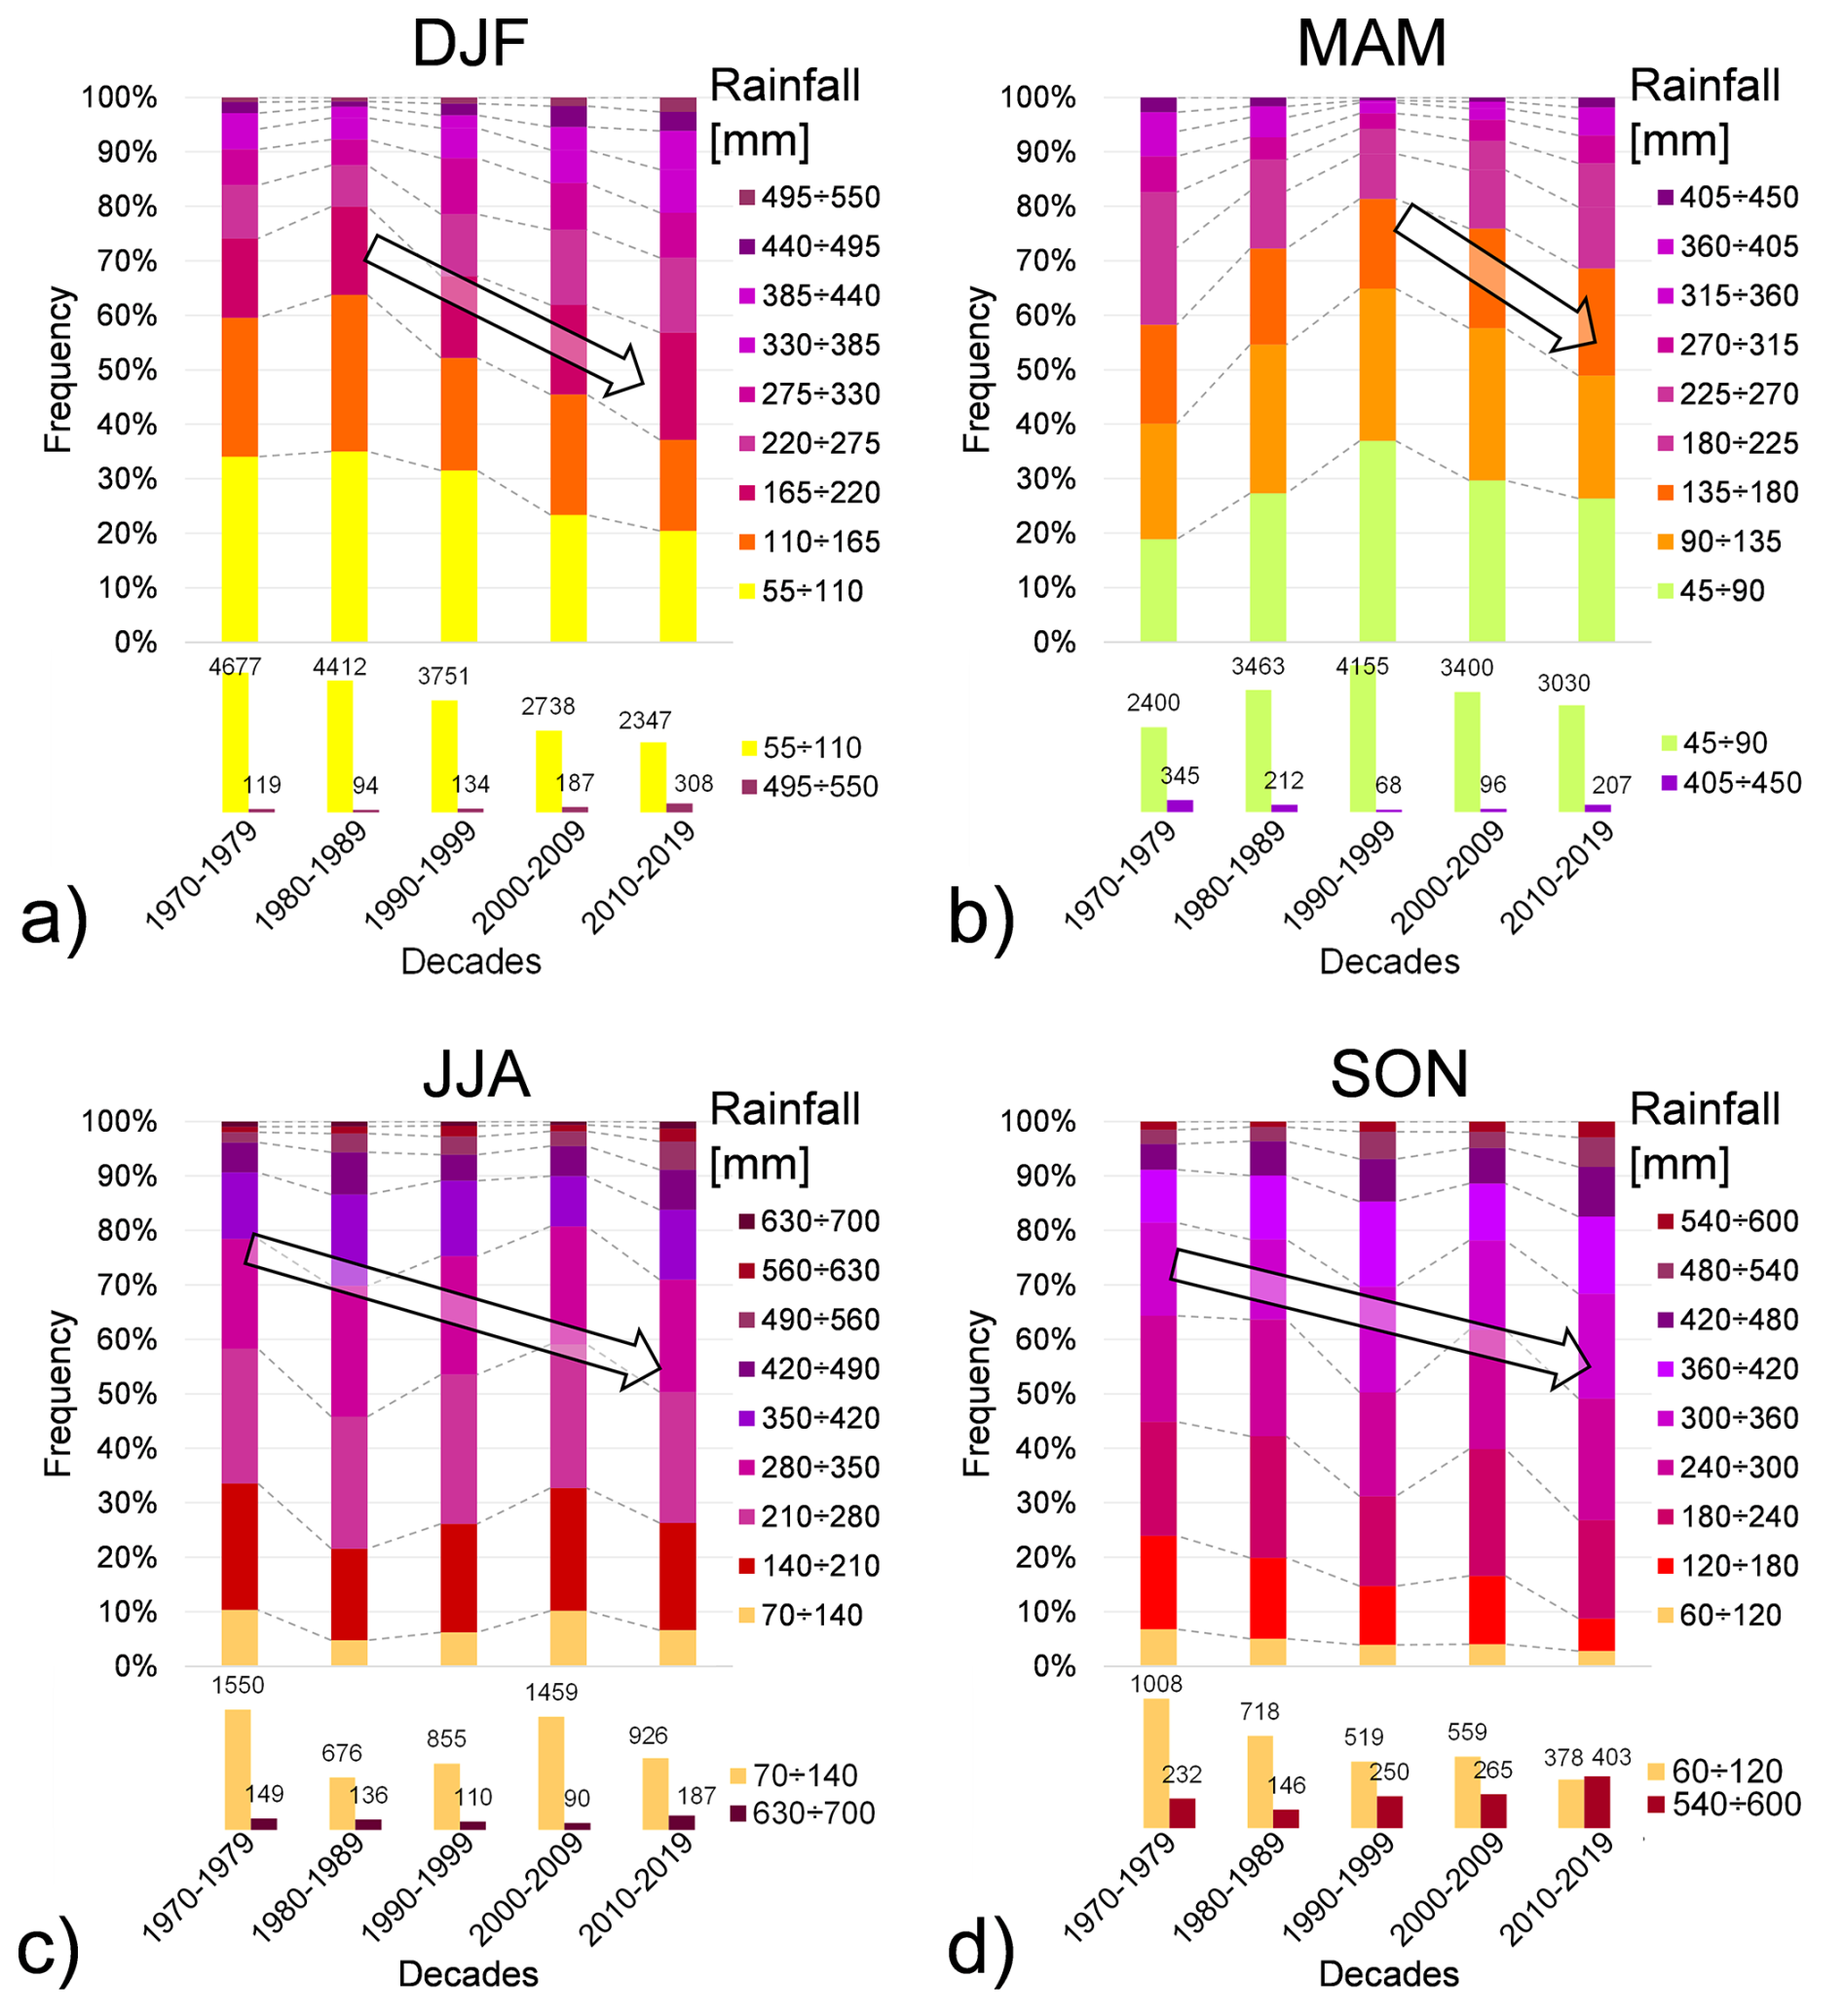
Figure 3Frequency distribution of rainfall height with an aggregation scale of 90 d during (a) winter (DJF), (b) spring (MAM), (c) summer (JJA) and (d) autumn (SON). Arrows indicate a possible frequency trend associated with each sub-interval of rainfall. Frequencies of the maximum and minimum rainfall ranges are zoomed in at the bottom of each graph for clarity.
Analogous insights were derived from the RAPS method analysis. For this study, RAPS analysis was carried out for the three altitude ranges, utilizing the 12 meteorological stations in Set C. For stations below 1000 m (Fig. 4a) the RAPS values decrease from 1985 to 2008, followed by a sharp increase in the most recent years, indicating that rainfall tended to be higher than the mean value after 2008. A notable exception was observed in 2002, which documented a significant peak (red arrow in Fig. 4a), likely corresponding to high rainfall events in May and November (as reported by Bollettino meteorologico e valanghe, Ufficio idrografico di Bolzano; Protezione Civile Provincia Autonoma di Trento). For stations between 1000 and 2000 m (Fig. 4b), a progressively increasing trend in rainfall is suggested by the downwards parabolic trend of the RAPS. Finally, above 2000 m (Fig. 4c), the RAPS plot exhibits a V-shape, reaching a minimum in 2007, followed by a sharp increase in the last decade.
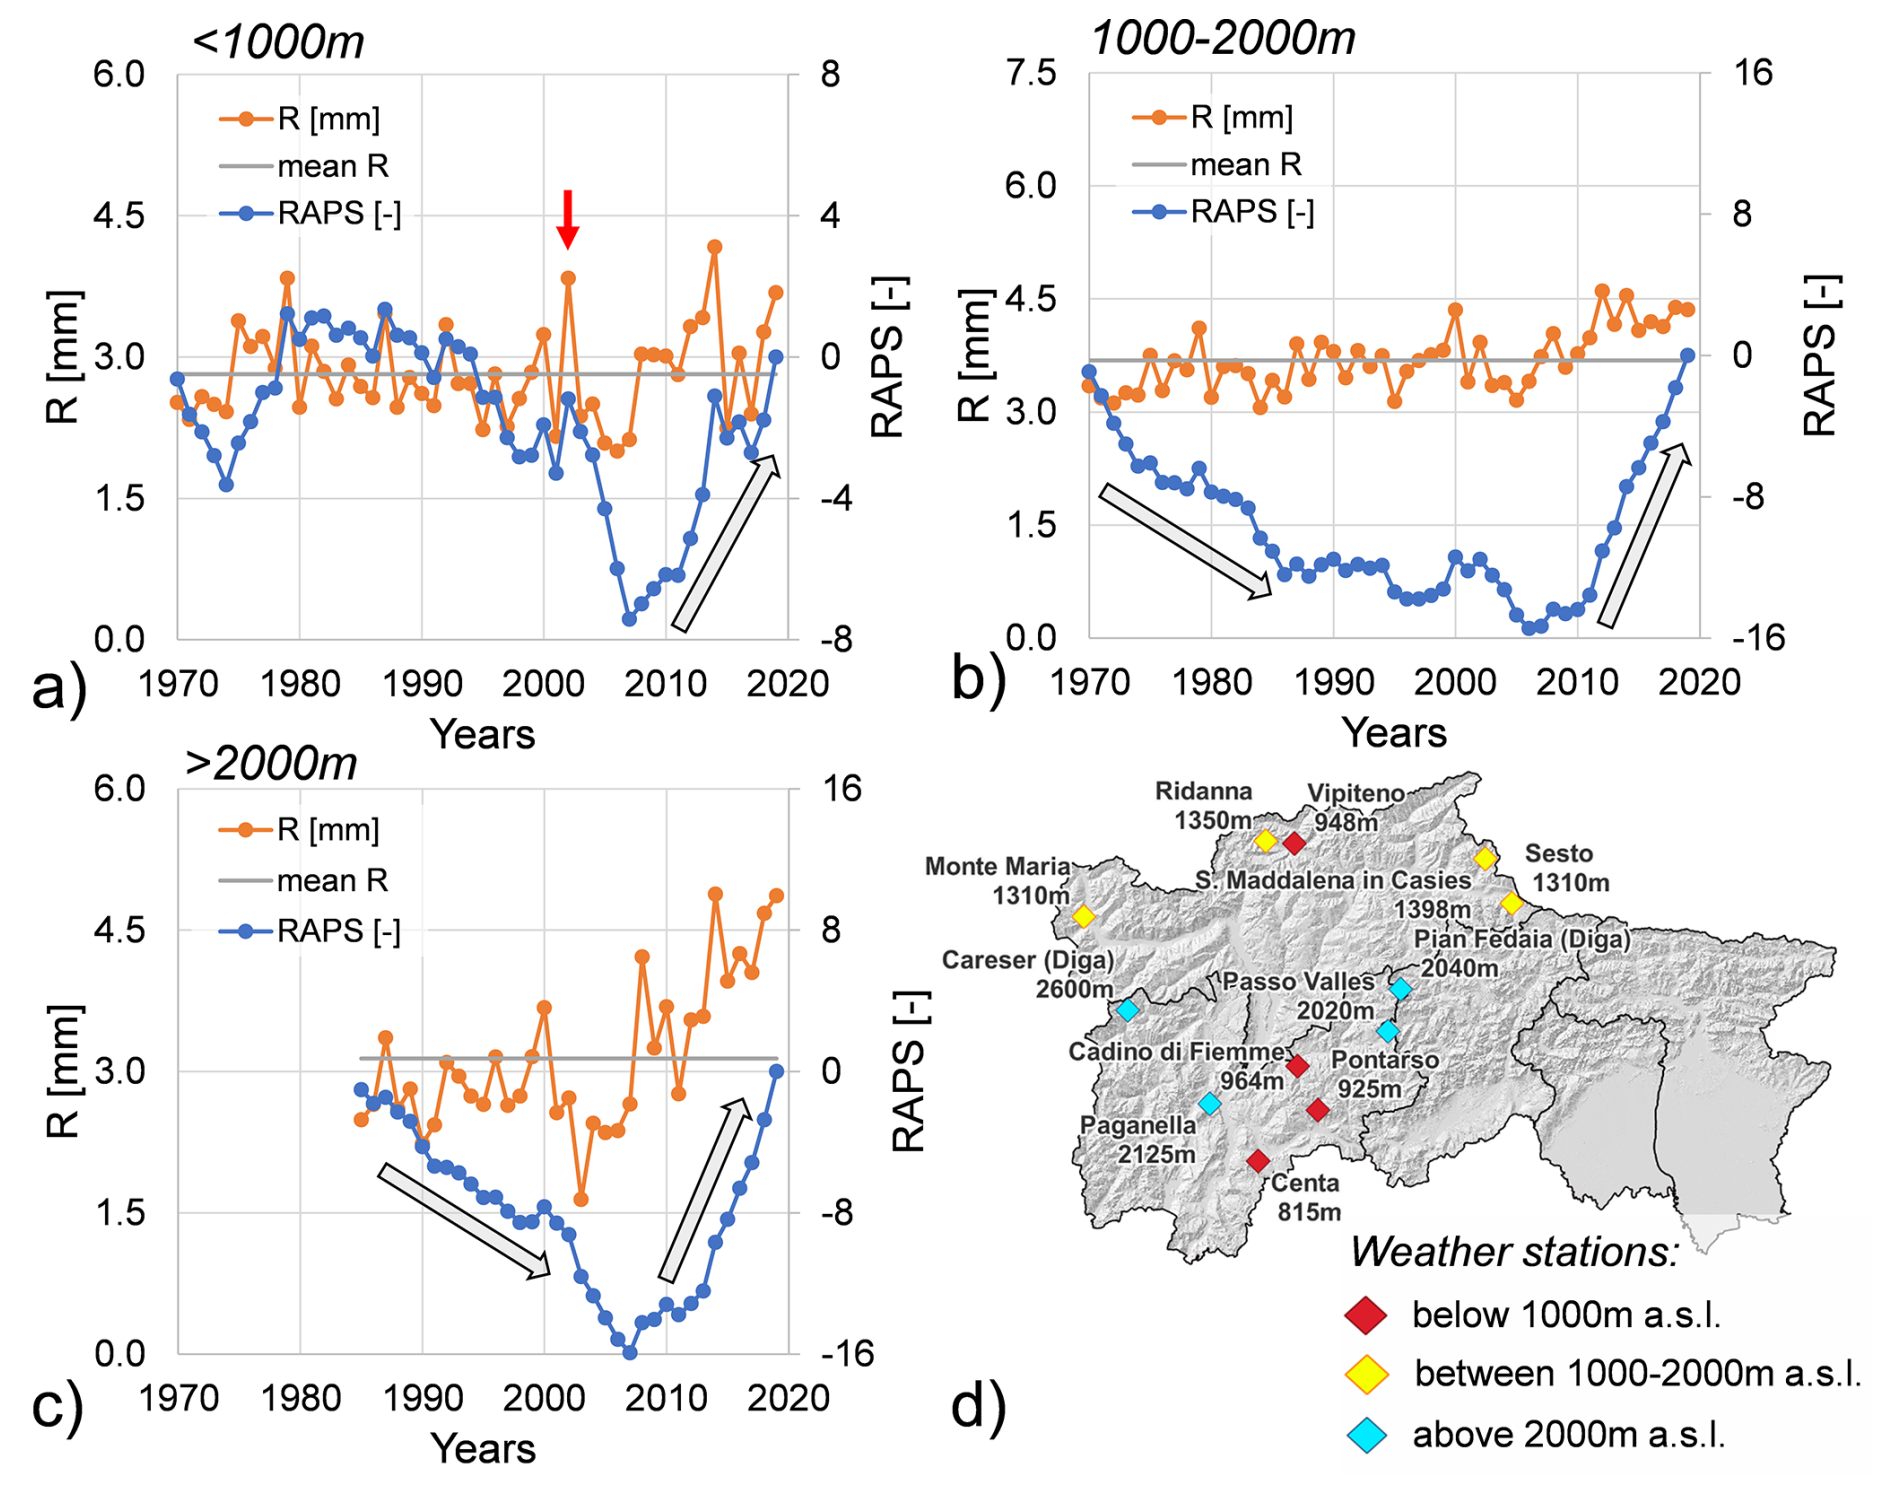
Figure 4Annual mean rainfall values and Rescaled Adjusted Partial Sums (RAPS): (a) altitudes below 1000 m (1970–2019); (b) altitudes between 1000–2000 m (1970–2019); and (c) altitudes above 2000 m (1985–2019). The red arrow in (a) indicates extraordinary events of 2002. (d) Spatial distribution of the 12 meteorological stations considered (Set C).
4.1.2 Air mean temperature
Air temperature exhibits variations on yearly, seasonal, monthly, and daily scales, with weather stations recording daily maximum and minimum temperatures. The initiation of rockfalls can be significantly linked to these temperature variations, both within a single day and overextended periods. For this analysis, variations in temperature over periods longer than one day are represented by the mean air temperature, while intra-day variations are captured by the air temperature amplitude (Sect. 4.1.4).
Figure 5 illustrates the frequencies of the 90 d mean temperature across the four seasons and five decades. A consistent trend of reduced for low temperatures and an increased frequency for high temperatures is observed over the decades. Across all seasons and altitudes (as detailed in Sect. S1.2), the results indicate a slight warming trend in the study area, with a particularly significant frequency increase observed during the autumn season.
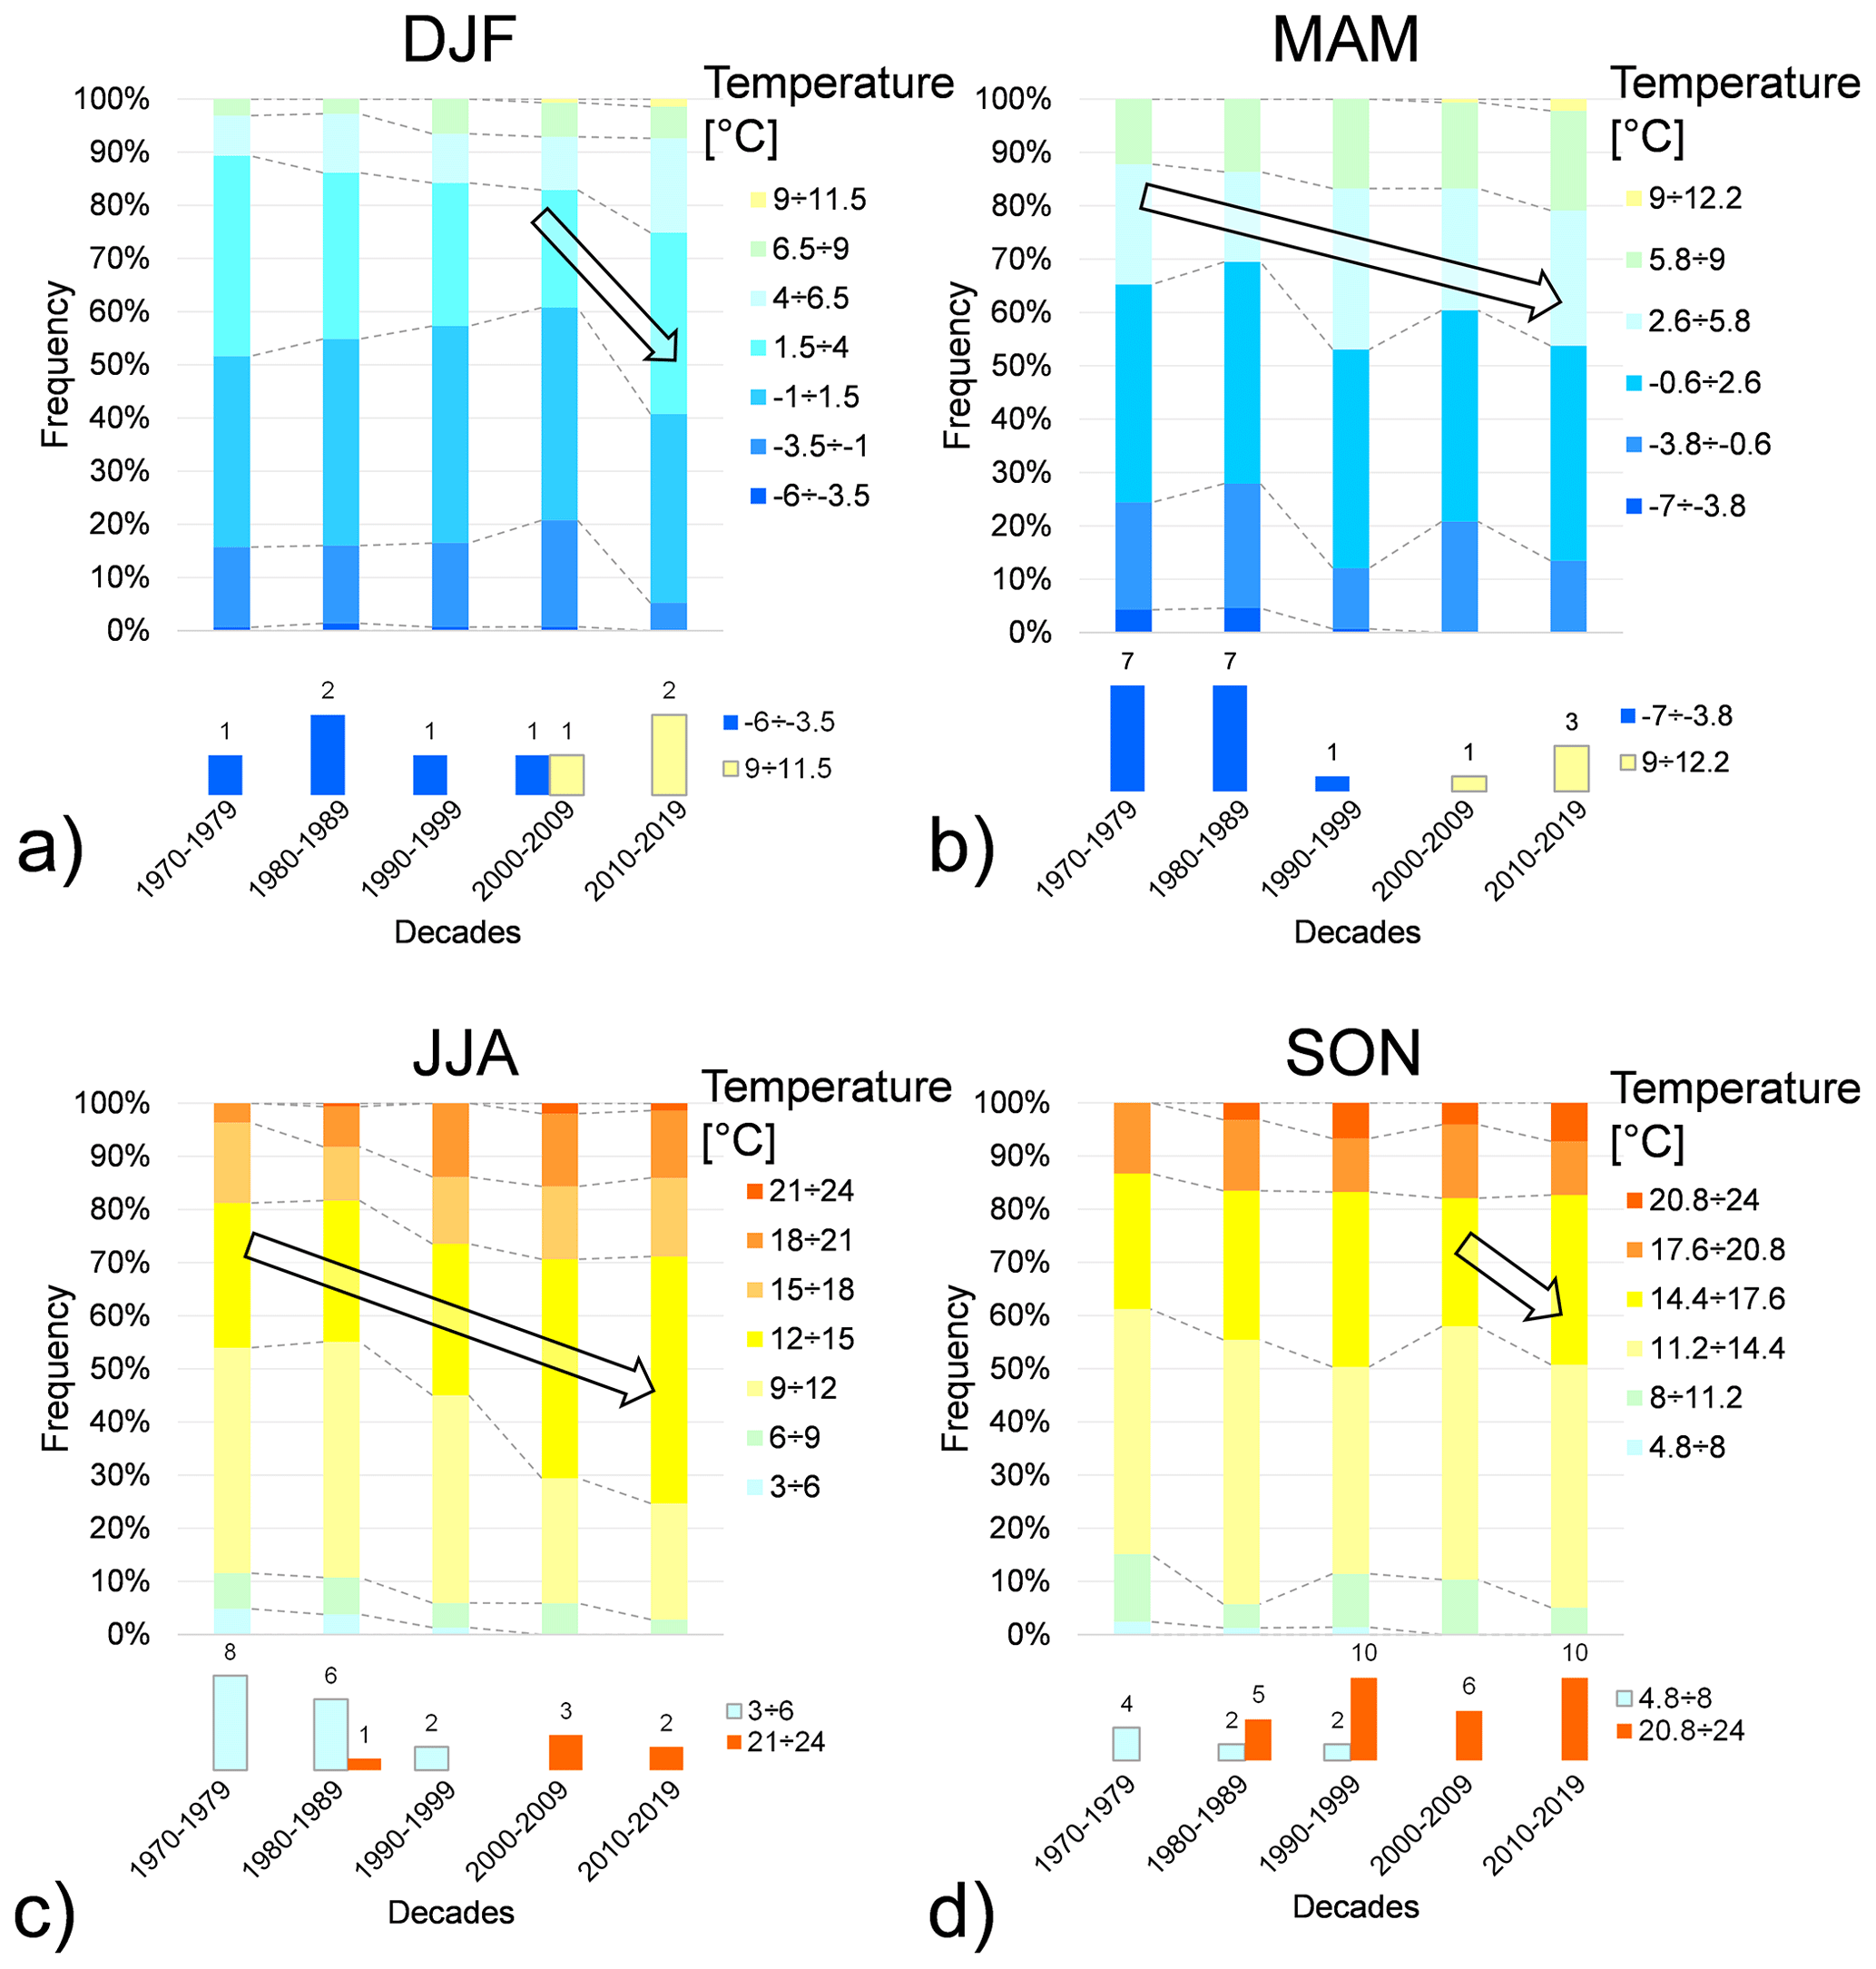
Figure 5Frequency distribution of mean temperature with an aggregation scale of 90 d during: (a) winter (DJF), (b) spring (MAM), (c) summer (JJA) and (d) autumn (SON). Arrows indicate a possible frequency trend associated with each sub-interval of mean temperature. Frequencies of the maximum and minimum temperature ranges are zoomed in at the bottom of each graph.
Based on the methodology by Nigrelli and Chiarle (2023), and using the 12 stations selected for an overlapping period from 1985 to 2019, the annual average warming rates were calculated. For minimum temperature, the rates ranged between 0.23 and 0.51 °C per decade, while for maximum temperature, they ranged between 0.17 and 0.37 °C per decade (Fig. 6). The highest warming rates were identified during the spring period above 2000 m, with maximum increases of approximately 0.65 °C for maximum temperature and 0.62 °C per decade for minimum temperature.
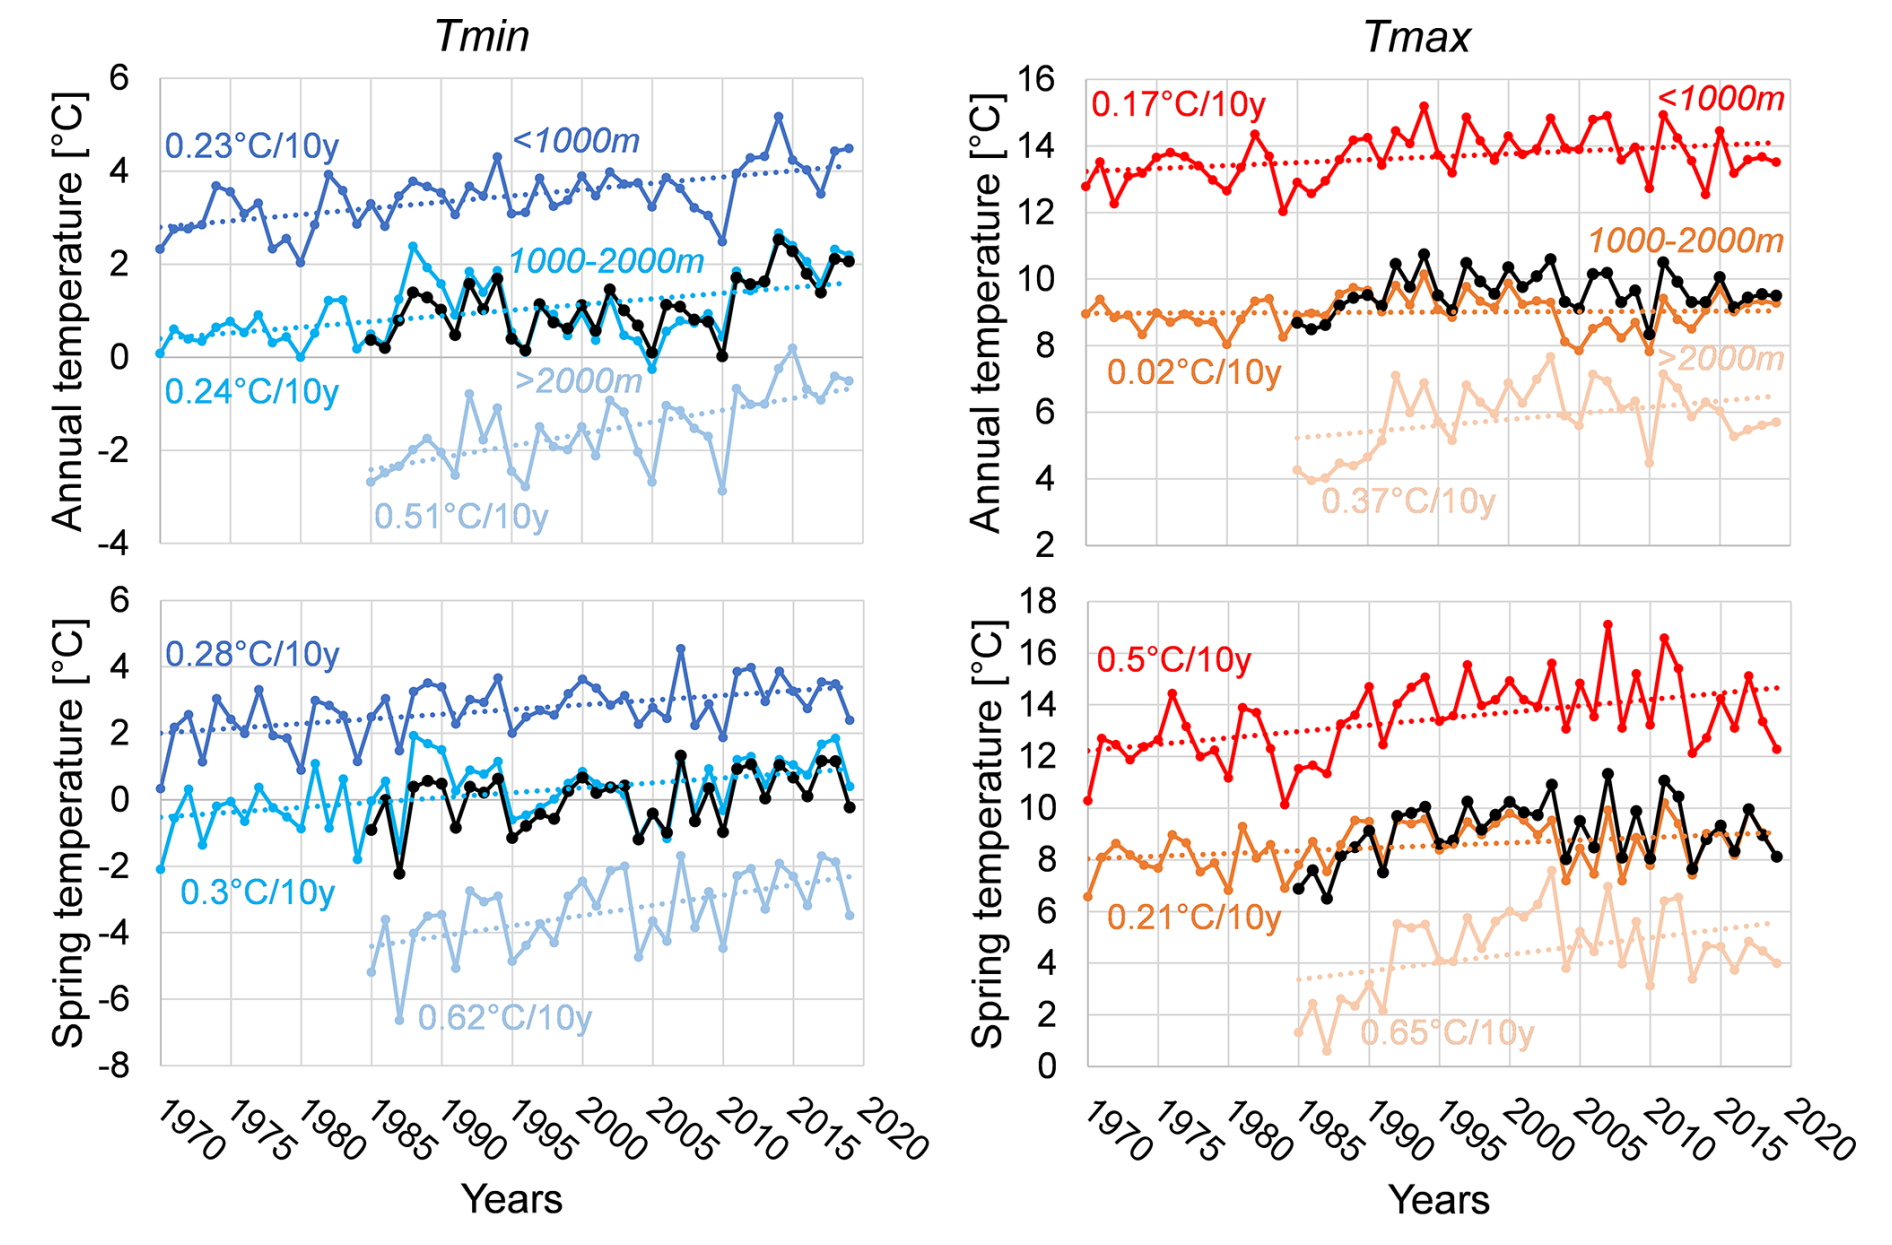
Figure 6Annual and spring Tmin and Tmax trends considering 12 weather stations from 1970 to 2019 for case study. The lack line shows the mean time-series.
To corroborate the conclusion regarding the shifting of winter and spring seasons, an analysis similar to Wang et al. (2021) was performed. Considering the 12 weather stations with full time-series (Set C) from 1970 to 2019, an increase in mean temperature of approximately 1.5 °C in winter and 3 °C in summer was observed (Fig. 7a–c). During the spring and autumn seasons, an increase in mean temperature of about 3 and 2 °C, respectively, was noted. Furthermore, this analysis revealed a shift in the onset of spring by 30 d and autumn by 20 d, consequently causing a change in the length of these two seasons (Fig. 7b–d), with a more significant change occurring during spring.
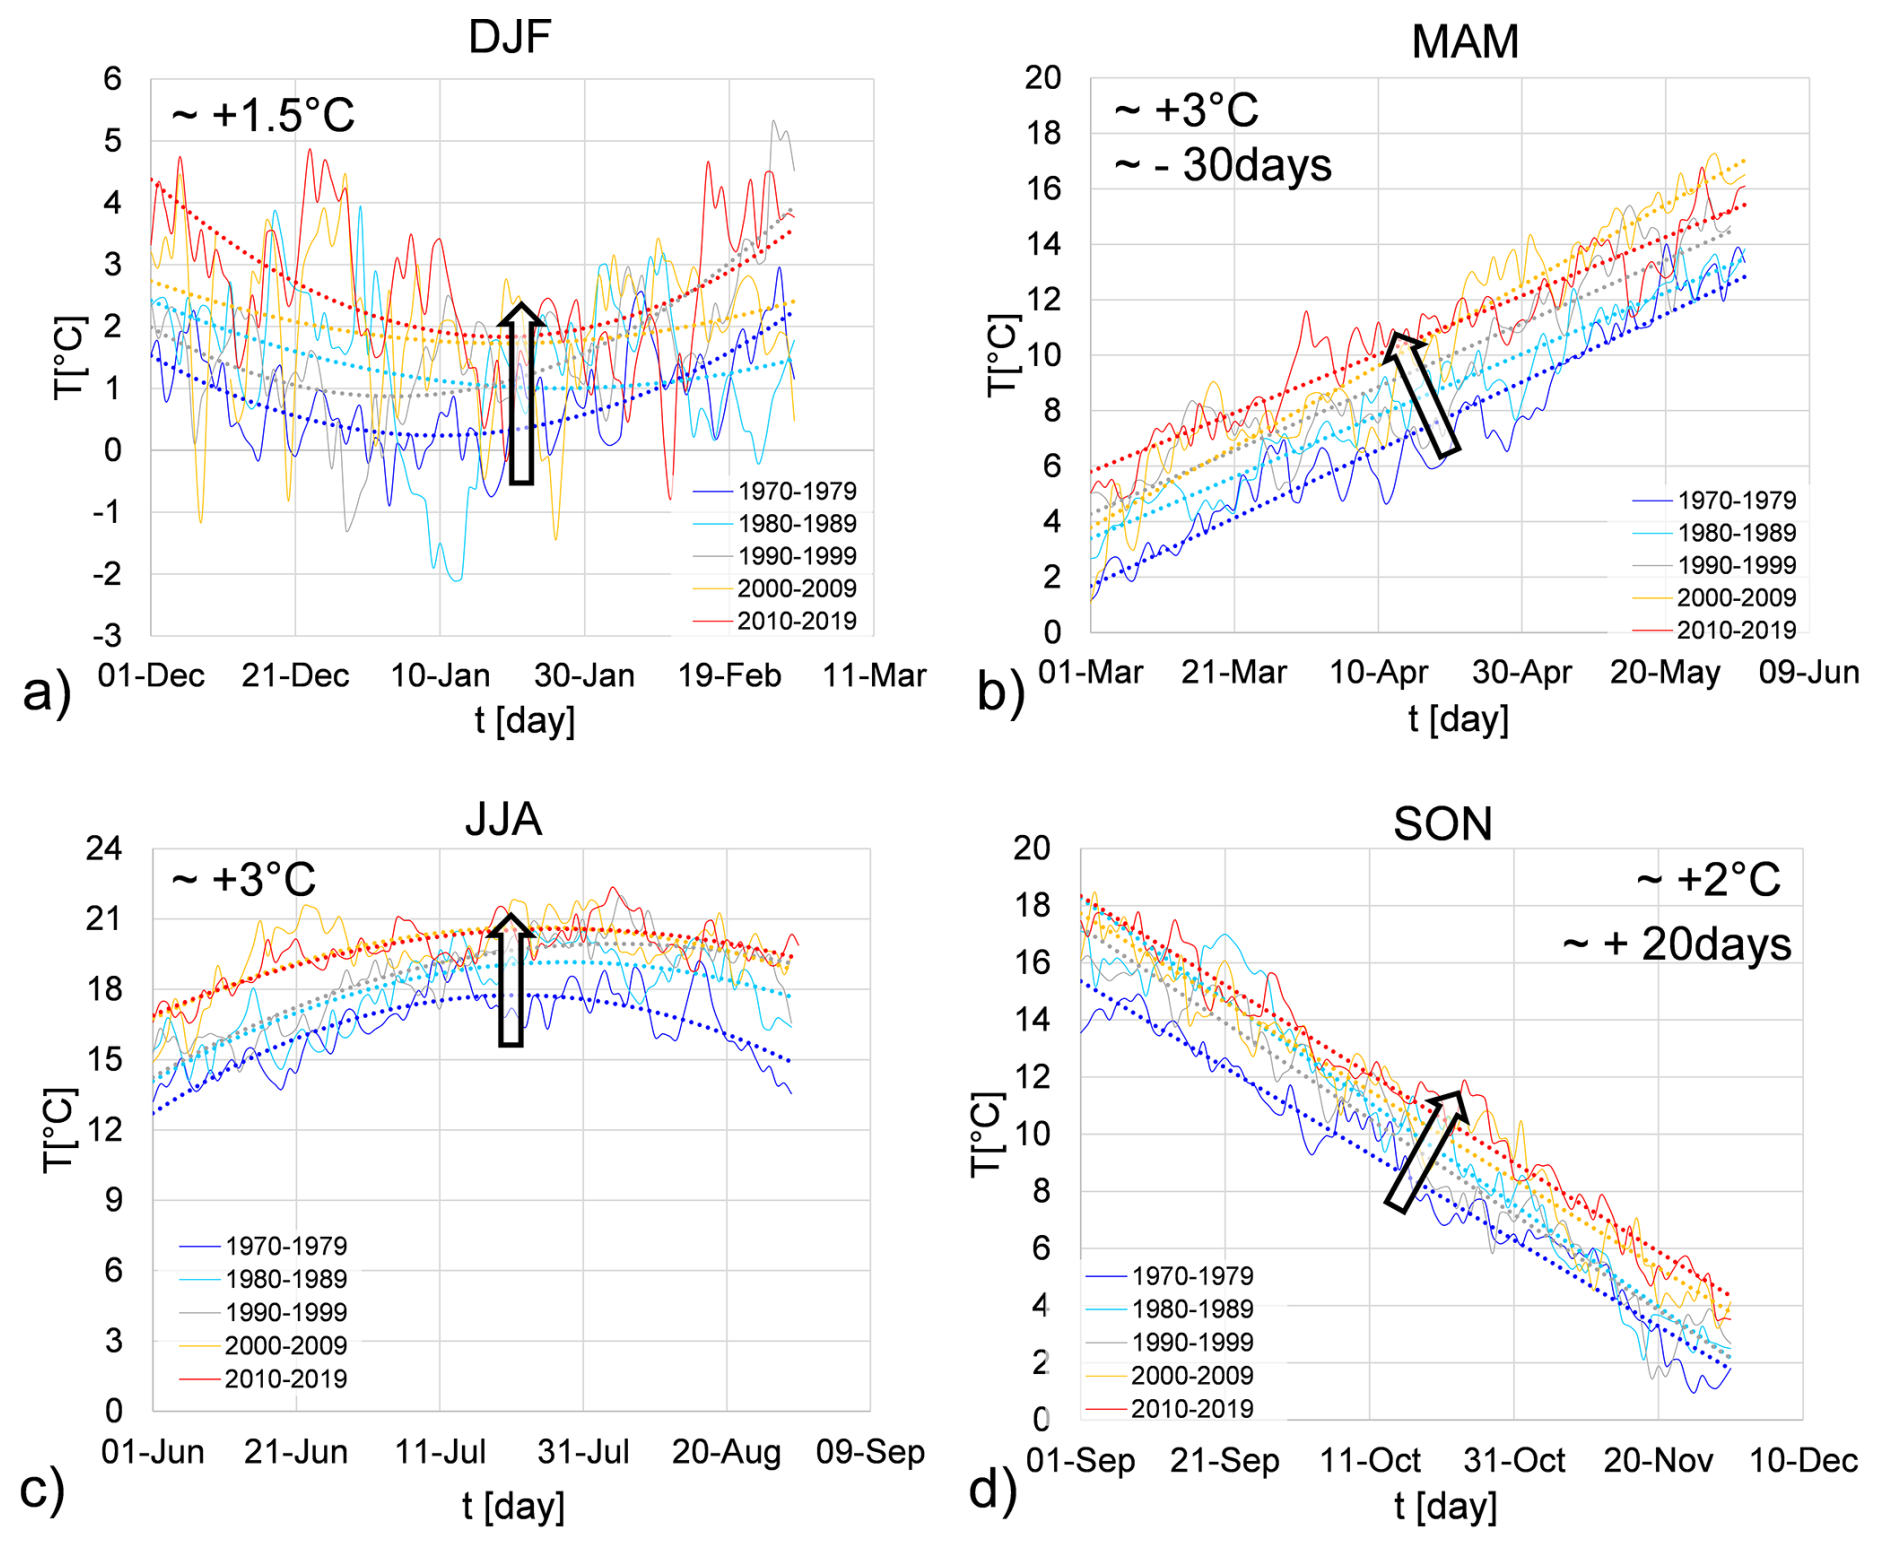
Figure 7Daily time series of air mean temperature over 1970–2019 during: (a) winter (DJF), (b) spring (MAM), (c) summer (JJA) and (d) autumn seasons (SON).
4.1.3 Temperature variation
Air mean temperature variation is defined as the difference between the mean air temperature on a given day and the corresponding mean air temperature assessed on a preceding day, as determined by the chosen aggregation scale. Figure 8 illustrates the frequencies of temperature variation with an aggregation scale of 6 d for the four seasons. No significant changes in temperature variation are evident over the decades, apart from minor fluctuations. This suggests that temperatures change gradually from one season to the next across the years, maintaining a consistent evolution throughout all decades. This conclusion holds true when considering other aggregation scales, as shown in Sect. S1.3. When comparing the highest and lowest values of temperature variation, ΔT, an increase in the 8 ÷ 10 °C range during winter in the last decade was observed (Fig. 8a). Conversely, in summer, a reduction of frequencies of extreme temperature variation values was noted (Fig. 8c).
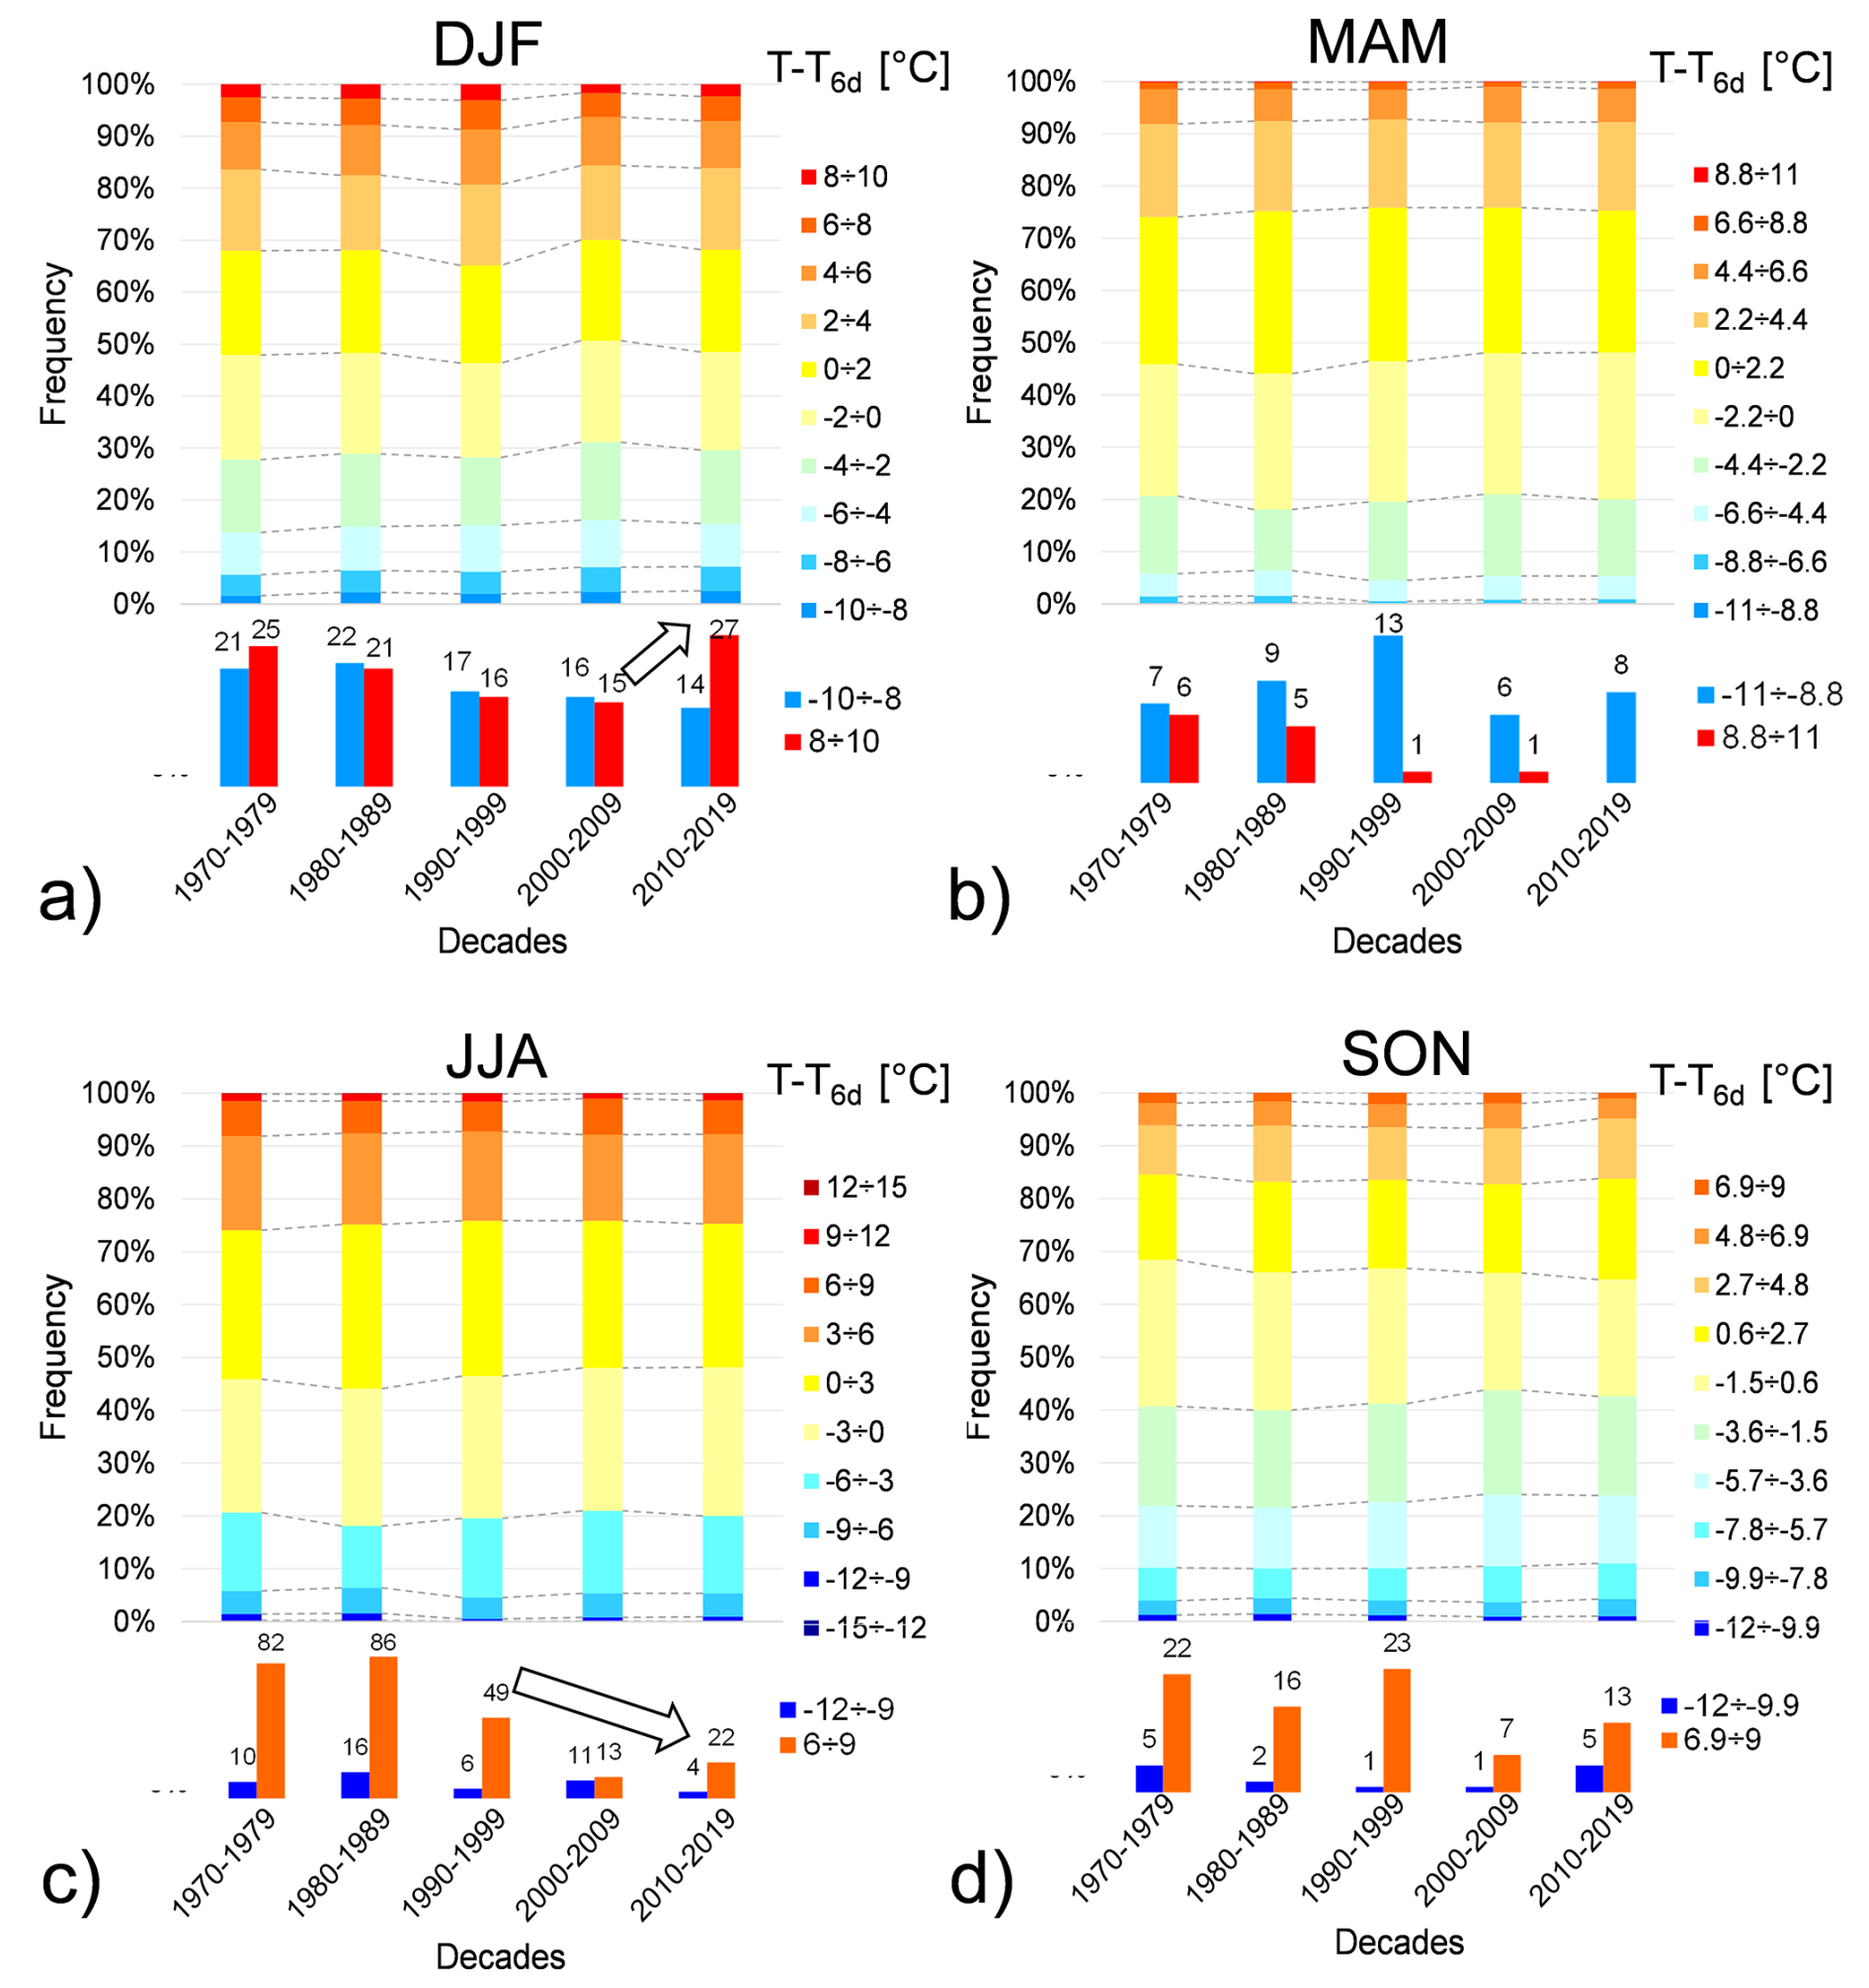
Figure 8Frequency distribution of mean temperature difference with an aggregation scale of 6 d during: (a) winter (DJF), (b) spring (MAM), (c) summer (JJA) and (d) autumn (SON). Arrows indicate a possible frequency trend associated with each sub-interval of temperature variation. Frequencies of the maximum and minimum temperature-difference ranges are zoomed in at the bottom of each graph.
4.1.4 Temperature amplitude
The results concerning temperature amplitude frequencies, considering different decades and seasons, are shown in Fig. 9.
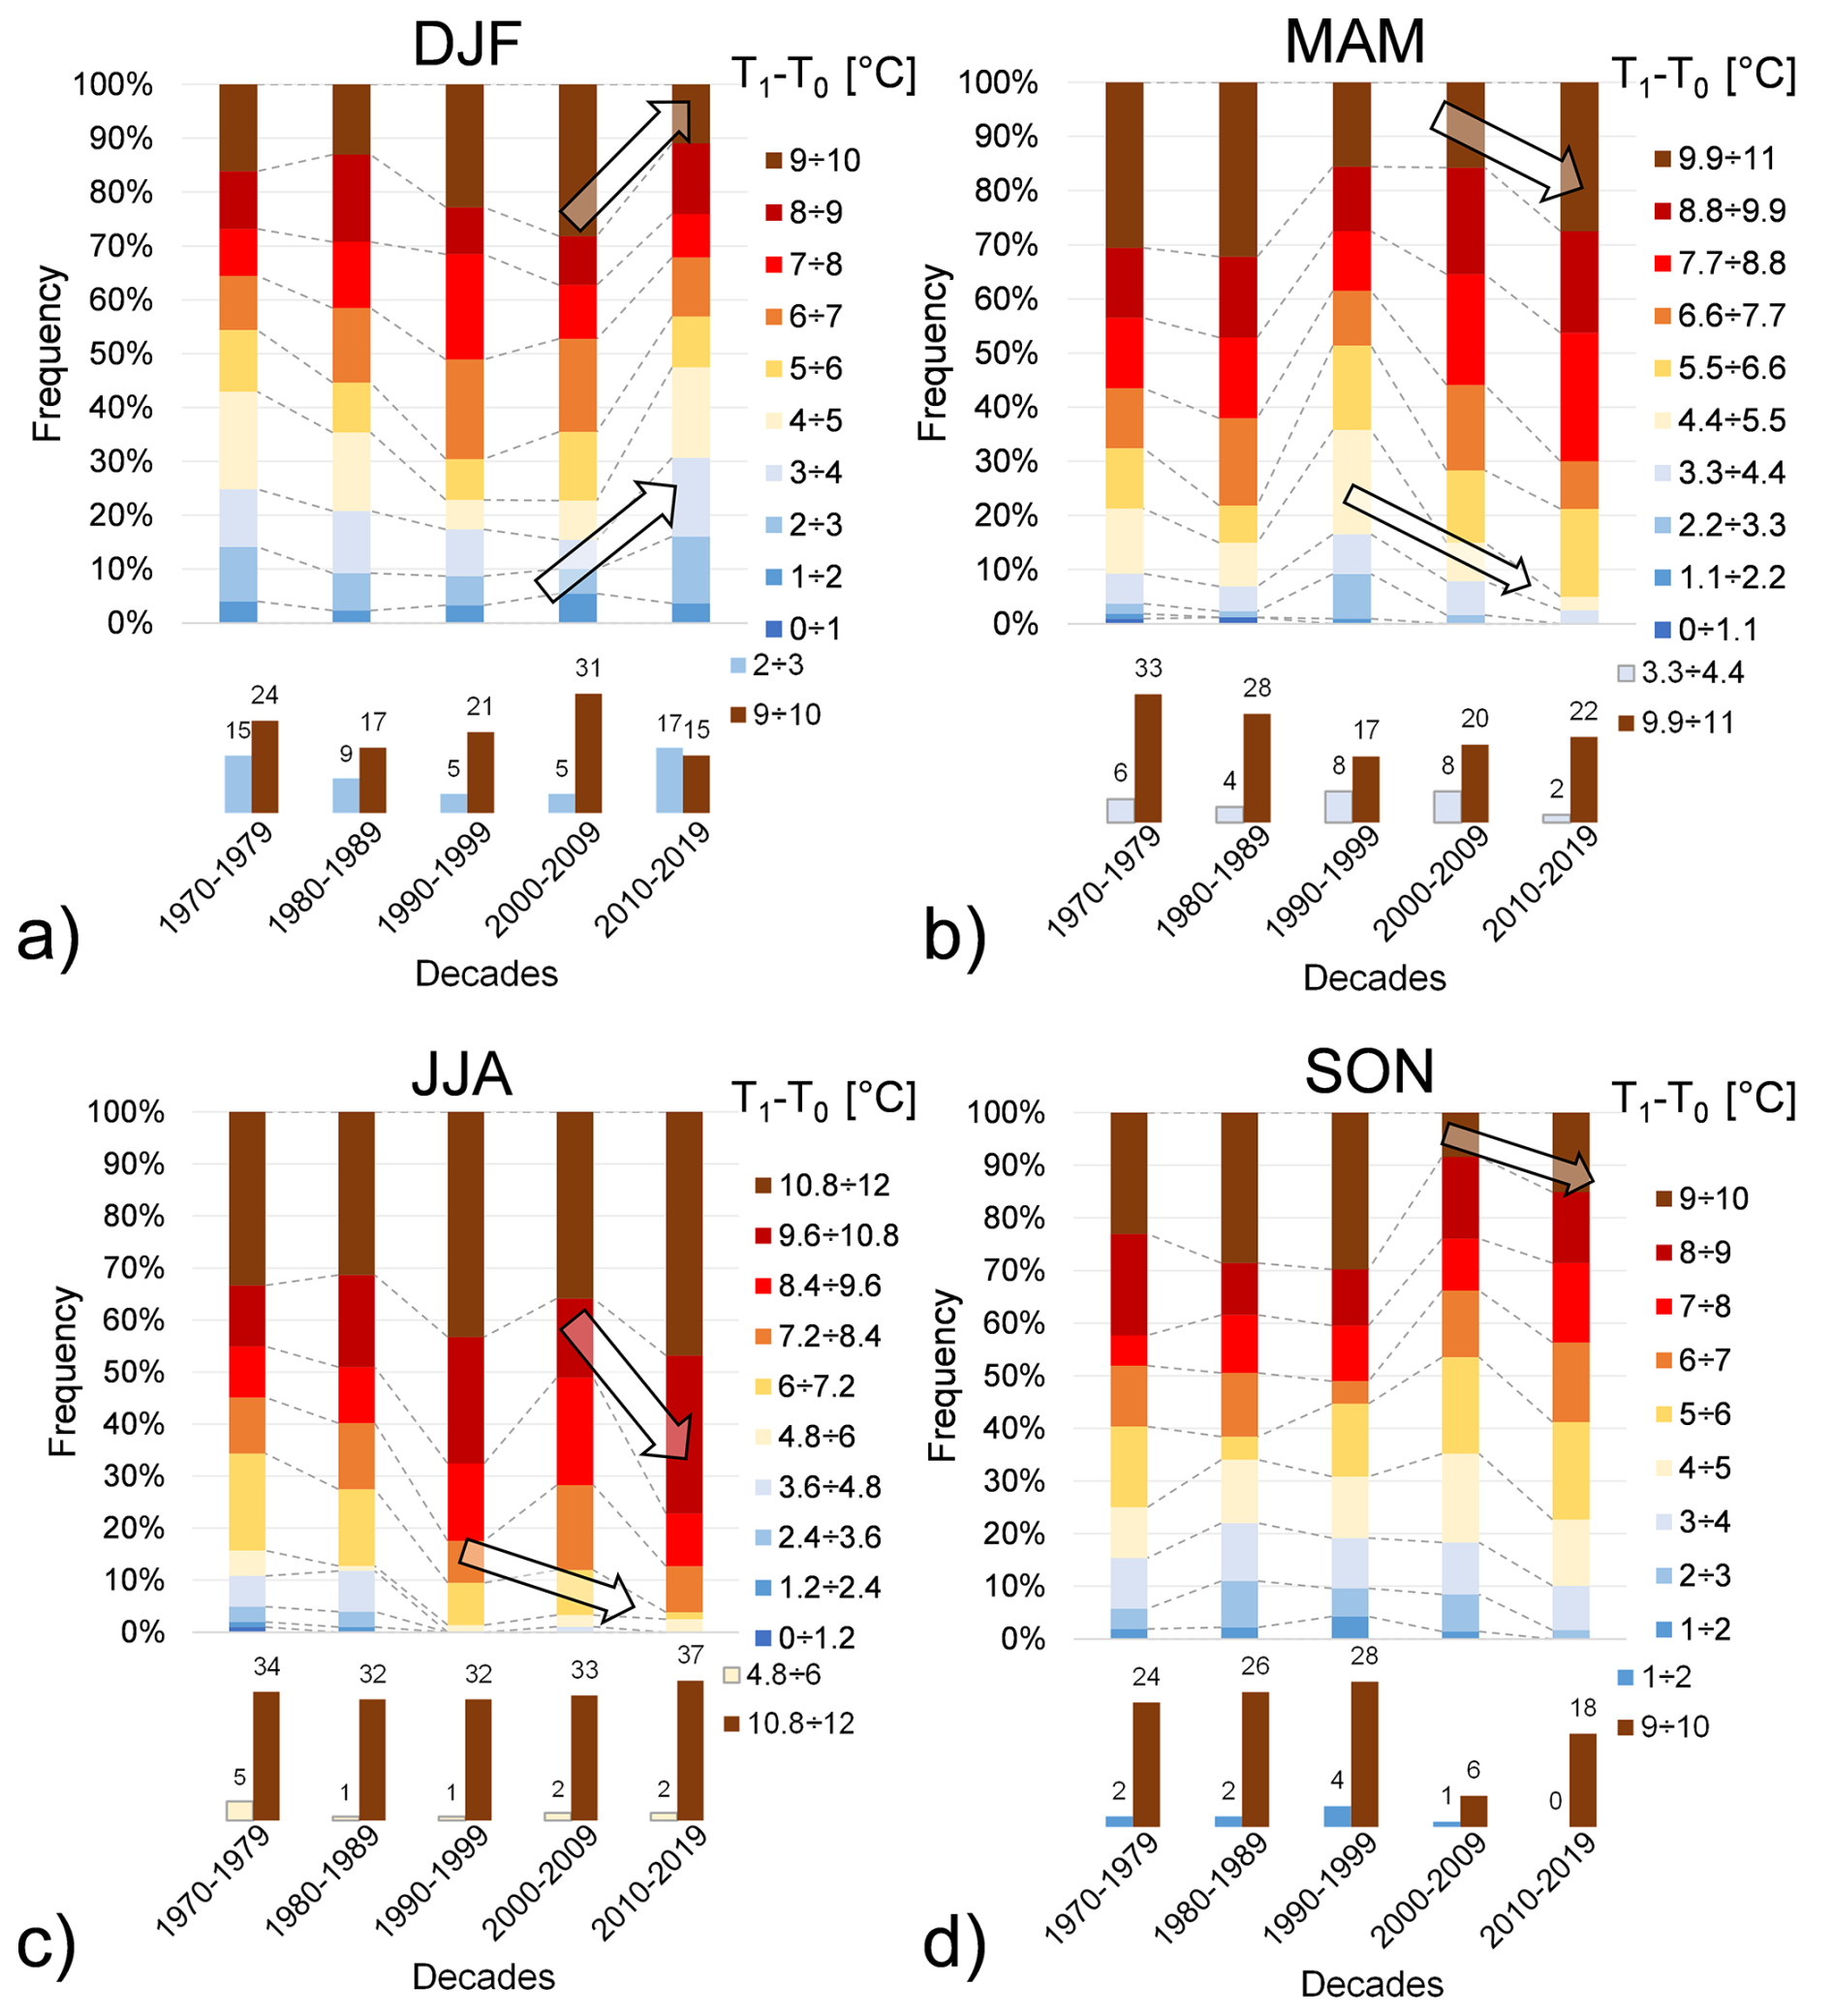
Figure 9Frequency distribution of daily air temperature amplitude with an aggregation scale of 90 d, and at all elevations, during: (a) winter (DJF), (b) spring (MAM), (c) summer (JJA) and (d) autumn (SON). Arrows indicate a possible frequency trend associated with each sub-interval of temperature amplitude. Frequencies of the maximum and minimum temperature amplitude ranges are zoomed in at the bottom of each graph.
In all seasons, except winter, an increase in the frequencies of maximum temperature amplitude and a reduction in frequencies of the lowest range were observed. This indicates that on many days, there is a significant difference between minimum and maximum temperatures, averaging 11 °C. Conversely, during the winter season, the opposite trend was noted: low temperature amplitude ranges increased, while high ones decreased over the last decade. This suggests that the difference between minimum and maximum temperatures tends to be less pronounced in winter.
4.1.5 Freeze-Thaw cycle
As the frequency of high temperatures increases, so does the number of days with maximum and/or minimum daily temperatures above zero. This shift alters the persistence of icing in the area, consequently affecting the onset and frequency of freeze/thaw cycles, and leading to an increase in the number of ice-free days. Specifically, freeze/thaw cycles accelerate rock mass degradation by reducing cohesion at the ice-rock interface. To investigate these effects, the persistence of both icing and freeze/thaw cycles was analyzed. The results for freeze/thaw cycles, considering different elevations at a 7 d aggregation scale are presented in Fig. 10. For each elevation, two key months were selected, as representing periods when freeze/thaw cycles typically cease or commence.
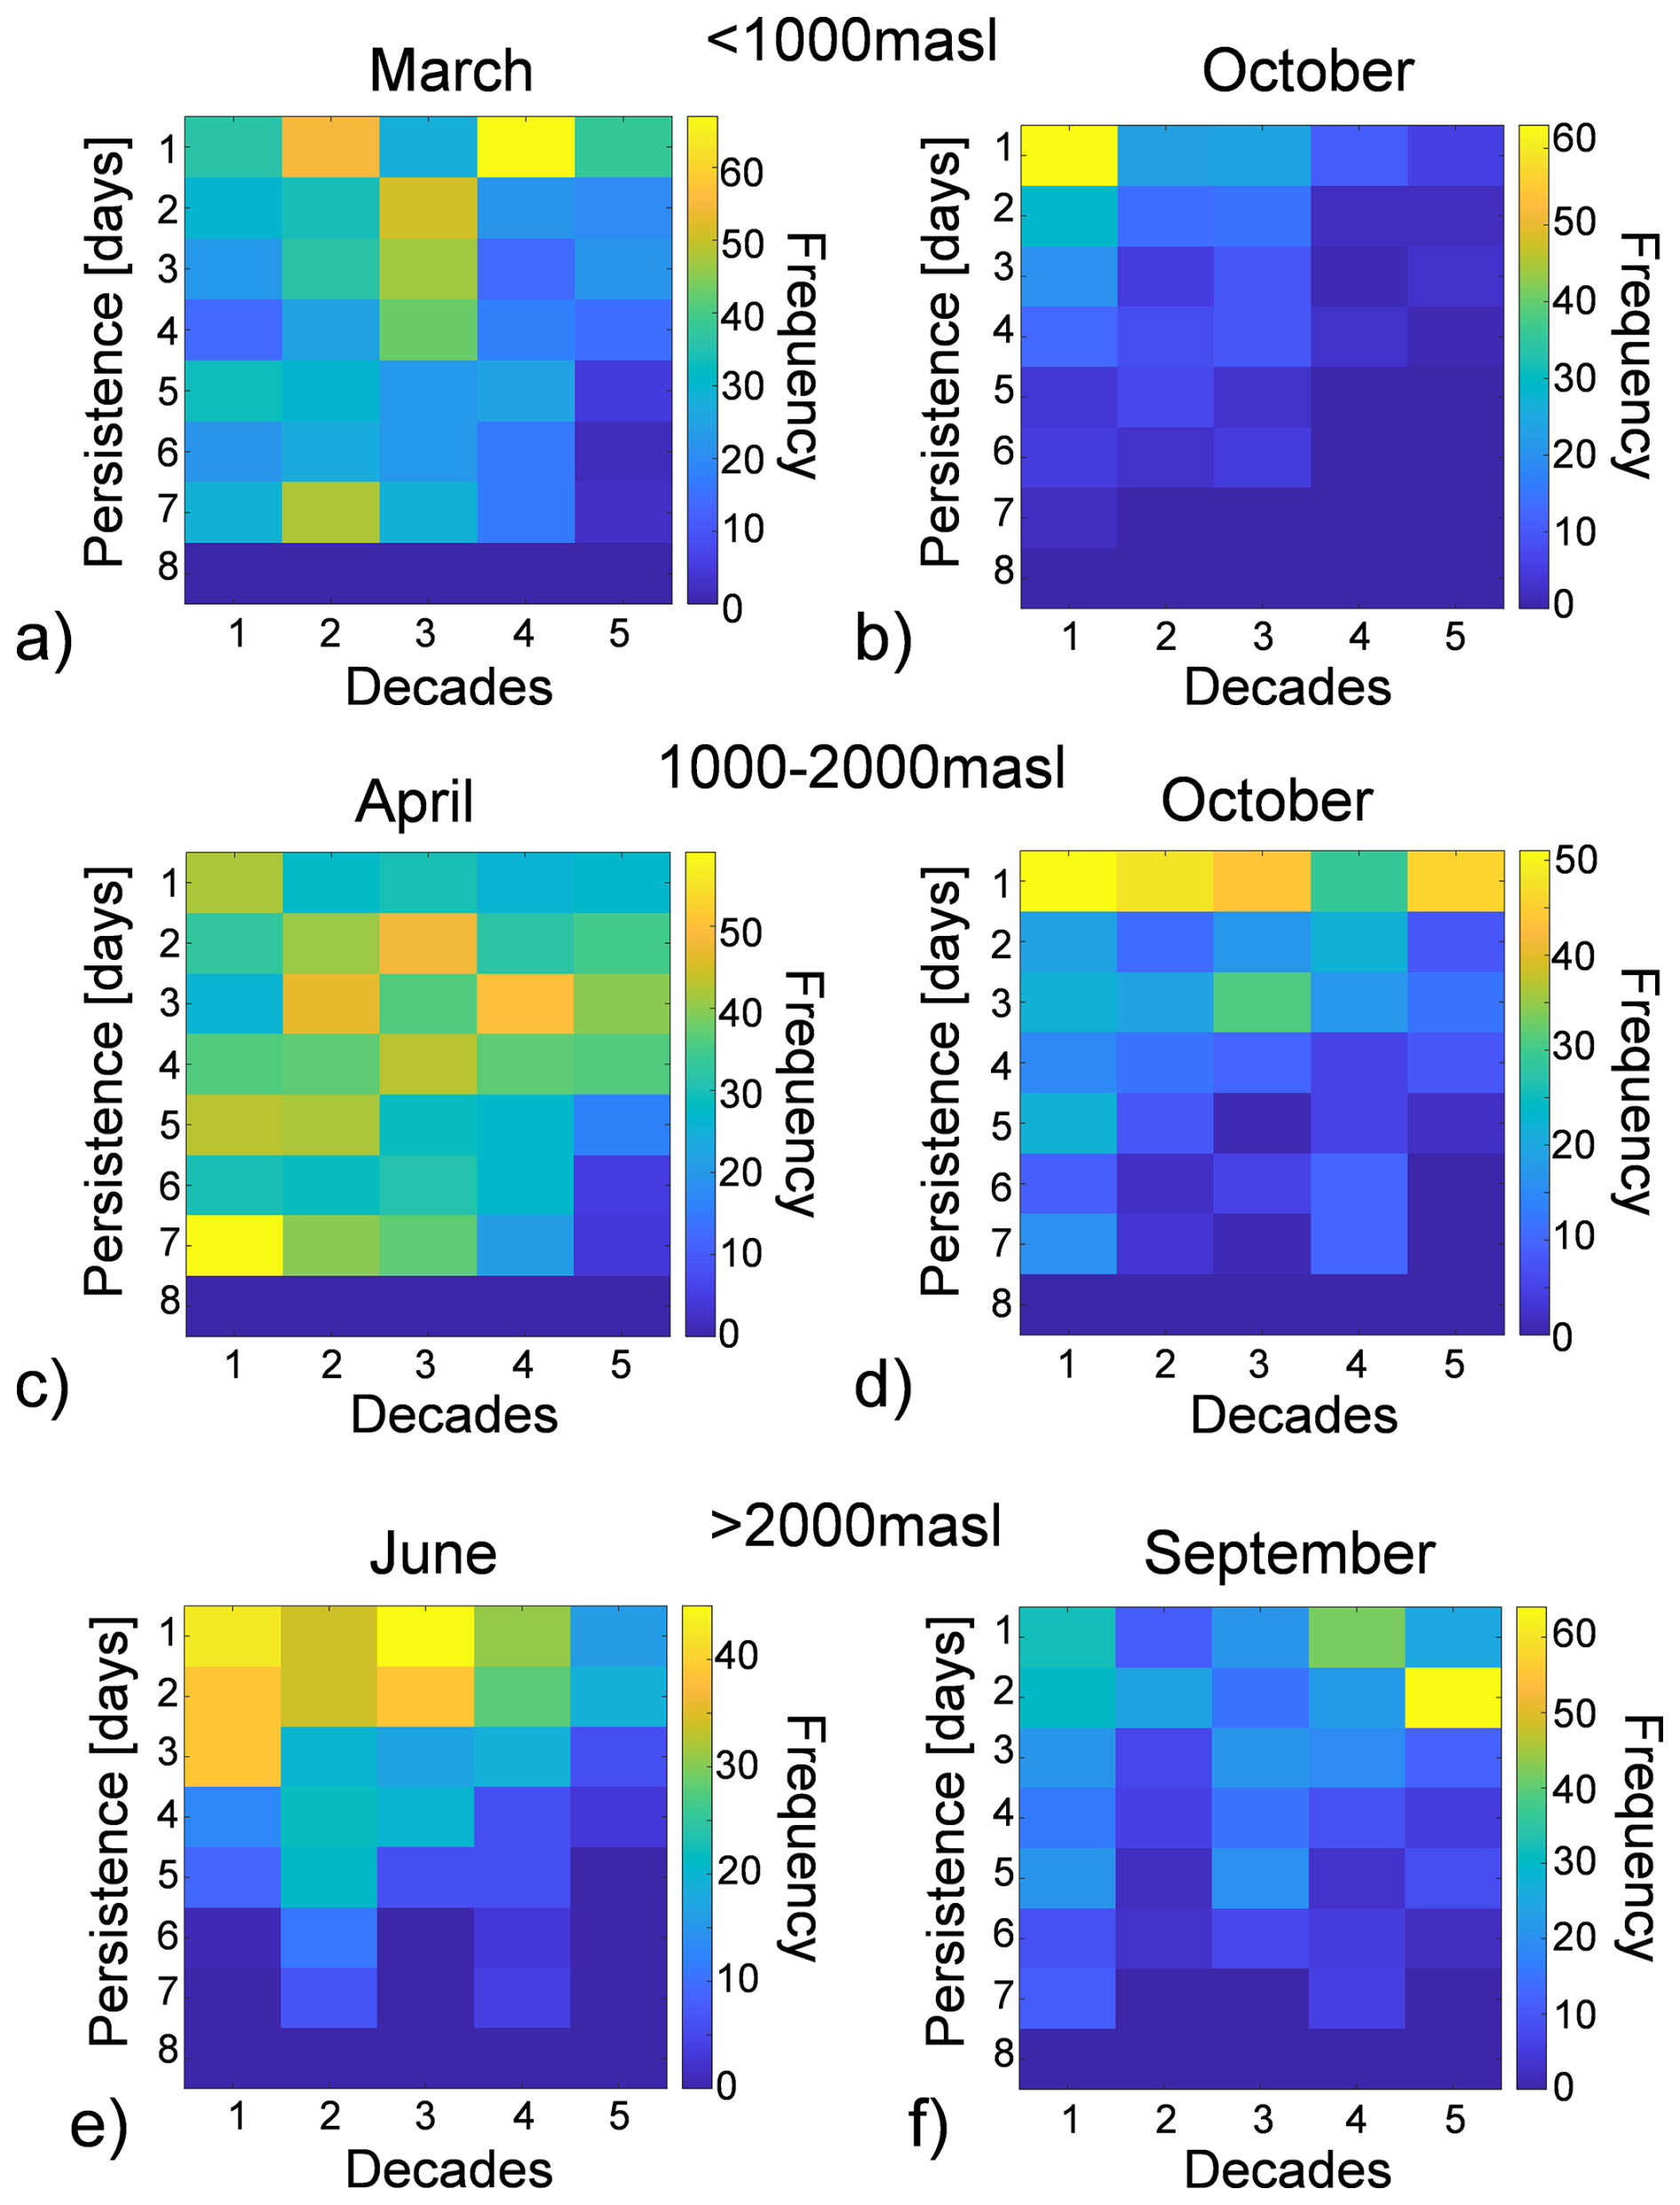
Figure 10Heatmaps of freeze-thaw cycle frequency during thawing and freezing period: (a–b) below 1000 m a.s.l., (c–d) between 1000–2000 m a.s.l. and (e–f) above 2000 m a.s.l.
Overall, the results indicate a general decrease in the persistence and frequency of freeze-thaw cycles over the years, signifying a reduction in the number of consecutive days experiencing these cycles. When analyzing different altitude ranges: for elevations below 2000 m (Fig. 10a, b, c and d), this reduction in persistence is observed in March/April and October. Due to warming, high frequencies with low persistence are observed in March/April during the last decade, as freeze/thaw cycle days are no longer consecutive. Similarly, in October at low altitudes (Fig. 10b), freeze/thaw cycles occur less frequently and tend to disappear. At medium altitudes between 1000 and 2000 m (Fig. 10c and d), an increase in frequencies with one-day persistence is recorded. This indicates that freeze/thaw cycles are becoming more discontinuous, often separated by days where the minimum temperature remains above zero. Above 2000 m (Fig. 10e and f), a significant decrease in cycle frequency is observed in June and September. In September, many frequencies of consecutive freeze/thaw days with low persistence (e.g., 2 d) are noted. In contrast, during past decades, freeze/thaw cycles at these altitudes were less frequent but more continuous. These variations observed at different elevations can be attributed to the linear decrease in temperature with increasing altitude. This delays the end of the summer months and brings forward the end of the winter months at higher elevations. Similar patterns can be observed at other aggregation scales, as shown in Sect. S1.5.
4.1.6 Icing
Figure 11 illustrates the persistence and frequency of icing for the spring and autumn seasons at elevations above 2000 m, using a 7 d aggregation scale. Lower elevations were not considered, as no relevant icing phenomena were present at these altitudes during the studied decades. The results indicate a reduced frequency of 7 d persistence in both April and November. In April and October, there is an increase in 1 d persistence, while a reduction in persistence is noted in May. Consequently, while the total number of icing changes only slightly, their occurrence is increasingly interspersed with ice-free days. This phenomenon is primarily driven by an increase in maximum daily temperatures, which leads to a transition from pervasive icing to more frequent freeze/thaw cycles. To further verify this transition, Fig. 12 plots the persistence of freeze/thaw cycles for the same months and aggregation scale. A global increase in the frequency and persistence of freeze/thaw cycles is observed, indicating that some days that would traditionally experience icing are now undergoing freeze/thaw cycles.
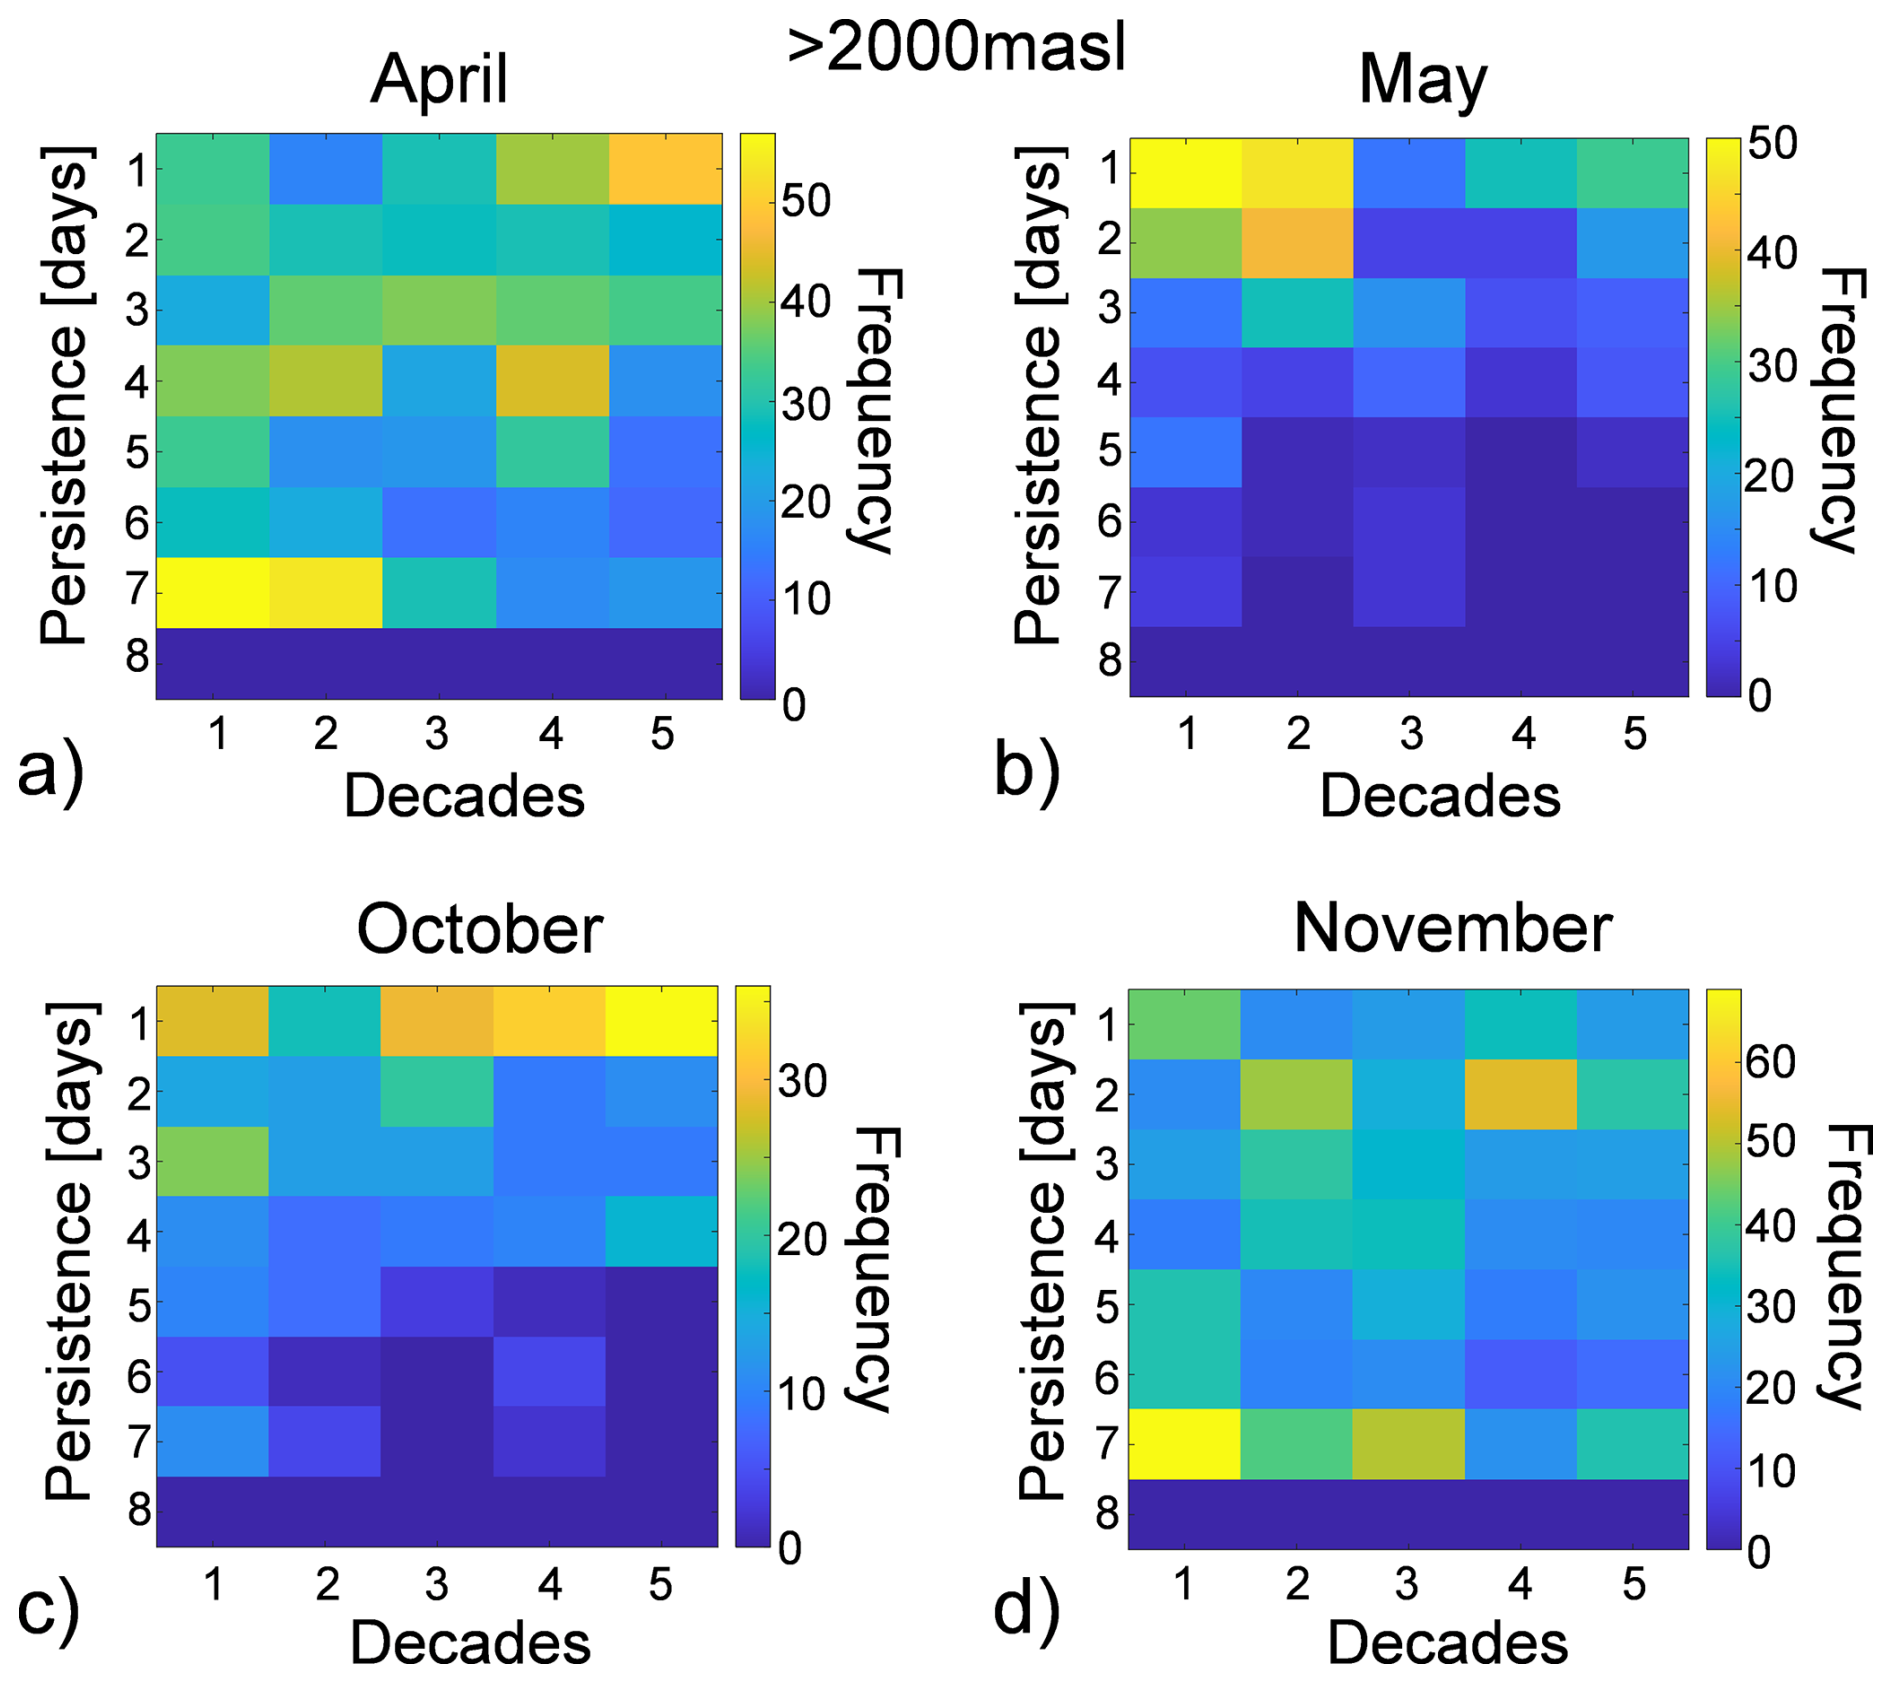
Figure 11Heatmaps of icing frequency above 2000 m a.s.l.: during (a–b) spring season and (c–d) autumn season.
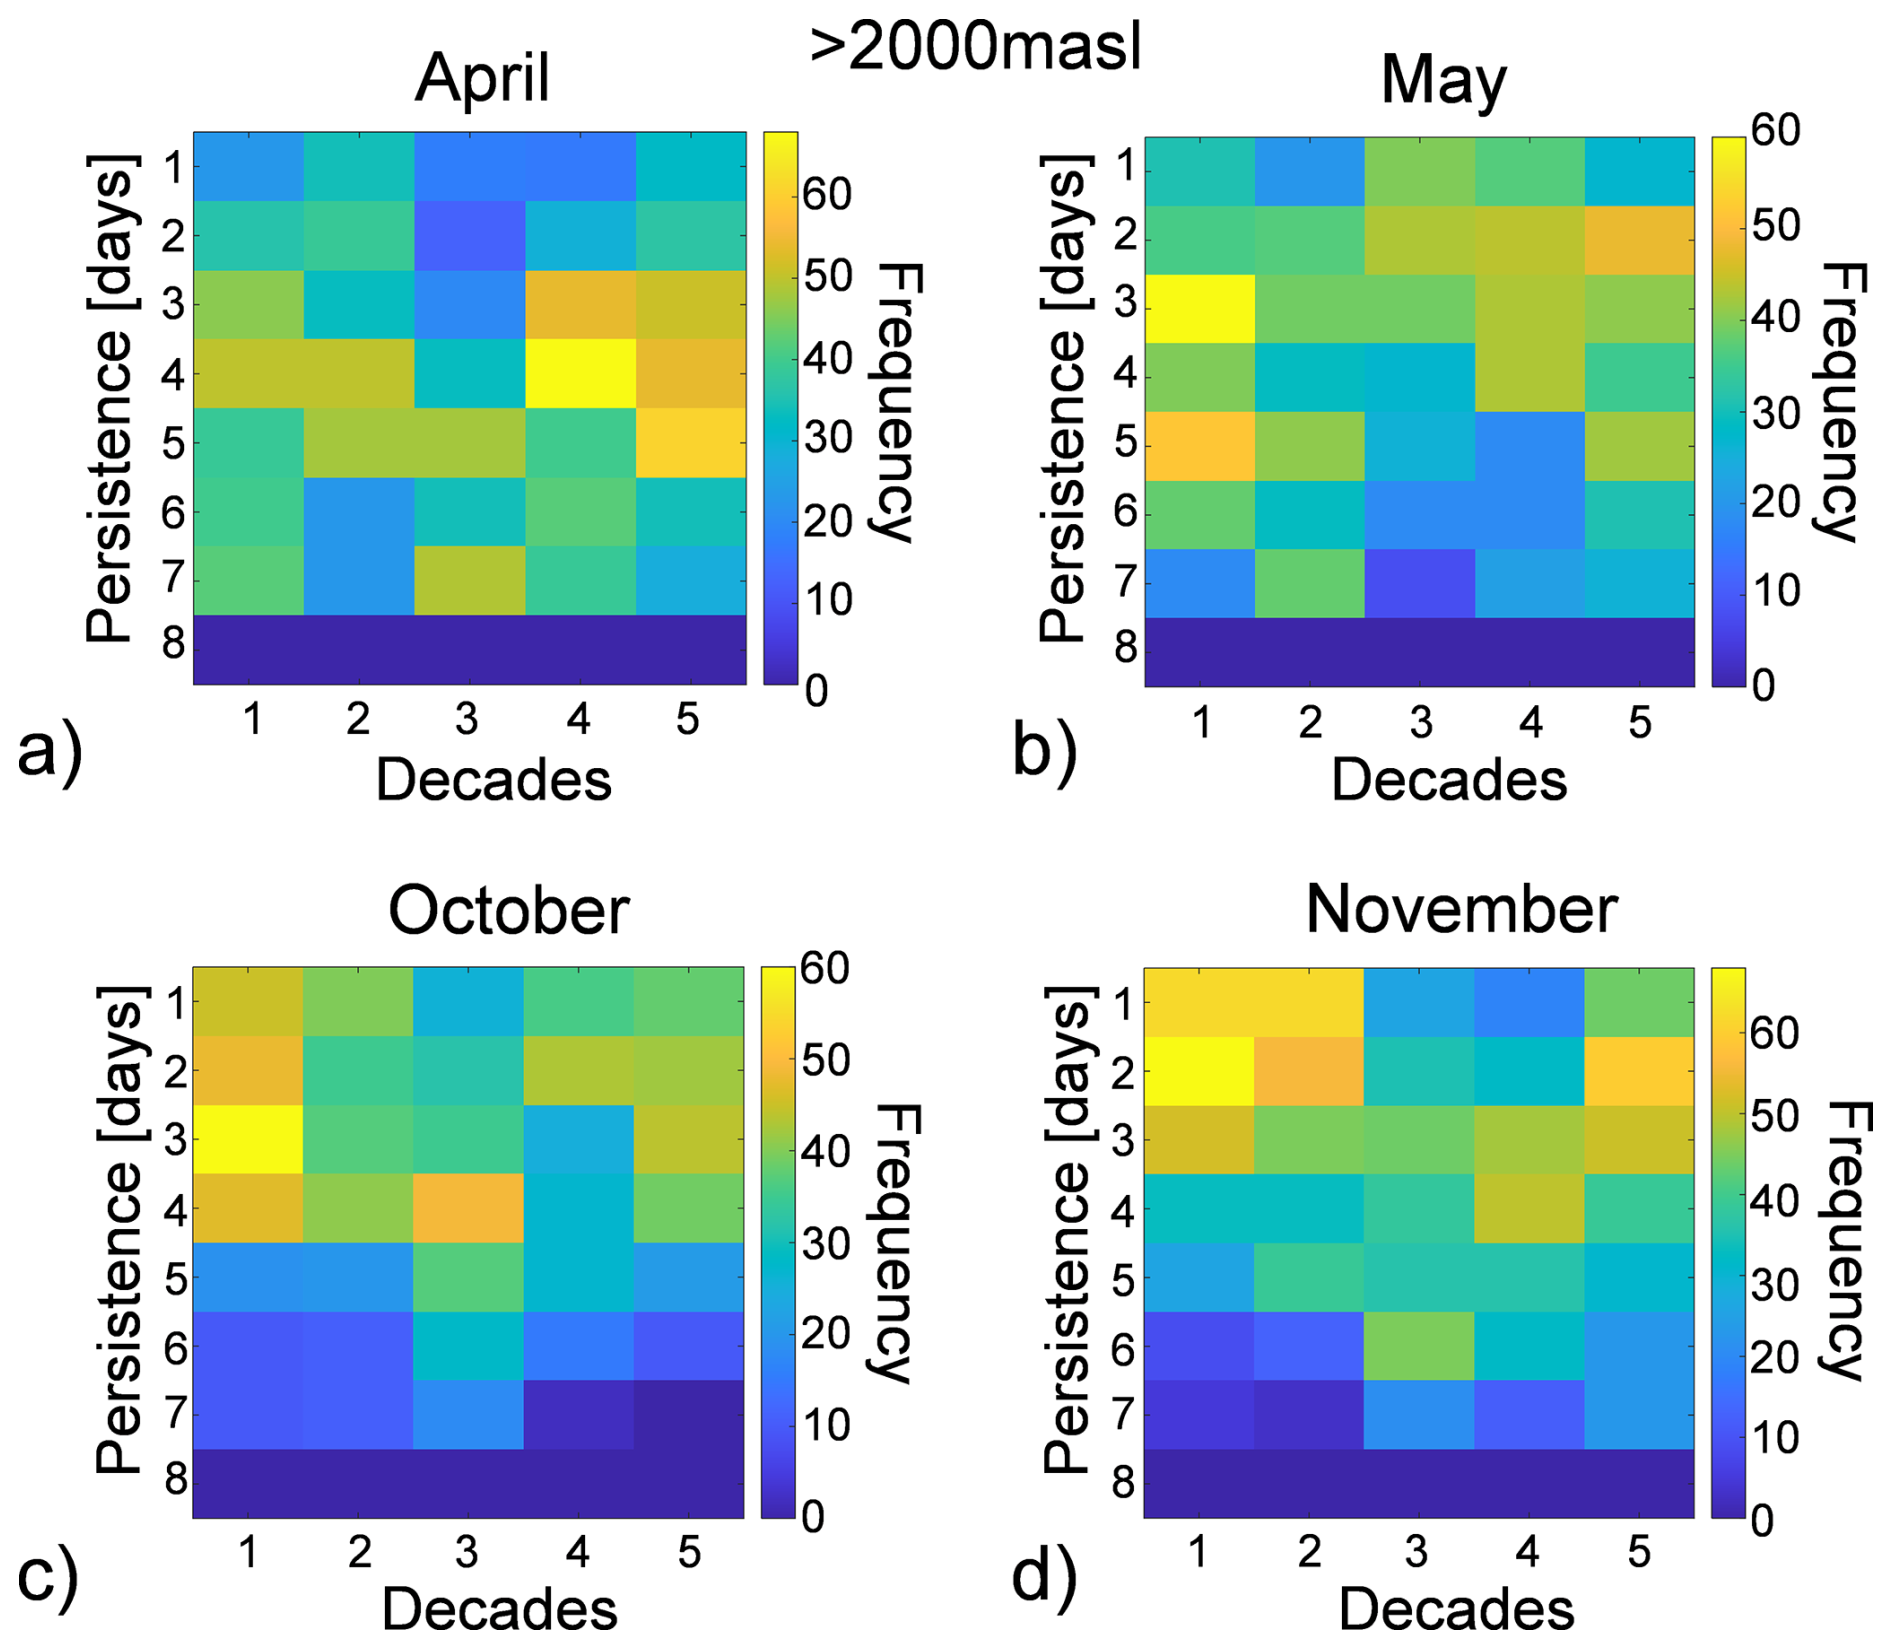
Figure 12Heatmaps of freeze-thaw cycle frequency above 2000 m a.s.l. during (a–b) spring season and (c–d) autumn season.
Considering the same weather stations used for the calculation of the temperature trends and employing the approach outlined by Nigrelli and Chiarle (2023), the analysis reveals a decrease of approximately 7.3 freeze-thaw days and about 2.2 icing days per decade (Fig. 13a). From the seasonal analysis, while the overall trend is generally decreasing, above 2000 m, freeze-thaw (FT) cycles show an increase at a rate of 3.3 d/10 years in winter and 2.7 d/10 years in spring (Fig. 13b–c). Furthermore, in winter above 2000 m, a loss of 2.1 ice days per decade is calculated (Fig. 13e).
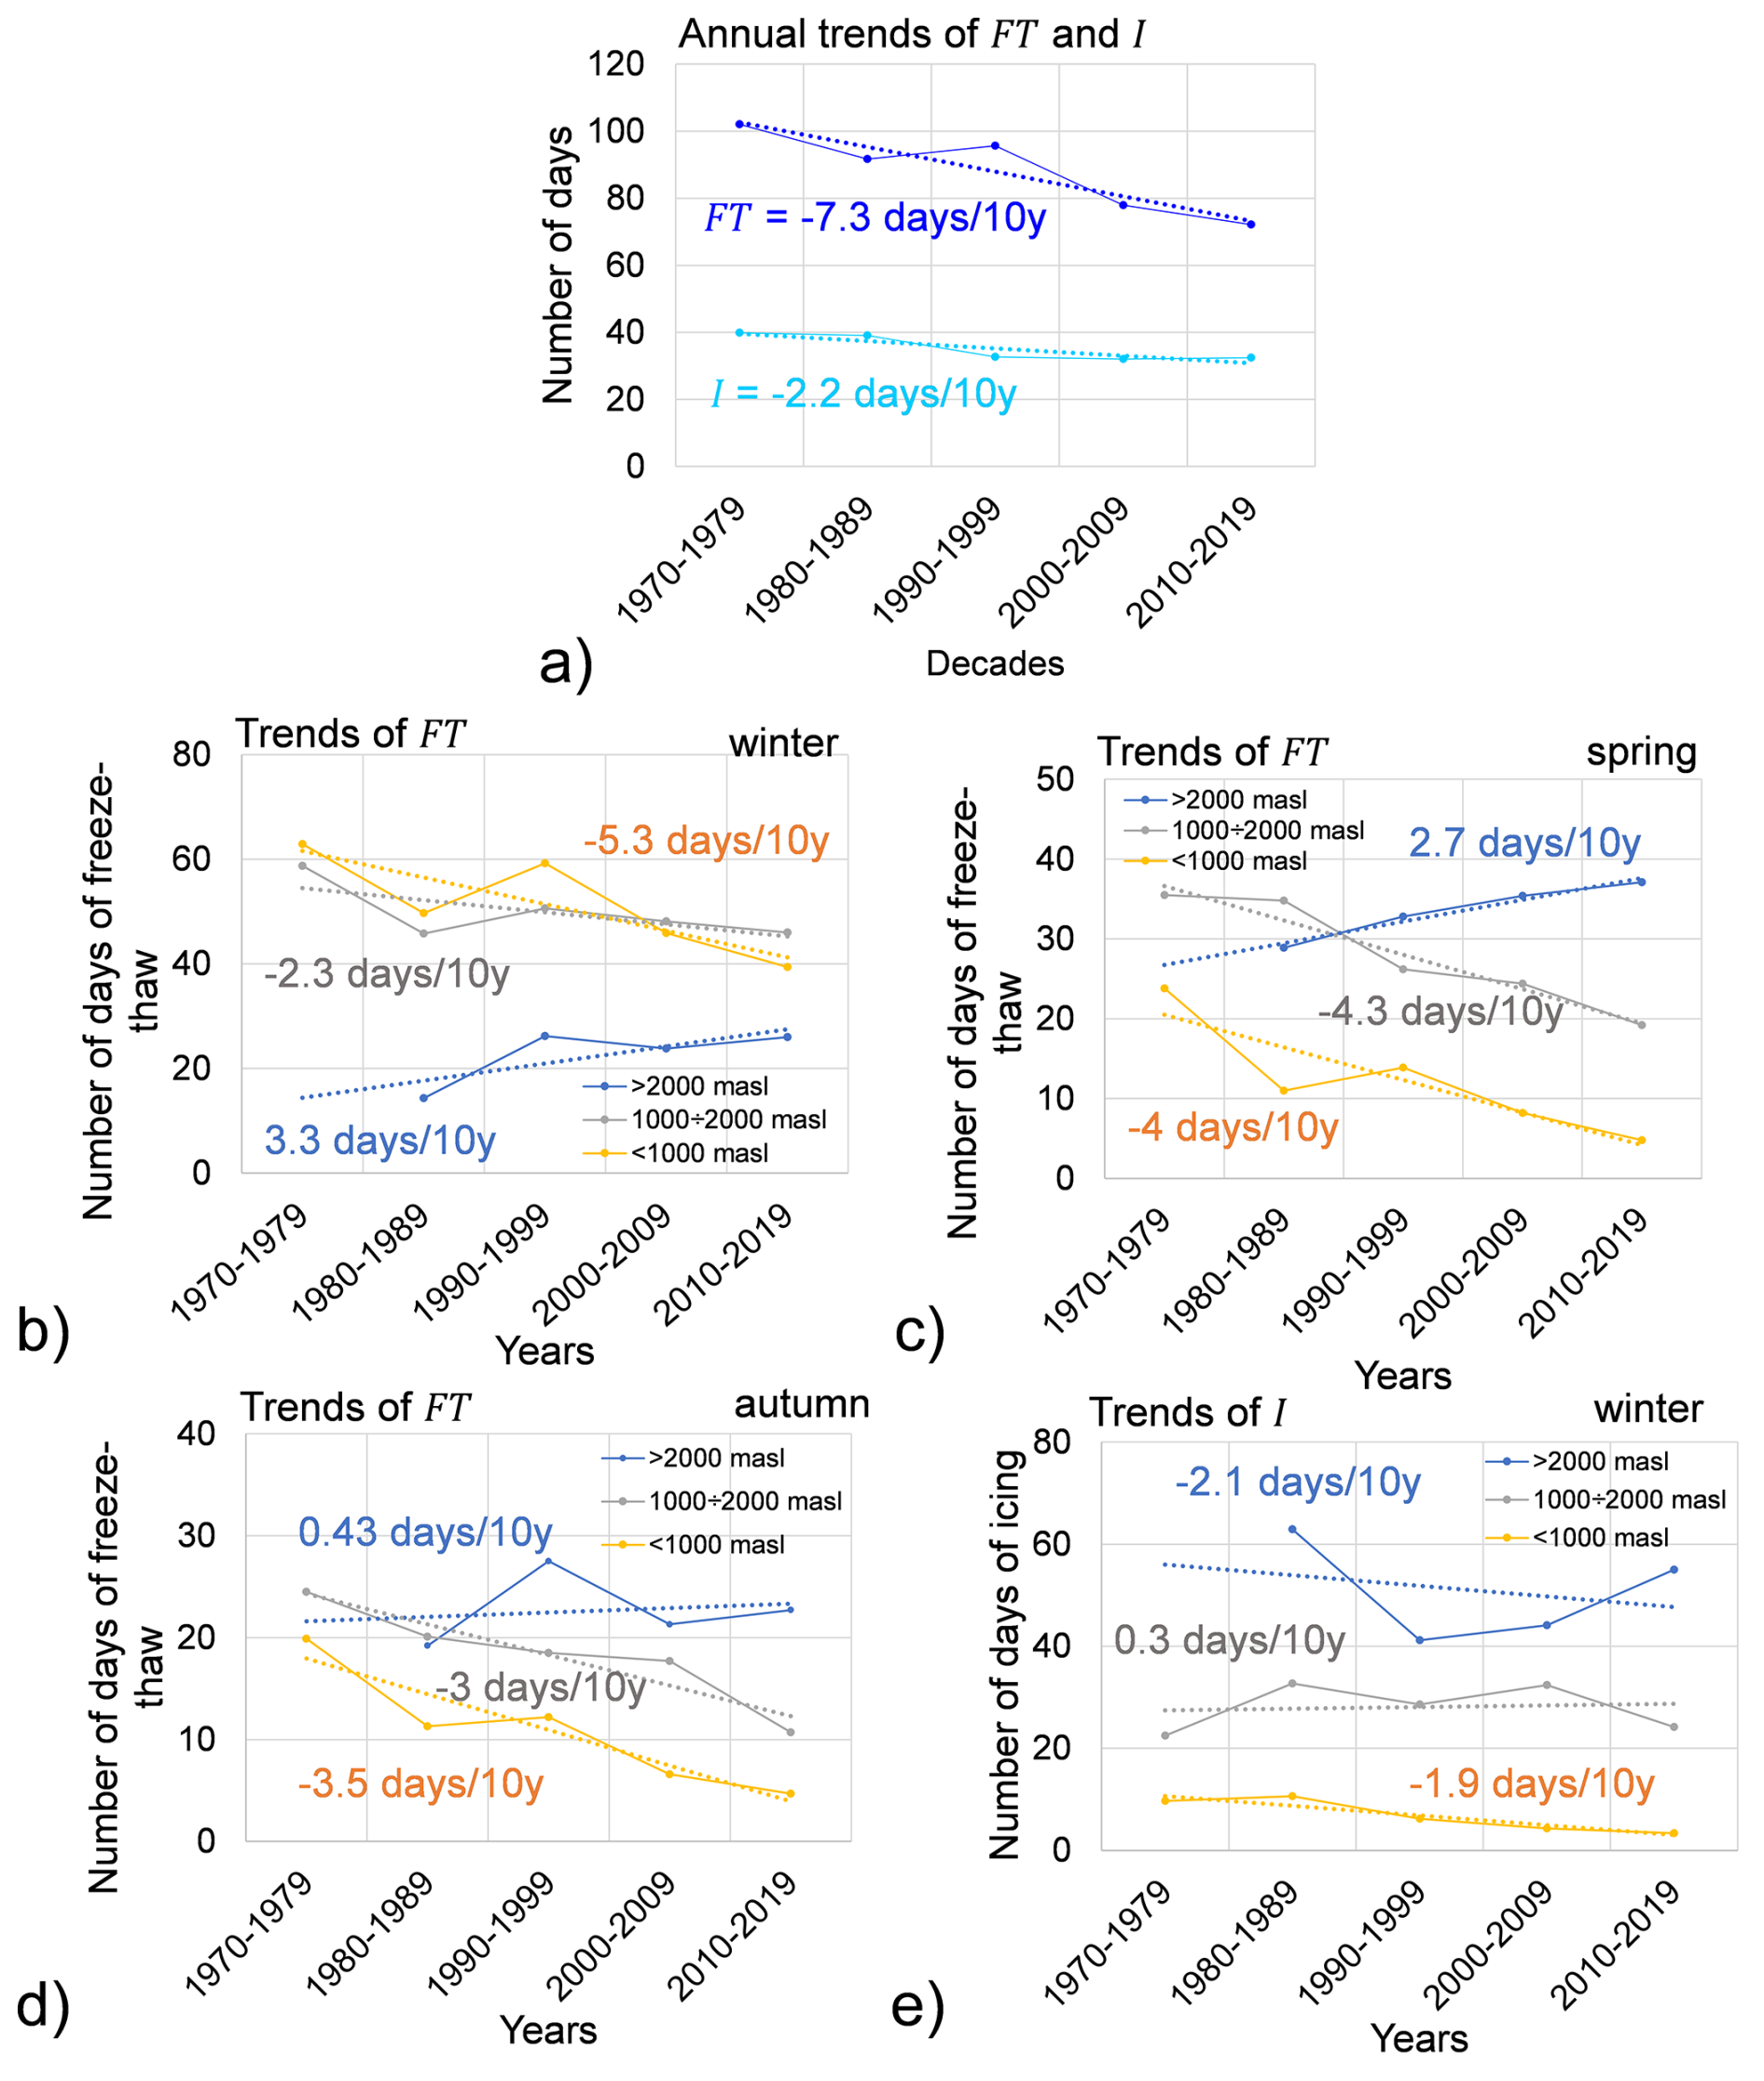
Figure 13Annual and seasonal freeze-thaw (FT) and icing (I) trends relative to altitudes for this case study during 1970 to 2019. (a) considering 12 weather stations; (b) FT trends during winter season; (c) FT trends during spring season; (d) FT trends during autumn season; (e) I trends during winter season.
4.2 Rockfall events distribution
From an initial dataset of 5480 rockfalls that occurred between 1970 and 2019, 2971events were extracted for detailed analysis. Recent rockfalls occurred from 2020 until 2025 were added to them in Fig. 14. The results obtained through the proposed approach are discussed below.
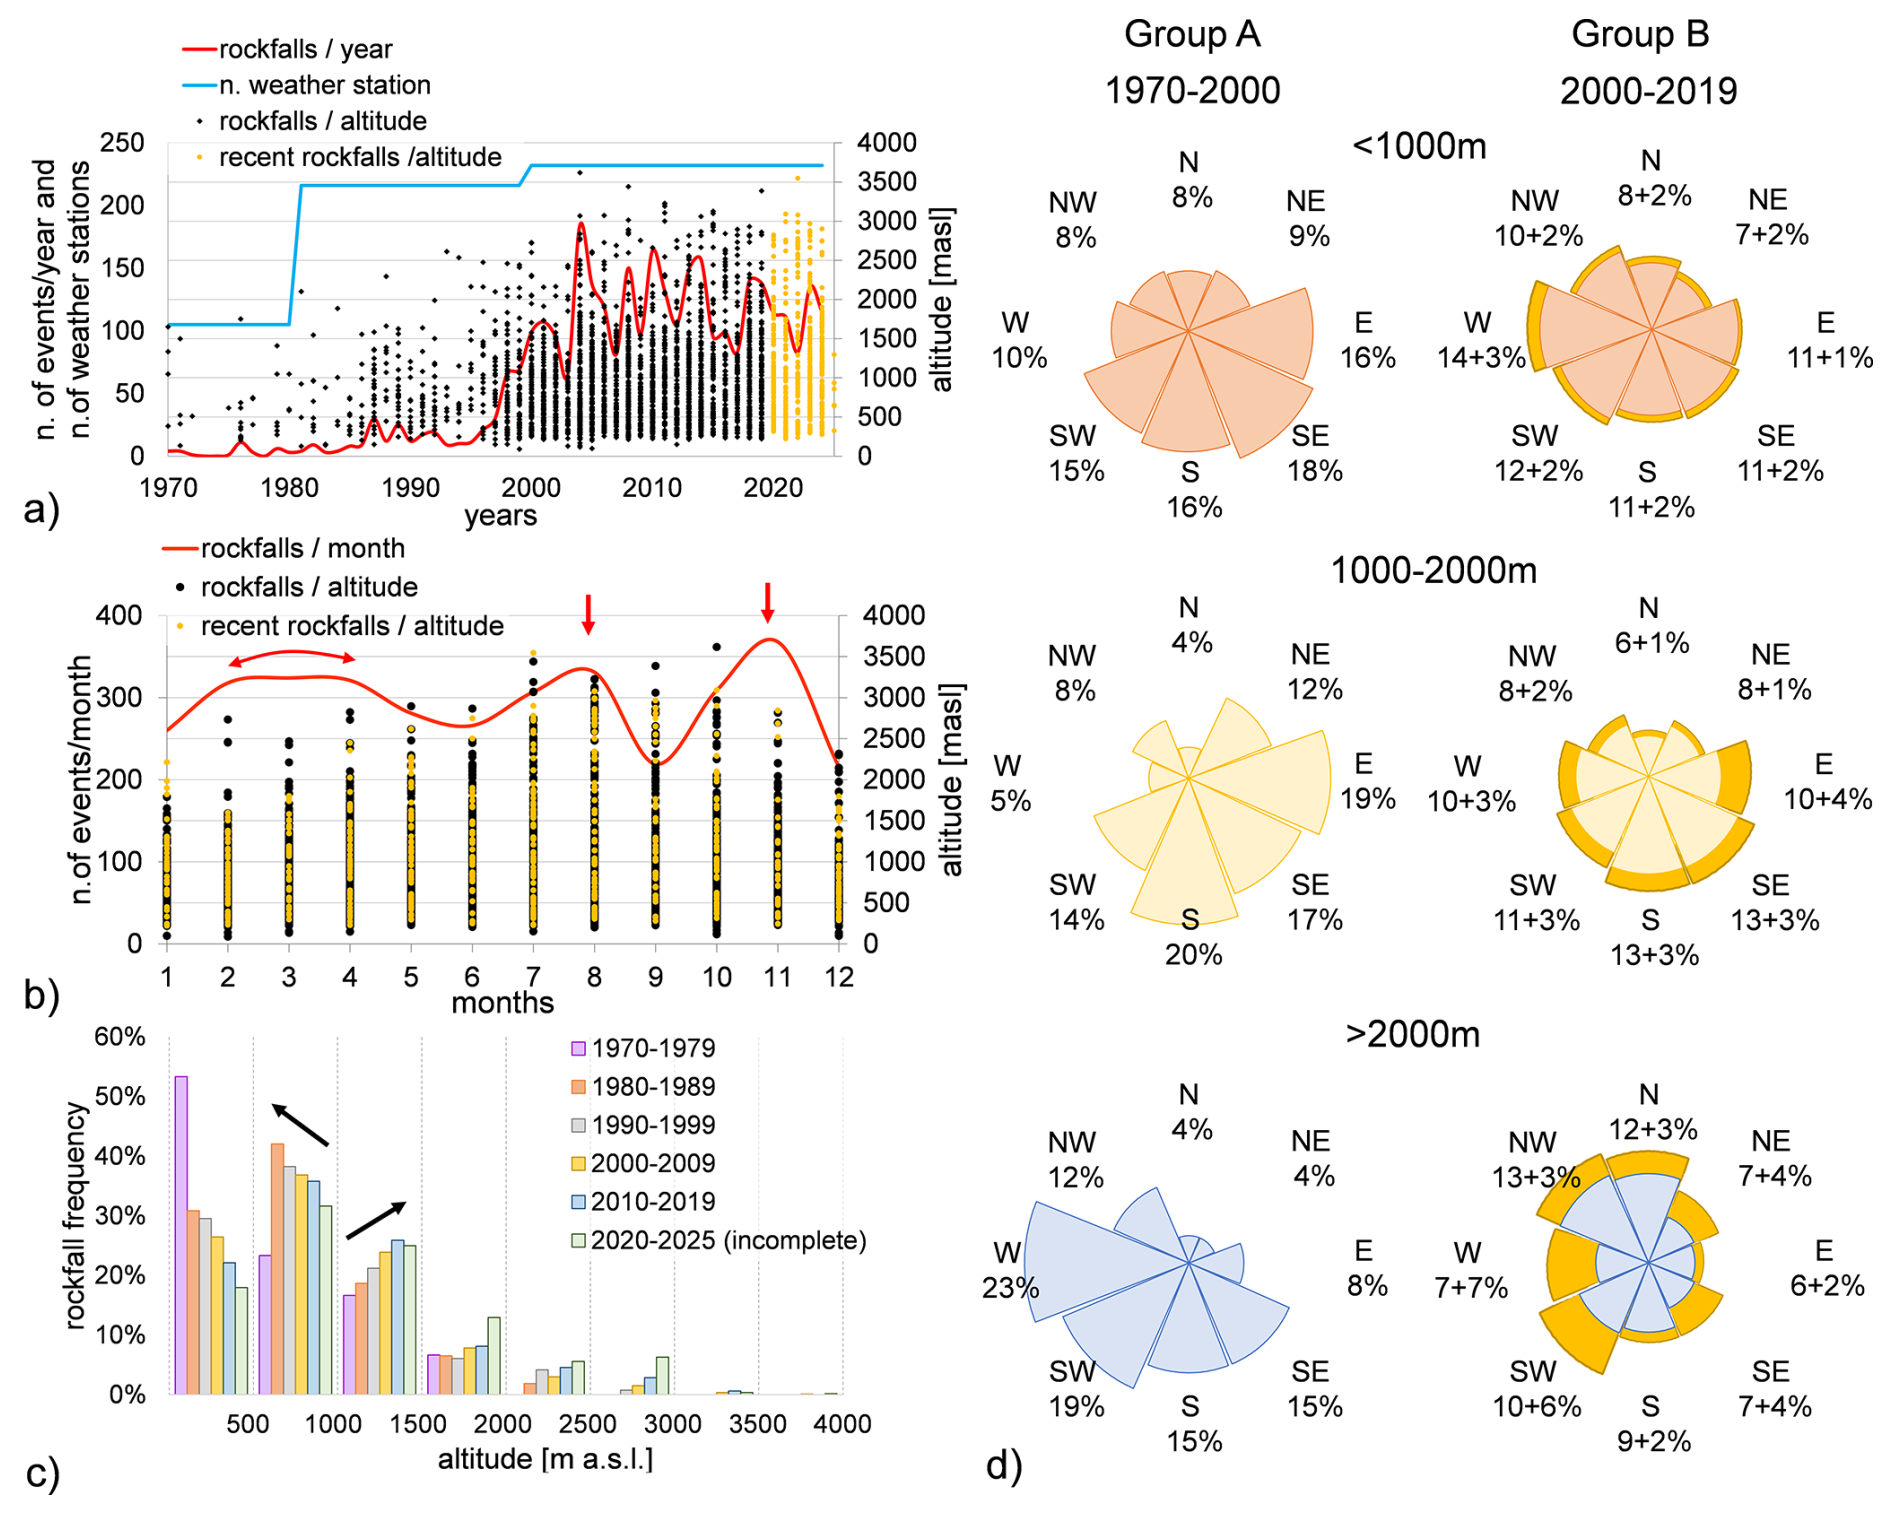
Figure 14Analysis of rockfall events from 1970 to 2025: (a) annual frequency of rockfalls (red line), distribution of rockfall events relative to altitude (black and yellow dots), number of active weather stations (blue line); (b) monthly frequency of rockfall events relative for all years (red line), altitude distribution for all years for the different months (yellow and black dots); (c) rockfall event distribution in terms of altitude and decades; (d) comparison rockfalls frequencies occurrence in terms of aspect classes for different altitudes (0–1000, 1000–2000 m and greater than 2000 m) between 1970–1999 (left side) and 2000–2025 (right side). Rockfalls frequencies from 2020 to 2025 are represented in the yellow areas.
Figure 14a displays the number of recorded rockfall events alongside the number of active weather stations. While the graph suggests an apparent increase in rockfall frequency over the past two decades, it is important to acknowledge that this increase could be partly attributed to improvements in the accuracy, completeness, and documentation of recording method of rockfall events at all elevations in recent years (Huggel et al., 2012; Sass and Oberlechner, 2012; Rupp and Damm, 2020; Bajni et al., 2021).
Figure 14b shows the monthly frequency of rockfalls, revealing three main peaks: in November, during the February-March-April period, and in August. The altitudinal distribution of rockfalls events (Fig. 14c) referred to the number of events recorded in that decade, shows a frequency a reduction of the frequency with increasing the altitude (apart the altitude between 500 and 1000 m). For elevations above 1000 m, an increase in relative frequency (since in every decade the number of events changes) is observed across the decades. However, in recent decades, a relative frequency decrease is noted below 1000 m.
To study the variation of the aspect of rockfall source during the different decades, the rockfall dataset was split up in two sub-datasets: one grouping the events from 1970 to 1999 (group A) and the second one collecting the events from 2000 to 2025 (group B). This subdivision was carried out in this way and not for decades because the number of rockfall events in the first two decades was too small. In this way they were aggregate to obtain a significant statistical number of events for the two groups. The obtained results are reported in the Fig. 14d where the percentage of rockfall event for different aspect classes (8 sectors) are reported for different elevation and for two groups. The percentage changes for the different elevation and for the two considered groups. For elevation below 1000 m, the predominant percentage is SE in the first group while in the second one is the W. For altitude between 1000 and 2000 m, in the first group the S and E orientations are more frequent in the group A while in the group B the difference between the aspect classes reduces and S and SE remains still the more important.
Finally, for altitude greater than 2000 m, for group A the predominant component is W while for the group B the W component reduces significantly, the S, SW and SE reduces slightly while the N component has significant increment. This pattern, especially on north-facing cliffs, could be attributed to permafrost thawing, which predominantly is present at elevations higher than 2500 m (Noetzli et al., 2003, Noetzli and Gruber, 2009).
4.3 Rockfalls and climate variables
This sub-section establishes the specific relationship between rockfall events and various meteorological variables. Given the inherent spatio-temporal variability of weather parameters, the analysis is structured according to elevation range, season, and aggregation scale.
The study utilizes the same climate variables and defined ranges as those employed in the initial climate analysis.
The relationships between rockfall events and meteorological variables were calculated using two distinct approaches:
-
Nearby Weather Stations: (presented in the main text).
-
Triangulation Method: (reported in the Sect. S3).
For brevity and focus, only the most significant results are presented in the main body of this paper. Comprehensive tables containing all calculated conditional probabilities are provided in the Sect. S2.
4.3.1 Rainfall
Figure 15 presents the conditional probabilities of rockfall events under the condition that rainfall is within a given range. Specifically, Fig. 15a illustrates these probabilities for the autumn season at elevations below 1000 m a.s.l. with Sa = 90 d, while Fig. 15b shows the probabilities for autumn season at elevations between 1000–2000 m a.s.l. with Sa = 30 d.
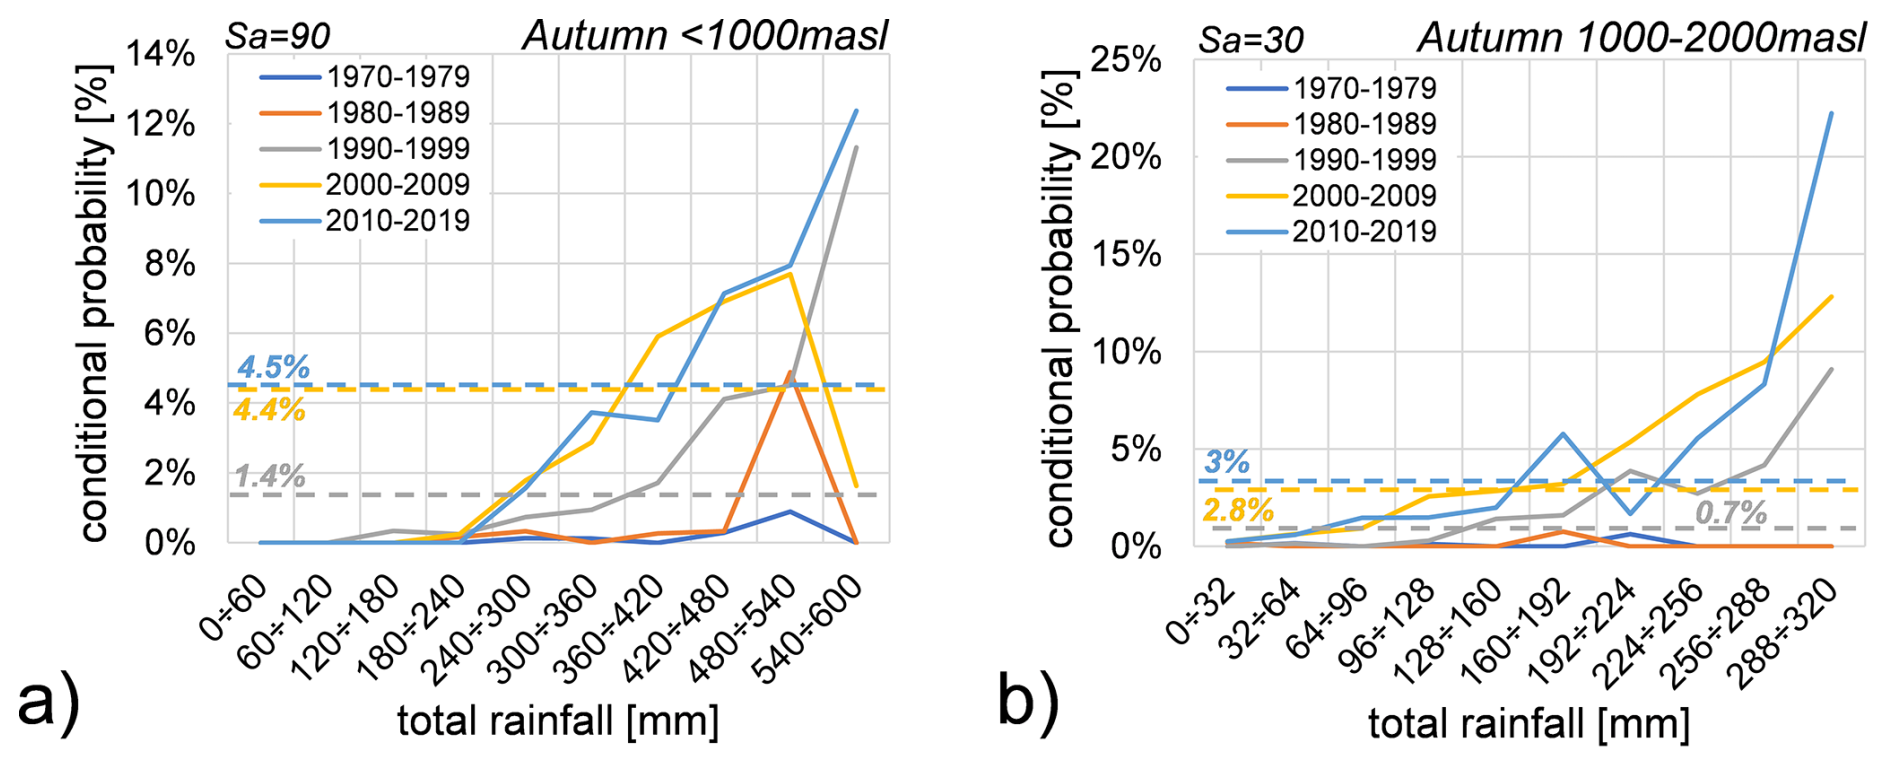
Figure 15Conditional probabilities of rockfalls triggered by rainfall from 1970 to 2019 during autumn season: (a) below 1000 m a.s.l. considering an aggregation scale Sa=90 d; (b) between 1000–2000 m a.s.l. with an aggregation scale Sa=30 d. Rockfall probabilities are represented by the coloured dotted lines according to the decade as shown in the legend.
In both cases, an increment in conditional probability is observed for the highest values of total rainfall in the last decade, reaching 12.4 % below 1000 m and 22.2 % between 1000–2000 m. When considering other aggregation scales and altitudes (detailed in Sect. S2.1), the highest probabilities associated with rainfall continue to occur during autumn season, specifically with a 7 d aggregation scale below 2000 m and a daily aggregation scale below 1000 m. These findings suggest a potential correlation between rockfall events and high total rainfall values during the autumn season. Furthermore, it is notable that in earlier periods, rockfalls showed a higher probability of occurrence with daily and weekly aggregation scales, whereas in the last decade, probabilities are higher with monthly and quarterly aggregation scales.
4.3.2 Mean air temperature
Figure 16a shows a conditional probability of 12.7 % for rockfall events triggered by mean weekly air temperatures at elevations between 1000–2000 m a.s.l. during the summer season. Figure 16b illustrates a probability of 2.2 % for rockfall events triggered by monthly temperature at elevations above 2000 m a.s.l. during the autumn season. A comprehensive analysis of all the results in Sect. S2.2, rockfall probability increased during decades particularly in the last two decades with higher probabilities in winter and spring below 1000 m, in summer between 1000 and 2000 m and in autumn above 2000 m. These results imply a possible correlation between rockfall events and increasing temperatures in accordance to climate analysis.
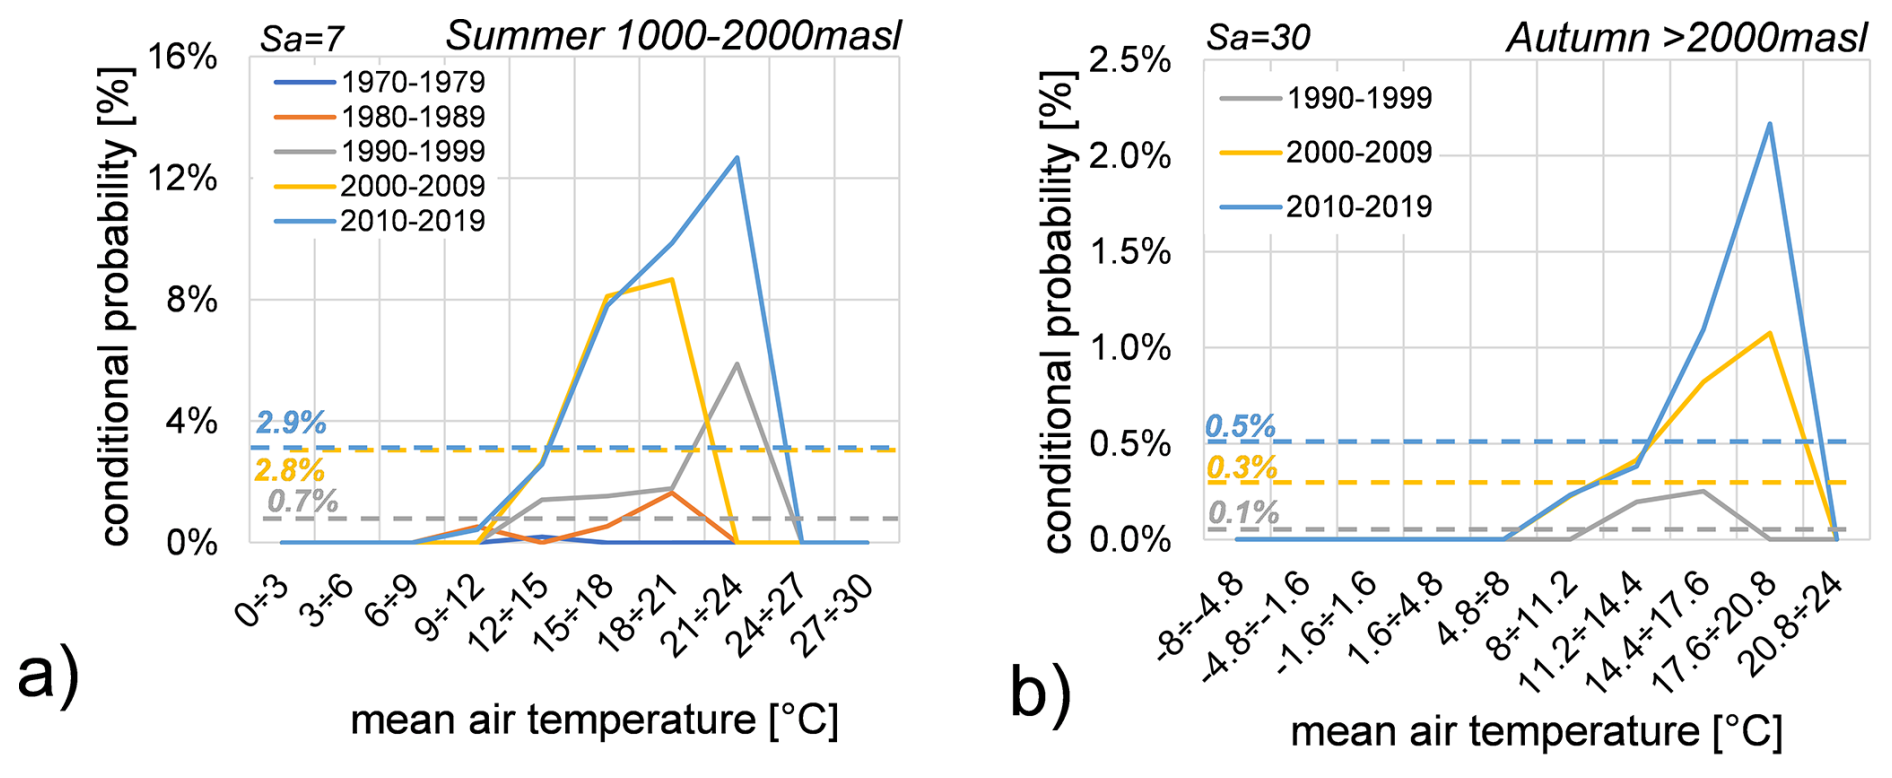
Figure 16Conditional probabilities of rockfalls triggered by mean temperature values from 1970 to 2019: (a) during summer season between 1000–2000 m a.s.l. with an aggregation scale Sa=7 d. (b) during autumn season above 2000 m a.s.l. with an aggregation scale Sa=30 d. Rockfall probabilities are represented by the coloured dotted lines according to the decade as shown in the legend.
4.3.3 Temperature amplitude
In Fig. 17 the conditional probabilities of rockfall events conditioned by monthly air temperature amplitude (Tmax−Tmin) are presented. Specifically, Fig. 17a shows these probabilities during the spring season below 1000 m a.s.l., and Fig. 17b shows them during the winter season between 1000–2000 m a.s.l. Observing Fig. 17a, a probability of 28.6 % corresponds to a temperature amplitude range of 8.8 to 9.9 °C. Figure 17b indicates a 5.8 % probability that rockfall are conditioned by temperature amplitude range of 9 to 10 °C. All results consistently show higher probability values in the last two decades, especially for temperature amplitude ranges greater than 6.6 °C during spring and ranges from 9 to 10 °C in winter, with the exception of cases where Sa=0. This suggests that higher probabilities of rockfall events are generally associated with largest ranges of temperature amplitude.
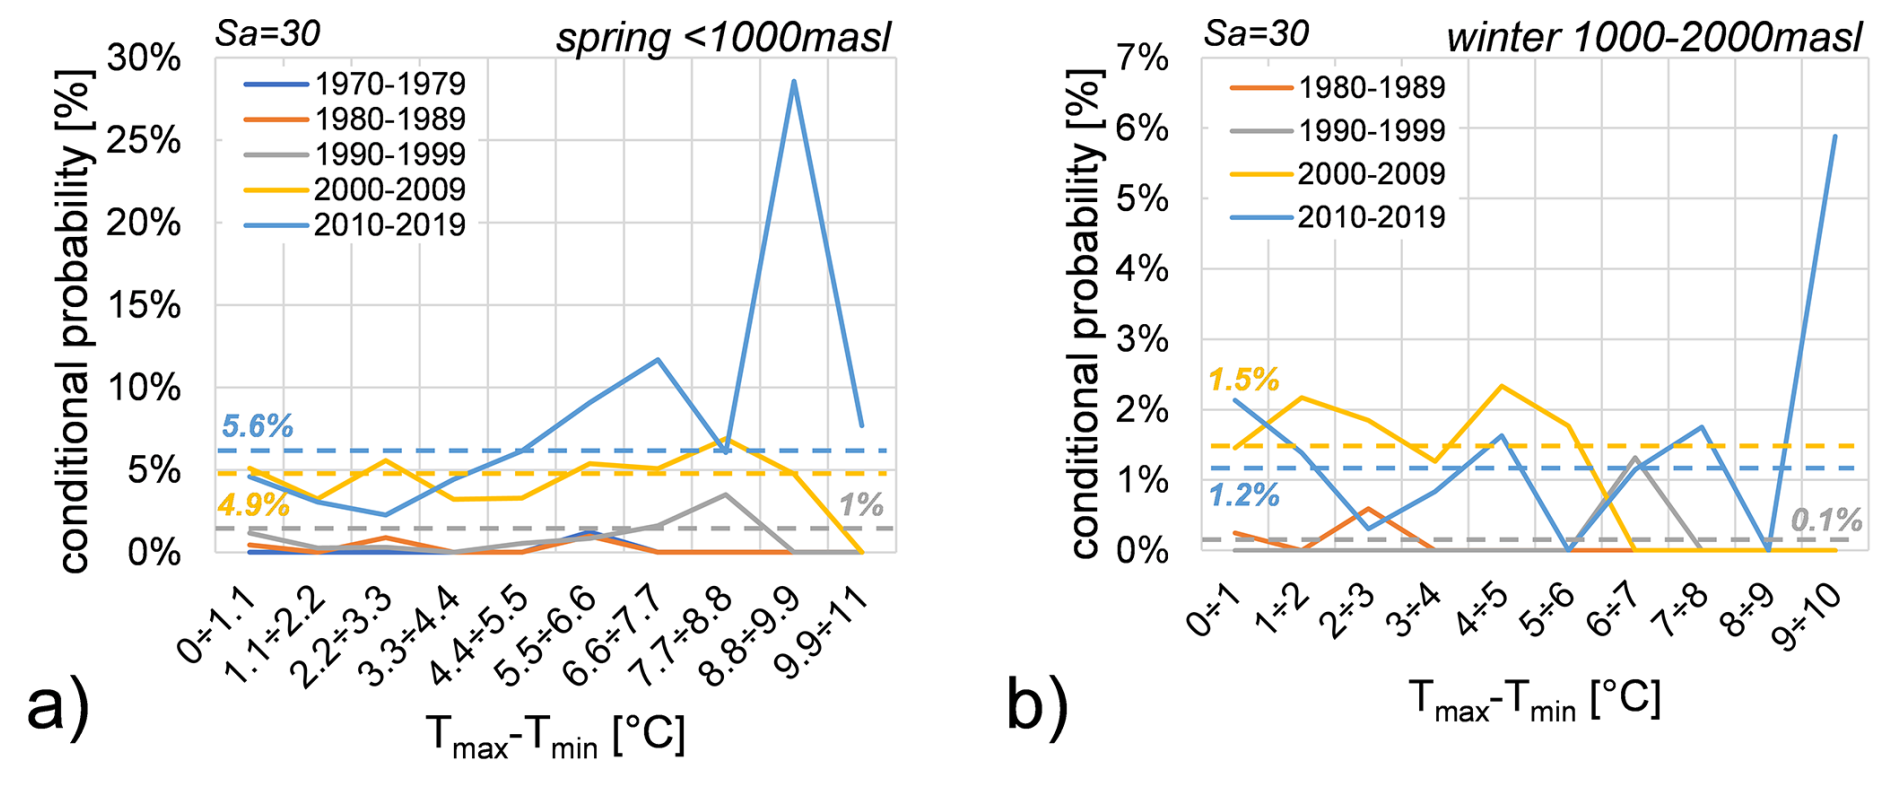
Figure 17Conditional probabilities of rockfalls conditioned by ranges of temperature amplitude from 1970 to 2019: (a) during spring season below 1000 m a.s.l.; (b) during winter season between 1000–2000 m a.s.l. Rockfall probabilities are represented by the coloured dotted lines according to the decade as shown in the legend.
4.3.4 Air mean Temperature variation
Figure 18 illustrates the conditional probabilities of rockfalls caused by temperature variation. Figure 18a shows results with a 1 d aggregation scale during summer between 1000–2000 m a.s.l., while Fig. 18b shows results with a 6 d aggregation scale during spring season below 1000 m a.s.l. At altitudes between 1000 to 2000 m, a probability of 14.3 % for rockfalls is observed with temperature variations ranging from −9 to −6 °C. Below 1000 m, rockfalls are more probable (20 %) for temperature variations ranging between 8.8 to 11 °C. Notably, temperature variation frequencies do not change significantly over the decades, implying that temperature variation can be considered stable from a climate perspective.
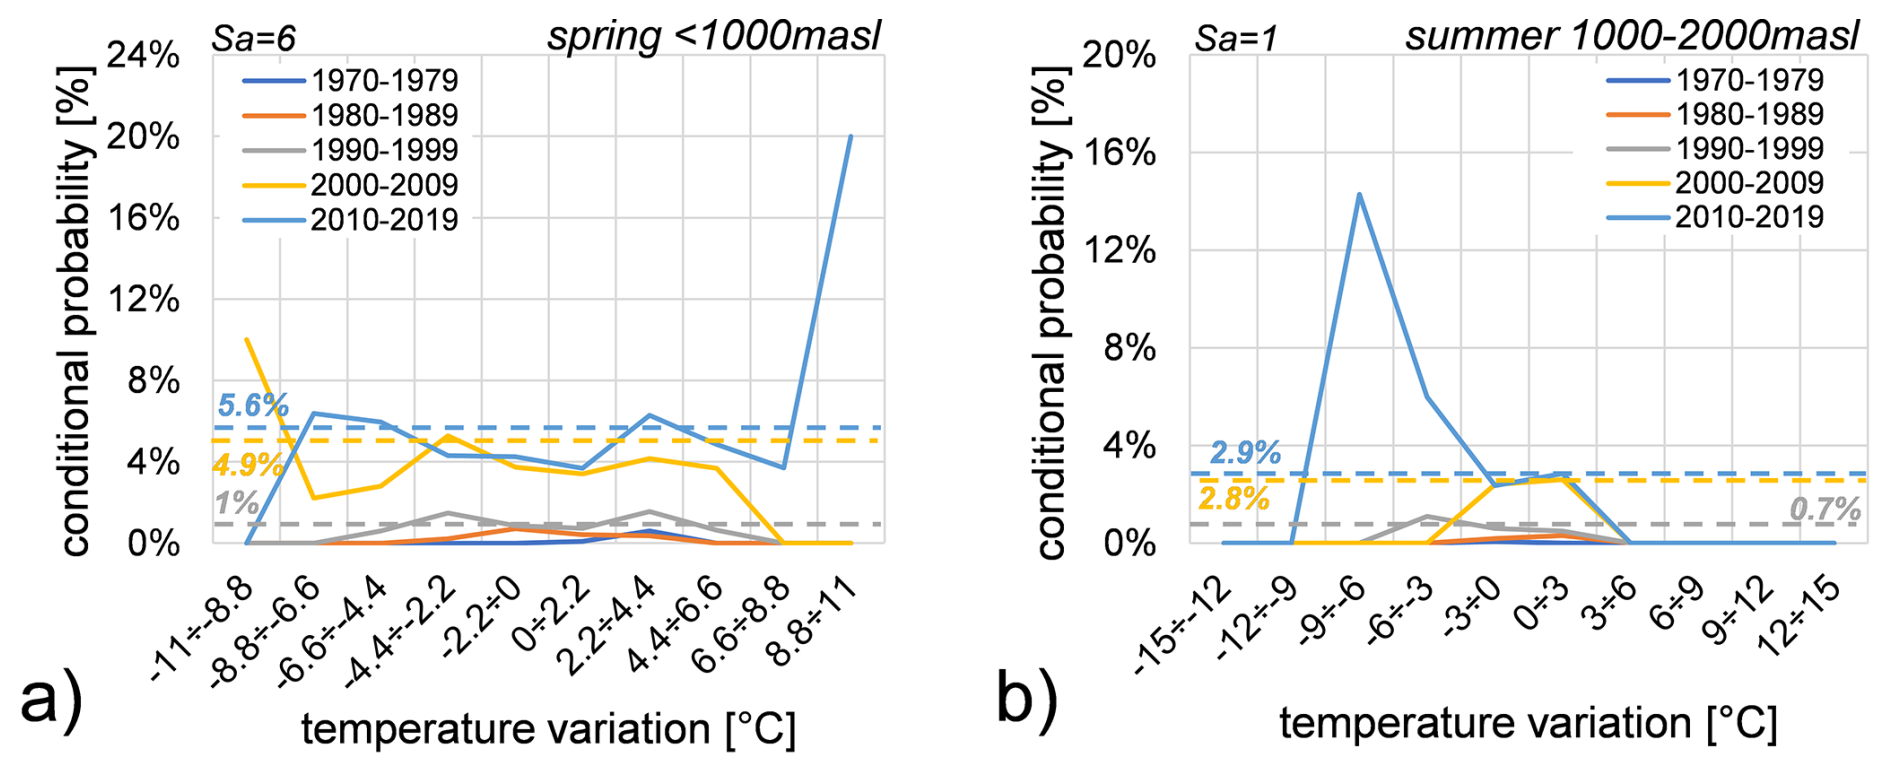
Figure 18Conditional probabilities of rockfalls from 1970 to 2019 during: (a) spring season below 1000 m a.s.l. and (b) during summer season between 1000–2000 m a.s.l. Rockfall probabilities are represented by the coloured dotted lines according to the decade as shown in the legend.
4.3.5 Freeze-Thaw cycle and icing
The Bayesian analysis for freeze-thaw cycles and icing relies on three temperature time-series (maximum, mean, and minimum) obtained through regionalization, thus significantly influencing the results. To demonstrate this, we compare the results for minimum and mean temperature time-series with a 7 d aggregation scale, focusing on two specific cases: (i) winter at altitudes below 1000 m a.s.l. (Fig. 19) and (ii) spring between 1000 and 2000 m a.s.l. (Fig. 20).
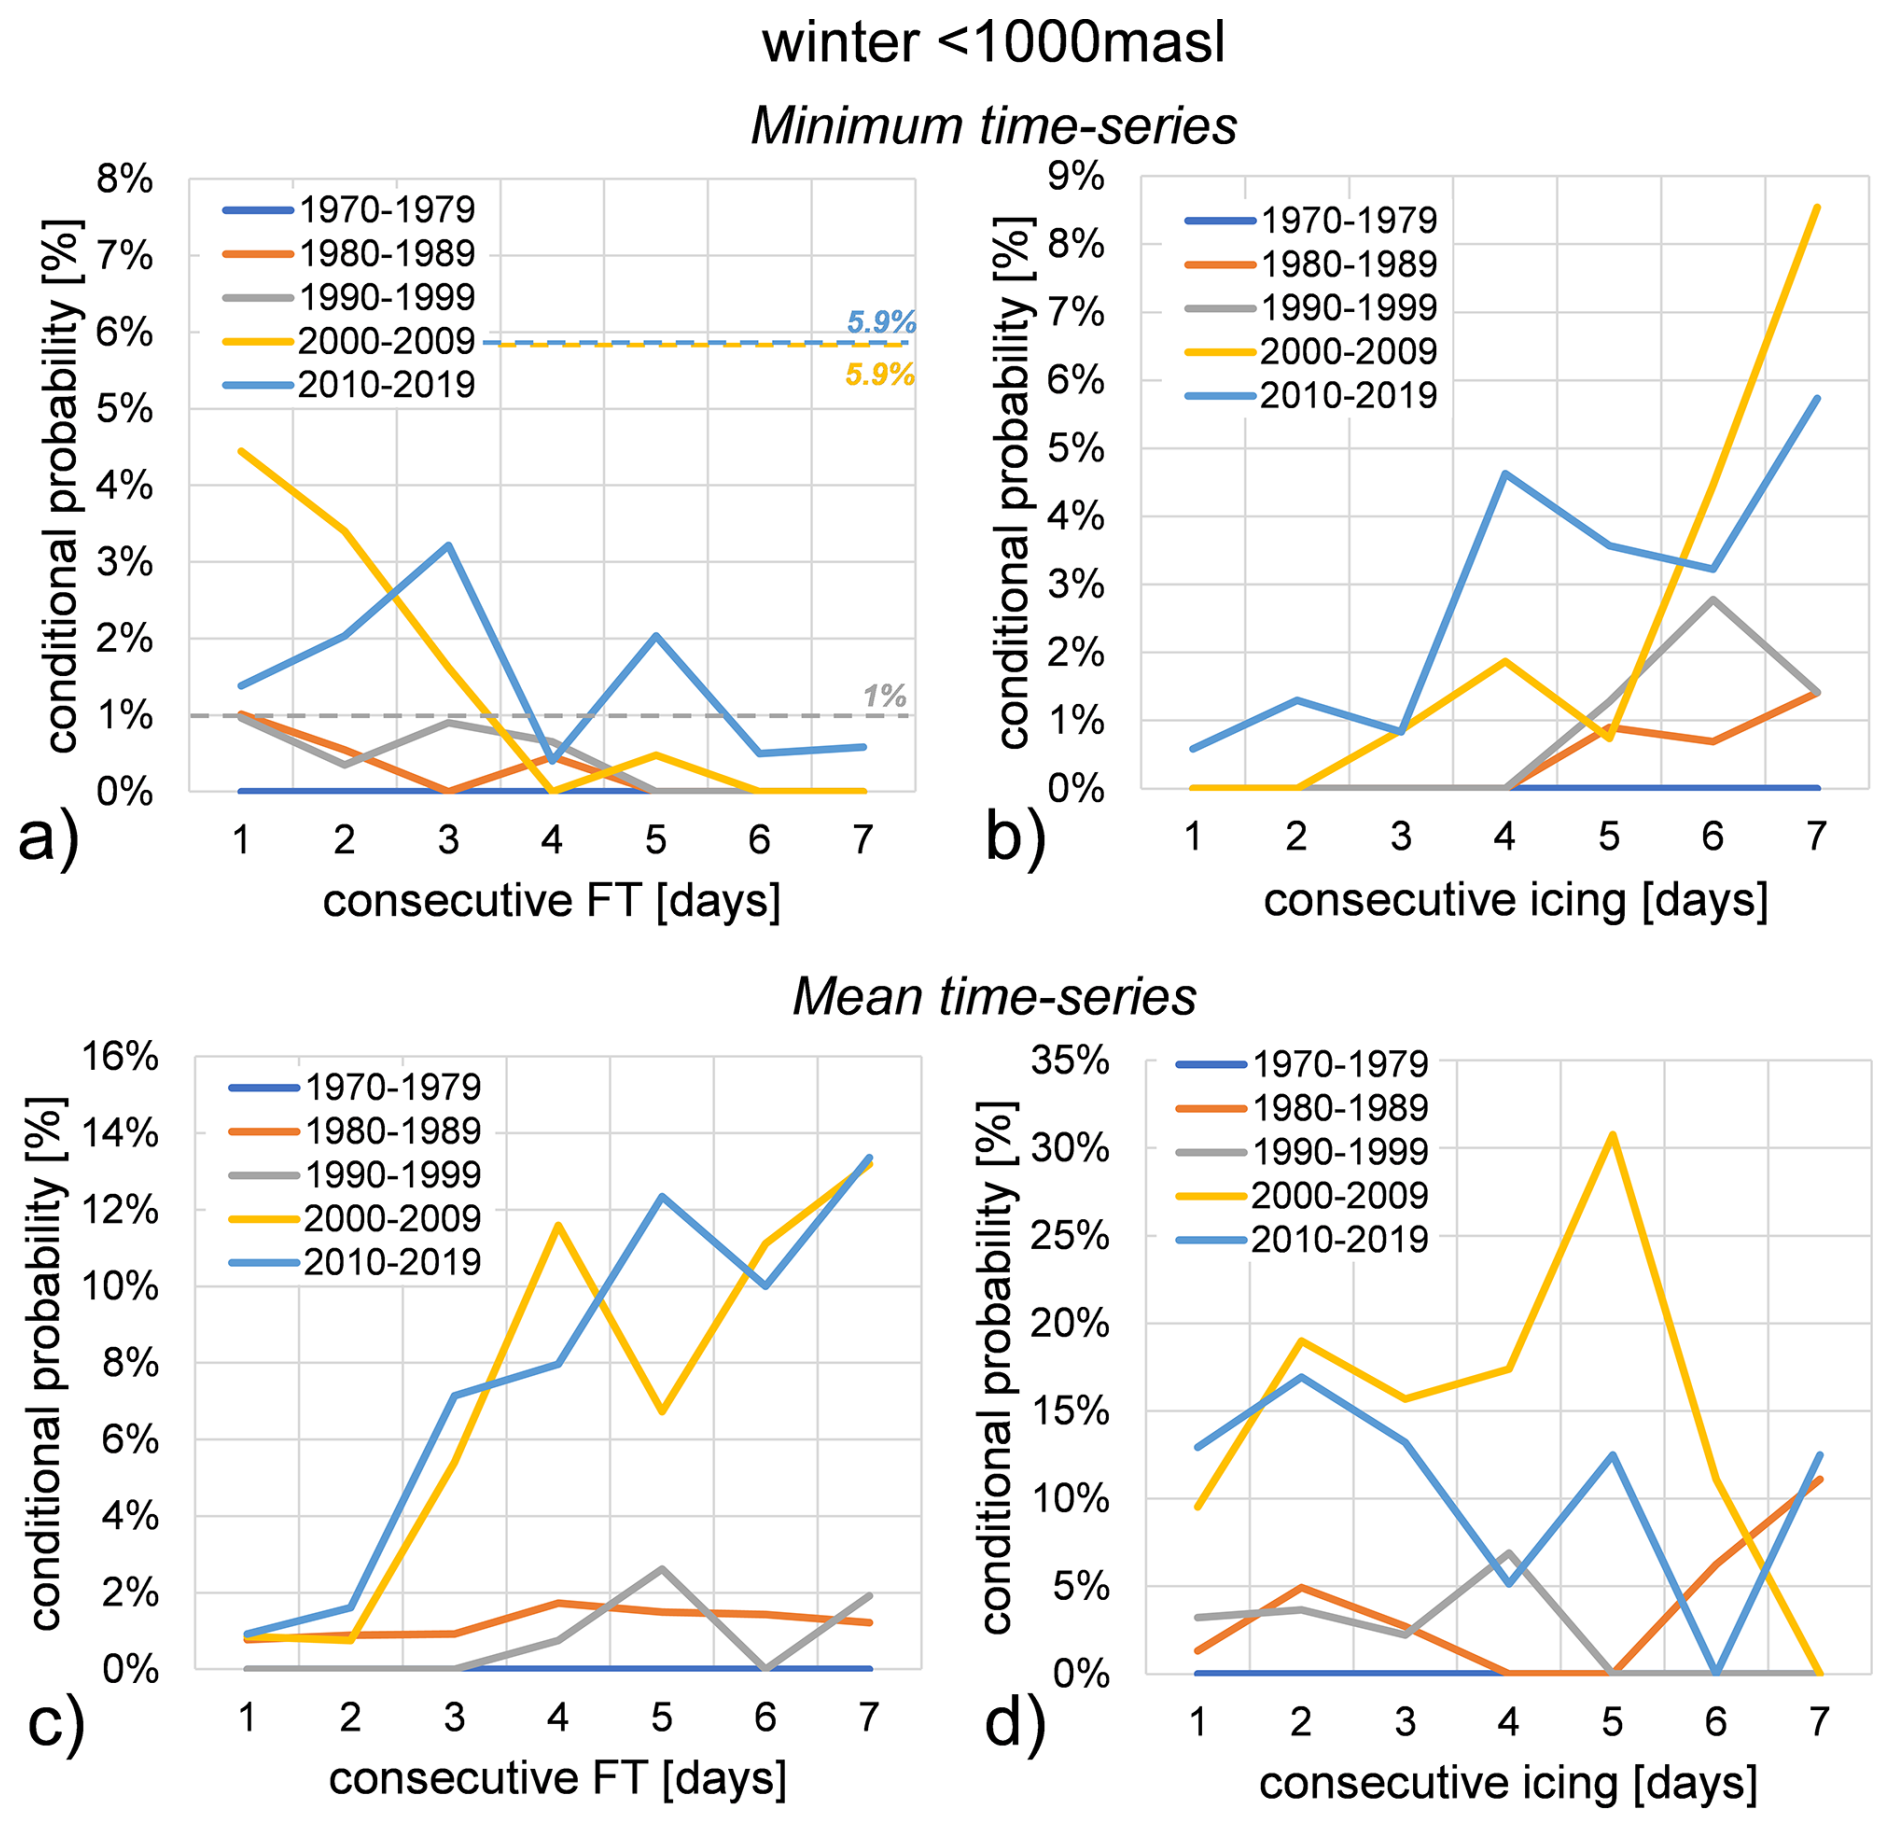
Figure 19Conditional probabilities of rockfalls during winter below 1000 m a.s.l. from 1970 to 2019 with a 7 d aggregation scale: (a, c) triggered by freeze-thaw cycles with minimum and mean times-series; (b, d) triggered by icing with minimum and maximum time-series. Rockfall probabilities are represented by the coloured dotted lines according to the decade as shown in the legend.
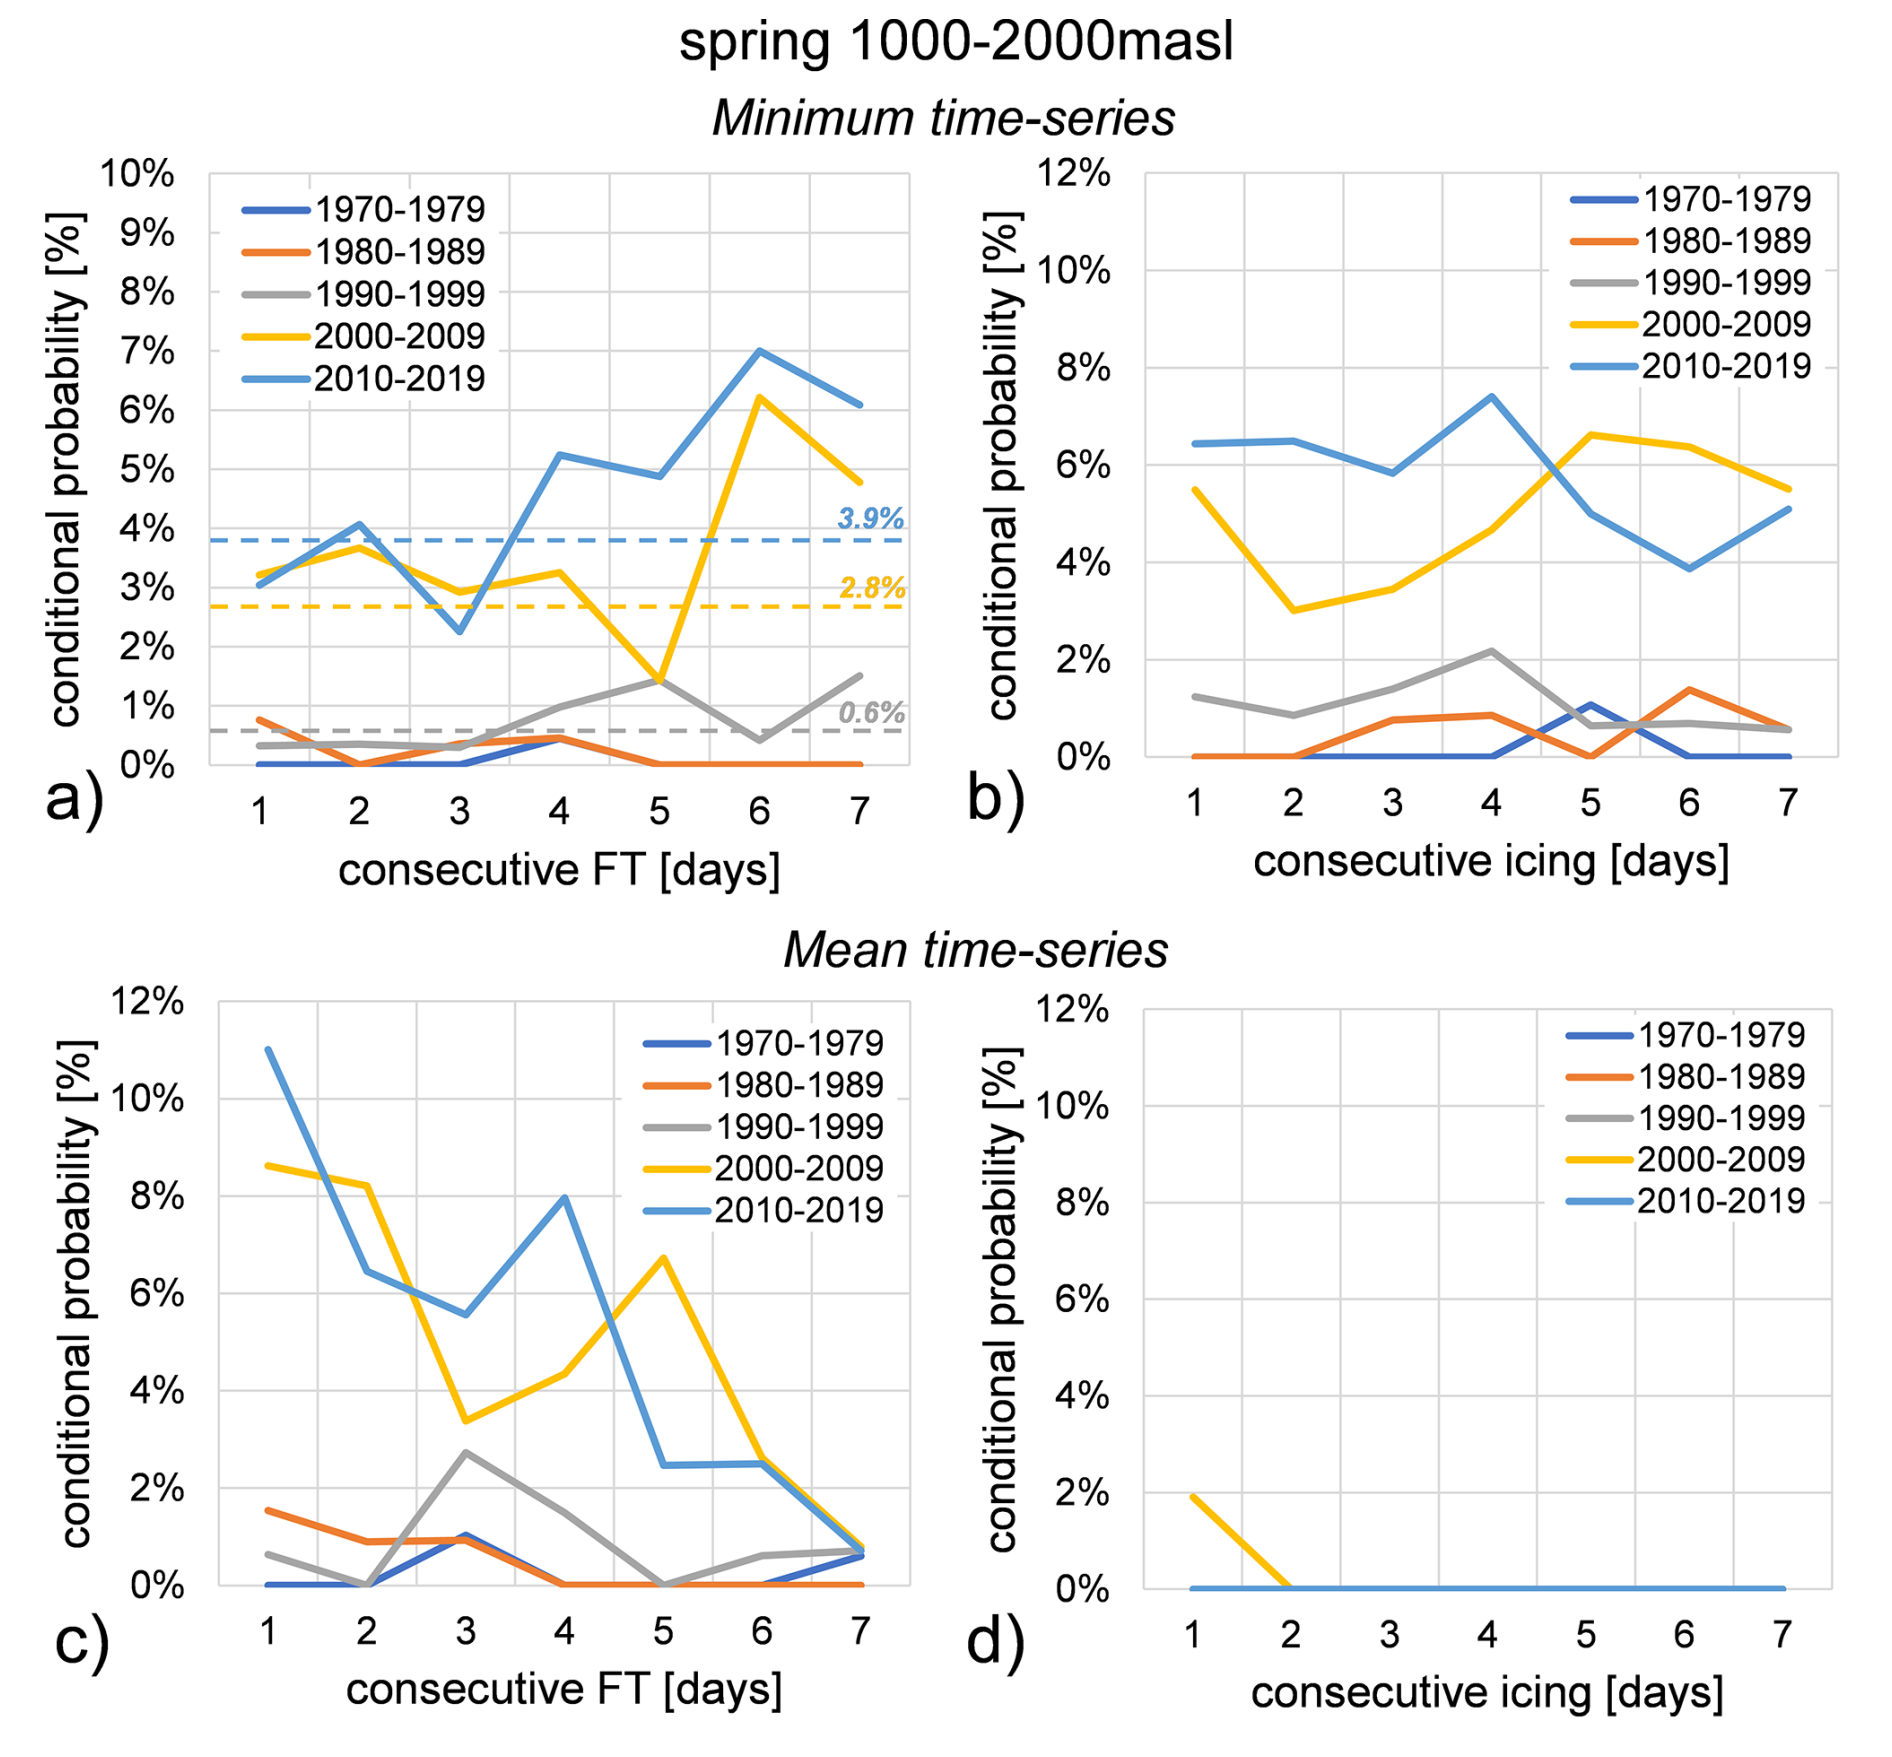
Figure 20Conditional probabilities of rockfalls during spring between 1000 and 2000 m a.s.l. from 1970 to 2019 with a 7 d aggregation scale. (a, c) triggered by freeze-thaw cycles with minimum and mean times-series. (b, d) triggered by icing with minimum and mean time-series. Rockfall probabilities are represented by the coloured dotted lines according to the decade as shown in the legend.
Equation (10) indicates that the conditional probability of a rockfall event (P(Rf|M)) is dependent on the frequency of freeze-thaw cycles (FT) and icing events. As the conditional probability ranges from 0 to 1, variations in the numerator (i.e., the frequency of FT and icing events) have a more significant impact on the overall trend of P(M|Rf) than variations in the denominator, especially when FT and icing events exhibit similar trends over consecutive days.
In Fig. 19a–b, where icing events are more prevalent than FT cycles, P(Rf|M) increases with increasing icing events and decreases with increasing FT cycles. Conversely, in Fig. 19c–d where FT cycles are more frequent, the opposite trend is observed.
Similar trends are noted in Fig. 20, with the specific behaviour depending on the relative frequency of FT and icing events. For instance, in Fig. 20a–b, P(Rf|M) increases with increasing FT events and decreases with increasing icing events.
The contrasting trends observed in the two examples can be attributed to the varying influence of overall rockfall probability. Below 1000 m a.s.l., the rockfall probability remains relatively stable, whereas between 1000 and 2000 m a.s.l., it tends to increase over time.
5.1 Climate
Global and regional climate variations, particularly concerning temperature trends, have been extensively monitored and reported. For instance, Gobiet et al. (2014) documented increasing temperature in the alpine region from 1980 onwards, with annual mean warming rates of 0.5 °C per decade. Their projections also suggest that the 21st-century temperature changes will impact not only rising values but also seasonal cycles. Similarly, in the Swiss Alps, Allen and Huggel (2013) observed an increase in both the values and frequencies of maximum temperature, Tmax, with a rate of 0.49 °C per decade during summer season. Ceppi et al. (2012) reported a comparable rate of 0.46 °C/decade, while Beniston (2006) found that winter minimum temperatures, Tmin below 1000 m elevation increased by approximately 4 °C for the period 1961–1990, with summer temperatures projected to exceed current values by 5.5–6 °C. It is noteworthy that during the Early Twentieth Century Warming (Early Twentieth Century Warming, ETCW, 1916–1945) a maximal global warming trend of 0.47 °C/30 years was observed (Bengtsson et al., 2004). The climate reports for the current study area consistently align with these broader findings. The climate report for a subregion of Alpine arc (Tyrol, South Tyrol and Belluno) indicates typical climate fluctuations until 1980, followed by a distinct warming trend from 1980 to 2010 (Adler et al., 2015). Seasonally, this report noted: (i) minimal warming in spring and summer; (ii) less variation in autumn temperatures, and (iii) milder winters. Consequently, the number of warm days in summer has increased, while icing or frost days have decreased. Nigrelli and Chiarle (2023) further stated that during the most recent climatological normal period (1991–2020), the annual average minimum temperature was −2.4 °C, with a warming rate of 0.4 °C per decade, and the annual average maximum temperature was 4.4 °C with a warming rate of 0.5 °C per decade. Summer and autumn temperatures exhibited the highest warming rates, approximately 0.6 °C per decade.
In this work, by analysing stations characterized by altitudes, an annual warming rate of 0.51 °C per decade was found above 2000 m (Fig. 6). However, for this specific rate, it is crucial to consider the shorter time period used for analysis at these higher altitudes. When analysing stations by seasons, the maximum temperature warming rate, in this case, also occurred during spring season, consistent with some regional observations.
Regarding water availability, several studies suggest a potential decline in some regions due to reduced precipitation and a decrease in snowpack and snow season duration in many mountain areas (Beniston, 2003). In the Swiss Alps, for instance, elevations below 1200 m have experienced a reduction in total snow amount and snow season by approximately 100 d since the mid-1980s. Beniston (2006) additionally noted that for every 1 °C increase in temperature, the snowline rises by about 150 m. Nigrelli and Chiarle (2023) observed a decrease in the Alps in the number of icing days (days when the maximum temperature is below 0 °C) by 6 d per decade, and the number of freeze-thaw cycle days (days when the minimum temperature is below 0 °C) by 9 d per decade. As observed in the Fig. 13 similar results were concluded in this work in which a local region was considered.
Wang et al. (2021) achieved similar results on a global scale, observing significant changes in the length of the four seasons between 1952 and 2011: spring and summer started earlier by 1.6 d/10 years and 2.5 d/10 years, respectively, while the onset of autumn and winter was delayed by 1.7 d/10 years and 0.5 d/10 years, respectively. This conclusion was also observed in our work, as shown in Fig. 7, even though our analysis focused on a local scale and a 50-year time range.
Concerning rainfall, our results indicate that high-intensity rainfall events are becoming more frequent. This finding is consistent with Schmidli and Frei (2005) and Widmann and Schär (1997), who reported an increase in mean precipitation during the 20th century during, particularly in fall and winter. Beniston (2006) noted that precipitation patterns in the Swiss Alps have changed, with winter precipitation decreasing marginally (2 %–3 %) while summer precipitation is projected to decrease by 15 %–20 % in most parts of the Alpine chain. According to Christensen and Christensen (2003), reductions in average summer precipitation may be accompanied by a sharp increase in short but heavy precipitation events. Gobiet et al. (2014) also stated that precipitation generally decreases in summer and increases in winter. The RAPS method, applied in our study (Fig. 4), further confirmed these results by showing long-term trends similar to those identified by Garbrecht and Fernandez (1994), who studied 90-year annual rainfall (1902–1991) in Bryan County, Oklahoma, and identified distinct periods of decrease (1902–1966) followed by increase (1967–1991), which corresponded to occurrences of floods and droughts.
5.2 Rockfall
The proposed approach investigated the effect of meteorological variables on rockfall onset using a Bayesian methodology. This method classified different weather variables into ranges specified according to both altitude and season.
As established in statistical literature (e.g., Gelman, 2008; Berti et al., 2012), Bayesian methods primarily formalize evidence suggested by the input data. Specifically, the posterior probability is inherently dependent on the likelihood function, the prior probability, and the marginal likelihood. Application of Bayes' theorem formally demonstrates that this posterior probability represents the conditional probability of a rockfall event occurring given the meteorological variable falls within a specified range i, derived from the observed frequency of rockfalls associated with that range.
Consequently, this type of analysis is limited to assessing the temporal evolution of the onset conditions and cannot be used for predicting future rockfall events based solely on the historical record.
Nonetheless, this methodology constitutes a valuable tool for the objective assessment of climate variation effects on rockfall events, differentiating it from alternative approaches that focus exclusively on extreme meteorological values.
Furthermore, our results findings align with various seasonal patterns reported in previous Alpine research. For instance, Corò et al. (2015) identified in the Alps rockfall frequency peaks in October–November, June–July and March. Bajni et al. (2021) observed primary peaks in spring and minor peaks in January in the Aosta Valley; while Frayssines and Hantz (2006) found a primary peak in winter and a secondary peak in April in the French Alps. Similarly, Perret et al. (2006) highlighted early spring seasonality in the rockfall frequency in the Swiss Alps. Consistent with these observations, our study reveals distinct rockfall peaks in November, February, April, and August (Fig. 14b).
Climate variables significantly influence rockfall occurrence. Our analysis indicates a relationship between winter rockfalls and precipitation, particularly daily rainfall events exceeding 31.5 mm. Summer rockfalls above 2000 m are potentially linked to mean air temperatures exceeding 9 °C, while spring rockfalls between 1000 and 2000 m correlate with mean air temperatures ranging from 5.8 to 15.4 °C. Additionally, rockfalls exhibit a correlation with winter temperature amplitudes between 1 and 7 °C at elevations between 1000 and 2000 m, and summer temperature amplitudes between 10.8 and 12 °C above 2000 m.
Air temperature plays a crucial role in rockfall initiation, particularly during warmer months. Elevated temperatures can accelerate snowmelt, facilitating water infiltration into rockwall discontinuities and thereby triggering rockfalls, especially at the onset of summer and autumn (Allen and Huggel, 2013). Furthermore, air temperature directly influences other critical mechanisms such as icing and freeze-thaw cycles (Noetzli et al., 2003; Salzmann et al., 2007; Courtial-Manent et al., 2024).
The impact of freeze-thaw (FT) cycles on rockfall occurrence has been extensively investigated. Frayssines and Hantz (2006) observed a correlation between rockfalls and frequent temperature fluctuations around the freezing point in early spring and late autumn at elevations between 1000 and 2000 m. D'Amato et al. (2016) reported an increase in rockfall frequency during freeze-thaw episodes, particularly during thawing periods. This study confirms these findings, with an increased rockfall frequency observed in winter below 1000 m during FT cycles lasting 1 to 3 d, and in spring between 1000 and 2000 m. A slight increase in rockfall frequency was also observed during icing periods lasting 1 to 5 d.
The methodology employed in this study for obtaining the sampled time-series was inspired by the work of Paranunzio et al. (2015). Consequently, comparing between our frequency and the anomaly results reported by Paranunzio et al. (2015) is essential. Paranunzio et al. (2015) concluded that four out of five case studies in the Piedmont region could be attributed to meteorological anomalies, such as temperature rise or heavy precipitation. In a subsequent study, Paranunzio et al. (2016) found that in 85 % of cases across the Western and Eastern Alps, at least one climate variable has anomaly values at rockfall occurrence, with most events linked to short-term temperature anomalies. Precipitation was identified as a contributing factor in only 15 % of rockfall events at weekly, monthly, and quarterly aggregation scales.
To further validate our approach, we adapted and tested the method of Paranunzio et al. (2016) in this study, comparing the results obtained with its method to those obtained using our proposed method starting in both cases from the dataset reported in this work. We analysed the same climate variables (precipitation and mean air temperature) at identical aggregation scales (daily, weekly, monthly, and quarterly). Additionally, we investigated temperature variations (ΔT) over 1, 3, and 6 d prior to the event. The non-exceedance probability P(V) was calculated and an event is considered anomalous when its non-exceedance probability is less than or is greater than being α a significance level that is equal to α=0.2 as indicated in Paranunzio et al. (2016). The obtained results are reported in Fig. 21 where the frequencies of the anomalous events are reported according to the corresponding meteorological variables. For all considered variables the frequencies of anomalous events increase with the decades and more frequent anomalous events are located in the middle of the range of the considered values for each variable. This result could be due to the definition of non-exceeding probability that was estimated ordering the recorded data values. This implies that the first values in the rank could be relative higher but not the highest in the meteorological station. In contrast the conditional probability has greater values for high values of meteorological variables. This difference is attributed to the method employed for computing the conditional probability in which the meteorological probability is computed for all ranges even those in which the rockfall events did not occurred. Finally, temperature variations have to peaks one associated to negative values and another one to positive. This result is attributed to the fact that the same temperature variation could occur for increasing temperature (temperature variation positive) and for decreasing temperature (temperature variation negative) and since the anomalous events correspond to a symmetric value of non-exceeding probabilities (positive and negative anomalies) two peaks appeared.
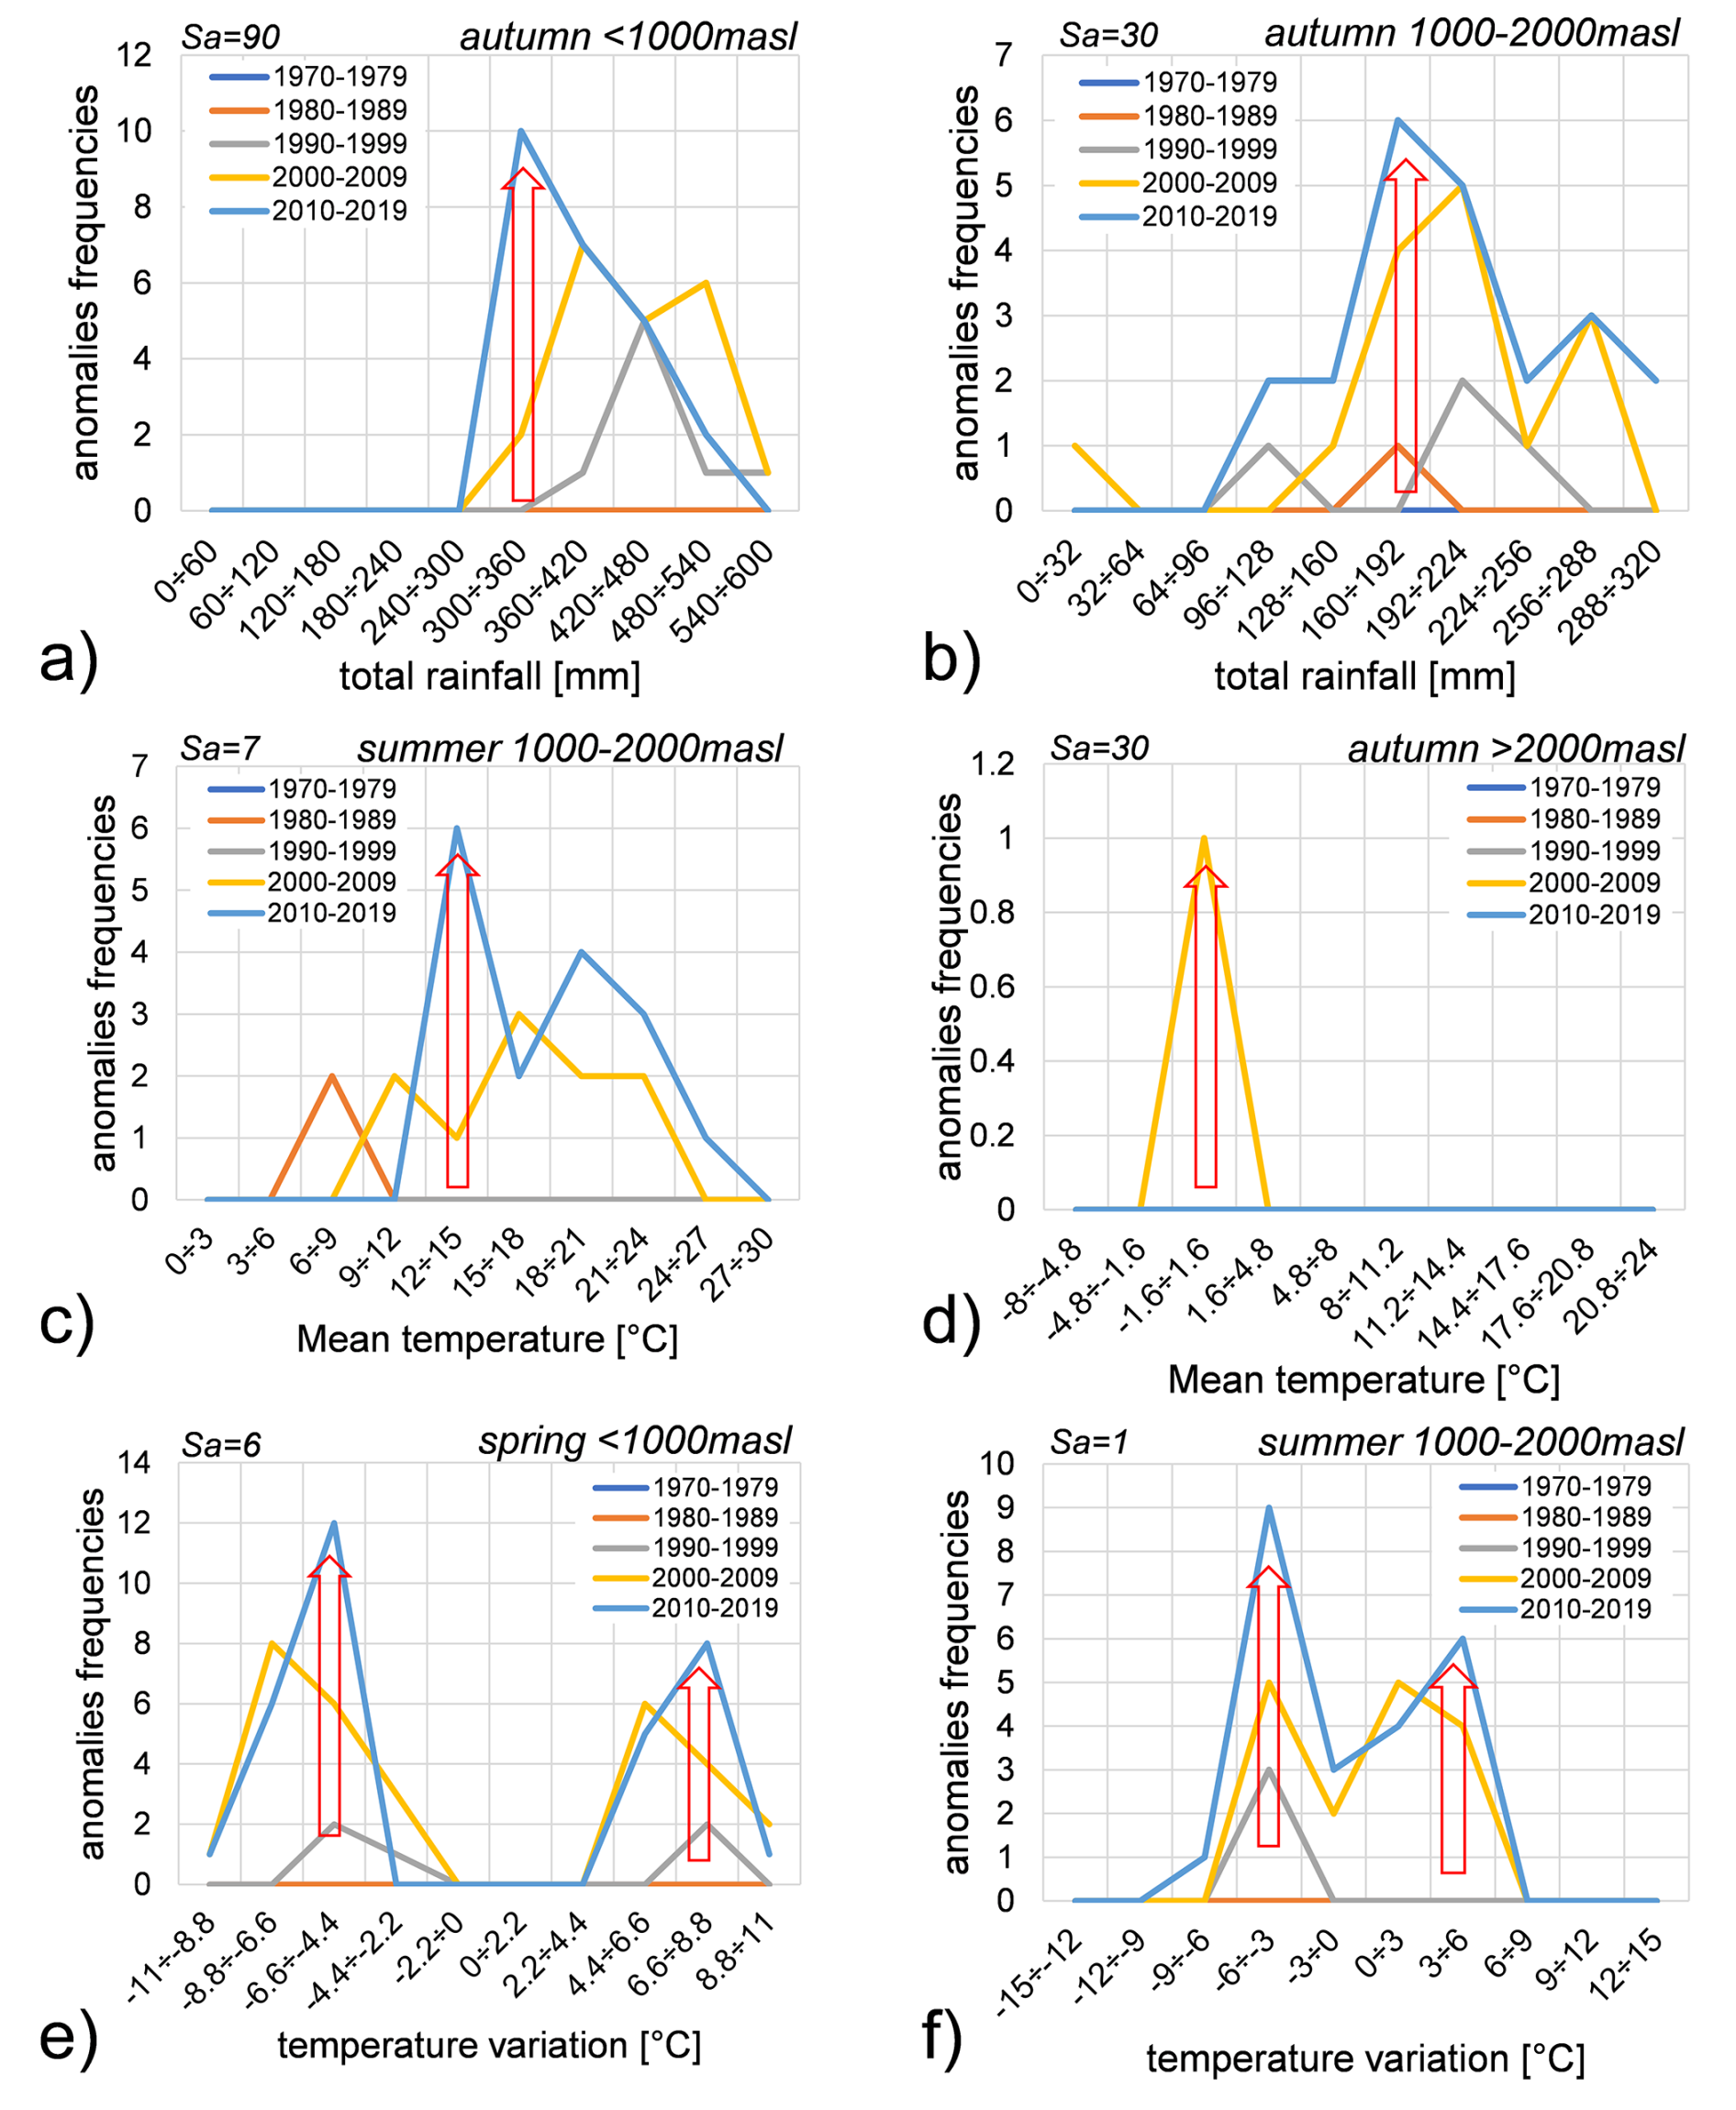
Figure 21Distributions of anomaly frequencies by using Paranunzio et al. (2015) method, categorized by climate variable and aggregation scale as applied in this analysis. Only results for rainfall, temperature amplitude and temperature variation, as presented in Sect. 4.3, are reported.
Due to the complexity of meteorological but also lithological and morphological conditions under which the rockfall occurred, this analysis does not allow to unravel into detail the mechanisms why a weather variable has different effects according to the season or elevation. For such detail, it should be necessary to constrain the analysis by considering only rockfalls occurring on single lithological and morphological settings through a detailed multitemporal survey that allows to focus on specific weather variables, e.g. thermal stress (Collins and Stock, 2016; Gasc-Barbier et al., 2024; Fei et al., 2025), freeze-thaw (D'Amato et al., 2016), or rainfall (Weidner et al., 2024).
The overall probability distributions obtained from the triangulation method were found to be similar to the main results. While variations in conditional probabilities were noted, the observed trends remained consistent across many cases.
For the remaining cases exhibiting divergent trends, two primary methodological explanations are proposed:
-
Resolution Effect due to Local Averaging: the discrepancy may be attributed to the local scale of the analysis. Specifically, the calculation of the meteorological time series involved averaging data from only three weather stations associated with each rockfall event. This limited spatial sampling may introduce a resolution mismatch when comparing the results against a broader reference dataset, affecting the precision of the conditional probability assessment. Furthermore, it is not possible to guarantee that the three closest stations fully capture the local variability or the dependence on fine-scale variables such as elevation.
-
Statistical Dependency on Station Count: an alternative interpretation relates to the fundamental structure of the Bayesian calculation. By reducing the number of considered weather stations for calculating the prior probability of the meteorological variable P(M), the resulting conditional probabilities, P(M|Rf) (Likelihood) and P(Rf|M) (Posterior), are necessarily affected accordingly. The reduction in input data volume directly influences the numerical stability and magnitude of the probability estimates, leading to the observed variations.
This study analysed meteorological data from 1970 to 2019, confirming a significant warming trend in the Alpine region, consistent with previous research. Specifically, for the period 1985–2019, the study area recorded an annual mean warming rate of 0.28 °C per decade for minimum temperature and 0.15 °C per decade for maximum temperature. The highest warming rates were notably observed during the spring period, with a maximum increase of 0.3 °C per decade. These trends indicate that springs and autumns are becoming warmer, summers are experiencing increasing frequencies of high temperature values, and winters are growing milder. This overall warming leads to an earlier onset of summer and a delayed onset of winter, consequently altering the length of these seasons.
Significant changes in precipitation patterns were also observed. There is a clear increase in high-intensity rainfall events, particularly in winter, alongside a reduction in low-intensity rainfall was recorded across all seasons. This finding aligns with established observations for the Alpine region in the existing literature. Conversely, summer precipitation variations were modest, contrasting with some previous projections for the area.
A notable decline in both icing and freeze-thaw cycles days was identified. Quantitatively, this study estimates a decrease of 7.3 d of freeze-thaw cycles and 2.2 icing days every decade.
The Rescaled Adjusted Partial Sums (RAPS) method provided valuable insights into long-term trends and fluctuations in precipitation. It highlighted that climate evolution is primarily driven not by changes in the maximum values of climate variables, but rather by variations in their frequencies over the years.
Our rockfall analysis revealed that rockfall frequencies exhibit three main peaks: in November, February-April, and August. Regarding the aspect of the source area, for altitude greater than 2000 m, for group A the predominant component is W while for the group B the W component reduces significantly (from 23 % to 7 % + 7 %), the S, SW and SE reduces slightly while the N component has significant increment (from 4 % to 12 % +3 %): a pattern potentially linked to permafrost thawing in these high-altitude.
The study identified several correlations between rockfall events and specific climate variables. High-intensity rainfall and rockfalls are correlated in autumn, with monthly and quarterly rainfall events showing conditional probabilities of 12.4 % below 1000 m and 22.2 % at altitudes between 1000 and 2000 m. A correlation with mean air temperatures was observed: a 12.7 % conditional probability for rockfalls with weekly mean temperatures ranging from 21 to 24 °C during the summer season between 1000 and 2000 m. This conditional probability reaches 2.2 % above 2000 m with temperatures ranging from 17.6 to 20.8 °C during the autumn season (at a 30 d aggregation scale). Temperature amplitude also showed correlations: in spring below 1000 m a.s.l., a 28.6 % probability was found for amplitudes between 8.8 and 9.9 °C. In winter, between 1000 and 2000 m a.s.l., a 5.8 % probability was observed for amplitudes in the range of 9 to 10 °C. Regarding temperature variation, rockfalls in summer between 1000 and 2000 m are correlated with a 14.3 % probability with temperature variations from −9 to −6 °C. During spring below 1000 m a.s.l., a conditional probability of 20 % was found for the maximum range of variation (8.8 °C ÷ 11 °C).
Finally, the analysis of correlations between rockfall events and freeze-thaw cycles and icing periods highlighted that the probability results are significantly influenced by the chosen calculated time-series (maximum, average, or minimum temperature), emphasizing the importance of detailed temperature data for these phenomena.
Meteorological timeseries data are taken from Sistema nazionale per l'elaborazione e diffusione di Dati Climatici (SCIA, https://scia.isprambiente.it/, last access: 10 November 2024; Desiato et al., 2011; Padulano et al., 2021).
Rockfalls dataset source include:
-
Italian Landslide Inventory project (IFFI, https://idrogeo.isprambiente.it/, last access: 12 November 2024; Trigila et al., 2007)
-
Geomorphological impacts of Climate change in the Alps (GeoClimAlp https://geoclimalp.irpi.cnr.it/, last access: 12 November 2024; Nigrelli et al., 2024) database
-
online news sources (https://www.ildolomiti.it/, last access: 12 November 2024; https://www.ladige.it/, last access: 12 November 2024; https://www.guidedolomiti.com/tag/frane-crolli/, last access: 12 November 2024)
Additional information is available from the authors upon reasonable request.
The supplement related to this article is available online at https://doi.org/10.5194/nhess-26-187-2026-supplement.
FB: meteorological and rockfall data collection and analysis; FB and GD developed the code for statistical analysis and carried out the statistical computation; FB, GD and GC prepared the draft manuscript. PF and GC provided funding, supervised the project and the analyses.
The contact author has declared that none of the authors has any competing interests.
Publisher’s note: Copernicus Publications remains neutral with regard to jurisdictional claims made in the text, published maps, institutional affiliations, or any other geographical representation in this paper. While Copernicus Publications makes every effort to include appropriate place names, the final responsibility lies with the authors. Views expressed in the text are those of the authors and do not necessarily reflect the views of the publisher.
The authors acknowledge support from the Geology and Materials Testing Office of the Autonomous Province of for providing data on rockfalls in their province area.
This paper was edited by Solmaz Mohadjer and reviewed by three anonymous referees.
Adler, S., Chimani, B., Drechsel, S., Haslinger, K., Hiebl, J., Meyer, V., Resch, G., Rudolph, J., Vergeiner, J., Zingerle, C., Marigo, G., Fischer, A., and Seiser, B.: Il clima del Tirolo-Alto Adige-Bellunese. Zentralanstalt für Meteorologie und Geodynamik (ZAMG), Ripartizione Protezione antincendi e civile – Provincia Autonoma di Bolzano, http://www.3pclim.eu/images/Il_clima_del_Tirolo-Alto_Adige-Bellunese.pdf (last access: 10 September 2024), 2015.
Allen, S. and Huggel, C.: Extremely warm temperatures as a potential cause of recent high mountain rockfall, Global and Planetary Change, 107, 59–69, 2013.
Bajni, G., Camera, C. A., and Apuani, T.: Deciphering meteorological influencing factors for Alpine rockfalls: a case study in Aosta Valley, Landslides, 18, 3279–3298, 2021.
Bassetti, M. and Borsato, A.: Evoluzione geomorfologica della Bassa Valle dell'Adige dall'Ultimo Massimo Glaciale: sintesi delle conoscenze e riferimenti ad aree limitrofe, Acta Geologica, 82, e42, https://www.researchgate.net/publication/255632538_Evoluzione_geomorfologica_della_Bassa_Valle_dell'Adige_dall'Ultimo_Massimo_Glaciale_sintesi_delle_conoscenze_e_riferimenti_ad_aree_limitrofe (last access: 14 January 2026), 2005.
Bayes, R. T.: Bayes' Theorem. An essay towards solving a problem in the doctrine of chances, Philosophical, 370–418, https://doi.org/10.1098/rstl.1763.0053, 1763.
Bengtsson, L., Semenov, V. A., and Johannessen, O. M.: The early twentieth-century warming in the Arctic – A possible mechanism, Journal of Climate, 17, 4045–4057, 2004.
Beniston, M.: Climatic change in mountain regions: a review of possible impacts, Climatic Change, 59, 5–31, 2003.
Beniston, M.: Mountain weather and climate: a general overview and a focus on climatic change in the Alps, Hydrobiologia, 562, 3–16, 2006.
Berti, M., Martina, M. L. V., Franceschini, S., Pignone, S., Simoni, A., and Pizziolo, M.: Probabilistic rainfall thresholds for landslide occurrence using a Bayesian approach, Journal of Geophysical Research: Earth Surface, 117, https://doi.org/10.1029/2012JF002367, 2012.
Boeckli, L., Brenning, A., Gruber, S., and Noetzli, J.: A statistical approach to modelling permafrost distribution in the European Alps or similar mountain ranges, The Cryosphere, 6, 125–140, https://doi.org/10.5194/tc-6-125-2012, 2012.
Böhm, R., Auer, I., Brunetti, M., Maugeri, M., Nanni, T., and Schöner, W.: Regional temperature variability in the European Alps: 1760–1998 from homogenized instrumental time series, International Journal of Climatology: A Journal of the Royal Meteorological Society, 21, 1779–1801, 2001.
Bosellini, A., Gianolla, P., and Stefani, M.: Geology of the Dolomites, Episodes Journal of International Geoscience, 26, 181–185, 2003.
Brunetti, M., Lentini, G., Maugeri, M., Nanni, T., Auer, I., Bohm, R., and Schoner, W.: Climate variability and change in the Greater Alpine Region over the last two centuries based on multi-variable analysis, International Journal of Climatology, 29, 2197–2225, 2009.
Bunce, C. M., Cruden, D. M., and Morgenstern, N. R.: Assessment of the hazard from rock fall on a highway, Canadian Geotechnical Journal, 34, 344–356, 1997.
Ceppi, P., Scherrer, S. C., Fischer, A. M., and Appenzeller, C.: Revisiting Swiss temperature trends 1959–2008, International Journal of Climatology, 32, 203–213, 2012.
Christensen, J. H. and Christensen, O. B: Severe summertime flooding in Europe, Nature, 421, 805–806, 2003.
Corò, D., Galgaro, A., Fontana, A., and Carton, A.: A regional rockfall database: the Eastern Alps test site, Environmental Earth Sciences, 74, 1731–1742, 2015.
Collins, B. D. and Stock, G. M.: Rockfall triggering by cyclic thermal stressing of exfoliation fractures, Nature Geoscience, 9, 395–400, 2016.
Courtial-Manent, L., Ravanel, L., Mugnier, J. L., Deline, P., Lhosmot, A., Rabatel, A., Duvillard, P. A., and Batoux, P.: 18-years of high-Alpine rock wall monitoring using terrestrial laser scanning at the Tour Ronde east face, Mont-Blanc massif, Environmental Research Letters, 19, 034037, https://doi.org/10.1088/1748-9326/ad281d, 2024.
Crosta, G. B. and Agliardi, F.: Parametric evaluation of 3D dispersion of rockfall trajectories, Nat. Hazards Earth Syst. Sci., 4, 583–598, https://doi.org/10.5194/nhess-4-583-2004, 2004.
D'Amato, J., Hantz, D., Guerin, A., Jaboyedoff, M., Baillet, L., and Mariscal, A.: Influence of meteorological factors on rockfall occurrence in a middle mountain limestone cliff, Nat. Hazards Earth Syst. Sci., 16, 719–735, https://doi.org/10.5194/nhess-16-719-2016, 2016.
Dal Piaz, G. V., Bistacchi, A., and Massironi, M.: Geological outline of the Alps, Episodes Journal of International Geoscience, 26, 175–180, 2003.
Davies, M. C., Hamza, O., and Harris, C.: The effect of rise in mean annual temperature on the stability of rock slopes containing ice-filled discontinuities, Permafrost and Periglacial Processes, 12, 137–144, 2001.
Delonca, A., Gunzburger, Y., and Verdel, T.: Statistical correlation between meteorological and rockfall databases, Nat. Hazards Earth Syst. Sci., 14, 1953–1964, https://doi.org/10.5194/nhess-14-1953-2014, 2014.
Desiato, F., Lena, F., Baffo, F., Suatoni, B., and Toreti, A.: Indicatori del clima in Italia. Ecologia Agraria, U. C., & Romagna, A. E. APAT, Roma, https://scia.isprambiente.it/wp-content/uploads/2024/03/Indicatori-del-clima-in-Italia.pdf (last access: 16 June 2024), 2005.
Desiato, F., Fioravanti, G., Fraschetti, P., Perconti, W., and Toreti, A.: Climate indicators for Italy: calculation and dissemination, Adv. Sci. Res., 6, 147–150, 2011.
Doglioni, C.: Tectonics of the Dolomites (southern Alps, northern Italy), Journal of Structural Geology, 9, 181–193, 1987.
Douglas, G. R.: Magnitude frequency study of rockfall in Co. Antrim, N. Ireland, Earth Surface Processes, 5, 123–129, 1980.
Draebing, D. and Krautblatter, M.: The efficacy of frost weather processes in alpine rockwalls, Geophysical Research Letters, 46, 6516–6524, 2019.
Đurin, B., Kranjčić, N., Kanga, S., Singh, S. K., Sakač, N., Pham, Q. B., Hunt, J., Dogančić, D., and Di Nunno, F.: Application of Rescaled Adjusted Partial Sums (RAPS) method in hydrology – an overview, Advances in Civil and Architectural Engineering, 13, 58–72, 2022.
Fei, L., Jaboyedoff, M., Derron, M. H., Choanji, T., and Sun, C.: Multiscale observations of diurnal thermal effects on rock failure and crack dynamics in soft marl layers (La Cornalle molasse rock wall, Switzerland), Engineering Geology, 108159, https://doi.org/10.1016/j.enggeo.2025.108159, 2025.
Fischer, L., Kääb, A., Huggel, C., and Noetzli, J.: Geology, glacier retreat and permafrost degradation as controlling factors of slope instabilities in a high-mountain rock wall: the Monte Rosa east face, Nat. Hazards Earth Syst. Sci., 6, 761–772, https://doi.org/10.5194/nhess-6-761-2006, 2006.
Frattini, P., Crosta, G., Carrara, A., and Agliardi, F.: Assessment of rockfall susceptibility by integrating statistical and physically-based approaches, Geomorphology, 94, 419–437, 2008.
Frayssines, M. and Hantz, D.: Failure mechanisms and triggering factors in calcareous cliffs of the Subalpine Ranges (French Alps), Engineering Geology, 86, 256–270, 2006.
Garbrecht, J. and Fernandez, G. P.: Visualization of trends and fluctuations in climatic records 1, JAWRA Journal of the American Water Resources Association, 30, 297–306, 1994.
Gariano, S. L. and Guzzetti, F.: Landslides in a changing climate, Earth-Science Reviews, 162, 227–252, 2016.
Gasc-Barbier, M., Merrien-Soukatchoff, V., Krzewinski, V., Azemard, P., and Genois, J. L.: Assessment of the influence of natural thermal cycles on dolomitic limestone rock columns: A 10-year monitoring study, Geomorphology, 464, 109353, https://doi.org/10.1016/j.geomorph.2024.109353, 2024.
Gelman, A.: Objections to Bayesian statistics, Bayesian Anali., 3, 445–449, https://doi.org/10.1214/08-BA318, 2008.
Gobiet, A., Kotlarski, S., Beniston, M., Heinrich, G., Rajczak, J., and Stoffel, M.: 21st century climate change in the European Alps – A review, Science of the total Environment, 493, 1138–1151, 2014.
Gruber, S. and Haeberli, W.: Permafrost in steep bedrock slopes and its temperature-related destabilization following climate change, Journal of Geophysical Research: Earth Surface, 112, https://doi.org/10.1029/2006JF000547, 2007.
Hilker, N., Badoux, A., and Hegg, C.: The Swiss flood and landslide damage database 1972–2007, Nat. Hazards Earth Syst. Sci., 9, 913–925, https://doi.org/10.5194/nhess-9-913-2009, 2009.
Huggel, C., Allen, S., Deline, P., Fischer, L., Noetzli, J., and Ravanel, L.: Ice thawing, mountains falling – are alpine rock slope failures increasing?, Geology Today, 28, 98–104, 2012.
Krautblatter, M. and Moser, M.: A nonlinear model coupling rockfall and rainfall intensity based on a four year measurement in a high Alpine rock wall (Reintal, German Alps), Nat. Hazards Earth Syst. Sci., 9, 1425–1432, https://doi.org/10.5194/nhess-9-1425-2009, 2009.
Krautblatter, M., Funk, D., and Günzel, F. K.: Why permafrost rocks become unstable: a rock–ice-mechanical model in time and space, Earth Surf. Process. Landf., 38, 876–887, 2013.
Letortu, P.: Le recul des falaises crayeuses haut-normandes et les inondations par la mer en Manche centrale et orientale: de la quantification de l'aléa à la caractérisation des risques induits, PhD thesis, Université de Caen, https://theses.hal.science/tel-01018719 (last access: 16 December 2024), 2013.
Luethi, R., Gruber, S., and Ravanel, L.: Modelling transient ground surface temperatures of past rockfall events: towards a better understanding of failure mechanisms in changing periglacial environments, Geogr. Ann. Ser. A Phys. Geogr., 97, 753–767, 2015.
Macciotta, R., Martin, C. D., Edwards, T., Cruden, D. M., and Keegan, T. Quantifying weather conditions for rock fall hazard management, Georisk: Assessment and management of risk for Engineered Systems and Geohazards, 9, 171–186, 2015.
Macciotta, R., Hendry, M., Cruden, D. M., Blais-Stevens, A., and Edwards, T. Quantifying rock fall probabilities and their temporal distribution associated with weather seasonality, Landslides, 14, 2025–2039, 2017.
Matsuoka, N. and Sakai, H.: Rockfall activity from an alpine cliff during thawing periods, Geomorphology, 28, 309–328, 1999.
Nigrelli, G., Fratianni, S., Zampollo, A., Turconi, L., and Chiarle, M.: The altitudinal temperature lapse rates applied to high elevation rockfalls studies in the Western European Alps, Theoretical and Applied Climatology, 131, 1479–1491, 2018.
Nigrelli, G. and Chiarle, M.: 1991–2020 climate normal in the European Alps: focus on high-elevation environments, Journal of Mountain Science, 20, 2149–2163, 2023.
Nigrelli, G., Paranunzio, R., Turconi, L., Luino, F., Mortara, G., Guerini, M., Giardino, M., and Chiarle, M.: First national inventory of high-elevation mass movements in the Italian Alps, Computers & Geosciences, 184, 105520, https://doi.org/10.1016/j.cageo.2024.105520, 2024.
Nissen, K. M., Rupp, S., Kreuzer, T. M., Guse, B., Damm, B., and Ulbrich, U.: Quantification of meteorological conditions for rockfall triggers in Germany, Nat. Hazards Earth Syst. Sci., 22, 2117–2130, https://doi.org/10.5194/nhess-22-2117-2022, 2022.
Noetzli, J., Hoelzle, M., and Haeberli, W.: Mountain permafrost and recent Alpine rock-fall events: a GIS-based approach to determine critical factors. in: Proceedings of the 8th International Conference on Permafrost, Vol. 2, Zürich: Swets & Zeitlinger Lisse, 827–832, https://doi.org/10.5167/uzh-33321, 2003.
Noetzli, J. and Gruber, S.: Transient thermal effects in Alpine permafrost, The Cryosphere, 3, 85–99, https://doi.org/10.5194/tc-3-85-2009, 2009.
Padulano, R., Rianna, G., and Santini, M.: Datasets and approaches for the estimation of rainfall erosivity over Italy: A comprehensive comparison study and a new method, Journal of Hydrology: Regional Studies, 34, 100788, https://doi.org/10.1016/j.ejrh.2021.100788, 2021.
Palau, R. M., Gisnås, K. G., Solheim, A., and Gilbert, G. L.: Regional-scale analysis of weather-related rockfall triggering mechanisms in Norway, and its sensitivity to climate change, Nat. Hazards Earth Syst. Sci. Discuss. [preprint], https://doi.org/10.5194/nhess-2024-46, 2024.
Palladino, M. R., Viero, A., Turconi, L., Brunetti, M. T., Peruccacci, S., Melillo, M., Luino, F., Deganutti, A. M., and Guzzetti, F.: Rainfall thresholds for the activation of shallow landslides in the Italian Alps: the role of environmental conditioning factors, Geomorphology, 303, 53–67, 2018.
Paranunzio, R. and Marra, F.: Open gridded climate datasets can help investigating the relation between meteorological anomalies and geomorphic hazards in mountainous areas, Global and Planetary Change, 232, 104328, https://doi.org/10.1016/j.gloplacha.2023.104328, 2024.
Paranunzio, R., Laio, F., Nigrelli, G., and Chiarle, M.: A method to reveal climatic variables triggering slope failures at high elevation, Natural Hazards, 76, 1039–1061, 2015.
Paranunzio, R., Laio, F., Chiarle, M., Nigrelli, G., and Guzzetti, F.: Climate anomalies associated with the occurrence of rockfalls at high-elevation in the Italian Alps, Nat. Hazards Earth Syst. Sci., 16, 2085–2106, https://doi.org/10.5194/nhess-16-2085-2016, 2016.
Paranunzio, R., Chiarle, M., Laio, F., Nigrelli, G., Turconi, L., and Luino, F.: New insights in the relation between climate and slope failures at high-elevation sites, Theoretical and Applied Climatology, 137, 1765–1784, 2019.
Pepin, N., Bradley, R. S., Diaz, H. F., Baraer, M., Caceres, E. B., Forsythe, N., Fowler, H., Greenwood, G., Hashmi, M. Z., Liu, X. D., Miller, J. R., Ning, L., Ohmura, A., Palazzi, E., Rangwala, I., Schöner, W., Severskiy, I., Shahgedanova, M., Wang, M. B., Williamson, S. N., and Yang, D. Q.: Elevation-dependent warming in mountain regions of the world, Nat. Clim. Chang., 5, 424–430, https://doi.org/10.1038/nclimate2563, 2015.
Pepin, N. C., Arnone, E., Gobiet, A., Haslinger, K., Kotlarski, S., Notarnicola, C., Palazzi, E., Seibert, P., Serafin, S., Schöner, W., Terzago, S., Thornton, J. M., Vuille, M., and Adler, C.: Climate changes and their elevational patterns in the mountains of the world, Reviews of Geophysics, 60, e2020RG000730, https://doi.org/10.1029/2020RG000730, 2022.
Perret, S., Stoffel, M., and Kienholz, H.: Spatial and temporal rockfall activity in a forest stand in the Swiss Prealps – a dendrogeomorphological case study, Geomorphology, 74, 219–231, 2006.
Ravanel, L., Magnin, F., and Deline, P.: Impacts of the 2003 and 2015 summer heatwaves on permafrost-affected rock-walls in the Mont Blanc massif, Sci. Total Environ., 609, 132–143, 2017.
Rupp, S. and Damm, B.: A national rockfall dataset as a tool for analysing the spatial and temporal rockfall occurrence in Germany, Earth Surface Processes and Landforms, 45, 1528–1538, 2020.
Salzmann, N., Nötzli, J., Hauck, C., Gruber, S., Hoelzle, M., and Haeberli, W.: Ground surface temperature scenarios in complex high-mountain topography based on regional climate model results, Journal of Geophysical Research: Earth Surface, 112, https://doi.org/10.1029/2006JF000527, 2007.
Sandersen, F., Bakkehøi, S., Hestnes, E., and Lied, K.: The influence of meteorological factors on the initiation of debris flows, rockfalls, rockslides and rockmass stability, Publikasjon-Norges Geotekniske Institutt, 201, 97–114, 1997.
Sass, O. and Oberlechner, M.: Is climate change causing increased rockfall frequency in Austria?, Nat. Hazards Earth Syst. Sci., 12, 3209–3216, https://doi.org/10.5194/nhess-12-3209-2012, 2012.
Schär, C., Vidale, P. L., Lüthi, D., Frei, C., Häberli, C., Liniger, M. A., and Appenzeller, C.: The role of increasing temperature variability in European summer heatwaves, Nature, 427, 332–336, 2004.
Schmidli, J. and Frei, C.: Trends of heavy precipitation and wet and dry spells in Switzerland during the 20th century, International Journal of Climatology: A Journal of the Royal Meteorological Society, 25, 753–771, 2005.
Stoffel, M. and Huggel, C.: Effects of climate change on mass movements in mountain environments, Progress in Physical Geography, 36, 421–439, 2012.
Stoffel, M., Trappmann, D. G., Coullie, M. I., Ballesteros Cánovas, J. A., and Corona, C.: Rockfall from an increasingly unstable mountain slope driven by climate warming, Nature Geoscience, 17, 249–254, 2024.
Stull, R. B.: Meteorology for scientists and engineers: a technical companion book with Ahrens' Meteorology Today, 2nd edn., Brooks/Cole Thomson Learning, Pacific Grove, ISBN 9780534372149, 2000.
Trigila, A., Iadanza, C., and Guerrieri, L.: The IFFI project (Italian landslide inventory): Methodology and results, Guidelines for mapping areas at risk of landslides in Europe, 23, 15, https://doi.org/10.2788/63147, 2007.
Valagussa, A., Frattini, P., and Crosta, G. B.: Earthquake-induced rockfall hazard zoning, Engineering Geology, 182, 213–225, 2014.
Varnes, D. J.: Slope movement types and processes, Special Report, 176, 11–33, https://onlinepubs.trb.org/Onlinepubs/sr/sr176/176-002.pdf (last access: 4 May 2024), 1978.
Viani, C., Chiarle, M., Paranunzio, R., Merlone, A., Musacchio, C., Coppa, G., and Nigrelli, G.: An integrated approach to investigate climate-driven rockfall occurence in high alpine slope: the Bessanese glacial basin, Western Italian Alps, Journal of Mountain Sience, 17, https://doi.org/10.1007/s11629-020-6216-y, 2020.
Volkwein, A., Schellenberg, K., Labiouse, V., Agliardi, F., Berger, F., Bourrier, F., Dorren, L. K. A., Gerber, W., and Jaboyedoff, M.: Rockfall characterisation and structural protection – a review, Nat. Hazards Earth Syst. Sci., 11, 2617–2651, https://doi.org/10.5194/nhess-11-2617-2011, 2011.
Wang, J., Guan, Y., Wu, L., Guan, X., Cai, W., Huang, J., Dong, W., and Zhang, B.: Changing lengths of the four seasons by global warming, Geophysical Research Letters, 48, e2020GL091753.7-2651, https://doi.org/10.1029/2020GL091753, 2021.
Weidner, L., Walton, G., and Phillips, C.. Investigating the influences of precipitation, snowmelt, and freeze-thaw on rockfall in Glenwood Canyon, Colorado using terrestrial laser scanning, Landslides, 21, 2073–2091, 2024.
Widmann, M. and Schär, C.: A principal component and long-term trend analysis of daily precipitation in Switzerland, International Journal of Climatology: A Journal of the Royal Meteorological Society, 17, 1333–1356, 1997.
World Meteorological Organization: World Meteorological Organization, 10th edn., Calcolation of monthly and annual 30 year standard normals, Washington, D.C., USA, https://posmet.ufv.br/wp-content/uploads/2017/04/MET-481-WMO-341.pdf (last access: 10 September 2024), 1989.
Zhao, T., Crosta, G. B., Utili, S., and De Blasio, F. V.: Investigation of rock fragmentation during rockfalls and rock avalanches via 3-D discrete element analyses, J. Geophys. Res. Earth Surf., 122, 678–695, 2017.