the Creative Commons Attribution 4.0 License.
the Creative Commons Attribution 4.0 License.
 | 25 Mar 2026
Tracking the slopes: a spatio-temporal prediction model for backcountry skiing activity in the Swiss Alps using user-generated content
Leonie Schäfer
Frank Techel
Günter Schmudlach
Ross S. Purves
Backcountry skiing is a popular form of recreation in Switzerland and worldwide, yet little is known about where and when people venture outside and methods to monitor skiing behaviour are limited by the vast and remote nature of backcountry terrain. With avalanche fatalities documented each year, there is a need for spatially and temporally explicit information on the persons exposed to avalanche danger for effective risk estimations. To do so, we explored over 6800 user-generated GPS tracks and over 8 million clicks on a ski touring website to model backcountry skiing base rates on a daily scale in 126 regions in the Swiss Alps. We linked the data to weather, snow, temporal and environmental variables to train two different spatio-temporal prediction models based on the two data sources. We found that GPS and click data describe different types of behaviour (planning and real world behaviour), yet we could demonstrate that they correlate well with a 1 d time lag (ρ = 0.63), suggesting that online activity precedes actual skiing activity. Our results show that online and real-world behaviour are driven by similar underlying factors, with temporal aspects – such as weekends and the progression of the season – playing the most important role in both datasets. However, we found differences in how certain variables influenced behaviour: people tended to click on more routes in areas of high avalanche danger during more extreme weather conditions than they actually visited, and time spent on trip planning decreased as the season progressed. Our study demonstrates the potential of user-generated data sources to model skiing activity on regional and daily temporal scales, but also sheds light on specific limitations of the different data sources in approximating backcountry skiing activity.
- Article
(11483 KB) - Full-text XML
-
Supplement
(3327 KB) - BibTeX
- EndNote


Winter sport activities that take place in mountainous terrain, e.g., skiing or snowshoeing, have increased in popularity in recent years. Simultaneously, the availability of better equipment and avalanche education have increased recreational activity in uncontrolled avalanche terrain. In Switzerland, the number of backcountry skiers – skiers who ascend under their own power and descend in uncontrolled avalanche terrain – has more than doubled in the last decade (Lamprecht et al., 2014, 2020), but it is unclear where and when these skiers are active in the terrain. Travelling in avalanche terrain comes with inherent risks: accident statistics show that backcountry skiers are at risk of serious injuries or even death with an average of 22 people dying each winter in an avalanche in Switzerland, most of them triggering the avalanche themselves (Schweizer and Techel, 2017; SLF, 2025).
Compared to research on the physical properties of avalanches and snowpack, research on the detailed spatio-temporal behaviour of skiers, and especially of those not involved in accidents, is much rarer. One reason for this disparity is that while fatal accidents and other incidents are reported comprehensively (e.g., Niemann et al., 2022; Pfeifer et al., 2018), accident-free backcountry trips, which are far more frequent, are generally not documented. As a result, we know when and where accidents occur, but we lack information on important context, such as how many other skiers were in the field, which is essential for calculating accident and fatality rates (Toft et al., 2025). Exposure, or the baseline backcountry skiing activity rate, is a crucial part of the avalanche risk equation. Moreover, knowing about daily backcountry skiing activities can be valuable for avalanche forecast verification, since it is impossible to determine whether a lack of reported avalanches stems from the fact that no avalanches happened or because no people were in the field to release and report a potential avalanche. Conditions where avalanches do not occur are important for avalanche forecasting, but remain difficult to interpret, and knowing where skiers were active could shed light on such situations (Techel et al., 2015). Understanding when people engage in winter backcountry recreation is also one way to evaluate the effectiveness of avalanche forecasts and for targeting specific outreach efforts.
Although data is hard to come by, various approaches to include base rates when calculating the (relative) risk of accidentally triggering an avalanche have been used (e.g., Grímsdóttir and Mcclung, 2006; Pfeifer, 2009; Schmudlach and Köhler, 2016; Techel et al., 2015; Winkler et al., 2021; Degraeuwe et al., 2024; Toft et al., 2025; Walcher et al., 2019). For example, backcountry skiing activity base rates have been estimated by installing counters and voluntary registration boards in Switzerland (Zweifel et al., 2006) or by installing beacon checkers that detect and count signals from avalanche transceivers carried by skiers in Norway (Toft et al., 2025). While these methods provide accurate numbers at specific locations, they are expensive and not scalable to larger areas, especially when these are remote and inaccessible, as is often the case for backcountry skiing. To address this, recent studies have used mobile phone location data which is scalable to large areas, but so far the results have been inconsistent (Ahas et al., 2008; Francisco et al., 2018; Toft et al., 2023).
With the emergence of new data collection and data sharing technologies, most importantly GPS and what was termed Web 2.0 in the early 2000s, user-generated content (UGC) arose as an easily accessible and inexpensive new data source for studying humans in nature generally (Wood et al., 2013). Following Goodchild (2007) and Santos (2022, p. 108), we define UGC as a collective term for “any kind of text, data or action that has been performed and produced by digital system users”, often with diverse and sometimes unknown motivations, accessible to the public through various online platforms. Spatially explicit UGC has proven to be efficient for visitor monitoring in protected areas and parks (Heikinheimo et al., 2017; Levin et al., 2017; Tenkanen et al., 2017) as well as in urban areas (Norman et al., 2019; Wartmann et al., 2021) but has rarely been used to analyze spatio-temporal backcountry skiing patterns (Techel et al., 2015). So far, only a handful of studies have used UGC to explore backcountry skiing patterns (e.g., Sharp et al., 2018; Toft et al., 2024; Techel et al., 2014). In particular, different kinds of user-generated content have yet to be explored as a tool for estimating backcountry skiing base rates or identifying key drivers of activity fluctuations. Moreover, we are not aware of attempts to predict backcountry skiing activity for upcoming days.
We address this gap by leveraging two different types of user-generated data to model and predict backcountry skiing activity base rates in the Swiss Alps. Specifically, we used GPS data and online engagement data from a popular Swiss ski touring platform as proxies for actual and potential human presence in the backcountry. Our approach involved first comparing these two proxies and then linking them to a set of environmental, temporal and snow and weather condition-related variables using machine learning. We aimed to (a) find out if and how real-world behaviour as expressed through GPS tracks corresponds to online engagement, (b) assess the suitability of each data source for modelling actual and potential activity and (c) identify the key drivers of spatio-temporal behaviour to predict daily variations in backcountry skiing activity at a regional scale, moving beyond the retrospective activity pattern analyzes found in the literature (e.g., Techel et al., 2015).
There are three commonly acknowledged physical factors that contribute to avalanche release: weather, snowpack and terrain (McClung, 2023). While avalanche research has traditionally focused on these physical factors, the first decades of the 21st century have seen a paradigm shift, with growing attention paid to the role of the human factor (Furman et al., 2010). This reflects increasing acknowledgment that heuristic-based decision making is a key driver of behaviour in the backcountry, introducing unconscious biases that play a crucial role in avalanche accidents (McCammon, 2004; Tversky and Kahneman, 1974). This has driven a wave of research into behavior, including studies on decision making processes, risk taking behaviour, group dynamics, demographics, used equipment, or terrain use of backcountry skiers using surveys, questionnaires or interviews (Furman et al., 2010; Happ et al., 2023; Mannberg et al., 2018; Marengo et al., 2017; Nichols et al., 2018; Silverton et al., 2009; Valle et al., 2022; Zweifel et al., 2006), which are sometimes combined with accident statistics (Gasser, 2020; Niemann et al., 2022; Pfeifer et al., 2018; Techel et al., 2015; Winkler et al., 2021, 2016).
In survey- and interview-based studies, participants are often questioned about their decisions in hypothetical scenarios, thus taking a stated preference approach (Furman et al., 2010; Haegeli et al., 2010; Marengo et al., 2017). While people's stated preferences can shed light on the thought processes and motivations behind a decision, they may differ from actual behaviour (Kroes and Sheldon, 1988; Wardman, 1988). This highlights the importance of using revealed preference data to analyze skiing behaviour. Compared to qualitative studies on decision-making that use stated preference methods, quantitative studies that analyze and monitor behaviour – and particularly detailed spatio-temporal behaviour – through real-world observations are less common. To date, studies of base rate have only analyzed temporally aggregated data at a small number of locations with no intent of predicting future activity rates. Zweifel et al. (2006) quantified backcountry recreation by using a registration board and automated measuring stations to count backcountry skiers at four different sites in Davos, Switzerland. A similar study was recently carried out in Norway by Toft et al. (2025), where automatic stations measuring the signal of avalanche transceivers carried by skiers were installed. Although results of such studies are promising and serve as potential ground truth data, they are only suitable for small-scale studies as they are resource intensive in terms of materials, personnel and budgets. Additionally, they typically only provide information about those accessing an area, but not about where they go. Exploring methods that can be employed on a larger scale, Toft et al. (2023) used telecom network signalling data to quantify backcountry recreation in Norway. However, they found that the positional accuracy of the data product provided by a Norwegian telecom company was insufficient, and distinguishing between backcountry recreationists and individuals on streets or in residential areas was impossible. Contrasting results were found by Francisco et al. (2018) in Andorra, where the authors successfully used telecom data to study backcountry skiing dynamics under different avalanche and weather conditions, claiming a positional accuracy of 150 m. Further research is needed to evaluate this data in different regional contexts. In another approach, Techel et al. (2015) used UGC in the form of written text reports of tours uploaded to two popular mountaineering platforms in Switzerland. They analyzed spatio-temporal patterns in the Swiss Alps and related them to avalanche accidents, showing that the risk of having an accident was strongly influenced by avalanche danger level and snow cover but was not congruent with the areas hosting most backcountry activity.
With growing public access to cheap GPS devices, mostly integrated in mobile phones, studies making use of recorded GPS data from backcountry skiers have become more popular (e.g., Bielański et al., 2018; Degraeuwe et al., 2024; Taczanowska et al., 2017). GPS data are often collected in traditional study settings, where researchers actively obtain data from voluntary participants, often alongside surveys (e.g., Hendrikx et al., 2018, 2022; Johnson and Hendrikx, 2021; Sykes et al., 2020; Toft et al., 2024; Ahonen et al., 2024; Sykes et al., 2025). Participants are generally aware of, and potentially motivated by the study’s purpose. Such studies rely on resource-intensive recruitment processes and the willingness of volunteers to contribute their time and effort, resulting in a limited sample size. A less expensive way to gather GPS data is through social media or social fitness platforms such as Strava or Skitourenguru (Wood et al., 2013; Schmudlach and Eisenhut, 2024; Toft et al., 2024). If GPS data is acquired from such platforms, it can be considered as UGC, where individuals and their motivations, and therefore potential sampling biases, are largely unknown to researchers (Mashhadi et al., 2020). GPS data in backcountry skiing research can shed light on decision-making processes related to different terrain, but also to estimate exposure or base rates of skiing activity. Toft et al. (2024) suggest that the forecast avalanche danger may not affect people's decision to go outdoors, but their decision on where to go. This is in line with Winkler et al. (2021), who showed that people ski on less serious terrain when the avalanche danger is heightened. However, there are other factors beyond the avalanche forecast that influence behaviour, most obviously in the form of the weather forecast, with Ahonen et al. (2024) finding that almost all skiers assess a weather forecast when preparing for a trip. This calls for further examination of different factors that influence skiing activity to eventually estimate activity base rates.
A potential way of exploring behaviour is through the use of online engagement data, which has been widely used in marketing and search engine optimization (Joachims, 2002; Bucklin and Sismeiro, 2009; Akter and Wamba, 2016). Such data sources have more recently started to play a role in environmental science, leading to the development of conservation culturomics – where online data, such as Google Trends or Wikipedia data, are employed to study human-nature interactions (Ladle et al., 2016; Mittermeier et al., 2021). Online data are also a form of revealed preference data which have been shown to correlate with observations – for example in the case of visits to protected areas (Tenkanen et al., 2017) or, more controversially, Google flu trends (Kandula and Shaman, 2019).
Our study consists of the following steps (see Fig. 1):
-
We use two different user-generated revealed preference datasets as a proxy for backcountry skiing activity: recorded GPS tracks and online click data from a backcountry skiing web platform. Through correlation analysis, we assess if and how well both proxies align.
-
Based on a literature review, we identify suitable variables to predict backcountry skiing activity.
-
Using these variables, we train two models. The track model performs a binary classification of absence and presence of activity, while the click model performs a regression estimating the level of potential activity.
-
The two models are evaluated and discussed in terms of their performance and the importance of the predictor variables. Further, we assess how different variables impact skiing activity and predict activity for different scenarios.
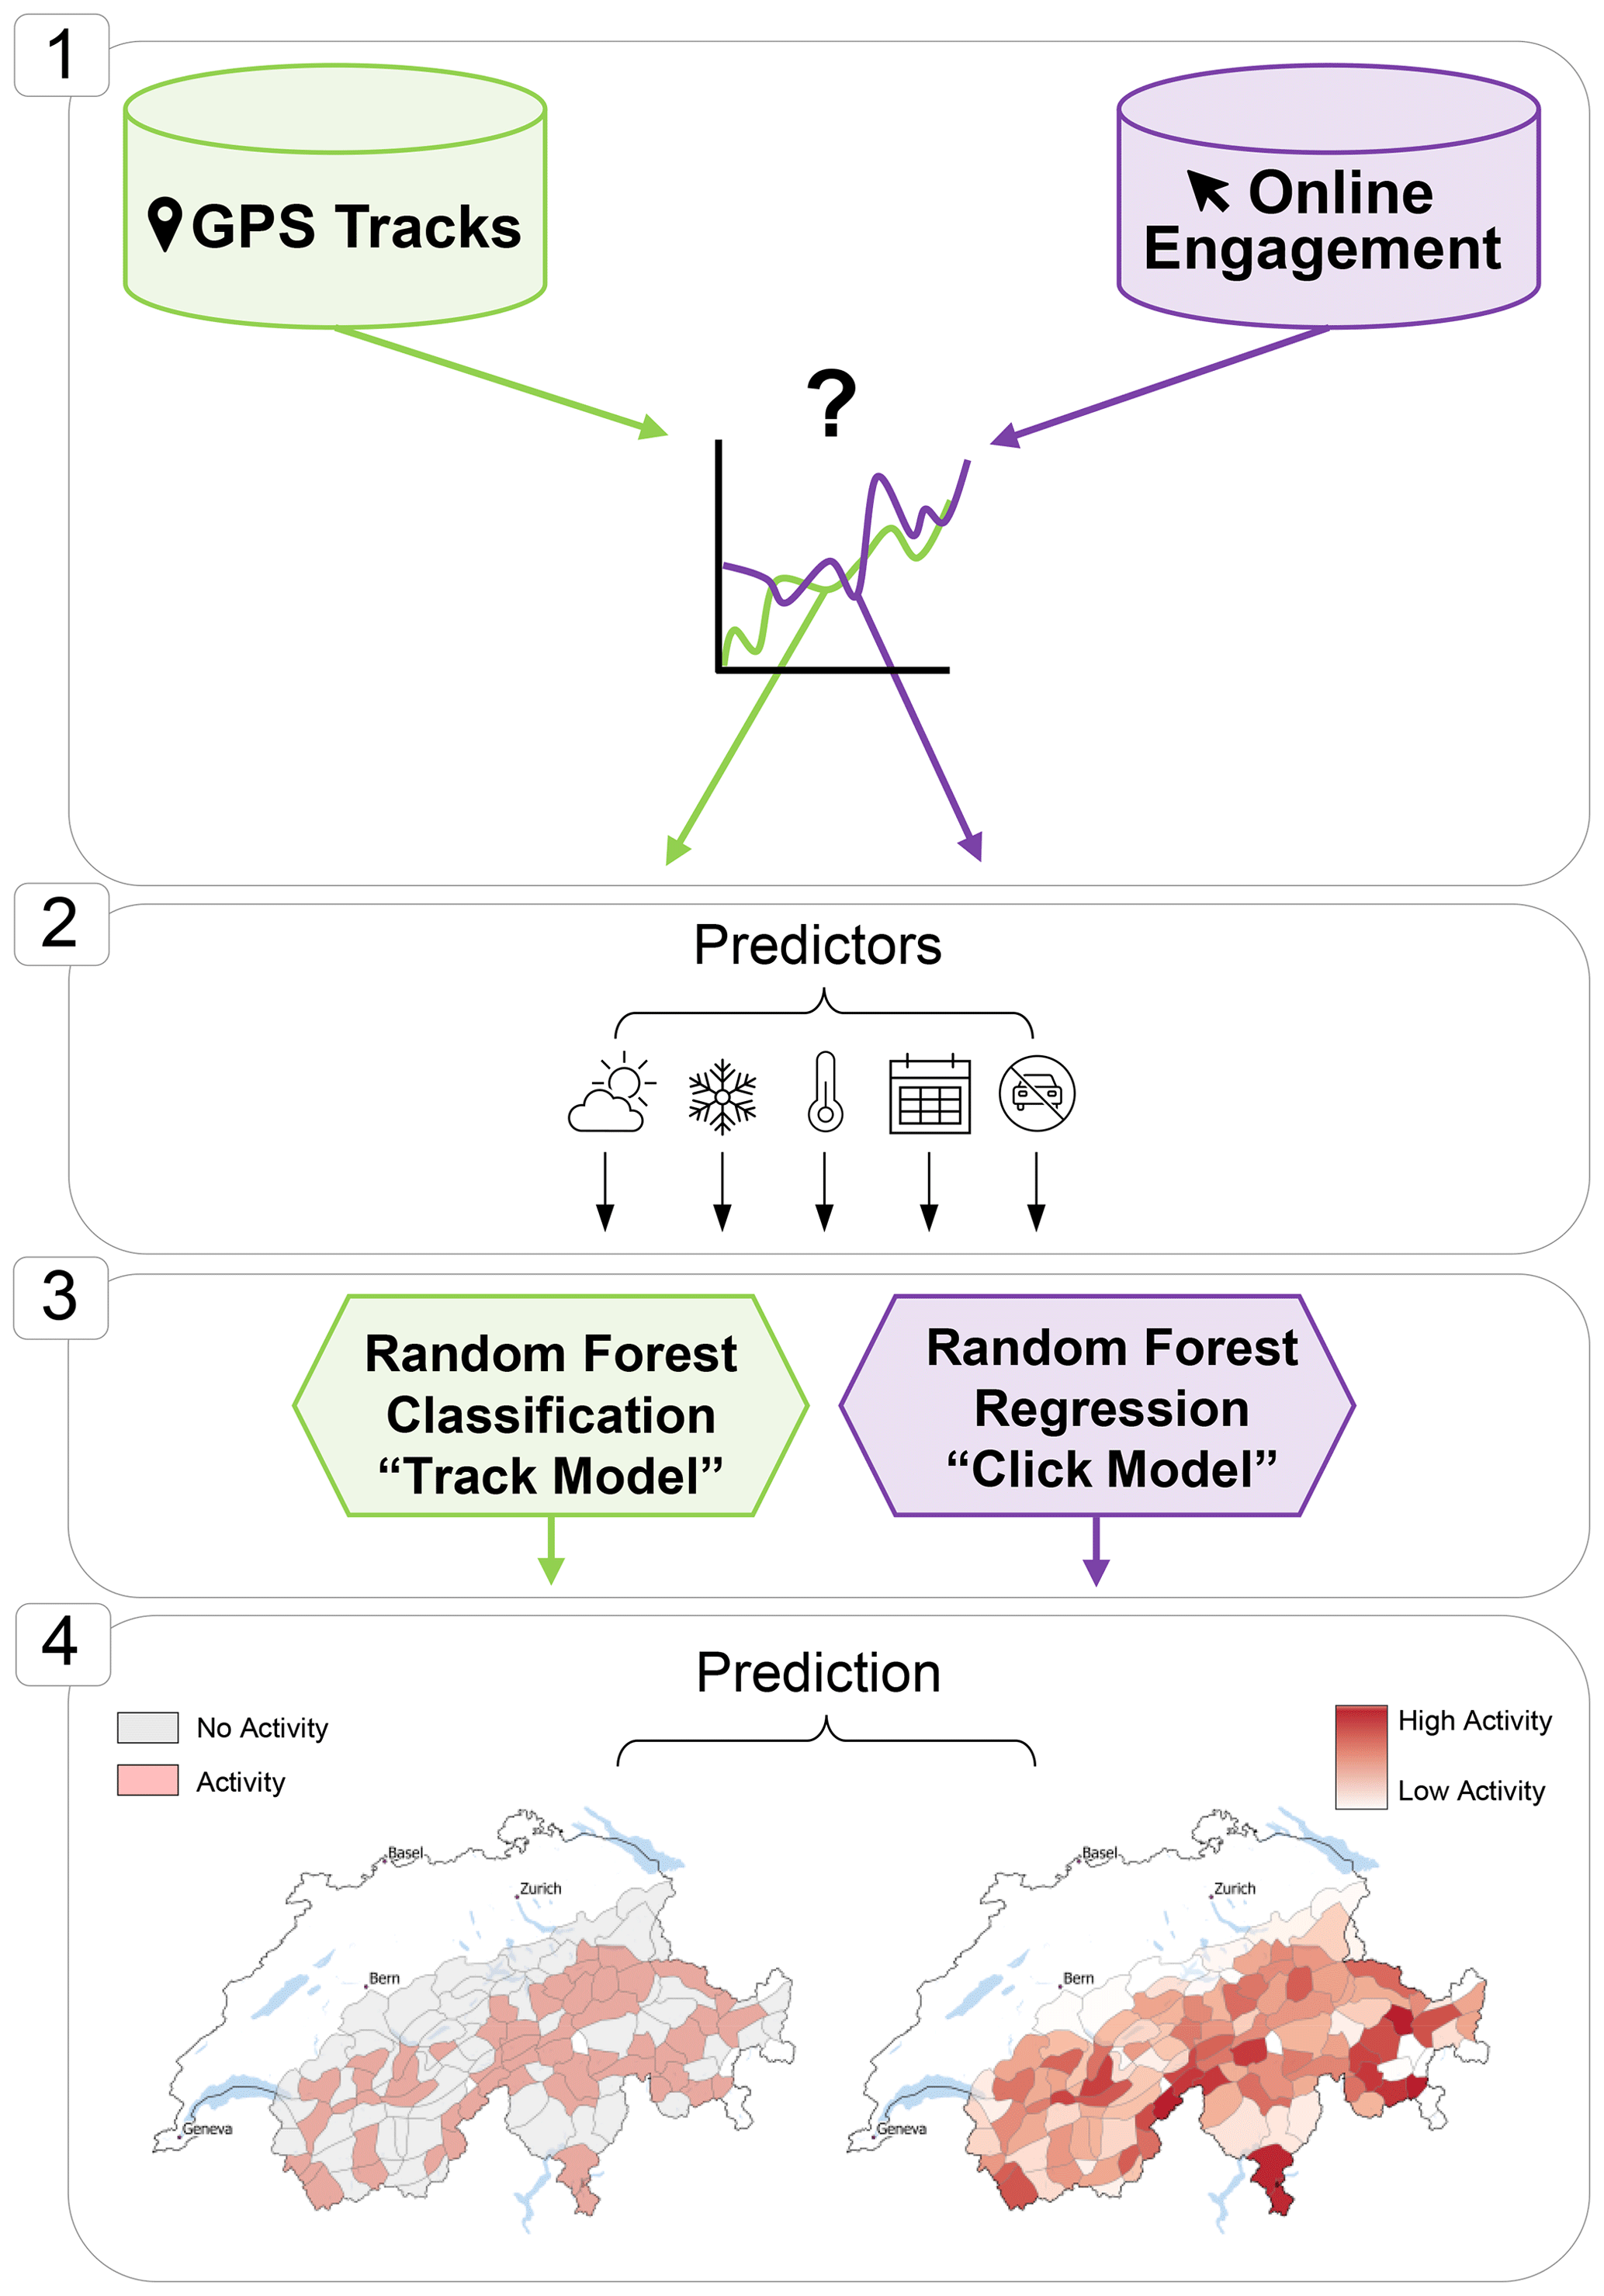
Figure 1Methodology overview with (1) data, (2) predictors, (3) models and (4) predictions.
3.1 Study Area
The study area covers the Swiss Alps, including Liechtenstein, with roughly 26 000 km2 (Fig. 2a). It is mountainous, with 50 % of the area above 1500 m. Large parts of the Alps are prone to avalanche danger due to steep terrain in combination with substantial amounts of snow. The backcountry skiing season usually lasts from December until April or May.
The Swiss Alps and Liechtenstein are split into 128 warning regions to communicate avalanche conditions in the avalanche forecast published daily during winter by the WSL Institute for Snow and Avalanche Research SLF (Fig. 2a). These warning regions are the smallest spatial units for which avalanche danger forecasts are issued. We limited the study to Switzerland and Liechtenstein to ensure a consistent use of forecast avalanche danger levels, as there are some inconsistencies in how avalanche danger levels are used in different Alpine countries (Techel et al., 2018).
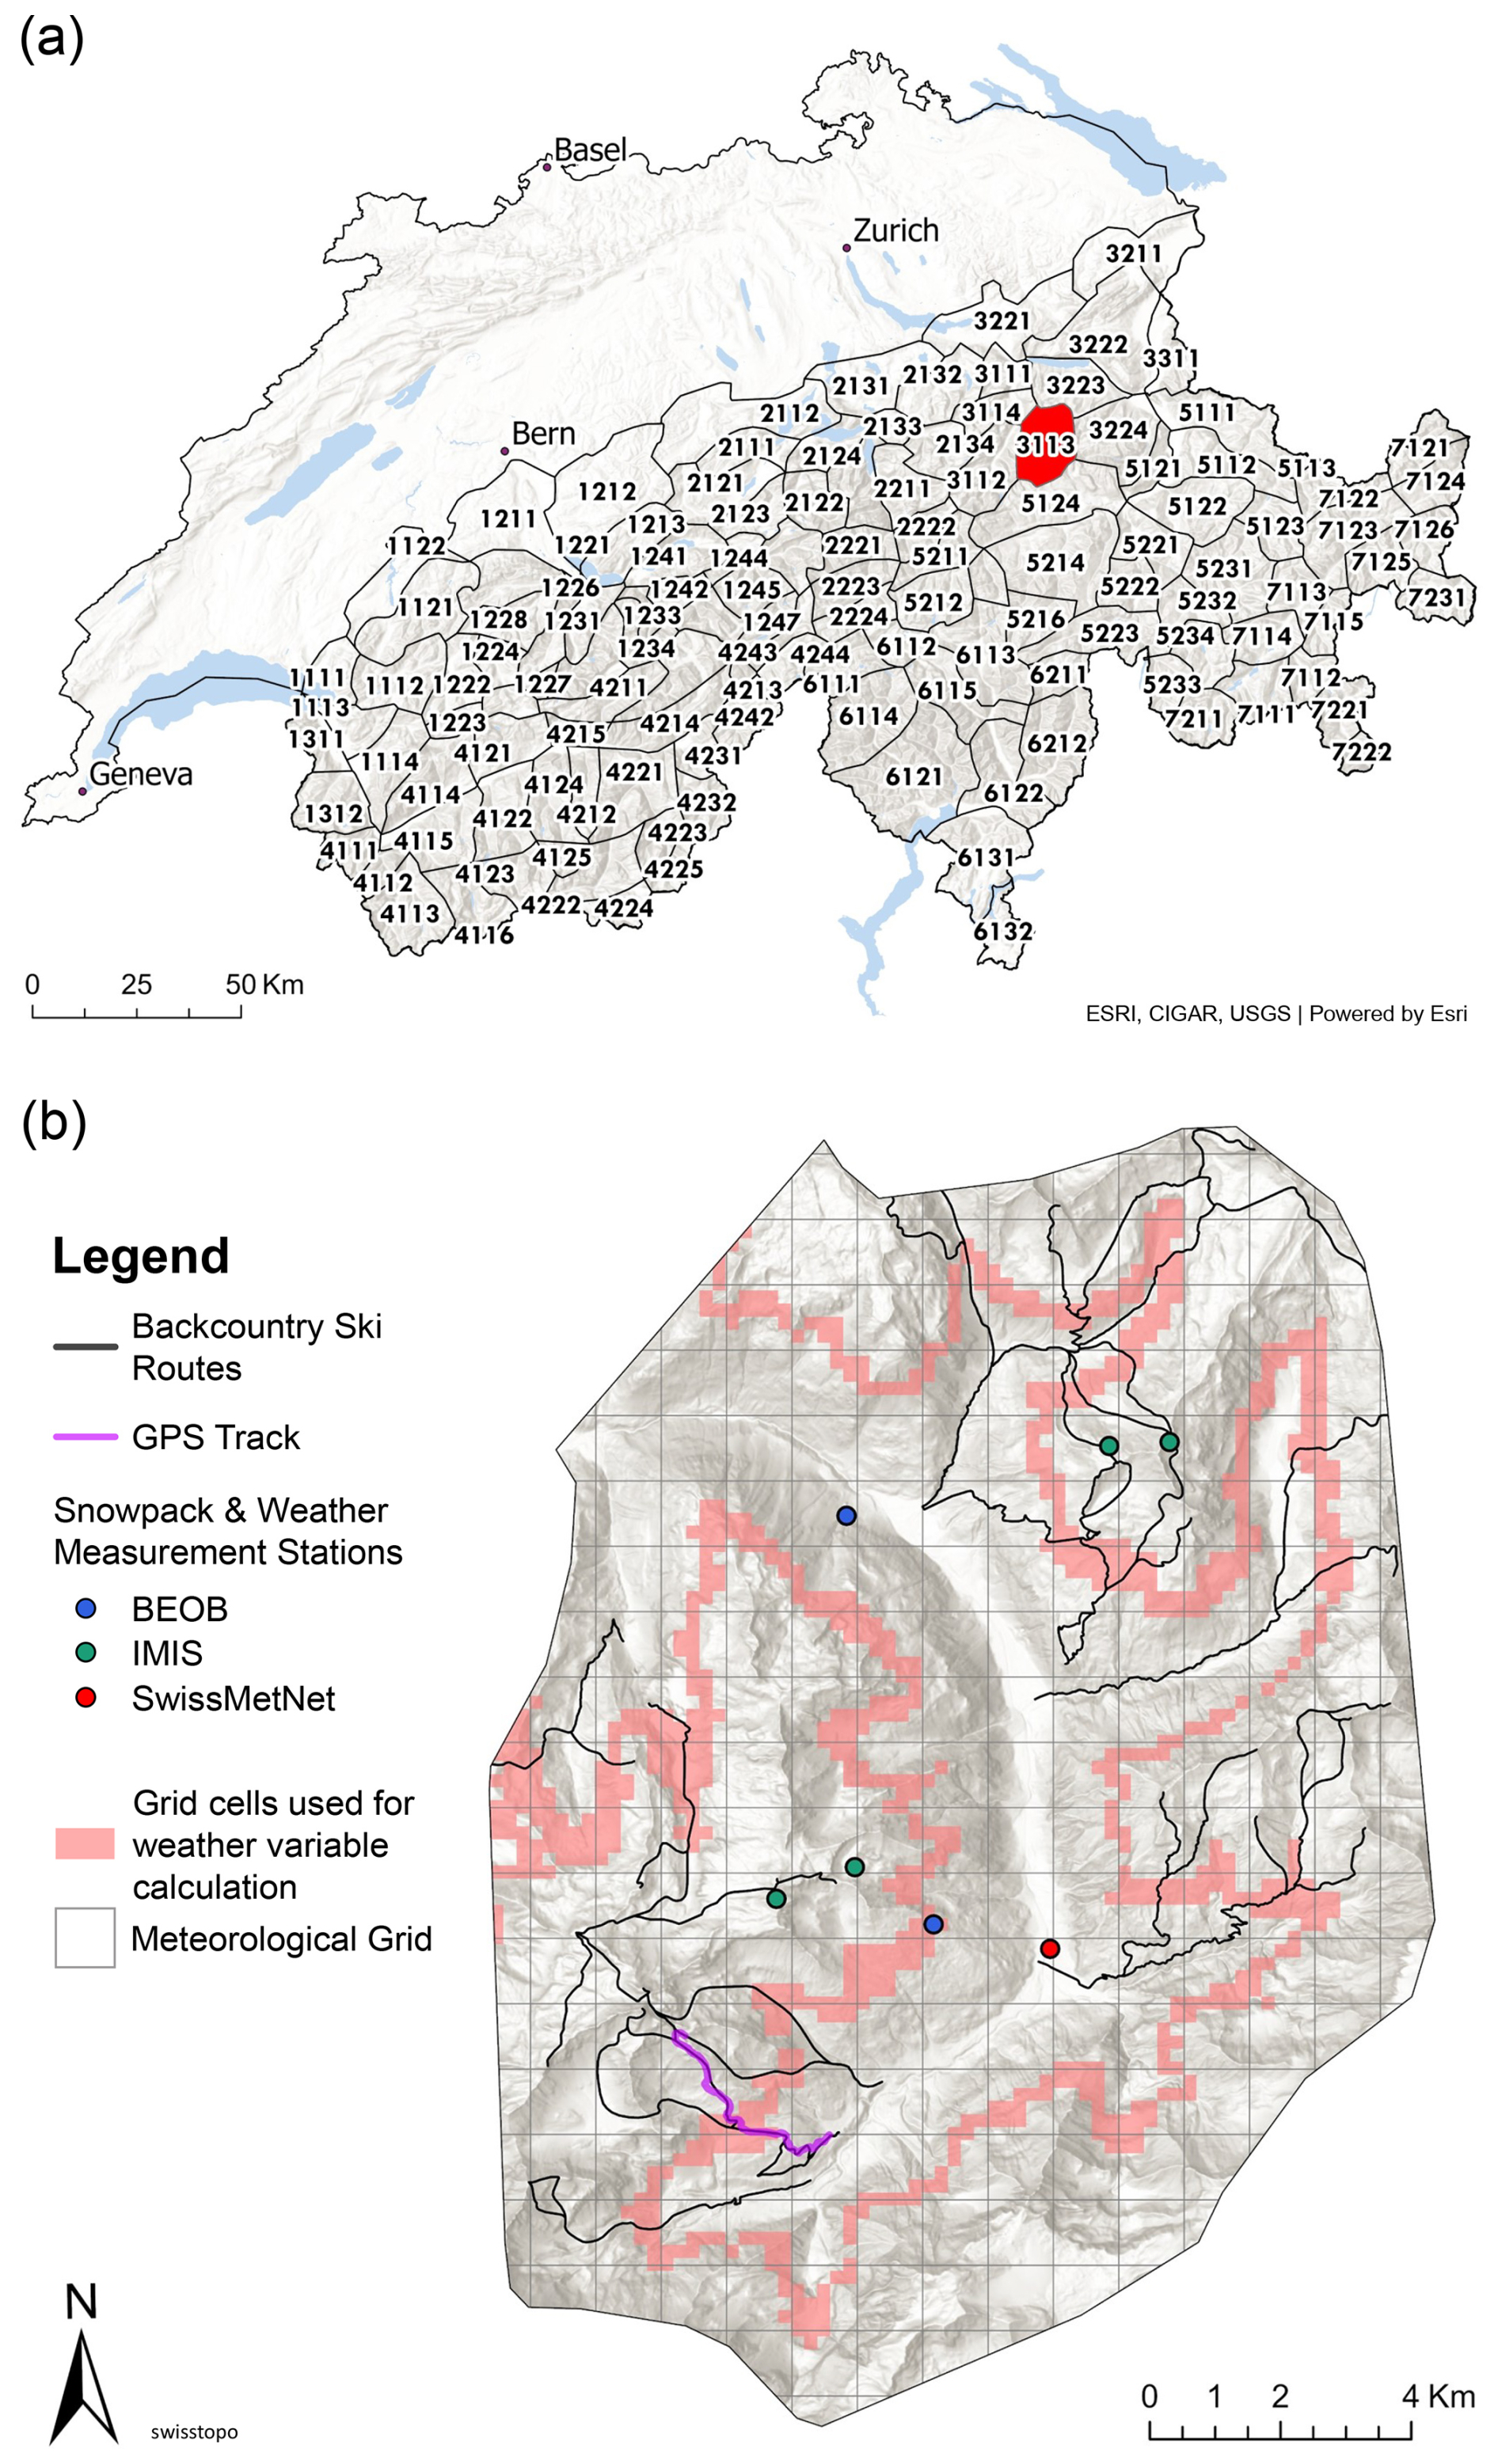
Figure 2(a) Map of Switzerland showing 128 Alpine warning regions, the smallest spatial units used to communicate avalanche danger in the avalanche forecasts in Switzerland. Each region is labelled with its respective warning region code (WRC). (b) Example region 3113, highlighted in panel (a), showing weather stations (SwissMetNet), snow measurement stations from automatic measuring stations (IMIS) and from manual measuring stations (BEOB), backcountry ski routes featured on https://www.skitourenguru.com/ (last access: 26 February 2026), one example GPS track before obfuscation, the elevation belt used to calculate meteorological variables by averaging all grid points that lie within, and the grid showing the spatial resolution of meteorological data. To obfuscate exact GPS locations, each GPS track has only the warning region code (3113 in this example) as spatial reference.
3.2 Data
3.2.1 Skitourenguru
Skitourenguru (https://www.skitourenguru.com/) is a popular online service that supports backcountry skiers in the selection and planning of suitable backcountry trips. It provides avalanche risk assessments for thousands of predefined backcountry ski routes across the Alpine region using an algorithm, which processes information from the current avalanche forecast and terrain characteristics (Schmudlach and Köhler, 2016; Schmudlach and Eisenhut, 2024). The website is freely accessible to all users and does not require a registered account. Users can search for ski routes based on criteria such as travel distance from home, elevation gain, route difficulty, or avalanche risk. Additionally, users who have registered for a free account can upload GPS tracks of their own tours (Schmudlach and Köhler, 2016). Both datasets used in this study were collected by Skitourenguru GmbH and are introduced in the subsequent sections.
3.2.2 GPS tracks (Track data)
Between 2013 and 2024, over 6800 GPS tracks were sampled from the platforms https://www.skitourenguru.com/, https://www.gipfelbuch.ch/ (last access: 26 February 2026) and https://camptocamp.com (last access: 26 February 2026) (Schmudlach, 2022). The GPS data cover 9 winter seasons and 126 out of 128 Alpine warning regions, though many warning regions only contained a few tracks over the whole study period. On average, roughly 770 tracks were recorded in each season without a noticeable trend over time. Skitourenguru and Gipfelbuch are mainly used by German-speaking recreationists, while camp2camp is predominantely used by French- and Italian-speaking recreationists (Techel et al., 2015). By using all three we ensure coverage of German, French and Italian speaking regions of Switzerland. On these websites, users with a free account can post GPS tracks and condition reports of ski tours and other outdoor activities. These posts are visible to anyone visiting the websites. As the data was sampled manually by Skitourenguru GmbH, there are two data gaps in seasons 2021/22 and 2022/23 and there is no user information, such as a user ID, available. Although this dataset only represents a small fraction of real-world skiing activity, it reflects a user-base from different websites and language-regions.
This dataset has been previously used to study avalanche risk taken by backcountry skiers under different avalanche conditions (Winkler et al., 2021; Degraeuwe et al., 2024; Schmudlach et al., 2018). To preserve privacy, the coordinates of the GPS tracks were aggregated to the spatial granularity of warning regions and timestamps to 1 d (obfuscation). Figure 2b shows one example GPS track before obfuscation. After obfuscation, each track is represented by a single data point, holding information about the warning region, the mean elevation of the track and the date it was carried out.
3.2.3 Online engagement (Click data)
On Skitourenguru, engagement data is collected by logging clicks on pre-defined ski routes (see Fig. 2b). This dataset contains over 8 million clicks on 2666 unique ski routes covering 122 of the 128 warning regions and a time period of 9 years between 2015 and 2024. Since 2017, clicks have been associated with a unique ID, which is retained as long as browser history or cookies are not cleared. We used these unique IDs to estimate the number of users (570 000) and the average distance between clicked routes per ID and day (15 km) to account for users clicking on multiple tours during trip planning. As the distance was smaller than the average warning region size, we assumed that the clicks typically fall within the same region and do not cause spatial distortion.
Every click can be related to exactly one geo-referenced route, from which terrain characteristics and the warning region can be inferred. Analogous to the GPS tracks, all clicks are aggregated to the spatial level of warning regions and to daily intervals. After the re-design of the website in 2020 and the related connection to other websites such as the website of the Swiss Alpine Club (SAC), the popularity of the website and the number of resulting clicks increased greatly. Due to this increase, data before and after 2020 are difficult to compare. Therefore, only data from the season 2020/2021 onwards is included for modelling and prediction, which results in ≈ 7.3 million clicks and represents 90 % of the initial dataset. However, all click data is used for the correlation analysis of GPS tracks and clicks to maximize temporal overlap between both data sets.
3.3 Correlation Analysis
Click data differ from track data in that we assume they reflect real world planning or potential behaviour rather than actual skiing behaviour. The baseline assumption linking click and track data is that a click on a specific tour is indicative of activity on the same tour in the days that follow. To test this hypothesis, we examined the correlation between clicks and tracks over seven different winter seasons, considering time lags ranging from 0 to 4 d.
Given the obfuscated nature of the data and the sparsity of track data at the level of individual warning regions, we aggregated and counted both track and click data over the entire study area for each day. The relationship between daily track and click counts was quantified using Spearman's rank-order correlation coefficient (ρ), a non-parametric measure of association (Dodge, 2008). Correlations were calculated separately for winter seasons to account for inter-seasonal differences.
3.4 Prediction Model
3.4.1 Variable Selection
The variables used to predict skiing activity are linked to the four factors that contribute to avalanche release as introduced in Sect. 2, as well as by a literature research in the domain of outdoor recreation and specifically backcountry skiing. A list of all variables, a short description and the data source they were derived from, can be found in Table 1.
MeteoSwiss (2021c)Rutty and Andrey (2014)MeteoSwiss (2021a)Verbos et al. (2018)MeteoSwiss (2021d)Wegelin et al. (2022)MeteoSwiss (2021e)WSL Institute for Snow and Avalanche Research SLF (2024)King et al. (2014)Intercantonal Measurement and Information System IMIS (2023)Hendrikx et al. (2022)WSL Institute for Snow and Avalanche Research SLF (2023)Furman et al. (2013)Intercantonal Measurement and Information System IMIS (2023)Ingold (2005)Federal Statistical Office(BFS) (2022)Koppen et al. (2014)Federal Statistical Office(BFS) (2022)Olson et al. (2017)Federal Office of Topography(swisstopo) (2024)Schirpke et al. (2018)Federal Office of Topography(swisstopo) (2024)Willibald et al. (2019)Bundesamt für Umwelt BAFU (2025)King et al. (2014)Madden et al. (2023)Techel et al. (2014)Table 1Initial variables used to model backcountry skiing activity. For each variable, the data source, a short description and literature based on which the variable was chosen is presented. Variables that were used for the final model are marked in bold.
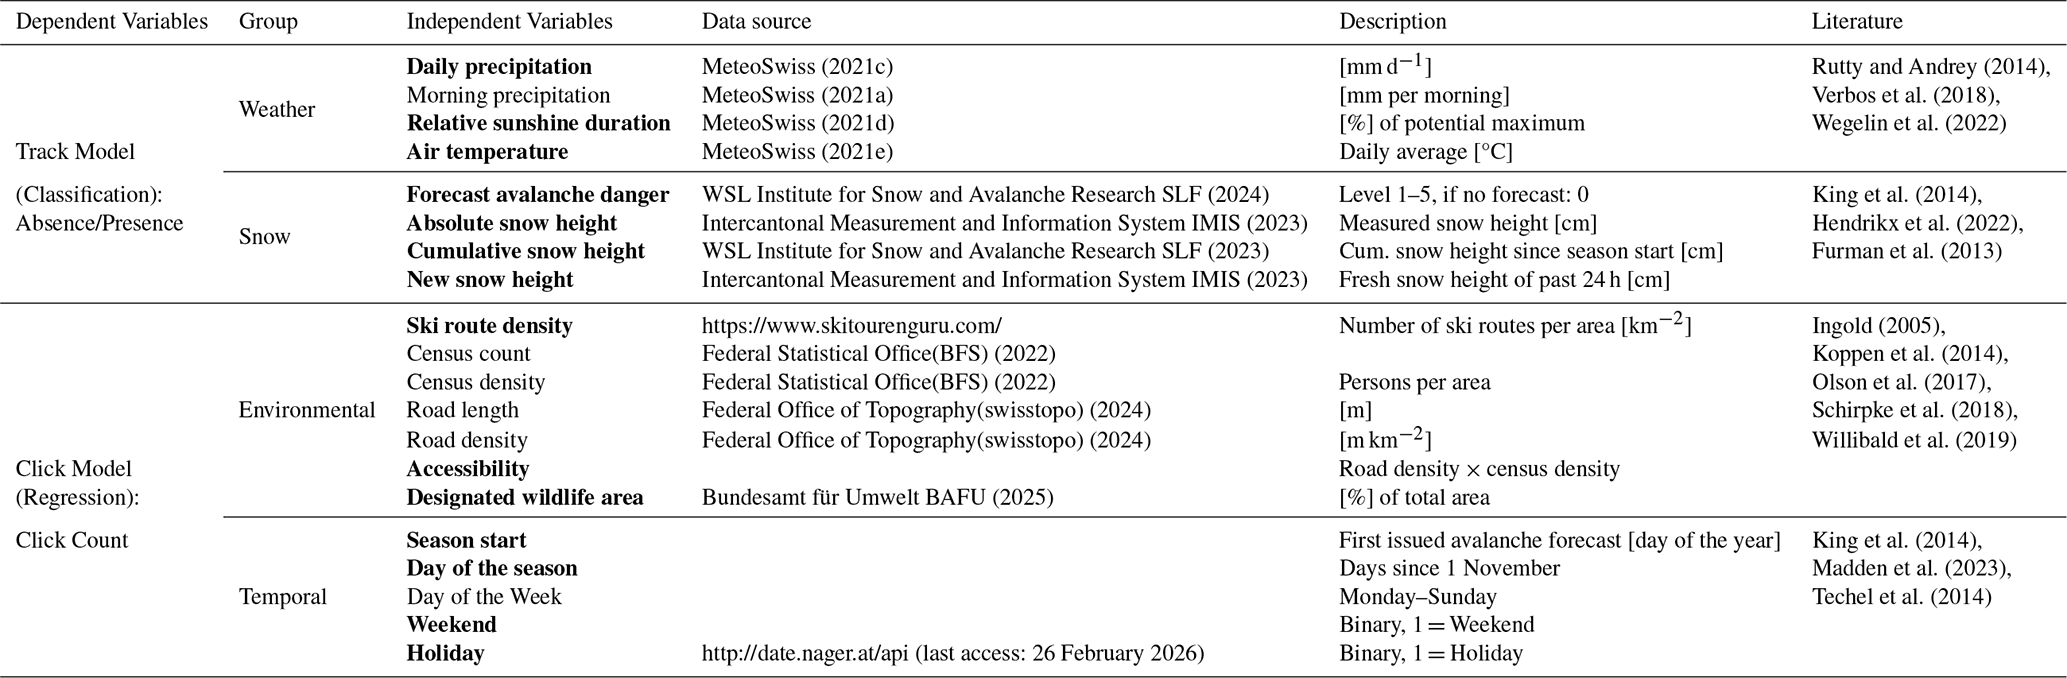
The selected variables can be divided into three temporally and spatially dynamic categories (weather, snow, temporality) and one spatially variable category (environment) (Table 1), which reflect the different sides of the avalanche triangle. Weather and snowpack are directly represented by weather variables and snow variables. Terrain suitability is represented by environmental variables. Finally, patterns of human behaviour are captured through environmental and temporal variables, reflecting preferences related to accessibility, weekdays, holidays and seasonality.
There is rich literature on the importance of weather variables for outdoor activities (Verbos et al., 2018; Wegelin et al., 2022). For instance, Rutty and Andrey (2014) found that virtually all skiers access a weather forecast when planning a tour and that it can even deter them from ultimately going outside. Further, temporal variables relating to weekday, holiday and seasonality are often used for predicting behaviour in recreation and tourism and have shown to be an important driver for backcountry usage patterns (King et al., 2014; Madden et al., 2023; Techel et al., 2014). Snow conditions and the avalanche forecast are crucial for backcountry skiing and play an important role in the decision-making process. They can sometimes deter people from undertaking backcountry skiing trips, for instance when avalanche conditions are expected to be dangerous (Furman et al., 2013; Hendrikx et al., 2022; Marengo et al., 2017), while also enhancing activity due to the desire to ski an untracked slope of fresh snow, which is for many skiers the ultimate goal of a ski tour (Furman et al., 2010). Accessibility is a pre-requisite for recreation which is commonly used to predict recreational activity or recreation supply, and is a crucial factor for terrain-selection of backcountry skiers (Koppen et al., 2014; Olson et al., 2017; Schirpke et al., 2018; Willibald et al., 2019). Further, recreational activities can significantly disturb wildlife, the existence of protected zones therefore influences the regions where backcountry activities are undertaken (Ingold, 2005; Lesmerises et al., 2018; Müllner et al., 2004).
3.4.2 Variable Calculation
The clicks and the GPS tracks have the same spatial (warning regions) and temporal (daily) resolution. Both datasets were enriched with the predictor variables aggregated to these resolutions.
Meteorological variables were derived from gridded datasets interpolated from SwissMetNet Stations (MeteoSwiss, 2021b, 2026). We used daily average temperature, the daily relative sunshine duration and the daily precipitation sum. Meteorological variables vary according to topographic elevation (Scherrer and Appenzeller, 2014; Spreafico and Weingartner, 2005). Since backcountry skiing usually takes place at higher elevations within a region, mean values for precipitation and sunshine duration were calculated based on the grid points that lie in an elevation band within ±100 m of the mean track elevation for the track data, respectively the mean route elevation in a given region for the click data (Fig. 2b). To account for the snow fall line, we used the elevation belt around the minimum elevation, which is generally the warmest part of the tour, for the temperature calculation. Daily measurements of new snow and absolute snow height were available for 226 automated (IMIS) and 126 manual measuring stations (BEOB) (WSL Institute for Snow and Avalanche Research SLF, 2023; Intercantonal Measurement and Information System IMIS, 2023). Most of the stations are concentrated in inner-Alpine regions, therefore some warning regions at the Alpine edge contain few or even no measuring stations. Further, some stations contain substantial measurement gaps. Due to the broad spatial resolution to which variables needed to be generalized, a spatial interpolation of the measurements would have been unnecessarily complex. Therefore, we opted to use the mean of the five nearest measuring stations for each warning region. If more than five stations lay within a region, those with the smallest elevation difference from the mean ski track elevation were selected. Further, we used the daily forecast avalanche danger communicated through the 5-level danger scale (1 = low, 2 = moderate, 3 = considerable, 4 = high, 5 = very high) as published by the WSL Institute for Snow and Avalanche Research SLF. For the remaining variables, we calculated road density by dividing total length by area, ski route density by dividing the number of ski routes per area, census density by dividing total number of inhabitants by area, accessibility by multiplying road density and census density (e.g., Stahl Olafsson et al., 2022) and we used the proportion of protected wildlife area per warning region. Season start was determined using the first day of the season on which an avalanche forecast was issued and we used day of the season as the number of days since 1 November, to allow comparison between seasons. Finally, for holidays we included all Swiss National holidays, as well as single days between public holidays and weekends (commonly referred to as “bridge days”), as well as the week between Christmas and New Year (see Appendix A for a complete list).
3.4.3 Model Building
Different models can be used for prediction tasks, such as fully explainable, linear models (e.g., GLM/GAM: Willibald et al., 2019), partially explainable machine learning models (e.g., random forests: Minehart et al., 2024) and deep learning models (e.g., neural networks: Loumiotis et al., 2018). Choosing the right model involves trade-offs: while more complex models like machine learning or deep learning models can better capture non-linear relationships, they are harder or even impossible to interpret. Simpler models on the other hand offer a high level of interpretability but have limited power with non-linear and potentially correlated data. Considering the characteristics of our training data, which is noisy, non-linear, inter-correlated and relatively small in size, we chose to use random forests.
Random forests have proven to be an efficient and effective tool to predict visits to outdoor recreation areas (Madden et al., 2023) or map recreational ecosystem services (Manley and Egoh, 2022; Nyelele et al., 2023). They have a number of advantages in that they are well suited to non-linear and correlated data and agnostic with respect to data types such as numerical and categorial data (Marsland, 2011). Compared to deep learning architectures like neural networks, random forests are however relatively easy to interpret as the algorithm consists of a set of decision trees that make the prediction based on majority voting (Breiman, 2001). Moreover, they provide an estimate of the variable importance as well as of how different values of a variable influence the outcome. In other words, random forests provide a level of interpretability that most other machine learning algorithms fail to provide (Gilpin et al., 2018; Liaw and Wiener, 2002). Additionally, they work well for relatively small and noisy data sets because they are not prone to overfitting due to the large number of trees that are grown (Breiman, 2001).
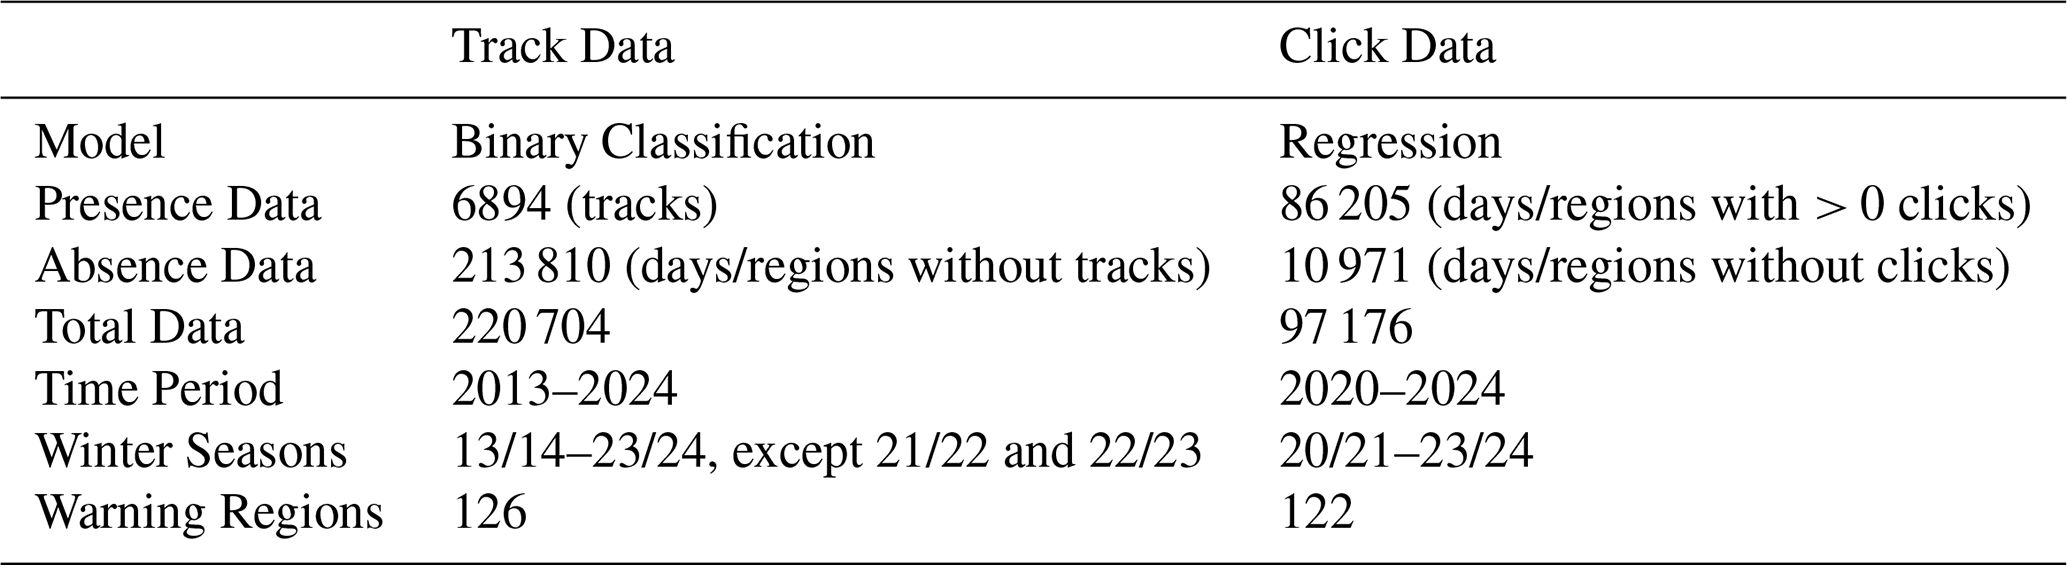
We used the track data and the click data to train two separate random forests using the “randomForest” library in R (Liaw and Wiener, 2002). Because the track data was far less abundant than the click data – many regions only contained a few tracks over an entire season – we used it to train a binary classifier, with “presence” (when at least one track was recorded) and “absence” (when no track was recorded). The click data was used to train a regression model, where the response variable was the daily click count per warning region. Both models had identical spatial (warning regions) and temporal (1 d) resolution. For the remainder of this article we use the terminology “track model” for the binary classification model derived from the GPS track data and “click model” for the regression model derived from the click data.
While correlated variables do not impact the predictive power of a random forest, they can hinder the accurate estimation of variable importance as measured by variable permutation (Darst et al., 2018). Moreover, they may lead to increased computation time without contributing significant additional information. Therefore, a correlation analysis was carried out to exclude strongly correlated variables (r > 0.4). Additionally, variables with near zero importance values were excluded to speed up computation. Further, data points were excluded when they were recorded outside the winter season (June–October), or when no weather or snow data was available for the given day, since random forests do not accept NA values as input. Accordingly, 2.5 % of click data and 1 % of track data was filtered out.
Since both datasets included only presence data, we inferred absence by adding data points for days and regions without clicks or tracks, assuming absence of evidence implies evidence of absence – on the premise that no record signals fewer people in the field. For modelling, we assigned a click count of 0 or a track label “absence” to these generated points.
For the track data, the resulting absence points outnumbered the presence points by a ratio of 30 : 1. Class imbalance is a frequent problem when working with real life data and can be challenging for machine learning algorithms. When fed with imbalanced data, most algorithms fail to yield equally good performances in both the minority and the majority class since, depending on the performance measure chosen, the algorithm prioritizes accuracy of the bigger class (Guo et al., 2008; Krawczyk, 2016). To address this, the two classes were artificially balanced by downsampling the absence class to train the track model. This in turn meant that we expected our model to overpredict presence, since presence counts were artificially inflated.
In typical machine learning applications, training and testing data are created by randomly partitioning the dataset. However, if temporally autocorrelated processes are present, a random split violates the assumption of independence between training and test sets (Otis and White, 1999). Since temporal autocorrelation was clearly present in our data, we used an entire season as the test set while training the model on data from all other seasons. This approach resulted in four training runs, cross-validated with four different winter seasons for the click model, and nine training runs, cross-validated with nine different winter seasons for the track model.
Hyperparameters were fine-tuned using a grid search to find the best possible parameter values for mtry (the number of variables randomly selected at each node of a tree) and sampsize (the number of data points sampled for each tree), which are the most common parameters used for tuning random forests (Figs. S6–S7). As the generalization error generally decreases with a higher number of trees and consequently more trees lead to a more stable prediction, we opted for a forest of 1000 trees for each model (Liaw and Wiener, 2002).
3.4.4 Performance Evaluation
After training the models on click and track data, they were applied to unseen test data, repeating for each cross-validation run. Classification performance was assessed using sensitivity, specificity, balanced accuracy and the Hanssen–Kuipers Skill Score (KSS). Sensitivity and specificity were calculated according to Swets (1988). Balanced accuracy is the geometric mean of sensitivity and specificity and is frequently used when classes are imbalanced (Marsland, 2011). To account for class imbalance, we additionally used KSS, a measure developed in meteorology and suitable for imbalanced prediction problems where the minority class is the focus (Hanssen and Kuipers, 1965; Peirce, 1884; Ebert and Milne, 2022). R2 and RMSE were used to assess performance of the regression model (e.g., Montgomery et al., 2006). Further, we calculated the prediction delta for both models, which we defined as the difference between predicted and observed tracks, respectively clicks to assess the spatial and temporal distribution of errors.
To assess how different variables impact the prediction, variable importance values were calculated using the built-in function for variable importance in the “randomForest” R library (Liaw and Wiener, 2002). Variable importance was calculated using a permutation-based method, measuring the average decrease in model accuracy and therefore predictive power, when a specific variable was excluded. To examine how each variable influenced activity, we calculated permutation-based partial dependency (PD) using the R package “pdp” (Greenwell, 2017). PD isolates a variable’s effect by holding all other variables constant and thereby assessing its impact on the probability for a given outcome of the response variable (Breiman, 2001).
To demonstrate how the models are spatially influenced by altering one variable, we created idealized scenarios where all but one variable was held constant. For each scenario, a reference value was defined, and the variable of interest was systematically altered, while all other variables were fixed at reference values. The resulting differences in model predictions were visualized to highlight the spatial heterogeneity in variable influence. This approach allowed us to map the response of model predictions to changes in individual variables in a spatial context on an exemplary basis.
We structure the results according to the research objectives outlined in Sect. 1. This section presents: (Sect. 4.1) the characteristics of the training datasets used as proxies for backcountry skiing activity, (Sect. 4.2) the importance of different variables for the prediction, (Sect. 4.3) the predictive performance of both models and (Sect. 4.4) the spatial and temporal distribution of errors.
4.1 Correspondence between click and track data
Correlation analysis revealed that a 1 d lag between clicks and tracks exhibits the strongest correlation in all seasons (ρmean = 0.63, p < 0.001), therefore the click dates were shifted by one day for the entire analysis (Fig. 3). Notably, correlation generally increased over time and peaks in season 2023/24. This is likely due to the increasing number of clicks over the years and specifically after 2020.
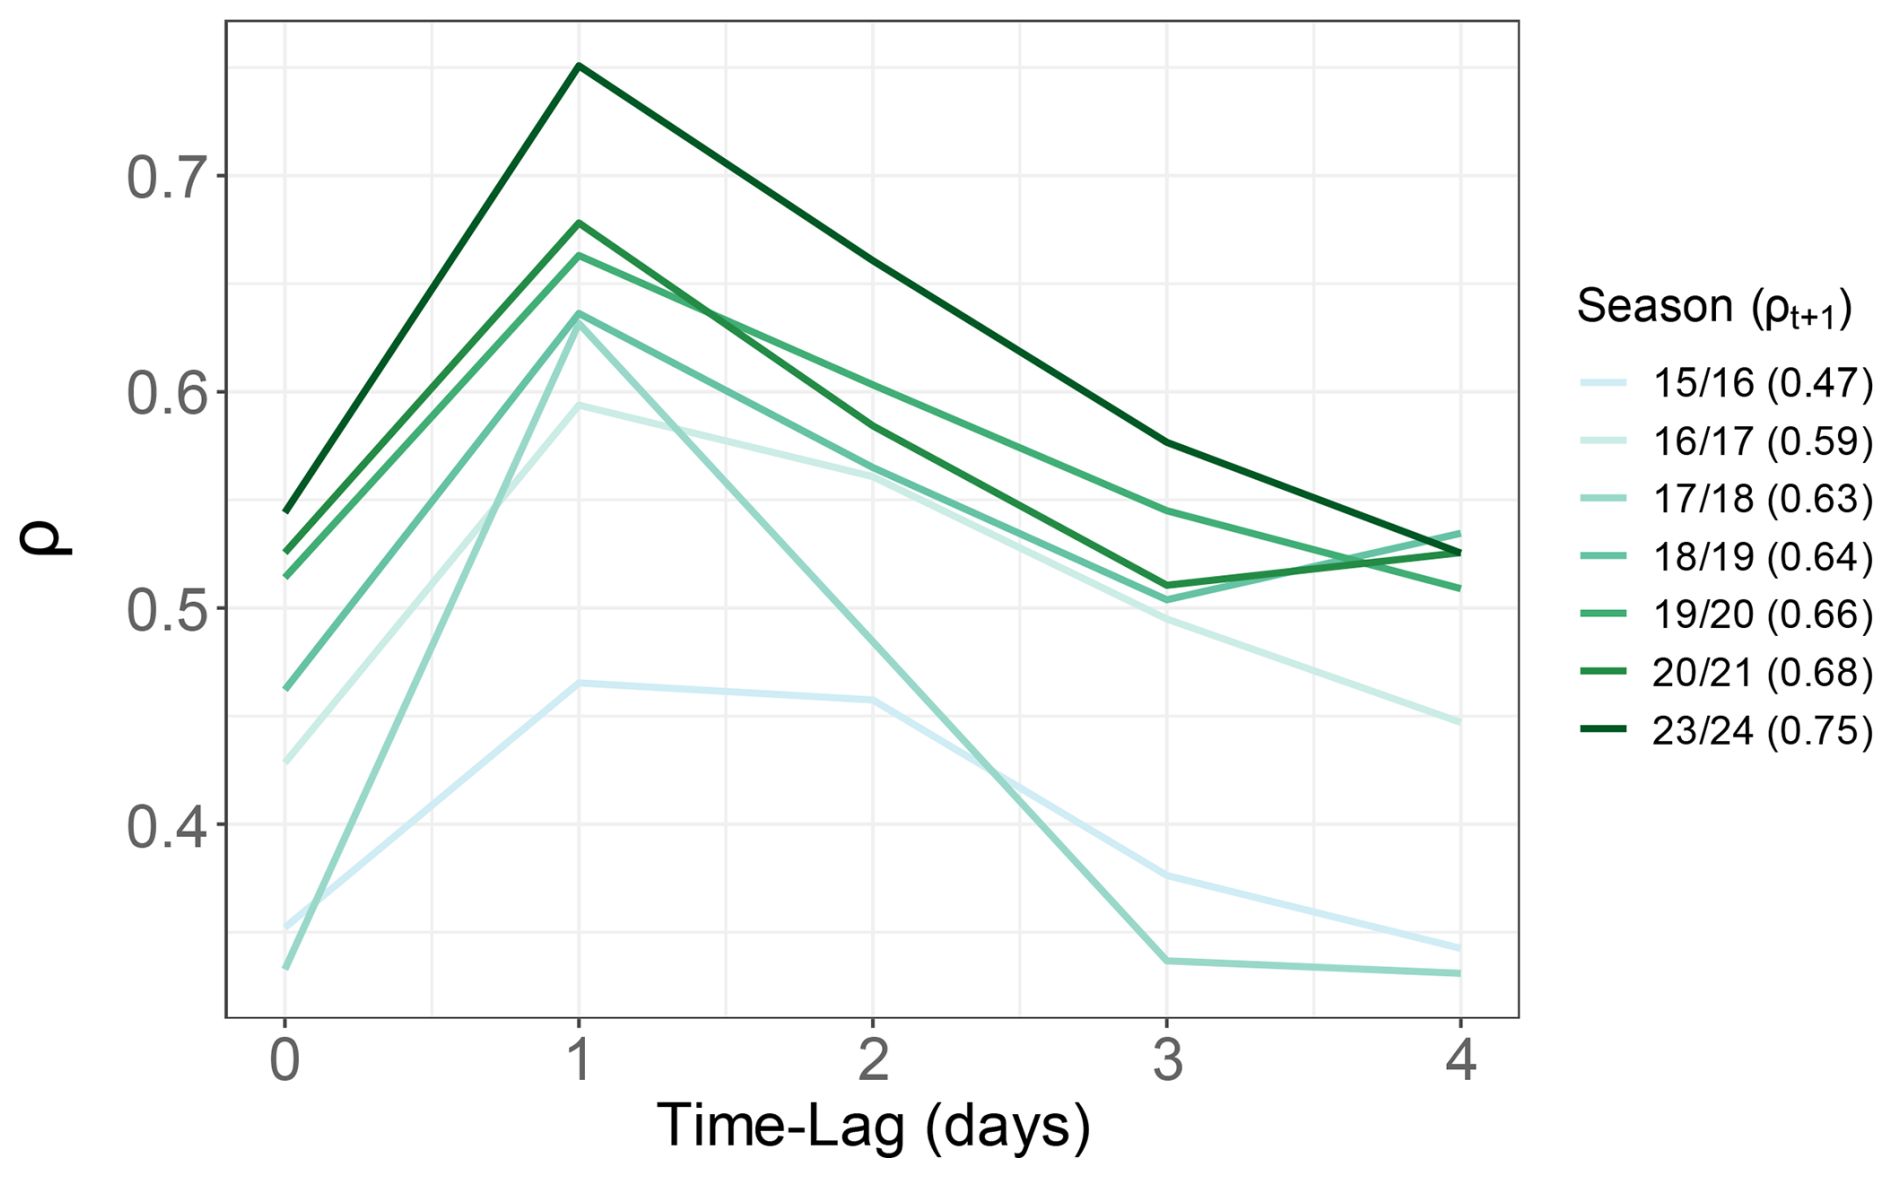
Figure 3Spearman rank correlation (ρ) of daily sums of tracks and clicks with different time lag between both datasets. The time lag represents the number of days by which the click data is shifted, so that date(click) becomes date(click) + time lag. ρ for the 1 d lag is provided in brackets.
On average, 771 GPS tracks were recorded each season in the whole study area. However, there were substantial variations between seasons, e.g., in season 2016/17, relatively few tracks were recorded (528), which can be attributed to an extreme lack of snow in this season (Zweifel et al., 2017). More tracks were recorded on weekends (57 %) and in the second half of the season (61 %), compared to weekdays and the beginning of the season. The tracks were spatially clustered, with 50 % of all tracks recorded in only 21 of the 128 warning regions. Although the click data was denser in both spatial and temporal distribution, it showed similar patterns to the track data. After 2020, on average 1.8 million clicks were recorded per season, but lower click counts were recorded in years with below-average snow conditions (e.g., 2021/22) (Pielmeier et al., 2023). Overall, 38 % of all clicks were recorded for weekends (i.e., on Friday and Saturday considering a 1 d time lag) and 50 % of all clicks were recorded in the second half of the season, indicating that click data was more uniformly distributed over time than the track data. However, similarly to the tracks, clicks were spatially clustered, with 50 % of the clicks recorded in 23 warning regions.
Figure 4 shows daily aggregates of clicks and tracks over the whole study region for two exemplary seasons. Correlation analysis of both time series exhibited correlation coefficients ρ ranging from 0.47–0.75 (ρmean = 0.63) in different seasons (Fig. 3). Visually, the time series aligned relatively well, but the binary track data, unlike the click data, included many days with zero counts producing noisy time series. Peaks in both datasets coincided, but often differed in magnitude. Further, tracks were more concentrated on the weekends, while clicks were distributed more evenly throughout the week, and peaks on the weekends were relatively less pronounced in the click data.
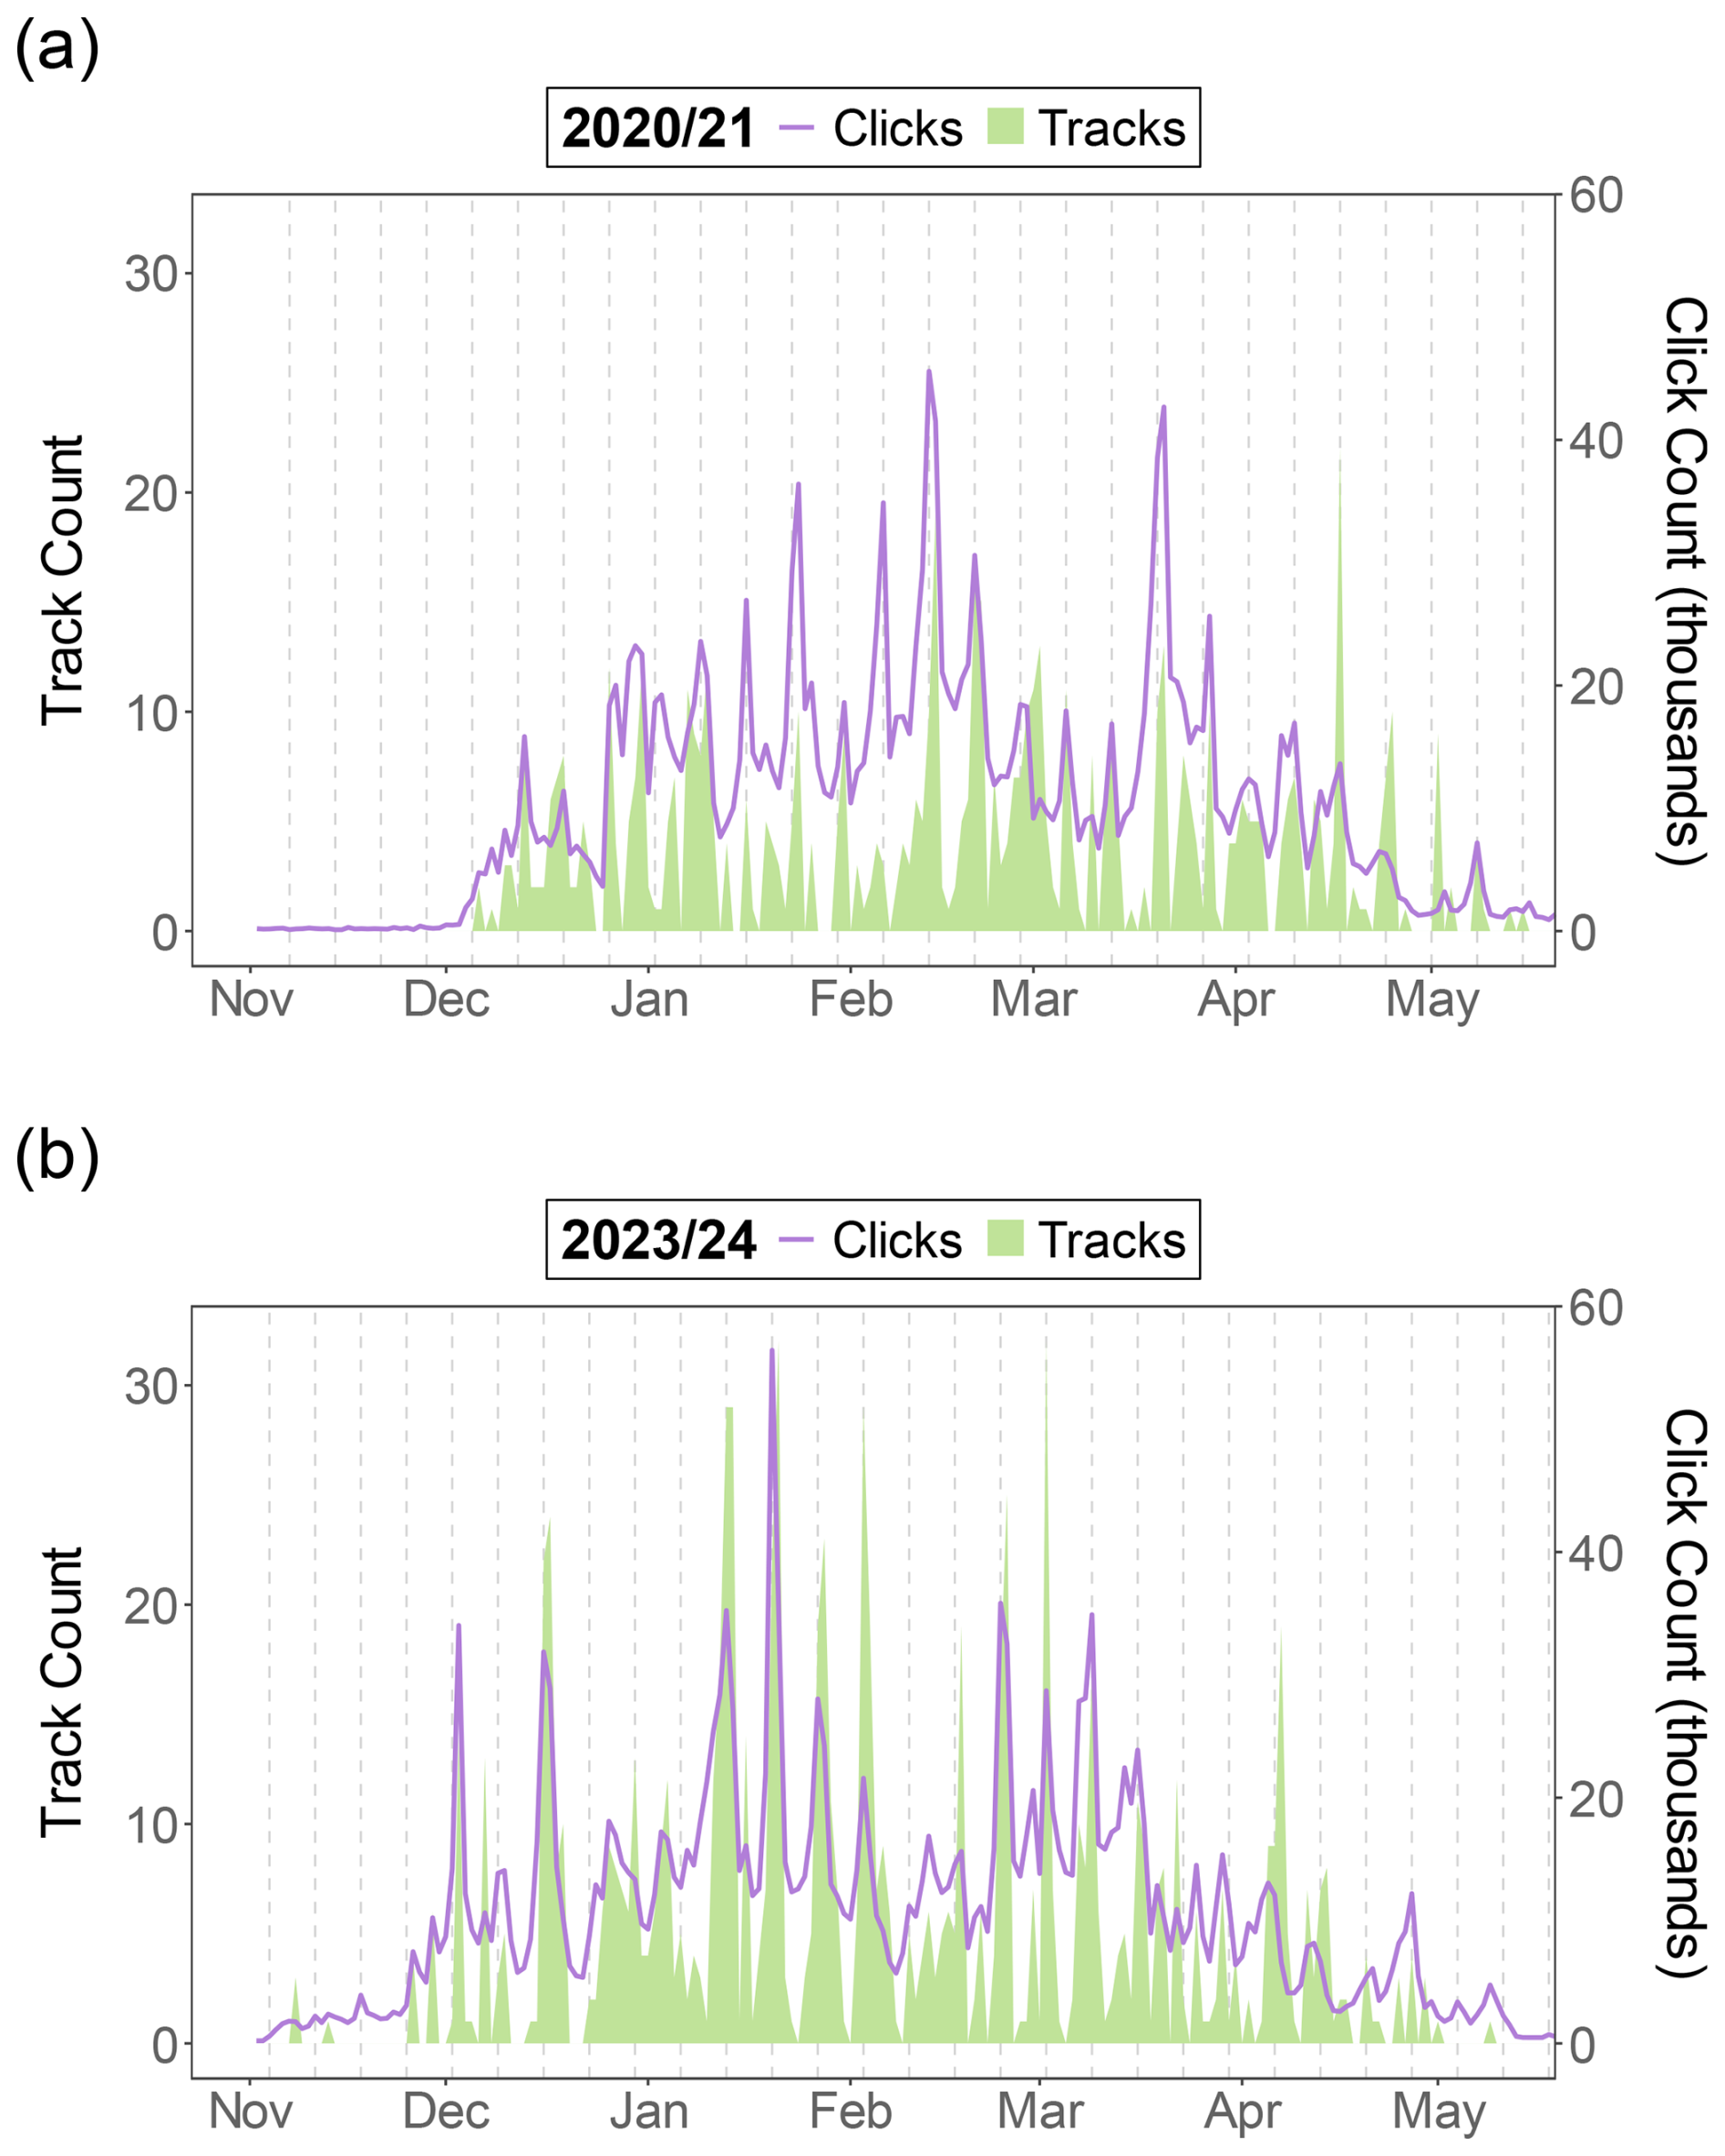
Figure 4Daily click and track counts aggregated across the entire study area. (a) Season 2020/21, correlation coefficient ρ = 0.67 (p < 0.001). (b) Season 2023/24, correlation coefficient ρ = 0.75 (p < 0.001). Click counts were shifted by 1 d and Saturdays are represented as vertical dashed lines.
From a spatial perspective, track and click counts aligned relatively well, especially in the central and northeastern part of the Alps (ρ = 0.3 − 0.66, p < 0.05) (Fig. 5). We observe an interesting trend in the southernmost regions of the Alps (WRC 6131), where the GPS activity is high but the click activity is low. This region is characterized by relatively low but steep mountains, mild temperatures and very little snow, and consequently a lack of mapped ski touring routes. In this case, the rather high GPS activity likely reflects an outlier, driven by a few enthusiastic local users, rather than broader trends in backcountry skiing. In the central Alpine regions however, there is a cluster of regions where clicks are more abundant than tracks. Similar spatial patterns in planned routes were found by Schönenberger et al. (2018) and may simply reflect the popularity of these regions amongst the users of Skitourenguru.
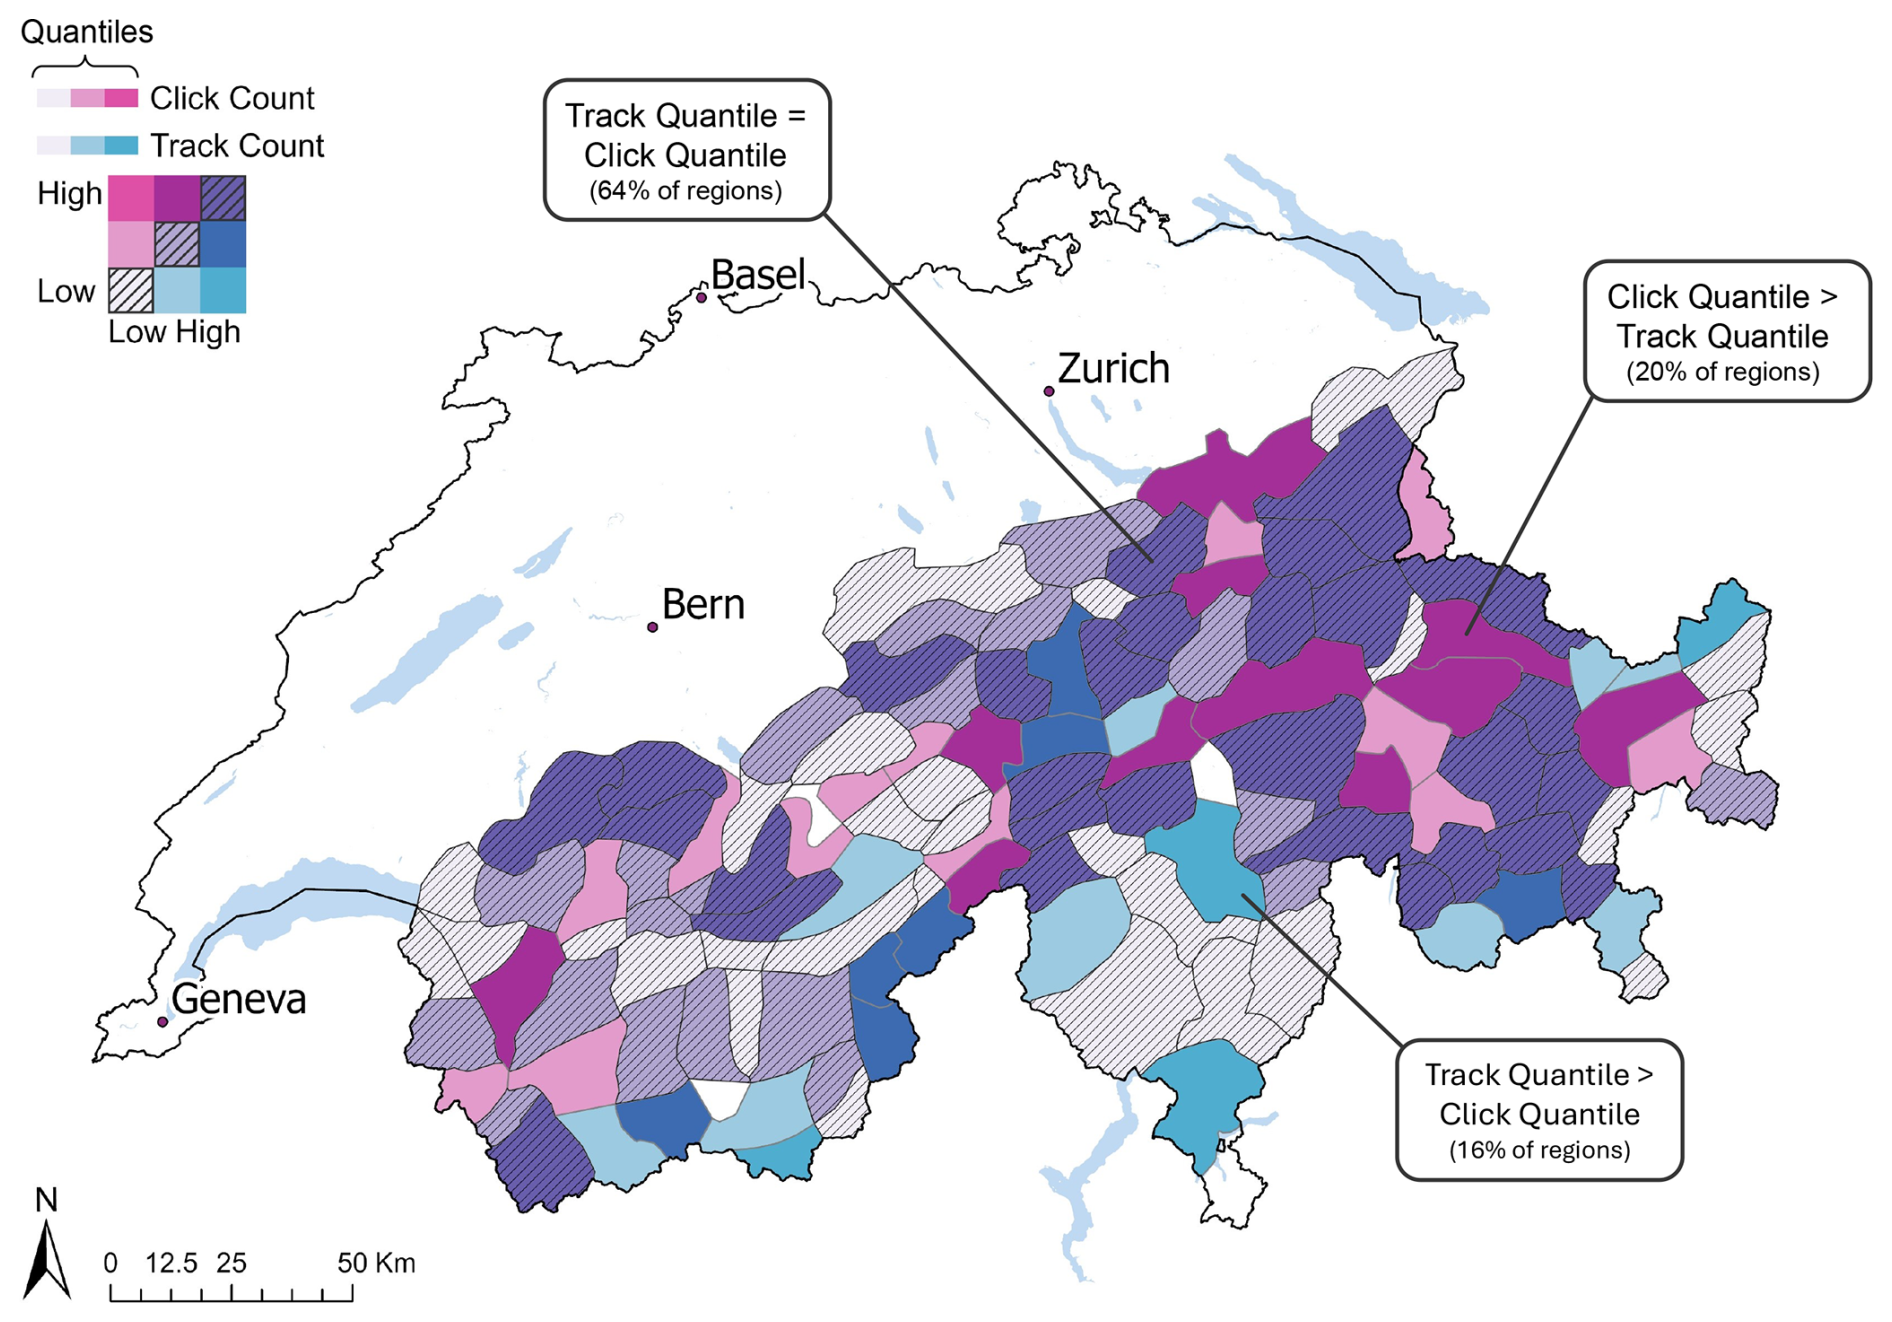
Figure 5Bi-variate map showing click and track counts in quantile bins for each warning region. Note that the datasets are compared only in relative terms using 33 % quantiles, as the click dataset is much larger than the track dataset. Blue indicates track quantile > click quantile, pink indicates track quantile < click quantile, purple and dashed indicates correspondence between click and track count quantiles.
Overall, lowest correlation coefficients were found in regions with both low click and low track counts, which should generally be interpreted with care.
4.2 Influence of Variables on Prediction
Figure 6 shows the importance of each variable for the performance of each model, represented as points for each cross-validation season respectively. For the binary track model, variable importance was calculated for each class separately. For the comparison with the click model, importance for the presence class was chosen, as the click data primarily included data points with click counts above zero, indicating “activity” rather than “no activity”. Comparing the importance ranking of the variables in both models showed that ordering of variables in both models is very similar (ρ = 0.81, p < 0.001). Overall, the range between the least and most important variables was smaller in the track model than in the click model, indicating a more balanced distribution of variable importance. Despite this, both models exhibited a similar pattern in variable importance, suggesting that the same underlying factors drive each data source, again confirming their relationship. Ski route density was the first, respectively second most important variable for the click, respectively the track model. For both models, two out of three temporal variables (weekend and day of the season) were among the five most important variables. Further, holidays and new snow were among the least important variables for both models.
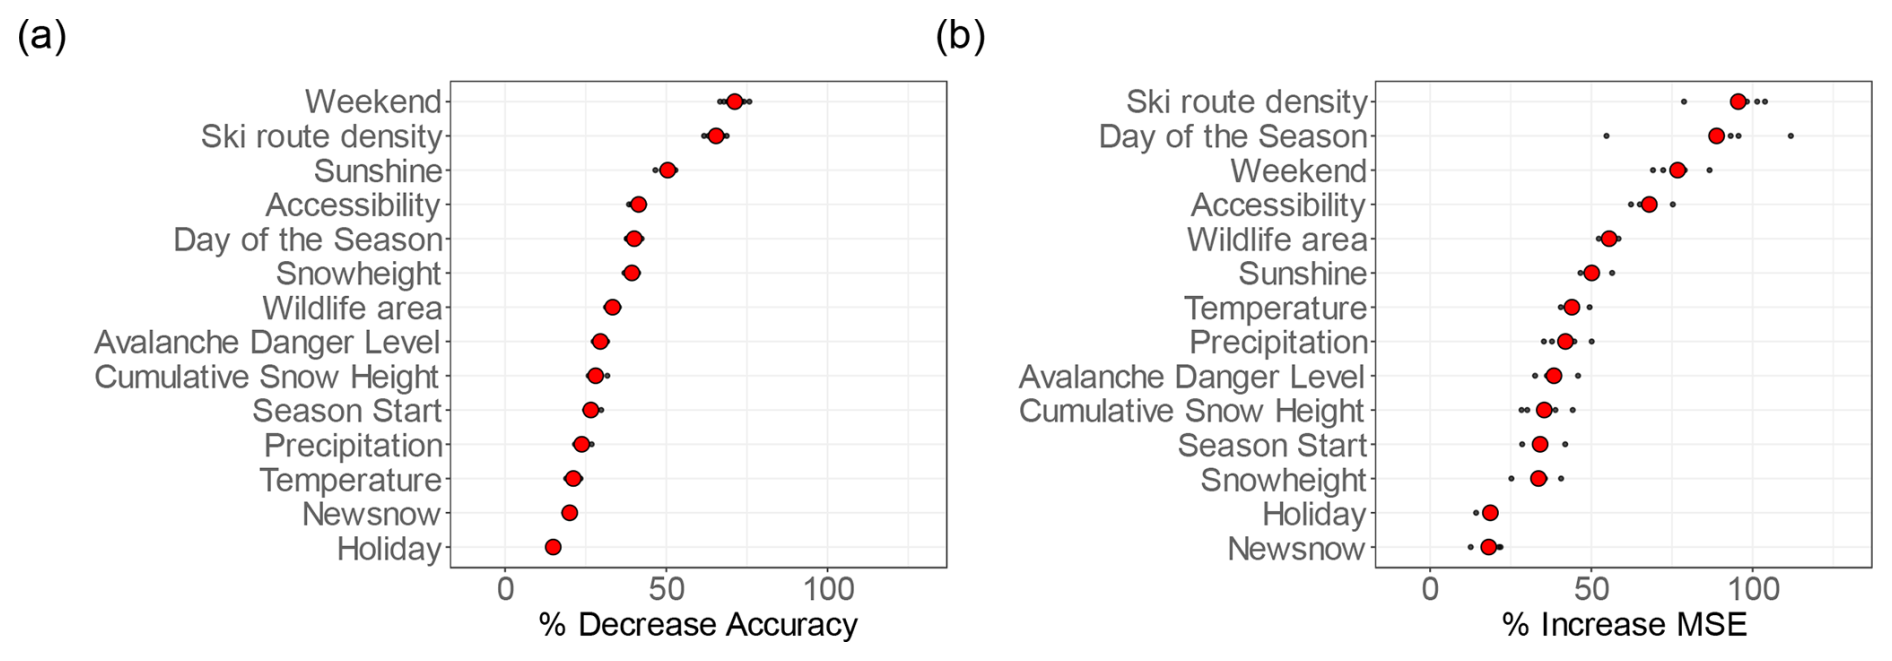
Figure 6Variable importance derived from (a) the track model and (b) the click model. The x axis shows the percentage decrease in accuracy, respectively the increase of the mean squared error the model suffered when excluding given variable. High values of “% Decrease Accuracy” and “% Increase MSE” indicate high importance for the predictive power. For the track model, variable importance refers to the importance for predicting the presence class (hence activity of backcountry skiing), rather than for the absence class. Each black point represents one test season, the red point indicates the mean value.
While the relative importance of variables was similar across both models, partial dependency plots revealed that some variables had a somewhat different impact on activity (Fig. 7). Noteworthy differences were found for the variables temperature, avalanche danger, new snow and day of the season. The click model predicted higher activity for lower temperatures, higher avalanche danger, more new snow and early on in the season as compared to the track model. This highlights key differences between online (planning) and real-world (skiing) behaviour. More people tend to click on tours under riskier and more extreme conditions, than are actually pursued in practice. Additionally, the click model predicted more activity at the beginning of the season, which then gradually declined toward the end, whereas actual outdoor activity peaked in the middle of the season. For the other variables, as is exemplarily shown for ski route density and sunshine, the general pattern was the same for both models.
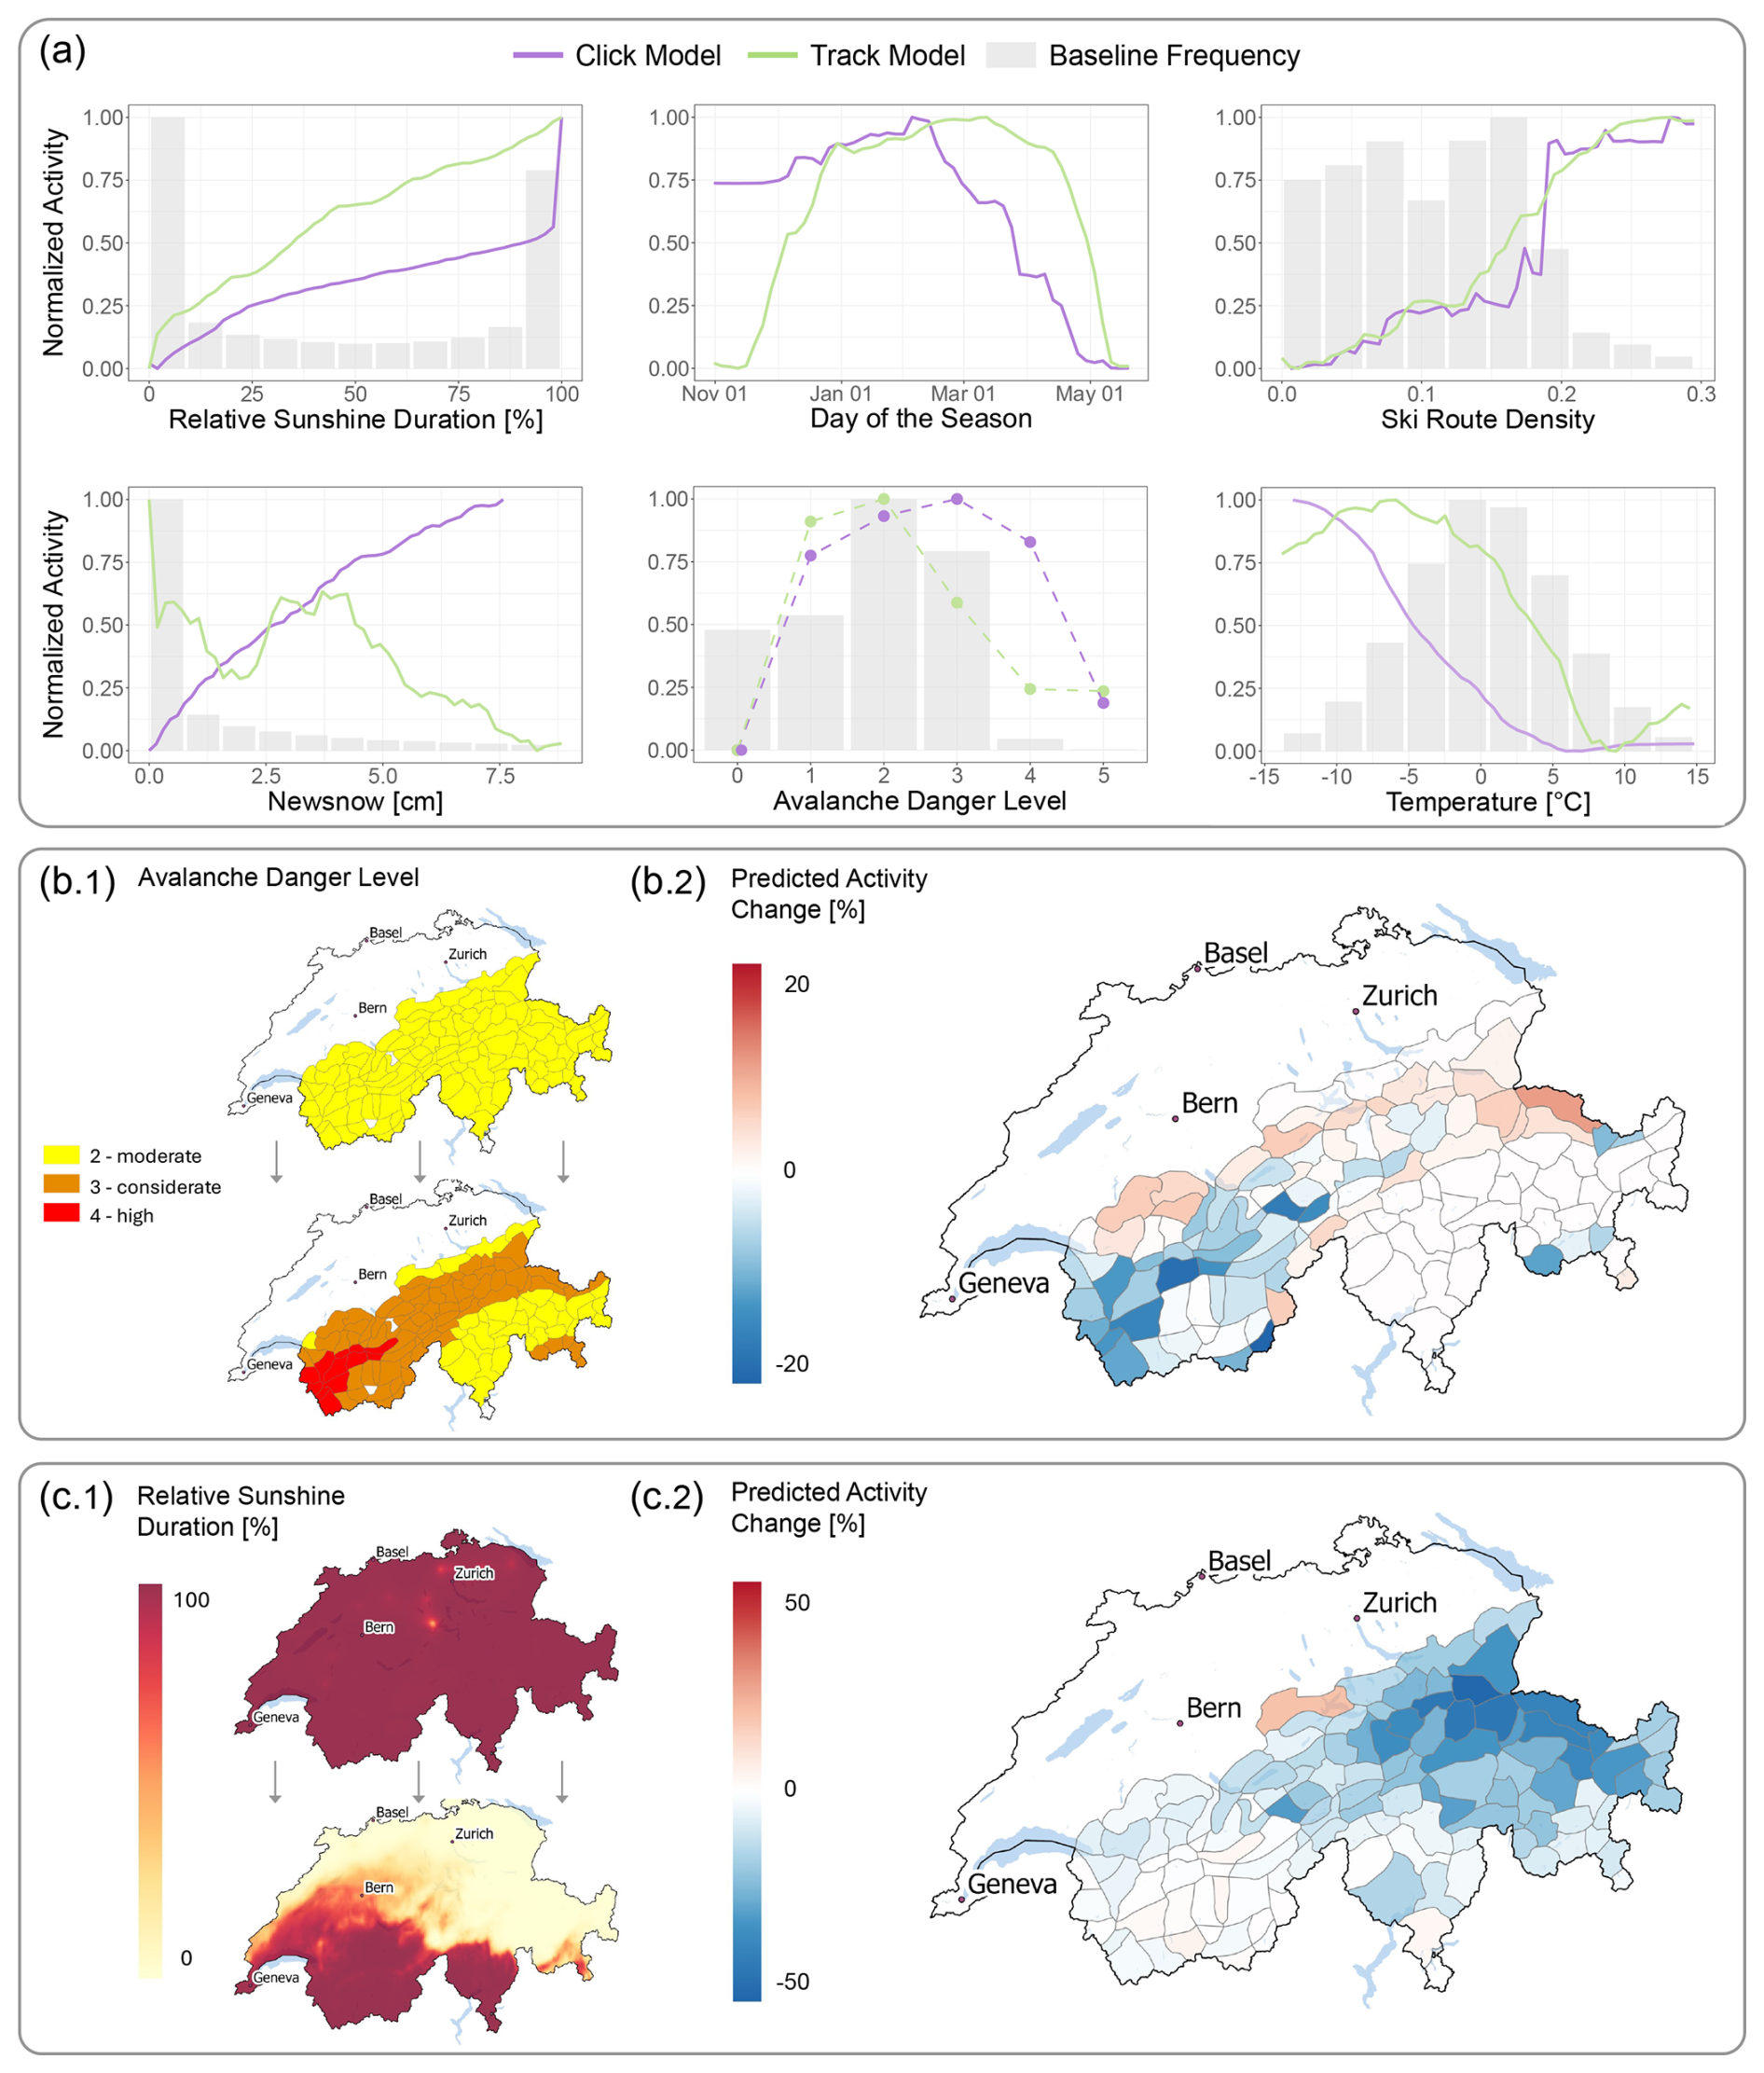
Figure 7(a) Normalized partial dependency (PD) plots for six variables. Dashed lines indicate categorical data. The normalized baseline frequency of each variable is shown in light grey. Note that PDs in regions with limited underlying data (e.g., avalanche danger levels 4 and 5) are subject to higher uncertainty and should be interpreted with caution. For a complete list of variables see Fig. S9. (b.1) Idealized click model prediction scenario for a day in January 2024, where all variables were held constant except for the avalanche danger level. Only regions that contain ski routes (and thus click data) are shown, excluding two central Alpine regions and four peripheral ones. (b.2) Change in predicted activity resulting from panel (b.1) as predicted by the click model. Panels (c.1) and (c.2) illustrate the same type of scenario and resulting change, but with relative sunshine duration as the manipulated variable.
Partial dependency (PD) plots were computed separately for the two data sets and were min-max normalized to allow for visual comparison, since PD values typically differ in scales for regression and classification models. A normalized value of 1 in the click model thus corresponds to the maximum PD effect of a given variable within the click model, and likewise for the track model. Consequently, normalized values are not directly comparable across tasks in terms of absolute magnitude. Therefore, in the normalized PD plots, some variables may appear equally influential despite much smaller actual effects. Furthermore, min-max normalization masks differences in the strength of variable effect. Variables with lower importance typically yield flatter PD curves, but this relative flatness is lost after normalization. Thus, while normalization enables qualitative comparison of the effect shapes (e.g., increase or decrease of activity likelihood), it does not reflect differences in effect magnitude or importance. By looking at unscaled plots (Figs. S10–S11), the magnitude of activity change under certain conditions could be estimated. For instance, the click model predicted activity to be 30 % higher on weekends than on weekdays and 35 % higher on sunny days than on days without sunshine. These activity changes were even stronger for the track model, with 50 % higher activity on weekends and 60 % higher activity on sunny days compared to days without sunshine. These findings are in line with Moss (2009) and Toft et al. (2025) who found 50 %–90 %, respectively 70 % more activity on the weekends. Higher weekend/weekday ratios were reported by Techel et al. (2015) (130 %–220 % higher) and Schönenberger et al. (2018) (300 % higher) for observed and planned tours.
For avalanche danger, we found differences in activity at different danger levels, but the absolute changes were small (e.g., from level 2 to level 3, a 4 % increase in the click model and a 7 % decrease in the track model and from level 1 to 3, a 17 % increase for the click model and a 6 % decrease for the track model). This is noticeably smaller that found in previous studies. Zweifel et al. (2006) reported 90 % more tours in Davos, a region in eastern Switzerland, on days with danger level 2 compared to 3, and Techel et al. (2015) reported 110 % more activity for the same scenario.
When predicting activity for different scenarios across Switzerland, the sparseness of the training data for the track model means that spatial variation is not well captured and the track data are therefore not suited to modelling at these spatial granularities. We focus our interpretation of spatially explicit scenarios on the predictions made by the click model (Figs. 7b–c, 8). While some variables had a uniform impact over space, other variables had differing impacts in different regions. For instance, the amount of sunshine hours had a positive impact on activity in all regions, as can be clearly seen in Fig. 7c, where activity in all regions decreased as sunshine duration was lowered compared to the base state. Contrastingly, the impact of increased avalanche danger on activity varied across regions, as we can observe a shift in activity towards the pre-Alps as the danger level was elevated from 2 to 3 (Figs. 7b, 8). For danger level 4, the decline in activity was consistent, though predictions for danger level 4 or higher should be interpreted with caution, since these conditions occur very rarely and thus the data basis is sparse.
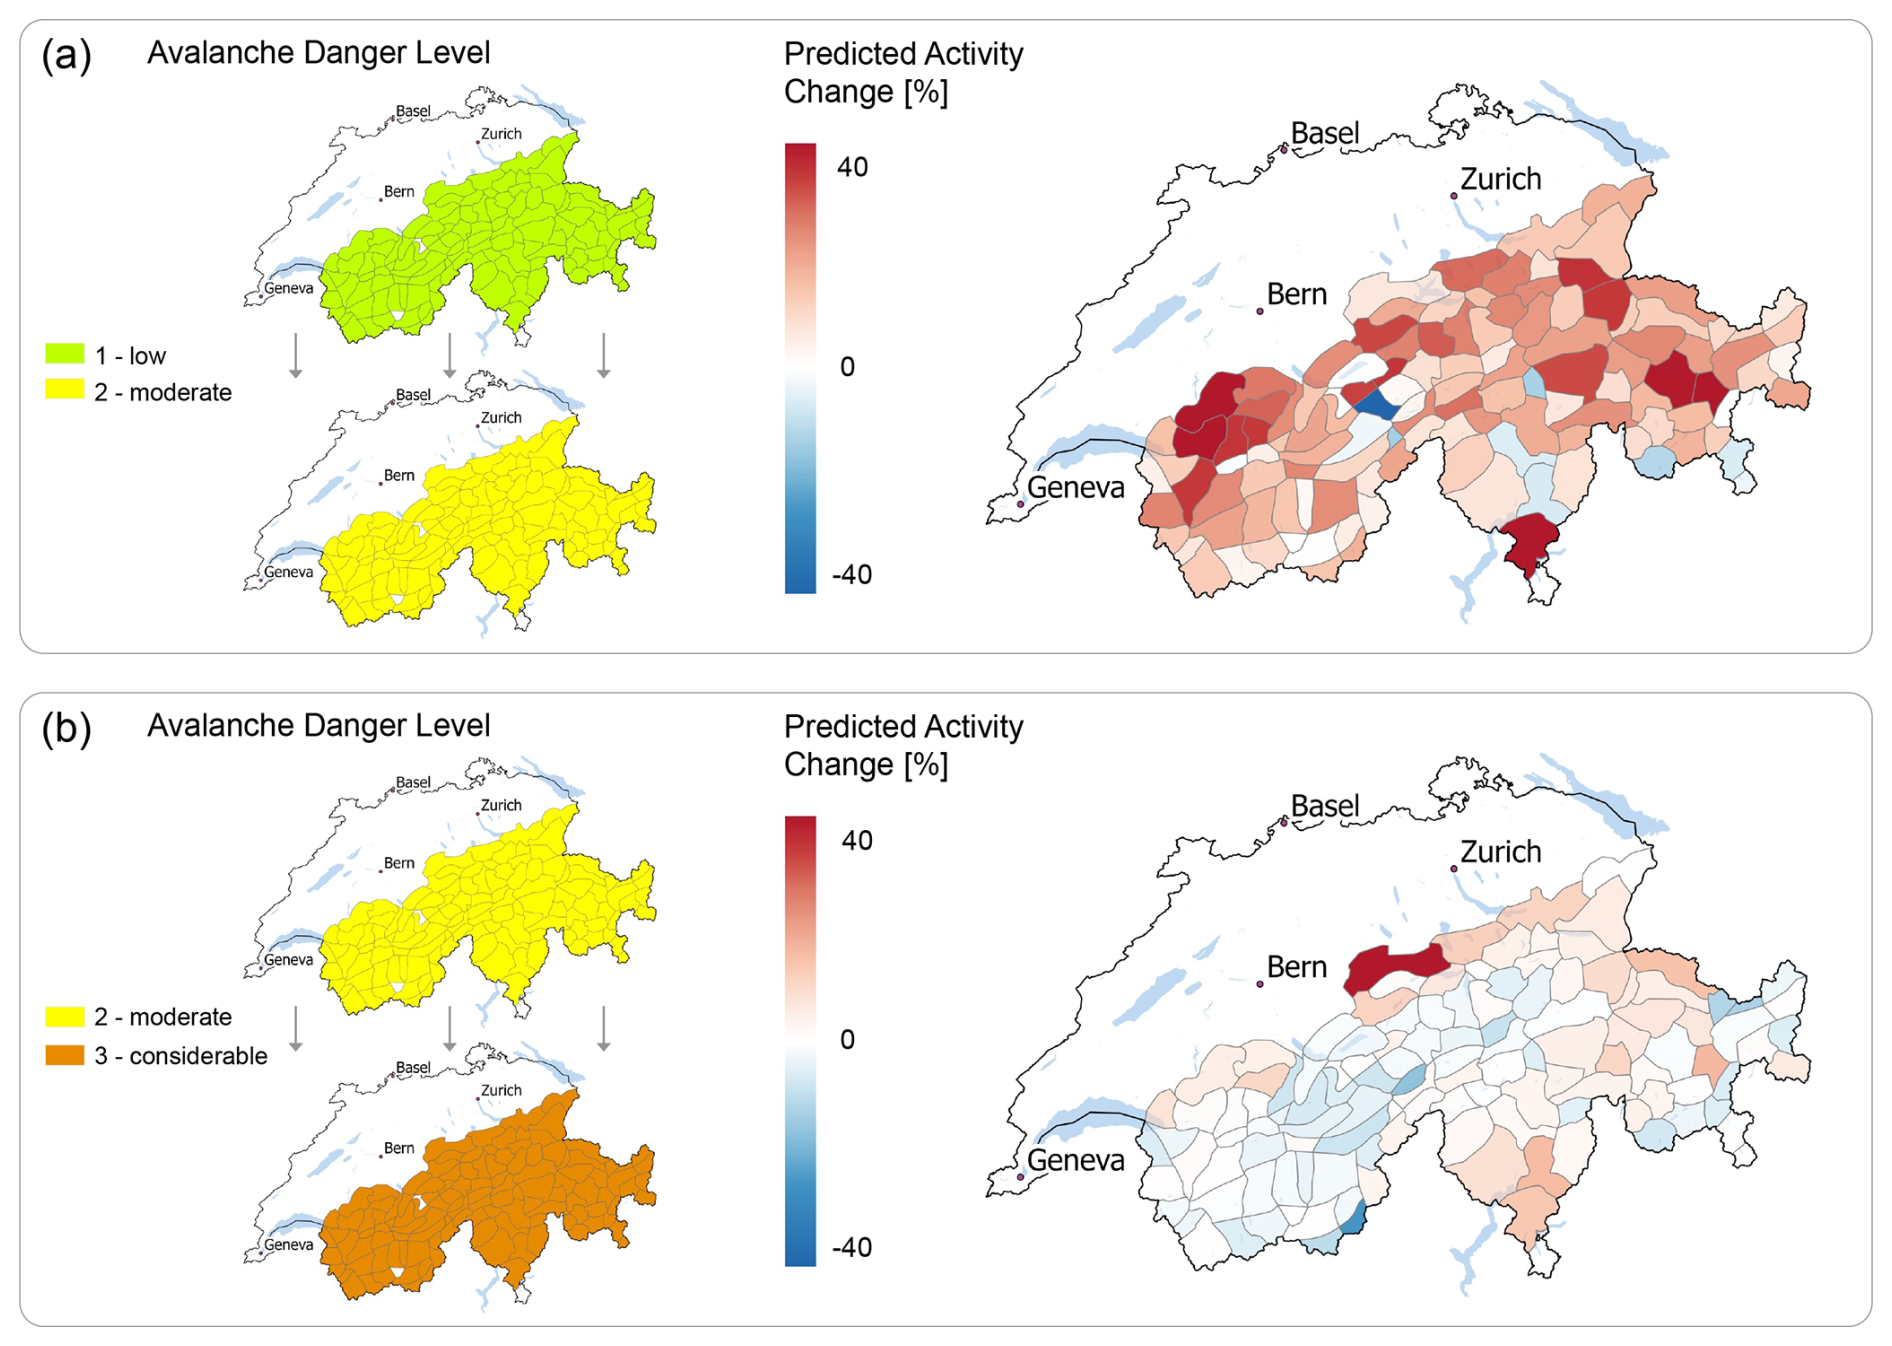
Figure 8Idealized prediction scenarios where all variables were held constant except for the avalanche danger level, which is systematically altered (a) from low to moderate danger and (b) from moderate to considerable danger with resulting change in predicted activity, as predicted by the click model.
4.3 Model Performance
Table 2 gives an overview of the skill scores obtained from different test seasons used for cross-validation. The track model predicting presence or absence of activity yielded a mean balanced accuracy of 0.75 ± 0.01. Mean sensitivity and specificity values are similar, but they exhibit an inverse relationship: as specificity increases, sensitivity tends to decrease. This is due to the fact that when the model predicts more absence, specificity increases at the expense of sensitivity, as more presence points are missed.
Table 2Skill scores for different validation seasons for click and track model. Mean values and standard deviations for each metric across all available seasons are shown in bold.
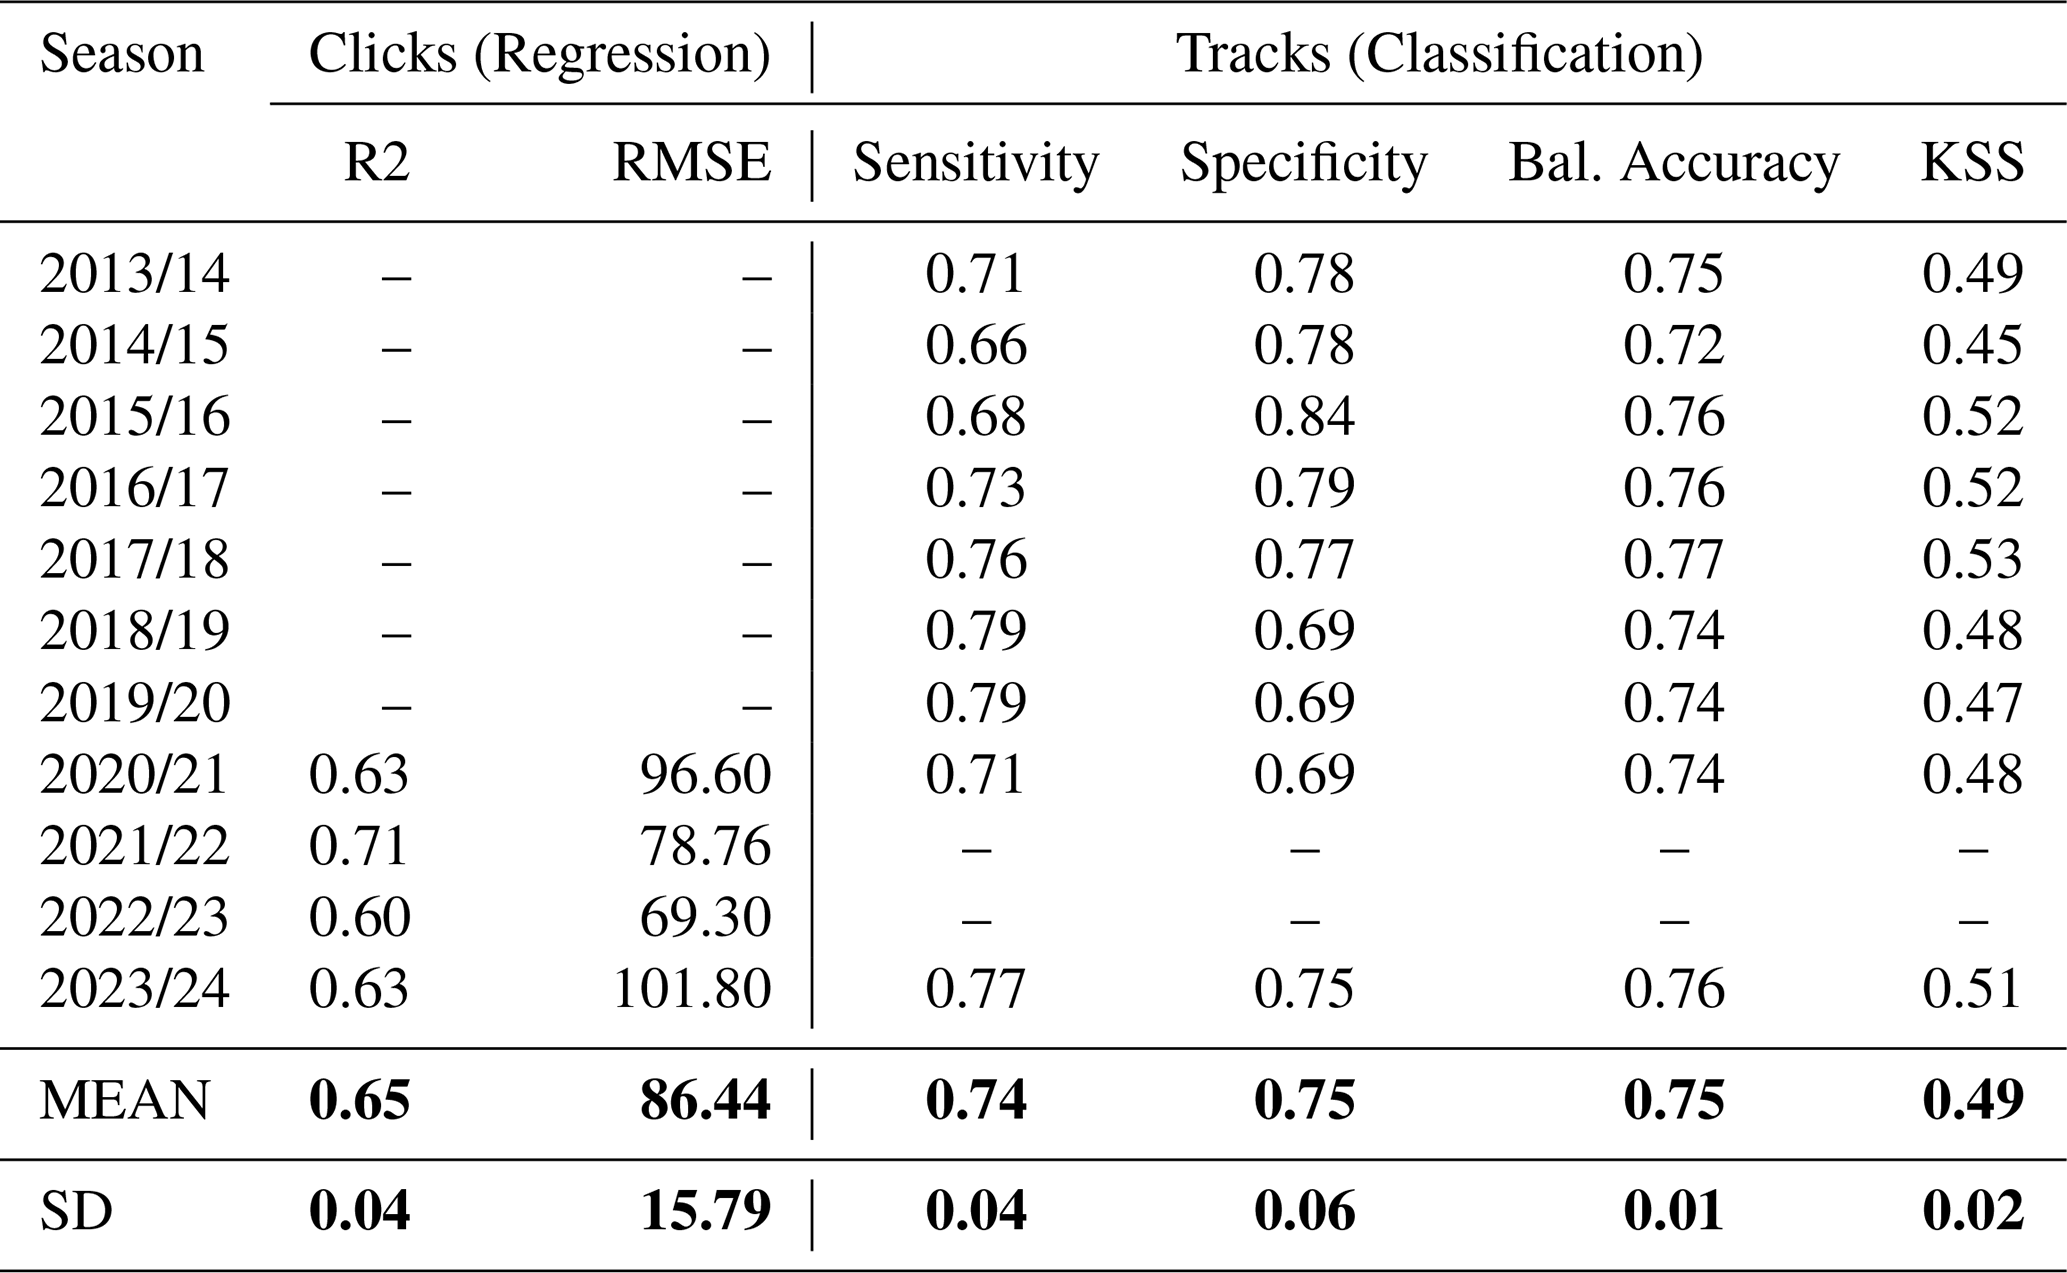
Note: values in bold were calculated using unrounded data; therefore, they may differ from the mean/SD calculated directly from the rounded values shown in the table.
The click model yielded an average R2 of 0.65 ± 0.04, and an average RMSE of 86 ± 15. This means that on average 65 % of the variability in clicking behaviour could be explained by the model, and the predicted clicks deviated by an average of 86 clicks per day from the true value. As for the track model, the predictive power varied slightly by season, but standard deviation for all seasons lies below 0.05.
To account for spatial clustering in both datasets, we trained additional models excluding warning regions with limited data, but performance was unaffected as the initial models already captured low levels of activity well.
4.4 Prediction Errors
4.4.1 Spatial Distribution
Residuals show that the track model consistently overpredicted activity across all regions (Fig. 9a). The underlying driver for this lies in the model training with artificially balanced presence and absence points. When verified with real-life and therefore unbalanced data, the model predicted more presence than was observed. The click model on the other hand both over- and underpredicted activity depending on the region (Fig. 9b). When comparing temporally aggregated predicted and observed counts per region, we find a nearly perfect correlation close to a 1 : 1 relationship for the click model (ρ = 0.98) and a strong correlation for the track model (ρ = 0.68). Scatterplots can be found in Fig. S8.
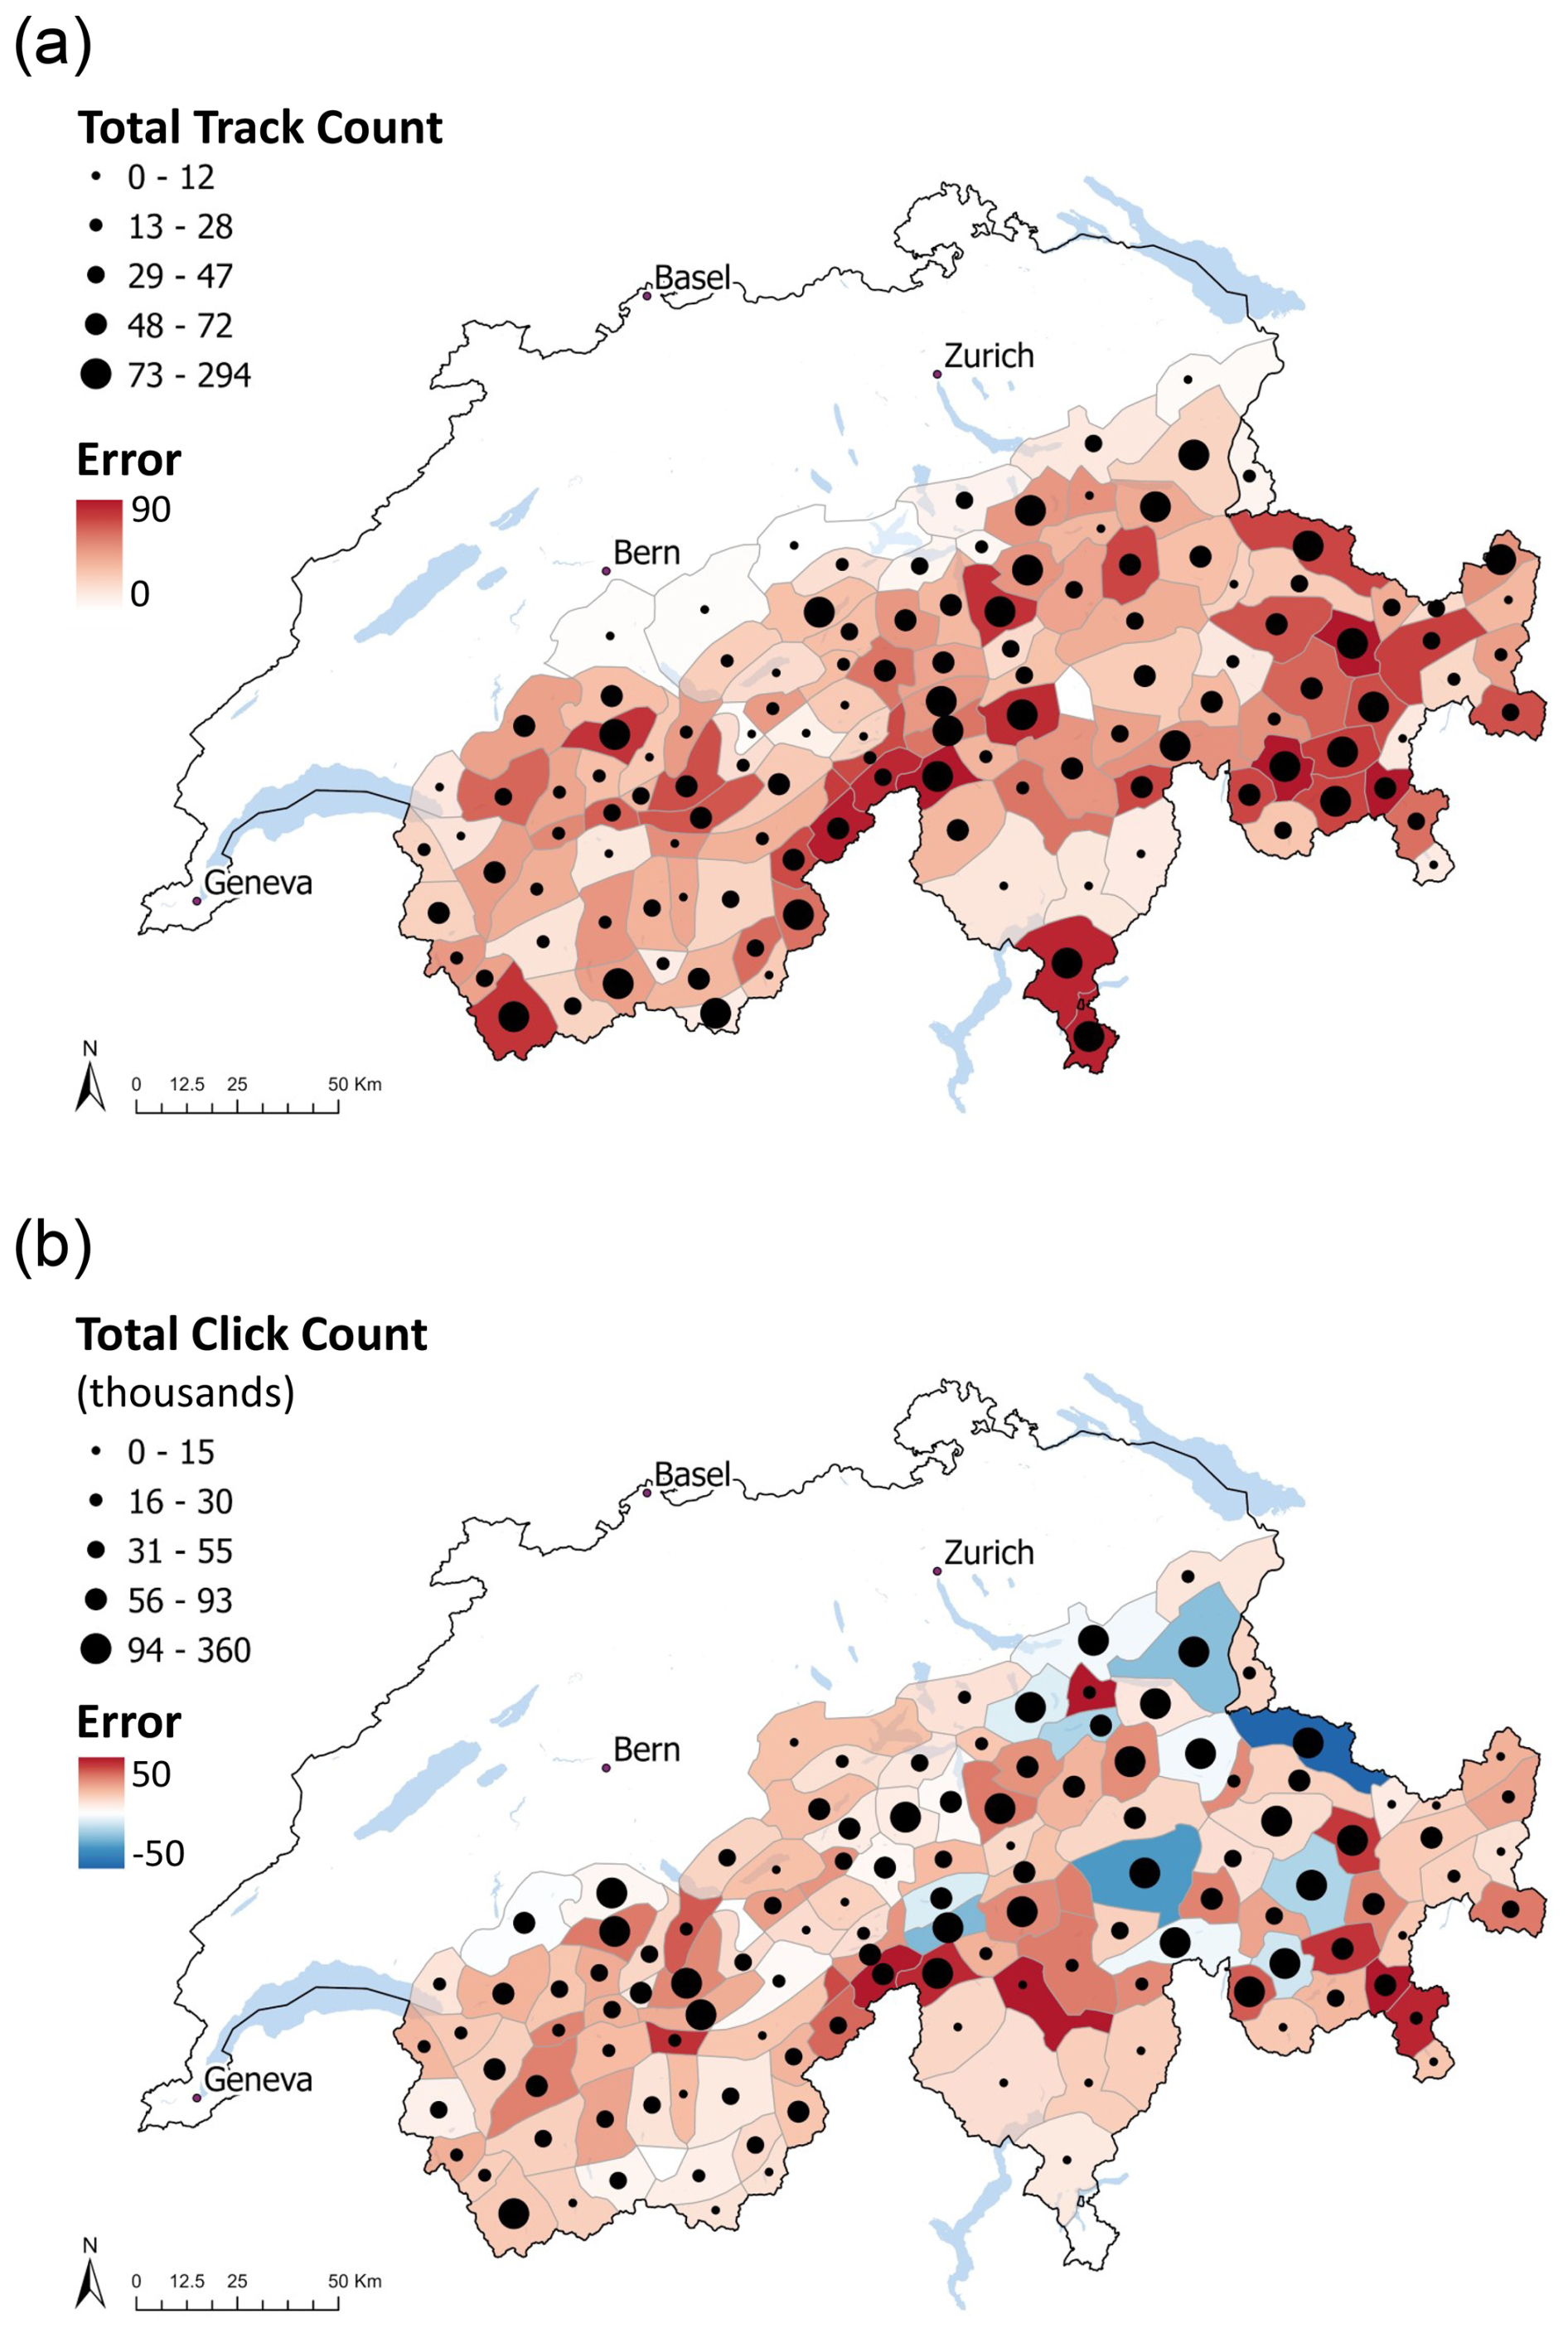
Figure 9Mean prediction error for (a) track model and (b) click model across all seasons, where red indicates that the model overpredicted and blue indicates that the model underpredicted activity. (a) The prediction error was calculated as (a) the mean number of days per season with a false positive prediction and (b) the mean daily difference between predicted and observed clicks. Black circles indicate the total number of tracks (a) or clicks (b) per region binned in 20 %-quantiles.
For the binary track model, errors were autocorrelated within regions and largely followed the distribution of the initial training data, with larger absolute errors in regions with more recorded tracks and smaller absolute errors in regions with very few recorded tracks. Contrastingly, the errors of the click model were neither autocorrelated, nor did they follow the underlying distribution of the training data. Generally, residuals approached zero in most regions, with some regions with larger absolute errors dispersed across the whole study area. Visually, the only slight spatial trend was that the click model underpredicted activity slightly more often in the northeastern and eastern part of the study area, which coincides with regions that received more clicks overall.
4.4.2 Temporal Distribution
Figure 10 shows the predicted and observed track and click counts aggregated over the whole study area for one example season. The click model captured weekly and seasonal cycles, with higher predicted activities on the weekends and in the middle of the season, coinciding well with observations (actual clicks). The magnitudes of peaks were often underpredicted, while periods of lower activity were overpredicted. Overall, the predicted clicks reflected a smoothed version of the observed clicks. The track model on the other hand produced a very noisy prediction and systematically overpredicted activity. Nonetheless, track predictions correlated fairly well with click predictions (2020/2021: ρ = 0.69, 2023/24: ρ = 0.71, p < 0.001). Most predicted click peaks and some predicted track peaks visibly aligned in their temporal locations with the observed peaks. However, the predicted magnitude, especially for tracks, frequently did not match observations well. This was also reflected in the prediction delta (i.e., difference between model predictions and actual counts) (Fig. 10b and d), which was continuously positive for the track model while alternating between positive and negative for the click model. The track prediction delta was almost zero in the early stages of the season (November), which coincides with almost zero recorded tracks, hence the model performed best when there was no activity. This was in line with the spatial distribution of errors, as smallest errors were found in regions with few tracks. For the click model, periods of over- and underpredictions alternated over the season with highest absolute errors occurring in the middle of the season where highest click counts also occurred. The time series of click prediction errors suggests that there might be other factors at play that are not captured by the model, which leads to a temporal clustering of over- and underprediction. These factors may include weather variables that are not currently in the model (e.g., wind), or school holidays, which vary across cantons or even individual municipalities in Switzerland.
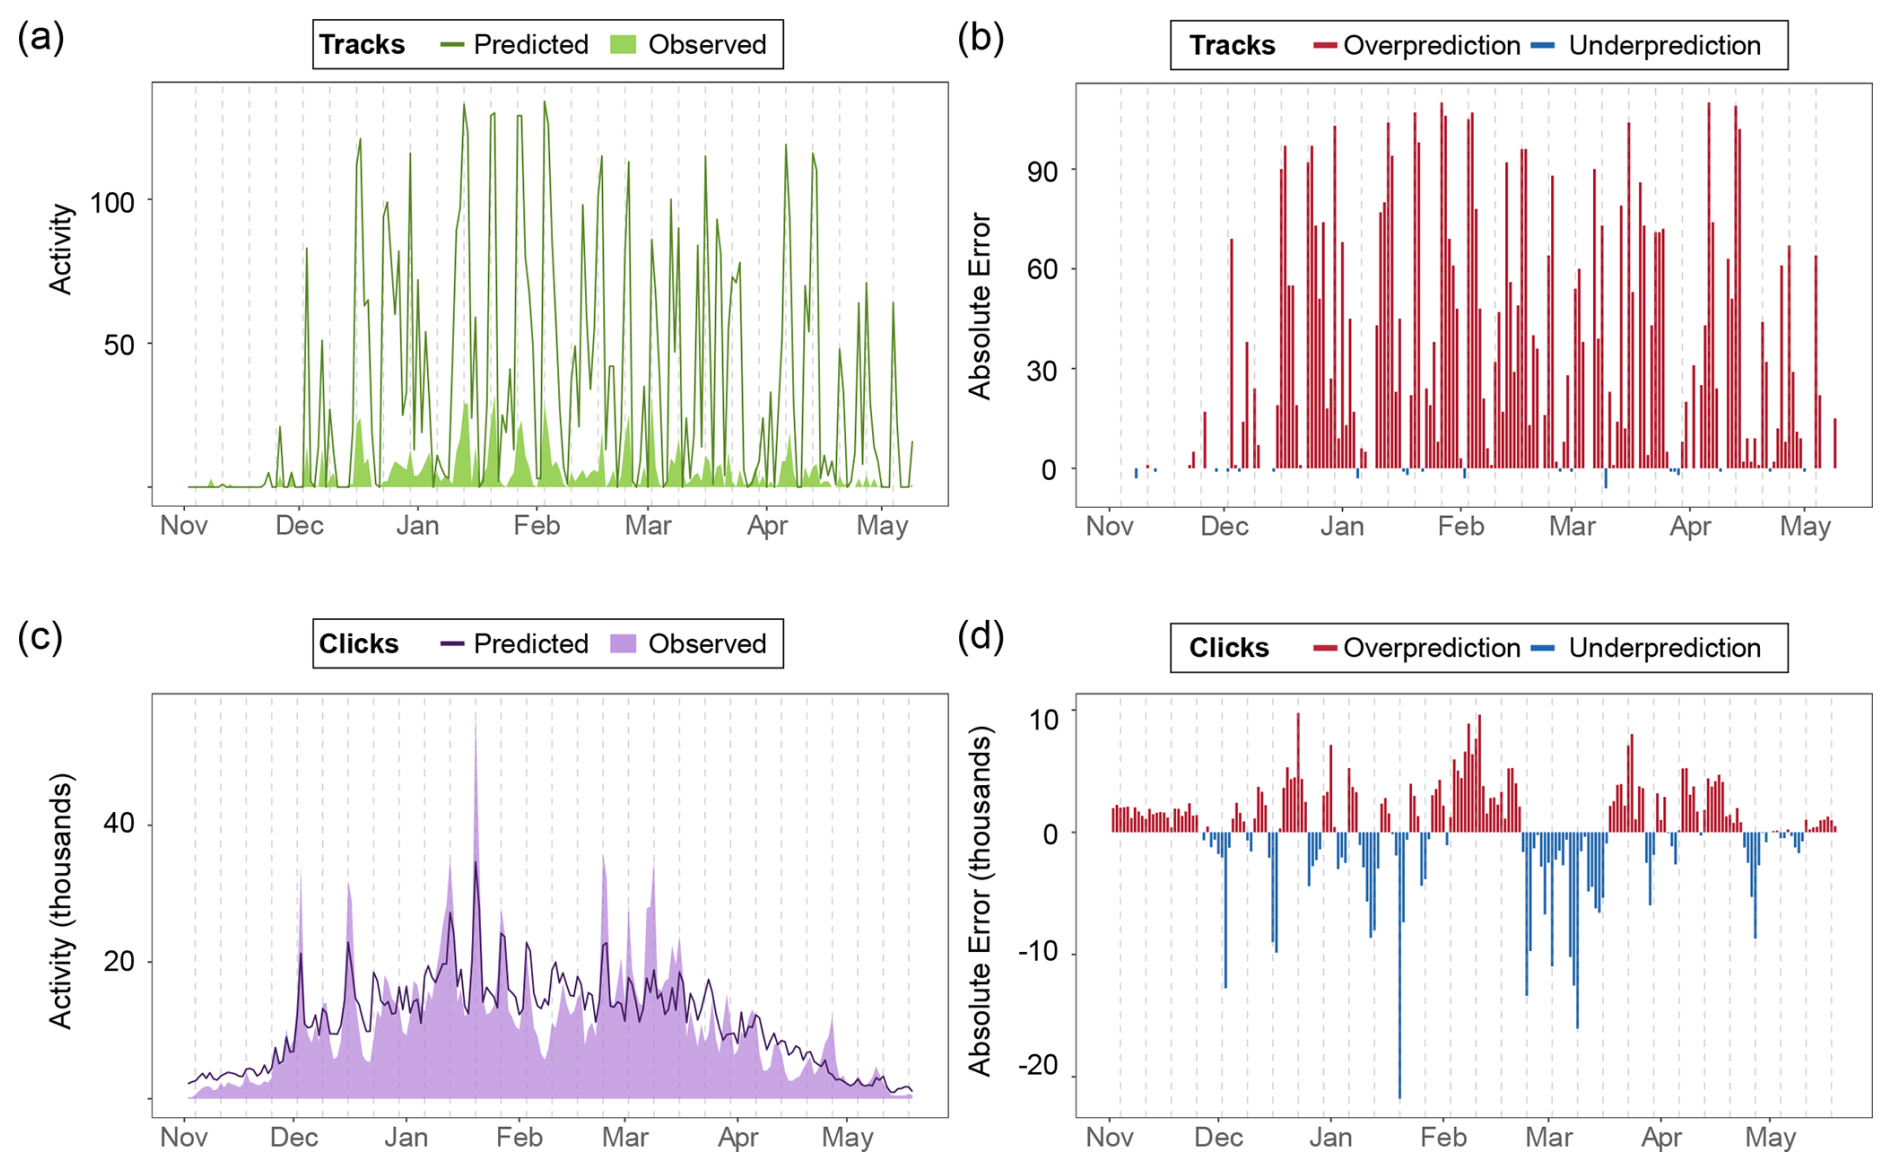
Figure 10Temporal distribution of predictions and prediction errors for the example season 2023/24. Observed daily activity vs. predicted daily activity obtained from (a) the track model and (c) the click model. Counts were aggregated over the whole study area. Prediction delta from (b) the track model and (d) the click model. The prediction delta was calculated as (b) the daily mean difference between number of regions where activity was predicted and number of regions where activity was observed and (d) the daily mean difference between predicted and observed clicks. Saturdays are represented as vertical dashed lines.
We modelled daily backcountry skiing base rates across avalanche warning regions in Switzerland using two different user-generated data sources – GPS tracks and online engagement – as proxies for activity, and linked them to snow, weather, temporal and environmental variables to identify the most important drivers for backcountry skiing activity. While previous literature proposed methods to enumerate backcountry skiers at a small scale (e.g., Toft et al., 2025; Zweifel et al., 2006), we explored methods that are scalable to larger regions and timescales, predicting spatial variation in backcountry skier behaviour across Switzerland on a daily basis. Following the research aims outlined in the beginning, we can summarise our main findings:
- a.
There is a significant correlation between GPS tracks and clicks across Switzerland using a 1 d time lag (ρ = 0.63, p < 0.001), suggesting that online clicking behaviour precedes real-world behaviour as represented by GPS tracks.
- b.
Click data captures spatially nuanced planning behaviour that often – but not always – translates into actual activity, while GPS tracks provide direct evidence of actual activity and insights on how different variables impact activity, though they only reflect a small fraction of real-world activity.
- c.
Drivers for backcountry skiing activity are similar for GPS track and click activity and include temporality (i.e., weekend, day of the season), accessibility of regions and skiing possibilities, and sunshine duration. However, the influence of certain variables differs between the models, highlighting differences in behaviour when planning versus actual skiing behaviour. Changes in avalanche danger had a relatively small effect on behavior.
Our findings support the hypothesis that online (planning) behaviour precedes real-world (skiing) activity, a pattern previously observed for visits to tourist destinations (e.g., Clark et al., 2019; Owuor et al., 2023), and aligns with findings that many people now plan outdoor recreation activities online (Fedosov and Langheinrich, 2015; Schwietering et al., 2024; Arts et al., 2021; Schönenberger et al., 2018). Although GPS data would be a gold standard to examine real-world behaviour, many backcountry skiers do not share such data and they are in practice too sparse in time and space to use for a daily estimation of activity. Using the models for different scenarios showed that they can be valuable tools to estimate and compare activity base rates for different days and assess the influence of different conditions on potential activity for different regions. For example, we found clear evidence of increased potential activity in the northern lower pre-Alps as avalanche danger increased (Figs. 7, 8). Lastly, we found that skiing activity is highest on weekends in spring, when the weather is good. Although avalanche danger has an impact on activity patterns, it is less important than temporality, the availability of ski routes and the weather (Fig. 6). It is likely that under more dangerous avalanche conditions people chose less challenging tours in the same region, however as our analysis was limited to the granularity of warning regions, we did not consider difficulty (e.g., as expressed through exposure and slope) as a variable.
5.1 Implications
As social media platforms and web communities have grown, user-generated content has increasingly been used as a proxy for human presence for visitor monitoring, ecosystem services mapping and tourism research where its effectiveness for researching human activities in the outdoors and nature has been demonstrated (Fisher et al., 2019; Levin et al., 2017; Norman et al., 2019; Manley and Egoh, 2022; Nyelele et al., 2023; Schirpke et al., 2018; Sonter et al., 2016; Tenkanen et al., 2017; Wartmann et al., 2021; Wood et al., 2013). UGC has been previously used in backcountry skiing research (Techel et al., 2015; Toft et al., 2025), but it has not yet been explored as a tool to predict activity rates in the future. Our results demonstrate that click data is a promising data source to spatio-temporally model potential skiing activity across Switzerland. While clicks can be used as a day-to-day estimation of potential activity, GPS data, in an aggregated form, can be used to link real-world activity to potential drivers. Although the click model overestimates activity – not every click directly translates to a completed tour – it provides valuable insights into potential backcountry skiing activity.
Aggregating GPS tracks over coarser temporal and spatial scales, such as an entire season, may reveal trends, such as the low activity during a snow-sparse winter like 2016/17 (MeteoSwiss, 2017), but click data is richer and likely portrays a broader set of users, as all users of the website automatically contribute to the data. While it is difficult to translate click data to an actual number of skiers, it can shed light on relative popularity of regions on a given day. We therefore suggest further exploring the potential of click data as a more abundant, less privacy-sensitive, and cheap alternative to GPS data. Avalanche forecasting websites should routinely collect anonymised click data (with respect to spatially resolved forecast data) since these may provide useful insights into potential real world behavior. Standardising the ways in which such click data are collected may help in future comparisons between countries and avalanche forecasting regions.
We found that avalanche danger plays a smaller role in predicting activity compared to temporal and weather-related variables. While higher avalanche danger levels lead to a recognizable shift of activity toward the pre-Alps, the magnitude of this effect is smaller than we expected based on earlier research (e.g., Zweifel et al., 2006; Moss, 2009; Techel et al., 2015; Winkler et al., 2021). However, including more aspects of avalanche danger (e.g., the avalanche problem, Müller et al., 2025) may influence these results. For instance, in spring, avalanche conditions are often favorable in the morning and more dangerous in the afternoon; only the latter are captured in the danger level used in this analysis.
Our results suggest care in making assumptions about the importance of avalanche forecasts in influencing behavior, with many other factors also playing an important role in revealed, rather than stated, preferences. Studies based around stated preferences should in the future better control for potential confounds with respect to behavior.
Although overall patterns were similar for clicks and tracks, we found some striking differences which reflect key differences in the types of behavior each model describes. Although online behavior was driven by more extreme conditions (more new snow, colder temperatures and higher avalanche danger), actual skiing behaviour shows a shift towards less dangerous (lower avalanche danger) and more comfortable (higher temperatures) conditions. A similar trend was observed by Moss (2009) in Scotland, where the views of the avalanche forecast and a conditions blog increased strongly with higher danger levels, while actual backcountry activity decreased.
According to our findings, people do more online research towards the beginning of the winter, but become more active outside in the middle and towards the end of the season. This result suggests a mismatch between preparation and activity, which may have important implications for avalanche education programs.
5.2 Limitations
Both the track and the click data come with biases and uncertainties. Although GPS tracks are direct evidence of physical presence in a region, they only cover a fraction of real activity. For instance, Degraeuwe et al. (2024) estimated that GPS data accounts for only 1 of 2000 of backcountry activities, this is – considering the size of our datasets – in line with our analysis. Given previous literature on user-generated data, participation bias in creation of GPS data was expected, since most users in online communities observe but never contribute (e.g., Nonnecke and Preece, 1999; Goodchild, 2007; Chen et al., 2019). As with most user-generated data, it remains unclear whether the users behind the data are representative of the broader ski touring population. There have been efforts to compare user-generated data against in situ visitor counts, e.g., in South Africa and Norway (Tenkanen et al., 2017; Venter et al., 2023), but to our knowledge, no similar work has been carried out for backcountry skiing specifically. However, we assume that the popularity of Skitourenguru means that our click data captures many more users than are present in the GPS tracks we analysed. Further, the web interface has an influence on which routes users click. For instance, ski routes are colour-coded and automatically sorted by their avalanche risk rating. These design choices are intended to nudge users toward safer routes and as a result, user engagement may become skewed toward lower-risk options. This can potentially introduce a spatial bias if safer routes are more prevalent in certain regions. However, as the data was generalized to the granularity of warning regions, we could not assess, whether skiers adjust their behaviour to more safe terrain within the same warning region when avalanche danger is higher, which was found by Techel et al. (2014).
Calculating the predictors was not straightforward, as data availability varied. Some variables (e.g., snow measurements) were only available at discrete point locations while others existed in gridded or interpolated formats (e.g., weather data) and all variables had to be generalized to the relatively coarse spatial scale of the warning regions. Snow variables relied on interpolation, as we used the value of the nearest stations for snow depth, and are therefore prone to errors, which could influence their importance rating. Wind variables were, due to the heterogeneity of wind fields within a region, not included into the model, although wind is likely an important factor for skiing activity. Although we carried out a temporal cross-validation, it was not practical to perform a corresponding spatial cross-validation. On the one hand, our relatively small GPS track dataset would make this difficult if we moved beyond a leave one-out approach, and on the other hand a leave one-out approach is not suitable for cross-validation of spatially autocorrelated data.
Lastly, there are some limitations in terms of the modelling approach. A fundamental assumption when using GPS tracks or click data as proxies for backcountry skiing activity is that the absence of data implies the absence of activity. As a result, regions may be falsely labelled as inactive simply because no GPS tracks or clicks were recorded, leading to misclassification errors. Similarly, reduced click behaviour later in the season may reflect generally more homogenous spring conditions and more straightforward planning rather than a reduction in activity. This highlights that both the data and resulting models can, at best, reflect relative rather than absolute activity patterns. Direct comparison of model performance is limited by their differing objectives – classification versus regression – and the use of distinct performance metrics.
In this study we used user-generated GPS tracks and online engagement data to predict daily backcountry skiing activities on a regional scale across Switzerland. While online engagement shows good alignment with GPS activity on the next day, we showed that backcountry skier's online information seeking is driven by more extreme conditions than those reflected in actual behavior. Nonetheless, online engagement data provide a cheap and scalable alternative source of revealed preference data, especially in comparison to privacy sensitive GPS data or resource intensive in-situ counts modelling backcountry skiing base rates. Base rates derived from click data could be used to improve the interpretation of avalanche occurrence data, and particularly human-triggered events, in relation to the forecast avalanche danger. To strengthen and extend these findings, future research should involve local experts such as mountain guides to assess whether the predicted activity changes under different scenarios align with in-situ experience in this terrain. Additionally, future work could include comparing ground truth data (e.g., Toft et al., 2025) with the model to validate and scale its predictions to quantify skiing activity in absolute numbers. As our analysis was limited to the granularity of warning regions, future work could include more detailed terrain information, such as the slope, elevation and the overall difficulty of individual tours. This would allow us to explore if and how skiers adapt route choice to different avalanche and weather conditions. Finally, to more accurately interpret user-generated data, it is important to better understand who contributes to outdoor sport platforms and what motivates them to share information in order to identify potential biases in the data.
The following official national holidays* and bridge days are considered (in chronological order): Neujahr (1 January)*, Berchtoldstag (2 January)*, Karfreitag (variable date)*, Ostersamstag und -sonntag (variable date), Ostermontag (variable date)*, Tag der Arbeit (1 May)*, Auffahrt (variable date)*, Auffahrtsbrücke (variable date), Pfingstsamstag und -sonntag (variable date), Pfingstmontag (variable date)*, Weihnachtsabend (24 December), Weihnachten (25 December)*, Stephanstag (26 December)*, Weihnachtswoche (27–31 December).
Table B1Description of training data for the track and click model.
The R-Code is available at https://doi.org/10.5281/zenodo.18838099 (Schäfer, 2026).
The processed data can be accessed via Zenodo at https://doi.org/10.5281/zenodo.18838099 (Schäfer, 2026). The Skitourenguru data are available online at https://wiki.skitourenguru.com/de/articles/a0065.html (Skitourenguru GmbH, 2026a) and https://wiki.skitourenguru.com/de/articles/a0068.html (Skitourenguru GmbH, 2026b).
The supplement related to this article is available online at https://doi.org/10.5194/nhess-26-1537-2026-supplement.
LS: conceptualization, methodology, software, data curation and analysis, vizualisation, writing – original draft, funding acquisition. RS: conceptualization, methodology, writing – review and editing, supervision, funding acquisition. FT: conceptualization, methodology, writing – review and editing, supervision. GS: data curation, writing – review and editing, supervision.
The contact author has declared that none of the authors has any competing interests.
Publisher's note: Copernicus Publications remains neutral with regard to jurisdictional claims made in the text, published maps, institutional affiliations, or any other geographical representation in this paper. The authors bear the ultimate responsibility for providing appropriate place names. Views expressed in the text are those of the authors and do not necessarily reflect the views of the publisher.
This research was supported by funding from the Hasler Foundation (Hasler Stiftung) and the Digital Society Initiative (DSI) at the University of Zurich. We gratefully acknowledge their support.
This research has been supported by the Hasler Stiftung (grant no. 23093).
This paper was edited by Pascal Haegeli and reviewed by John Sykes and one anonymous referee.
Ahas, R., Aasa, A., Roose, A., Mark, Ü., and Silm, S.: Evaluating passive mobile positioning data for tourism surveys: An Estonian case study, Tourism Manage., 29, 469–486, https://doi.org/10.1016/j.tourman.2007.05.014, 2008. a
Ahonen, L., Mannberg, A., Hetland, A., Stefan, M., Pfuhl, G., Rong, G., Landrø, M., and Cowley, B.: Combining Avalanche Nowcasts With GPS Tracks and “In Situ” Participant Reports to Understand Decision-Making in Avalanche Terrain, in: Proceedings of the International Snow Science Workshop, Tromsø, Norway, https://arc.lib.montana.edu/snow-science/item.php?id=3343 (last access: 26 February 2026), 2024. a, b
Akter, S. and Wamba, S. F.: Big data analytics in E-commerce: a systematic review and agenda for future research, Electron. Mark., 26, 173–194, https://doi.org/10.1007/s12525-016-0219-0, 2016. a
Arts, I., Fischer, A., Duckett, D., and van der Wal, R.: Information technology and the optimisation of experience – The role of mobile devices and social media in human-nature interactions, Geoforum, 122, 55–62, https://doi.org/10.1016/j.geoforum.2021.03.009, 2021. a
Bielański, M., Taczanowska, K., Muhar, A., Adamski, P., González, L.-M., and Witkowski, Z.: Application of GPS tracking for monitoring spatially unconstrained outdoor recreational activities in protected areas – A case study of ski touring in the Tatra National Park, Poland, Appl. Geogr., 96, 51–65, https://doi.org/10.1016/j.apgeog.2018.05.008, 2018. a
Breiman, L.: Random Forests, Mach. Learn., 45, 5–32, https://doi.org/10.1023/a:1010933404324, 2001. a, b, c
Bucklin, R. E. and Sismeiro, C.: Click Here for Internet Insight: Advances in Clickstream Data Analysis in Marketing, J. Interact. Mark., 23, 35–48, https://doi.org/10.1016/j.intmar.2008.10.004, 2009. a
Bundesamt für Umwelt BAFU: Bundesinventar der eidgenössischen Jagdbanngebiete inkl. Routennetz Jagdbanngebiete, Bundesamt für Umwelt BAFU [data set], https://opendata.swiss/de/dataset/bundesinventar-der-eidgenossi schen-jagdbanngebiete-inkl-routennetz-jagdbanngebiete (last access: 19 May 2025), 2025. a
Chen, X., Li, X., Yao, D., and Zhou, Z.: Seeking the support of the silent majority: are lurking users valuable to UGC platforms?, J. Acad. Market. Sci., 47, 986–1004, https://doi.org/10.1007/s11747-018-00624-8, 2019. a
Clark, M., Wilkins, E. J., Dagan, D. T., Powell, R., Sharp, R. L., and Hillis, V.: Bringing forecasting into the future: Using Google to predict visitation in U.S. national parks, J. Environ. Manage., 243, 88–94, https://doi.org/10.1016/j.jenvman.2019.05.006, 2019. a
Darst, B. F., Malecki, K. C., and Engelman, C. D.: Using recursive feature elimination in random forest to account for correlated variables in high dimensional data, BMC Genetics, 19, 65, https://doi.org/10.1186/s12863-018-0633-8, 2018. a
Degraeuwe, B., Schmudlach, G., Winkler, K., and Köhler, J.: SLABS: An improved probabilistic method to assess the avalanche risk on backcountry ski tours, Cold Reg. Sci. Technol., 221, 104169, https://doi.org/10.1016/j.coldregions.2024.104169, 2024. a, b, c, d
Dodge, Y.: Spearman Rank Correlation Coefficient, Springer, New York, 502–505, https://doi.org/10.1007/978-0-387-32833-1_379, ISBN 9780387328331, 2008. a
Ebert, P. A. and Milne, P.: Methodological and conceptual challenges in rare and severe event forecast verification, Nat. Hazards Earth Syst. Sci., 22, 539–557, https://doi.org/10.5194/nhess-22-539-2022, 2022. a
Federal Office of Topography (swisstopo): SwissTLM3D – Topographic Landscape Model of Switzerland, swisstopo [data set], https://www.swisstopo.admin.ch/de/landschaftsmodell-swisstlm3d (last access: 26 Febraury 2026), 2024. a, b
Federal Statistical Office (BFS): Statistik der Bevölkerung und Haushalte (STATPOP), Geodaten 2021, 23528269, Federal Statistical Office (BFS) [data set], Neuchâtel, https://www.bfs.admin.ch/asset/de/23528269 (last access: 26 February 2026), 2022. a, b
Fedosov, A. and Langheinrich, M.: From Start to Finish: Understanding Group Sharing Behavior in a Backcountry Skiing Community, in: Proceedings of the 17th International Conference on Human-Computer Interaction with Mobile Devices and Services Adjunct, MobileHCI '15, Copenhagen Denmark, 24–27 August 2015, Association for Computing Machinery, New York, NY, USA, 758–765, https://doi.org/10.1145/2786567.2793698, ISBN 9781450336536, 2015. a
Fisher, D. M., Wood, S. A., Roh, Y.-H., and Kim, C.-K.: The Geographic Spread and Preferences of Tourists Revealed by User-Generated Information on Jeju Island, South Korea, Land, 8, 73, https://doi.org/10.3390/land8050073, 2019. a
Francisco, G., Apodaka, J., Travesset-Baro, O., Vilella, M., Margalef, A., and Pons, M.: Exploring the potential of mobile phone data (Call Detail Records) to track and analyze backcountry skiers dynamics in avalanche terrain, in: Proceedings of the International Snow Science Workshop 2018, Innsbruck, Austria, 7–12 October 2018, 1600–1603, https://www.researchgate.net/profile/Oriol-Travesset-Baro/publication/336085578_Exploring_the_potential_of_mobi bile_phone_data_Call_Detail_Records_to_track_and_analyze_ backcountry_skiers'_dynamics_in_avalanche_terrain/links/5d8 dc73192851c33e9408ee2/Exploring-the-potential-of-mobile-phone-data-Call-Detail-Records-to-track-and-analyze-backcoun try-skiers-dynamics-in-avalanche-terrain.pdf (last access: 26 Febraury 2026), 2018. a, b
Furman, N., Shooter, W., and Schumann, S.: The Roles of Heuristics, Avalanche Forecast, and Risk Propensity in the Decision Making of Backcountry Skiers, Leisure Sci., 32, 453–469, https://doi.org/10.1080/01490400.2010.510967, 2010. a, b, c, d
Furman, N., Shooter, W., and Tarlen, J.: Environmental factors affecting the predicted decisions of backcountry skiers: An examination of the obvious clues method decision aid, Journal of Outdoor Recreation, Education, and Leadership, 5, 226–241, https://doi.org/10.7768/1948-5123.1168, 2013. a, b
Gasser, B.: Equipment Became Better in Backcountry Skiing – Did Severity of Injuries Decrease? An Analysis from the Swiss Alps, Int. J. Env. Res. Pub. He., 17, 901, https://doi.org/10.3390/ijerph17030901, 2020. a
Gilpin, L. H., Bau, D., Yuan, B. Z., Bajwa, A., Specter, M., and Kagal, L.: Explaining Explanations: An Overview of Interpretability of Machine Learning, in: 2018 IEEE 5th International Conference on Data Science and Advanced Analytics (DSAA), Turin, Italy, 1–3 October 2018, IEEE, 80–89, https://doi.org/10.1109/DSAA.2018.00018, ISBN 978-1-5386-5090-5, 2018. a
Goodchild, M. F.: Citizens as sensors: the world of volunteered geography, GeoJournal, 69, 211–221, https://doi.org/10.1007/s10708-007-9111-y, 2007. a, b
Greenwell, B. M.: pdp: An R Package for Constructing Partial Dependence Plots, The R Journal, 9, 421–436, https://doi.org/10.32614/RJ-2017-016, 2017. a
Grímsdóttir, H. and Mcclung, D.: Avalanche risk during backcountry skiing – An analysis of risk factors, Nat. Hazards, 39, 127–153, https://doi.org/10.1007/s11069-005-5227-x, 2006. a
Guo, X., Yin, Y., Dong, C., Yang, G., and Zhou, G.: On the Class Imbalance Problem, in: 2008 Fourth International Conference on Natural Computation, Jinan, Shandong, China, 18–20 October 2008, IEEE, 192–201, https://doi.org/10.1109/ICNC.2008.871, ISBN 978-0-7695-3304-9, 2008. a
Haegeli, P., Haider, W., Longland, M., and Beardmore, B.: Amateur decision-making in avalanche terrain with and without a decision aid: a stated choice survey, Nat. Hazards, 52, 185–209, https://doi.org/10.1007/s11069-009-9365-4, 2010. a
Hanssen, A. and Kuipers, W.: On the Relationship between the Frequency of Rain and Various Meteorological Parameters, Koninkl. Nederlands Meterologisch Institut, Mededelingen en Verhandelingen, Koninklijk Nederlands Meteorologisch Instituut, https://books.google.ch/books?id=nTZ8OgAACAAJ (last access: 26 February 2026), 1965. a
Happ, E., Scholl-Grissemann, U., and Schnitzer, M.: Ski touring: Analyzing risk-taking behavior and risk avoidance associated with an emerging outdoor activity in the Alps, JSAMS Plus, 2, 100030, https://doi.org/10.1016/j.jsampl.2023.100030, 2023. a
Heikinheimo, V., Minin, E. D., Tenkanen, H., Hausmann, A., Erkkonen, J., and Toivonen, T.: User-Generated Geographic Information for Visitor Monitoring in a National Park: A Comparison of Social Media Data and Visitor Survey, ISPRS Int. J. Geo-Inf., 6, 85, https://doi.org/10.3390/ijgi6030085, 2017. a
Hendrikx, J., Johnson, J., and Mannberg, A.: How do we really use terrain in the backcountry? A comparison between stated terrain preferences and observed backcountry travel behaviour, in: Proceedings of the International Snow Science Workshop, Innsbruck, Austria, 7–12 October 2018, 1298–1300, https://www.researchgate.net/publication/328891291_How_do_we_really_use_terrain_in_the_backcountry_A_comparison_between_stated_terrain_preferences_and_observed_backcountry_travel_behaviour (last access: 27 February 2026), 2018. a
Hendrikx, J., Johnson, J., and Mannberg, A.: Tracking decision-making of backcountry users using GPS tracks and participant surveys, Appl. Geogr., 144, 102729, https://doi.org/10.1016/j.apgeog.2022.102729, 2022. a, b, c
Ingold, P.: Freizeitaktivitäten im Lebensraum der Alpentiere, Haupt, Bern, 1–516, ISBN 3-258-06780-5, 2005. a, b
Intercantonal Measurement and Information System IMIS: IMIS measuring network, EnviDat, https://doi.org/10.16904/envidat.406, 2023. a, b, c
Joachims, T.: Optimizing search engines using clickthrough data, in: Proceedings of the eighth ACM SIGKDD international conference on Knowledge discovery and data mining, Edmonton, Alberta, Canada, 23–26 July 2002, ACM, 133–142, https://doi.org/10.1145/775047.775067, ISBN 978-1-58113-567-1, 2002. a
Johnson, J. and Hendrikx, J.: Using Citizen Science to Document Terrain Use and Decision-Making of Backcountry Users, Citizen Science: Theory and Practice, 6, 8, https://doi.org/10.5334/cstp.333, 2021. a
Kandula, S. and Shaman, J.: Reappraising the utility of Google flu trends, PLoS Comput. Biol., 15, e1007258, https://doi.org/10.1371/journal.pcbi.1007258, 2019. a
King, M. A., Abrahams, A. S., and Ragsdale, C. T.: Ensemble methods for advanced skier days prediction, Expert Syst. Appl., 41, 1176–1188, https://doi.org/10.1016/j.eswa.2013.08.002, 2014. a, b, c
Koppen, G., Sang, Å. O., and Tveit, M. S.: Managing the potential for outdoor recreation: Adequate mapping and measuring of accessibility to urban recreational landscapes, Urban For. Urban Gree., 13, 71–83, https://doi.org/10.1016/j.ufug.2013.11.005, 2014. a, b
Krawczyk, B.: Learning from imbalanced data: open challenges and future directions, Progress in Artificial Intelligence, 5, 221–232, https://doi.org/10.1007/s13748-016-0094-0, 2016. a
Kroes, E. P. and Sheldon, R. J.: Stated Preference Methods: An Introduction, J. Transp. Econ. Policy, 22, 11–25, 1988. a
Ladle, R. J., Correia, R. A., Do, Y., Joo, G., Malhado, A. C., Proulx, R., Roberge, J., and Jepson, P.: Conservation culturomics, Front. Ecol. Environ., 14, 269–275, https://doi.org/10.1002/fee.1260, 2016. a
Lamprecht, M., Fischer, A., and Stamm, H.: Sport Schweiz 2014: Sportaktivität und Sportinteresse der Schweizer Bevölkerung, Tech. rep., Bundesamt für Sport BASPO, Magglingen, 56 pp., https://doi.org/10.13140/2.1.2930.0166, 2014. a
Lamprecht, M., Bürgi, R., and Stamm, H.: Sport Schweiz 2020: Sportaktivität und Sportinteresse der Schweizer Bevölkerung, Tech. rep., Bundesamt für Sport BASPO, Magglingen, 62 pp., 2020. a
Lesmerises, F., Déry, F., Johnson, C. J., and St-Laurent, M.-H.: Spatiotemporal response of mountain caribou to the intensity of backcountry skiing, Biol. Conserv., 217, 149–156, https://doi.org/10.1016/j.biocon.2017.10.030, 2018. a
Levin, N., Lechner, A. M., and Brown, G.: An evaluation of crowdsourced information for assessing the visitation and perceived importance of protected areas, Appl. Geogr., 79, 115–126, https://doi.org/10.1016/j.apgeog.2016.12.009, 2017. a, b
Liaw, A. and Wiener, M.: Classification and regression by randomForest, R News, 2, 18–22, 2002. a, b, c, d
Loumiotis, I., Demestichas, K., Adamopoulou, E., Kosmides, P., Asthenopoulos, V., and Sykas, E.: Road Traffic Prediction Using Artificial Neural Networks, in: 2018 South-Eastern European Design Automation, Computer Engineering, Computer Networks and Society Media Conference (SEEDA_CECNSM), Kastoria, Greece, 22–24 September 2018, IEEE, 1–5, https://doi.org/10.23919/SEEDA-CECNSM.2018.8544943, 2018. a
Madden, K., Lukoseviciute, G., Ramsey, E., Panagopoulos, T., and Condell, J.: Forecasting daily foot traffic in recreational trails using machine learning, Journal of Outdoor Recreation and Tourism, 44, 100701, https://doi.org/10.1016/j.jort.2023.100701, 2023. a, b, c
Manley, K. and Egoh, B. N.: Mapping and modeling the impact of climate change on recreational ecosystem services using machine learning and big data, Environ. Res. Lett., 17, 054025, https://doi.org/10.1088/1748-9326/ac65a3, 2022. a, b
Mannberg, A., Hendrikx, J., Landrø, M., and Ahrland Stefan, M.: Who's at risk in the backcountry? Effects of individual characteristics on hypothetical terrain choices, J. Environ. Psychol., 59, 46–53, https://doi.org/10.1016/j.jenvp.2018.08.004, 2018. a
Marengo, D., Monaci, M. G., and Miceli, R.: Winter recreationists' self-reported likelihood of skiing backcountry slopes: Investigating the role of situational factors, personal experiences with avalanches and sensation-seeking, J. Environ. Psychol., 49, 78–85, https://doi.org/10.1016/j.jenvp.2016.12.005, 2017. a, b, c
Marsland, S.: Machine Learning, Chapman and Hall/CRC, https://doi.org/10.1201/9781420067194, ISBN 978-1-4200-6719-4, 2011. a, b
Mashhadi, A., Winder, S. G., Lia, E. H., and Wood, S. A.: Quantifying Biases in Social Media Analysis of Recreation in Urban Parks, in: 2020 IEEE International Conference on Pervasive Computing and Communications Workshops (PerCom Workshops), Austin, TX, USA, 23–27 March 2020, IEEE, 1–7, https://doi.org/10.1109/PerComWorkshops48775.2020.9156262, ISBN 978-1-72814-716-1, 2020. a
McCammon, I.: Heuristic Traps in Recreational Avalanche Accidents: Evidence and Implications, Avalanche News, No. 68, 2004. a
McClung, D.: The Avalanche Handbook, Mountaineers Books, 4th edn., ISBN 978-1-68051-539-8, 2023. a
MeteoSwiss: Klimabulletin Winter 2016/2017, https://www.meteoschweiz.admin.ch/service-und-publikationen/publikationen/berichte-und-bulletins/2017/klimabulletin-winter-2016-2017.html (last access: 27 Febraury 2026), 2017. a
MeteoSwiss: Documentation of MeteoSwiss Grid-Data Products: Hourly Precipitation Estimation through Rain-Gauge and Radar: CombiPrecip, Tech. rep., Federal Office of Meteorology and Climatology MeteoSwiss, https://www.meteoswiss.admin.ch/dam/jcr:2691db4e-7253-41c6-a413-2c75c9de11e3/ProdDoc_CPC.pdf (last access: 27 Febraury 2026), 2021a. a
MeteoSwiss: MeteoSwiss Spatial Climate Analyses: Documentation of Datasets for Users, Tech. rep., Federal Office of Meteorology and Climatology MeteoSwiss, 7 pp., https://www.meteoswiss.admin.ch/climate/the-climate-of-switzerland/spatial-climate-analyses.html (last access: 27 Febraury 2026), 2021b. a
MeteoSwiss: Daily Precipitation (final analysis): RhiresD, Tech. rep., Federal Office of Meteorology and Climatology MeteoSwiss, 6 pp., https://www.meteoschweiz.admin.ch/dam/jcr:4f51f0f1-0fe3-48b5-9de0-15666327e63c/ProdDoc_RhiresD.pdf (last access: 27 Febraury 2026), 2021c. a
MeteoSwiss: Documentation of MeteoSwiss Grid-Data Products: Daily Relative Sunshine Duration: SrelD 1.0, Tech. rep., Federal Office of Meteorology and Climatology MeteoSwiss, 6 pp., https://www.meteoswiss.admin.ch/dam/jcr:981891db-30d1-47cc-a2e1-50c270bdaf22/ProdDoc_SrelD.pdf (last access: 27 Febraury 2026), 2021d. a
MeteoSwiss: Documentation of MeteoSwiss Grid-Data Products: Daily Mean, Minimum and Maximum Temperature: TabsD, TminD, TmaxD 1.2, Tech. rep., Federal Office of Meteorology and Climatology MeteoSwiss, 5 pp., https://www.meteoschweiz.admin.ch/dam/jcr:818a4d17-cb0c-4e8b-92c6-1a1bdf5348b7/ProdDoc_TabsD.pdf (last access: 27 Febraury 2026), 2021e. a
MeteoSwiss: Automatic weather stations, MeteoSwiss [data], https://opendatadocs.meteoswiss.ch/de/a-data-groundbased/a1- automatic-weather-stations#daten-automatisch-herunterladen (last access: 3 March 2026), 2026. a
Minehart, K., Antonio, A. D., Creany, N., Monz, C., and Gutzwiller, K.: Predicting trail condition using random forest models in urban-proximate nature reserves, Environmental Challenges, 15, 100937, https://doi.org/10.1016/j.envc.2024.100937, 2024. a
Mittermeier, J. C., Correia, R., Grenyer, R., Toivonen, T., and Roll, U.: Using Wikipedia to measure public interest in biodiversity and conservation, Conserv. Biol., 35, 412–423, https://doi.org/10.1111/cobi.13702, 2021. a
Montgomery, D. C., Peck, E. A., and Vining, G. G.: Introduction to Linear Regression Analysis, 4th edn., Wiley & Sons, ISBN 0471754951, 2006. a
Moss, G.: Avalanche hazard and visitor numbers – a study in Lochaber, Scotland, in: Proceedings ISSW 2009, International Snow Science Workshop Davos, Switzerland, 27 September–2 October 2009, 628–632, https://arc.lib.montana.edu/snow-science/objects/issw-2009-0628-0632.pdf (last access: 27 Febraury 2026), 2009. a, b, c
Müller, K., Techel, F., and Mitterer, C.: The EAWS matrix, a decision support tool to determine the regional avalanche danger level (Part A): conceptual development, Nat. Hazards Earth Syst. Sci., 25, 4503–4525, https://doi.org/10.5194/nhess-25-4503-2025, 2025. a
Müllner, A., Eduard Linsenmair, K., and Wikelski, M.: Exposure to ecotourism reduces survival and affects stress response in hoatzin chicks (Opisthocomus hoazin), Biol. Conserv., 118, 549–558, https://doi.org/10.1016/j.biocon.2003.10.003, 2004. a
Nichols, T. B., Hawley, A. C., Smith, W. R., Wheeler, A. R., and McIntosh, S. E.: Avalanche Safety Practices Among Backcountry Skiers and Snowboarders in Jackson Hole in 2016, Wild. Environ. Med., 29, 493–498, https://doi.org/10.1016/j.wem.2018.05.004, 2018. a
Niemann, D., Paul, S., and Rahman, H. H.: Avalanche Preparedness and Accident Analysis Among Backcountry Skier, Sidecountry, and Snowmobile Fatalities in the United States: 2009 to 2019, Wild. Environ. Med., 33, 197–203, https://doi.org/10.1016/j.wem.2022.03.006, 2022. a, b
Nonnecke, B. and Preece, J.: Shedding light on lurkers in online communities, Ethnographic studies in real and virtual environments: Inhabited information spaces and connected communities, Edinburgh, 24–26 January 1999, 123–128, 1999. a
Norman, P., Pickering, C. M., and Castley, G.: What can volunteered geographic information tell us about the different ways mountain bikers, runners and walkers use urban reserves?, Landscape Urban Plan., 185, 180–190, https://doi.org/10.1016/j.landurbplan.2019.02.015, 2019. a, b
Nyelele, C., Keske, C., Chung, M. G., Guo, H., and Egoh, B. N.: Using social media data and machine learning to map recreational ecosystem services, Ecol. Indic., 154, 110606, https://doi.org/10.1016/j.ecolind.2023.110606, 2023. a, b
Olson, L. E., Squires, J. R., Roberts, E. K., Miller, A. D., Ivan, J. S., and Hebblewhite, M.: Modeling large-scale winter recreation terrain selection with implications for recreation management and wildlife, Appl. Geogr., 86, 66–91, https://doi.org/10.1016/j.apgeog.2017.06.023, 2017. a, b
Otis, D. L. and White, G. C.: Autocorrelation of Location Estimates and the Analysis of Radiotracking Data, J. Wildlife Manage., 63, 1039, https://doi.org/10.2307/3802819, 1999. a
Owuor, I., Hochmair, H. H., and Paulus, G.: Use of social media data, online reviews and wikipedia page views to measure visitation patterns of outdoor attractions, Journal of Outdoor Recreation and Tourism, 44, 100681, https://doi.org/10.1016/j.jort.2023.100681, 2023. a
Peirce, C. S.: The Numerical Measure of the Success of Predictions, Science, ns-4, 453–454, https://doi.org/10.1126/science.ns-4.93.453.b, 1884. a
Pfeifer, C.: On probabilities of avalanches triggered by alpine skiers. An empirically driven decision strategy for backcountry skiers based on these probabilities, Nat. Hazards, 48, 425–438, https://doi.org/10.1007/s11069-008-9270-2, 2009. a
Pfeifer, C., Höller, P., and Zeileis, A.: Spatial and temporal analysis of fatal off-piste and backcountry avalanche accidents in Austria with a comparison of results in Switzerland, France, Italy and the US, Nat. Hazards Earth Syst. Sci., 18, 571–582, https://doi.org/10.5194/nhess-18-571-2018, 2018. a, b
Pielmeier, C., Marty, C., and Techel, F.: Schnee und Lawinen in den Schweizer Alpen 2021/22: Wetter, Schneedecke und Lawinengefahr in den Schweizer Alpen, WSL-Institut für Schnee- und Lawinenforschung SLF, Davos, Switzerland, WSL Berichte, 128, 72 pp., https://doi.org/10.55419/wsl:32462, 2023. a
Rutty, M. and Andrey, J.: Weather Forecast Use for Winter Recreation, Weather Clim. Soc., 6, 293–306, https://doi.org/10.1175/WCAS-D-13-00052.1, 2014. a, b
Santos, M. L. B. D.: The “so-called” UGC: an updated definition of user-generated content in the age of social media, Online Inform. Rev., 46, 95–113, https://doi.org/10.1108/OIR-06-2020-0258, 2022. a
Scherrer, S. C. and Appenzeller, C.: Fog and low stratus over the Swiss Plateau – a climatological study, Int. J. Climatol., 34, 678–686, https://doi.org/10.1002/joc.3714, 2014. a
Schäfer, L.: Code and data for: Tracking the slopes: a spatio-temporal prediction model for backcountry skiing activity in the Swiss Alps using user-generated content, Version v1, Zenodo [data set/code], https://doi.org/10.5281/zenodo.18838099, 2026. a, b
Schirpke, U., Meisch, C., Marsoner, T., and Tappeiner, U.: Revealing spatial and temporal patterns of outdoor recreation in the European Alps and their surroundings, Ecosyst. Serv., 31, 336–350, https://doi.org/10.1016/j.ecoser.2017.11.017, 2018. a, b, c
Schmudlach, G.: Avalanche Risk Property Dataset (ARPD) User Manual (V3.1.2), https://wiki.skitourenguru.com/common/data/ARPD_Manual_3.1.2.pdf (last access: 27 February 2026), 2022. a
Schmudlach, G. and Eisenhut, A.: A Routing Algorithm for Backcountry Ski Tours, in: Proceedings of the International Snow Science Workshop, Tromsø, Norway, 1, 1489–1495, 2024. a, b
Schmudlach, G. and Köhler, J.: Automated Avalanche Risk Rating of Backcountry Ski Routes, in: Proceedings of the International Snow Science Workshop, Beckenridge, CO, USA, 1, 450–456, 2016. a, b, c
Schmudlach, G., Winkler, K., and Köhler, J.: Quantitative risk reduction method (QRM), a data-driven avalanche risk estimator, in: Proceedings ISSW, 1272–1278, 2018. a
Schönenberger, C.: Analysis of planned route trajectories to gain insights into route planning behaviour for backcountry ski tours, Master's thesis, University of Zurich, https://lean-gate.geo.uzh.ch/typo3conf/ext/qfq/Classes/Api/download.php/mastersThesis/67 (last access: 26 February 2026), 2018. a, b, c
Schweizer, J. and Techel, F.: Lawinenunfälle Schweizer Alpen. Zahlen und Fakten der letzten 20 Jahre, Bergundsteigen, 98, 44–48, 2017. a
Schwietering, A., Steinbauer, M., Mangold, M., Sand, M., and Audorff, V.: Digitalization of planning and navigating recreational outdoor activities, German Journal of Exercise and Sport Research, 54, 107–114, https://doi.org/10.1007/s12662-023-00927-1, 2024. a
Sharp, E., Haegeli, P., and Welch, M.: Patterns in the exposure of ski guides to avalanche terrain, in: Proceedings of the International Snow Science Workshop, Innsbruck, Austria, https://api.semanticscholar.org/CorpusID:226225194 (last access: 26 February 2026), 2018. a
Silverton, N. A., McIntosh, S. E., and Kim, H. S.: Risk Assessment in Winter Backcountry Travel, Wild. Environ. Med., 20, 269–274, https://doi.org/10.1580/08-WEME-OR-209R1.1, 2009. a
Skitourenguru GmbH: Avalanche Risk Property Dataset (ARPD), Skitourenguru GmbH [data set], https://wiki.skitourenguru.com/de/articles/a0065.html (last access: 3 March 2026), 2026a. a
Skitourenguru GmbH: Route Click Statistics Dataset (RCSD), Skitourenguru GmbH [data set], https://wiki.skitourenguru.com/de/articles/a0068.html (last access: 3 March 2026), 2026b. a
SLF: Long-term Avalanche Statistics, https://www.slf.ch/en/avalanches/avalanches-and-avalanche-accidents/long-term-statistics (last access: 8 December 2025), 2025. a
Sonter, L. J., Watson, K. B., Wood, S. A., and Ricketts, T. H.: Spatial and Temporal Dynamics and Value of Nature-Based Recreation, Estimated via Social Media, PLoS ONE, 11, e0162372, https://doi.org/10.1371/journal.pone.0162372, 2016. a
Spreafico, M. and Weingartner, R.: The hydrology of Switzerland: Selected aspects and results, Reports of the FOWG, Water Series, Berne, https://scnat.ch/en/uuid/i/a122cfa5-aba4-56c4-bc56-f79d0139f936-The_Hydrology_of_Switzerland (last access: 27 February 2026), 2005. a
Stahl Olafsson, A., Purves, R. S., Wartmann, F. M., Garcia-Martin, M., Fagerholm, N., Torralba, M., Albert, C., Verbrugge, L. N., Heikinheimo, V., Plieninger, T., Bieling, C., Kaaronen, R., Hartmann, M., and Raymond, C. M.: Comparing landscape value patterns between participatory mapping and geolocated social media content across Europe, Landscape Urban Plan., 226, 104511, https://doi.org/10.1016/j.landurbplan.2022.104511, 2022. a
Swets, J.: Measuring the accuracy of diagnostic systems, Science, 240, 1285–1293, 1988. a
Sykes, J., Hendrikx, J., Johnson, J., and Birkeland, K. W.: Combining GPS tracking and survey data to better understand travel behavior of out-of-bounds skiers, Appl. Geogr., 122, 102261, https://doi.org/10.1016/j.apgeog.2020.102261, 2020. a
Sykes, J., Haegeli, P., Atkins, R., Mair, P., and Bühler, Y.: Development of operational decision support tools for mechanized ski guiding using avalanche terrain modeling, GPS tracking, and machine learning, Nat. Hazards Earth Syst. Sci., 25, 1255–1292, https://doi.org/10.5194/nhess-25-1255-2025, 2025. a
Taczanowska, K., Bielański, M., González, L.-M., Garcia-Massó, X., and Toca-Herrera, J.: Analyzing Spatial Behavior of Backcountry Skiers in Mountain Protected Areas Combining GPS Tracking and Graph Theory, Symmetry, 9, 317, https://doi.org/10.3390/sym9120317, 2017. a
Techel, F., Zweifel, B., Winkler, K., and Baur, R.: Patterns of Recreational Backcountry Usage—Analyzing Data from Social Media Mountaineering Networks and Avalanche Statistics, in: Proceedings of the International Snow Science Workshop, Banff, Canada, 29 September–3 October 2014, https://doi.org/10.13140/2.1.2491.7761, 2014. a, b, c, d
Techel, F., Zweifel, B., and Winkler, K.: Analysis of avalanche risk factors in backcountry terrain based on usage frequency and accident data in Switzerland, Nat. Hazards Earth Syst. Sci., 15, 1985–1997, https://doi.org/10.5194/nhess-15-1985-2015, 2015. a, b, c, d, e, f, g, h, i, j, k
Techel, F., Mitterer, C., Ceaglio, E., Coléou, C., Morin, S., Rastelli, F., and Purves, R. S.: Spatial consistency and bias in avalanche forecasts – a case study in the European Alps, Nat. Hazards Earth Syst. Sci., 18, 2697–2716, https://doi.org/10.5194/nhess-18-2697-2018, 2018. a
Tenkanen, H., Di Minin, E., Heikinheimo, V., Hausmann, A., Herbst, M., Kajala, L., and Toivonen, T.: Instagram, Flickr, or Twitter: Assessing the usability of social media data for visitor monitoring in protected areas, Scientific Reports, 7, 17615, https://doi.org/10.1038/s41598-017-18007-4, 2017. a, b, c, d
Toft, H., Sirotkin, A., Landrø, M., Engeset, R. V., and Hendrikx, J.: Challenges of Using Signaling Data From Telecom Network in Non-Urban Areas, Journal of Trial and Error, 3, 72–84, https://doi.org/10.36850/e14, 2023. a, b
Toft, H., Mannberg, A., Stefan, M., Aase, M., and Hetland, A.: Choosing to hold 'em or fold 'em – Effects of avalanche forecast information on terrain exposure, in: Proceedings of the International Snow Science Workshop, Tromsø, Norway, 23–27 September 2024, 1552–1559, 2024. a, b, c, d
Toft, H. B., Karlsen, K., Landrø, M., Mannberg, A., Hendrikx, J., and Hetland, A.: Who skis where, when? – A method to enumerate backcountry usage, Cold Reg. Sci. Technol., 230, 104370, https://doi.org/10.1016/j.coldregions.2024.104370, 2025. a, b, c, d, e, f, g, h
Tversky, A. and Kahneman, D.: Judgment under Uncertainty: Heuristics and Biases: Biases in judgments reveal some heuristics of thinking under uncertainty, Science, 185, 1124–1131, https://doi.org/10.1126/science.185.4157.1124, 1974. a
Valle, E. A., Cobourn, A. P., Trivitt, S. J., Hendrikx, J., Johnson, J. D., and Fiore, D. C.: Perceptions Among Backcountry Skiers During the COVID-19 Pandemic: Avalanche Safety and Backcountry Habits of New and Established Skiers, Wild. Environ. Med., 33, 429–436, https://doi.org/10.1016/j.wem.2022.08.005, 2022. a
Venter, Z. S., Gundersen, V., Scott, S. L., and Barton, D. N.: Bias and precision of crowdsourced recreational activity data from Strava, Landscape Urban Plan., 232, 104686, https://doi.org/10.1016/j.landurbplan.2023.104686, 2023. a
Verbos, R. I., Altschuler, B., and Brownlee, M. T. J.: Weather Studies in Outdoor Recreation and Nature-Based Tourism: A Research Synthesis and Gap Analysis, Leisure Sci., 40, 533–556, https://doi.org/10.1080/01490400.2017.1325794, 2018. a, b
Walcher, M., Haegeli, P., and Fuchs, S.: Risk of Death and Major Injury from Natural Winter Hazards in Helicopter and Snowcat Skiing in Canada, Wild. Environ. Med., 30, 251–259, https://doi.org/10.1016/j.wem.2019.04.007, 2019. a
Wardman, M.: A Comparison of Revealed Preference and Stated Preference Models of Travel Behaviour, J. Transp. Econ. Policy, 22, 71–91, 1988. a
Wartmann, F., Baer, M., Hegetschweiler, K., Fischer, C., Hunziker, M., and Purves, R.: Assessing the potential of social media for estimating recreational use of urban and peri-urban forests, Urban For. Urban Gree., 64, 127261, https://doi.org/10.1016/j.ufug.2021.127261, 2021. a, b
Wegelin, P., Von Arx, W., and Thao, V. T.: Weather myths: how attractive is good weather really for same-day visits to outdoor recreation destinations?, Tourism Recreation Research, 49, 1–13, https://doi.org/10.1080/02508281.2022.2148076, 2022. a, b
Willibald, F., Van Strien, M. J., Blanco, V., and Grêt-Regamey, A.: Predicting outdoor recreation demand on a national scale – The case of Switzerland, Appl. Geogr., 113, 102111, https://doi.org/10.1016/j.apgeog.2019.102111, 2019. a, b, c
Winkler, K., Fischer, A., and Techel, F.: Avalanche Risk in Winter Backcountry Touring: Status and Recent Trends in Switzerland, in: Proceedings of the International Snow Science Workshop, Breckenridge, CO, USA, 3–7 October 2016, 270–276, 2016. a
Winkler, K., Schmudlach, G., Degraeuwe, B., and Techel, F.: On the correlation between the forecast avalanche danger and avalanche risk taken by backcountry skiers in Switzerland, Cold Reg. Sci. Technol., 188, 103299, https://doi.org/10.1016/j.coldregions.2021.103299, 2021. a, b, c, d, e
Wood, S. A., Guerry, A. D., Silver, J. M., and Lacayo, M.: Using social media to quantify nature-based tourism and recreation, Scientific Reports, 3, 2976, https://doi.org/10.1038/srep02976, 2013. a, b, c
WSL Institute for Snow and Avalanche Research SLF: Manual measuring network, EnviDat, https://doi.org/10.16904/envidat.408, 2023. a, b
WSL Institute for Snow and Avalanche Research SLF: Lawinenbulletin 2013–2024, https://www.slf.ch/de/lawinenbulletin-und-schneesituation/archiv/ (last access: 27 February 2026), 2024. a
Zweifel, B., Räz, A., and Stucki, T.: Avalanche risk for recreationists in backcountry and in off-piste area: surveying methods and pilot study at Davos, Switzerland, in: Proceedings International Snow Science Workshop, Telluride, CO, USA, 1–6 October 2006, 733–741, 2006. a, b, c, d, e, f
Zweifel, B., Pielmeier, C., Marty, C., and Techel, F.: Schnee und Lawinen in den Schweizer Alpen. Hydrologisches Jahr 2016/17, in: WSL Berichte 61, 79 pp., WSL-Institut für Schnee- und Lawinenforschung SLF; Eidg. Forschungsanstalt für Wald, Schnee und Landschaft WSL, Davos; Birmensdorf, https://www.slf.ch/de/lawinenbulletin-und-schneesituation/winterberichte/schnee-und-lawinen-in-den- schweizer-alpen-hydrologisches-jahr-201617/#c271093 (last access: 27 February 2026), 2017. a
- Abstract
- Introduction
- Background
- Material and Methods
- Results and Interpretation
- Discussion
- Conclusion and Outlook
- Appendix A: Holidays
- Appendix B: Training Data
- Code availability
- Data availability
- Author contributions
- Competing interests
- Disclaimer
- Acknowledgements
- Financial support
- Review statement
- References
- Supplement