the Creative Commons Attribution 4.0 License.
the Creative Commons Attribution 4.0 License.
 | 07 Jan 2026
Dynamic analysis of drought propagation in the context of climate change and watershed characterization: a quantitative study based on GAMLSS and Copula models
Min Li
Zilong Feng
Mingfeng Zhang
Lijie Shi
Yuhang Yao
Investigating the processes governing drought propagation under a changing environment is essential for advancing drought early warning and reducing socio-economic risks. Currently, few studies have analyzed the effects of meteorological factors and watershed characteristics on drought propagation based on non-stationary drought indices. In this paper, the probabilities and thresholds of meteorological drought to hydrological drought propagation were calculated using the non-stationary drought index constructed using the Generalized Additive Model for Location, Scale, and Shape (GAMLSS) model and the Copula function to assess the influence of large-scale climatic indices, meteorological elements, and watershed characteristics on the propagation characteristics of seasonal droughts. The results showed that non-stationary drought indices that incorporate meteorological factors tended to have a better performance than standardized drought indices. Under the combined influence of large-scale climatic indices, temperature, specific humidity, and wind speed, the propagation probabilities became larger especially during spring and winter in the upstream and midstream regions of the Luanhe River Basin, China, with the propagation thresholds in winter significantly increases by 0.1–0.2. These mean that hydrologic droughts are more likely to be triggered. Furthermore, the spatial variability of drought propagation is further influenced by watershed characteristics, including the slope and leaf area index, which collectively alter runoff generation processes.
- Article
(10855 KB) - Full-text XML
-
Supplement
(439 KB) - BibTeX
- EndNote


As one of the major climate problems, meteorological drought poses a serious threat to the ecological environment and social economy (Wang et al., 2022a; Hao et al., 2019; Kumar et al., 2019). In a drought event, meteorological drought often occurs first and insufficient precipitation leads to hydrological drought or agricultural drought through the hydrological cycle (Han et al., 2019; Zhang et al., 2022a; Zhong et al., 2020). This process of meteorological drought triggering hydrological or agricultural drought is called inter-type drought propagation (Zhang et al., 2021; Wossenyeleh et al., 2021; Apurv and Cai, 2020; Jehanzaib et al., 2020). After suffering from numerous drought disasters, it is widely recognized that the impact of drought on human life can be reduced by investigating the propagation of droughts (Pandey et al., 2022; Dehghani et al., 2019; Le et al., 2016).
Drought is often studied based on drought indices, and the choice of drought index is crucial for characterizing regional drought (Mahmoudi et al., 2019; Tao et al., 2021; Xu et al., 2021). Some drought indices: the Standardized Precipitation Index (SPI), the Standardized Precipitation Evapotranspiration Index (SPEI), the Standardized Runoff Index (SRI) and the Standardized Soil moisture Index (SSI) are used to describe the drought characteristics of a region (Mckee et al., 1993; Vicente-Serrano et al., 2010; Shukla and Wood, 2008; Xu et al., 2021). In recent years, scholars have made a lot of efforts to examine drought propagation characteristics, employing a wide range of analytical tools including both statistical analyses and model simulations. Such as the Copula models (Wu et al., 2022b; Wang et al., 2022b; Guo et al., 2020), Markov models (Yeh and Hsu, 2019; Vorobevskii et al., 2022), and Variable Infiltration Capacity (VIC) model (Bhardwaj et al., 2020; Lilhare et al., 2020). Wang et al. (2022) analyzed the propagation probability characteristics of meteorological drought to hydrological drought in the Yiluo River Basin based on the Copula function. Sattar et al. (2020) assessed the propagation probability of meteorological drought to different categories of hydrological drought in the Han River basin using Markov Bayesian Classifier and conditional probabilities. Bhardwaj et al. (2020) assessed drought propagation characteristics in India based on the SPI and VIC models.
Some studies have shown that under the dual influence of climate change and human activities, the spatiotemporal evolution characteristics of drought are difficult to analyze (Wu et al., 2022a; Jehanzaib et al., 2020; Zhou et al., 2019). Therefore, scholars analyzed the factors that affect the propagation of droughts around the world (Li et al., 2019b). For instance, Jehanzaib et al. (2020) and Peña-Gallardo et al. (2019) have found that climate type, climate change, catchment characteristics, and other factors can affect the propagation of drought. Ding et al. (2021) showed the effect of climate on drought propagation by comparing the differences in propagation time from meteorological drought to hydrological drought in different climatic regions of China. Guo et al. (2021) assessed the impact of large reservoirs on propagation by comparing differences in drought propagation characteristics before and after reservoir construction.
Under the influence of climate change and human activities, precipitation and runoff series show significant non-stationarity and uncertainty, and drought studies become more complex and urgent (Wang et al., 2015b; Wang et al., 2020; Jehanzaib et al., 2023). Therefore, researchers incorporate non-stationarity into drought studies through more appropriate analytical tools. The GAMLSS model is one of the commonly used methods. Previously, researchers mostly used the non-stationary drought index constructed based on the GAMLSS model to assess the impacts of climate change, human activities, and other factors on a single drought, indicating that the non-stationary drought indices have a better performance than the stationary drought index in drought research (Shao et al., 2022; Wang et al., 2023). Since then, the non-stationary drought indices have been gradually applied to the study of drought propagation. Das et al. (2022) constructed non-stationary meteorological and hydrological drought indices using large-scale climatic factors and regional meteorological elements as covariates for precipitation and runoff, respectively, and assessed the impact of external drivers on drought propagation characteristics. Overall, fewer studies incorporate non-stationary drought indices into drought propagation.
As the main source of water supply for the Beijing-Tianjin-Tangshan area, the Luanhe River Basin is responsible for multiple tasks such as urban water supply, and industrial and agricultural water supply. Frequent droughts in recent years have not only affected the supply of regional water resources but also had a serious impact on the ecological environment. Therefore, an in-depth understanding of the evolution pattern and impact mechanism of drought is of great significance to the rational allocation of water resources and sustainable development of the basin. According to some recent studies, there are non-stationary characteristics in the precipitation series and the runoff series of the Luanhe River Basin (Li et al., 2019a; Li et al., 2020) and the occurrence of drought in Luanhe River Basin may be related to some large-scale climatic indices (Wang et al., 2018; Li et al., 2015; Wang et al., 2016). Wang et al. (2016) pointed out that the Atlantic Multi-Year Oscillation (AMO) has a significant effect on drought in the Luan River Basin. In addition, meteorological factors are also important in influencing droughts in the basin. Chen et al. (2022) pointed out that the increase in temperature will lead to more frequent hydrological droughts in the Luan River basin in the future. Previous studies on the Luanhe River Basin have focused on examining the effects of large-scale climatic factors on a single type of drought, with few assessments of the effects of large-scale climatic indices and regional meteorological elements on drought propagation (Li et al., 2015; Wang et al., 2015a; Li et al., 2024b).
Although some progress has been made in the study of drought propagation, there are few studies considering the impact of changing environments. Furthermore, spatial and temporal differences in drought propagation are strongly related to watershed characteristics. To evaluate the influence of external driving factors on drought propagation, NSPI and NSRI were constructed based on GAMLSS framework with climate indices and meteorological factors as covariables. The propagation probability and propagation threshold of meteorological drought to hydrological drought were calculated by Copula model under stationary and non-stationary conditions in different seasons, respectively. The effects of climate change on drought propagation were quantified at a seasonal scale, and the impacts of watershed characteristics on drought propagation were explored.
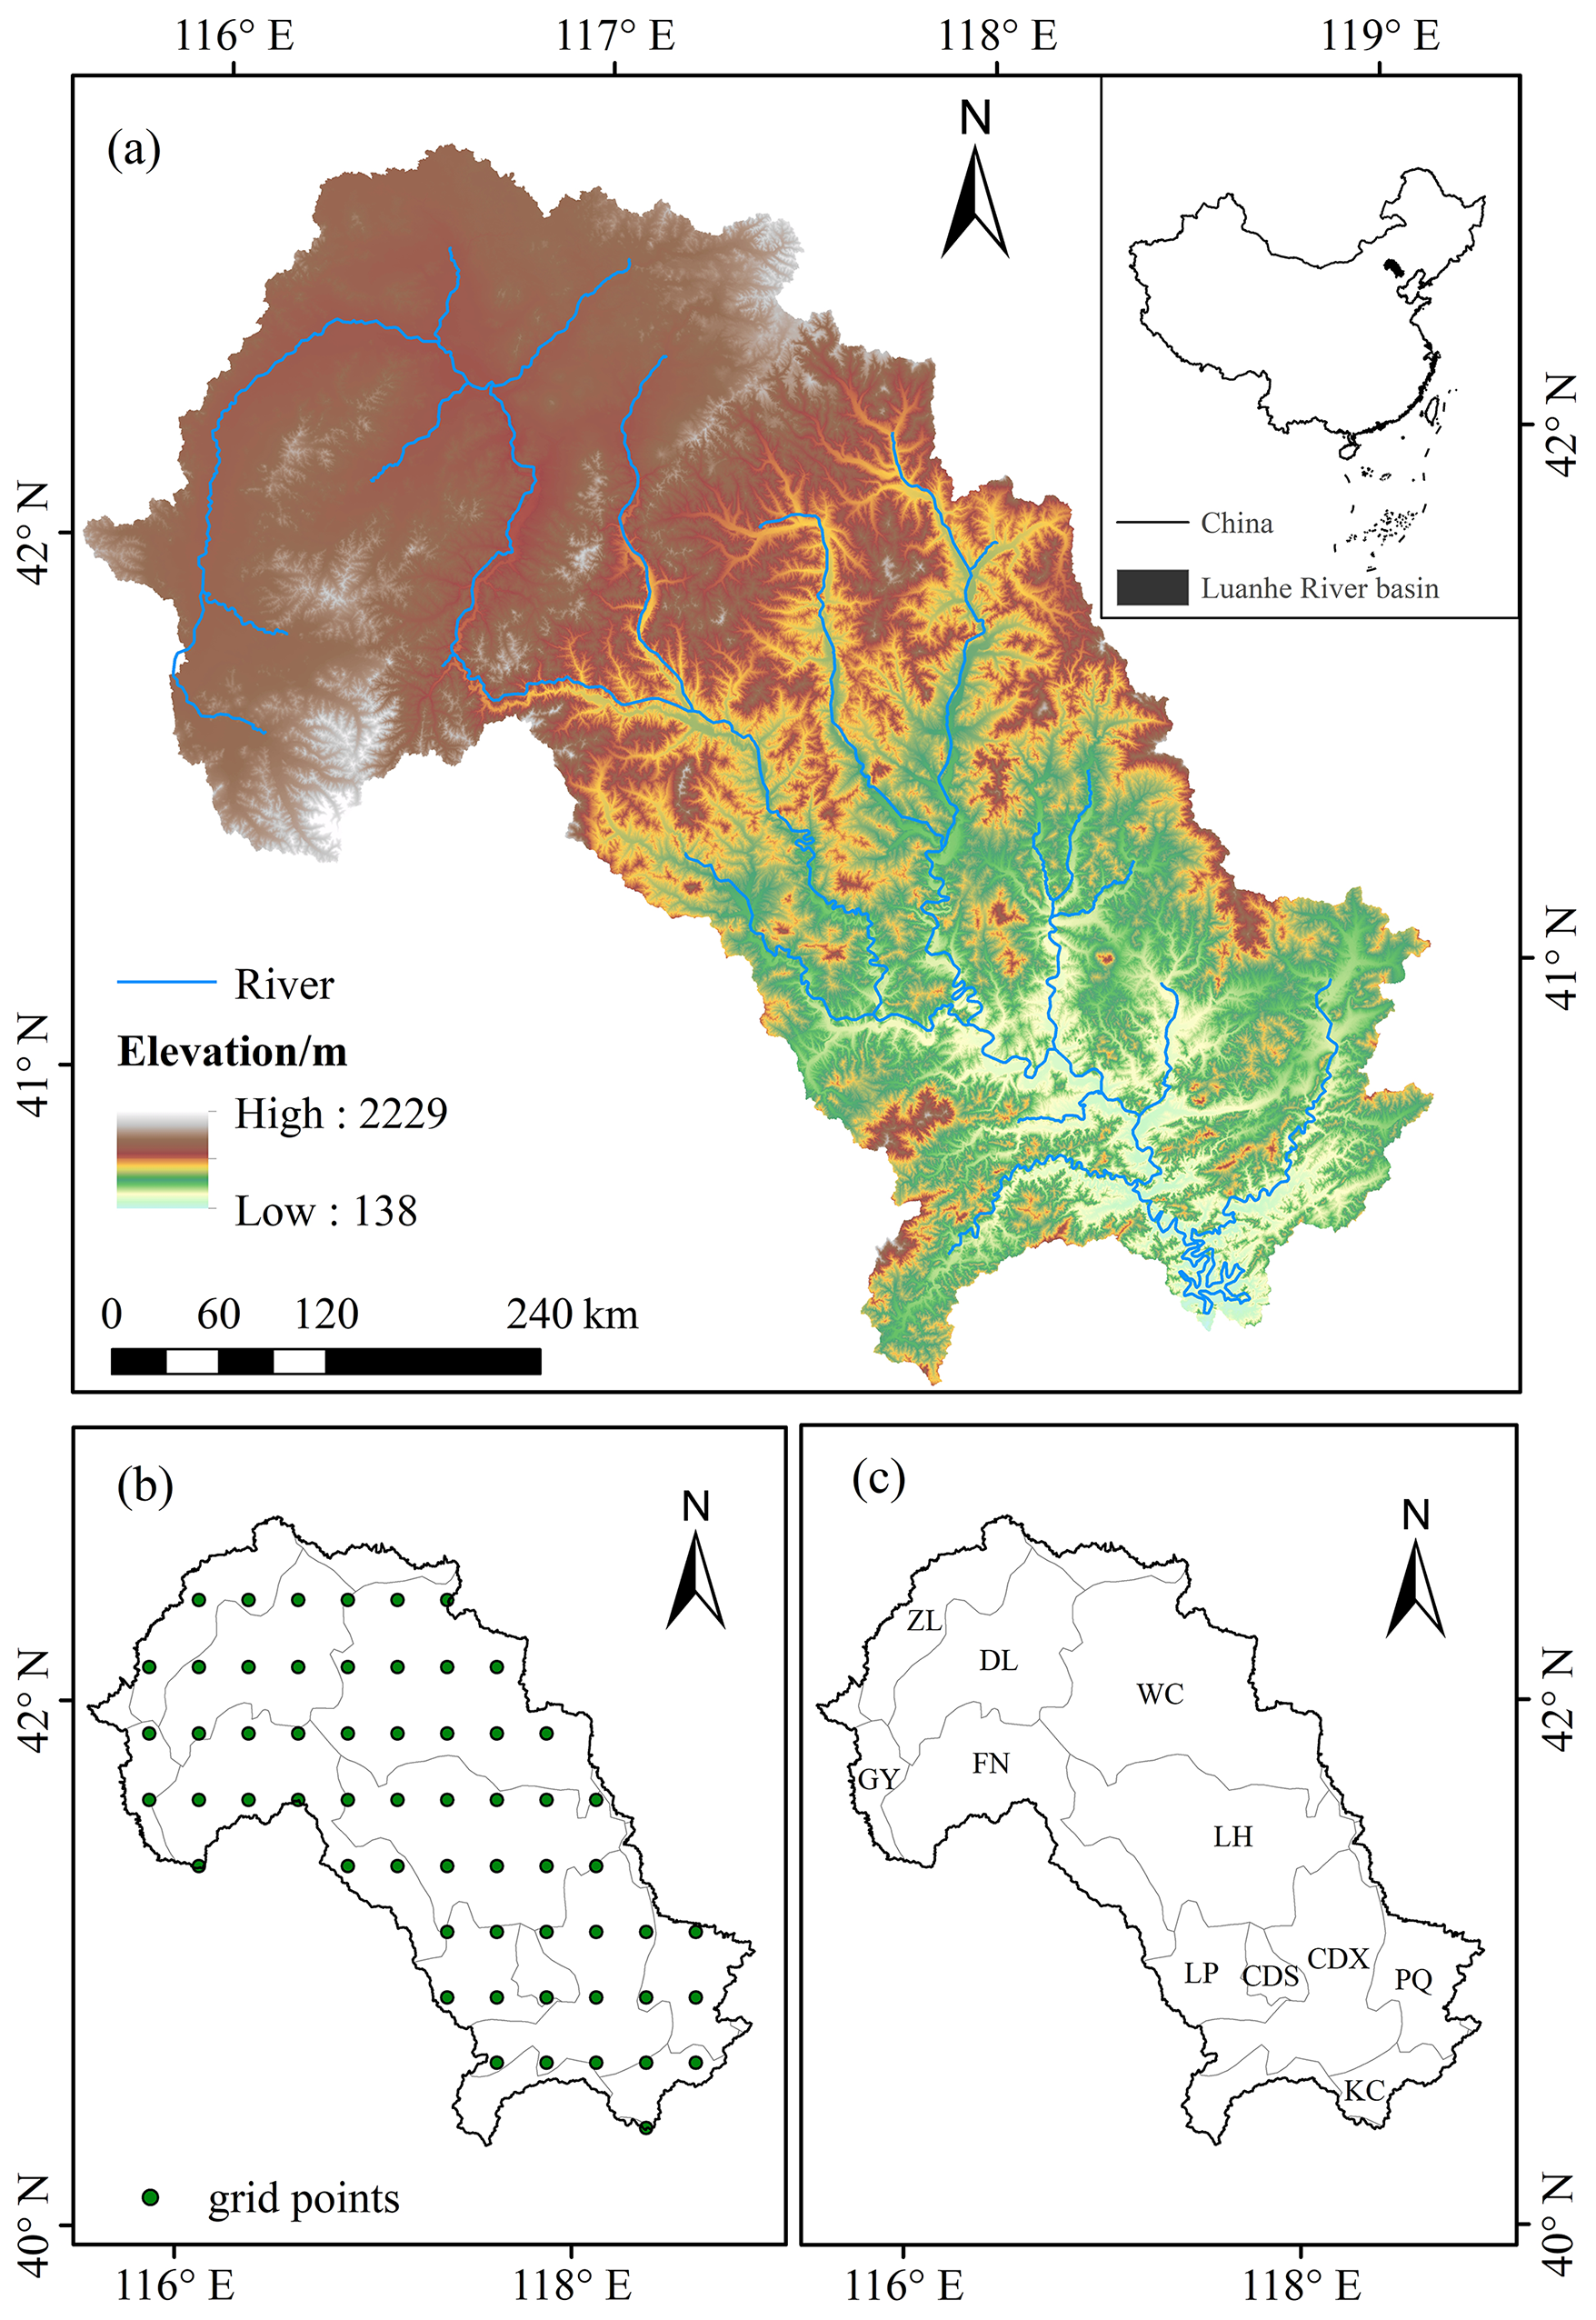
Figure 1The geographical location of the Luanhe River Basin (a), and the grid points contained in the watershed boundaries (b), 11 subregions contained in the watershed (c).
The Luanhe River is the second largest river in Hebei Province, China, and its geographical location is shown in Fig. 1a. The area of the basin is about 44 750 km2, with an average width of 90 km from east to west and a length of 500 km from north to south, including a mountainous area of 43 940 km2 (Li et al., 2024a). There are obvious differences in physical and geographical conditions, and the topography of the whole basin is high in the northwest and low in the southeast.
The surface is flat and the river valley is wide and shallow in the Luanhe River basin. The climate difference between the north and south of the Luanhe River basin is obvious. The annual mean temperature ranges from 1 to 11 °C, while the July mean temperature ranges from 17 to 25 °C (Gao et al., 2024). Affected by the continental monsoon climate, the basin has four distinct seasons of precipitation, with an average annual precipitation of 400–800 mm, of which summer precipitation accounts for 67 %–76 % of the total annual precipitation; spring and autumn account for about 9 % and 15 %, respectively; and winter precipitation accounts for only about 2 % (Li et al., 2023). The climate type changes from cold temperate arid and semi-arid climate to warm temperate semi-humid climate.
With global climate change, drought disasters in the Luanhe River Basin are becoming increasingly frequent, causing serious losses to the region's ecology and socio-economy. According to historical records, the main drought events in the Luanhe River Basin occurred in 1961, 1963, 1968, 1972, 1980–1984, 2000, 2007, and 2009. The cumulative economic losses caused by drought disasters in the basin during the period from 1960 to 2010 exceeded CNY 13 billion. Under the influence of climate change and human activities, the characteristics of drought propagation in the basin become more complex.

In this paper, the large-scale climatic indices (abbreviated as CI) Nino3.4, Atlantic Multidecadal Oscillation (AMO), Southern Oscillation Index (SOI), Pacific Decadal Oscillation (PDO), Arctic Oscillation (AO), North Atlantic Oscillation (NAO) and North Pacific (NP) data are derived from the National Oceanic and Atmospheric Administration (NOAA) (http://www.esrl.noaa.gov/psd/data/climateindices, last access: 2 April 2025) (1960–2014). The average monthly precipitation, temperature, wind speed, specific humidity, evapotranspiration, and runoff datasets are available at a grid resolution of 0.25° Lat × 0.25° Lon and are obtained from Global Land Data Assimilation System (GES DISC Dataset: GLDAS Noah Land Surface Model L4 monthly 0.25 × 0.25 degree V2.0 (GLDAS_e NOAH025_e M 2.0)). The grid-wise analysis is carried out at a resolution of 0.25° Lat × 0.25° Lon over the Luanhe River which includes 58 grid points (Fig. 1b). Leaf area index of 0.25° spatial resolution was derived from the Advanced Very High Resolution Radiometer (AVHRR) Global Inventory Modeling and Mapping Studies (GIMMS) LAI3g version 2 (https://daac.ornl.gov/cgi-bin/dsviewer.pl?ds_id=1653, last access: 2 April 2025) (1981–2015). The slope data is extracted from 90 m resolution DEM data, and the data set is provided by Geospatial Data Cloud site, Computer Network Information Center, Chinese Academy of Sciences (http://www.gscloud.cn, last access: 2 April 2025). In addition, based on county-level administrative divisions, this study divides the research area into 11 sub-regions, namely ZL, DL, GY, FN, WC, LH, LP, CDS, CDX, PQ, and KC (Fig. 1c). Based on geographical features, the watershed is divided into three parts: upstream, midstream, and downstream. The upstream region includes ZL, DL, GY, FN, and the northern part of WC; the midstream region includes the southern part of FN, the southern part of WC, LH, and LP; and the downstream region includes CDS, CDX, PQ, and KC.
The current study aims to assess the impact of external drivers on drought propagation based on the GAMLSS model, in particular, the probability and threshold of drought propagation in different seasons. Figure 2 summarizes the steps of the current study. First, the standardized drought indices SPI and SRI were calculated based on monthly-scale rainfall and runoff. Then, the non-stationary drought indices NSPI and NSRI were calculated using the large-scale climate indices and regional meteorological factors as covariates of the non-stationary Gamma distribution parameters of the rainfall and runoff series, respectively. Finally, based on the copula function, the drought propagation probability and threshold under stationary and non-stationary conditions were calculated, and the impact of external driving factors on the propagation of meteorological drought to hydrological drought was analyzed and quantified.
3.1 The calculation of drought index
3.1.1 Stationary Model
Based on precipitation data, the SPI is constructed using hydrological statistical principles and standardization methods. The index has the advantages of convenient data collection, simple calculation, and is suitable for multi-spatiotemporal scale calculations. Suppose that the precipitation series x at a certain time scale satisfies the probability density function of Gamma distribution f(x):
In the formula, α and β are shape and scale parameters (α > 0, β > 0) and they are treated as constants in the GAMLSS framework. The cumulative probability of precipitation is as follows:
The corresponding SPI is obtained by normalizing the cumulative probability F(x) of each item. The cumulative probability normalization method is based on the inverse normal function algorithm proposed by Abramowitz and Stegun (1965).
If :
If :
Here: c0=2.515517, c1=0.802853, c2=0.010328, d1=1.4132788, d2=0.189269 and d3=0.001308.
As a drought index that can effectively and accurately describe the hydrological drought characteristics of the basin, SRI can be calculated by replacing the precipitation sequence with the runoff sequence and the calculation method of SRI is similar to that of SPI. Table 1 shows the drought class classification (Kolachian and Saghafian, 2021).
Table 1Drought class classification and corresponding SPI values and SRI value.

3.1.2 Nonstationary Model
Generalized Additive Models for Location, Scale, and Shape (GAMLSS) proposed by Rigby and Stasinopoulos (2005) can flexibly analyze non-stationary time series, more details of GAMLSS are available in Rigby and Stasinopoulos (2005). In recent years it has often been applied to capture non-stationary in series such as precipitation and runoff. The non-stationary model presented in this paper is based on the study by Das et al. (2022). To better study the seasonal characteristics of drought and capture the changes in meteorological elements caused by seasonal climate change, this paper chooses the drought index on a 3 month time scale to analyze the propagation characteristics of drought, and the GAMLSS model is used to construct a non-stationary model for the analysis of precipitation and runoff changes. By incorporating large-scale climate factors as covariates, a non-stationary meteorological drought index is constructed and used to capture the non-stationary characteristics of precipitation series in the basin. In this paper, based on the calculation principle of the standardized drought index, the non-stationary Gamma distribution of precipitation and runoff is constructed based on the GAMLSS model. The correlated climate variables are selected from these large-scale climate factors (e.g., AMO, SOI, PDO, AO, NAO, and NP). To capture the non-stationary characteristics of the basin runoff sequence, the non-stationary hydrological drought index (NSRI) was constructed. The meteorological variables (wind speed, temperature, and specific humidity) were considered as covariates for the non-stationary model of hydrological drought index. The semi-parametric additive model formula used in this study is as follows:
where g1(αt) and g2(βt) are the link functions, which are determined by the domain of the statistical parameter, namely, if the domain of the distributed parameter αt and βt are , the link functions are g1(αt)=αt and g1(βt)=βt, if , then g1(αt)=ln αt and g2(βt)=ln βt. The hjk represents the dependence function of the distribution parameters on the covariates cjk. The parameter coefficients and model residuals are estimated by RS algorithm, and whether the model residuals approximately satisfy the normal distribution is analyzed, and the optimal fitting distribution is selected by AIC (Akaike Information Criterion), SBC (Schwarz Bayesian Criterion), and GD (Global Deviance).
3.2 The Copula model
In multivariate drought probability analysis, the Copula function is an effective tool for constructing multivariate joint drought distributions with multiple characteristics based on the univariate distribution and the linkage structure between random variables. The equation is expressed as follows:
where C is the two-dimensional Copula function, F(x,y) is a joint distribution function, FX(x) and FY(y) are the marginal distribution functions of two random variables X and Y, respectively. Before establishing the joint distribution, the marginal distribution of the random variables needs to be determined, and in this study, the normal distribution is used as the marginal distribution of the meteorological drought index and hydrological drought index series. Droughts are usually extreme climatic events, precipitation shortages and other extreme conditions, which are statistically manifested in the behavior of data tails, and Clayton Copula can effectively capture the tail correlation between variables, which is especially significant in the research of drought. Therefore, Clayton Copula is used to construct the joint distribution between meteorological drought and hydrological drought indices in this paper (Guo et al., 2021; Zhang et al., 2022b; Zhang et al., 2023). Based on the Copula model, the conditional probabilities are calculated as follows (Liu et al., 2022):
here, P(X≤x) denotes the cumulative probability of X≤x. In this paper, with the meteorological drought index as the condition and the hydrological drought index as the target, then denotes the conditional probability of occurrence of hydrological drought under different meteorological drought conditions.
The drought propagation threshold (PT) is commonly defined as the severity of the meteorological drought that is most likely to cause hydrological drought, i.e., the SPI critical threshold. In this paper, the conditional probability density of SPI was calculated for each scenario in the interval of −3 to 3 at an interval of 0.01, and when SRI ≤ −0.5, the SPI value corresponding to the maximum point of the conditional probability density is the meteorological drought threshold that triggers hydrological drought (Guo et al., 2020).
To visualize more intuitively the difference between meteorological drought to hydrological drought propagation thresholds under non-stationary and stationary condition, the change rate of drought propagation thresholds was calculated with the following equations:
where Tn and Ts the thresholds of meteorological drought to hydrological drought propagation under non-stationary conditions and stationary conditions, respectively.
4.1 Selection of Climate Indices
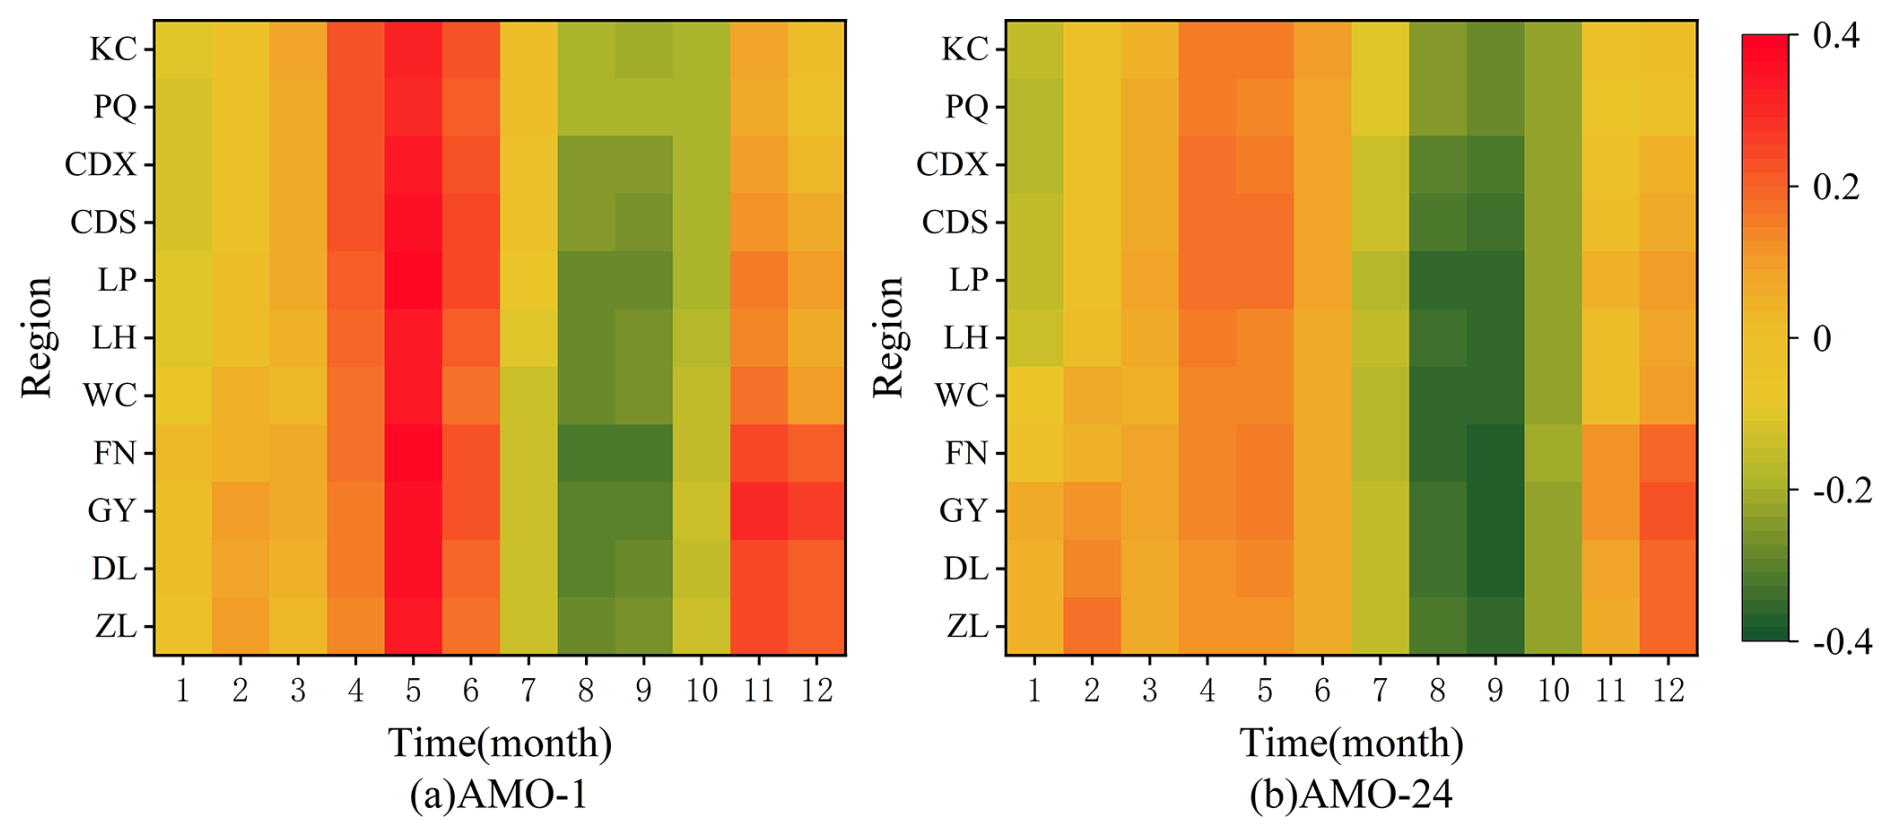
Pearson correlation test can be used to test whether there is a correlation between two sample sequences that follow a normal distribution. Usually, there is more than one climate factor affecting meteorological drought (Gao et al., 2020). In this paper, to select the relevant climate variables linked with meteorological drought in the Luanhe River basin, the Pearson correlation test was carried out to test the correlation between cumulative precipitation series at different time scales K (K = 1, 3, 6, 12, 24 months) and the CI with a lead time M (M = 0, 1, 2, 3 months) for all regions of the basin. The standardized climatic index series were averaged over a period (AP) of 1, 3, 6, 12, and 24 months (CI-n: CI with AP = n). To analyze the seasonal drought characteristics of the basin, we selected the significant climate indices for the cumulative precipitation series on a three month time scale. According to the correlation test results, AMO-1 and AMO-24 have higher correlation than other climate indexes, so AMO-1 and AMO-24 are selected as the covariates of rainfall. AMO-1 and AMO-24 with a lead time of M = 0 months were selected as covariates for the precipitation series and the test results are shown in Fig. 3. In addition, the correlation between AMO-1, AMO-24 and precipitation series with lag time of 1, 2 and 3 months from 1961 to 2014 is shown in Tables S1–S6 in the Supplement.
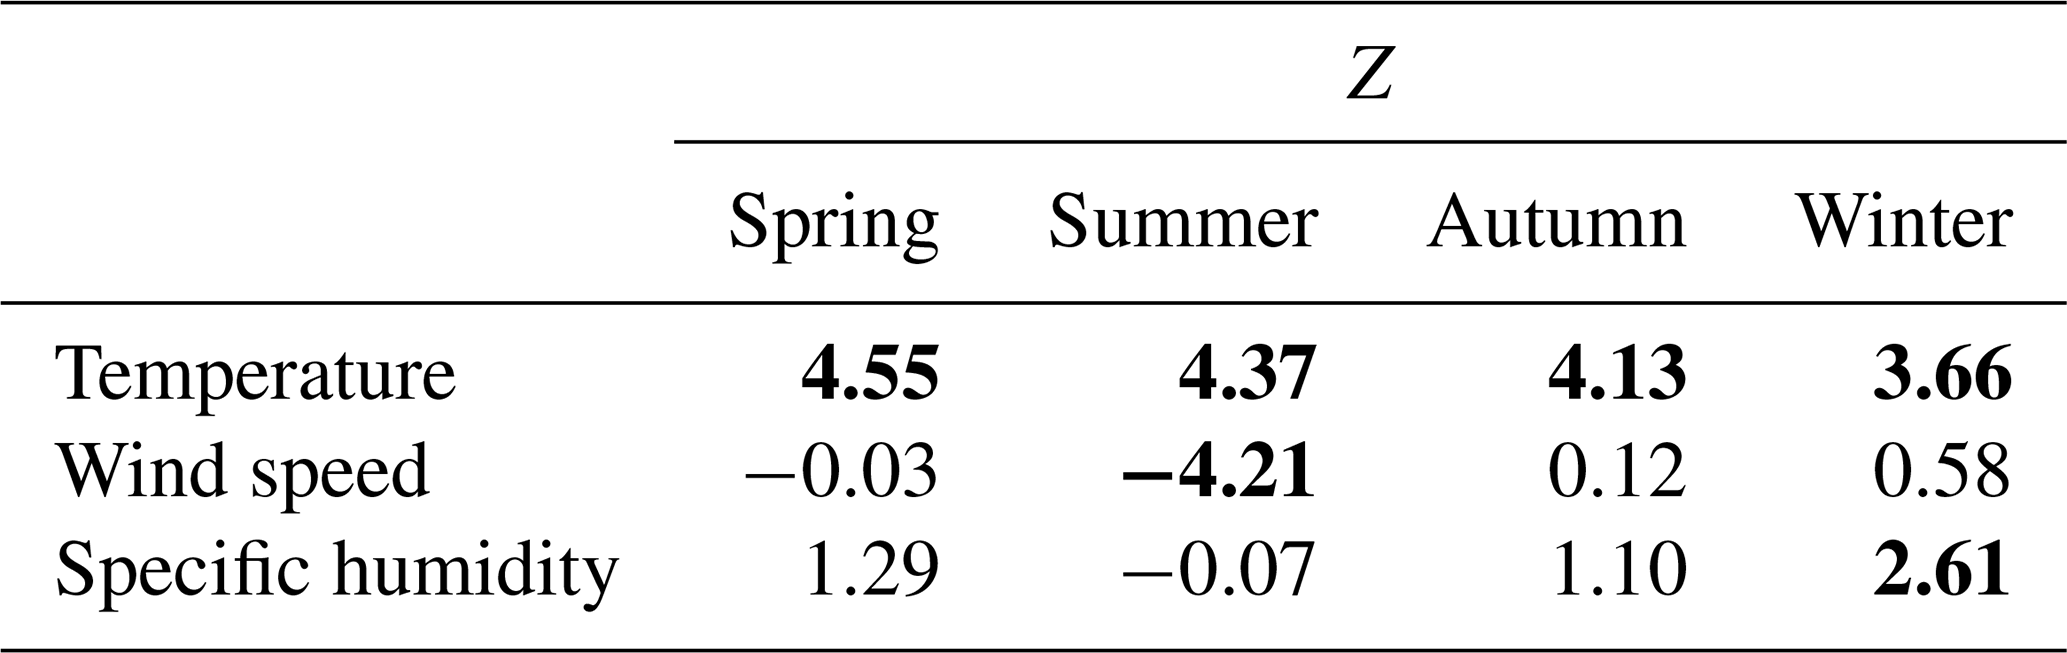
Trends of temperature, wind speed, and humidity in different seasons were calculated by the Mann–Kendall (M-K) trend analysis method in the watershed (Mann, 1945; Cheng et al., 2023). The results are presented in Table 2. When the absolute value of Z is greater than 1.96, it indicates that the series shows a significant level of p<0.05. The temperature shows a significant upward trend in four seasons. Wind speed shows a decreasing trend in spring and summer and an increasing trend in autumn and winter. Relative humidity showed an increasing trend in spring, summer, and winter, and a decreasing trend in summer.
Table 2Trends of temperature, wind speed, and specific humidity in different seasons during 1961–2014 (The bold numbers represent the series shows a significant trend.).
4.2 Preference of GAMLSS model
4.2.1 The simulation of precipitation series
GAMLSS framework was used to model the precipitation in each region of the watershed. To analyze the seasonal drought characteristics of the region, the SPI was calculated for 3 month time scales in this article. According to the correlation test results, AMO (AP = 1 and AP = 24) was selected as the significant CI for non-stationary modeling of precipitation. Seven different situations were considered according to the structure of the GAMLSS model (the model types are shown in Table 3). The AIC, SBC, and GD were used to select the optimal model, taking the CDS region as an example. The results of model preferences for the precipitation series are shown in Table 4.
Table 3Different model situations considered for precipitation simulation (CI-n: CI with the AP=n month).

Table 4AIC, SBC, and GD of the different models of precipitation in the CDS region (the Bold indicates the optimal model).

Table 5Model parameters estimation results in four seasons in the CDS region.

As can be seen from Table 4, for the non-stationary models of precipitation in the CDS region, among all the models with climate index as covariates, Mod7 has the best performance in spring, with the AIC, SBC, and GD of 494.1, 500.0 and 488.1, respectively. The optimal model in summer was Mod5, the AIC, SBC, and GD were 625.8, 631.7, and 619.8. In autumn, the optimal model was Mod1, the AIC, SBC, and GD were 505.8, 509.7, and 501.8. Mod2 had the best performance in winter, with the AIC, SBC, and GD of 322.5, 330.4, and 314.5. The results of the estimated model parameters of the precipitation in the CDS region are shown in Table 5.
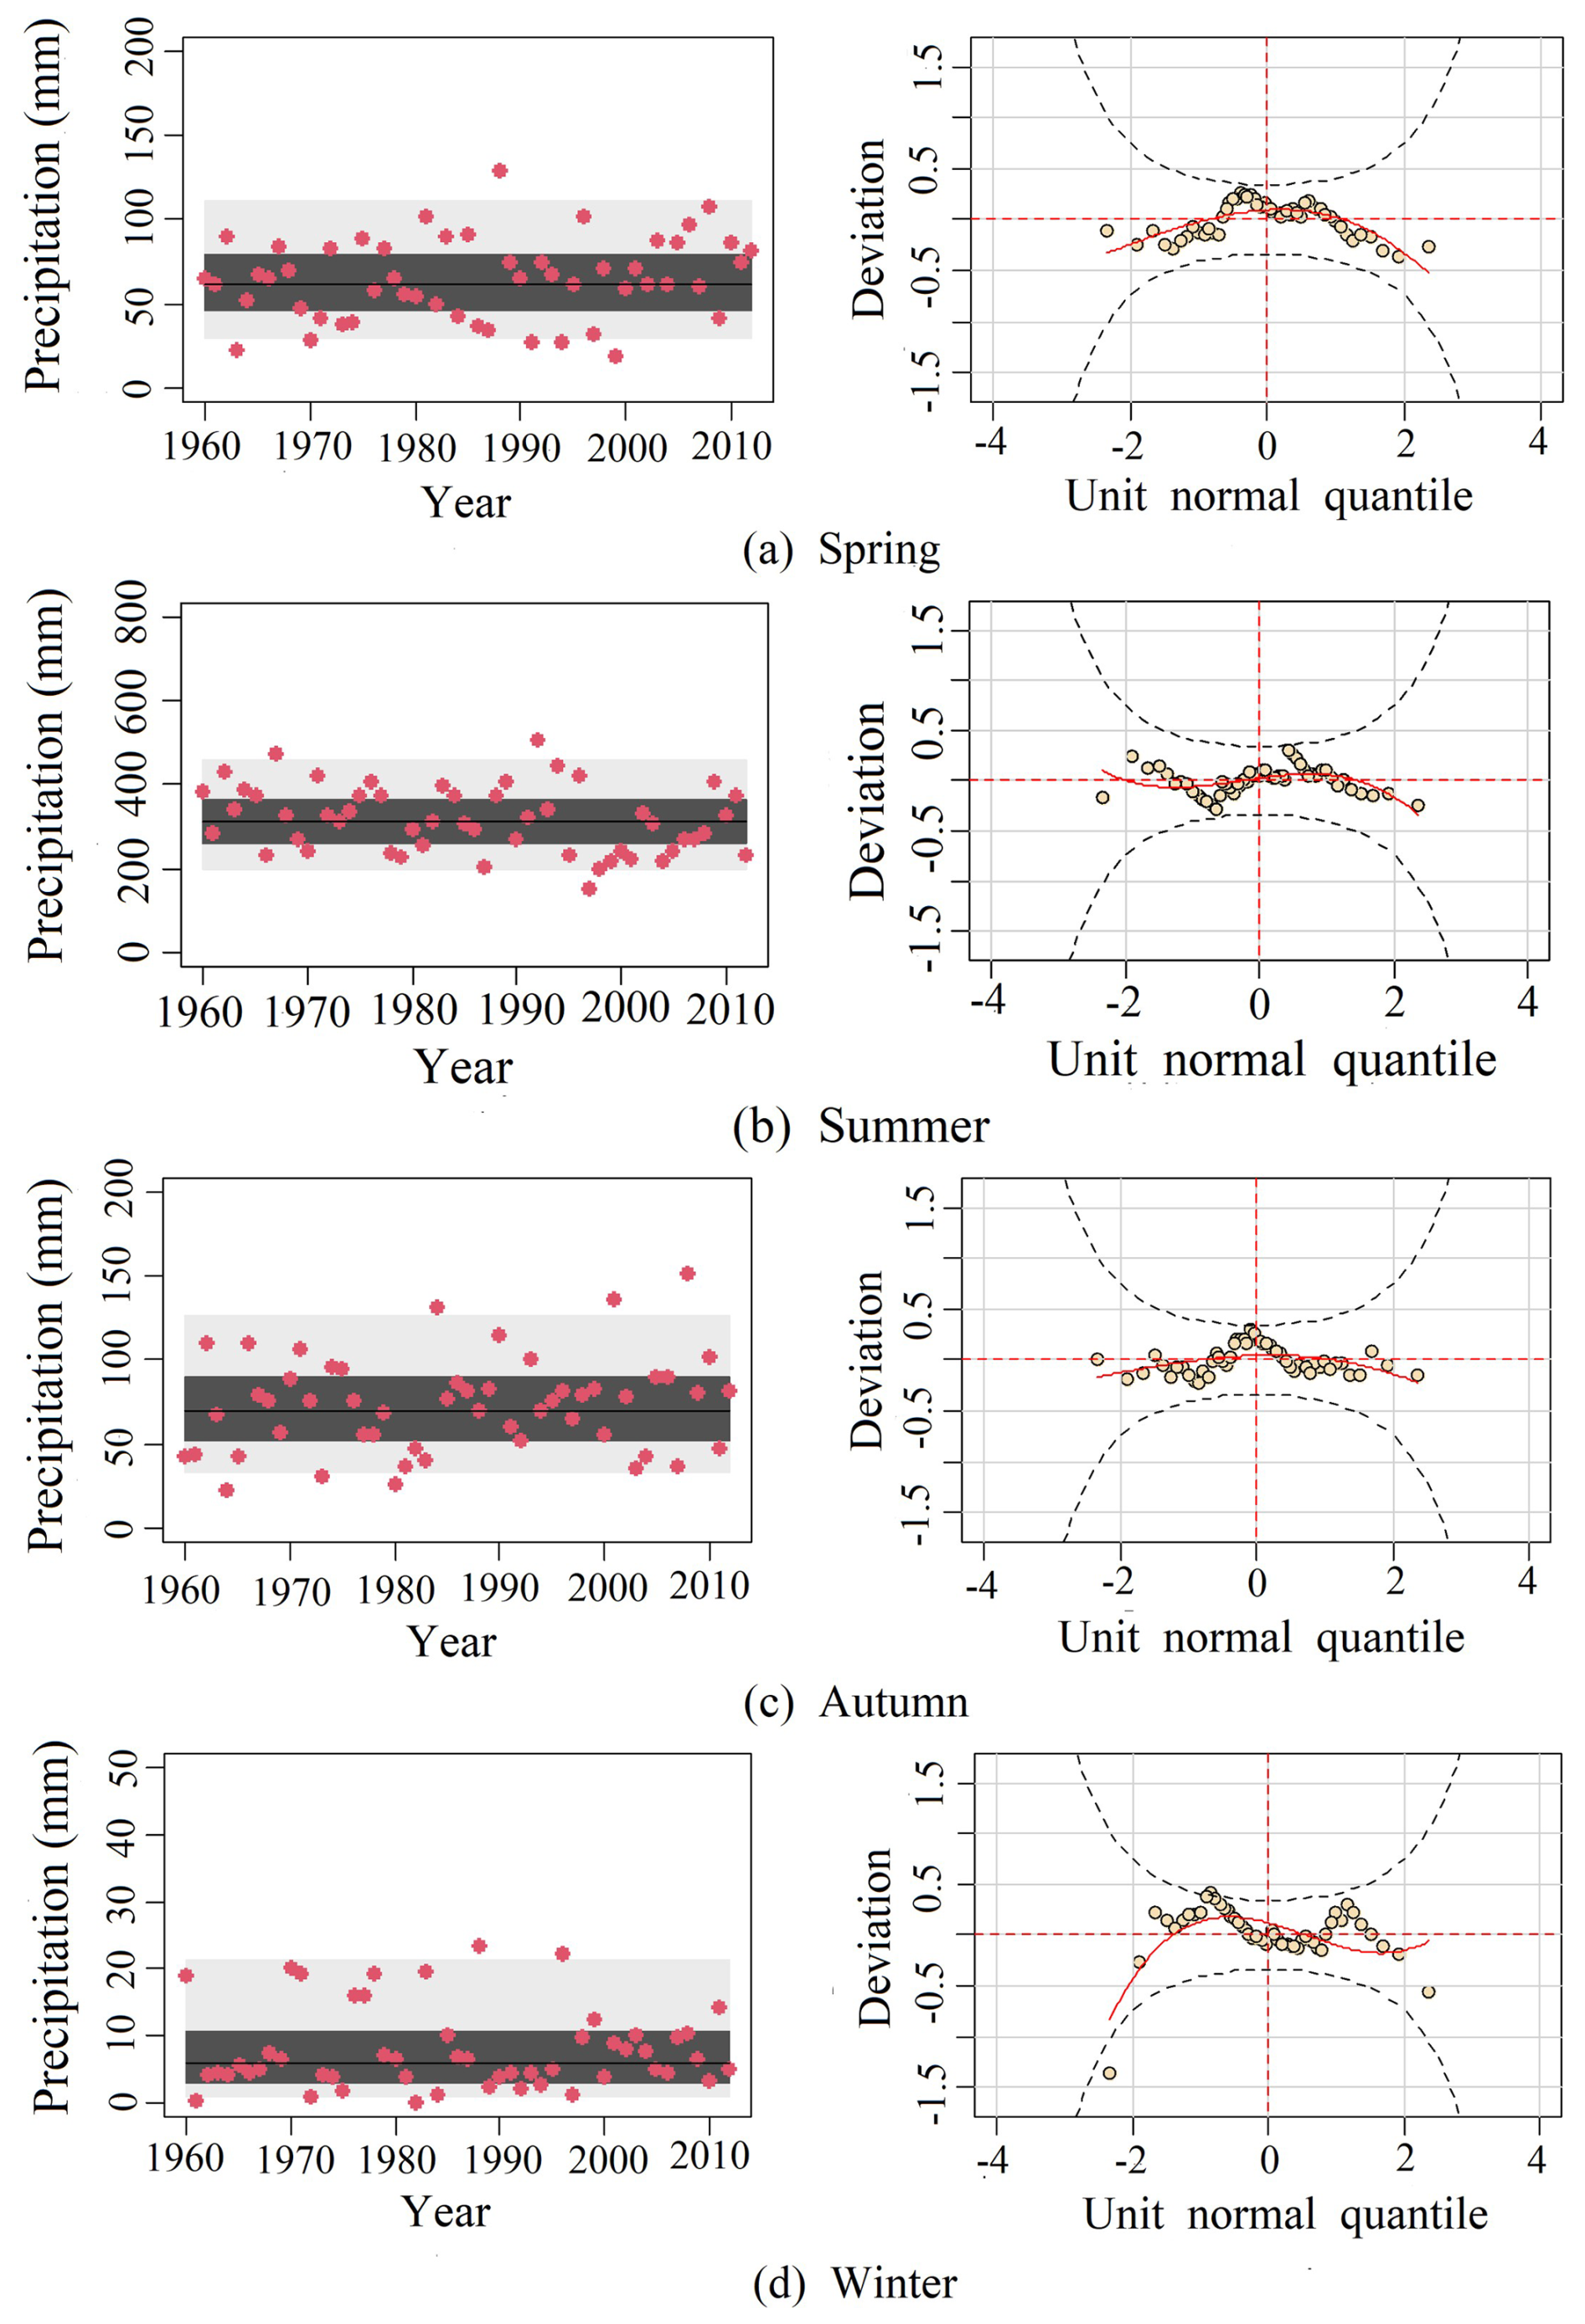
Figure 4Fitting results of four seasons of precipitation series in the CDS region (These red dots represent precipitation observations, light grey areas represent areas between the 5 % and 95 % centile curves, dark grey areas represent areas between the 25 % and 75 % centile curves, and black lines represent the median (50 %); the black dashed line in the worm plot of the fitted residuals indicates the 95 % confidence interval).
To assess the quality of the fitting, Fig. 4 provides the simulation of precipitation from the GAMLSS framework (Taking the CDS region as an example). It can be seen from Fig. 4 that the precipitation data values of the four seasons were basically within the 95 % quantile interval, the deviation values in the worm chart were evenly distributed in the 95 % confidence interval, and there was no obvious excess, which indicates that the residual fitting of the Gamma distribution meets the conditions. In general, the temporal behavior associated with the data was significant, the results of the model (Fig. 4) seem to reproduce the behavior of the data, especially to capture the large dispersion characteristics of the data.
4.2.2 The simulation of the runoff series
For the simulation of runoff, temperature (T), specific humidity (H), and wind speed (W) were considered as covariates of the shape and position parameters of the gamma distribution. Table 6 shows the models for the different combinations of the covariates considered, and taking the CDS region as an example, the optimal results are listed in Table 7.
Table 6Different model situations considered for runoff simulation.

Table 7AIC, SBC, and GD of the best suitable model of the non-stationary model of runoff in the CDS region.

The results of the estimated model parameters of the runoff in the CDS region as an example were shown in Table 8. As seen in Table 8, the main factors affecting the spring runoff series were temperature, specific humidity, and wind speed, with specific humidity having a greater influence than the other two factors. In summer, temperature was the main factor influencing the runoff series. In autumn and winter, runoff sequences were mainly influenced by temperature and specific humidity.
Table 8Model parameters estimation results in four seasons of the CDS region.

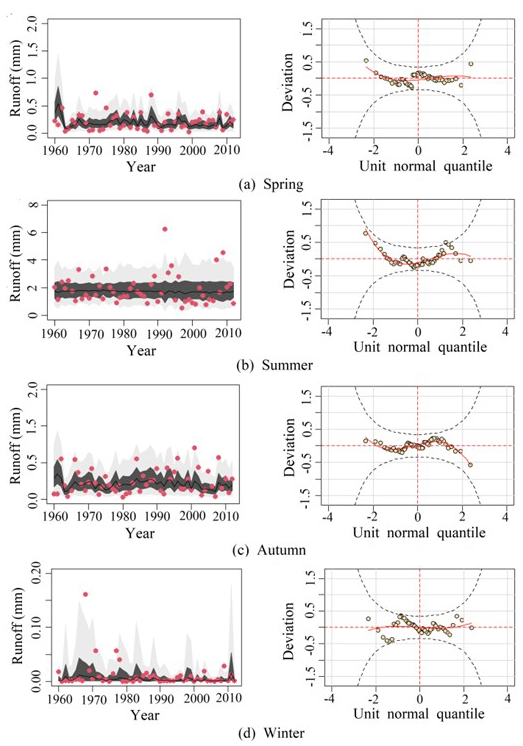
Figure 5Fitting results of four seasons of runoff series in the CDS region (These red dots represent runoff observations, light grey areas represent areas between the 5 % and 95 % centile curves, dark grey areas represent areas between the 25 % and 75 % centile curves, and black lines represent the median (50 %); the black dashed line in the worm plot of the fitted residuals indicates the 95 % confidence interval).
The simulation results of the stationary model and non-stationary model for runoff in the CDS region are shown in Fig. 5. As can be seen from Fig. 5, most of the runoff data values (red points) of the four seasons were located in the light gray area (5 % and 95 % centile curves), and the data deviations in the worm plots were evenly distributed in the 95 % confidence interval (between the two black ellipses dotted lines), which show that non-stationary gamma distribution meet the requirements for the fitting of runoff series. In Fig. 5, the non-stationary model showed the time variation characteristics of the runoff series flexibly. Generally, the non-stationary model can describe the variability of runoff series accurately. In summary, the non-stationary model with temperature, specific humidity, and wind speed were considered as covariates that can capture the time variation characteristics of the runoff series.
The results of the optimal modeling of the non-stationary series for the 11 regional runoffs are presented in Table 9. Table 9 shows that there are some differences in the optimal models of the non-stationary runoff series in different regions in different seasons, among which the spatial differences of the optimal models in winter are the most significant. The optimal models in spring are mainly Mod3 and Mod10, in summer the optimal models are mainly Mod2, Mod4 and Mod8, in autumn the optimal models are Mod3 and Mod7, and in winter the optimal models are mainly Mod3 and mod11.
Table 9Optimal model of non-stationary runoff series in different seasons in each region of the basin.

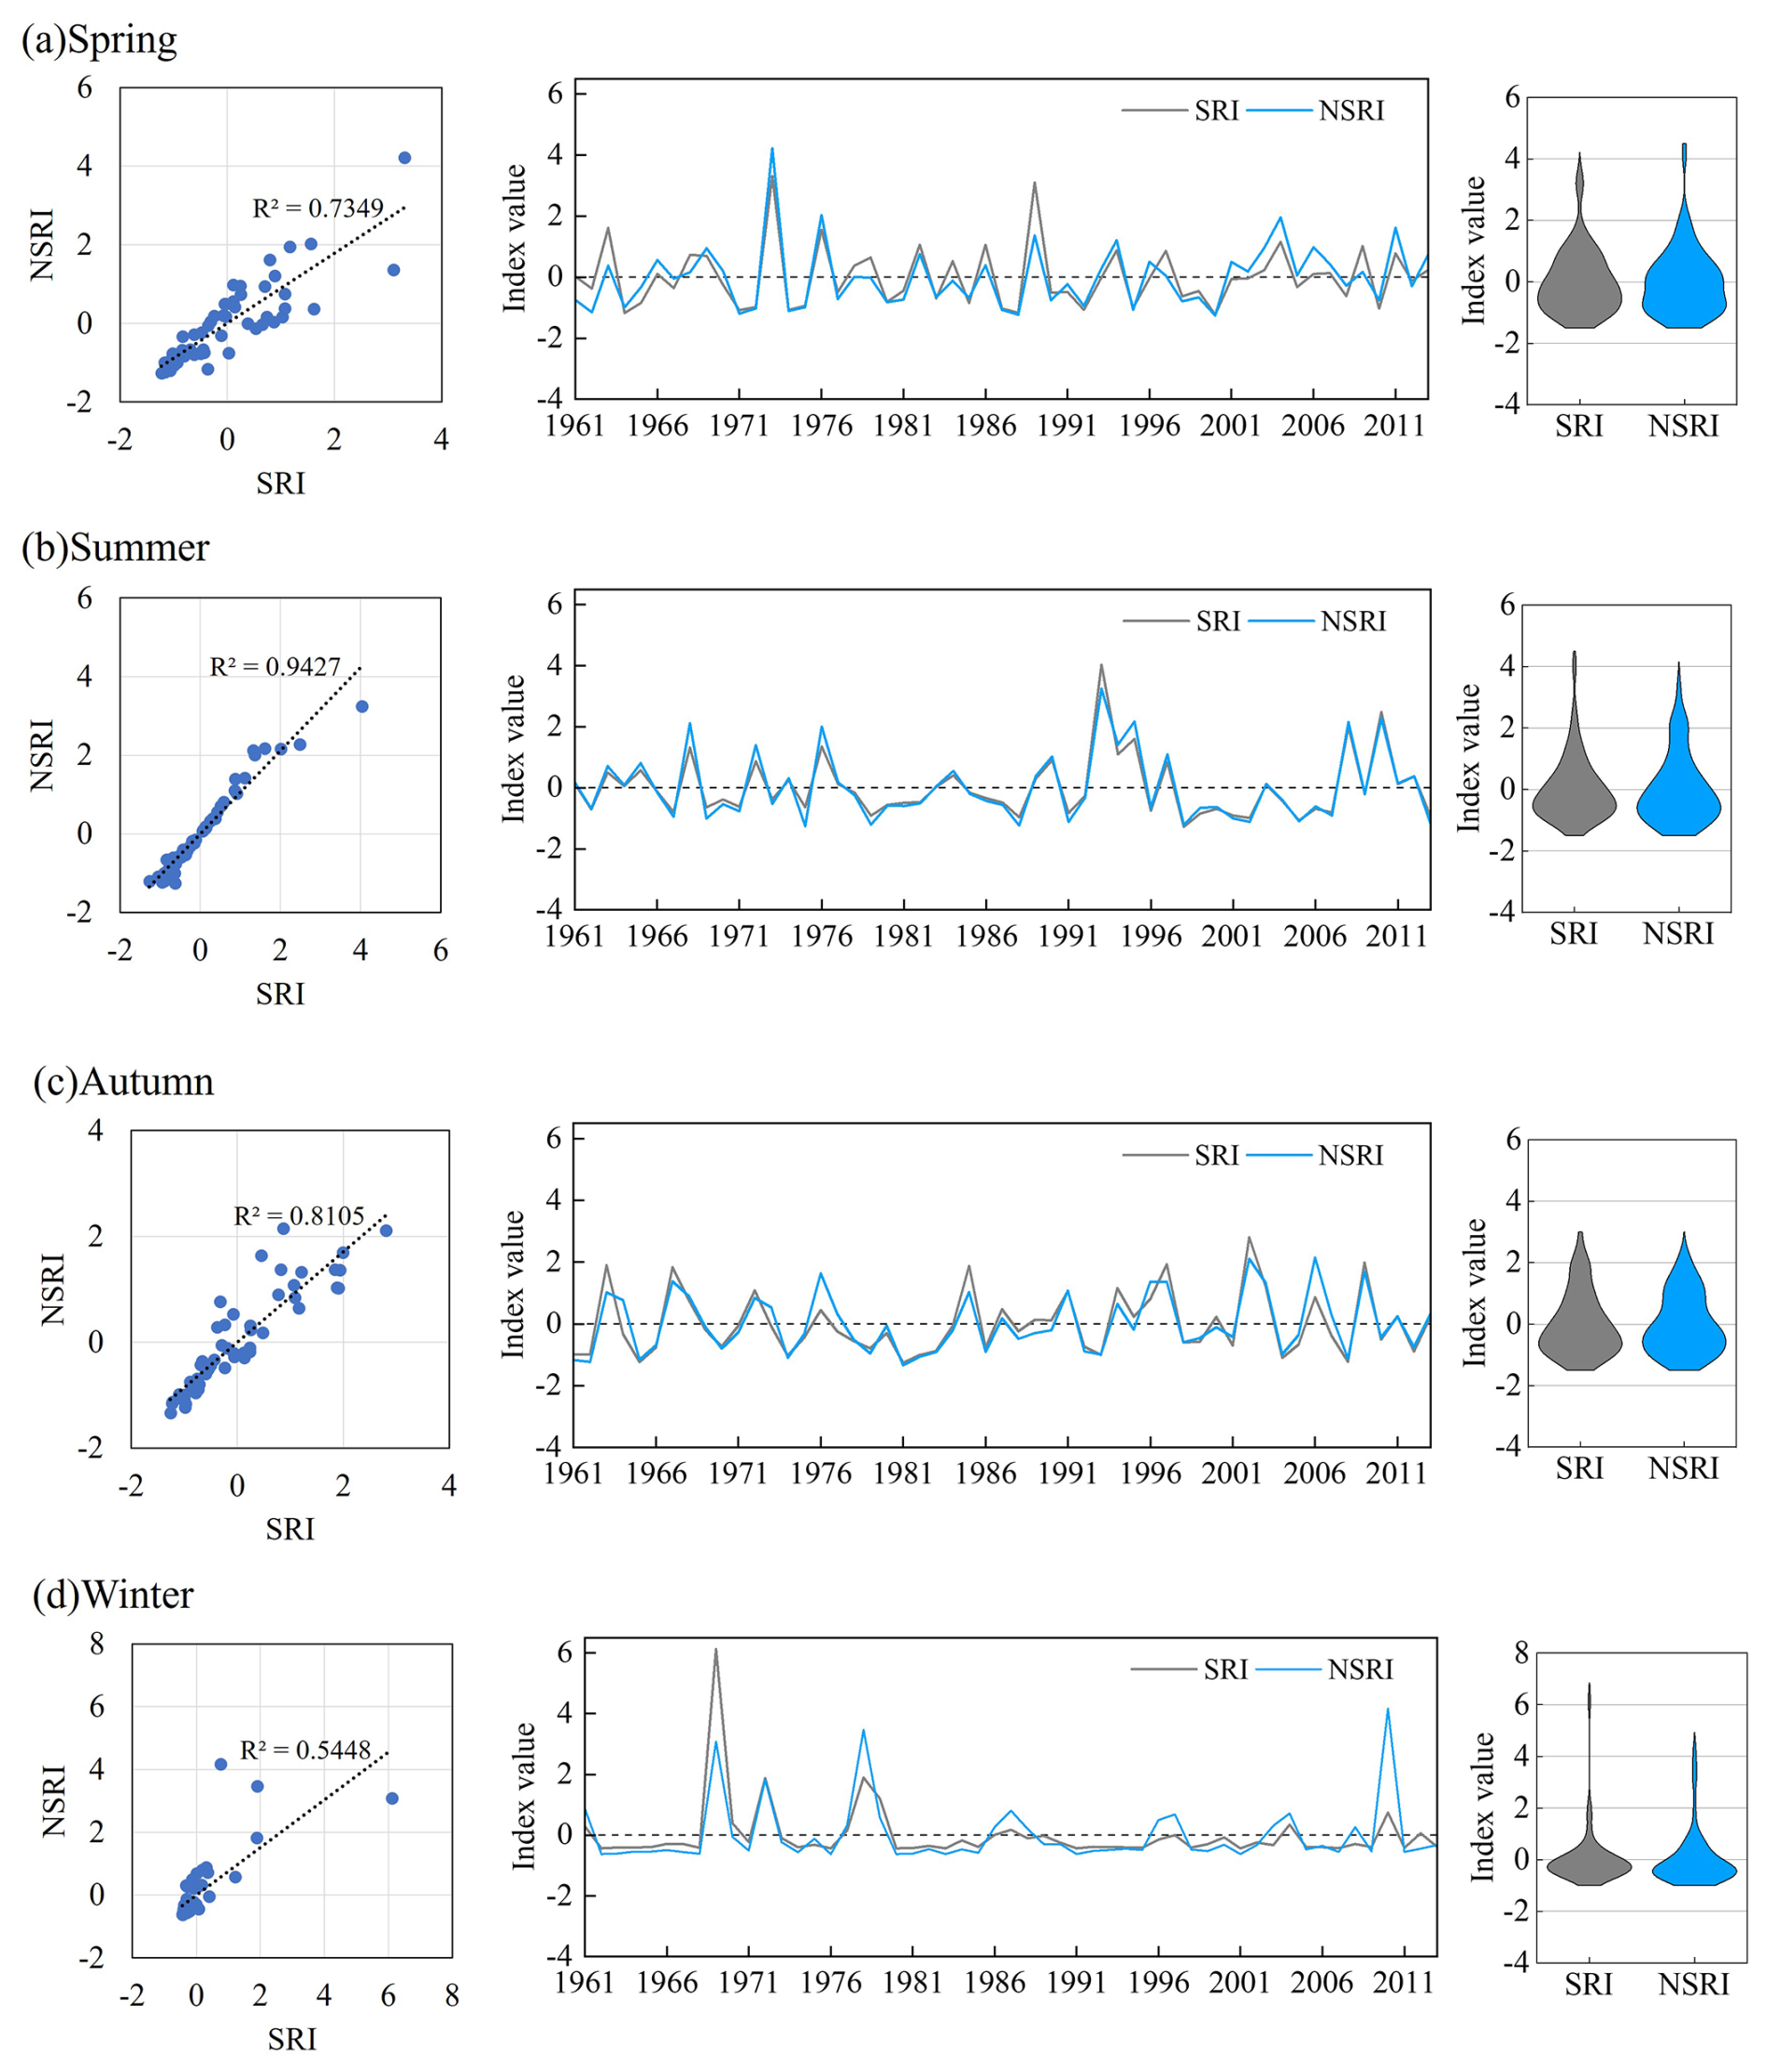
Figure 6Comparison of SRI and NSRI in different seasons in the CDS region during 1961–2014 (a: Spring; b: Summer; c: Autumn; d: Winter).
4.3 Calculation of stationary and non-stationary indices
According to the simulation results of the model in Sect. 4.2, the non-stationary models have better performance than the stationary models in the simulation of runoff series in all regions. The comparison results of SRI and NSRI in different seasons in CDS are shown in Fig. 6. It can be seen that the distribution of two indices is generally similar. Furthermore, the climate factors had different impacts on the index in different seasons, with the smallest impact on summer and the most significant impact on winter.
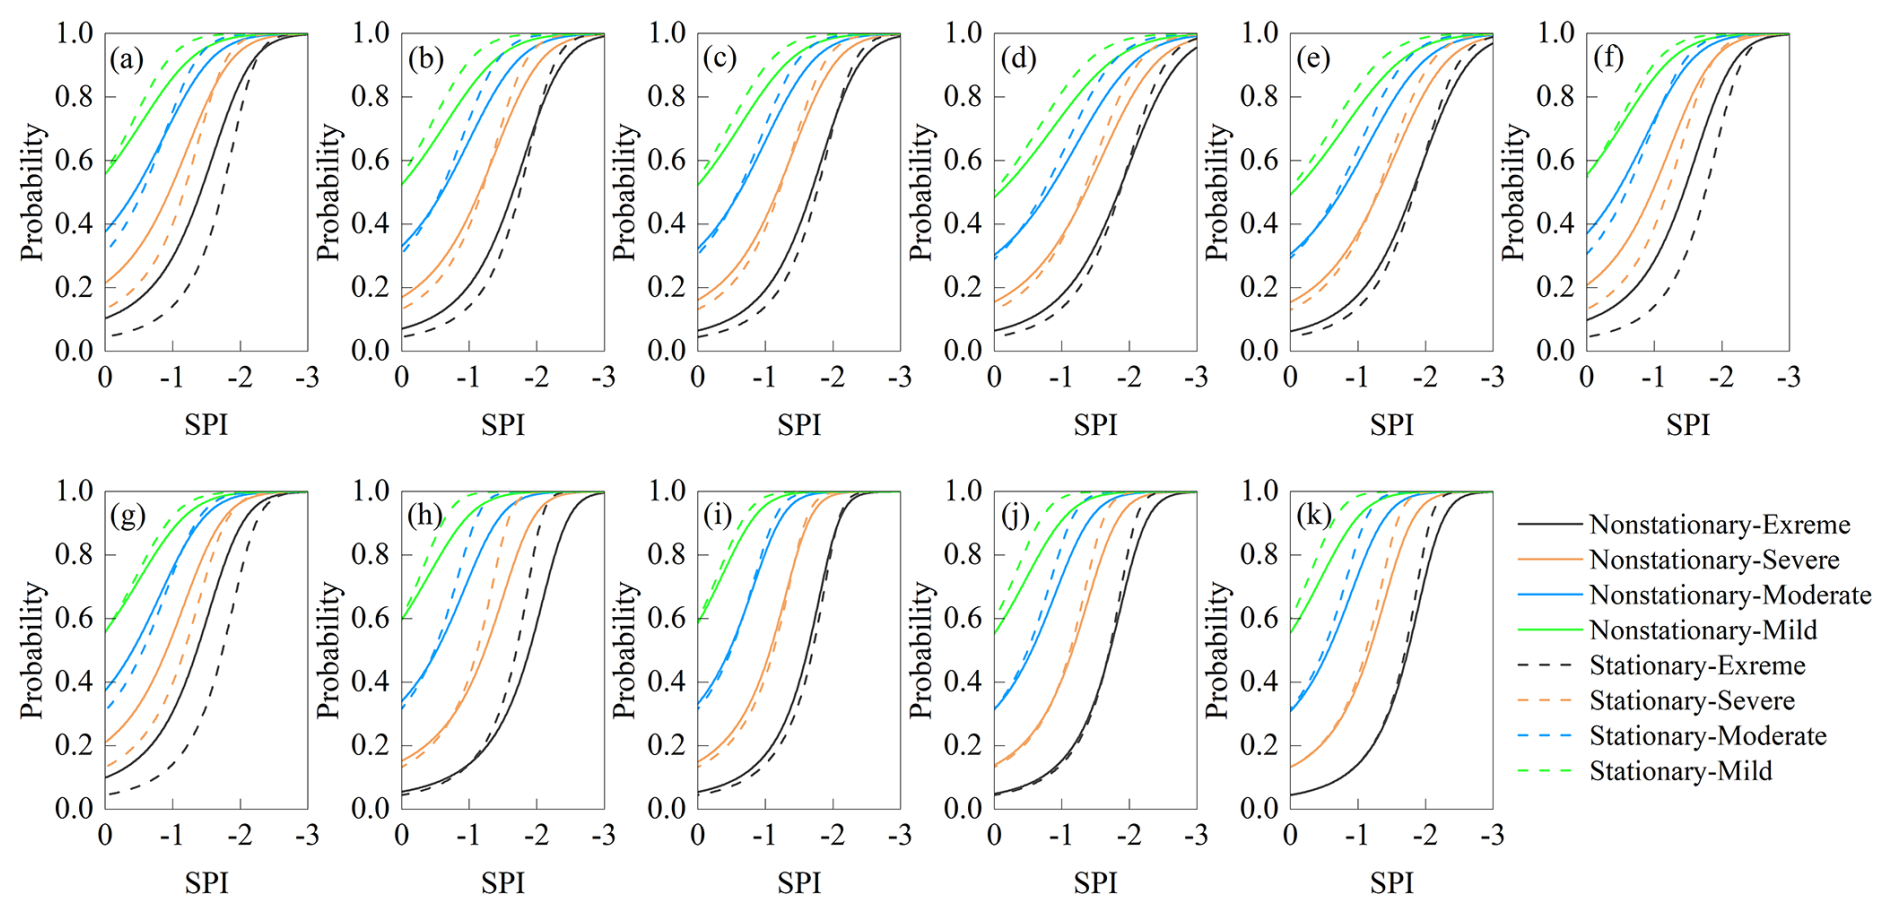
Figure 7Probability of drought propagation in spring for each region (a: ZL; b: DL; c: GY; d: FN; e: WC; f: LH; g: LP; h: CDS; i: CDX; j: PQ; k: KC).
4.4 Drought propagation probability
Based on the Copula model, the probabilities of meteorological drought propagation to hydrological drought can be calculated, and the impact of climate change on drought propagation can be analyzed. The calculated results in different seasons and different regions were shown in Figs. 7–10, where the solid and dashed lines indicate the calculated results of the non-stationarity model and the stationarity model, respectively, and black, red, blue, and green represent extreme drought, severe drought, moderate drought, and mild drought, respectively. According to the analysis results in Figs. 7–10, the probabilities of the occurrence of hydrological drought increased with the decrease of SPI, and as the degree of meteorological drought worsened, it might lead to more severe hydrological drought. In addition, the drought propagation probabilities calculated based on the non-stationarity model were significantly different from those calculated by the stationarity model, and they also differ in different seasons and regions.
Figure 7 shows the calculated results of drought propagation probabilities in spring in 11 regions. In the upstream (ZL, DL, GY,) and middle regions (WC, FN, LH, LP, and CDS) of the basin, the drought propagation probabilities calculated by the non-stationary model were significantly different from those calculated by the stationary model, while the calculated results were relatively close in the downstream areas such as CDX, PQ and KC. For the upstream and middle regions, under the same meteorological drought conditions, the probabilities of severe and extreme hydrological drought calculated based on the non-stationary model were larger than that of the stationary model, while in the downstream area, the probabilities of hydrological drought calculated by the stationary model were slightly higher than that of the non-stationary model. According to the modeling structure of the precipitation and runoff sequence in spring in Sect. 4.2, under the combined influence of climatic factors AMO, temperature, specific humidity, and wind speed, regional hydrological drought is more likely to occur. In contrast to the stationary conditions, the increase in temperature may be the main factor that causes the hydrological drought to become more severe in spring.
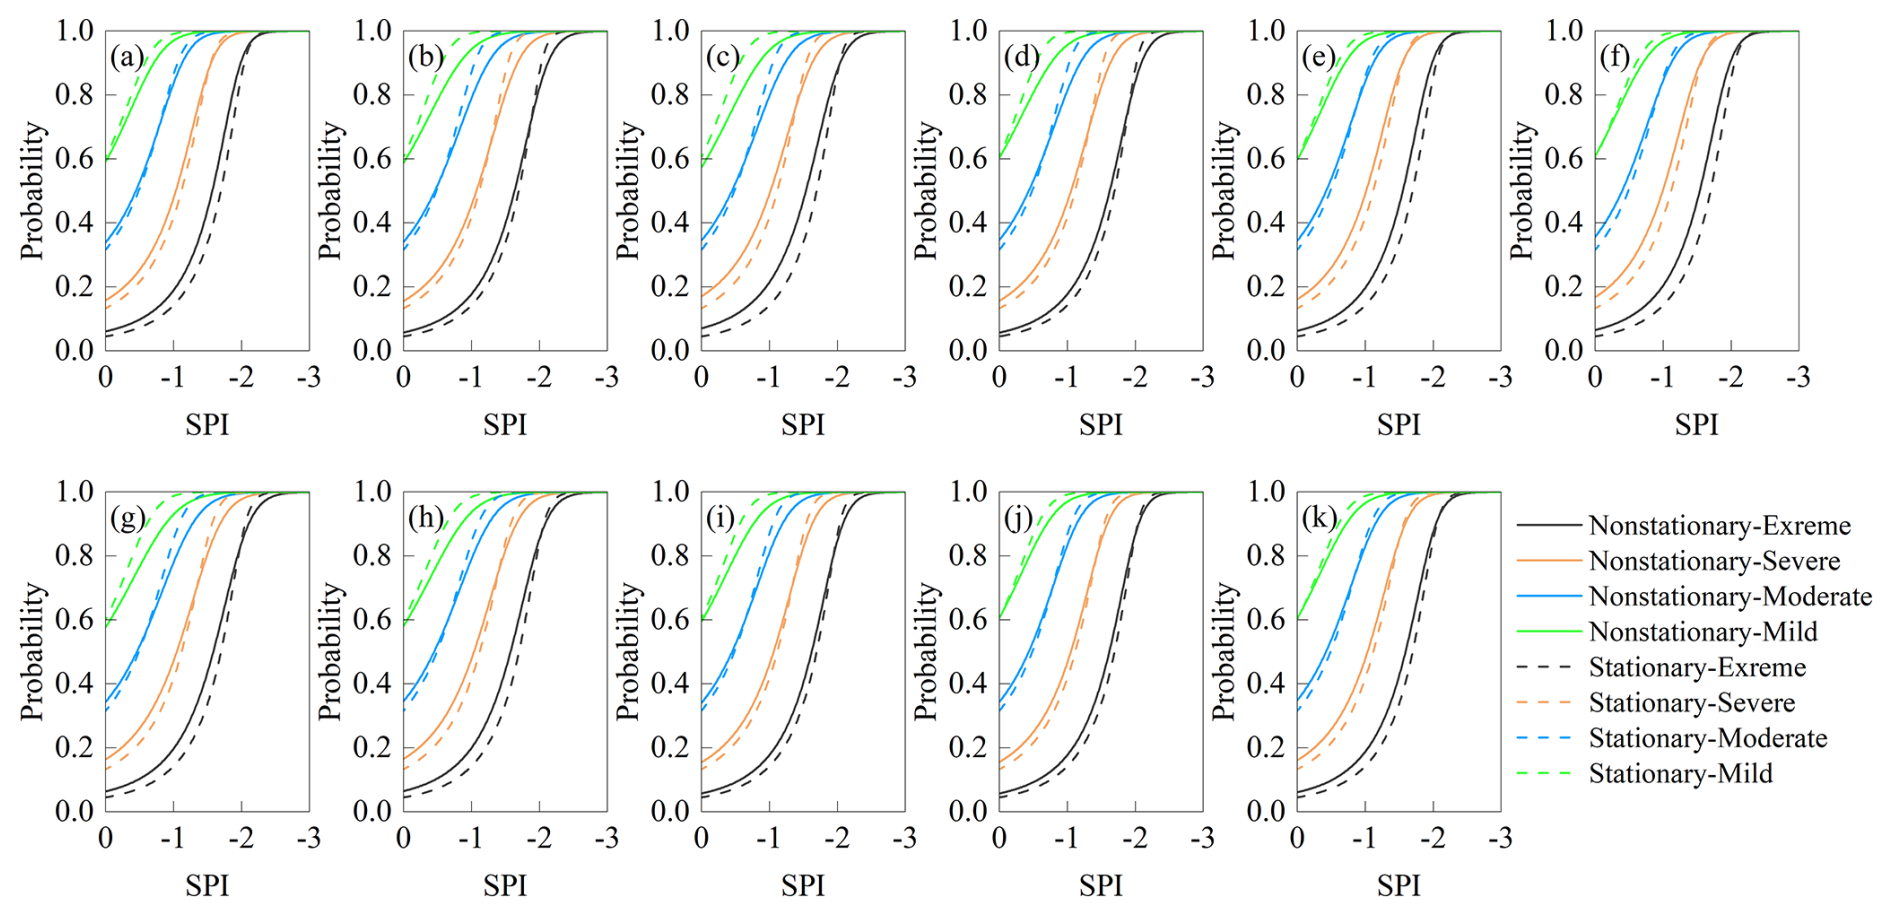
Figure 8Probability of drought propagation in summer for each region (a: ZL; b: DL; c: GY; d: FN; e: WC; f: LH; g: LP; h: CDS; i: CDX; j: PQ; k: KC).
In summer (Fig. 8), in each region, the difference between the drought propagation probabilities calculated by the non-stationary model and the results calculated by the stationary model was not significant, and the probability of occurrence of severe and extreme hydrological droughts calculated by the non-stationary model was larger. Taking the ZL region as an example (Fig. 8a), when climate change was not considered, the probability of severe hydrological drought and extreme hydrological drought was 0.6 and 0.17, respectively. Under the influence of the changing environment, the probability of causing severe hydrological drought and extreme hydrological drought was 0.62 and 0.2, respectively. This means that climate changes had little impact on drought propagation in the basin during the summer when precipitation was abundant. In contrast to the stationary conditions, the AMO and temperature may be the main climate reasons for the greater probability of drought propagation in summer (Zhang et al., 2022a).

Figure 9Probability of drought propagation in autumn for each region (a: ZL; b: DL; c: GY; d: FN; e: WC; f: LH; g: LP; h: CDS; i: CDX; j: PQ; k: KC).
Different from spring and summer, in autumn (Fig. 9), The probabilities of occurrence of moderate drought and more severe hydrological droughts calculated by the non-stationary model were larger than those of the stationary model in the upstream (ZL, DL, and GY) and downstream regions (CDX, PQ, and KC), which indicated that the propagation of droughts in the upstream and downstream regions was influenced by climate change significantly. As can be seen from Table 9, specific humidity is the main influence on the differences in drought propagation in the upstream (ZL, DL, GY, FN, and WC), while drought in the middle and lower reaches (LH, LP, CDS, CDX, PQ, and KC) is influenced by a combination of temperature and specific humidity.
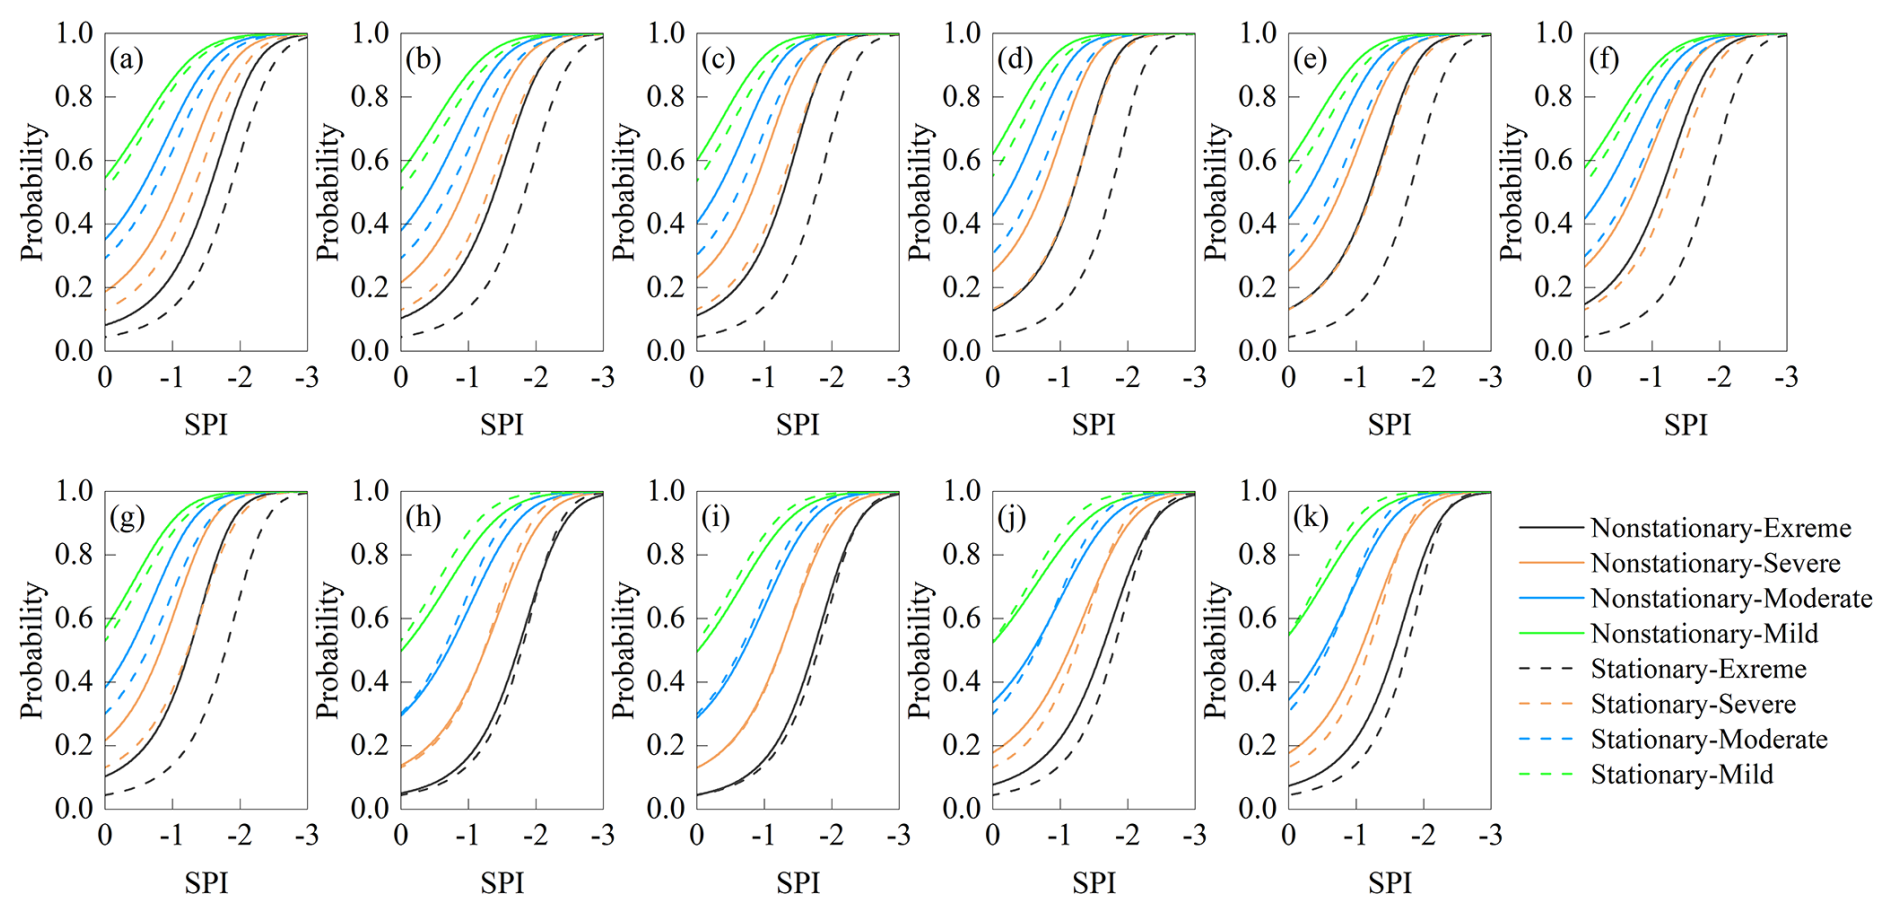
Figure 10Probability of drought propagation in winter for each region (a: ZL; b: DL; c: GY; d: FN; e: WC; f: LH; g: LP; h: CDS; i: CDX; j: PQ; k: KC).
In winter (Fig. 10), the probabilities of occurrence of moderate and more severe hydrological droughts in the upstream and midstream regions calculated based on the non-stationary model were significantly larger than those calculated by the stationary model. Taking the WC station as an example, when climate change was not considered, the probabilities of occurrence of moderate, severe, and extreme hydrological droughts under moderate meteorological drought conditions were about 0.8, 0.6, and 0.4, respectively, while under the influence of environmental change, the probabilities of moderate, severe and extreme hydrological droughts were about 0.9, 0.8 and 0.6, respectively. In most of the downstream areas, the difference between the calculation results of the two models was relatively small. Under the combined influence of AMO, temperature, wind speed, and specific humidity, the probabilities of drought propagation are increased. In upstream, the increase in wind speed may be the main climate factors affecting the occurrence of severe drought, and the increase in temperature and specific humidity may be the main climate factors affecting the occurrence of severe drought in midstream and downstream regions.
Comparing the four seasons, the probabilities of occurrence of moderate and more severe droughts were the lowest in spring, but the highest in winter, this phenomenon was significant under non-stationarity conditions. Taking the FN region as an example (Figs. 7d–10d), the probabilities of moderate meteorological drought propagating as moderate, severe, and extreme hydrological drought in spring under non-stationarity conditions were close to 0.6, 0.4, and 0.15, respectively, while in winter, the probabilities of propagating as moderate, severe and extreme hydrological drought under the same meteorological drought conditions were close to 0.9, 0.7 and 0.4, respectively. The reasons for the differences in the probabilities of drought propagation under stationary and non-stationary conditions are complex. On the one hand, non-stationary models capture changes caused by interannual variability, and on the other hand, they are affected by AMO, temperature, wind speed, and relative humidity. There may be some differences in the effects of various meteorological factors on drought in different seasons. From the results in Sect. 4.2, the drought propagation is affected by the combined effects of AMO, temperature, wind speed, and relative humidity in spring, with relative humidity as the main influencing factor. In summer, drought propagation is mainly influenced by AMO and temperature. In the fall, it is influenced by temperature and relative humidity, with relative humidity being the main influencing factor. In winter, it is influenced by a combination of AMO, temperature, and relative humidity, with temperature being the most important influencing factor. Comparing the four seasons, meteorological factors have the most serious effect on winter drought. In addition, there are some differences in the effects of meteorological factors on drought in different regions. Temperatures show a significant upward trend, which may mean that extreme runoff events will be more frequent. During the dry season, high temperatures increase evapotranspiration from surface water bodies, vegetation, etc., resulting in reduced runoff and lower soil moisture content will increase the risk of hydrological drought (Huang et al., 2017; Guo et al., 2021). Changes in humidity affect the efficiency of evapotranspiration, and higher humidity will reduce the transfer of water from the surface and plants to the atmosphere, limiting the development of drought. However, this effect may be limited by increased evaporation from increasing temperatures.
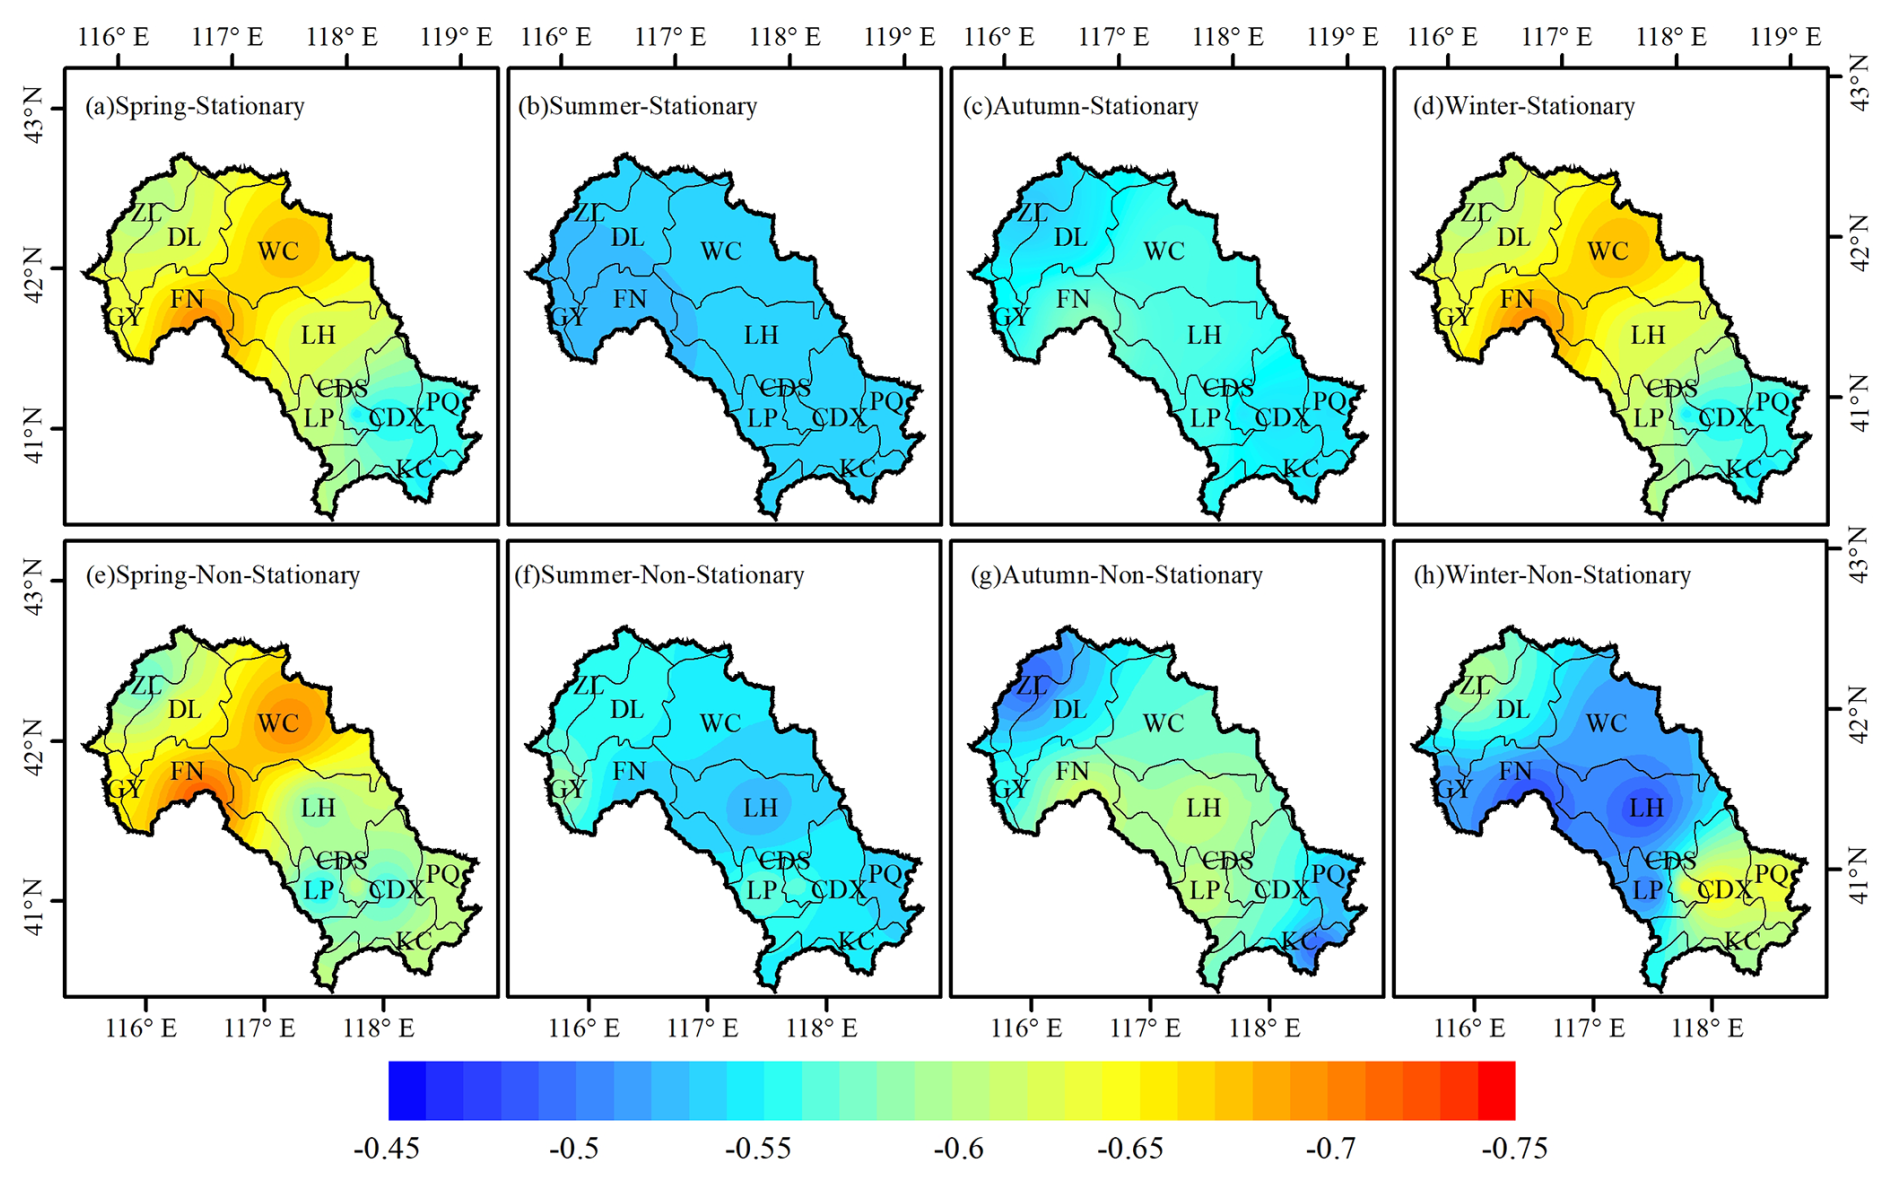
Figure 11Drought propagation thresholds in different seasons under stationary and non-stationary conditions.
4.5 Drought propagation threshold
Based on the Copula model, the thresholds that trigger hydrological droughts under stationary and non-stationary conditions (i.e., the propagation thresholds for drought) can be calculated, the results are shown in Fig. 11. The change rate of the meteorological drought to hydrological drought propagation thresholds are shown in Fig. 12. As can be seen from Figs. 11 and 12, there were obvious regional and seasonal characteristics of drought propagation thresholds. In this paper, the higher the drought propagation thresholds, the more likely hydrological drought is to be triggered.
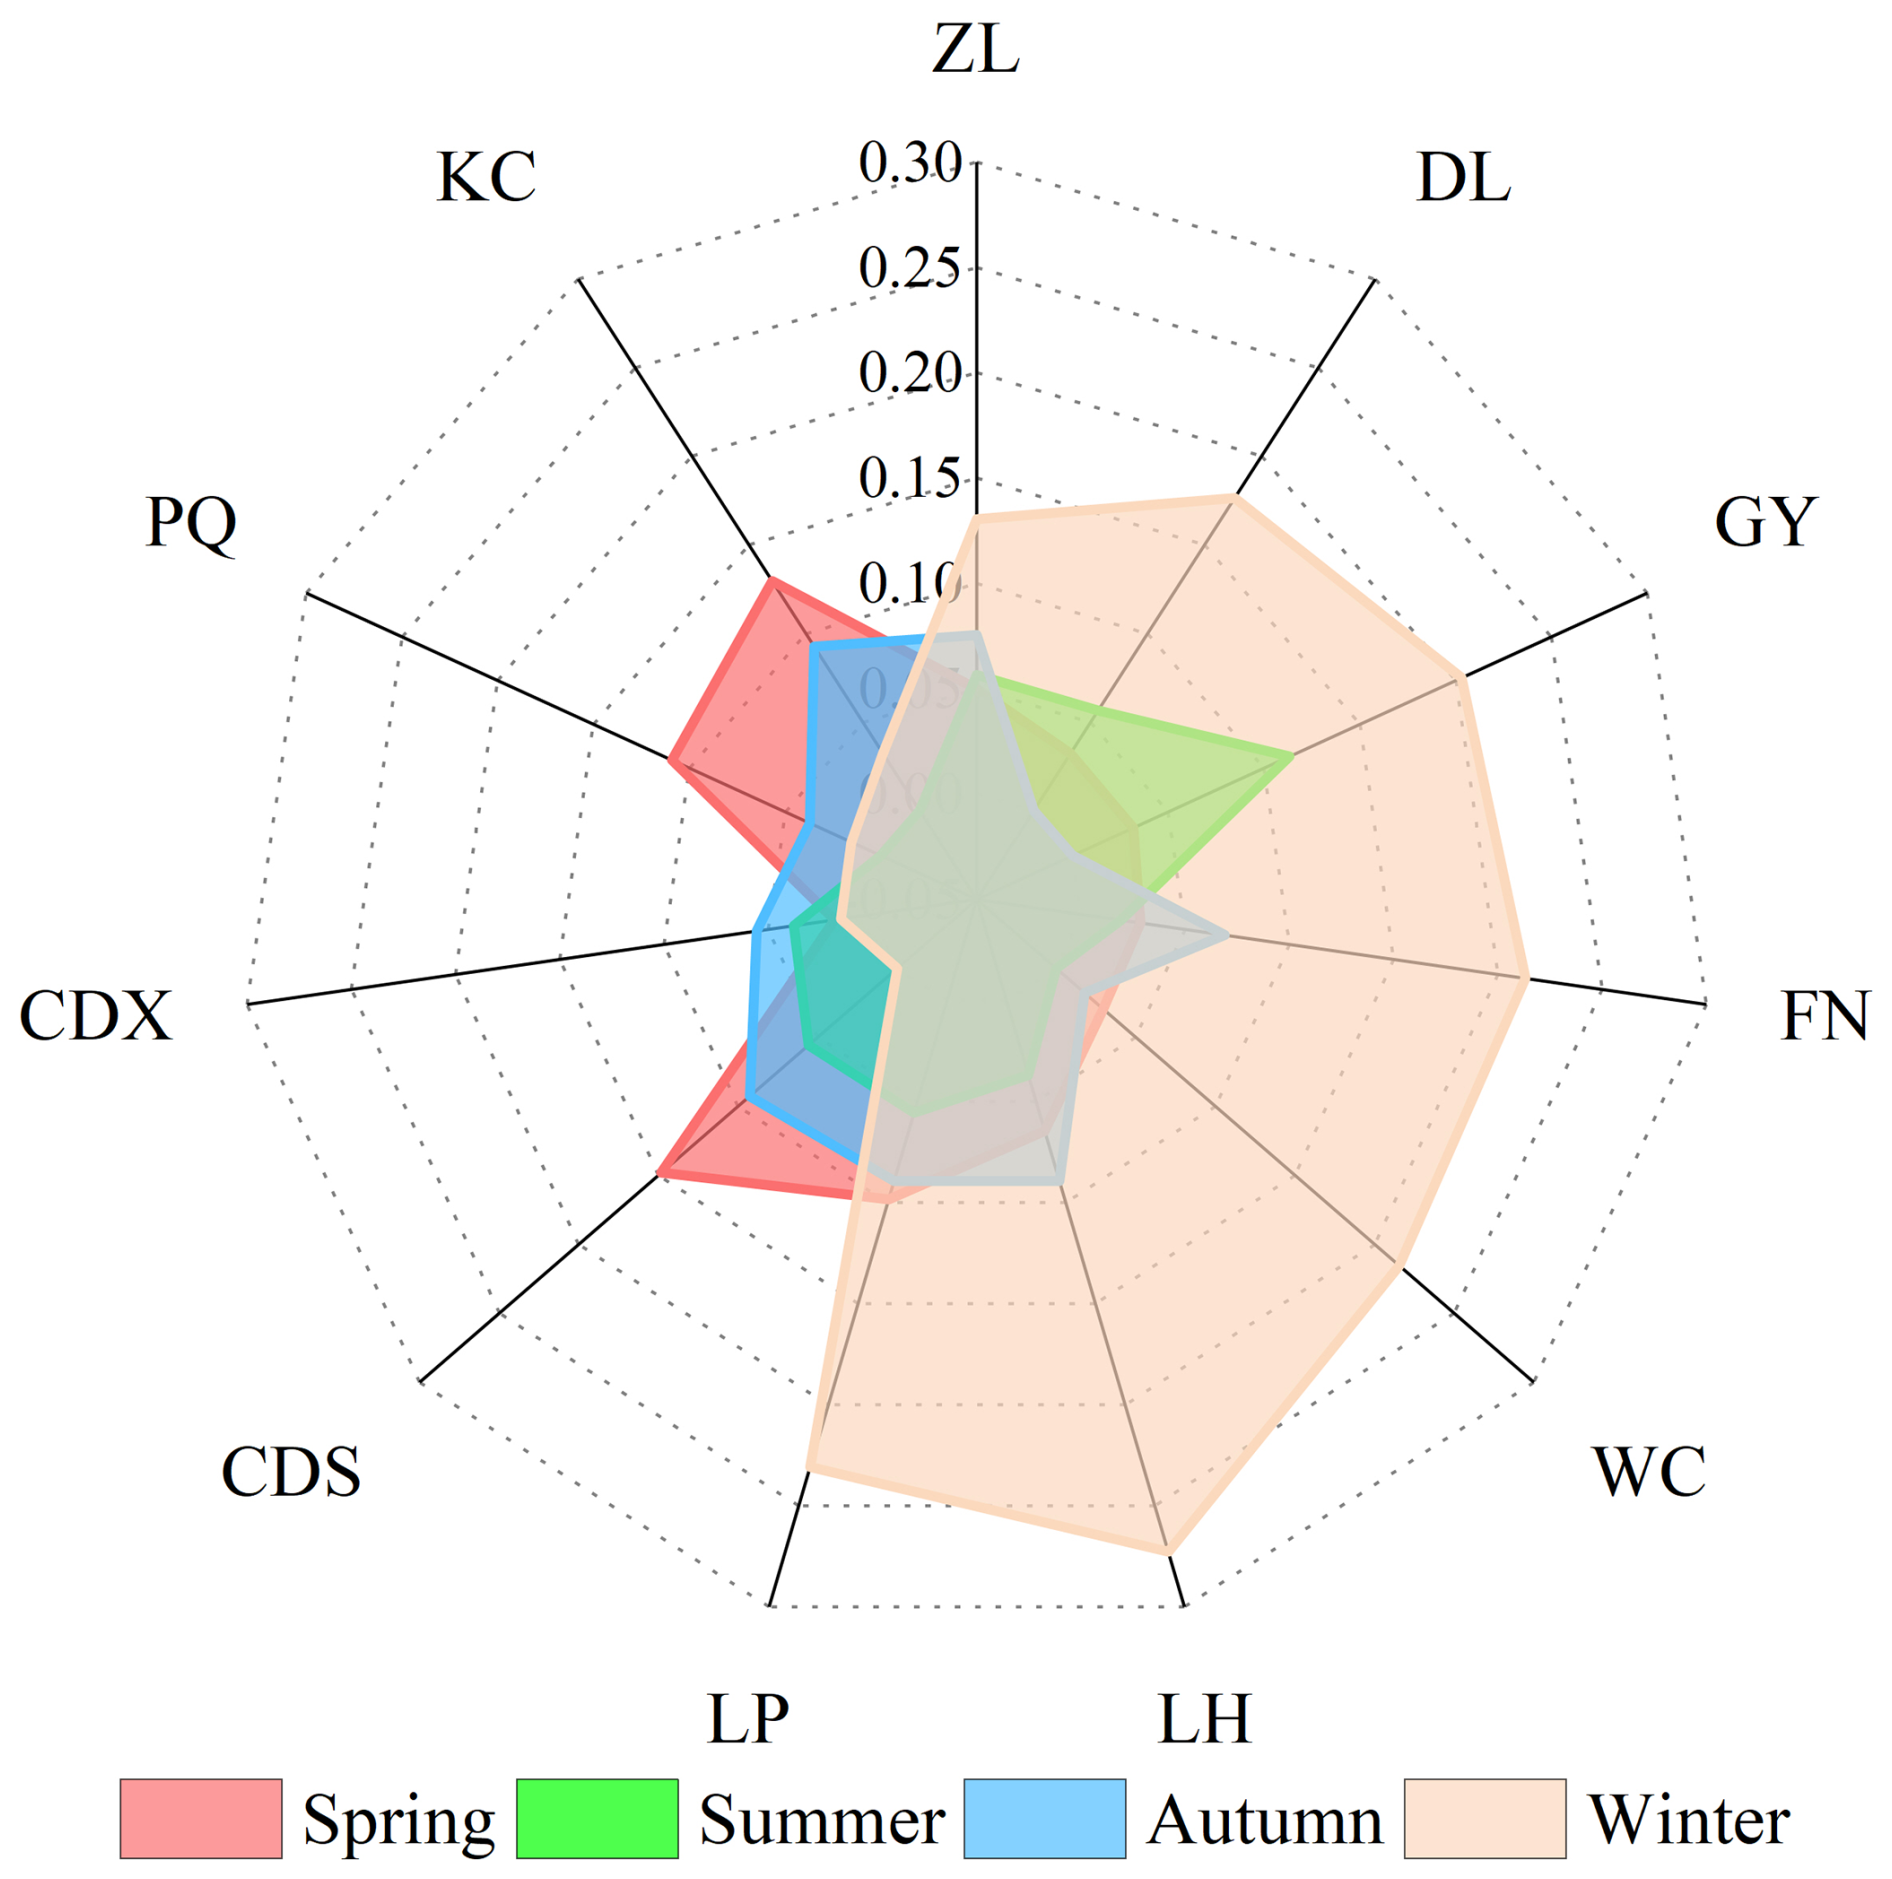
In spring (Fig. 11a), comparing the results of calculations based on the stationary model and the non-stationary model, the drought propagation thresholds were the smallest in FN, WC region, and the highest values occurred in the downstream region (CDS, CDX, PQ, KC) under the stationary condition. The distribution of drought propagation thresholds under non-stationary conditions was similar to that under stationary conditions. In addition, compared with the stationary condition, the drought propagation thresholds were higher in most regions under non-stationary condition. It indicated that hydrological droughts were more difficult to be triggered in most regions under the influence of climatic factors such as temperature, specific humidity, wind speed, and AMO. In summer (Fig. 11b), There was no significant difference in drought propagation thresholds in all regions under stationary conditions and non-stationary conditions. In autumn (Fig. 11c), the drought propagation thresholds in the river basin were close to that in summer. Under stationary conditions, the drought propagation thresholds were close to −0.55 in most regions. Comparing stationary conditions, the drought propagation thresholds increased in ZL, PQ, and KC, while decreasing in middle-stream areas (FN, WC, LH, LP, CDS, CDX) under non-stationary conditions. In winter (Fig. 11d), there were significant differences in regional drought propagation thresholds between stationary and non-stationary conditions. Under stationary conditions, the drought propagation thresholds of the basin were relatively lower than those in spring, summer, and autumn, with values ranging from −0.70 to −0.65. Under non-stationary conditions, the drought propagation thresholds increased generally, especially in the midstream region. From Fig. 12, it can be seen that drought propagation thresholds were most affected by large-scale climate factors and meteorological factors in winter, with a rate of change greater than 10 % or even 20 % in most regions, followed by spring, with the least change in the summer and autumn seasons. It indicated that hydrological drought was more likely to occur during winter due to climate factors.
Comparing the four seasons, the drought propagation thresholds in most areas were relatively low in spring and winter, and relatively high in summer and autumn under the stationary conditions. In contrast to winter and spring, precipitation was more abundant in summer and autumn, the runoff was more sensitive to precipitation, the propagation time from meteorological drought to hydrological drought was shorter, and a milder degree of meteorological drought might trigger hydrological drought. However, under the influence of climatic factors, the drought propagation thresholds of all four seasons changed. From the point of view of the model structure, climatic factors such as AMO, specific humidity, temperature, and wind speed had an impact on the occurrence of seasonal drought. Compared with spring, summer, and autumn, temperature and specific humidity had a great influence on the propagation of drought in winter. The increase in temperature may be the main reason for the occurrence of hydrological drought in winter.
Table 10The characteristics of the study area, including slope, evapotranspiration (E), soil moisture content (0–10 cm underground) (SMC0–10 cm), soil moisture content (10–40 cm underground) (SMC10–40 cm), soil moisture content (40–100 cm underground) (SMC40–100 cm), soil moisture content (100–200 cm underground) (SMC100–200 cm), Lead area index (LAI).

There are some differences in drought propagation thresholds in different regions, which may be caused by the watershed characteristics, including slope and so on (Han et al., 2023, Liu et al., 2023, Zhou et al., 2021). To further explore the spatial differences of propagation thresholds, the slope, average evapotranspiration, soil water content (0–10, 10–40, 40–100, 100–200 cm), and leaf area index in each region were calculated, and the relationships between the propagation thresholds and the factors were explored for each region.
As shown in Table 10, these factors may be one of the reasons for the spatial differences in drought propagation thresholds. Evapotranspiration and shallow soil moisture are dominant among these factors, followed by the effects of slope and vegetation on drought propagation. Slope affects drought propagation through its impact on surface runoff. When the slope increases and the water storage capacity decreases, the drought resistance capacity of the basin decreases, and meteorological drought is more likely to cause hydrological drought. Huang et al. (2015) pointed out that slope affects the impact of meteorological drought on agricultural drought by affecting the generation of runoff in the Weihe River Basin.
Evapotranspiration is a key part of the water cycle and directly reflects the exchange of water between the soil, vegetation, and the atmosphere. There is a positive correlation between evapotranspiration and drought propagation thresholds, and an increase in evapotranspiration leads to a decrease in surface water resources, which may increase the risk of drought propagation (Guo et al., 2020; Yao et al., 2022). Vegetation cover also affects drought propagation, and more vegetation can increase water retention in a watershed and improve its drought resistance (Zhang et al., 2022c). However, when a meteorological drought is severe, vegetation in a water-starved condition will consume more water through transpiration, accelerating the onset of drought. Soil moisture content may also be one of the factors causing spatial differences in drought propagation thresholds, with shallower soil having a greater impact on drought propagation than deep soil. Vegetation coverage significantly increases plant transpiration and inhibits soil evaporation to a certain extent. In general, the increase in vegetation coverage affects drought propagation by enhancing transpiration water consumption and soil moisture changes (Yang et al., 2025; Zhao et al., 2025).
Many studies have pointed out that climate change and human activities significantly impact the occurrence of drought in the Luanhe River basin. In this paper, meteorological drought and hydrological drought were characterized by the SPI and SRI, respectively. The drought propagation probabilities and thresholds in all seasons were calculated based on the non-stationary drought index constructed by the GAMLSS model and the Copula function, the influence of climate change and watershed characteristics on drought propagation was analyzed. The following conclusions can be drawn.
-
AMO-1 and AMO-24 have a significant impact on the precipitation series in the Luanhe River basin. The temperature, wind speed, and specific humidity were considered as the main influencing climate factors of the runoff series.
-
Based on the GAMLSS framework, both the stationary model and non-stationary model have a good fitting effect on the precipitation and runoff series of the basin, but overall, the non-stationary model can capture the time variation characteristics of these series more accurately.
-
For most regions, the probabilities of drought propagation under non-stationary conditions were greater than that under stationarity conditions. Compared to summer and autumn, spring and winter were more prone to hydrological drought and may experience more severe hydrological drought.
-
With regard to the drought propagation thresholds, non-stationary conditions were more likely to trigger hydrological drought than stationary conditions, this phenomenon was particularly evident in the midstream and upstream regions in winter, with drought propagation thresholds increasing by 0.1–0.2 under non-stationary conditions compared to stationary conditions. The increase of temperature may be the key factors contributing to the occurrence of hydrological drought in the basin.
-
Watershed characteristics were important factors in the spatial differences of drought propagation characteristics, including vegetation cover and so on. Among them, there was a high correlation (the absolute value of correlation coefficient > 0.5) between evapotranspiration, soil moisture content (10–40 cm underground, 40–100 cm underground) and drought propagation characteristics.
Limitation: There are many driving factors for the propagation of drought, and climate change and human activities are important factors among them. In this paper, we analyzed the effects of temperature, specific humidity, wind speed, and large-scale climate factors on drought and its propagation. However, there are numerous and complex factors that affect drought propagation, and different factors interact with each other. It is necessary to consider the interaction of topography, vegetation coverage, human activities, and climate change, so as to provide more effective support for drought resistance and control measures.
The underlying software code of this paper involves intellectual property issues, and therefore it is not publicly accessible.
The data and materials of the research are available from the National Oceanic and Atmospheric Administration (NOAA) (http://www.esrl.noaa.gov/psd/data/climateindices, last access: 2 April 2025) and Global Land Data Assimilation System the Advanced Very High Resolution 15 Radiometer (AVHRR) Global Inventory Modeling and Mapping Studies (GIMMS) LAI3g version 2 (https://doi.org/10.3334/ORNLDAAC/1653, Mao and Yan, 2019) and Geospatial Data Cloud site (http://www.gscloud.cn, last access: 2 April 2025).
The supplement related to this article is available online at https://doi.org/10.5194/nhess-26-1-2026-supplement.
ML: Conceptualization, Methodology, Software, Investigation, Formal Analysis, Writing-Original Draft; ZF: Data Curation, Writing-Original Draft, Writing-Review and Editing; MZ: Visualization, Investigation; LS: Superbvision, Validation; YY: Investigation, Data Curation.
The contact author has declared that none of the authors has any competing interests.
Publisher's note: Copernicus Publications remains neutral with regard to jurisdictional claims made in the text, published maps, institutional affiliations, or any other geographical representation in this paper. While Copernicus Publications makes every effort to include appropriate place names, the final responsibility lies with the authors. Views expressed in the text are those of the authors and do not necessarily reflect the views of the publisher.
We are grateful to the the National Oceanic and Atmospheric Administration (http://www.esrl.noaa.gov/psd/data/climateindices, last access: 2 April 2025) for providing the large climate indices data, and grateful to the GLDAS (https://disc.gsfc.nasa.gov/datasets/GLDAS_NOAH10_M_2.0/, last access: 2 April 2025) for providing the average monthly precipitation, temperature, wind speed, specific humidity, evapotranspiration, soil water content datasets and the runoff datasets. The data and materials of the research are available.
This work was supported by the State Key Laboratory of Hydraulic Engineering Intelligent Construction and Operation (No. HESS-2206), and the Open Fund of Key Laboratory of Flood & Drought Disaster Defense, the Ministry of Water Resources (KYFB202307260034).
This paper was edited by Lindsay Beevers and reviewed by two anonymous referees.
Abramowitz, M. and Stegun, I. A.: Handbook of Mathematical Functions [M], American Mathematical Society, 1046, https://doi.org/10.1090/s0025-5718-1983-0717728-4, 1965.
Apurv, T. and Cai, X.: Drought Propagation in Contiguous U. S. Watersheds: A Process-Based Understanding of the Role of Climate and Watershed Properties, Water Resources Research, 56, e2020WR027755, https://doi.org/10.1029/2020WR027755, 2020.
Bhardwaj, K., Shah, D., Aadhar, S., and Mishra, V.: Propagation of Meteorological to Hydrological Droughts in India, Journal of Geophysical Research: Atmospheres, 125, e2020JD033455, https://doi.org/10.1029/2020JD033455, 2020.
Chen, X., Han, R., Feng, P., and Wang, Y.: Combined effects of predicted climate and land use changes on future hydrological droughts in the Luanhe River basin, China, Natural Hazards, 110, 1305–1337, https://doi.org/10.1007/s11069-021-04992-3, 2022.
Cheng, X., Xu, Y., Chen, J., and Liu, Q.: The Impact of Climatic Conditions, Human Activities, and Catchment Characteristics on the Propagation From Meteorological to Agricultural and Hydrological Droughts in China, Journal of Geophysical Research: Atmospheres, 128, e2023JD039735, https://doi.org/10.1029/2023JD039735, 2023.
Das, S., Das, J., and Umamahesh, N. V.: Investigating the propagation of droughts under the influence of large-scale climate indices in India, Journal of Hydrology, 610, 127900, https://doi.org/10.1016/j.jhydrol.2022.127900, 2022.
Dehghani, M., Saghafian, B., and Zargar, M.: Probabilistic hydrological drought index forecasting based on meteorological drought index using Archimedean copulas, Hydrology Research, 50, 1230–1250, https://doi.org/10.2166/nh.2019.051, 2019.
Ding, Y., Xu, J., Wang, X., Cai, H., Zhou, Z., Sun, Y., and Shi, H.: Propagation of meteorological to hydrological drought for different climate regions in China, Journal of Environmental Management, 283, 111980, https://doi.org/10.1016/j.jenvman.2021.111980, 2021.
Gao, G., Li, J., Feng, P., Liu, J., and Wang, Y.: How extreme hydrological events correspond to climate extremes in the context of global warming: A case study in the Luanhe River Basin of North China, International Journal of Climatology, 44, 2391–2405, https://doi.org/10.1002/joc.8459, 2024.
Gao, Y., Niu, Y., Sun, W., Liu, K., Liu, X., Zhao, N., Yue, Y., Wu, H., Meng, F., Wang, J., Wang, X., and Liu, Q.: Climate factors driven typhus group rickettsiosis incidence dynamics in Xishuangbanna Dai autonomous prefecture of Yunnan province in China, 2005–2017, Environmental Health, 19, 3, https://doi.org/10.1186/s12940-019-0558-3, 2020.
Guo, Y., Huang, S., Huang, Q., Leng, G., Fang, W., Wang, L., and Wang, H.: Propagation thresholds of meteorological drought for triggering hydrological drought at various levels, Science of the Total Environment, 712, 136502, https://doi.org/10.1016/j.scitotenv.2020.136502, 2020.
Guo, Y., Huang, Q., Huang, S., Leng, G., Zheng, X., Fang, W., Deng, M., and Song, S.: Elucidating the effects of mega reservoir on watershed drought tolerance based on a drought propagation analytical method, Journal of Hydrology, 598, 125738, https://doi.org/10.1016/j.jhydrol.2020.125738, 2021.
Han, Z., Huang, S., Huang, Q., Leng, G., Wang, H., Bai, Q., Zhao, J., Ma, L., Wang, L., and Du, M.: Propagation dynamics from meteorological to groundwater drought and their possible influence factors, Journal of Hydrology, 578, 124102, https://doi.org/10.1016/j.jhydrol.2019.124102, 2019.
Han, Z., Huang, S., Zhao, J., Leng, G., Huang, Q., Zhang, H., and Li, Z.: Long-chain propagation pathways from meteorological to hydrological, agricultural and groundwater drought and their dynamics in China, Journal of Hydrology, 625, 130131, https://doi.org/10.1016/j.jhydrol.2023.130131, 2023.
Hao, Y., Liu, Q., Li, C., Kharel, G., An, L., Stebler, E., Zhong, Y., and Zou, C. B.: Interactive Effect of Meteorological Drought and Vegetation Types on Root Zone Soil Moisture and Runoff in Rangeland Watersheds, Water, 11, https://doi.org/10.3390/w11112357, 2019.
Huang, S., Chang, J., Leng, G., and Huang, Q.: Integrated index for drought assessment based on variable fuzzy set theory: A case study in the Yellow River basin, China, Journal of Hydrology, 527, 608–618, https://doi.org/10.1016/j.jhydrol.2015.05.032, 2015.
Huang, S., Li, P., Huang, Q., Leng, G., Hou, B., and Ma, L.: The propagation from meteorological to hydrological drought and its potential influence factors, Journal of Hydrology, 547, 184–195, https://doi.org/10.1016/j.jhydrol.2017.01.041, 2017.
Jehanzaib, M., Sattar, M. N., Lee, J.-H., and Kim, T.-W.: Investigating effect of climate change on drought propagation from meteorological to hydrological drought using multi-model ensemble projections, Stochastic Environmental Research and Risk Assessment, 34, 7–21, https://doi.org/10.1007/s00477-019-01760-5, 2020.
Jehanzaib, M., Ali, S., Kim, M. J., and Kim, T.-W.: Modeling hydrological non-stationarity to analyze environmental impacts on drought propagation, Atmospheric Research, 286, 106699, https://doi.org/10.1016/j.atmosres.2023.106699, 2023.
Kolachian, R. and Saghafian, B.: Hydrological drought class early warning using support vector machines and rough sets, Environmental Earth Sciences, 80, 390, https://doi.org/10.1007/s12665-021-09536-3, 2021.
Kumar, S., Kumar, P., Barat, A., Sinha, A. K., Sarthi, P. P., Ranjan, P., and Singh, K. K.: Characteristics of Observed Meteorological Drought and its Linkage with Low-Level Easterly Wind Over India, Pure and Applied Geophysics, 176, 2679–2696, https://doi.org/10.1007/s00024-019-02118-2, 2019.
Le, M. H., Perez, G. C., Solomatine, D., and Nguyen, L. B.: Meteorological Drought Forecasting Based on Climate Signals Using Artificial Neural Network – A Case Study in Khanhhoa Province Vietnam, Procedia Engineering, 154, 1169–1175, https://doi.org/10.1016/j.proeng.2016.07.528, 2016.
Li, J., Tang, L., Yang, J., Qu, L., Meng, F., Jiang, F., Xu, L., and He, S.: Spatial distribution of mine areas in the Luanhe River Basin, China: Clustering implications, Ore and Energy Resource Geology, 17, 100049, https://doi.org/10.1016/j.oreoa.2024.100049, 2024a.
Li, J. Z., Wang, Y. X., Li, S. F., and Hu, R.: A Nonstationary Standardized Precipitation Index incorporating climate indices as covariates, Journal of Geophysical Research: Atmospheres, 120, 12,082-12,095, https://doi.org/10.1002/2015JD023920, 2015.
Li, M., Zhang, T., and Feng, P.: A nonstationary runoff frequency analysis for future climate change and its uncertainties, Hydrological Processes, 33, 2759–2771, https://doi.org/10.1002/hyp.13526, 2019a.
Li, M., Zhang, T., Li, J., and Feng, P.: Hydrological Drought Forecasting Incorporating Climatic and Human-Induced Indices, Weather and Forecasting, 34, 1365–1376, https://doi.org/10.1175/WAF-D-19-0029.1, 2019b.
Li, M., Zhang, T., and Feng, P.: Bivariate frequency analysis of seasonal runoff series under future climate change, Hydrological Sciences Journal, 65, 2439–2452, https://doi.org/10.1080/02626667.2020.1817927, 2020.
Li, M., Feng, Z., Zhang, M., and Yao, Y.: Influence of large-scale climate indices and regional meteorological elements on drought characteristics in the Luanhe River Basin, Atmospheric Research, 300, 107219, https://doi.org/10.1016/j.atmosres.2024.107219, 2024b.
Lilhare, R., Pokorny, S., Déry, S. J., Stadnyk, T. A., and Koenig, K. A.: Sensitivity analysis and uncertainty assessment in water budgets simulated by the variable infiltration capacity model for Canadian subarctic watersheds, Hydrological Processes, 34, 2057–2075, https://doi.org/10.1002/hyp.13711, 2020.
Liu, Q., Yang, Y., Liang, L., Jun, H., Yan, D., Wang, X., Li, C., and Sun, T.: Thresholds for triggering the propagation of meteorological drought to hydrological drought in water-limited regions of China, Science of the Total Environment, 876, 162771, https://doi.org/10.1016/j.scitotenv.2023.162771, 2023.
Liu, Y., Huang, S., Guo, Y., Li, Z., and Huang, Q.: Propagation threshold of meteorological drought to different levels of hydrological drought. A case study of Qinhe River basin, Journal of Hydroelectric Engineering, 41, 9–19, https://doi.org/10.11660/slfdxb.20220202, 2022.
Mahmoudi, P., Rigi, A., and Miri Kamak, M.: Evaluating the sensitivity of precipitation-based drought indices to different lengths of record, Journal of Hydrology, 579, 124181, https://doi.org/10.1016/j.jhydrol.2019.124181, 2019.
Mann, H. B.: Nonparametric tests against trend, Econometrica: Journal of the Econometric Society, 13, 245–259, 1945.
Mao, J. and Yan, B.: Global Monthly Mean Leaf Area Index Climatology, 1981–2015, Version 1, ORNL Distributed Active Archive Center [data set], https://doi.org/10.3334/ORNLDAAC/1653, 2019.
Mckee, T. B., Doesken, N. J., and Kleist, J.: The relationship of drought frequency and duration to time scale, Proceedings of the 8th Conference on Applied Climatology, 17, 179–183, 1993.
Pandey, V., Srivastava, P. K., Mall, R. K., Munoz-Arriola, F., and Han, D.: Multi-satellite precipitation products for meteorological drought assessment and forecasting in Central India, Geocarto International, 37, 1899–1918, https://doi.org/10.1080/10106049.2020.1801862, 2022.
Peña-Gallardo, M., Vicente-Serrano, S. M., Hannaford, J., Lorenzo-Lacruz, J., Svoboda, M., Domínguez-Castro, F., Maneta, M., Tomas-Burguera, M., and Kenawy, A. E.: Complex influences of meteorological drought time-scales on hydrological droughts in natural basins of the contiguous Unites States, Journal of Hydrology, 568, 611–625, https://doi.org/10.1016/j.jhydrol.2018.11.026, 2019.
Rigby, R. A. and Stasinopoulos, D. M.: Generalized Additive Models for Location, Scale and Shape, Journal of the Royal Statistical Society Series C: Applied Statistics, 54, 507–554, https://doi.org/10.1111/j.1467-9876.2005.00510.x, 2005.
Sattar, M. N., Jehanzaib, M., Kim, J. E., Kwon, H.-H., and Kim, T.-W.: Application of the Hidden Markov Bayesian Classifier and Propagation Concept for Probabilistic Assessment of Meteorological and Hydrological Droughts in South Korea, Atmosphere, 11, 1000, https://doi.org/10.3390/atmos11091000, 2020.
Shao, S., Zhang, H., Singh, V. P., Ding, H., Zhang, J., and Wu, Y.: Nonstationary analysis of hydrological drought index in a coupled human-water system: Application of the GAMLSS with meteorological and anthropogenic covariates in the Wuding River basin, China, Journal of Hydrology, 608, 127692, https://doi.org/10.1016/j.jhydrol.2022.127692, 2022.
Shukla, S. and Wood, A. W.: Use of a standardized runoff index for characterizing hydrologic drought, Geophysical Research Letters, 35, https://doi.org/10.1029/2007GL032487, 2008.
Tao, L., Ryu, D., Western, A., and Boyd, D.: A New Drought Index for Soil Moisture Monitoring Based on MPDI-NDVI Trapezoid Space Using MODIS Data, Remote Sensing, 13, 122, https://doi.org/10.3390/rs13010122, 2021.
Vicente-Serrano, S. M., Beguería, S., and López-Moreno, J. I.: A Multiscalar Drought Index Sensitive to Global Warming: The Standardized Precipitation Evapotranspiration Index, Journal of Climate, 23, 1696–1718, https://doi.org/10.1175/2009JCLI2909.1, 2010.
Vorobevskii, I., Kronenberg, R., and Bernhofer, C.: Linking different drought types in a small catchment from a statistical perspective – Case study of the Wernersbach catchment, Germany, Journal of Hydrology X, 15, 100122, https://doi.org/10.1016/j.hydroa.2022.100122, 2022.
Wang, F., Lai, H., Li, Y., Feng, K., Zhang, Z., Tian, Q., Zhu, X., and Yang, H.: Dynamic variation of meteorological drought and its relationships with agricultural drought across China, Agricultural Water Management, 261, 107301, https://doi.org/10.1016/j.agwat.2021.107301, 2022a.
Wang, H., Zhu, Y., Qin, T., and Zhang, X.: Study on the propagation probability characteristics and prediction model of meteorological drought to hydrological drought in basin based on copula function, Frontiers in Earth Science, 10, 961871, https://doi.org/10.3389/feart.2022.961871, 2022b.
Wang, Y., Li, J., Feng, P., and Chen, F.: Effects of large-scale climate patterns and human activities on hydrological drought: a case study in the Luanhe River basin, China, Natural Hazards, 76, 1687–1710, https://doi.org/10.1007/s11069-014-1564-y, 2015a.
Wang, Y., Li, J., Feng, P., and Hu, R.: A Time-Dependent Drought Index for Non-Stationary Precipitation Series, Water Resources Management, 29, 5631–5647, https://doi.org/10.1007/s11269-015-1138-0, 2015b.
Wang, Y., Li, J., Feng, P., and Hu, R.: Analysis of drought characteristics over Luanhe River basin using the joint deficit index, Journal of Water and Climate Change, 7, 340–352, https://doi.org/10.2166/wcc.2015.108, 2016.
Wang, Y., Zhang, T., Chen, X., Li, J., and Feng, P.: Spatial and temporal characteristics of droughts in Luanhe River basin, China, Theoretical and Applied Climatology, 131, 1369–1385, https://doi.org/10.1007/s00704-017-2059-z, 2018.
Wang, Y., Duan, L., Liu, T., Li, J., and Feng, P.: A Non-stationary Standardized Streamflow Index for hydrological drought using climate and human-induced indices as covariates, Science of the Total Environment, 699, 134278, https://doi.org/10.1016/j.scitotenv.2019.134278, 2020.
Wang, Y., Peng, T., He, Y., Singh, V. P., Lin, Q., Dong, X., Fan, T., Liu, J., Guo, J., and Wang, G.: Attribution analysis of non-stationary hydrological drought using the GAMLSS framework and an improved SWAT model, Journal of Hydrology, 627, 130420, https://doi.org/10.1016/j.jhydrol.2023.130420, 2023.
Wossenyeleh, B. K., Worku, K. A., Verbeiren, B., and Huysmans, M.: Drought propagation and its impact on groundwater hydrology of wetlands: a case study on the Doode Bemde nature reserve (Belgium), Nat. Hazards Earth Syst. Sci., 21, 39–51, https://doi.org/10.5194/nhess-21-39-2021, 2021.
Wu, G., Chen, J., Shi, X., Kim, J.-S., Xia, J., and Zhang, L.: Impacts of Global Climate Warming on Meteorological and Hydrological Droughts and Their Propagations, Earths Future, 10, e2021EF002542, https://doi.org/10.1029/2021EF002542, 2022a.
Wu, J., Yao, H., Chen, X., Wang, G., Bai, X., and Zhang, D.: A framework for assessing compound drought events from a drought propagation perspective, Journal of Hydrology, 604, 127228, https://doi.org/10.1016/j.jhydrol.2021.127228, 2022b.
Xu, L., Chen, N., Yang, C., Zhang, C., and Yu, H.: A parametric multivariate drought index for drought monitoring and assessment under climate change, Agricultural and Forest Meteorology, 310, 108657, https://doi.org/10.1016/j.agrformet.2021.108657, 2021.
Yang, H., Ma, F., Yuan, X., Ji, P., and Li, C.: Vegetation greening accelerated the propagation from meteorological to soil droughts in the Loess Plateau from a three-dimensional perspective, Journal of Hydrology, 650, 132522, https://doi.org/10.1016/j.jhydrol.2024.132522, 2025.
Yao, Y., Fu, B., Liu, Y., Li, Y., Wang, S., Zhan, T., Wang, Y., and Gao, D.: Evaluation of ecosystem resilience to drought based on drought intensity and recovery time, Agricultural and Forest Meteorology, 314, 108809, https://doi.org/10.1016/j.agrformet.2022.108809, 2022.
Yeh, H.-F. and Hsu, H.-L.: Using the Markov Chain to Analyze Precipitation and Groundwater Drought Characteristics and Linkage with Atmospheric Circulation, Sustainability, 11, https://doi.org/10.3390/su11061817, 2019.
Zhang, Q., Miao, C., Gou, J., Wu, J., Jiao, W., Song, Y., and Xu, D.: Spatiotemporal characteristics of meteorological to hydrological drought propagation under natural conditions in China, Weather and Climate Extremes, 38, 100505, https://doi.org/10.1016/j.wace.2022.100505, 2022a.
Zhang, T., Su, X., Zhang, G., Wu, H., Wang, G., and Chu, J.: Evaluation of the impacts of human activities on propagation from meteorological drought to hydrological drought in the Weihe River Basin, China, Science of the Total Environment, 819, 153030, https://doi.org/10.1016/j.scitotenv.2022.153030, 2022b.
Zhang, T., Su, X., Wu, L., and Chu, J.: Identification of dynamic drought propagation from a nonstationary perspective and its application to drought warnings, Journal of Hydrology, 626, 130372, https://doi.org/10.1016/j.jhydrol.2023.130372, 2023.
Zhang, X., Hao, Z., Singh, V. P., Zhang, Y., Feng, S., Xu, Y., and Hao, F.: Drought propagation under global warming: Characteristics, approaches, processes, and controlling factors, Science of the Total Environment, 838, 156021, https://doi.org/10.1016/j.scitotenv.2022.156021, 2022c.
Zhang, Y., Hao, Z., Feng, S., Zhang, X., Xu, Y., and Hao, F.: Agricultural drought prediction in China based on drought propagation and large-scale drivers, Agricultural Water Management, 255, 107028, https://doi.org/10.1016/j.agwat.2021.107028, 2021.
Zhao, Q., Zhang, X., Li, C., Xu, Y., Fei, J., Hao, F., and Song, R.: Diverse vegetation response to meteorological drought from propagation perspective using event matching method, Journal of Hydrology, 653, 132776, https://doi.org/10.1016/j.jhydrol.2025.132776, 2025.
Zhong, F., Cheng, Q., and Wang, P.: Meteorological Drought, Hydrological Drought, and NDVI in the Heihe River Basin, Northwest China: Evolution and Propagation, Advances in Meteorology, 2020, 2409068, https://doi.org/10.1155/2020/2409068, 2020.
Zhou, J., Li, Q., Wang, L., Lei, L., Huang, M., Xiang, J., Feng, W., Zhao, Y., Xue, D., Liu, C., Wei, W., and Zhu, G.: Impact of Climate Change and Land-Use on the Propagation from Meteorological Drought to Hydrological Drought in the Eastern Qilian Mountains, Water, 11, 1602, https://doi.org/10.3390/w11081602, 2019.
Zhou, Z., Shi, H., Fu, Q., Ding, Y., Li, T., and Liu, S.: Investigating the Propagation From Meteorological to Hydrological Drought by Introducing the Nonlinear Dependence With Directed Information Transfer Index, Water Resources Research, 57, e2021WR030028, https://doi.org/10.1029/2021WR030028, 2021.