the Creative Commons Attribution 4.0 License.
the Creative Commons Attribution 4.0 License.
 | 14 Oct 2025
Flood exposure in Rotterdam's unembanked areas from 1970 to 2150: sensitivities to urban development, sea level rise, and adaptation
Martine van den Boomen
Ties Rijcken
Matthijs Kok
Uncertainties in the rate of sea level rise, coupled with ongoing urban expansion, are a challenge for city planners designing flood risk adaptation strategies. This study quantifies flood exposure in Rotterdam's unembanked areas from 1970 to 2150. We modelled flood hazards for 10-, 100-, and 1000-year return periods under both low- (RCP2.6) and high-emission (RCP8.5) scenarios while assessing exposure using historic and planned urban development data. Temporal variations in exposure rates are attributed to three factors: urban development, sea level rise, and the construction of the Maeslant storm surge barrier. Without adaptation measures, flood exposure in Rotterdam's unembanked areas is projected to increase. Under RCP8.5, exposure rates for 10-year flood events are expected to increase 7-fold by 2150 compared to 2020. For RCP2.6, a 3-fold increase is projected for 10-year events, reflecting uncertainties in long-term sea level rise. A retrospective analysis reveals a decrease in flood exposure: exposure levels observed in 2020 were approximately half those observed in 1996, due to construction of the Maeslant barrier. Exposure rates are primarily influenced by the Maeslant barrier, followed by sea level rise and urban development. Understanding the interplay of these three factors is crucial for urban planning and flood risk management in delta cities.
- Article
(6573 KB) - Full-text XML
- BibTeX
- EndNote


Without adaptation, flood exposure and potential damage are expected to increase due to the combined trends and interactions of economic growth and climate change. Over the past decades, the economic impact of flooding events has steadily increased, primarily driven by socio-economic development in flood-prone areas (Aerts and Botzen, 2011; Jongman et al., 2014). Globally, there is a persistent migration trend toward coastal areas and from rural to urban settings. This leads to higher population density and asset concentration, which in turn heightens flood exposure (Andreadis et al., 2022).
Climate change intensifies these flood risks through more frequent storms, rising sea levels, and higher river peak discharges (Calafat et al., 2022; Oppenheimer et al., 2019). Flood risk is commonly defined as a function of hazard, exposure, and vulnerability. Several studies have disentangled the key drivers of changes in flood risk across different spatial scales. At continental and global scales, historical analyses from 1950 to 2020 show that the most important drivers of flood impacts in Europe have been exposure growth and vulnerability decline (Paprotny et al., 2024). Steinhausen et al. (2022) analysed the independent and combined influence of exposure change and climate scenarios on future flood risk in Europe, finding that exposure change has a greater influence than climate-driven hazard changes in the near to mid-term future (up to 2085). Global analyses reveal distinct regional patterns. While flood impacts in African countries are mainly driven by climate change, in growing Southeast Asian economies (Indus, Yangtze, and Mekong basins), rapid urban growth dominates over climate change effects (Winsemius et al., 2016).
These large-scale studies highlight general trends, but designing effective local flood reduction strategies requires understanding risk drivers at finer spatial resolutions. At the regional and local scale, Koks et al. (2014) provided a framework to jointly assess flood hazard, exposure, and social vulnerability, demonstrating that including detailed regional information on flood risk drivers is crucial for developing effective flood reduction strategies. Local system dynamics can be complex: Schlögl et al. (2021) demonstrated that interactions within coupled natural and socio-economic systems maintain stable flood risk outcomes even as hazard events grow. Insights into these multi-scale risk drivers underscore that adaptation – through structural measures (sea walls, levees), nature-based solutions (mangrove restoration, wetlands), building-level interventions, or urban development policies – can significantly reduce future flood losses even under lower-global-warming scenarios (Magnan et al., 2022; Oppenheimer et al., 2019; Aerts, 2018; Song et al., 2017).
The interaction between risk drivers is especially interesting in urban port cities. Relocation of port activities to accommodate larger cargo ships has created new opportunities for urban development, often in historically industrial, unembanked areas located between flood sources (rivers, sea) and existing primary flood defence systems (Kaufmann et al., 2018). While these developments offer potential societal and economic benefits, they can also heighten flood exposure. Examples of port cities undergoing such transformations include Houston (Brody et al., 2018), Copenhagen (Hallegatte et al., 2011), Hamburg (Restemeyer et al., 2015), and Rotterdam (de Moel et al., 2014). This interplay between flood risk drivers, alongside the range of stakeholder interest, makes unembanked areas relevant case studies for exploring sustainable urban development and flood risk management under climate change uncertainty.
In this study, we focus on the case of Rotterdam's unembanked areas. As the need for housing is high in the Netherlands, and especially in the greater Rotterdam area, the city is currently making critical decisions about where and how to build. The (re)development of unembanked areas requires careful consideration of various trade-offs. For instance, policymakers must weigh the benefits of neighbourhood-level adaptations like ground raising – primarily benefiting new real estate – against more expensive system-scale measures such as strengthening storm surge barriers, protecting both new and existing buildings. These decisions have far-reaching implications for urban planning and flood risk management.
Previous flood risk studies that combine and correct flood losses for urban development have been limited in temporal and spatial extent, leading to an incomplete presentation of trends in flood exposure over time (Paprotny et al., 2018). In the Netherlands, studies assessing how flood risk might evolve in Rotterdam's unembanked areas have focused only on future scenarios and do not describe historical trends (de Moel et al., 2014; Veerbeek et al., 2010). These studies concluded that more accurate risk estimates would benefit from a more detailed consideration of objects and land use categories. The current study focuses specifically on residential buildings using detailed object-level data (BAG dataset; see Methods), offering higher precision for this category than broader land use classifications, although it excludes other land uses like commercial or industrial areas. Current studies only report flood exposure until 2100, but as urban planning and water management evolve toward longer decision-making time frames, there is a need for flood risk assessments that can inform these extended planning horizons while capturing temporal path dependencies.
This research aims to address these gaps by proposing a structured and flexible assessment framework for analysing historical, present, and future flood exposure of residential buildings in unembanked areas. Our framework is designed to unpack total flood exposure changes over time, attributing them to key drivers to support decision-making in urban planning and flood adaptation. The framework is applied to the unembanked areas of Rotterdam and explicitly distinguishes between the impacts of urban development, sea level rise, and adaptation efforts on flood exposure.
The study addresses the following key questions through a structured analysis:
-
How have extreme water level hazards and urban development evolved historically (1970–2020) in Rotterdam's unembanked areas, and how are they projected to change by 2150 under low- (RCP2.6) and high-emission (RCP8.5) scenarios?
-
What is the historical (1970–2020) evolution and projected (to 2150) trajectory of total residential flood exposure in Rotterdam's unembanked areas, under both RCP2.6 and RCP8.5 climate scenarios, incorporating sea level rise, planned urban development, and the Maeslant storm surge barrier's construction?
-
How does flood exposure vary spatially across different unembanked neighbourhoods, and how do these spatial patterns change over time?
-
What are the relative contributions of urban development, sea level rise, and the Maeslant storm surge barrier to the historic and projected changes in flood exposure over the period 1970–2150?
-
How sensitive is future flood exposure to different design flood elevation policies applied to new urban developments?
The framework is designed to be applicable to other unembanked areas in deltas worldwide, allowing for flexibility in data inputs and model choices based on local data availability and specific research questions.
2.1 Case study: Rotterdam's unembanked areas
Rotterdam is located in the Rhine–Meuse delta in the Netherlands, a highly urbanized area vulnerable to climate change impacts (Fig. 1). We chose the case study of the unembanked areas of Rotterdam for a number of reasons.
The Rhine–Meuse estuary, and specifically Rotterdam, is a highly urbanized area vulnerable to climate change impacts, and adapting to these challenges is crucial (Van Alphen et al., 2022; De Bruijn et al., 2022; Haasnoot et al., 2020). The focus is on unembanked areas, those located on the river side of primary flood defences, as defined by the Dutch Water Act. Unembanked areas are particularly interesting as these are not protected by flood defences and rely on their higher elevation to maintain acceptable flood risk levels. Rotterdam's flood risk policy for unembanked areas currently strongly advises raising the ground level of new building lots to withstand 1000-year flood events under the low-emission KNMI'14 climate scenario (Gemeente Rotterdam, 2021). By raising the ground levels, the design flood elevation policy aims to reduce exposure of new urban development to increasing water levels. With the current design flood elevation policy, new buildings must be elevated up to 1 m above existing ground levels. Contrarily, existing urban unembanked areas lack additional regulations to mitigate flood impacts, leaving homeowners responsible for flood damage and preventive measures (Duijn and van Buuren, 2017).
The unembanked areas of Rotterdam have been characterized by rapid urban development over the past decades. About 75 % of the current building stock in the unembanked areas (n=25 500) is realized after 1980. Furthermore, within the existing building stock, approximately 85 % of the housing units are part of multiple housing units within the same building, indicating that the assigned ground level elevation can differ from the actual elevation of the housing unit. Urban redevelopment within Rotterdam's former port areas, particularly the Stadshavens (city ports), represents one of Europe's largest inner-city transformations after the London Gateway, covering 1600 ha along both banks of the River Meuse (Daamen and Vries, 2013; Frantzeskaki et al., 2014). Situated uniquely inside Rotterdam's highway ring, these areas are highly favoured for urban (re)development. These areas are the only port areas situated inside Rotterdam's highway rim, which explains why these are favoured for urban development. Relocation of harbour activities, toward the sea to accommodate large cargo ships, has opened up spaces in unembanked areas, providing opportunities for new urban (re)developments. By 2040, Rotterdam is planning to construct 50 000 houses, of which more than 22 600 are located in unembanked areas (Rotterdams Weerwoord, 2022; Gemeente Rotterdam, 2023). Given that these unembanked areas generally are not protected by flood defences, the ground level of new building lots becomes the dominant factor in mitigating future flood exposure. As the recently released KNMI'23 scenarios project higher 1000-year flood event water levels than the KNMI'14 scenarios, the municipality plans to revise the current elevation.
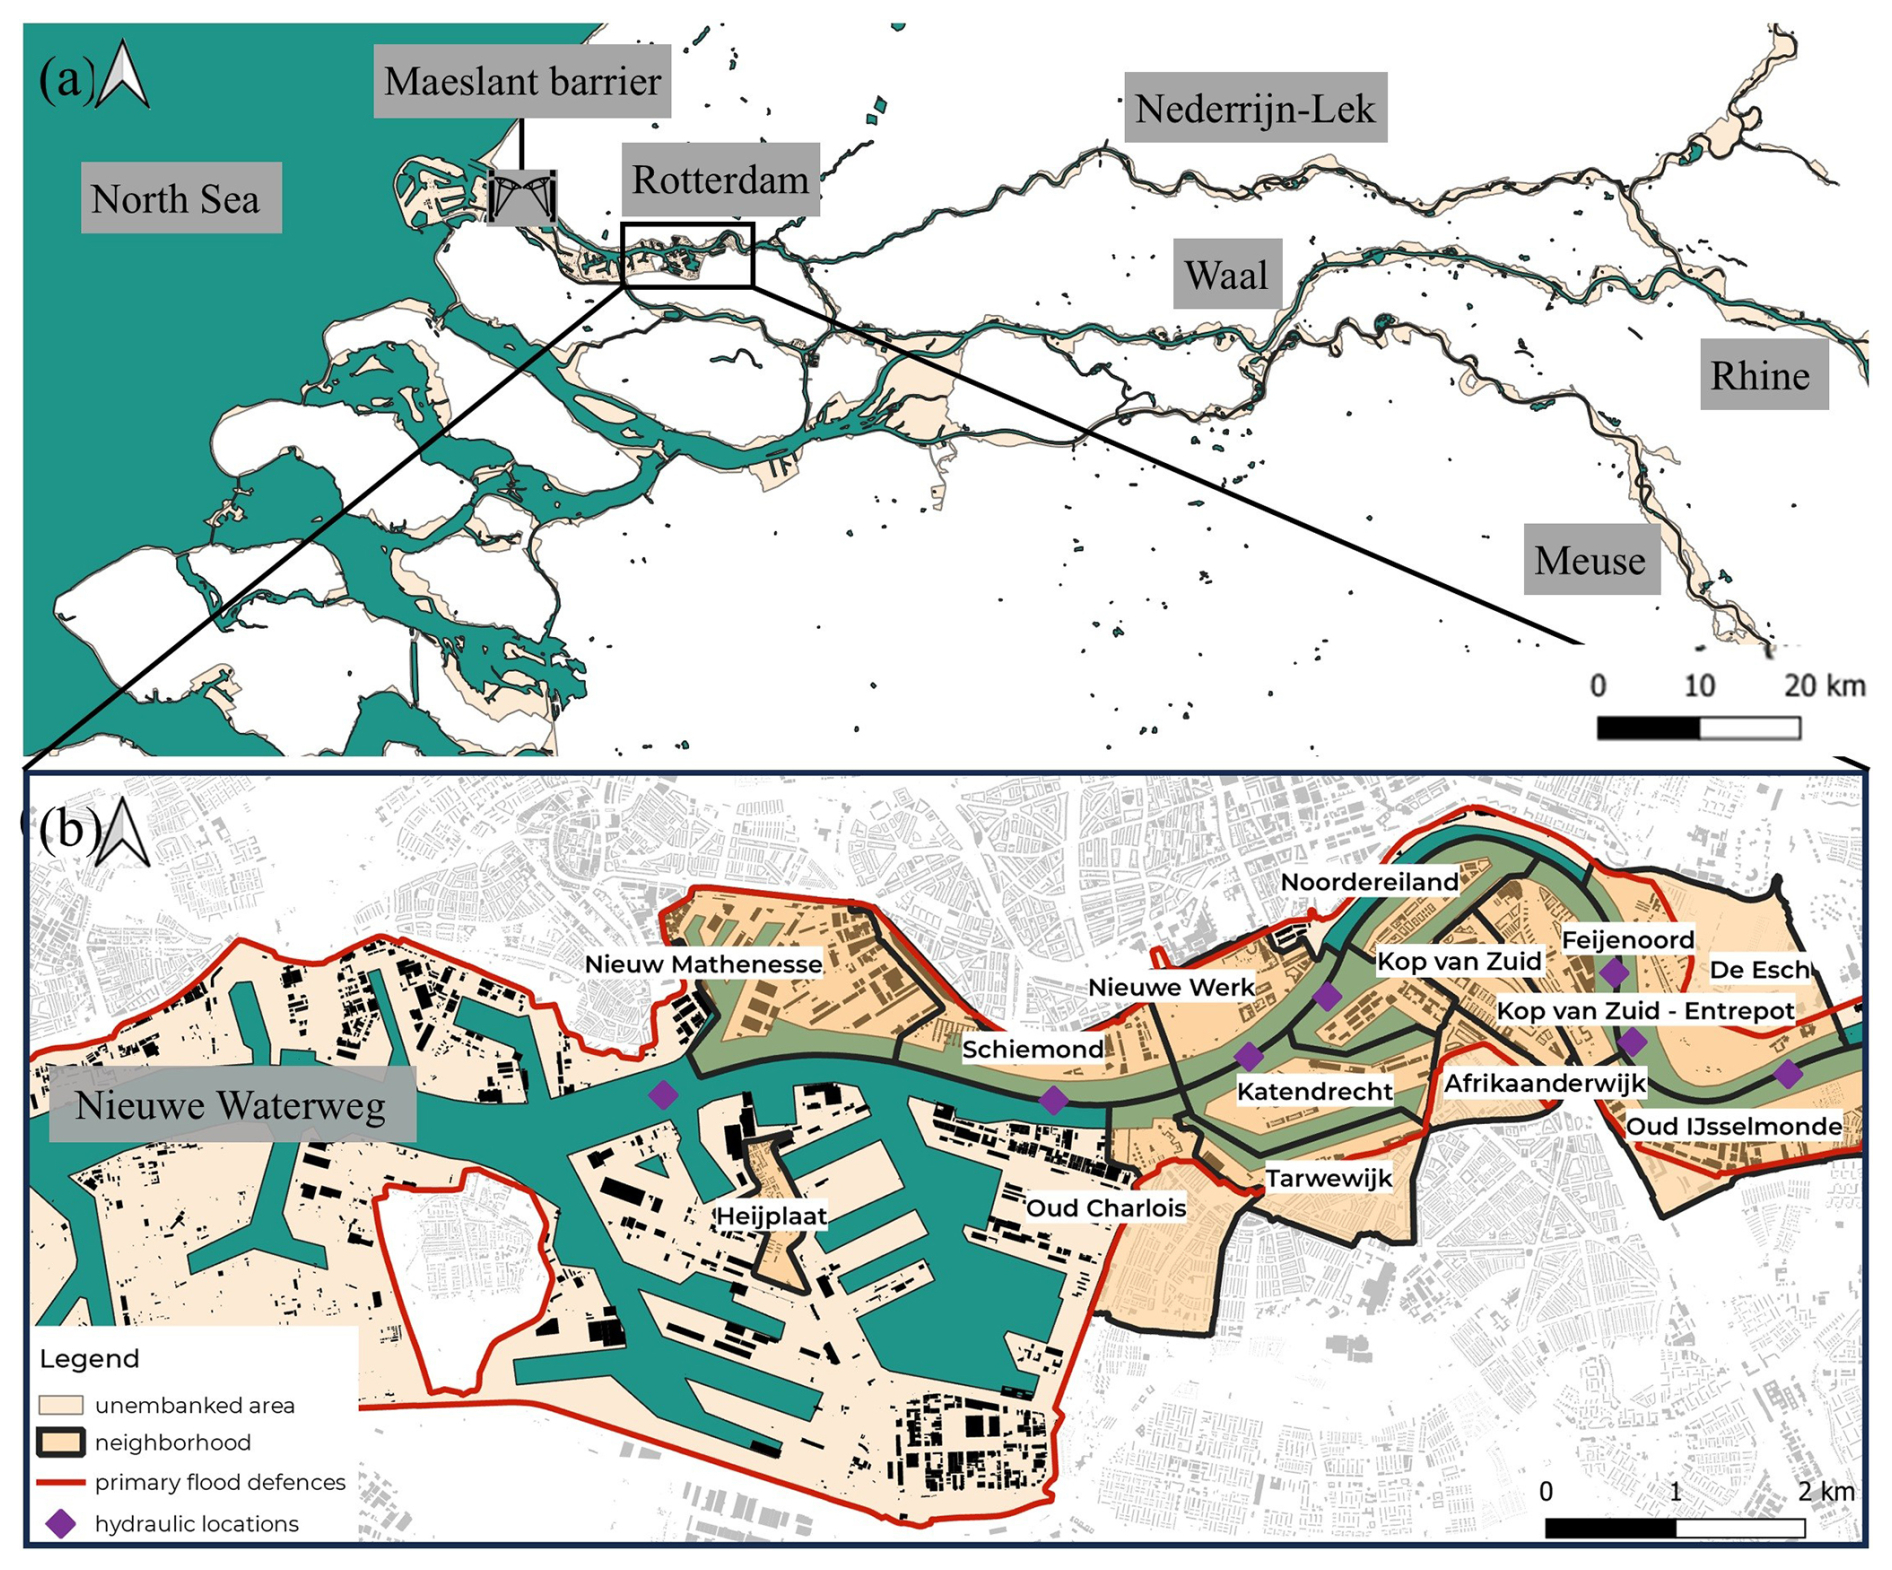
Figure 1Geographical context of the study. (a) The Rhine–Meuse delta system, showing the North Sea, the incoming Rhine and Meuse rivers, and the location of Rotterdam. (b) Detailed map of Rotterdam's unembanked neighbourhoods in relation to the primary flood defence system.
2.2 Flood modelling framework
While flood risk is commonly defined as a function of flood hazard, exposure, and vulnerability, the complexities of accurately quantifying vulnerability often necessitate a focused approach. The precise effect of hazard characteristics on exposed structures, such as those found in Rotterdam's unembanked areas, is still poorly understood and largely depends on the material and its quality (Huijbregts et al., 2014). This study primarily analyses temporal and spatial variations in flood exposure across unembanked neighbourhoods and attributes these changes to key drivers. Moreover, calibrating such models requires rich empirical data from local flood events, which are not available for this specific context: existing Dutch models often rely on historical data with limited transferability (Wagenaar et al., 2018). Consequently, this study prioritizes a detailed assessment of flood exposure (Fig. 2). We quantify the number of exposed buildings resulting from the interplay of urban development, sea level rise, and the Maeslant storm surge barrier construction, attributing exposure changes to each of these factors.
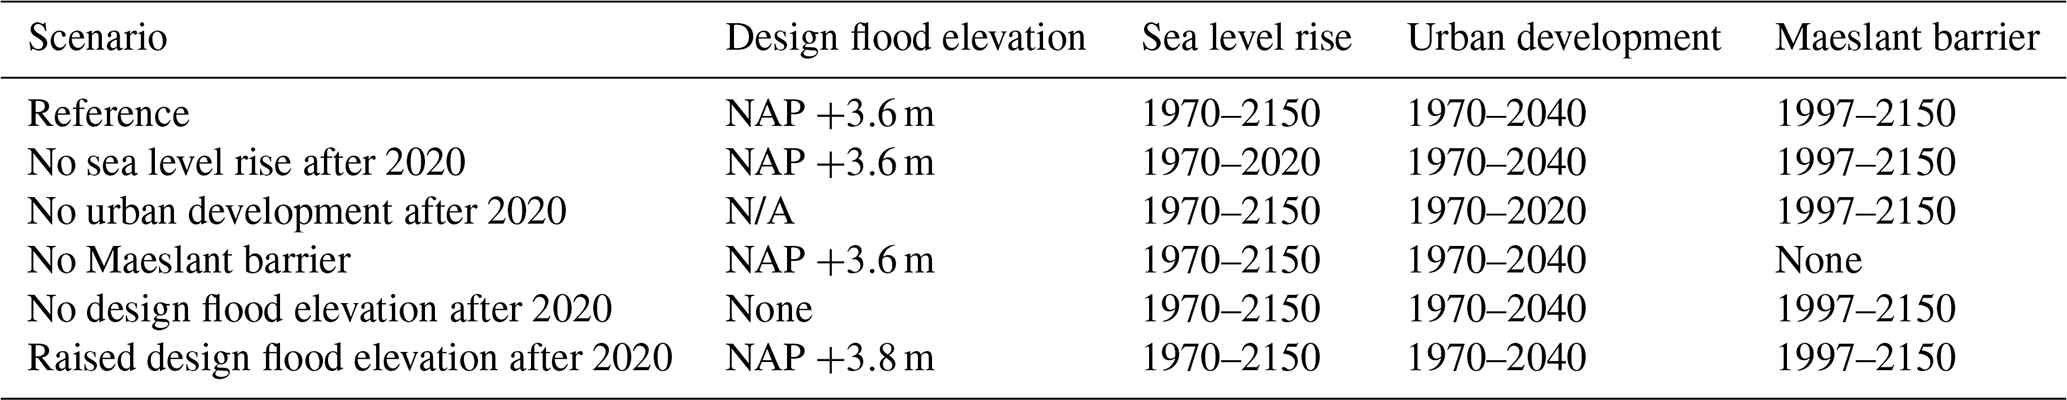
To achieve this, we use six combinations of flood hazard and exposure, as specified in Table 1. The reference scenario includes all drivers: historical and projected sea level rise, historical and planned urban development, and the Maeslant barrier's operation post-1997. To isolate individual impacts, subsequent scenarios systematically vary these conditions, for example, by excluding future sea level rise, no urban development post-2020, or removing the effect of the Maeslant barrier. The final two scenarios specifically explore the sensitivity of future exposure to various levels for the design flood elevation. If no design flood elevation is applied in a scenario, it implies that new developments follow the existing ground elevation distribution within their respective neighbourhoods.
In the remainder of this section, we outline our approach and the data used. We begin by describing our flood hazard modelling methods in Sect. 2.2.1, followed by our exposure modelling techniques in Sect. 2.2.2. Finally, Sect. 2.3 explains how we combine hazard and exposure data to create spatial and temporal maps of flood exposure. Throughout these sections, we detail the specific data sources used for our case study in Rotterdam. While our methodology is tailored to the unembanked areas in Rotterdam, it can be adapted to other contexts. Researchers applying this framework to other port areas or urban coastal regions can substitute local data for both the hazard and exposure components, making the methodology broadly applicable. Further details about scripts and data used in this study are provided in the repository (Oerlemans, 2024).
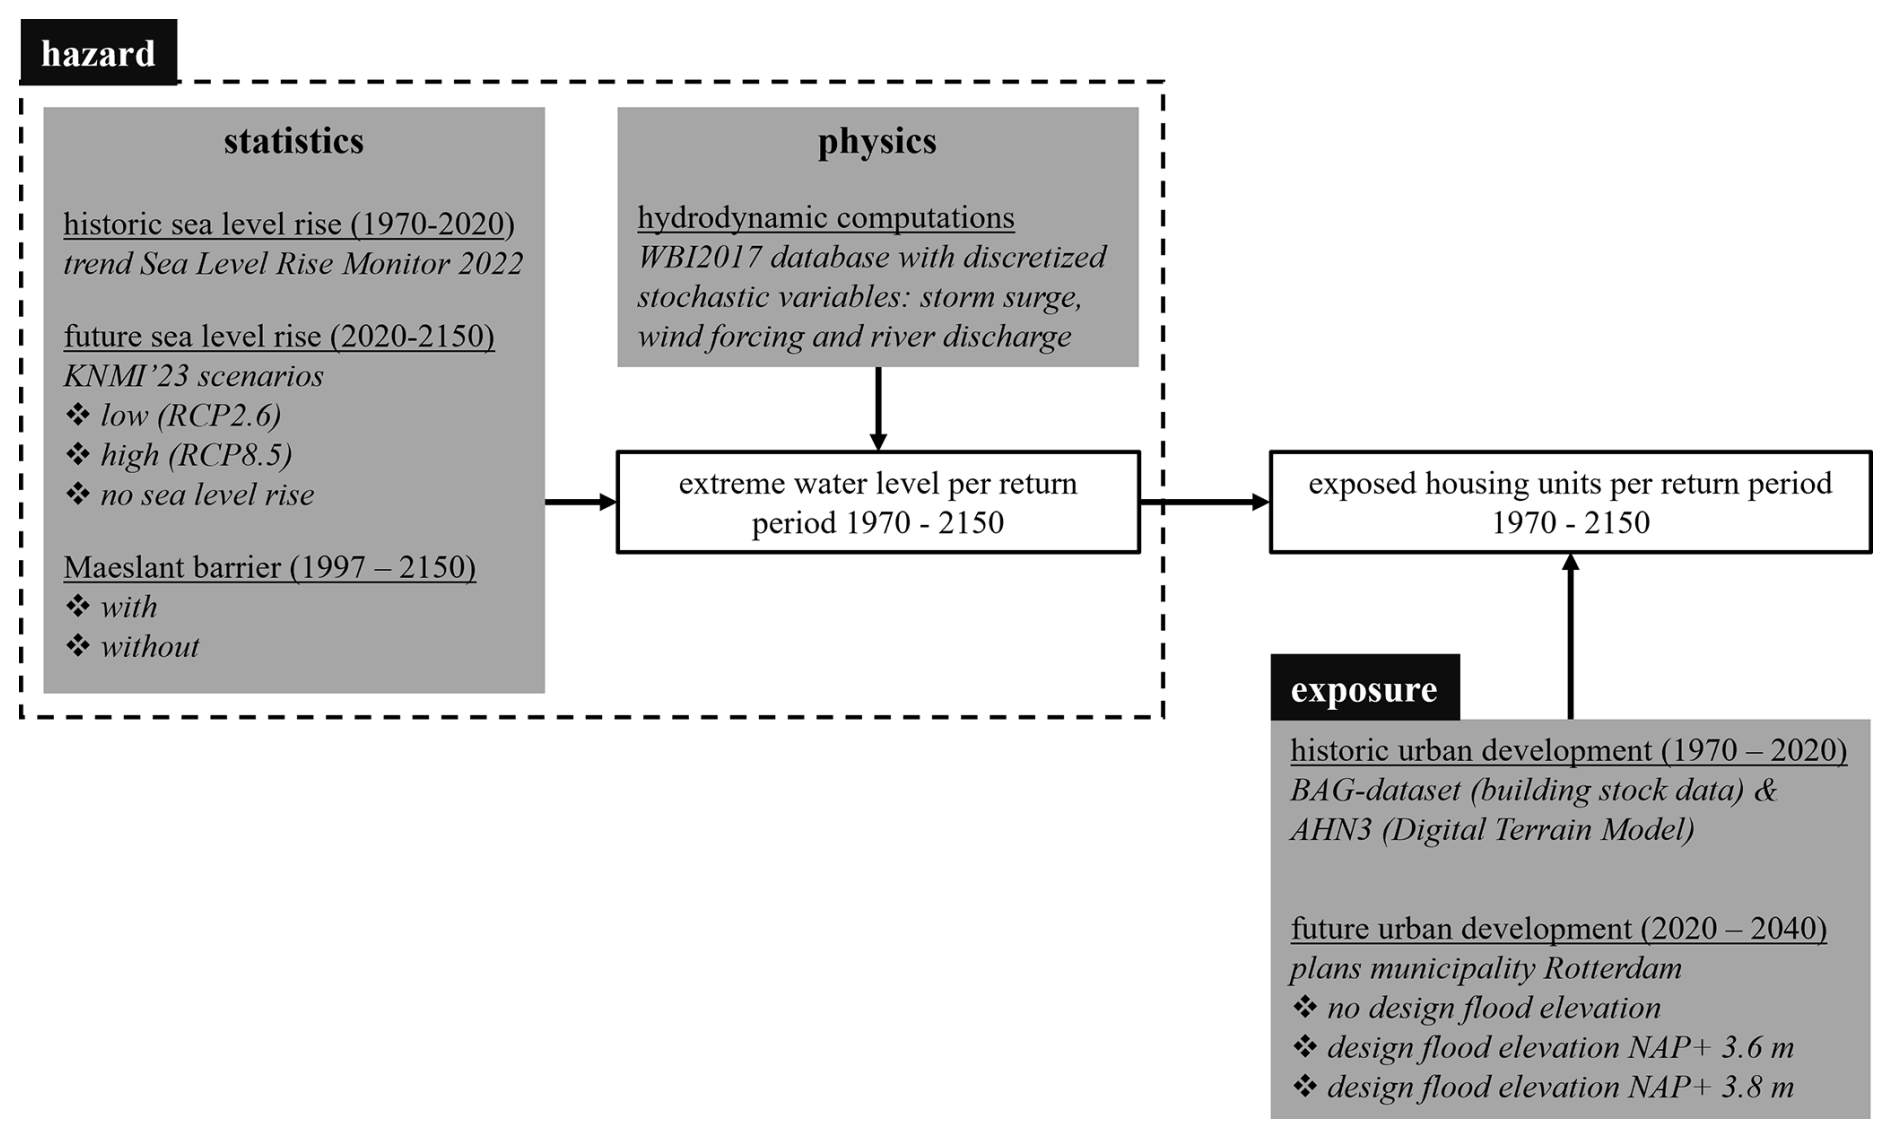
Figure 2Schematic of the integrated methodological framework and data inputs for calculating residential flood exposure. This diagram shows how flood hazard inputs (derived from sea level statistics, hydrodynamic models, and Maeslant storm surge barrier scenarios) are combined with exposure inputs (historical building stock, future urban development plans, and design elevation scenarios) to determine the number of exposed housing units per return period from 1970 to 2150.
2.2.1 Flood hazard: historical extreme water levels and future projections
Describing flood hazard in the Rhine–Meuse estuary is inherently complex, as water levels and wave conditions result from an interplay between sea conditions, discharges on multiple rivers, wind forcing, and whether storm surge barriers are open or closed (Fig. 1). To capture this complexity, our analysis uses the official governmental WBI2017 dataset, the standard dataset for dike assessment and design in the Netherlands (Agtersloot and Paarlberg, 2016). This dataset provides water levels and wave conditions for the Rhine–Meuse estuary derived from simulations using the 2D hydrodynamic model WAQUA. It encompasses 9750 scenarios, representing discrete combinations of the key stochastic input variables: wind direction, wind speed, river discharges, sea level variations, and Maeslant storm surge barrier operation (open/closed). These hydrodynamic simulations of the Rhine–Meuse estuary form the foundation for our probabilistic flood hazard assessment.
While the WBI database provides deterministic outcomes of water levels and wave conditions throughout the entire study area for specific scenarios, assessing flood risk over time requires a probabilistic approach. Therefore, we used the Hydra-NL software package (v.2.8.2) to translate hydrodynamic computations into water level frequency lines. These lines represent water level magnitudes and their probability of exceedance at specific locations in the Rhine–Meuse estuary. Hydra-NL is an open-source probabilistic model widely used in the Netherlands for deriving hydraulic boundary conditions for flood defence assessment (Ministerie van Infrastructuur en Milieu, 2016). It functions by combining the hydrodynamic outcomes from the WBI database with probabilistic information about the input variables, such as river discharge distributions and sea level statistics derived from measurements. We derived water level frequency lines for eight locations along the Nieuwe Waterweg for both historical (1970–2020) and future (2020–2150) periods (Fig. 1).
Table 1Specifications of the six scenarios used in the flood exposure analysis. Each scenario defines a unique combination of assumptions for design flood elevation (for post-2020 new builds), sea level rise, urban development, and Maeslant storm surge barrier operation. Colour-coding used in this table matches that in subsequent figures illustrating scenario-based results. NAP: Dutch Ordnance Datum, approximately corresponding to mean sea level.
The detailed Hydra-NL model outputs, including analyses of dominant contributing combinations of storm surge, Maeslant barrier operation, and river discharge for each return period and location, are provided in the associated data repository (Oerlemans, 2024). Notably, both historical and future analyses use the same underlying WAQUA computations from the WBI2017 database; the effects of changing conditions like sea level rise are incorporated solely through the probabilistic weighting within Hydra-NL, not through re-running the hydrodynamic 2D WAQUA computations of the WBI database.
To reconstruct the historical flood hazard, specific temporal adjustments were applied to the Hydra-NL analysis for the period 1970–2020. Firstly, we included past local sea level rise trends: 1.8 mm yr−1 for 1970–1990 and 2.9 mm yr−1 for 1990–2020, as derived from the Sea Level Rise Monitor 2022 (Deltares, 2023). Secondly, the impact of the Maeslant barrier's construction was accounted for by applying a failure probability of one per closure request in Hydra-NL for simulations prior to 1997, effectively removing its influence on extreme water levels before its construction year. While river discharge distributions of the Rhine are important in calculating extreme water levels in other areas in the Rhine–Meuse estuary, especially with expected increases in peak discharges that are included in climate scenarios, their impact on Rotterdam is relatively limited. This is because sea level, including storm surges, has a more significant impact on water levels in Rotterdam compared to river discharge. Hence, we did not include temporal changes for the discharge distributions in the Hydra-NL analysis.
To calculate future water level frequency lines (2020–2150), we adopted the KNMI'23 climate change scenarios (Dorland et al., 2023). These scenarios, building upon global Intergovernmental Panel on Climate Change (IPCC) scenarios but projecting further into the future, provide a more comprehensive representation of uncertainty for long-term decision-making and far-future risk management. The rationale behind adopting the KNMI scenarios is to be methodologically consistent with the IPCC and as such provide a widely accepted and actionable common projection for climate change in the Netherlands while at the same time using the most accurate local projections for Rotterdam. The KNMI'23 scenarios are categorized into low-emission (RCP2.6) and high-emission (RCP8.5) scenarios. This aligns our study with the scenarios used in the national Deltaprogramma initiative for evaluating and developing long-term flood risk management and climate adaptation strategies (Deltaprogramma, 2023).
While analyses incorporated both emission pathways, we use the high-emission KNMI'23 scenario (RCP8.5) as the central case for evaluating future flood hazards, representing a more precautionary upper bound for planning. To explicitly address the significant uncertainty concerning the timing rather than just the magnitude of future sea level rise impacts, results derived from the low-emission scenario (RCP2.6) are presented alongside the high-emission results. This comparative approach highlights the range of plausible future timelines; for instance, the 0.27 m sea level rise projected by 2050 under the high-emission scenario is not anticipated until 2058 under the low-emission pathway. Consequently, to visually represent this temporal uncertainty stemming from different emission trajectories, results throughout this paper are presented using a double x axis, mapping equivalent exposure levels to their corresponding years under both scenarios.
2.2.2 Flood exposure: current building stock and future projections
To assess exposure of the current building stock, we used the open-source BAG dataset to obtain building footprints of residential assets in Rotterdam's unembanked areas (Kadaster, 2022). For about 9 million addresses in the Netherlands, the BAG database includes key attributes, including property function, the surface area, and the construction year. In our analysis, only residential assets are included. Ground-level elevation data for each existing building footprint were derived by spatially joining the BAG data with digital terrain model of the Netherlands (AHN3, 0.5 m resolution raster). It is important to note that this represents the elevation of the surrounding terrain, not necessarily the finished floor level of individual housing units.
Addressing future changes in exposure required integrating planned urban development data provided by the Municipality of Rotterdam (Gemeente Rotterdam, 2023). These urban development plans outline major urban planning projects, specifying the number of planned housing units, their intended neighbourhoods, and scheduled completion dates up to 2040. However, these municipal data lack specific elevation plans for these unembanked future housing units. To explore the impact of potential future elevation strategies, particularly the city's design flood elevation policy, we formulated three distinct elevation scenarios for all planned housing units:
-
Reference-design-flood-elevation scenario. All planned housing units are assigned an elevation corresponding to the current design flood elevation of NAP +3.6 m (Amsterdam Ordnance Datum).
-
Increased-design-flood-elevation scenario. Planned units are assigned an elevated design flood elevation of NAP +3.8 m, reflecting a potential future increase in the design flood elevation standard. This 20 cm increase reflects a potential revision of the current standard (based on KNMI'14 scenarios) due to new climate projections (KNMI'23), which suggest a similar magnitude of change. While seemingly modest, this 0.2 m elevation increase would involve substantial additional costs, estimated in the tens of millions of euros.
-
No-design-flood-elevation scenario. This approach assumes urban densification without raising ground levels. We derived a Gaussian distribution based on existing neighbourhood elevations and used this to sample elevations for planned housing units, maintaining the current elevation distribution per neighbourhood.
Evaluating these distinct elevation pathways for new developments allows for an assessment of the design elevation policy's effectiveness in mitigating flood exposure under conditions of urban growth and climate change.
2.3 Quantifying residential flood exposure
Exposure was quantified by directly comparing the probabilistic water levels (hazard) with the assigned ground-level elevations of individual housing units (exposure) for 10-, 100-, and 1000-year flood events. A housing unit was classified as exposed during a given flood event scenario if the calculated water level exceeded its ground-level elevation by a defined threshold. Based on typical residential construction in the area, a threshold of 0.25 m, representing the average height of doorsteps, was adopted (Veerbeek et al., 2010). To assess the exposure over time, this calculation was performed for each housing unit – both existing and future under each design flood elevation scenario – across the range of water levels associated with return periods of 10, 100, and 1000 years.
This section presents the results of our analysis of residential flood exposure in Rotterdam's unembanked areas. We begin by characterizing the historical evolution and future projections of the key drivers: extreme water level hazards (Sect. 3.1.1) and residential urban development, including building stock and ground elevations (Sect. 3.1.2). Following this, Sect. 3.2 examines the total residential flood exposure that results from the combined interplay of these drivers under our reference scenario. Section 3.3 then explores the spatial distribution of this total exposure across Rotterdam's different unembanked neighbourhoods, highlighting variations in both relative and absolute numbers of exposed housing units over time. Subsequently, Sect. 3.4 presents an attribution analysis, disentangling the relative contributions of future sea level rise, planned urban development, and the Maeslant storm surge barrier's operation to projected changes in total residential flood exposure. We conclude in Sect. 3.5 with a sensitivity assessment, evaluating how future flood exposure for new urban developments is influenced by various levels of the design flood elevation.
3.1 Characterizing flood exposure drivers: extreme water levels and urban development
3.1.1 Extreme water levels between 1970–2150
Extreme water levels in Rotterdam's unembanked areas are primarily influenced by North Sea conditions (tides and storm surges), with river discharge playing a secondary role compared to locations more upstream in the Rhine–Meuse estuary. Over the study period, these extreme water levels are shaped by two main drivers: ongoing sea level rise and the operation of the Maeslant storm surge barrier.
Probabilistic calculations show an upward trend in extreme water levels due to sea level rise (Fig. 3a), assuming no system-scale adaptations, such as increased storage capacity or improvement of the closure reliability of the Maeslant barrier (Mooyaart et al., 2022). From 1996 to 1997, extreme water levels decreased due to the construction of the Maeslant barrier, ranging from a reduction of 0.06 m for 10-year events to 0.71 m for 1000-year events. Looking forward, under the RCP8.5 scenario, the 1000-year water level in 2150 is projected to be similar to the water level prior to the construction of the Maeslant barrier. Under the low-emission scenario (RCP2.6), the 2150 level for a 1000-year event remains 0.48 m lower than in 1996. For 100-year events under RCP8.5, the 1996 water level is projected to be reached again around 2090 and exceeded by 0.21 m in 2150. The mitigating effect of the Maeslant barrier is less pronounced for 10-year events because its closing criterion (NAP +3.0 m) means the barrier often remains open during 10-year events. Hence, the extreme water level for 10-year events in 2150 is projected to increase by 0.58 m (RCP8.5) and 0.33 m (RCP2.6) when compared to the 1996 levels.
3.1.2 Urban development between 1970–2040
The ground level elevation of current unembanked housing units varies considerably across different neighbourhoods (Fig. 3b), which holds implications for designing long-term flood risk adaptation strategies. Analysis reveals that both the mean ground elevation and the spread of this distribution differ substantially among these districts and directly influence how exposure rates change with marginal increases in flood water levels. Specifically, neighbourhoods such as Heijplaat, Nieuwe Werk, and Noordereiland have median ground elevation values below 3.3 m. When considering all unembanked neighbourhoods collectively, approximately 45 % of the existing building stock possesses ground level elevations that fall below the current design flood elevation of NAP +3.6 m.
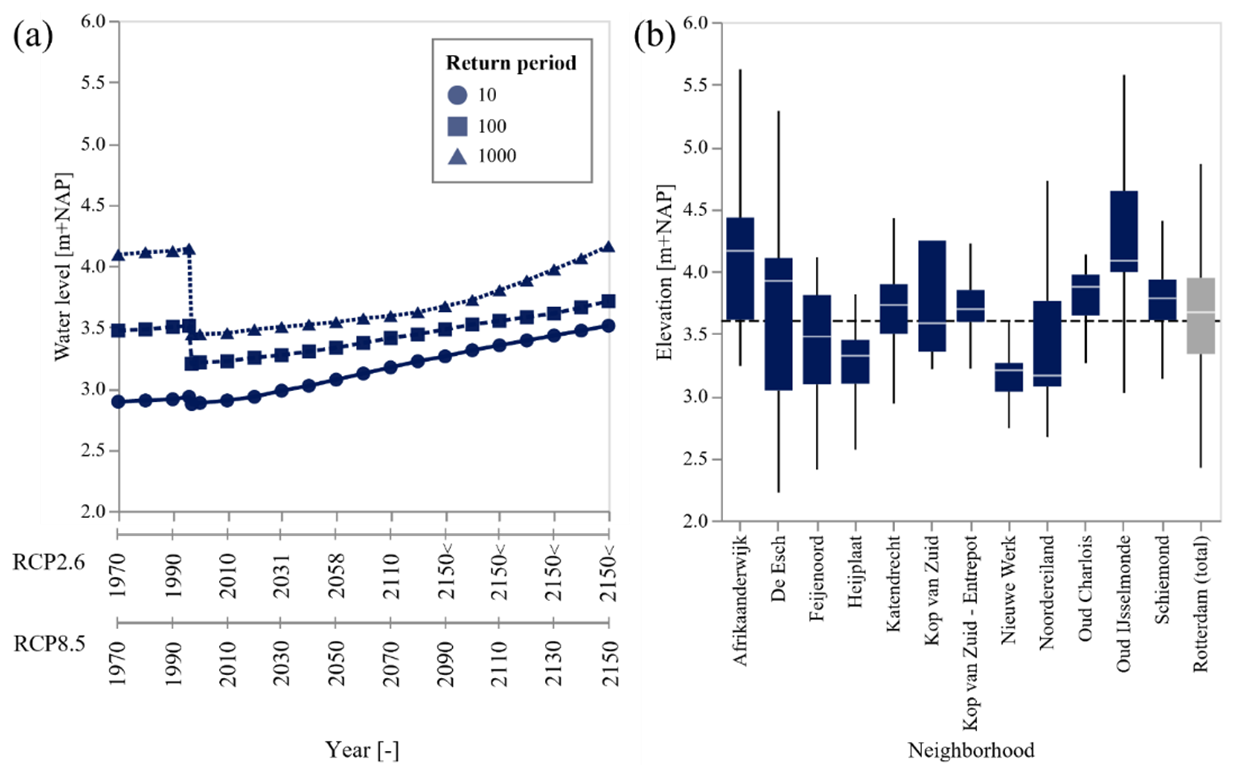
Figure 3Extreme water levels and building elevation distributions in Rotterdam's unembanked areas. (a) Spatially averaged extreme water levels (1970–2150) by return period (10, 100, 1000 years), with a dual x axis mapping levels to low- (RCP2.6) and high-emission (RCP8.5) scenarios (hydraulic locations shown in Fig. 1). (b) Box plot distributions of ground-level elevations for existing residential buildings by neighbourhood, showing the median, interquartile range, and 5th/95th percentiles. Tarwewijk and Nieuw Mathenesse are excluded due to limited residential building data.
3.2 Temporal variations in flood exposure: combined impact of urban development, sea level rise, and adaptation
An analysis of the collective influence of sea level rise, urban development, and the Maeslant barrier construction on the exposure of unembanked housing units in Rotterdam was conducted from 1970 to 2150 (Fig. 4). Without adaptation measures, unembanked areas in Rotterdam are expected to face increased flood exposure, particularly in the 22nd century. The magnitude of this increase varies across different return periods.
For 10-year events, the number of houses exposed to flooding is projected to increase from 400 in 1970 to 800 in 2020 and further to 5700 by 2150 under the RCP8.5 scenario (a 7-fold increase from 2020). Under RCP2.6, the 2150 projection is around 2400 exposed units, a 3-fold increase from 2020. The 100-year flood events show a different pattern: exposure decreases from 3200 houses in 1970 to 1600 houses in 2020, followed by an increase to 9100 in 2150 under the RCP8.5 scenario (a 6-fold increase from 2020). The RCP2.6 scenario projects about 5400 exposed units in 2150, a 3-fold increase from 2020. Similarly, for 1000-year events, exposure initially decreases from 5200 houses in 1970 to 4700 in 2020 before being projected to rise significantly to 39 400 in 2150 under the RCP8.5 scenario (an 8-fold increase from 2020). Under RCP2.6, the 2150 projection is approximately 10 700 units, a 2-fold increase from 2020.
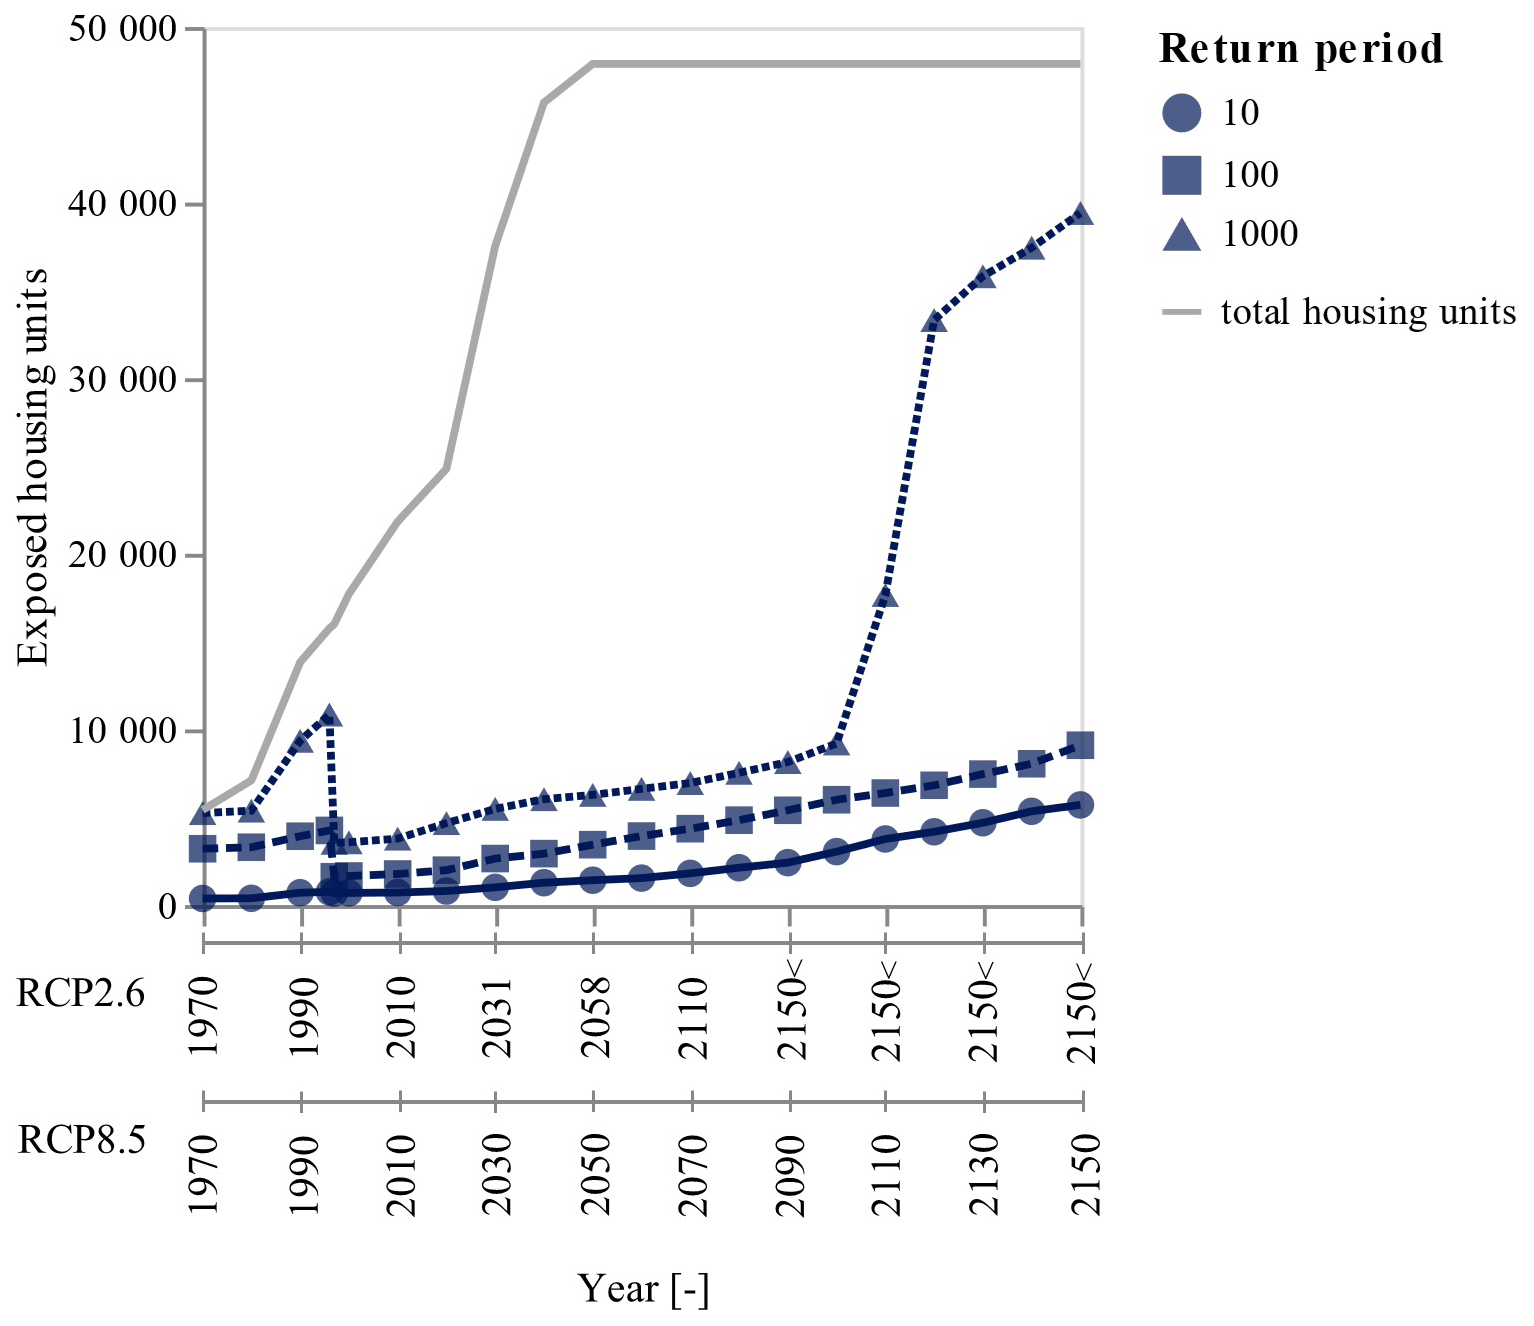
Figure 4Number of exposed houses for Rotterdam's unembanked areas for 10-, 100-, and 1000-year events between 1970 and 2150 for the low- (KNMI'23, RCP2.6) and high-emission (KNMI' 23, RCP8.5) scenarios. The dual x axis maps exposure levels to these two emission scenarios.
The operationalization of the Maeslant barrier in 1997 mitigated exposure, as evidenced by a decrease in extreme water levels (Fig. 3a) and exposed houses (Fig. 4). Specifically, the number of exposed houses decreased by approximately 100 houses (10 %) for 10-year events, 2600 houses (62 %) for 100-year events, and 7300 houses (67 %) for 1000-year events. The barrier's impact for 10-year events, compared to the other return periods, is limited because extreme water levels during such events do not always surpass the barrier's closure threshold. Consequently, there are instances in which the Maeslant barrier remains open, even though doing so results in flood exposure for certain properties.
3.3 Spatial distribution of flood exposure
Rotterdam's 14 unembanked neighbourhoods show significant variations in flood exposure, largely due to differences in housing unit elevations and density (Fig. 3b). To illustrate these exposure variations, we analysed the proportion of exposed houses in each neighbourhood over time (Fig. 5). These values fluctuate due to changes in the total number of houses (urban development) and shifts in water levels (sea level rise and Maeslant barrier operation), emphasizing the need for neighbourhood-specific adaptation strategies.
For 10-year flood events, the range of exposure across neighbourhoods is relatively narrow. In 1970, Kop van Zuid–Entrepot showed the highest relative exposure, at 48 % (∼110 houses), while Feijenoord, with 24 % relative exposure, had the largest absolute number of exposed units (∼220 houses). Other neighbourhoods had less than 5 % exposure. By 2020, overall exposure decreased. De Esch had the highest relative exposure, at 17 % (∼300 houses), whereas Feyenoord maintained the largest absolute exposure, with approximately 340 units (10 %); 9 out of the 14 neighbourhoods showed no exposure. Projections for 2150 under the RCP8.5 scenario indicate exposure reaching up to 58 % (∼1200 houses) in Noordereiland. Under the RCP2.6 scenario in 2150, maximum relative exposure in any neighbourhood is limited to 23 %.
The 100-year flood events show greater variability in exposure rates. In 1970, most neighbourhoods, except for the six neighbourhoods with few or no houses in 1970, had over 43 % exposure. By 2020, exposure decreased across all neighbourhoods, with Nieuwe Werk being the highest, at 23 % (∼230 houses). The Feijenoord neighbourhood shows the largest absolute number of exposed units, at approximately 670 houses (20 %). Projections for 2150 under the RCP8.5 scenario suggest a wide range of relative exposure, from 0 % exposure in Nieuw Mathenesse to 76 % in Heijplaat (∼690 houses).
For 1000-year events, the variability in exposure rates between neighbourhoods decreases in the far future as many approach 100 % exposure. While nearly all houses were at risk in 1970, this dropped to between 11 % and 77 % by 2020 due to the Maeslant storm surge barrier. However, 2150 projections under RCP8.5 show a return to near-total relative exposure in most areas. In absolute terms, Katendrecht is projected to have the largest number of exposed units (∼6790 houses), followed by Kop van Zuid (∼5070 houses) and Nieuw Mathenesse (∼4490 houses), reflecting the substantial planned development in these areas.
Interestingly, while extreme water levels have increased linearly since 1997 (Fig. 3a), the growth in the number of exposed houses follows a less predictable, non-linear pattern. This is a direct consequence of the unique elevation profile of each neighbourhood. These characteristics – both the median elevation and the distribution of elevations – influence the timing (e.g. when 50 % of the housing units become exposed for a specific return period) and the rate of increase in exposure for marginal rises in water levels. For example, Nieuwe Werk, with its lower average elevation and less variability, shows a rapid increase towards 100 %. In contrast, Kop van Zuid, with higher and more varied elevations, shows a more gradual increase in exposure. These findings highlight that one-size-fits-all solutions, like uniform waterfront heightening, will not be equally effective across Rotterdam. Each neighbourhood requires a tailored approach to flood risk management, informed by its specific elevation profile, housing density of current building stock, and urban development plans.
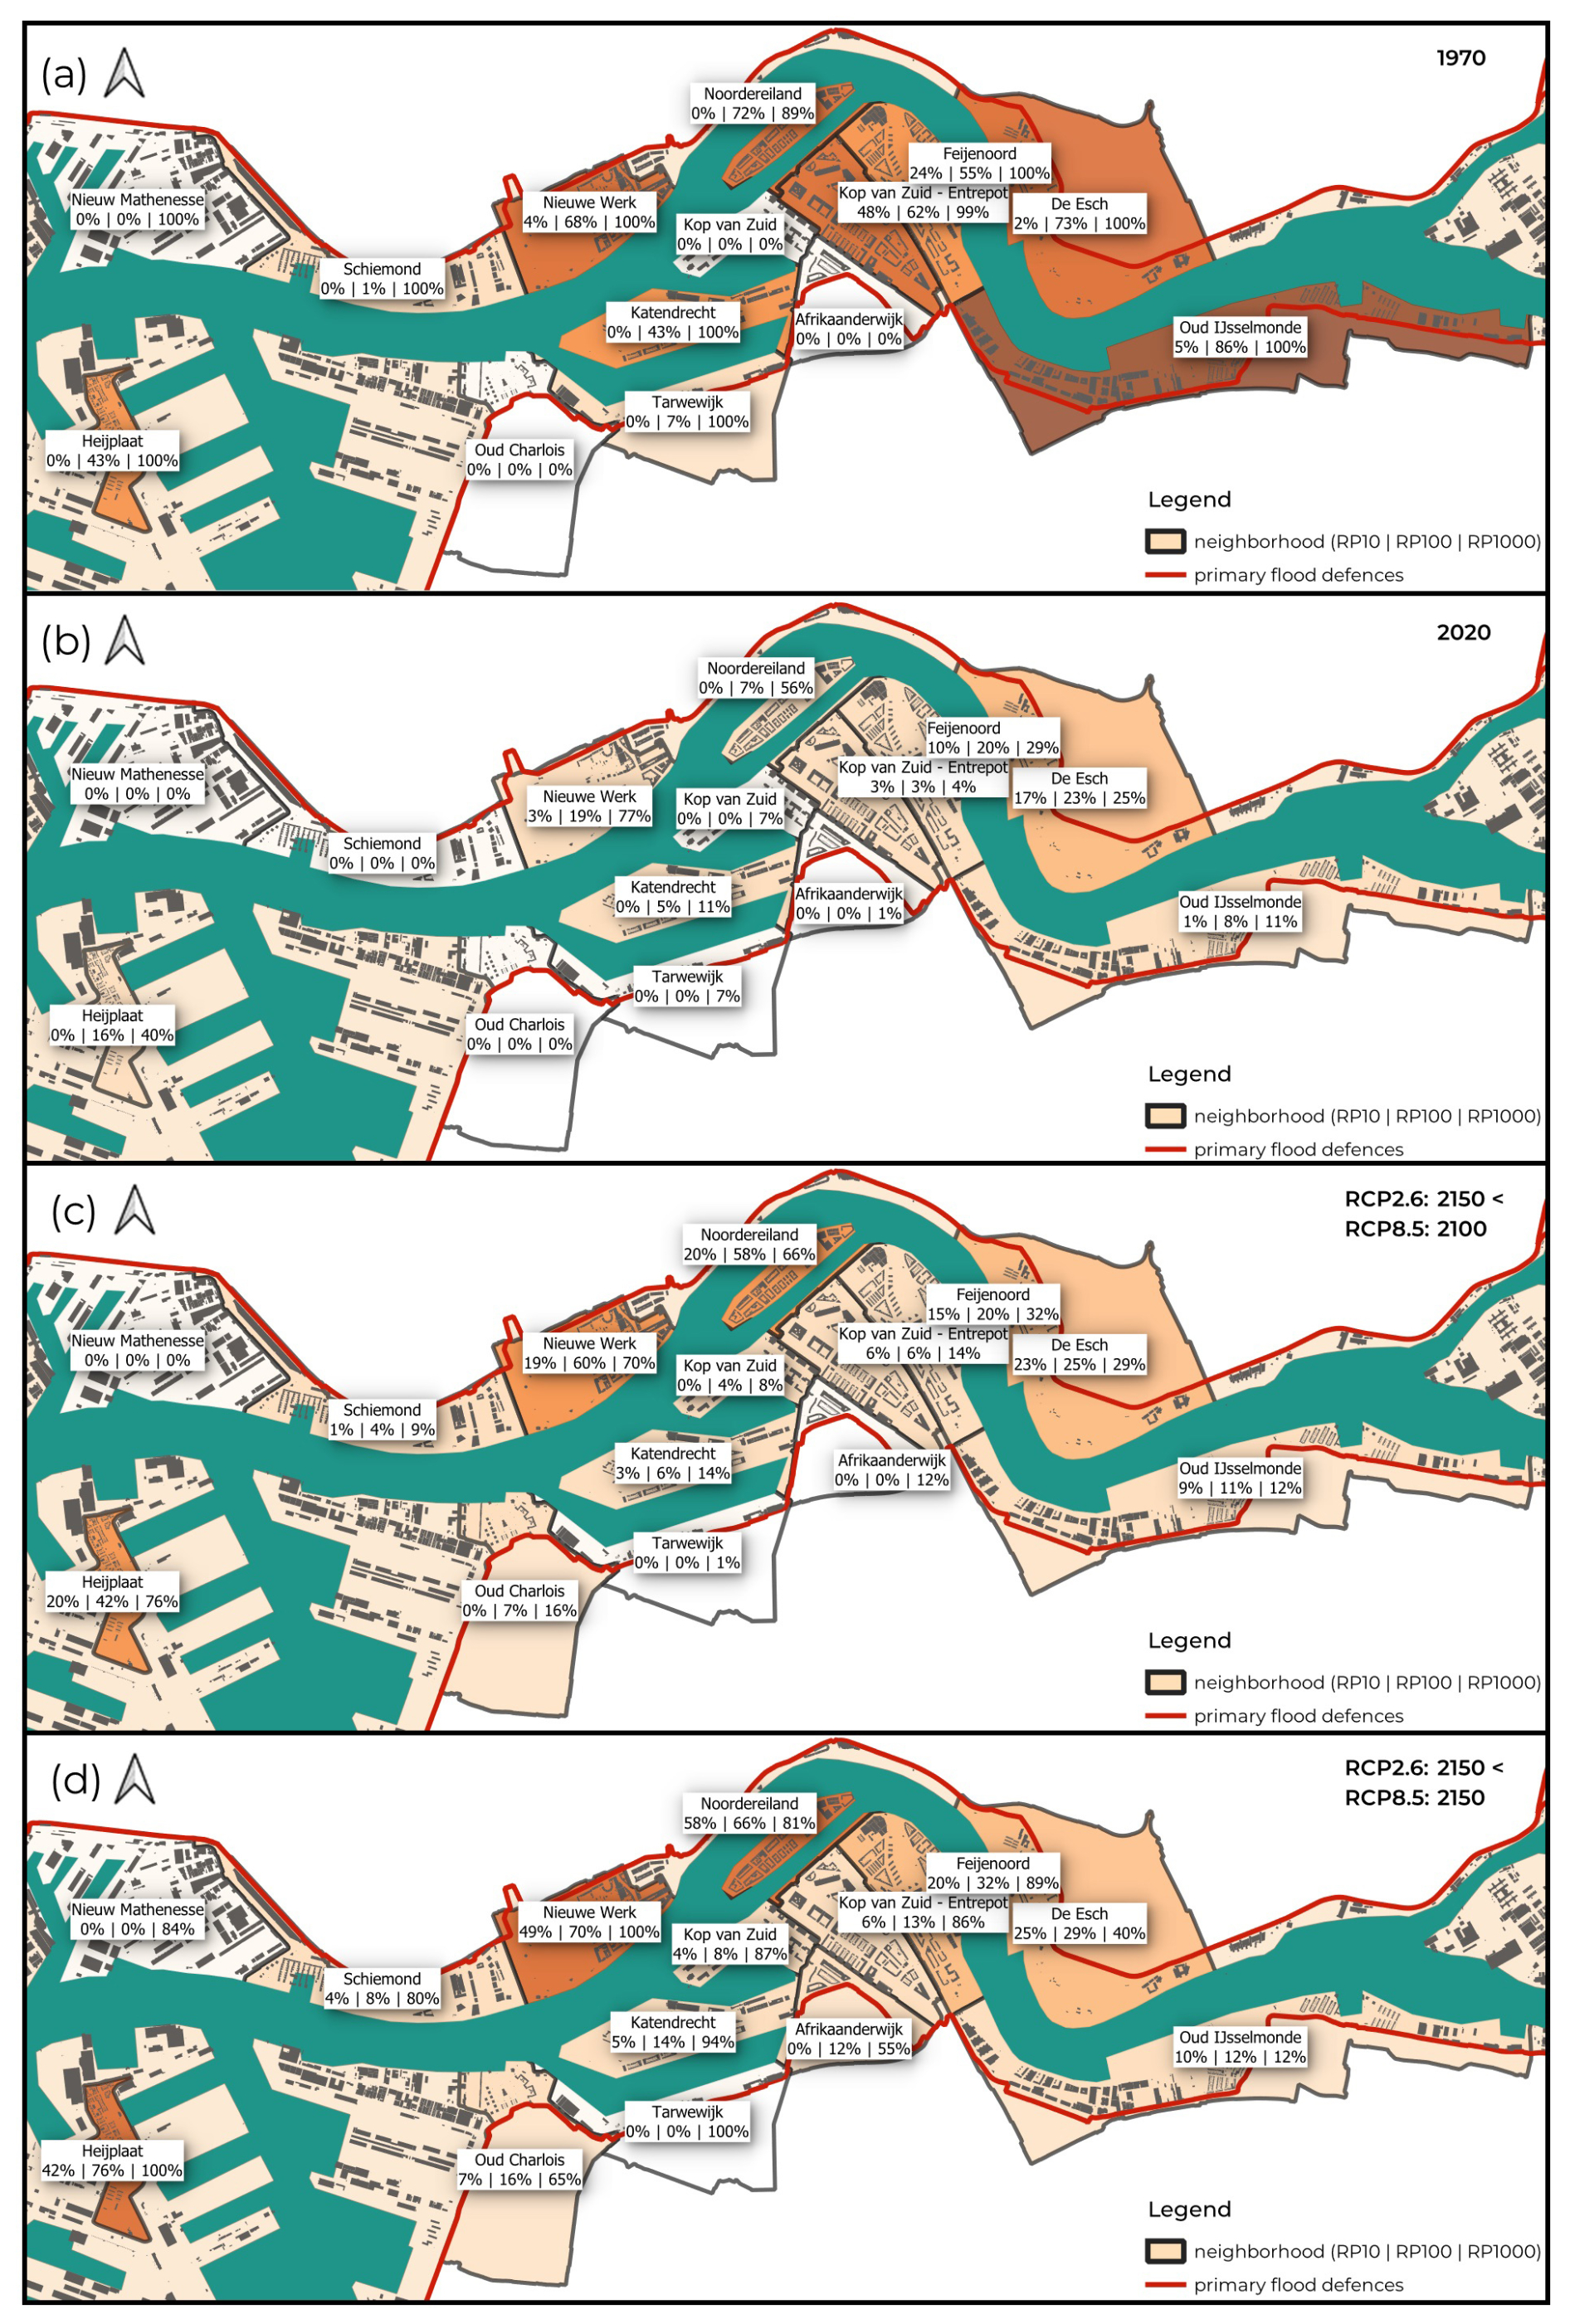
Figure 5Neighbourhood-level residential flood exposure (percentage of units exposed) for selected return periods and years. Exposure is shown for 10-, 100-, and 1000-year events in (a) 1970, (b) 2020, (c) 2100 (RCP8.5), and (d) 2150 (RCP8.5).
3.4 Disentangling urban development, sea level rise, and adaptation
Flood exposure in Rotterdam's unembanked areas is influenced by an interplay of ongoing urban development, rising sea levels, and adaptation measures. To understand their relative contributions, we systematically assessed the individual impact of each factor on residential flood exposure (Fig. 6).
First, to assess the sensitivity of future exposure to urban development, we compared scenarios with and without continued development after 2020 (assuming new builds adhere to the NAP +3.6 m design flood elevation). The impact of adding the planned 22 600 housing units is primarily evident for low-probability, high-impact events. Specifically, differences in exposure become significant only when extreme water levels surpass approximately NAP +3.85 m (the NAP +3.6 m design elevation plus the 0.25 m inundation threshold), a condition met during 1000-year flood events projected for the early 22nd century (Fig. 3a). Hence, no urban development after 2020 would mainly prevent the exposure of these new units during such extreme future events. For lower return periods like 100-year events, the addition of new housing units (built at or above NAP +3.6 m) has a minimal impact on overall exposure numbers until very late in the projection period under the RCP8.5 scenario. Interestingly, we observed some exposure differences between 2020 and 2100 across all return periods. This is an artefact of our methodology: the ∼3600 housing units constructed between 2020 and 2023 were assigned their actual ground elevations, with about 55 % of these units being below the design flood elevation level of NAP +3.6 m. In the scenario where urban development stops in 2020, these units are not added, whereas in the reference scenario they are.
Second, the impact of sea level rise after 2020 on flood exposure is also assessed by comparing exposure with and without sea level rise projections after 2020 (Fig. 5). Until 2100 (RCP8.5), exposure rates increase marginally and consistently. After 2100 (RCP8.5), exposure rates, particularly for 100-year events, rise more sharply. This occurs as rising water levels begin to exceed the ground elevations of a large portion of the existing building stock, many of which are clustered around similar elevations, including those built to the current design flood standard (Fig. 3b). Overall, the impact of sea level rise after 2020 is larger than the impact of planned urban development. Without post-2020 sea level rise, projected exposure rates in 2150 (RCP8.5) would be 6 times lower for 10-year flood events, 4 times lower for 100-year flood events, and 7 times lower for 1000 years compared to the reference scenario.
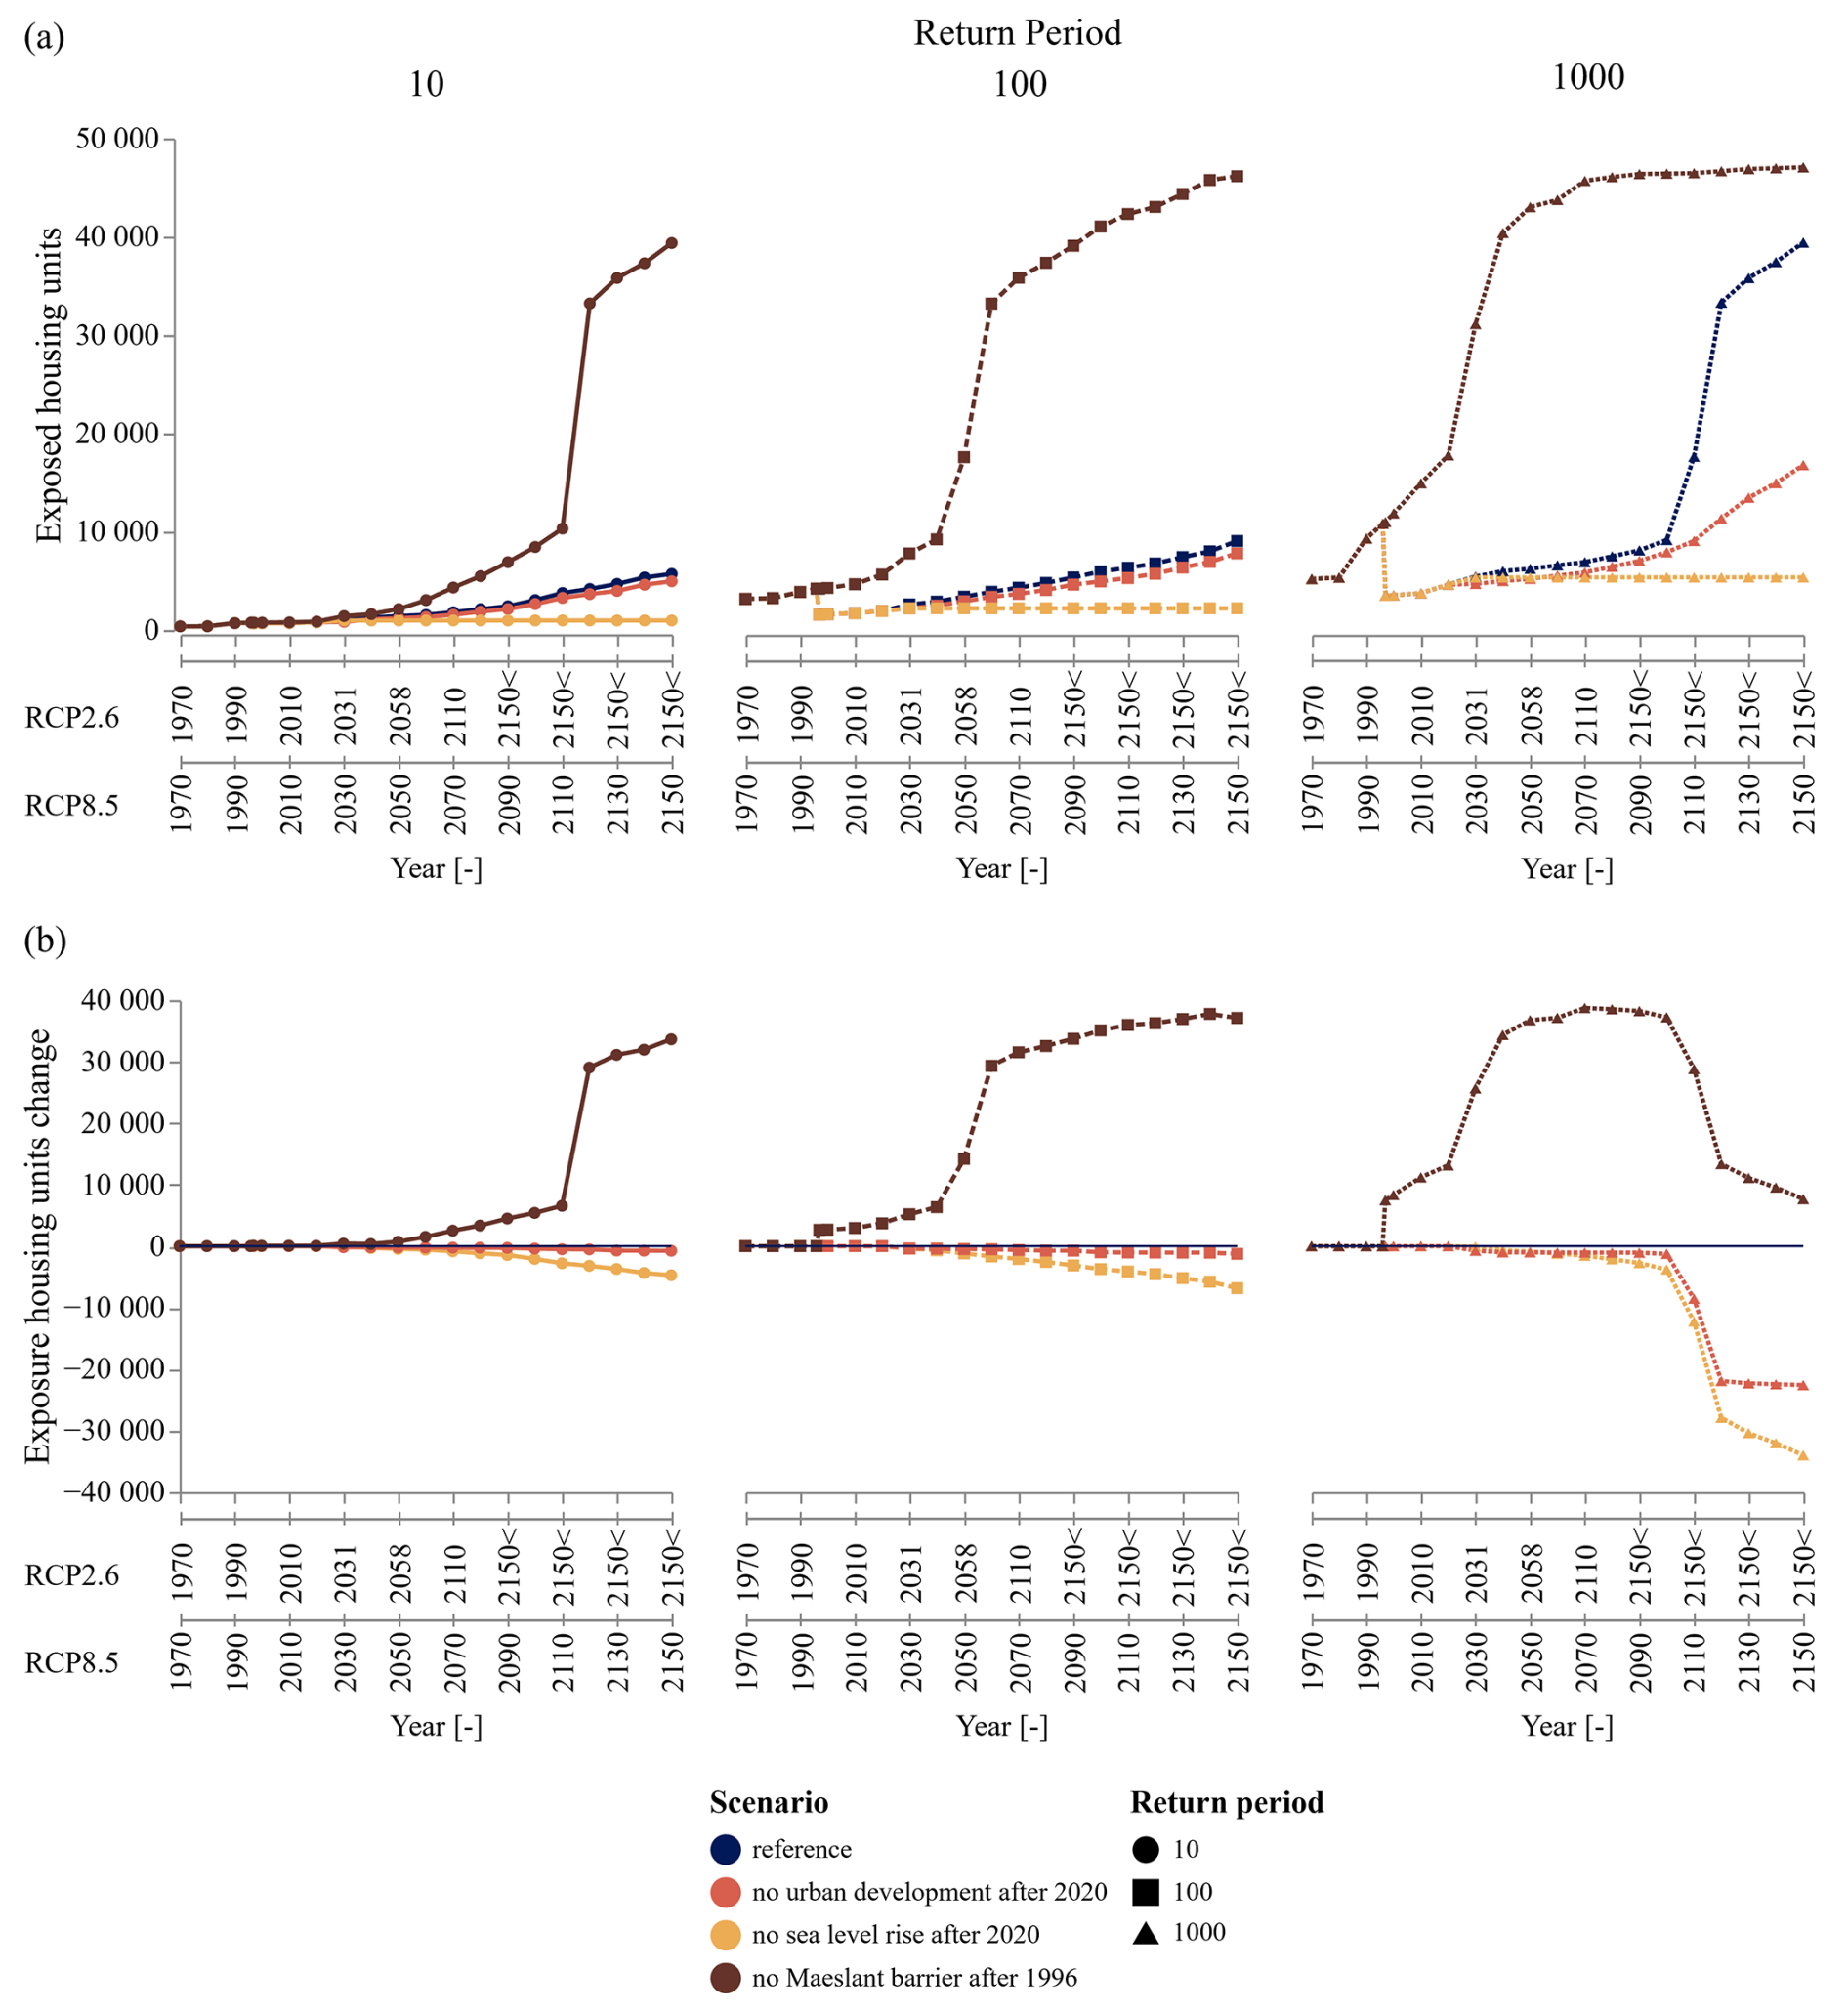
Figure 6Impact of urban development, sea level rise, and the Maeslant barrier on residential flood exposure. (a) Absolute number of exposed housing units (1970–2150) for the reference scenario and scenarios isolating the effects of no further urban development (post-2020), no further sea level rise (post-2020), and no Maeslant barrier. (b) Difference in exposed units for each attribution scenario compared to the reference. The dual x axis maps results to RCP2.6 and RCP8.5 emission scenarios.
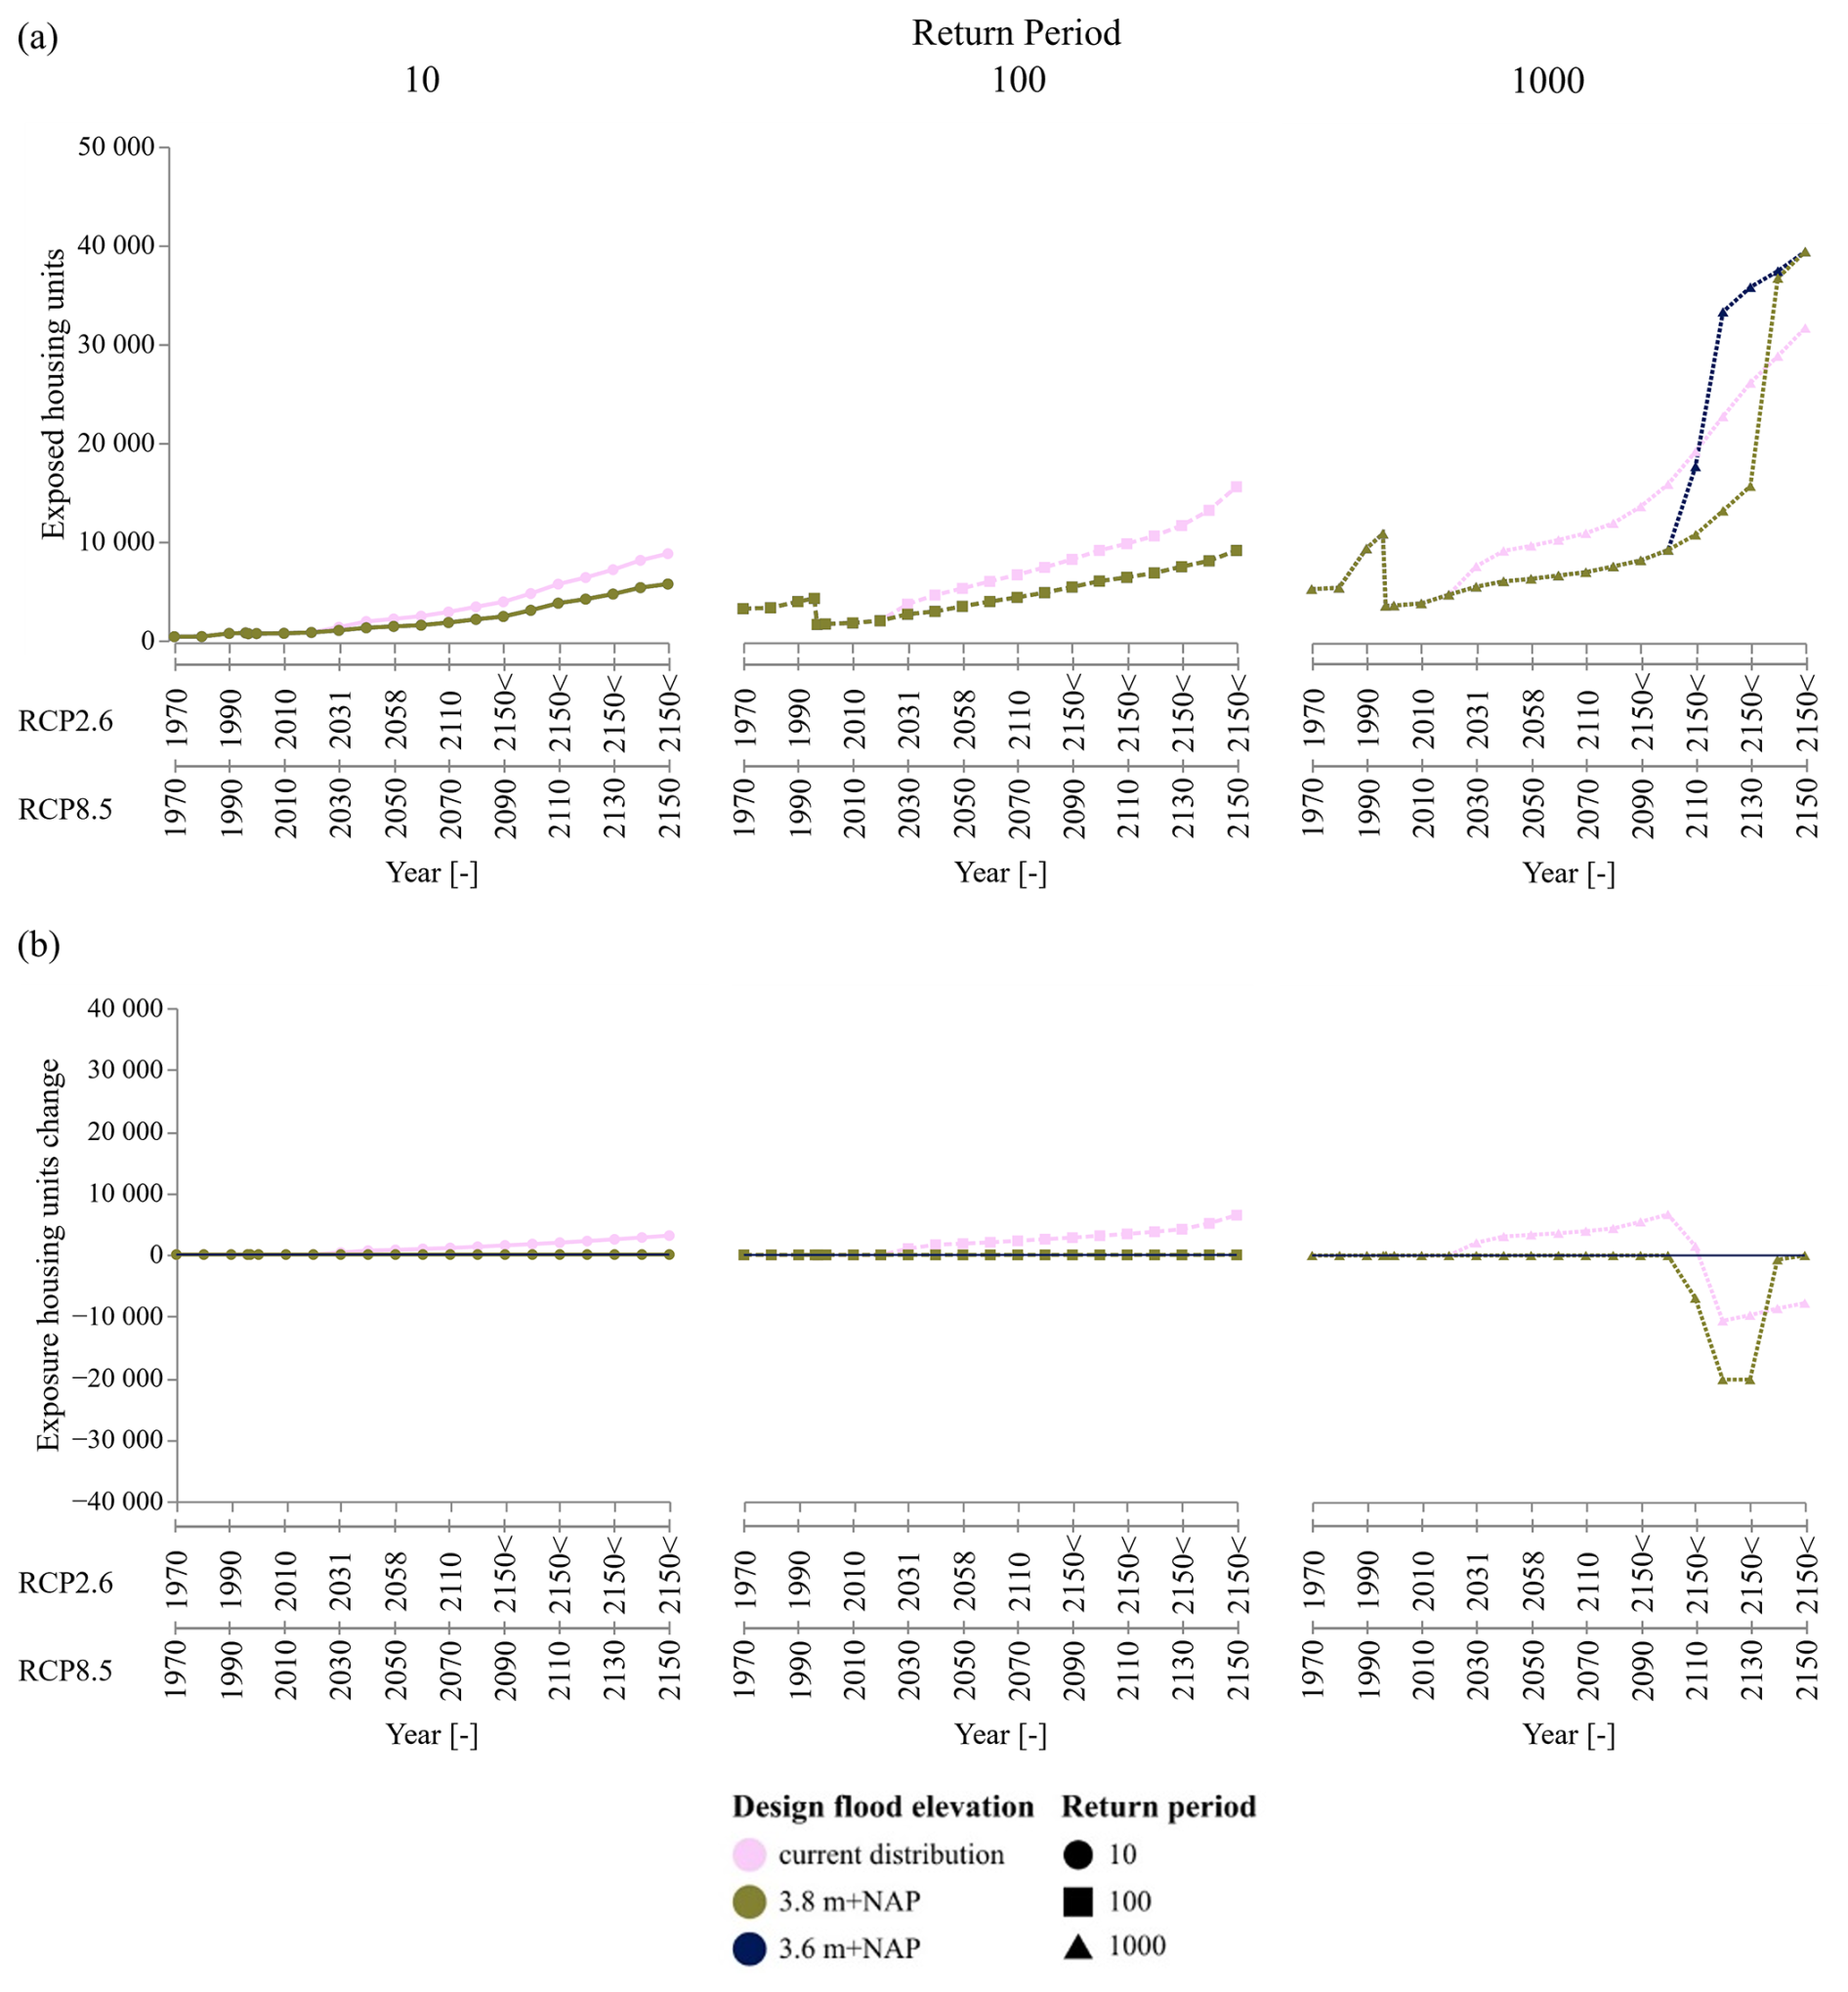
Figure 7Influence of design flood elevation on the number of exposed houses. The top three figures show the absolute number of exposed houses when the current elevation distribution per neighbourhood is applied for new housing units. Design flood elevation NAP +3.8 m gives the situation when building lots are raised to NAP +3.8 m. The lower three figures are relative to the reference.
Third, the Maeslant storm surge barrier plays a crucial role in mitigating flood exposure in Rotterdam. Without this barrier, water levels in Rotterdam would directly reflect sea level changes, leading to significantly higher flood exposure. Our analysis reveals that the Maeslant barrier has effectively reduced flood exposure, with its impact most pronounced for 1000-year events (Fig. 6). By 2150, under the RCP8.5 scenario, the absence of the Maeslant barrier would result in substantially higher exposure rates: 7 times higher for 10-year events, 5 times higher for 100-year events, and 1.2 times higher for 1000-year events. Even under the low-emission (RCP2.6) scenario, the barrier's absence would lead to exposure rates that are 3, 7, and 6 times higher for 10-year, 100-year, and 1000-year events, respectively, by 2150. The Maeslant barrier's effectiveness in reducing exposure rates outweighs the combined increases caused by urban development and sea level rise. However, while the Maeslant barrier significantly postpones the onset of increased flood exposure due to climate change, it does not offer indefinite protection. This limitation is evident in the projected increase in exposure for 1000-year events, demonstrating that the barrier, in its current configuration, cannot entirely counteract the long-term flood exposure increase driven by sea level rise.
3.5 Impact of design flood elevation on flood exposure
Elevating new housing units is a primary local adaptation strategy to reduce their direct exposure to future flood hazards. This section analyses the impact of different design flood elevation policies on overall exposure rates specifically for new residential constructions post-2020 (Fig. 7). We compare the reference scenario, where new units are built to the current design flood elevation of NAP +3.6 m, with two alternative approaches: first, a scenario without a design flood elevation, where new units are assigned elevations based on the existing varied ground-level distribution within their respective neighbourhoods, and second, a scenario with an increased design flood elevation requirement of NAP +3.8 m for all new units.
The absence of a design flood elevation requirement generally leads to higher exposure rates for these new housing units compared to the reference scenario (Fig. 7). Projections for the year 2150 under the RCP8.5 scenario illustrate this trend. If new buildings were built without a design flood elevation, the exposure rates would be 54 % higher for 10-year events and 71 % higher for 100-year events than if they were all built to the NAP +3.6 m standard. Interestingly, 1000-year events present a contrasting picture, with an anticipated 24 % reduction in exposure rate. This counterintuitive result occurs because, by sampling from existing neighbourhood elevation distributions (Fig. 3b), some newly built houses are assigned ground elevations that exceed the uniform NAP +3.6 m standard, especially in currently higher-lying areas, thus providing protection against the most extreme water levels.
Raising the design flood elevation to NAP +3.8 m yields modest reductions in exposure rates compared to the current NAP +3.6 m standard. For 10-year and 100-year events, this 0.2 m elevation increase has a limited impact on exposure rates, as water levels typically remain below both elevation thresholds. The benefits become apparent for 1000-year events, where the higher design flood elevation results in reduced exposure rates, particularly after 2100 under the RCP8.5 scenario. At these extreme water levels, the higher design elevation effectively postpones the onset of exposure for these new units by approximately 30 years compared to the NAP +3.6 m standard, thereby providing a longer window for implementing further adaptation measures. While the impact on exposure rates may seem modest, the elevated design flood elevation of NAP +3.8 m offers other benefits. It decreases inundation depths during flood events, which directly translates to lower property damage and recovery costs, although these are not quantified in this study.
4.1 Interpretation and implications of key findings
The projected increase in flood exposure when no additional adaptation measures are taken, particularly under the RCP8.5 scenario, underscores the challenge for Rotterdam's unembanked areas. This trend is consistent with former regional assessments in this area (de Moel et al., 2014; Veerbeek et al., 2010), but our detailed, long-term analysis provides a more granular understanding of how different-return-period events will impact specific residential neighbourhoods over time. This insight is crucial for developing targeted adaptation strategies for unembanked areas.
The Maeslant barrier's past and current role in mitigating flood exposure is undeniable. Its construction led to an immediate reduction in the number of exposed housing units, particularly for 100- and 1000-year events. By 2150, under RCP8.5, the 1000-year flood levels approach pre-barrier conditions, indicating that reliance on the barrier in its current operational mode – or a similar storm surge barrier – is not a permanent solution. This poses a long-term strategic challenge for Rotterdam. Future decisions regarding raising its closure threshold to maintain port accessibility and reduce closure frequency (Mooyaart et al., 2022) would directly trade off against increased exposure in unembanked areas, particularly for more frequent events, a dilemma this framework can help quantify by assessing the impact of such closure threshold changes.
The spatial heterogeneity in exposure across Rotterdam's 14 unembanked neighbourhoods, driven by varied ground elevation profiles and urban development patterns, means a “one-size-fits-all” adaptation approach will be suboptimal. Neighbourhoods such as Nieuwe Werk and Heijplaat, with lower median elevations, are projected to face disproportionately high exposure rates. This speaks for adaptation planning that considers both the physical characteristics (elevation, building density) and potentially the socio-economic profiles of neighbourhoods to ensure equitable and effective flood protection. This aligns with broader calls for integrating social vulnerability into flood risk management (Koks et al., 2014).
The current design flood elevation policy – NAP +3.6 m for new building lots – proves effective in reducing the future exposure of new developments compared to a scenario with no specific elevation requirements, especially for 10- and 100-year flood events. Raising this design flood elevation further (e.g. to NAP +3.8 m) offers incremental benefits, primarily by delaying the onset of exposure for these new units during very extreme events projected later in the century. However, the overall impact of these policies on reducing total city-wide exposure is tempered by the vast existing building stock situated at lower elevations. This suggests that, while important for future flood exposure, solely relying on increasing elevation standards for new builds may not be sufficient to manage long-term exposure for all unembanked areas, pointing to the need for a diversified adaptation portfolio. This underscores Rotterdam's exploration of a more integrated suite of adaptation measures, including both fixed and movable local flood defences, nature-based solutions, and building-specific flood-proofing (Ward et al., 2013).
4.2 Comparison with the existing literature
While comparisons with larger-scale European flood risk studies (e.g. Steinhausen et al., 2022; Paprotny et al., 2024) are limited by differences in spatial resolution (e.g. local building-level vs. NUTS3), our findings provide a local lens on broader trends in flood risk. These studies often indicate exposure growth as a dominant driver of risk change; our local analysis for Rotterdam refines this by showing that, while new urban development (post-2020) contributes to future exposure, it is the existing building stock combined with accelerating sea level rise that presents the more immediate and widespread challenge for the coming decades, particularly regarding 10- and 100-year flood events.
Previous studies focused specifically on Rotterdam's unembanked areas primarily estimated future expected annual damages, making direct quantitative comparisons with our exposure rates challenging (de Moel et al., 2014; Veerbeek et al., 2010). However, the general trend of increasing future flood impact aligns. De Moel et al. (2014) projected a doubling of expected annual damage by 2100 from a 2014 baseline of EUR 40 million. In contrast, Veerbeek et al. (2010) reported a significantly lower initial expected annual damage of EUR 0.16 million but predicted a more rapid increase, with expected annual damage doubling by 2050 and quadrupling by 2100. This large difference in baseline expected annual damage values between the two studies needs further investigation and may be attributed to varying methodologies, data sources, or scope of analysis. Our exposure projections for 2050, based on the KNMI'23 high-emission scenario, align with the flood exposure results of Veerbeek et al. (2010), differing by less than 5 %. Our 2100 projections are approximately 20 % lower than those of Veerbeek et al. (2010), primarily due to the different sea level rise scenarios used. Our study uses the KNMI'23 high-emission scenario with an expected sea level rise of 0.87 m, while Veerbeek et al. (2010) adopted the Veerman scenario with 1.3 m sea level rise. Our study complements these studies focused on expected annual damage by providing a historical perspective (1970–2020); an explicit attribution of exposure changes to key drivers; and a granular analysis of residential exposure, which can inform the extent of potential impact prior to flood damage assessment.
4.3 Limitations and uncertainties
Our approach combines various models and data sources, introducing inherent uncertainties that must be considered when interpreting results. A primary constraint arises from the temporal disparity in data projections: future urban development data extend only to 2040, while climate scenarios project to 2150. This restricts our ability to fully assess long-term exposure in unembanked areas and attribute changes specifically to urban development beyond 2040, as our post-2040 exposure figures predominantly reflect sea level rise impacts on the 2040 building stock.
Another limitation concerns the elevation data used for both existing and future urban development. For existing buildings, ground-level elevations from the AHN3 dataset were used, which may not precisely reflect the floor level of individual housing units, especially within multi-storey apartment complexes. For future urban development, our study assumes that the elevation of newly built housing units complies with the specified design flood elevation in each scenario. We uniformly assign this ground level elevation to new housing units, including those in high-rise structures. Consequently, our exposure assessment does not necessarily reflect direct exposure of individual housing units but rather indicates instances where the lower floor is exposed.
The third limitation of our study lies in its omission of explicit considerations for local flood-proofing measures, such as seawalls. To illustrate, quay walls in Feijenoord have elevations exceeding NAP +3.15 m, higher than some housing units' elevations, with the lowest at approximately NAP +2.5 m. As a result, our model may overestimate exposure in areas where such protective structures exist, as extreme water levels exceeding housing unit elevations in Feijenoord may not lead to actual exposure in reality. Other areas that have a similar bath tub shape are Heijplaat, de Esch, parts of Katendrecht, and the southern part of the Waalhaven. To partially address flood-proofing measures, our approach uses a uniform 0.25 m threshold, representing elevated entrances and door guards. This simplification could be refined in future studies by incorporating neighbourhood- or building-specific thresholds that more accurately reflect real-world conditions. While using 2D inundation modelling would offer a more explicit representation of hydrological connectivity within neighbourhoods, this approach involves a trade-off. The considerable increase in model complexity and computational effort, alongside the inherent uncertainties in reconstructing historical and projecting future digital terrain models (DTMs) and fine-scale infrastructure, made such detailed modelling impractical for the broad temporal scope of this research.
The probabilistic calculations for flood hazard are based on the WBI hydraulic-computation database, the standard for hydraulic and dike assessments in the Netherlands. A limitation here is that sea level rise is only factored into the probabilistic calculations performed by Hyra-NL, but not into the underlying 2D WAQUA computations. This means that the mean tide level remains static in the hydrodynamic simulations, which leads to an underestimation of extreme water levels, particularly for lower-return-period events in the far future, for high-sea-level-rise scenarios. Furthermore, this approach does not account for the hydrodynamic effects of past and future infrastructural changes within the estuary, such as the construction of the second Maasvlakte, alterations to the dimensions of the Nieuwe Waterweg canal over time, or potential future adjustments to the Maeslant barrier's operational strategy. The last few decades have demonstrated the profound impact such interventions have on estuarine hydrodynamics. Ideally, new databases with hydrodynamic computations including sea level rise would be derived. This need becomes particularly apparent for scenarios where sea level rise exceeds 1 m, as the combined effects of rising seas, altered coastal infrastructure, and ongoing morphological changes could reshape flood exposure patterns in ways our current framework does not fully capture.
4.4 Recommendations and outlook
As direction for further research we propose expanding the framework by integrating both physical and (social) vulnerability assessments in our flood risk analysis. Incorporating these factors would allow for a more comprehensive evaluation of flood risk beyond exposure alone and inform the design of more effective and equitable long-term adaptation strategies. This is particularly relevant for Rotterdam's unembanked areas, where about 20 % of the population is classified as highly socially vulnerable, compared to only 6 % in embanked areas (Koks et al., 2014). It is important to note that urban development in these unembanked areas is not solely a risk factor but also presents significant opportunities for urban improvement and development. For example, the Kop van Feijenoord project aims to create thousands of new homes while simultaneously improving flood defences and public spaces. Such developments can serve as a catalyst for strengthening neighbourhoods and improving connectivity between Rotterdam's northern and southern districts.
Also, integrating damage modelling is proposed to estimate expected annual damage in the present and future. Given the heterogeneity in housing units, ranging from low-lying historic structures to modern high-rise buildings, advanced damage curves, such as those developed for Venice with the framework of Schlumberger et al. (2022), could provide more accurate risk assessments. When considering planning horizons exceeding 50 years, projecting changes in asset value is key. Flood risk in Europe is expected to double by 2050 solely due to the increasing value of exposed assets (Steinhausen et al., 2022). At the same time, increasing exposure or flood event frequency can heighten flood risk salience, potentially leading to a revaluation of properties located in unembanked areas (Caloia et al., 2023; Jansen, 2023).
The unembanked areas of Rotterdam are at the forefront of the global flood adaptation challenge faced by many delta cities. With a significant and growing residential population – probably exceeding 100 000 residents in the wider unembanked region post-2040 – coupled with their importance for industry, port operations, and valuable ecosystems, the stakes for successful adaptation are high. For the national long-term strategy, the first dilemma that may emerge is whether to permanently close the estuaries or to keep them open to facilitate river discharge by gravity. Hence, there is no doubt that Rotterdam's unembanked areas are pivotal in formulating the long-term adaptation strategy of the Netherlands and vice versa.
This study developed and applied a framework to evaluate the combined and individual impacts of urban development, sea level rise, and specific adaptation measures on residential flood exposure in Rotterdam's unembanked areas from 1970 to 2150. By integrating detailed local urban development data with probabilistic flood hazard modelling under various climate scenarios, the research provides insights for long-term urban planning and flood risk management.
Our study reveals several findings.
-
Without additional adaptation, the unembanked areas in Rotterdam are expected to experience increases in flood exposure, especially in the 22nd century under the high-emission scenario of the KNMI'23 (RCP8.5). Under this scenario, we project a 7-fold increase in exposure for 10-year events, a 6-fold increase for 10-year events by 2150, and an 8-fold increase for 1000-year events compared to 2020 levels. The RCP2.6 scenario projects less severe increases: a 3-fold increase for 10-year and 100-year events and a 2-fold increase for 1000-year events by 2150.
-
The Maeslant storm surge barrier has been effective in mitigating flood risk. Its implementation has approximately halved exposure rates for 100- and 1000-year events compared to 1996 levels. Without this storm surge barrier, exposure rates would increase drastically, mirroring increases in local water levels due to sea level rise.
-
Spatially, flood exposure varies considerably across Rotterdam's unembanked neighbourhoods. The three areas with the highest relative exposure – Nieuwe Werk, Heijplaat, and Noordereiland – face future exposure rates exceeding 65 % for 100-year events by 2150 under RCP8.5, while the aggregated exposure percentage for all unembanked areas is 19 %. Attribution analysis shows that the Maeslant barrier's implementation had the largest historical impact on decreasing exposure. For the future, sea level rise is the primary driver of increasing exposure, while planned urban development under current design flood elevation policies contributes less to the overall increase.
-
Implementing a design flood elevation policy of NAP +3.6 m for new constructions significantly reduces their future exposure compared to no policy. Increasing this standard to NAP +3.8 m offers incremental benefits, mainly by delaying exposure to very extreme, late-century events.
These findings underscore the dynamic nature of flood exposure in urbanized deltas. Effective future management requires integrated strategies that consider the evolving hazard; the vulnerability of existing building stock; planned urban growth; and a combination of system-scale and localized, neighbourhood-specific adaptation measures.
The Python notebook used for the analysis and visualizations can be retrieved from https://doi.org/10.4121/d1291401-708a-4d48-9d95-8259cfd987d2 (Oerlemans, 2024). Flood hazard data, such as extreme water levels for return periods and locations used in this study, are included as well. Urban development plans on a project level are not included but can be obtained upon request from the Municipality of Rotterdam.
Conceptualization: CO, MvdB, TR, and MK; data curation: CO; formal analysis: CO and MvdB; methodology: CO; flood hazard modelling: CO; exposure modelling: CO; writing – original draft: CO; writing – review and editing: MvdB, TR, and MK; supervision: MvdB and MK; funding acquisition: MvdB and MK. All authors have read and agreed to the published version of the manuscript.
The contact author has declared that none of the authors has any competing interests.
Publisher's note: Copernicus Publications remains neutral with regard to jurisdictional claims made in the text, published maps, institutional affiliations, or any other geographical representation in this paper. While Copernicus Publications makes every effort to include appropriate place names, the final responsibility lies with the authors.
We thank the Municipality of Rotterdam, particularly Dook Ligthart, Vera Konings, and Liselotte Mesu, for providing valuable insights and their willingness to share urban development plans used in this study. We acknowledge the use of Claude 3.5 Sonnet (Anthropic, https://claude.ai/, last access: 15 September 2024) for proofreading the final draft. Finally, we thank the editor and two anonymous referees for their detailed and constructive reviews.
This publication is part of the project RED and BLUE, Real Estate Development and Building in Low Urban Environments, with project number NWA.1389.20.224 of the research programme Dutch Research Agenda (NWA), which is financed by the Dutch Research Council (NWO).
The paper was edited by Margreth Keiler and reviewed by two anonymous referees.
Aerts, J. C. J. H.: A review of cost estimates for flood adaptation, Water (Switzerland), 10, https://doi.org/10.3390/w10111646, 2018.
Aerts, J. C. J. H. and Botzen, W. J. W.: Climate change impacts on pricing long-term flood insurance: A comprehensive study for the Netherlands, Global Environ. Chang., 21, 1045–1060, https://doi.org/10.1016/j.gloenvcha.2011.04.005, 2011.
Agtersloot, R. and Paarlberg, A.: WAQUA productieberekeningen Rijn-Maasmonding, Wettelijk beoordelingsinstrumentarium 2017, https://iplo.nl/publish/pages/157051/1220082-001-hye-0012-v4-r-waquaproductieberekeningenbovenrivierenmaas.pdf (last access: 2 July 2024), 2016 (in Dutch).
Andreadis, K. M., Wing, O. E. J., Colven, E., Gleason, C. J., Bates, P. D., and Brown, C. M.: Urbanizing the floodplain: global changes of imperviousness in flood-prone areas, Environ. Res. Lett., 17, https://doi.org/10.1088/1748-9326/ac9197, 2022.
Brody, S. D., Sebastian, A., Blessing, R., and Bedient, P. B.: Case study results from southeast Houston, Texas: identifying the impacts of residential location on flood risk and loss, J. Flood Risk Manag., 11, S110–S120, https://doi.org/10.1111/jfr3.12184, 2018.
Calafat, F. M., Wahl, T., Tadesse, M. G., and Sparrow, S. N.: Trends in Europe storm surge extremes match the rate of sea-level rise, Nature, 603, 841–845, https://doi.org/10.1038/s41586-022-04426-5, 2022.
Caloia, F., van Ginkel, K., and Jansen, D.-J.: Floods and financial stability: Scenario-based evidence from below sea level, DNB Working Paper No. 796, https://doi.org/10.2139/ssrn.4672119, 2023.
Daamen, T. A. and Vries, I.: Governing the European port-city interface: Institutional impacts on spatial projects between city and port, J. Transp. Geogr., 27, 4–13, https://doi.org/10.1016/j.jtrangeo.2012.03.013, 2013.
De Bruijn, K. M., Diermanse, F. L. M., Weiler, O. M., De Jong, J. S., and Haasnoot, M.: Protecting the Rhine-Meuse delta against sea level rise: What to do with the river's discharge?, J. Flood Risk Manag., 15, 1–15, https://doi.org/10.1111/jfr3.12782, 2022.
de Moel, H., Van Vliet, M., and Aerts, J. C. J. H.: Evaluating the effect of flood damage-reducing measures: a case study of the unembanked area of Rotterdam, the Netherlands, 895–908, https://doi.org/10.1007/s10113-013-0420-z, 2014.
Deltaprogramma: Deltaprogramme 2023, Speed up, connect and reconstruct, https://english.deltaprogramma.nl/site/binaries/site-content/collections/documents/2022/09/20/delta-programme-2023-english---print-version/8397+Interactieve+DP+2023_DEF+ENG.pdf (last access: 14 May 2024), 2023.
Deltares: Zeespiegelmonitor 2022, https://publications.deltares.nl/11209266_000.pdf (last access: 17 May 2024), 2023.
Duijn, M. and van Buuren, A.: The absence of institutional entrepreneurship in climate adaptation policy – in search of local adaptation strategies for Rotterdam's unembanked areas, Policy Soc., 36, 575–594, https://doi.org/10.1080/14494035.2017.1369615, 2017.
Frantzeskaki, N., Wittmayer, J., and Loorbach, D.: The role of partnerships in “realising” urban sustainability in Rotterdam's City Ports Area, the Netherlands, J. Clean. Prod., 65, 406–417, https://doi.org/10.1016/j.jclepro.2013.09.023, 2014.
Gemeente Rotterdam: De Veranderstad – Werken aan een wereldstad voor iedereen Omgevingsvisie Rotterdam, https://omgevingsweb.nl/wp-content/uploads/po-assets/614657.pdf (last access: 17 June 2024), 2021.
Gemeente Rotterdam: Nieuwbouwprojecten Rotterdam Bouwen aan Rotterdam: https://www.bouwenaanrotterdam.nl/bouwkaart#/ (last access: 4 April 2024), 2023.
Haasnoot, M., Kwadijk, J., Van Alphen, J., Le Bars, D., Van Den Hurk, B., Diermanse, F., Van Der Spek, A., Oude Essink, G., Delsman, J., and Mens, M.: Adaptation to uncertain sea-level rise; how uncertainty in Antarctic mass-loss impacts the coastal adaptation strategy of the Netherlands, Environ. Res. Lett., 15, https://doi.org/10.1088/1748-9326/ab666c, 2020.
Hallegatte, S., Ranger, N., Mestre, O., Dumas, P., Corfee-Morlot, J., Herweijer, C., and Wood, R. M.: Assessing climate change impacts, sea level rise and storm surge risk in port cities: A case study on Copenhagen, Clim. Change, 104, 113–137, https://doi.org/10.1007/s10584-010-9978-3, 2011.
Huijbregts, Z., Van Schijndel, J. W., Schellen, H. L., and Blades, N.: Hygrothermal modelling of flooding events within historic buildings, J. Build. Phys., 38, 170–187, https://doi.org/10.1177/1744259114532613, 2014.
Jansen, D. J.: Homeowners and Flood Risk: A Disconnect between Awareness and Actions?, DNB Working Paper No. 791, https://doi.org/10.2139/ssrn.4612538, 2023.
Jongman, B., Hochrainer-Stigler, S., Feyen, L., Aerts, J. C. J. H., Mechler, R., Botzen, W. J. W., Bouwer, L. M., Pflug, G., Rojas, R., and Ward, P. J.: Increasing stress on disaster-risk finance due to large floods, Nat. Clim. Chang., 4, 264–268, https://doi.org/10.1038/nclimate2124, 2014.
Kadaster: Description BAG Geopackage, https://www.kadaster.nl/documents/1953498/2762071/Beschrijving+BAG+GeoPackage_1.1.pdf/60f9c6a5-1f46-e427-e02e-dc246b8183be?t=1719325522143 (last access: 10 March 2024), 2022.
Kaufmann, M., Priest, S. J., and Leroy, P.: The undebated issue of justice: silent discourses in Dutch flood risk management, Reg. Environ. Chang., 18, 325–337, https://doi.org/10.1007/s10113-016-1086-0, 2018.
Koks, E. E., Jongman, B., Husby, T. G., and Botzen, W. J. W.: Combining hazard, exposure and social vulnerability to provide lessons for flood risk management, Environ. Sci. Policy, 47, 42–52, https://doi.org/10.1016/j.envsci.2014.10.013, 2014.
Magnan, A. K., Oppenheimer, M., Garschagen, M., Buchanan, M. K., Duvat, V. K. E., Forbes, D. L., Ford, J. D., Lambert, E., Petzold, J., Renaud, F. G., Sebesvari, Z., van de Wal, R. S. W., Hinkel, J., and Pörtner, H. O.: Sea level rise risks and societal adaptation benefits in low-lying coastal areas, Sci. Rep.-UK, 12, 1–22, https://doi.org/10.1038/s41598-022-14303-w, 2022.
Ministerie van Infrastructuur en Milieu: Regeling veiligheid primaire waterkeringen 2017, https://wetten.overheid.nl/BWBR0039040/2017-01-01 (last access: 12 June 2024), 2016.
Mooyaart, L. F., Bakker, A. M. R., van den Bogaard, J. A., and Jonkman, S. N.: Economic Optimization of Coastal Flood Defence Systems including Storm Surge Barrier Closure Reliability, J. Flood Risk Manag., 1–19, https://doi.org/10.1111/jfr3.12904, 2022.
Oerlemans, C: Scripts and data of: “Flood exposure in Rotterdam's unembanked areas from 1970 to 2150: sensitivities to urban development, sea level rise and adaptation”, 4TU.ResearchData [data set], https://doi.org/10.4121/d1291401-708a-4d48-9d95-8259cfd987d2, 2024.
Oppenheimer, M., Glavovic, B., Hinkel, J., van de Wal, R., Magnan, A. K., Abd-Elgawad, A., Cai, R., Cifuentes-Jara, M., DeConto, R. M., Ghosh, T., Hay, J., Isla, F., Marzeion, B., Meyssignac, B., and Sebesvari, Z.: Sea Level Rise and Implications for Low Lying Islands, Coasts and Communities, https://doi.org/10.1017/9781009157964.006, 2019.
Paprotny, D., Sebastian, A., Morales-Nápoles, O., and Jonkman, S. N.: Trends in flood losses in Europe over the past 150 years, Nat. Commun., https://doi.org/10.1038/s41467-018-04253-1, 2018.
Paprotny, D., Tilloy, A., Treu, S., Buch, A., Vousdoukas, M. I., Feyen, L., Kreibich, H., Merz, B., Frieler, K., and Mengel, M.: Attribution of flood impacts shows strong benefits of adaptation in Europe since 1950, Research Square [preprint], 1–22, https://doi.org/10.21203/rs.3.rs-5430941/v1, 2024.
Restemeyer, B., Woltjer, J., and van den Brink, M.: A strategy-based framework for assessing the flood resilience of cities – A Hamburg case study, Planning Theory and Practice, 16, 45–62, https://doi.org/10.1080/14649357.2014.1000950, 2015.
Rotterdams Weerwoord: Denken buiten kade(r)s; Atlas buitendijks Rotterdam, https://rotterdamsweerwoord.nl/content/uploads/2023/08/Atlas-Buitendijks-Rotterdam.pdf (last access: 2 September 2024), 2022.
Schlögl, M., Fuchs, S., Scheidl, C., and Heiser, M.: Trends in torrential flooding in the Austrian Alps: A combination of climate change, exposure dynamics, and mitigation measures, Climate Risk Management, 32, https://doi.org/10.1016/j.crm.2021.100294, 2021.
Schlumberger, J., Ferrarin, C., Jonkman, S. N., Diaz Loaiza, M. A., Antonini, A., and Fatorić, S.: Developing a framework for the assessment of current and future flood risk in Venice, Italy, Nat. Hazards Earth Syst. Sci., 22, 2381–2400, https://doi.org/10.5194/nhess-22-2381-2022, 2022.
Song, J., Fu, X., Gu, Y., Deng, Y., and Peng, Z.-R.: An examination of land use impacts of flooding induced by sea level rise, Nat. Hazards Earth Syst. Sci., 17, 315–334, https://doi.org/10.5194/nhess-17-315-2017, 2017.
Steinhausen, M., Paprotny, D., Dottori, F., Sairam, N., Mentaschi, L., Alfieri, L., Lüdtke, S., Kreibich, H., and Schröter, K.: Drivers of future fluvial flood risk change for residential buildings in Europe, Glob. Environ. Chang., 76, https://doi.org/10.1016/j.gloenvcha.2022.102559, 2022.
van Alphen, J., Haasnoot, M., and Diermanse, F.: Uncertain Accelerated Sea-Level Rise, Potential Consequences, and Adaptive Strategies in The Netherlands, Water, 14, https://doi.org/10.3390/w14101527, 2022.
van Dorland, R., Beersma, J., Bessembinder, J., Bloemendaal, N., van den Brink, H., Brotons Blanes, M., Drijfhout, S., Groenland, R., Haarsma, R., Homan, C., Keizer, I., Krikken, F., Le Bars, D., Lenderink, G., van Meijgaard, E., Meirink, J. F., Overbeek, B., Reerink, T., Selten, F., Severijns, C., Siegmund, P., Sterl, A., de Valk, C., van Velthoven, P., de Vries, H., van Weele, M., Witchers Schreur, B., and van der Wiel, K.: KNMI National Climate Scenarios 2023 for the Netherlands, https://cdn.knmi.nl/system/data_center_publications/files/000/071/902/original/KNMI23_climate_scenarios_scientific_report_WR23-02.pdf (last access: 19 June 2024), 2023.
Veerbeek, W., Zevenbergen, C., and Gersonius, B.: Flood risk in unembanked areas Part C Vulnerability assessment based on direct flood damages, https://edepot.wur.nl/326010 (last access: 15 May 2024), 2010.
Wagenaar, D., Lüdtke, S., Schröter, K., Bouwer, L. M., and Kreibich, H.: Regional and Temporal Transferability of Multivariable Flood Damage Models, Water Resour. Res., 54, 3688–3703, https://doi.org/10.1029/2017WR022233, 2018.
Ward, P. J., Pauw, W. P., van Buuren, M. W., and Marfai, M. A.: Governance of flood risk management in a time of climate change: The cases of Jakarta and Rotterdam, Environ. Polit., 22, 518–536, https://doi.org/10.1080/09644016.2012.683155, 2013.
Winsemius, H. C., Aerts, J. C. J. H., Van Beek, L. P. H., Bierkens, M. F. P., Bouwman, A., Jongman, B., Kwadijk, J. C. J., Ligtvoet, W., Lucas, P. L., Van Vuuren, D. P., and Ward, P. J.: Global drivers of future river flood risk, Nat. Clim. Change, 6, 381–385, https://doi.org/10.1038/nclimate2893, 2016.