the Creative Commons Attribution 4.0 License.
the Creative Commons Attribution 4.0 License.
 | 13 Oct 2025
Indirect assimilation of radar reflectivity data with an adaptive hydrometer retrieval scheme for severe short-term weather forecasts
Lixin Song
Feifei Shen
Zhixin He
Lu Yang
Dongmei Xu
Aiqing Shu
Jiajun Chen
Different hydrometeor retrieval schemes are explored based on the Weather Research and Forecasting (WRF) model in the indirect assimilation of radar reflectivity for two real cases occurred during June 2020 and August 2018. When retrieving hydrometeors from radar reflectivity, there are two commonly used hydrometeor classification methods: “temperature-based” and “background hydrometer-dependent” schemes. The hydrometeor proportions are usually empirically assigned in the “temperature-based” method within different background temperature intervals, whereas in the “background hydrometer-dependent” scheme, each type of hydrometeor is derived based on the portions estimated from the background field for different radar reflectivity ranges. In this study, a blending scheme is designed to combine “temperature-based” and “background hydrometer-dependent” methods adaptively to avoid errors caused by fixed relationships and reduce uncertainties introduced by the background field itself. Three experiments, EXP_temp, EXP_bg, and EXP_temp-bg are conducted using the “temperature-based” method, “background hydrometer-dependent” scheme, and blending scheme, respectively. It is found that adding the “background hydrometer-dependent” scheme facilitates the generation of accurate hydrometeor species which will enhance the effectiveness of radar data assimilation. In addition, due to the adaptive combination of “temperature-based” and “background hydrometer-dependent” schemes, the EXP_temp-bg experiment yields improved thermodynamic and dynamic structures, which contributes to predicting radar reflectivity and precipitation intensity more accurately.
- Article
(14558 KB) - Full-text XML
- BibTeX
- EndNote


The Initial conditions are a crucial factor in enhancing the accuracy of numerical weather prediction (NWP, Navon, 2009; Kain et al., 2010; Lopez, 2011; Xu et al., 2021; Huang et al., 2023). Compared to conventional observations, Doppler radar observations have extremely high temporal and spatial resolution, as well as containing precipitating hydrometeor information (Zhao et al., 2012; Li et al., 2013; Kong et al., 2020). Therefore, radar is one of the key platforms for obtaining proper initial conditions to successfully predict convective storms (Lilly, 1990; Dawson et al., 2015; Gustafsson et al., 2017; Shen et al., 2020a, 2025a; Xu et al., 2022; Chen et al., 2023). A number of efforts have been devoted to assimilating radar data into mesoscale numerical models (Lindskog et al., 2004; Dowell et al., 2011; Sun et al., 2014; Bick et al., 2016; Tong et al., 2020; Shen et al., 2016, 2019, 2022, 2025b; Wan et al., 2024).
Radar observations have two fundamental variables: radar radial velocity (Vr) and radar reflectivity (Z). Assimilating radar radial velocity is conducive to improving the dynamical structure of the initial field. Numerous scholars are dedicated to researching radar radial velocity assimilation (Gao et al., 2004; Simonin et al., 2014; Li et al., 2016; Shen et al., 2020b). Based on the three-dimensional variational (3DVar) system of the fifth-generation Pennsylvania State University-NCAR Mesoscale Model (MM5), Xiao et al. (2005) developed a radar radial velocity observation operator and investigated the impact of assimilating radar radial velocity on precipitation forecasts. In addition, Wang et al. (2013b) employed the four-dimensional variational (4DVar) system to assimilate radar radial velocity and reflectivity into a model for enhancing forecasting accuracy.
In contrast, assimilating radar reflectivity is more challenging than assimilating radial wind, on account of its highly nonlinear observation operator and close relationship with complex microphysics (Borderies et al., 2019; Xu et al., 2019). Currently, there are two main methods for assimilating radar reflectivity: direct assimilation and indirect assimilation. Xiao et al. (2007) proposed a direct assimilation scheme for radar reflectivity based on the 3DVar system of MM5. The water content was classified according to phases using warm rain microphysical processes. However, due to the absence of ice-phase particles, the scheme demonstrates limited effectiveness in deep moist convection cases that are dominated by cold cloud processes. To assimilate radar reflectivity into NWP models more effectively, Gao and Stensrud (2012) proposed a hydrometeor classification method based on the 3DVar system in the direct assimilation of radar reflectivity. The results demonstrated that this classification method beneficially accelerates the convergence speed of the analysis and reduces errors in the analysis. Compared to variational data assimilation methods, ensemble Kalman filter (EnKF; Evensen, 1994) is a better choice for assimilating radar reflectivity directly since EnKF does not require consideration of the tangent or adjoint model of the observation operator (Liu et al., 2019). Based on the EnKF method, Tong and Xue (2005) assimilated the simulated radar observations from a supercell storm. The results indicated that directly assimilating radar reflectivity data has a positive impact on both analyses and forecasts. Although the forward operator of reflectivity tends to be easily implemented in EnKF, its computational cost is too high to be widely applied in scientific research and operational forecasting (Kong et al., 2018).
To avoid the issue of high nonlinearity in radar reflectivity observation operators, the indirect assimilation method is often used in the NWP. Based on the Advance Regional Prediction System (ARPS), Hu et al. (2006) investigated the impact of cloud analysis using radar reflectivity on forecasting tornado storms. They found that cloud analysis helps in adjusting the temperature, humidity fields, and hydrometeors within the clouds, thereby improving tornado predictions. Also, Schenkman et al. (2011) found that cloud analysis technology is able to adjust cloud variables to better suit the dynamic and thermal fields. However, cloud analysis schemes rely largely on uncertain empirical relationships, thus hardly suppressing the generation of spurious echoes. Using the 4DVar system, Sun and Crook (1997) proposed assimilating rainwater mixing ratios retrieved from reflectivity instead of directly assimilating reflectivity, which seems to produce better analysis results. Based on the 3DVar system of WRF, Wang et al. (2013a) further demonstrated that assimilation of rainwater and estimated water vapor obtained from radar reflectivity reduces the linearization error in the radar reflectivity observation operator, thus improving precipitation forecasts. However, both indirect assimilation methods under the two variational frameworks are employed in the warm rain scheme, which restricts their applications above troposphere or in the coexistence of liquid and ice particles. Shen et al. (2021) added hydrometeor control variables including ice-phase particles when indirectly assimilating radar reflectivity observations of Hurricane Ike, which enables track and intensity forecasts of hurricanes to be greatly improved.
For the indirect assimilation of radar reflectivity, one of the challenges is how to correctly classify hydrometeors in observations. There are currently two methods to distinguish hydrometeor types. One is to classify hydrometeor types according to background temperature (hereafter called temperature-based) developed by Gao and Stensrud (2012), with fixed parameters and empirical relations. Another is the “background hydrometer-dependent” hydrometeor retrieval scheme (Chen et al., 2020, 2021). The “background hydrometer-dependent” method calculates hydrometeor weights at various thresholds from the model background field to better allocate radar reflectivity observation information. This approach avoids empirical thresholds and weighting coefficients given in the “temperature-based” method, and beneficially improves the accuracy of hydrometeor retrievals. However, the “background hydrometer-dependent” scheme also relies on the accuracy of the background field itself. When the background field is similar to the observation, the “background hydrometer-dependent” method tends to provide accurate hydrometeor weights. On the other hand, when the background field differs significantly from the observation, the algorithm may not be suitable for appropriately allocating hydrometeors of the radar reflectivity observation. Considering the limitations of both “temperature-based” or “background hydrometer-dependent” schemes, this study aims to adaptively combine two above methods of classifying hydrometeors to assimilate radar reflectivity more reasonably.
In the study, Sect. 2 describes the WRF-3DVar methods, radar observation operators, and a new hydrometeor retrieval method that adaptively combines the “temperature-based” and “background hydrometeor-dependent” methods. Based on two convective cases, three experiments are designed to investigate the impact of different hydrometeor retrieval schemes on assimilation and prediction, with the specific configurations presented in Sect. 3. Section 4 presents analysis and forecast results of all experiments. The conclusion is presented in Sect. 5.
2.1 The WRF-3DVar system
Based on the incremental method proposed by Courtier et al. (1994), 3DVar uses the minimization algorithm to solve the objective function. The cost function is as follows:
The vectors x, xb, and yo stand for analysis variables, background variables, and observation variables. B is the background error covariance, which is calculated by the National Meteorological Center (NMC; Parrish and Derber, 1992) method. R represents the observation error covariance. H is the nonlinear observation operator.
2.2 The radical velocity observation operator
The radial velocity observation operator is as follows:
u, v, and w denote the zonal, meridional, and vertical wind components, respectively. (x, y, z) and (xi, yi, zi) represent the radar position and observation position, respectively. ri is the distance between the radar and the observation. vT is the terminal speed.
2.3 The radar reflectivity observation operator
According to Tong and Xue (2005), the radar reflectivity observation operator is as follows:
qx means hydrometeor mixing ratios. Ze(qx) (units: dBZ) is the equivalent reflectivity factor of rainwater, snow, and graupel. αx represents the fixed coefficient that is determined by the dielectric coefficient, density, and intercept parameter of each hydrometeor. αr is 3.63×10⁹. For snow and graupel, the coefficient is temperature dependent. When the environmental temperature is greater than 0°, αs for wet snow is 4.26×10¹¹ and αg for wet graupel is 9.08×10⁹. When the temperature is below 0°, αs for dry snow is 9.80×10⁸ and αg for dry graupel is 1.09×10⁹. ρ is the air density. During the direct assimilation of radar reflectivity, the linearization errors are almost inevitable. Therefore, the indirect assimilation method is utilized in the study. The indirect method assimilates the retrieved water vapor and hydrometeors from the radar reflectivity observations. Following Wang et al. (2013a), it is assumed that when the radar reflectivity exceeds a certain threshold, the relative humidity reaches 100 %. The threshold is set to 30 dBZ in this study. The saturation water vapor at that point is then calculated and assimilated as a pseudo observation.
For retrieving hydrometeors from radar reflectivity, it is required to determine the proportion of each hydrometeor in the radar reflectivity observation. At present, there are two methods to obtain the proportion of each hydrometeor.
2.3.1 The “temperature-based” method
In Gao and Stensrud (2012), the hydrometeor types in reflectivity are classified based on the background temperature. The specific values are as follows:
and Cg denote the weights of rainwater, snow, and graupel, respectively. αr, αs, and αg represent the fixed coefficients of rainwater, snow, and graupel, respectively (Same as above). Tb is the background temperature.
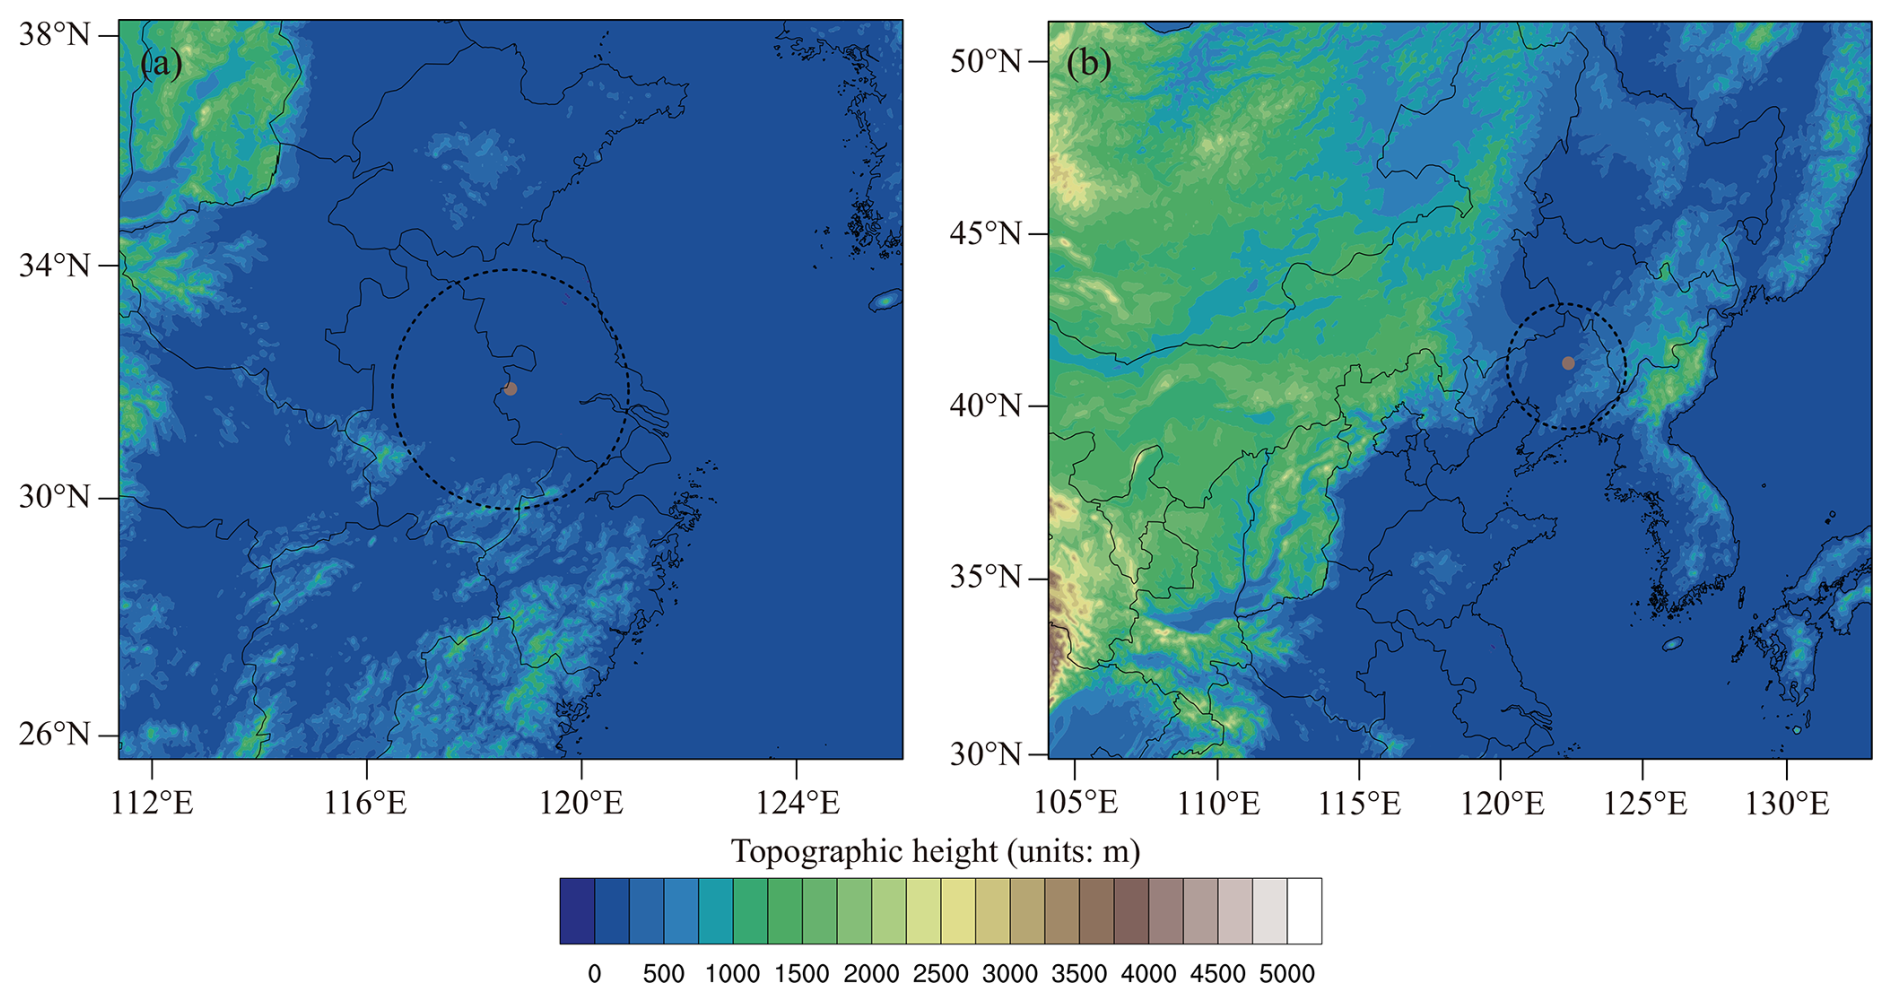
Figure 1The simulated area of (a) Case 1 and (b) Case 2, with the detecting ranges of the Nanjing radar and Shenyang radar. Both radars are S-band Doppler radars with a maximum coverage range of 230 km. The radial velocity and reflectivity observations have range resolutions of 250 and 1000 m, respectively.
2.3.2 The “background hydrometer-dependent” method
It is found that hydrometeor weights derived from the background field vary with individual weather conditions, which helps to reduce errors resulting from fixed coefficients in Chen et al. (2020, 2021). The specific process of calculating proportions is as follows.
Compute the average equivalent radar reflectivity of each hydrometeor ( in different reflectivity ranges (refi) and model layers (k) based on the background field statistics. The reflectivity ranges are usually set as follows: ref1<15 dBZ, , , , ref5≥45 dBZ.
Calculate the weight () of each hydrometeor in the background field.
Divide radar reflectivity observations based on the weights () derived from step 2. If the background field has missing data, the calculated climatological mean for 1 month will be used instead.
2.3.3 The blending method
The blending method aims to utilize the two methods of partitioning hydrometeors accordingly to retrieve multiple hydrometeors more reasonably in radar reflectivity indirect assimilation. Firstly, calculate the standard deviation σ of each hydrometeor content in the model grid and its surrounding background grids. If the standard deviations of the retrieved hydrometeors of the two schemes are less than 2σ, it means that the retrieved hydrometeors are consistent with the local structure of the background. Therefore, the hydrometeor content is calculated by the following formulas:
represents the deviation between the hydrometeor content of the background field and the retrieved hydrometeor content based on the “temperature-based” scheme. is the deviation between the hydrometeor content of the background field and the retrieved hydrometeor by the “background hydrometer-dependent” scheme. and are the weights calculated by the “temperature-based” and “background hydrometer-dependent” methods, respectively. β means the proportion of the results calculated by the “background hydrometer-dependent” method.
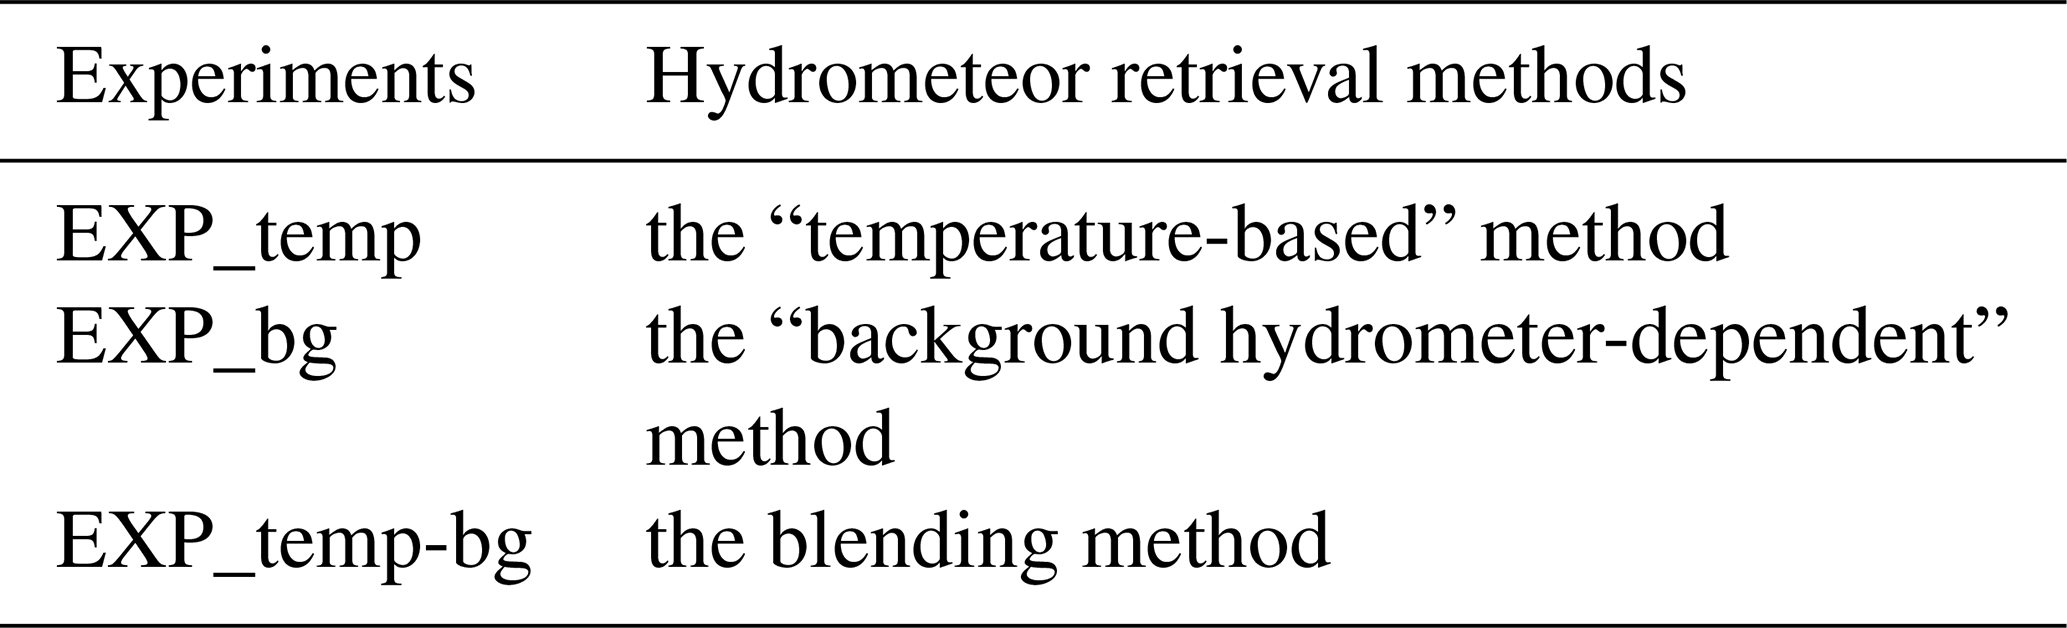
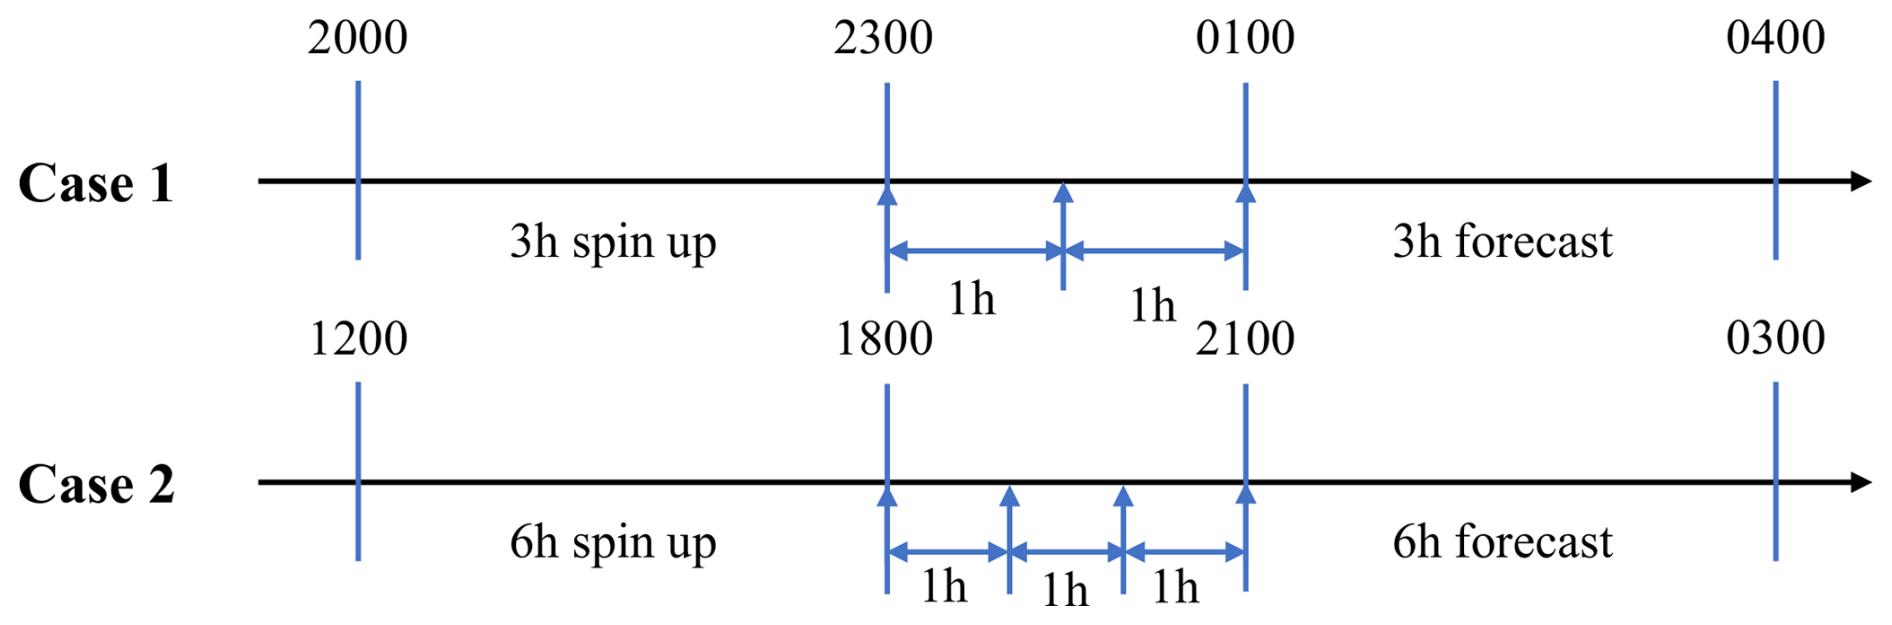
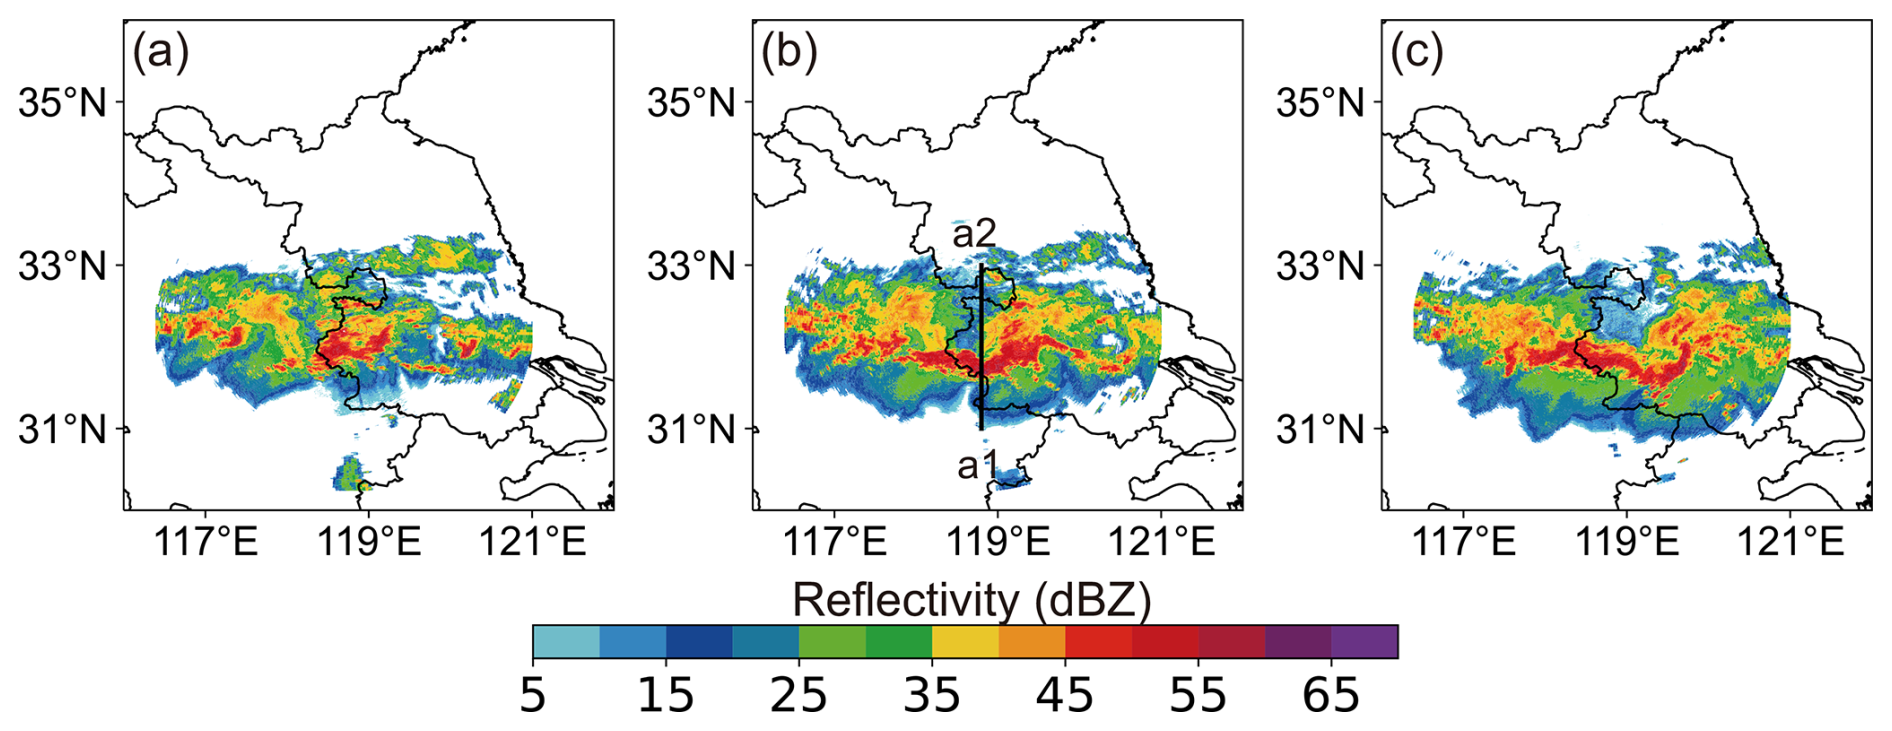
Figure 3The observed composite reflectivity fields (units: dBZ) at (a) 23:00 UTC on 14 June, (b) 00:00 UTC, and (c) 01:00 UTC on 15 June 2020. The black line a1–a2 in Fig. 3b is the vertical cross section location of Fig. 4.
WRF v4.3 and its data assimilation system, WRFDA v4.3, are employed in this study. Two convective cases are investigated: 14 June 2020 (referred to as Case 1; Fig. 1a) and 6 August 2018 (denoted as Case 2; Fig. 1b). For Case 1, the model domain consists of 500×471 grid points with a horizontal resolution of 3 km and 50 vertical levels. For Case 2, the domain comprises 723×691 grid points, also with a 3 km horizontal resolution and 50 vertical levels. The physical parameterizations applied include the WRF Double-Moment 6-Class Microphysics (WDM6) scheme, the Rapid Radiative Transfer Model (RRTM) longwave radiation scheme (Mlawer et al., 1997), the Dudhia shortwave radiation scheme (Dudhia, 1989), the Yonsei University (YSU) boundary layer scheme (Hong et al., 2006), and the Noah land surface model (Chen and Dudhia, 2001) for land surface processes. No cumulus parameterization scheme is used. As summarized in Table 1, three data assimilation (DA) experiments are conducted to evaluate the effects of all retrieval methods considered in this study. For all three DA experiments, the initial and lateral boundary conditions are provided by NCEP Global Forecast System (GFS) data. Additionally, the specific workflow is illustrated in Fig. 2. Radar observations for both cases undergo a series of preprocessing and quality control procedures, including anomaly detection and velocity de-aliasing. The observation errors for radar radial velocity and radar reflectivity are set to 2 m s−1 and 5 dBZ, respectively.
4.1 14 June 2020 case
Figure 3 shows the observed reflectivity at 23:00 UTC on 14 June, at 00:00 UTC, and at 01:00 UTC on 15 June 2020. At the beginning, there are strong echoes in the southwestern boundary of Jiangsu Province. Subsequently, the strong convective band begins to expand in both eastward and westward directions, stretching to the central Anhui Province and Jiangsu Province.
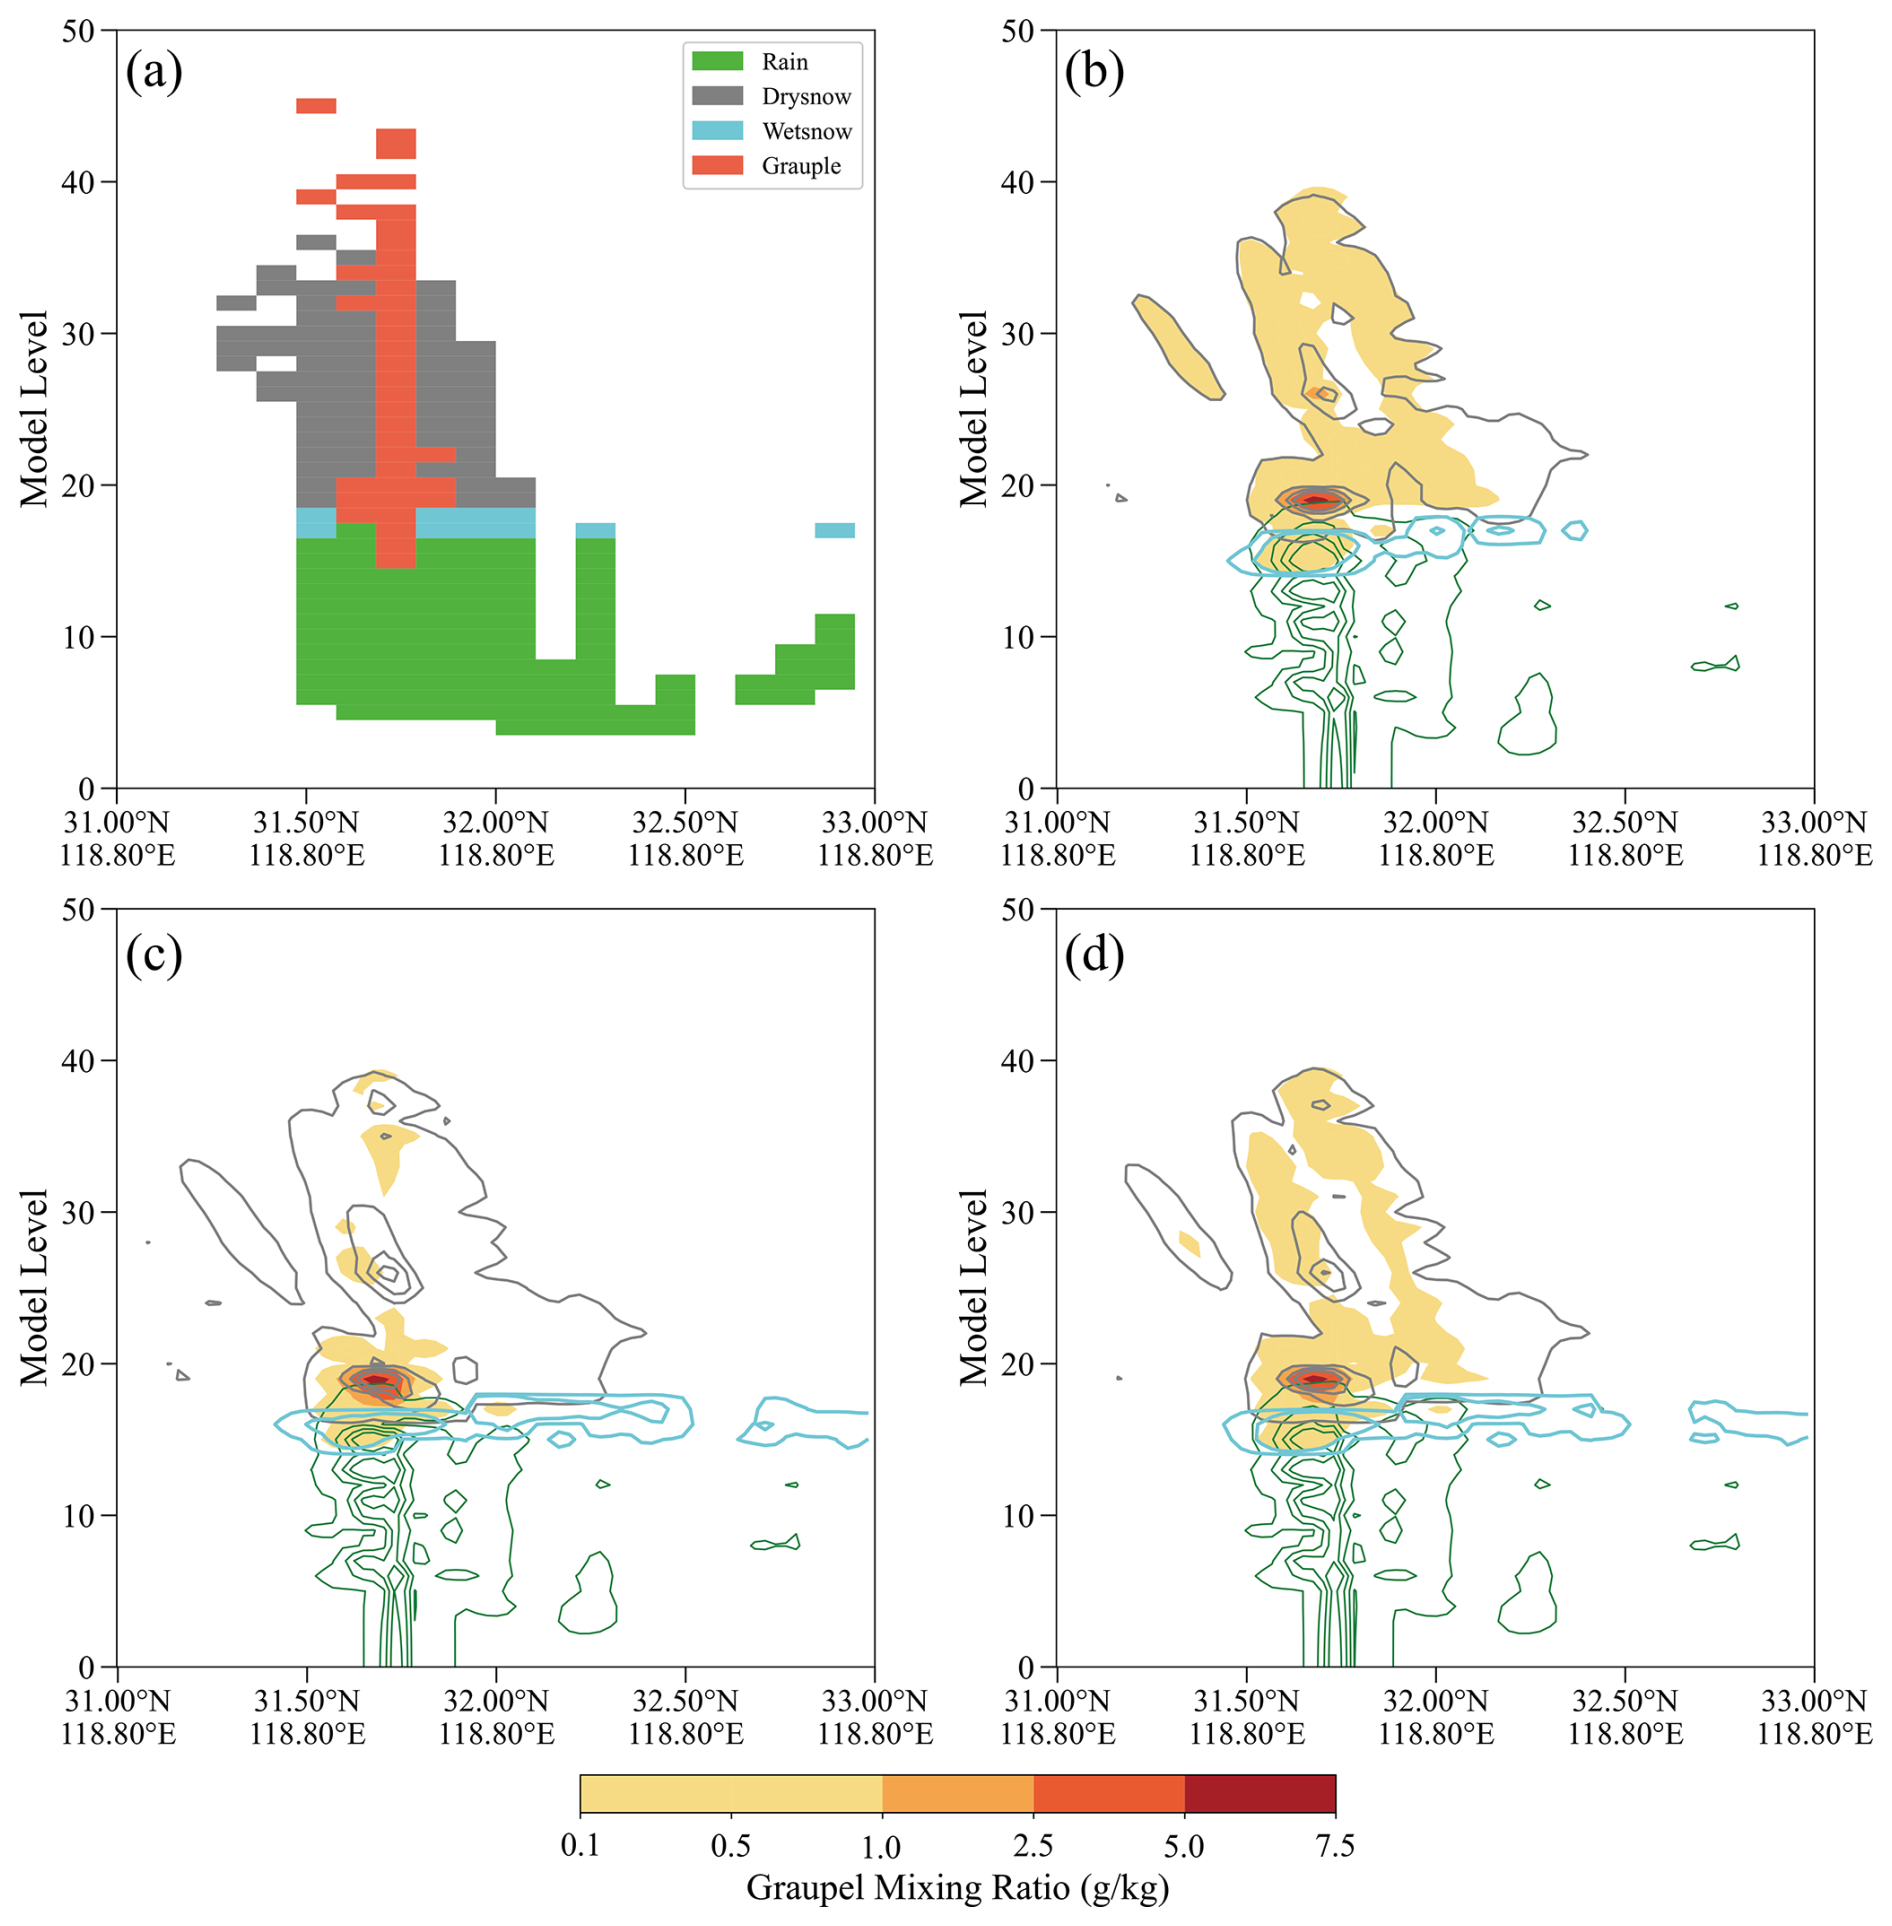
Figure 4The vertical sections of (a) the hydrometeor classification algorithm based on the dual-polarization radar observations and retrieved hydrometeors for (b) EXP_temp, (c) EXP_bg, and (d) EXP_temp-bg along the black lines a1–a2 at 15:00 UTC. The retrieved hydrometeors refer to rainwater mixing ratio (green contours; units: g kg−1), dry snow mixing ratio (gray contours; units: g kg−1), wet snow mixing ratio (cyan contours; units: g kg−1), and graupel mixing ratio (shading; units: g kg−1), respectively.
Figure 4 compares the hydrometeor classification algorithm (HCA) based on dual-polarization radar observations with the hydrometeor retrieval results from the three experiments at 15:00 UTC on 14 June 2020. The HCA diagram indicates that rainwater dominates the lower levels, while dry snow and graupel prevail at higher levels, with wet snow present near the melting layer. In the vertical cross sections of the three experiments (Fig. 4b, c, d), the overall distribution patterns of the retrieved hydrometeors appear reasonable, especially for rain and snow. Notably, the wet snow and graupel retrieved by EXP_temp-bg are more consistent with the HCA results compared to EXP_temp and EXP_bg.
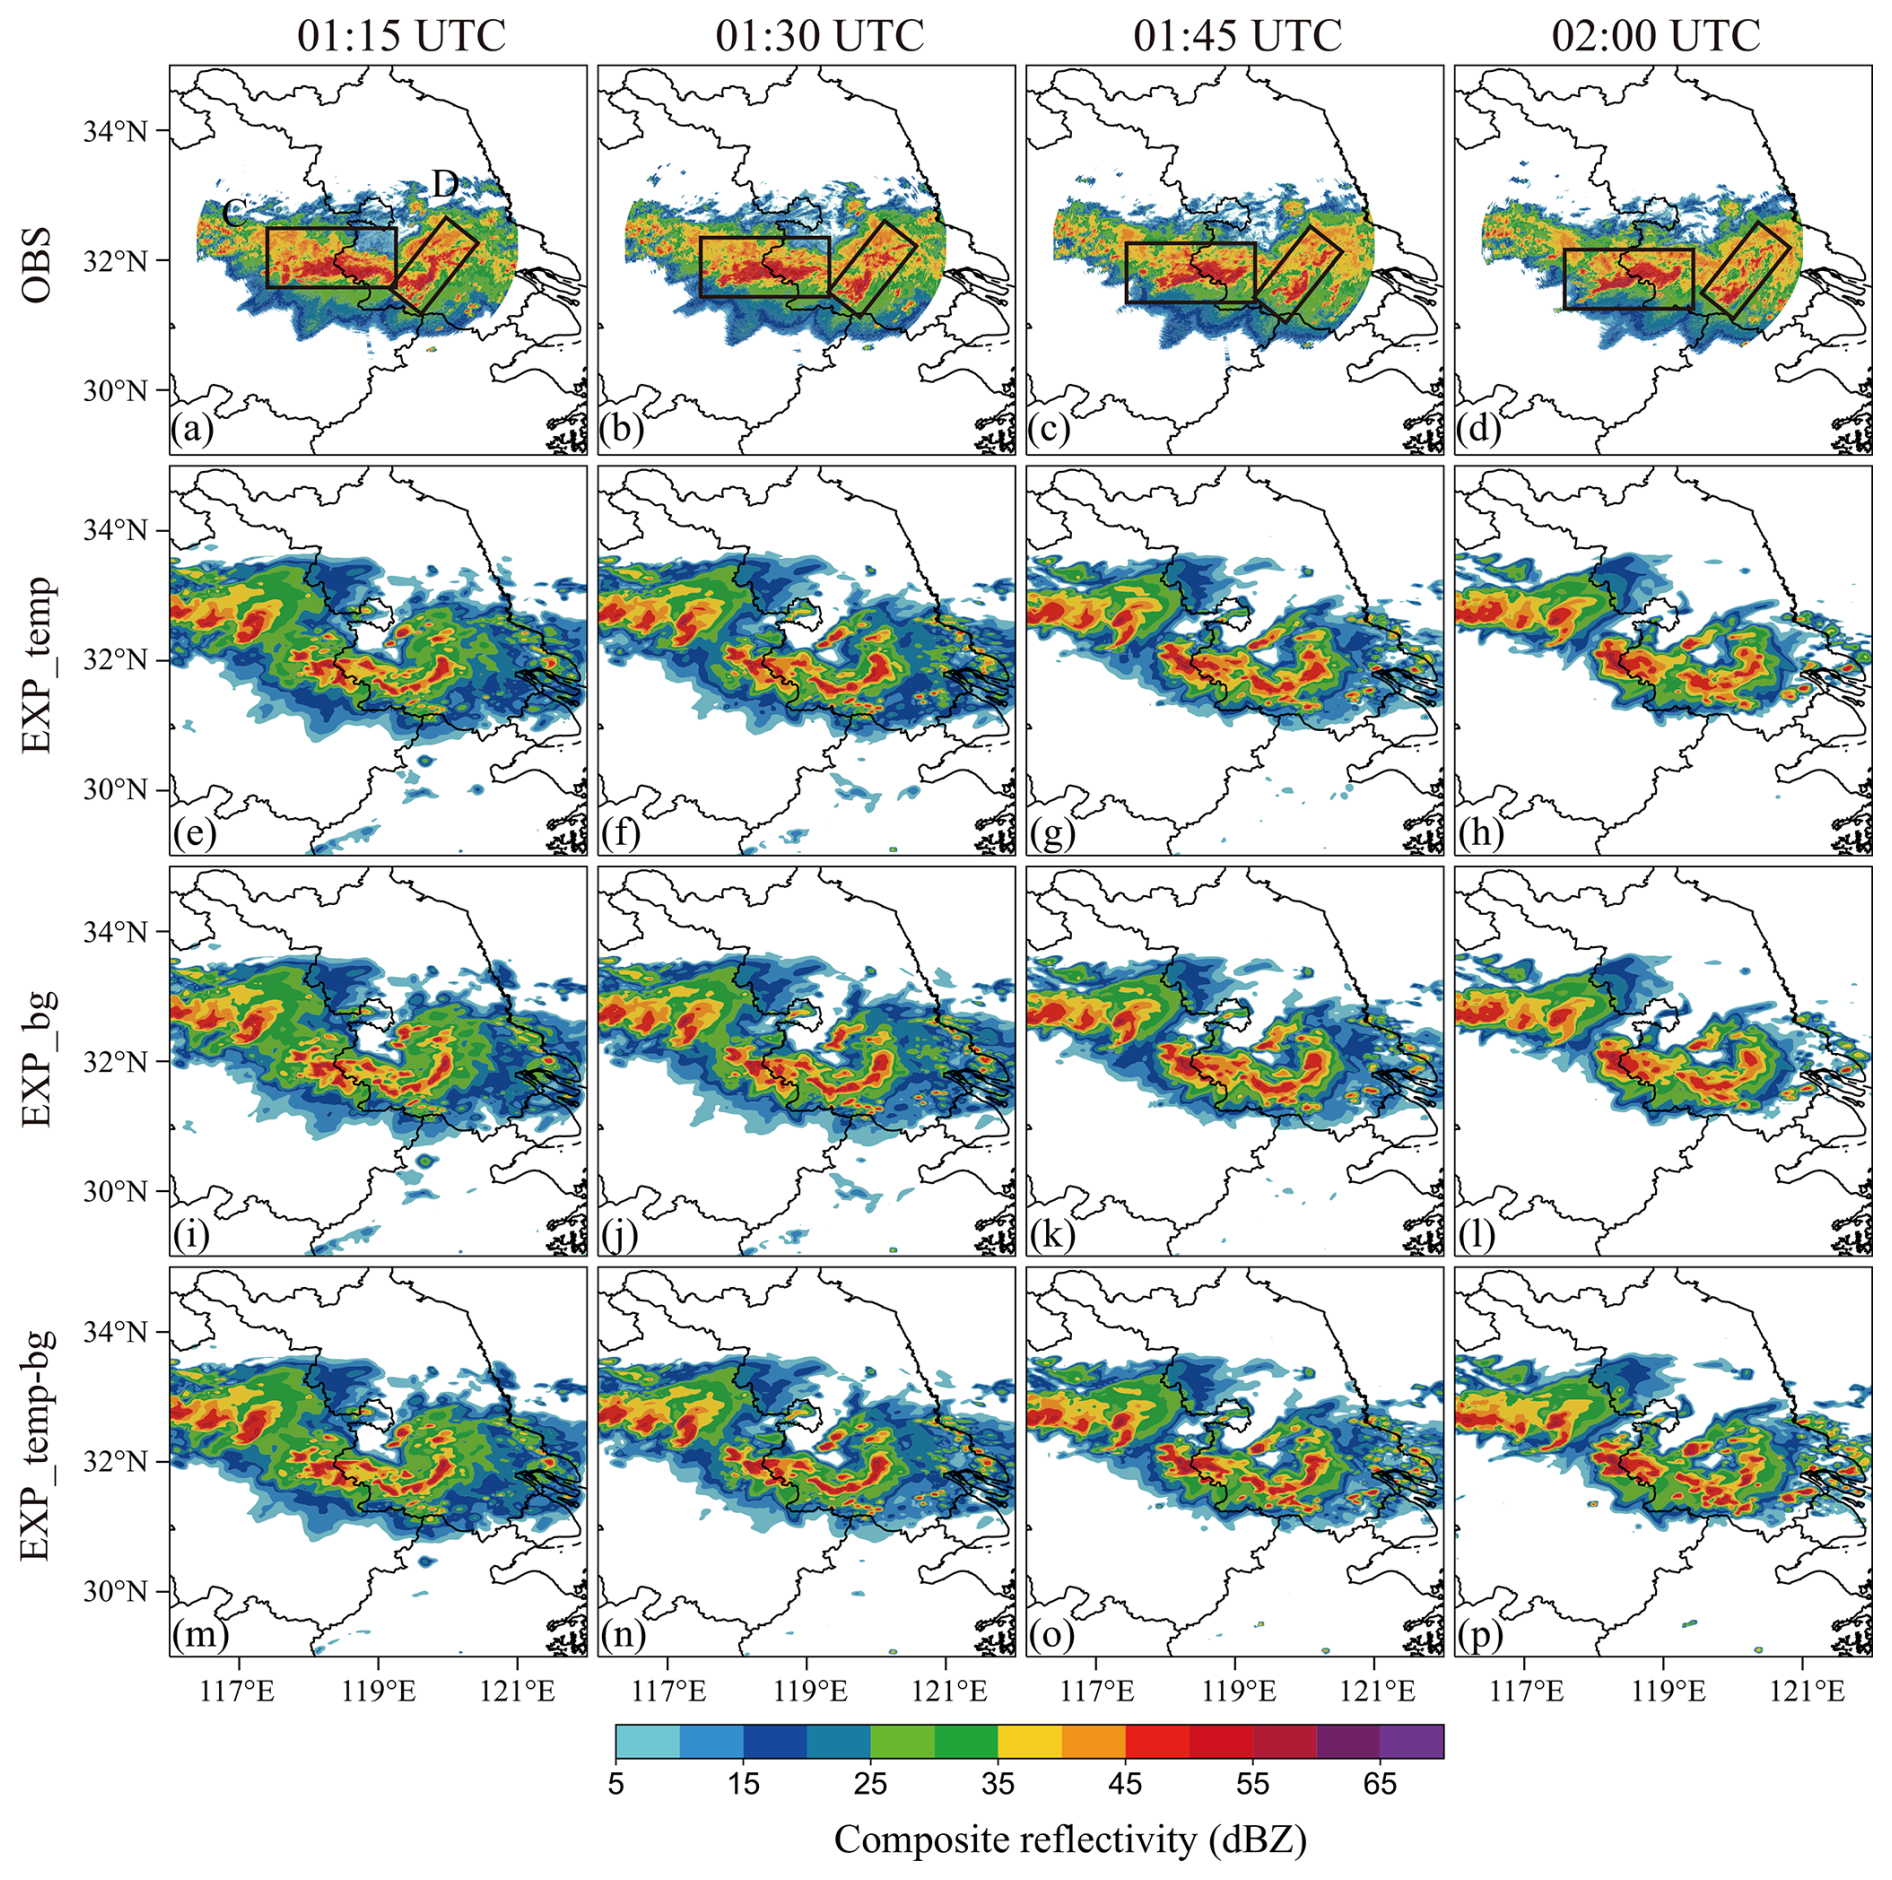
Figure 5The composite reflectivity (shaded; units: dBZ) predicted by (e)–(h) EXP_temp, (i)–(l) EXP_bg, and (m)–(p) EXP_temp-bg for the 1 h forecast beginning at 01:00 UTC on 15 June 2020, as compared to (a)–(d) the observed composite reflectivity. The labels C and D present the convection locations.
To investigate the impact of the radar reflectivity DA based on the three hydrometeor retrieval methods, Fig. 5 shows the predicted composite reflectivity initiated at 01:00 UTC on 15 June. It is shown that the convective structure is divided into two parts (labeled C and D). From the observations (Fig. 3a), the combination of C and D is initially located in the western Jiangsu and eastern Anhui. Soon after, region D gradually separates from C and shifts eastward, displaying the reduced intensity and poor organization. At 01:15 UTC, all DA experiments are able to capture region C and region D, albeit with slightly weaker intensity compared to the observations. At 01:30 UTC, the patterns of region C predicted by three experiments depart from the observation, while the echoes for EXP_temp-bg exhibit the best organization. At 01:45 UTC, region C in EXP_temp and EXP_bg shows poor agreement with the observations. In contrast, EXP_temp-bg provides a more accurate forecast in terms of shape and intensity. At 02:00 UTC, three experiments can predict region C and region D to some extent, but region D in EXP_temp-bg has the most accurate echo pattern. In general, the blending scheme is conducive to improving the radar reflectivity forecast skill.
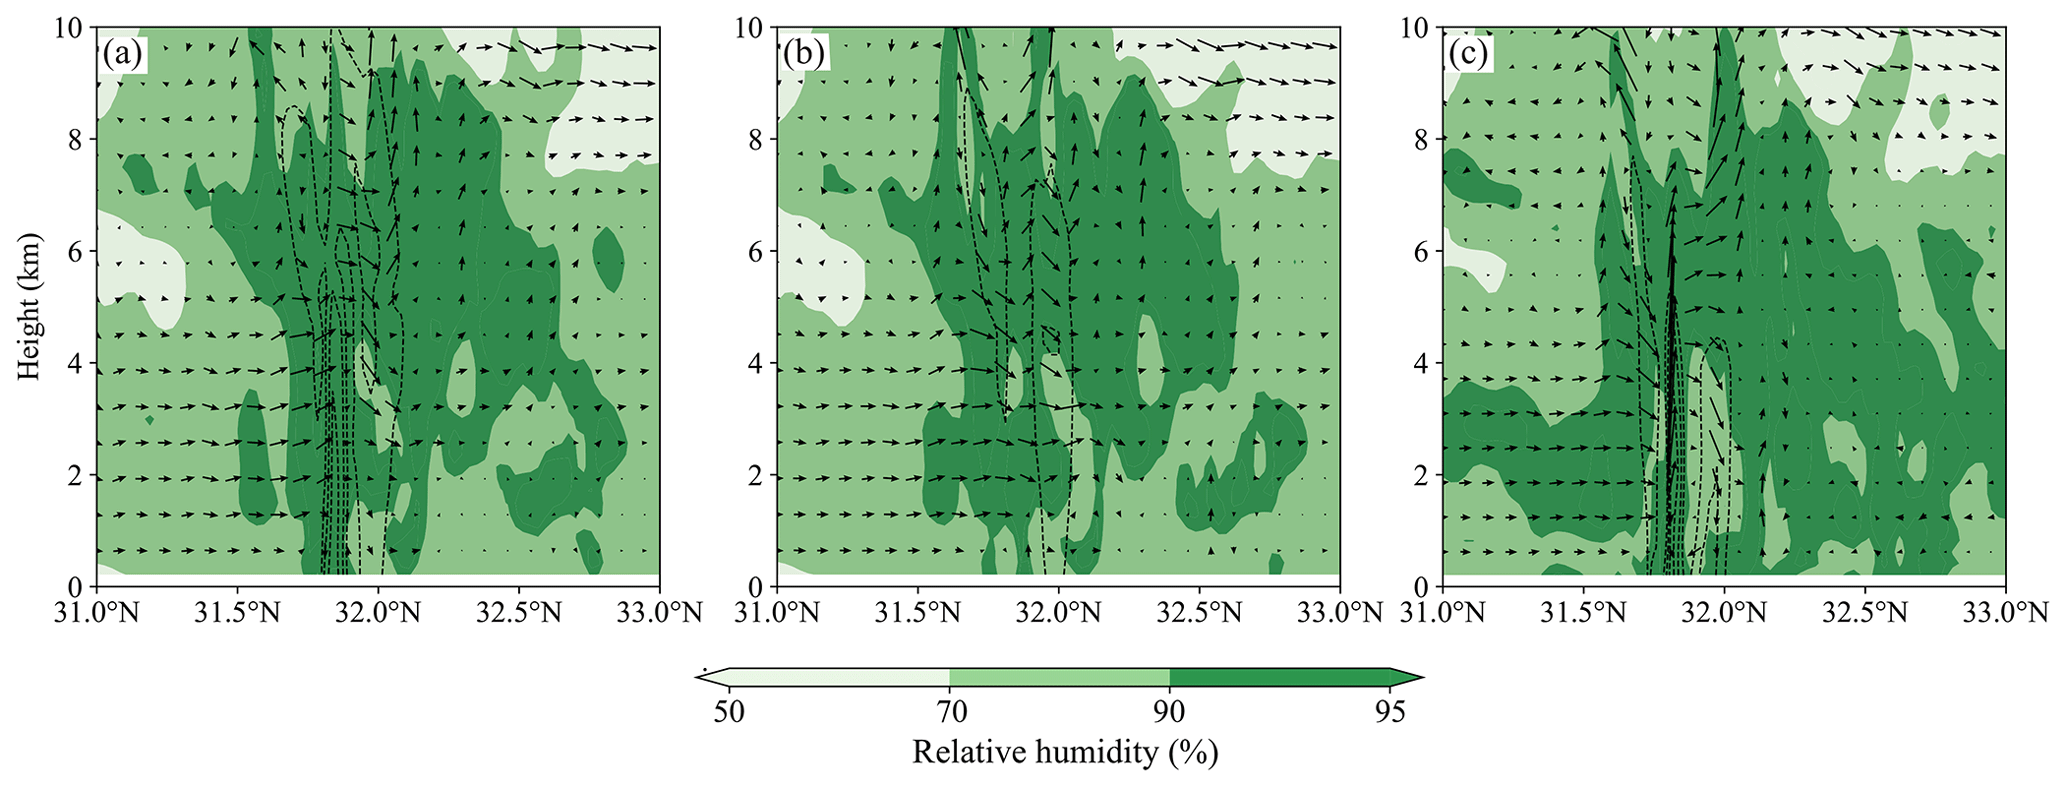
Figure 6The cross sections of relative humidity (shading; units: %), radar reflectivity (black contours starting at 40 dBZ; units: dBZ), and wind vectors for (a) EXP_temp, (b) EXP_bg, and (c) EXP_temp-bg along the line a1–a2. These are 1 h forecasts initialized at 15:01 UTC.

Figure 7Shown here is 3 h accumulated precipitation initialized at 01:00 UTC on 15 June 2020. (a) The observation, (b) EXP_temp, (c) EXP_bg, and (d) EXP_temp-bg.
Figure 6 displays the vertical cross sections of the relative humidity, radar reflectivity, and wind fields at 15:01 UTC. After 1 h forecast, the cross sections from all experiments indicate the presence of saturated water vapor columns near the strong echoes (around 32° N). Notably, EXP_temp-bg also reveals a robust updraft, facilitating the transport of water vapor from lower to upper levels. In comparison, EXP_temp-bg produces the most consistent thermal and dynamical conditions, resulting in the most accurate forecast of the convection.
Figure 7 shows the 3 h accumulated precipitation forecast from 15:01 to 15:04 UTC on 15 June 2020. As depicted in Fig. 7a, the primary precipitation zone is concentrated along the western boundary of Jiangsu Province, with accumulated precipitation exceeding 50 mm. The precipitation intensity is overestimated for three DA experiments. However, EXP_temp-bg effectively suppresses two false precipitation areas, leading to an improved precipitation forecast.
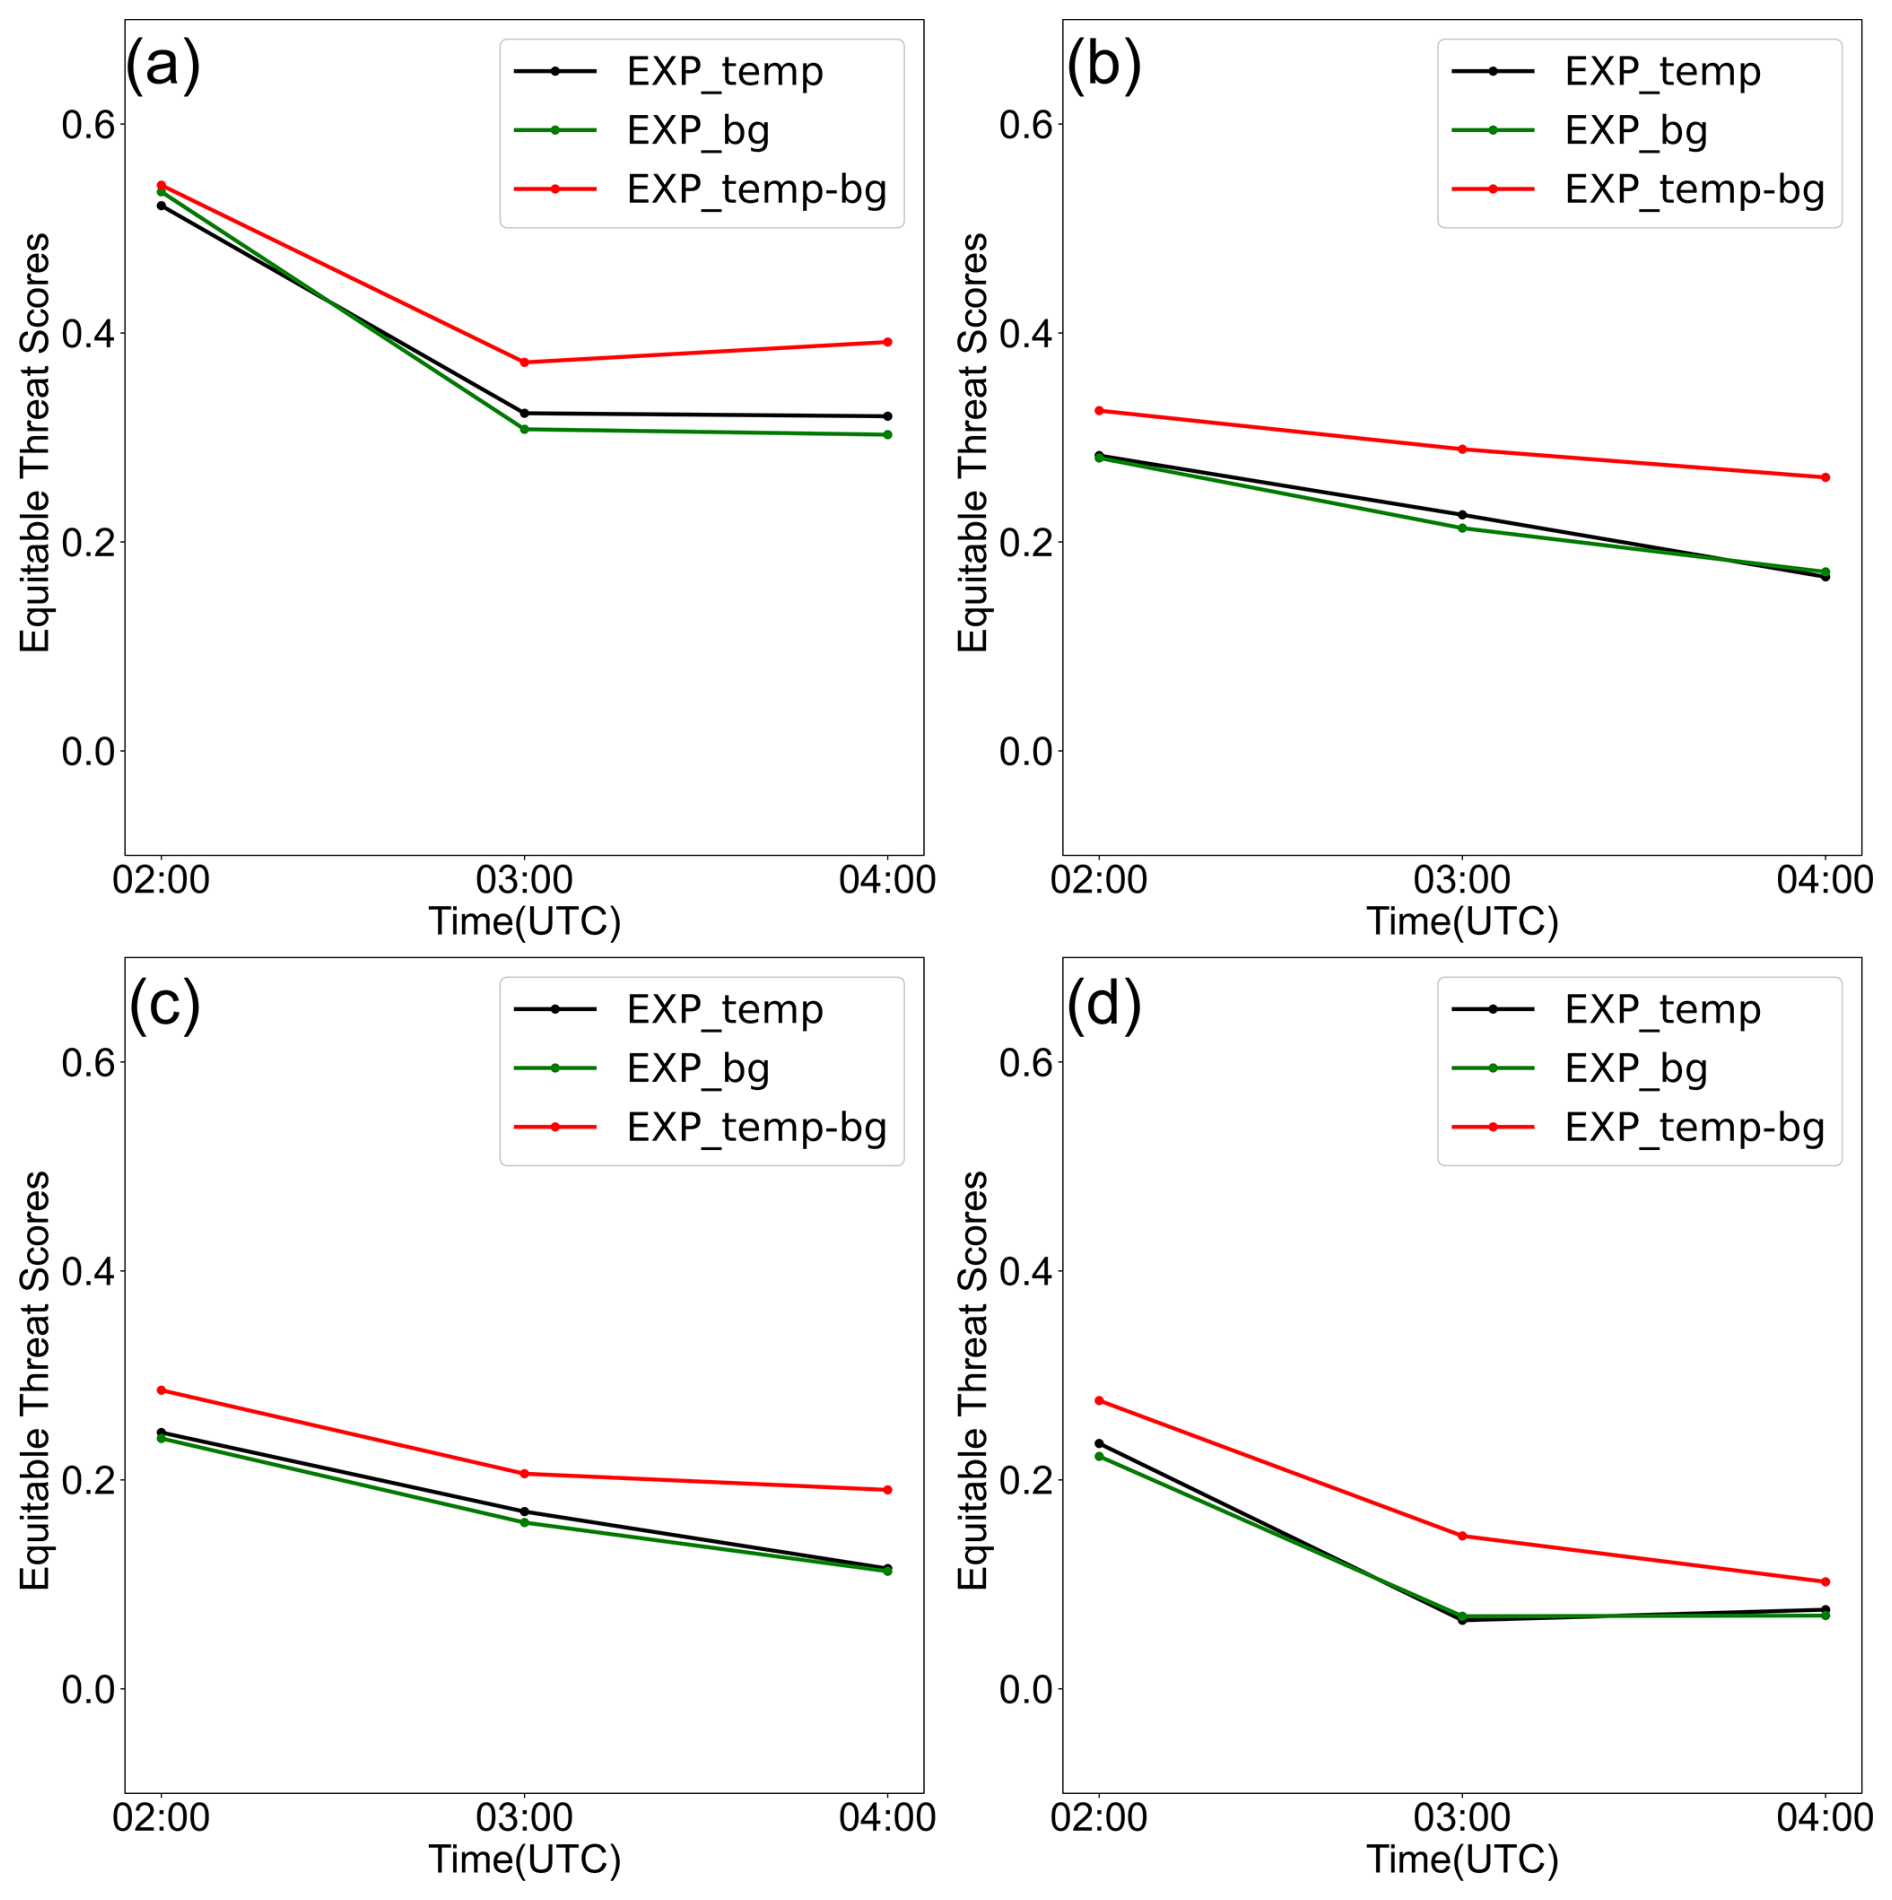
Figure 8Equitable threat scores of hourly accumulated precipitation forecasts with four thresholds: (a) 0.1, (b) 2.5, (c) 5, and (d) 10 mm from 02:00 UTC to 04:00 UTC on 15 June.
To quantitatively assess the performance of different hydrometeor retrieval schemes, the equitable threat scores (ETS) are calculated for 0–3 h precipitation forecasts in EXP_temp, EXP_bg, and EXP_temp-bg (Fig. 8). The specific calculation formula of ETS is as follows:
where A, B, C, and D are the number of hits, the false alarms, the misses, and the correct negatives. R refers to the probability of having a correct forecast by chance.
It is evident that as the precipitation threshold increases, the ETS values for all three experiments decline progressively. Furthermore, EXP_temp and EXP_bg exhibit comparable ETS values under various precipitation thresholds. In contrast, EXP_temp-bg consistently outperforms both EXP_temp and EXP_bg for the entire 3 h forecast period, which implies that the integrated hydrometeor retrieval scheme is conducive to the assimilation of radar reflectivity observations.
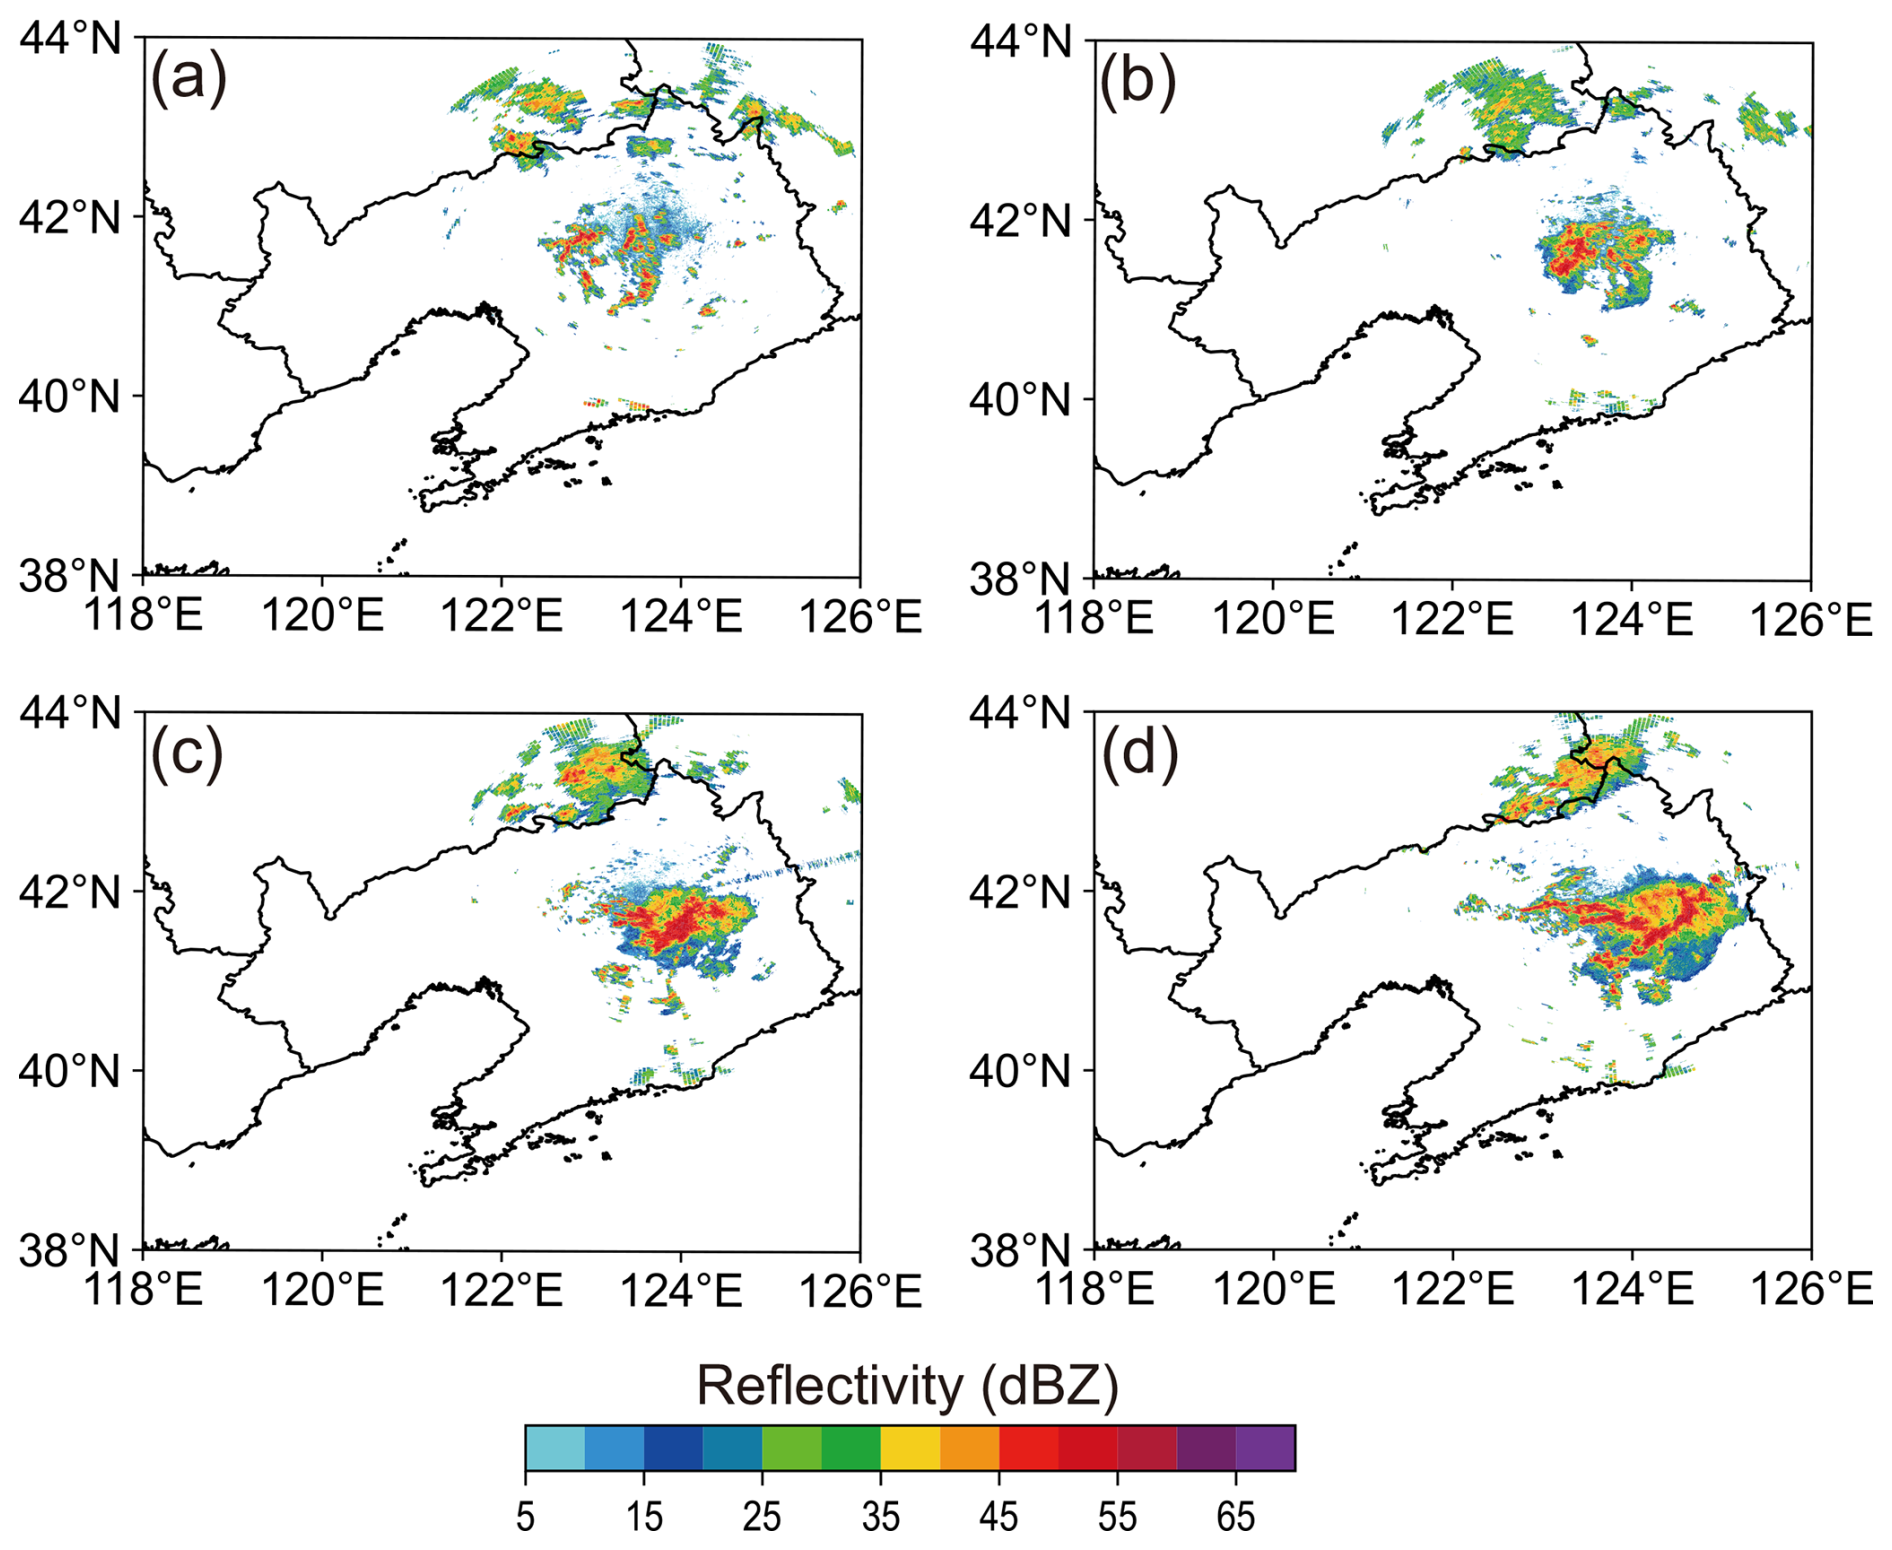
Figure 9The observed composite reflectivity fields (units: dBZ) at (a) 18:00 UTC, (b) 19:00 UTC, (c) 20:00 UTC, and (d) 21:00 UTC on 6 August 2018.
4.2 6 August 2018 case
Figure 9 presents the observed composite reflectivity at 18:00, 19:00, 20:00, and 21:00 UTC on 6 August 2018. At 18:00 UTC, there are a small number of strong radar echoes in the central part of Liaoning Province. At 19:00 UTC, these discrete strong echoes gradually converge in the center of Liaoning, forming a well-organized structure. By 20:00 UTC, the convections continue to develop and form a “V” pattern echo. At 21:00 UTC, a distinct “T” shaped echo emerges in the observed area.
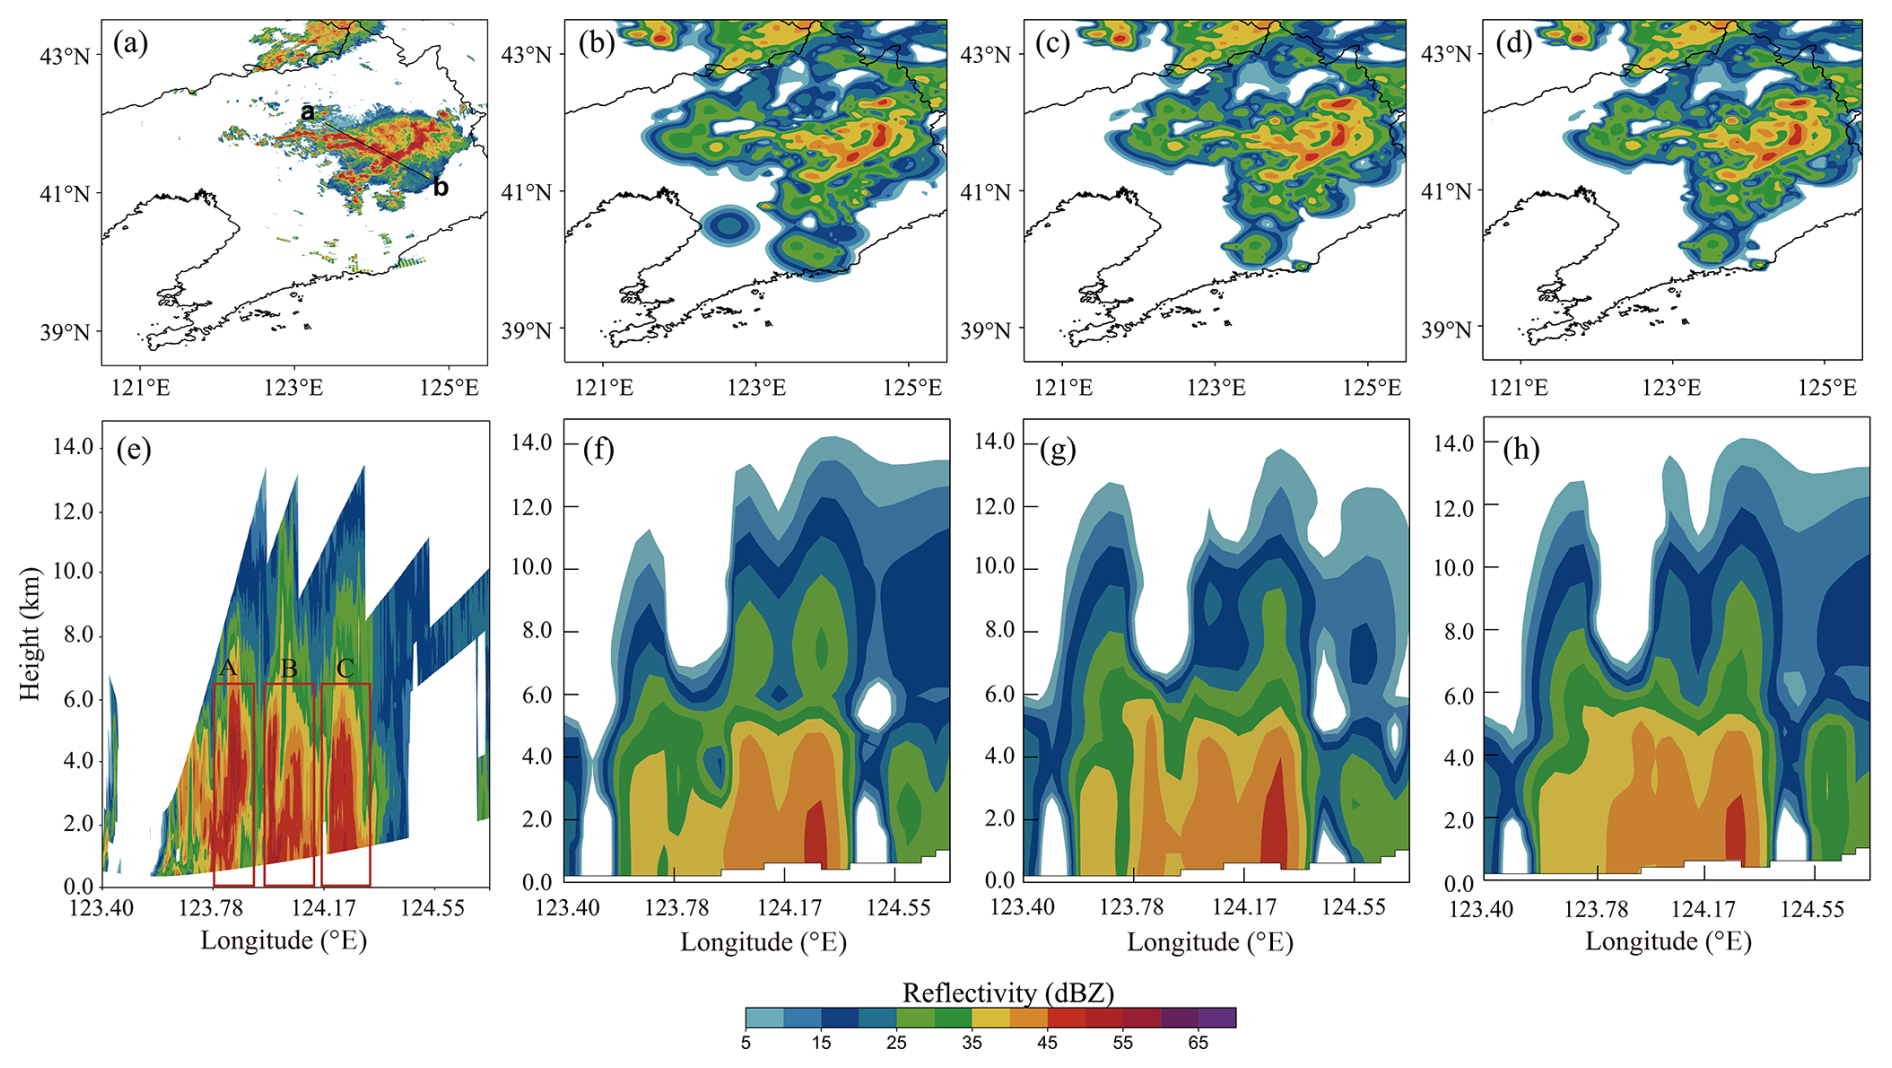
Figure 10The composite reflectivity at 21:00 UTC for (a) observation, (b) EXP_temp, (c) EXP_bg, (d) EXP_temp-bg, accompanied by the vertical cross sections for (e) observation, (f) EXP_temp, (g) EXP_bg, and (h) EXP_temp-bg along the line a–b. The vertical cross section location at 21:00 UTC is shown by the line a–b in Fig. 10a. The labels in Fig. 10e present the convection locations.
Figure 10 shows the radar reflectivity analysis fields and the vertical cross sections along the line a–b from EXP_temp, EXP_bg, and EXP_ temp-bg at 21:00 UTC. As shown in Fig. 10a, a distinct “T” shaped echo emerges in the observed area. Generally, the composite reflectivity analyses of the experiments EXP_temp, EXP_bg, and EXP_temp-bg show a general agreement. From the observed vertical cross section, it seems that there exist three strong echo bands between 123.78 and 124.36° E. In order to display the differences between three DA experiments and the observation, the convective system located near 123.75° E is marked as A, the strong convection at 123.97–124.17° E is marked as B, and the strong echo region at 124.17–124.55° E is marked as C. Notably, part A in the experiment EXP_temp departs from the observation, while EXP_bg and EXP_temp-bg capture it more closely. It seems EXP_temp-bg combines the echo characteristics of both EXP_temp and EXP_bg in part A. For part B, though all three DA experiments exhibit a general agreement with the observation, their intensity is weaker than that in the observation. All three experiments capture the overall structure of C.
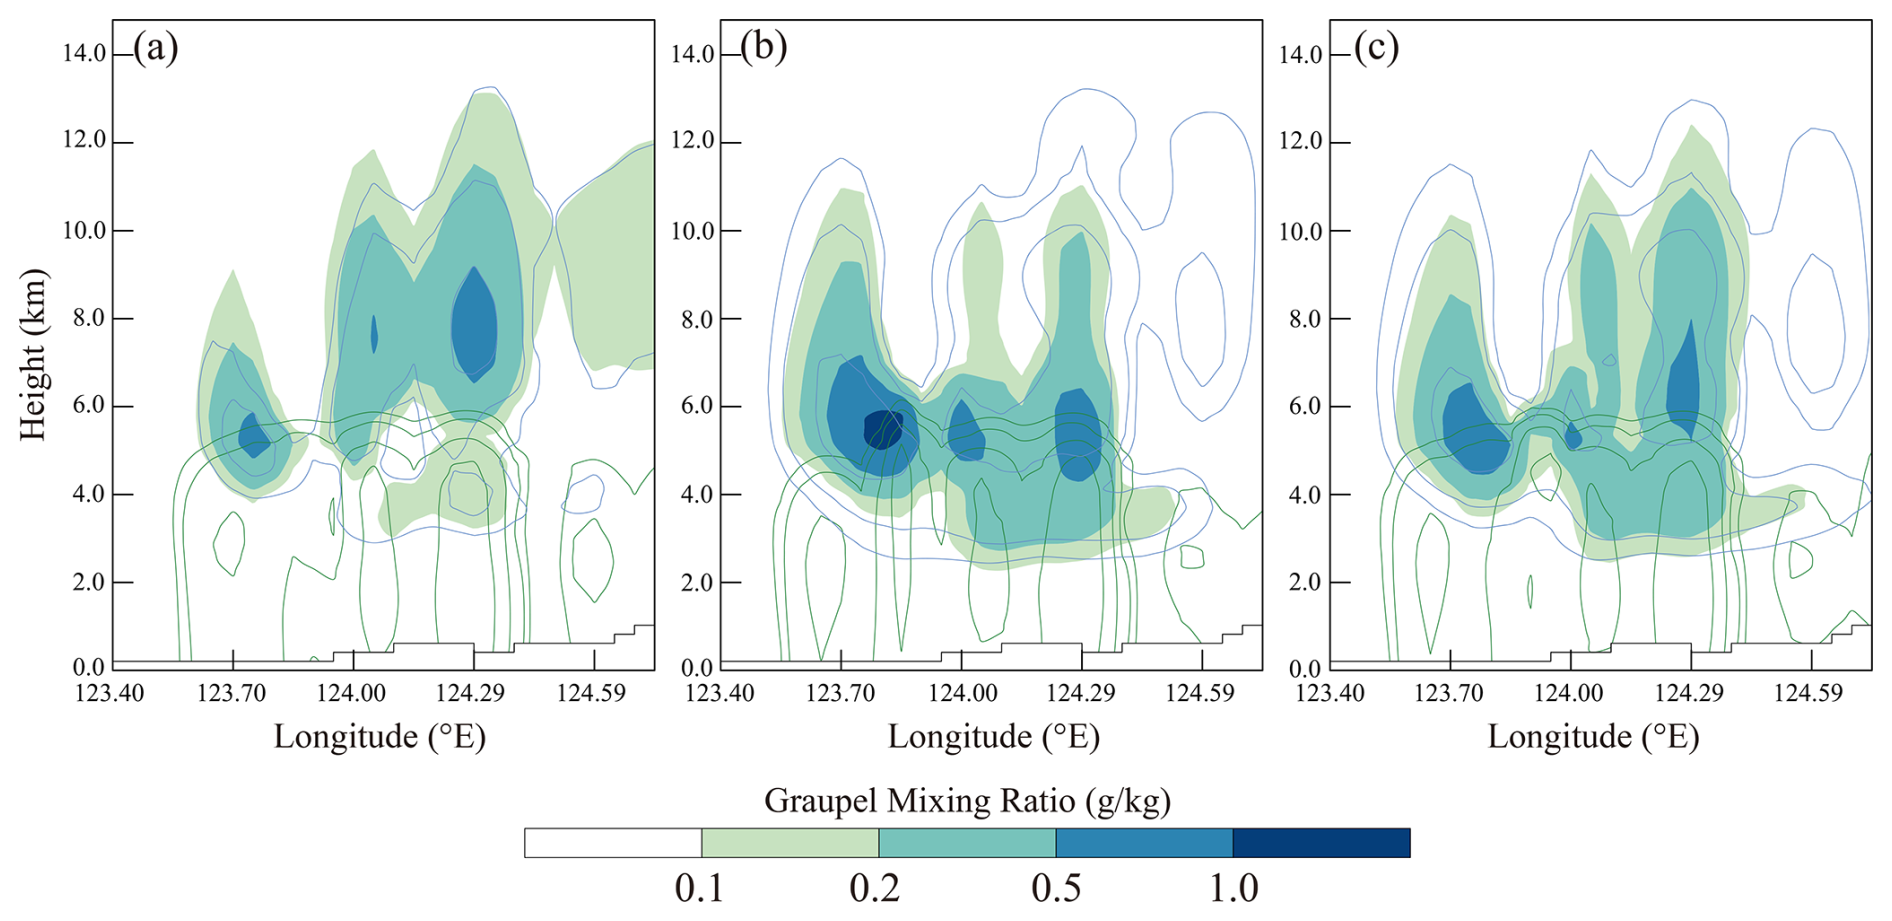
Figure 11The vertical cross sections of rainwater mixing ratio (green contours), snow mixing ratio (blue contours), and graupel mixing ratio (shading) at 21:00 UTC for the experiments (a) EXP_temp, (b) EXP_bg, and (c) EXP_temp-bg. The position of the cross sections is located at the line a–b of Fig. 10a.
To examine how different retrieval methods modify the hydrometeor distributions, the rainwater, snow, and graupel mixing ratio cross sections are presented in Fig. 11. Rainwater occurs below the freezing level, while snow and graupel particles primarily exist above the freezing level. The distribution of low-level rainwater in EXP_temp-bg is similar to that in EXP_bg. The proportion of snow and graupel is a fixed coefficient in the EXP_temp, resulting in similar vertical distributions as shown in Fig. 11a. For schemes associated with the background, the weights assigned to different hydrometeors vary dynamically with the background field. Therefore, the fixed coefficient does not exist in the other two experiments (EXP_bg and EXP_temp-bg). Additionally, both EXP_bg and EXP_temp-bg have significantly higher snow and graupel content than EXP_temp. Figure 11 shows three strong centers of graupel particles corresponding to three strong reflectivity bands in Fig. 10. By comparing the three groups of the DA experiments, it is apparent that EXP_bg has the highest strong center value, while EXP_temp has the lowest. Moreover, the distribution of high-altitude hydrometeors in EXP_temp-bg combines the features of EXP_temp and EXP_bg. To conclude, the hydrometeor vertical distributions are closely related to the radar reflectivity structure as expected.
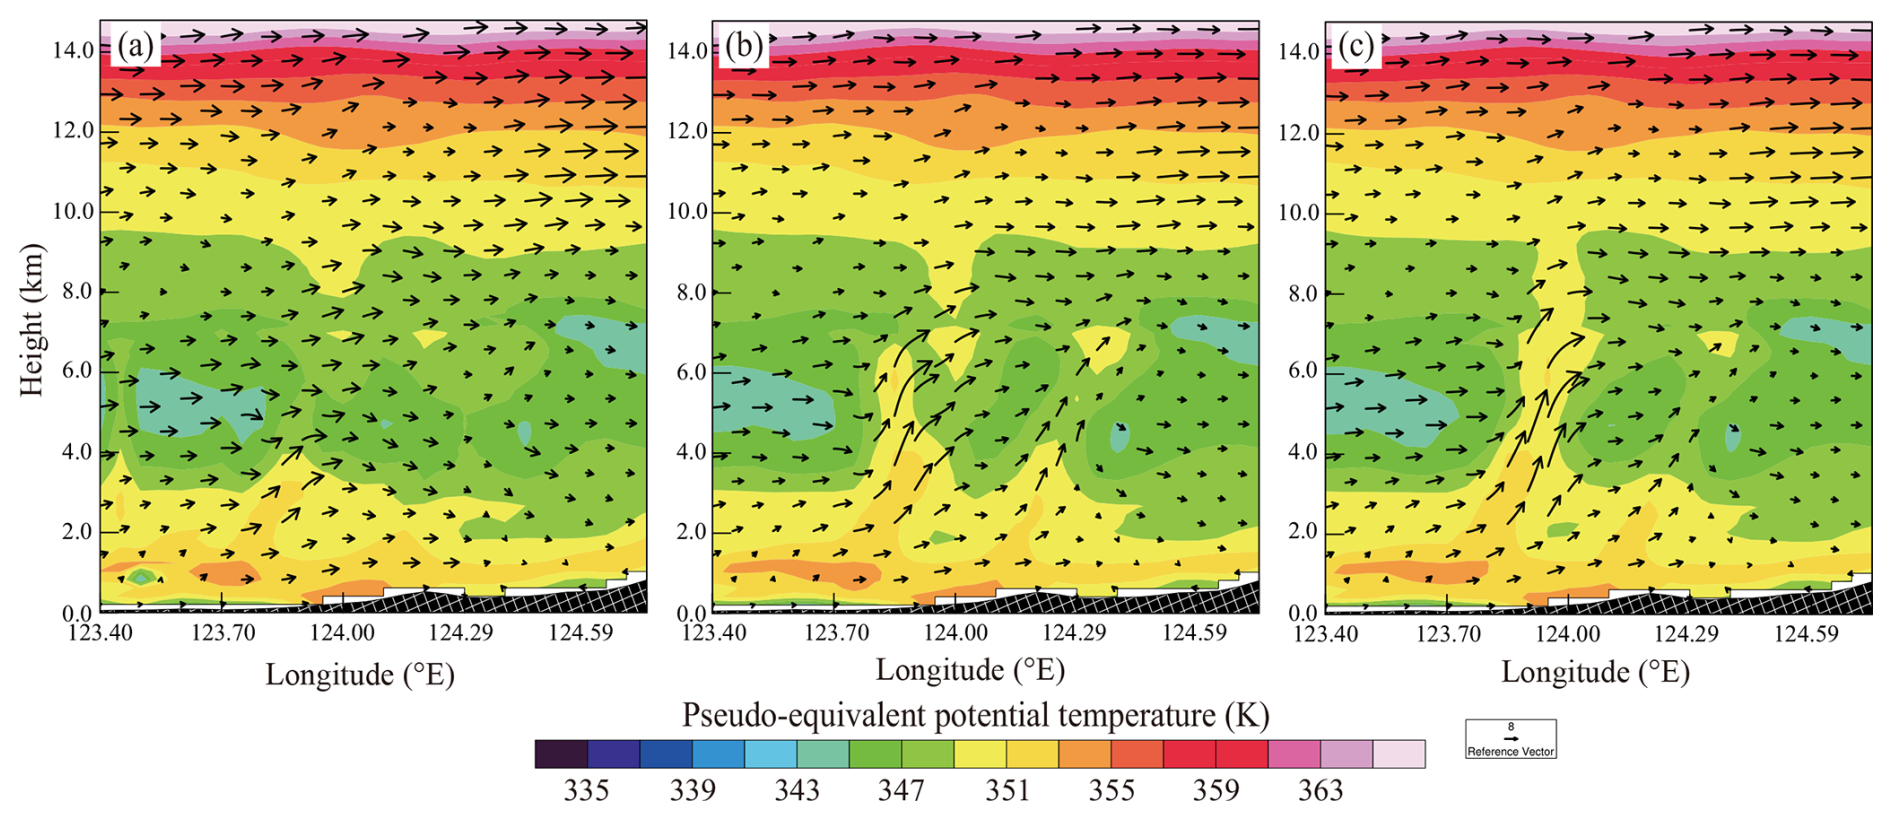
Figure 12The vertical sections of pseudo-equivalent potential temperature (shaded; units: K) and velocity vectors (units: m s−1; the vertical velocity has been multiplied by 10) at 21:00 UTC for (a) EXP_temp, (b) EXP_bg, and (c) EXP_temp-bg. The position of the cross sections is located at the line a–b of Fig. 10a.
Figure 12 displays the vertical cross sections of the pseudo-equivalent potential temperature (θse), wind components, and reflectivity at 21:00 UTC for EXP_temp, EXP_bg, and EXP_temp-bg. All three data assimilation (DA) experiments exhibit a high–low–high vertical distribution of θse. It suggests that the vertical structure of the atmosphere is unstable in this region, with dry conditions prevailing in the upper levels and moist conditions in the lower levels. This type of vertical structure is favorable for the development of severe convective weather events. In the middle layer, there is a zone with relatively high θse value for EXP_bg and EXP_temp-bg. Specifically, a warm core structure is identified near 123.85° N, accompanied by strong upward motion. This results in the release of unstable energy, indicating that a severe convective system is continuously developing. Additionally, compared with EXP_bg, EXP_temp-bg yields a more extensive and deeper updraft column.
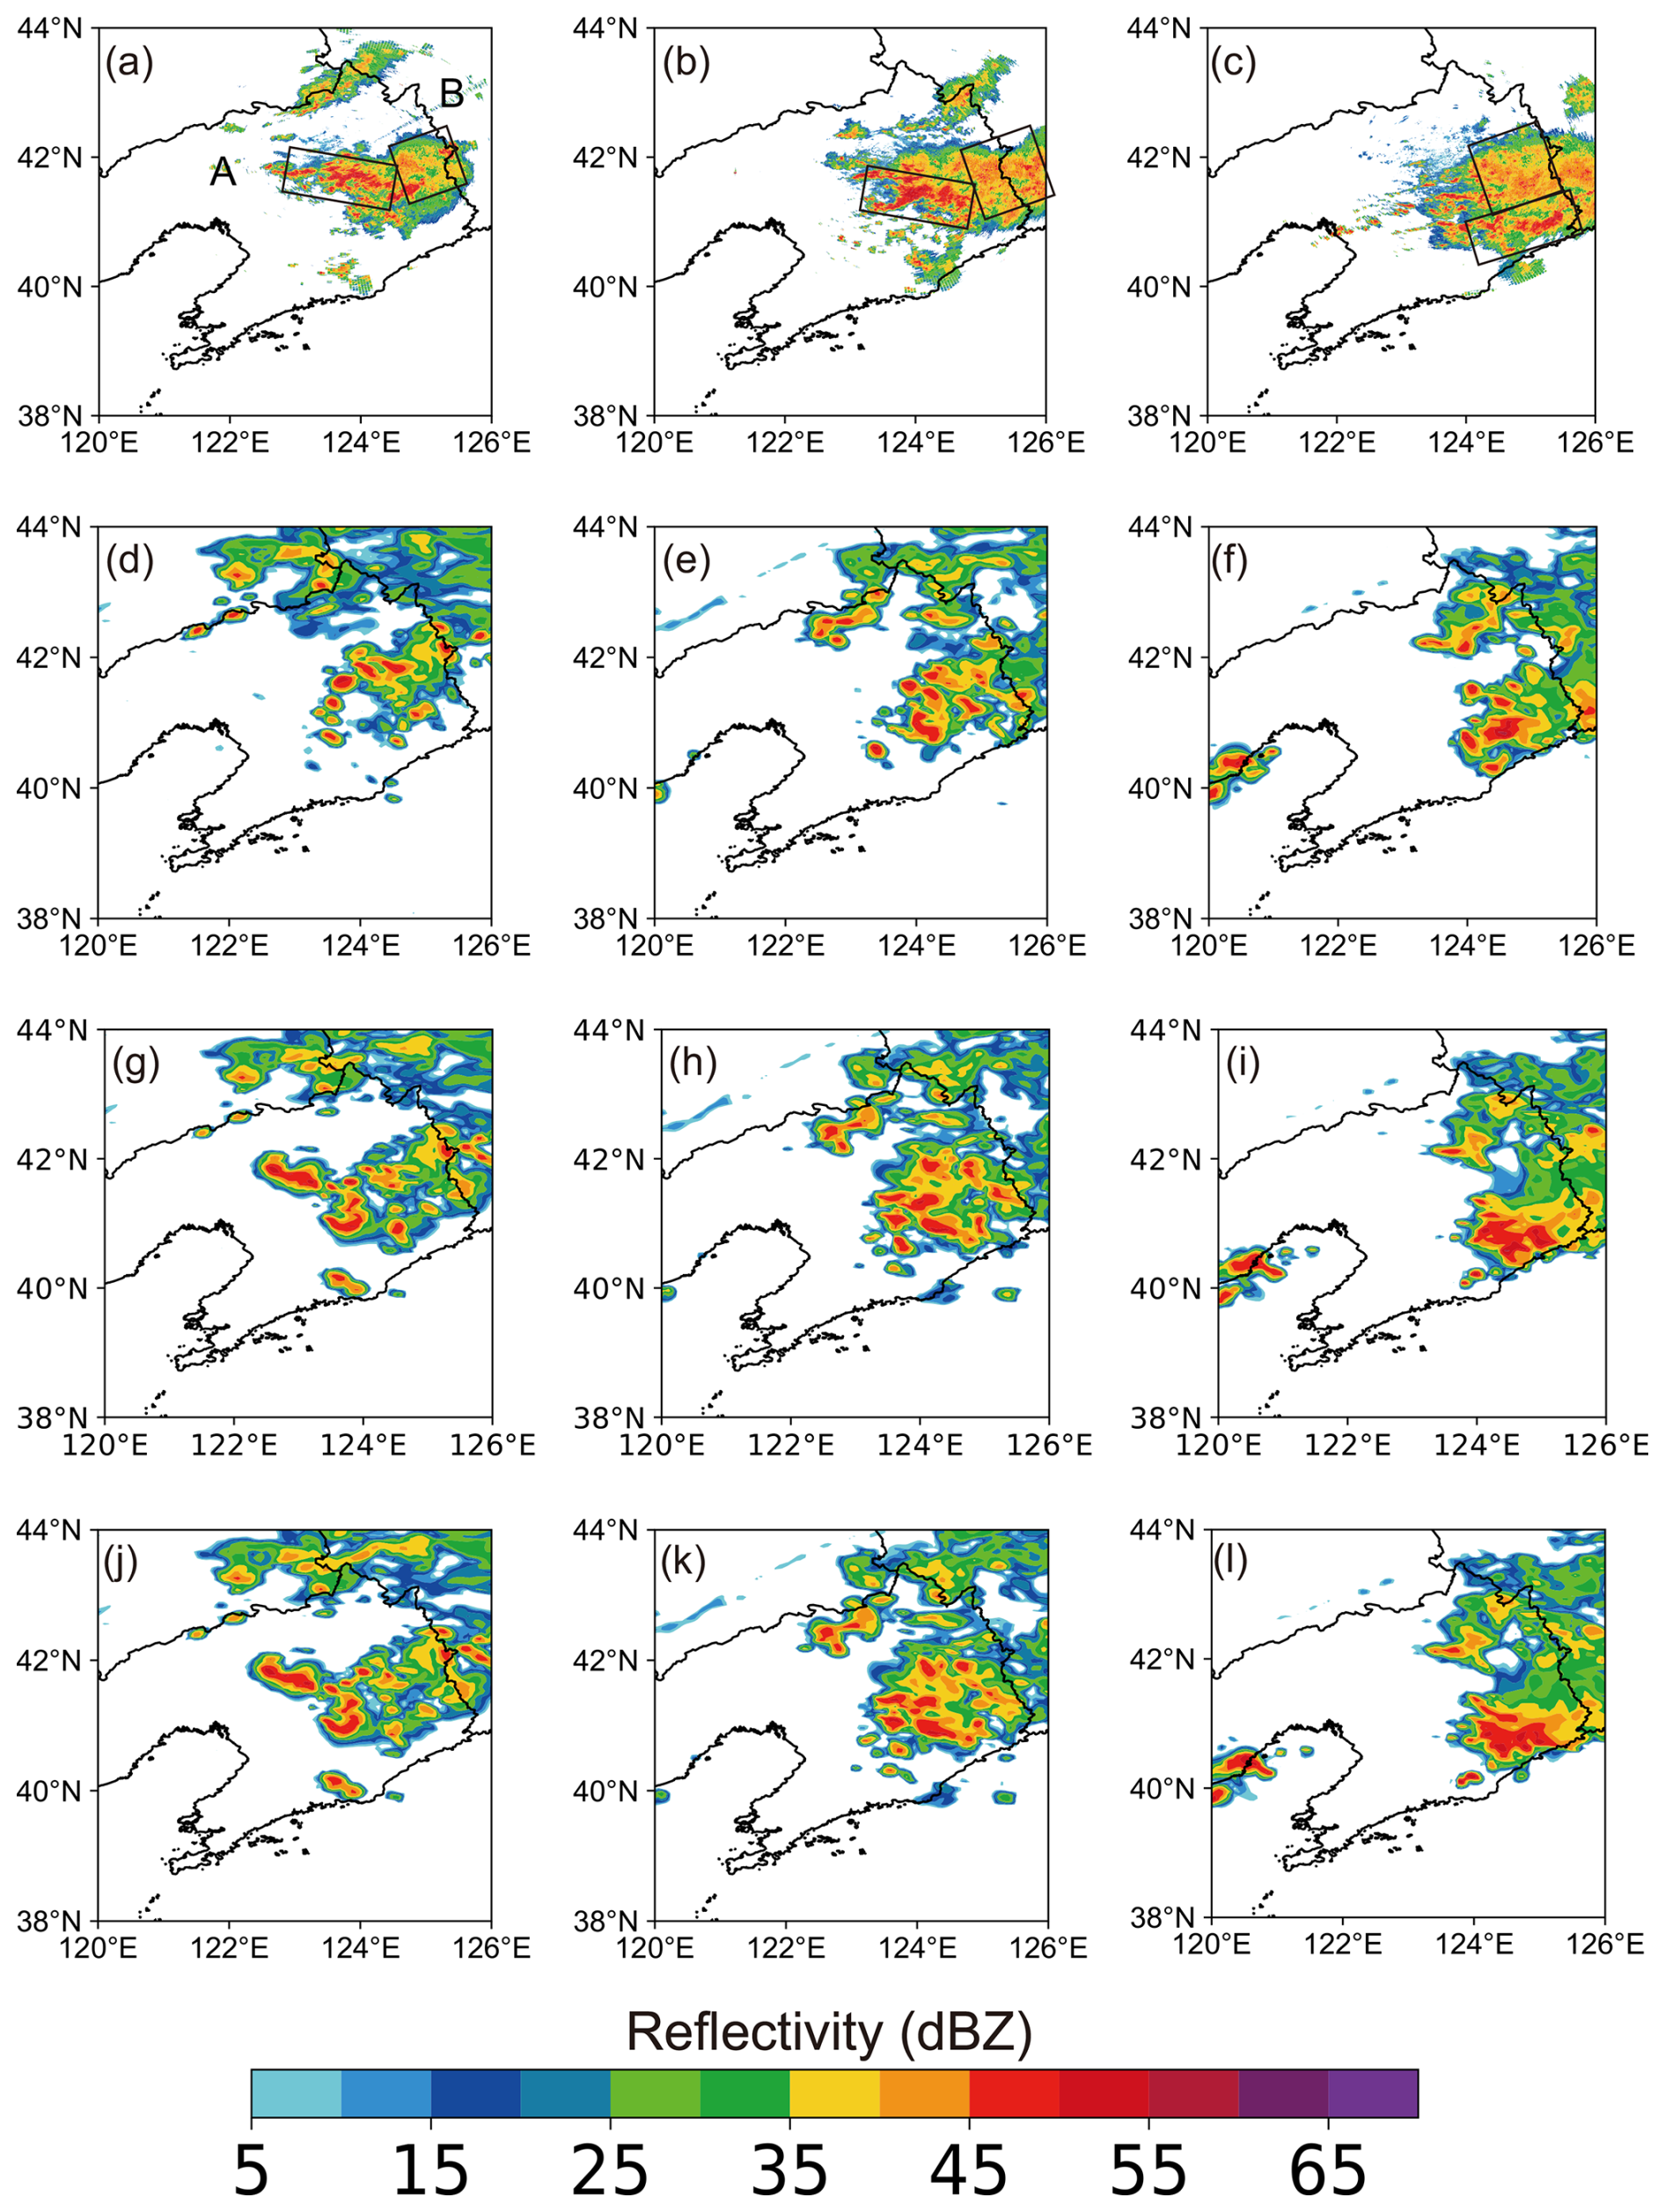
Figure 13The composite reflectivity (shaded; units: dBZ) predicted by (d)–(f) EXP_temp, (g)–(i) EXP_bg, and (j)–(l) EXP_temp-bg, as compared to (a)–(c) the observed composite reflectivity. The corresponding times from left to right are 22:00 UTC on 6 August (left), 00:00 UTC on 7 August (middle), and 02:00 UTC on 7 August (right), respectively. The labels A and B present the convection locations.
Figure 13 shows 1, 3, and 5 h forecasts initialized at 21:00 UTC on 6 August 2018 for EXP_temp, EXP_bg, and EXP_temp-bg. As can be seen from the observation, the strong echo is located near 42° N at the beginning and has a tendency to slowly develop to the east. For the sake of clarity, the strong echo zone is divided into two parts: part A and part B. At 22:00 UTC on 6 August, the forecasts of three DA experiments for part B are inconsistent with the observation in terms of the intensity. The part A predicted by EXP_bg and EXP_temp-bg shows a general agreement with the observation, while the radar reflectivity forecast of EXP_temp departs from the observation. At 00:00 UTC on 7 August, EXP_bg and EXP_temp-bg yield an improved forecast for part A and B as compared with EXP_temp, in terms of the intensity and organization. However, there is a southeast bias in part A predicted by both EXP_bg and EXP_temp-bg. Compared to EXP_bg, EXP_temp-bg provides more accurate predictions for part B. As shown by the observation at 02:00 UTC on 7 August, the predicted A in EXP_temp-bg shows closer alignment with the observation than that in EXP_temp and EXP_bg. For part B, three sets of experiments all depart from the observation. Overall, EXP_temp-bg demonstrates superior prediction skills in terms of the radar reflectivity.
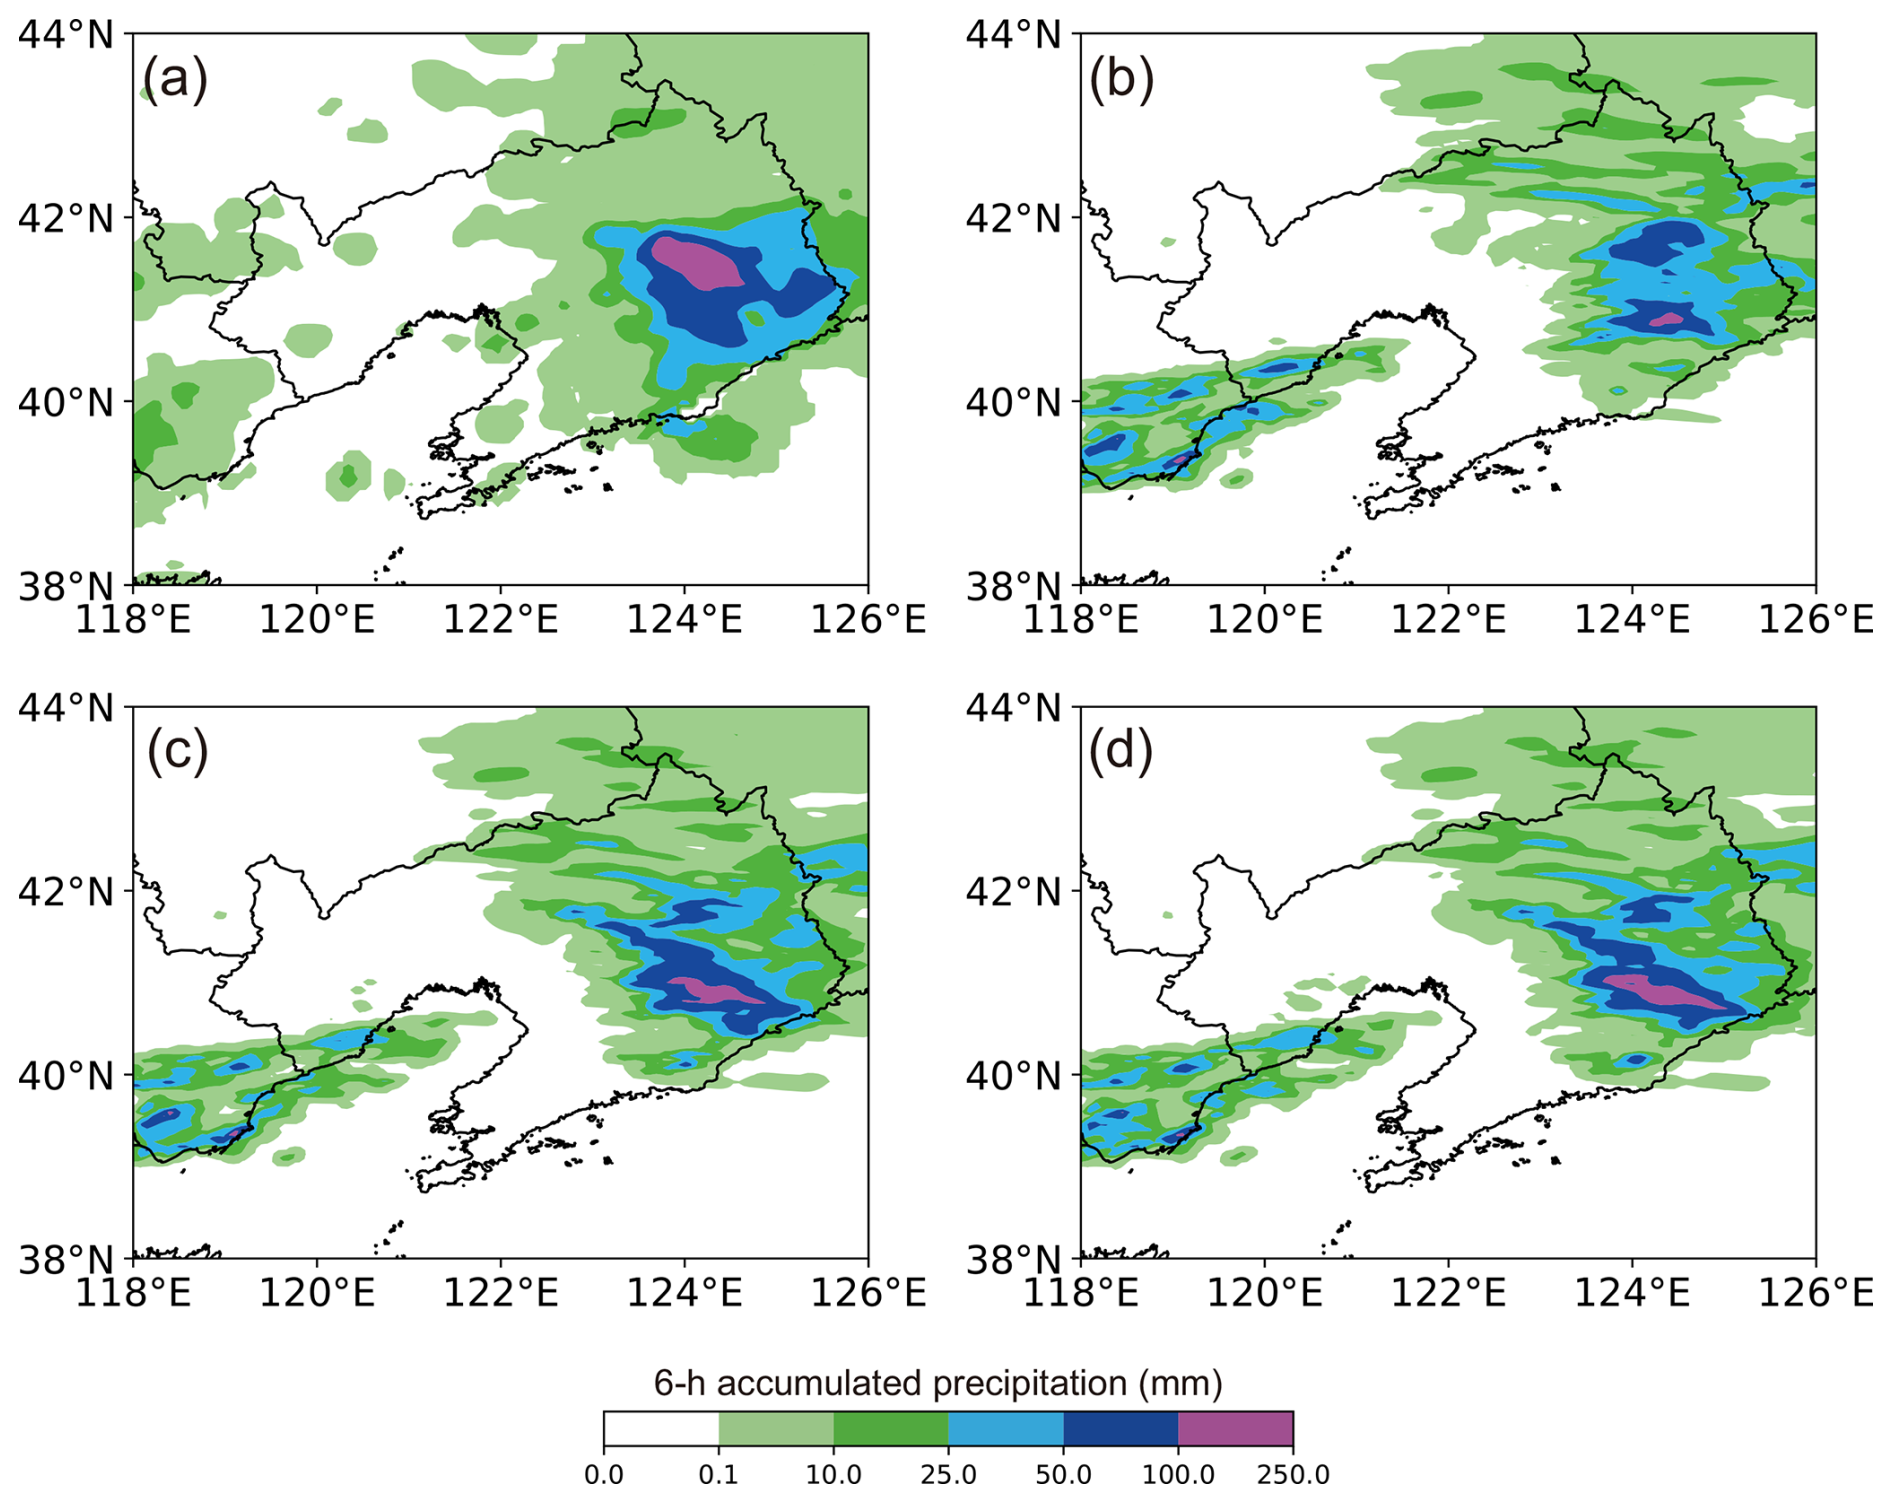
Figure 14Shown here is 6 h accumulated precipitation initialized at 21:00 UTC on 6 August 2018. (a) The observation, (b) EXP_temp, (c) EXP_bg, and (d) EXP_temp-bg.
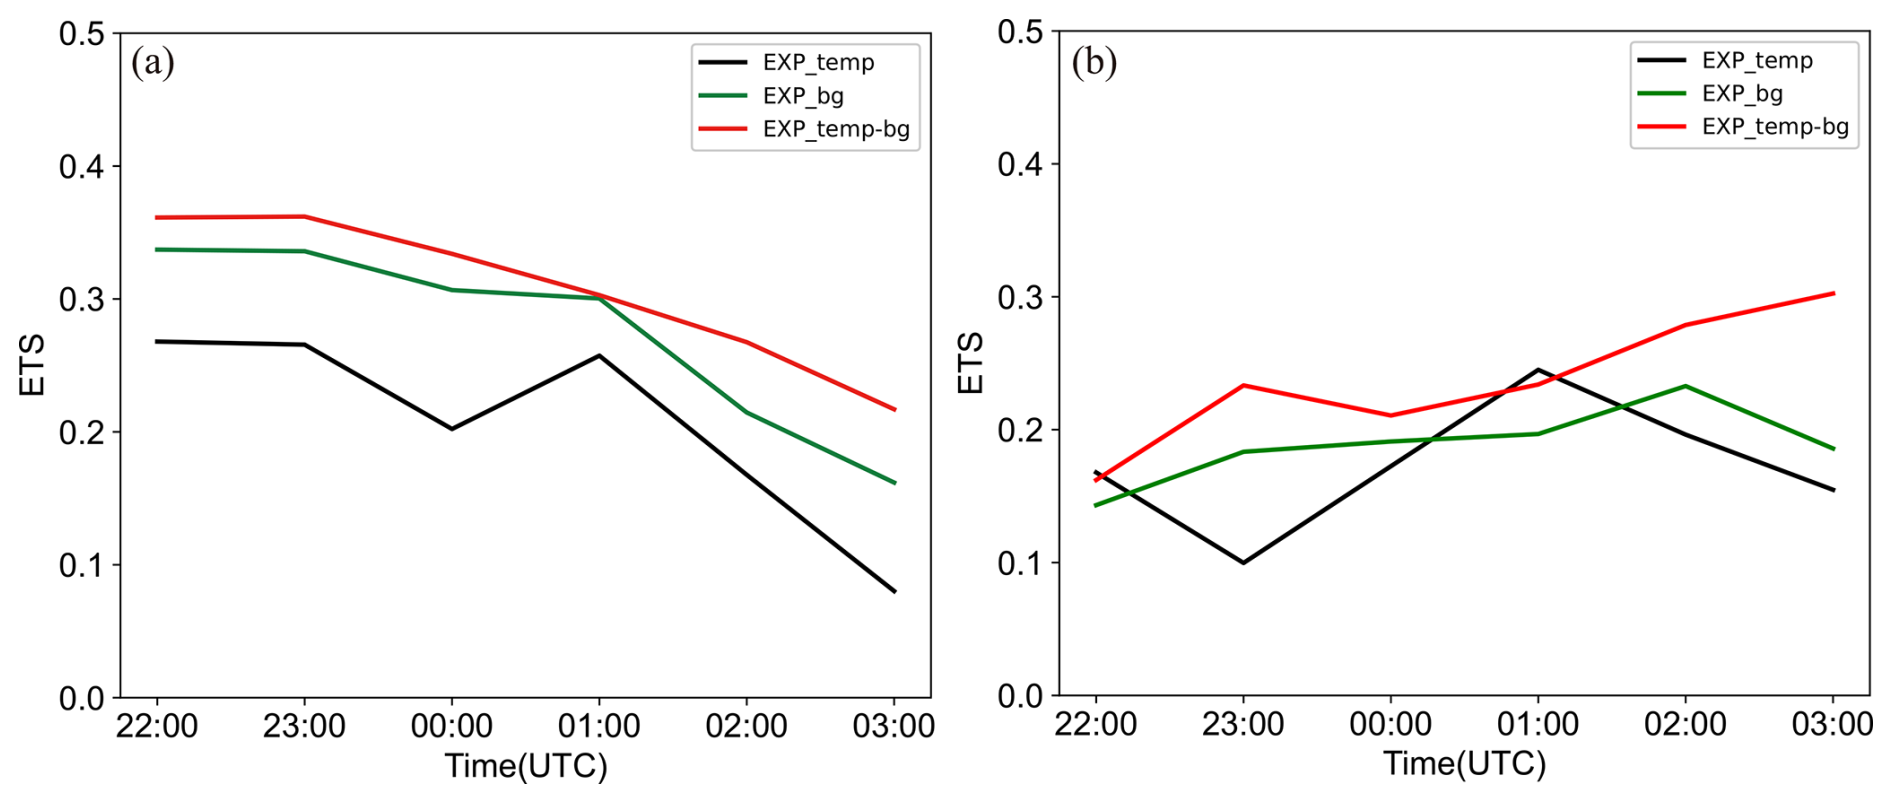
Figure 14 shows 6 h accumulated precipitation of the three DA experiments from 21:00 UTC on 6 August to 03:00 UTC on 7 August 2018. According to the observation, heavy rainfall is mainly concentrated in the northeastern part of Liaoning, with precipitation quantity exceeding 100 mm. All three experiments underestimate the extent of the precipitation in this event, especially in the range of 25 to 50 mm. Moreover, there is a certain deviation between the predicted and observed locations. As shown in Fig. 14c and d, the patterns of heavy precipitation areas are similar in EXP_bg and EXP_temp-bg. EXP_bg and EXP_temp-bg are notably better than EXP_temp in predicting the rainfall for the threshold 50 mm. EXP_temp-bg displays the best forecasting skill in terms of the heavy rainfall area.
Figure 15 shows ETS values of 1 h accumulated precipitation for EXP_temp, EXP_bg, and EXP_temp-bg. For the threshold of 2.5 mm h−1, the precipitation forecasts of EXP_temp-bg generally exhibit superior quality. The EXP_temp experiment consistently shows the lowest ETS scores among the three experiments. At the threshold of 10 mm h−1, the ETS score of EXP_temp-bg gradually increases in the later stages of the forecast. These results indicate that the blending method is able to improve the precipitation forecast skill.
The study proposes an adaptive hydrometeor retrieval scheme within the WRF-3DVar system, which combines “temperature-based” and “background hydrometer-dependent” methods to enhance analyses and forecasts for strong convections. In the indirect assimilation of radar reflectivity, it is vital to correctly divide hydrometeor information in radar reflectivity. On the basis of two retrieval methods proposed by Gao and Stensrud (2012) and Chen et al. (2020, 2021), the blending scheme is developed to minimize the limitations brought by both methods so as to improve the assimilation and prediction skills.
The three hydrometeor retrieval schemes above are evaluated for two strong convective processes that occurred during June 2020 and August 2018. Three DA experiments (EXP_temp, EXP_bg, and EXP_temp-bg) are conducted by using the “temperature-based”, “background hydrometer-dependent”, and blending methods, respectively. The analysis results reveal that the blending method is effective at improving the radar reflectivity structures for severe convections. Based on the other two DA experiments, EXP_temp-bg further improves hydrometeor structures and properly allocates the proportion of each hydrometeor, which is responsible for more reasonable hydrometeor distributions. Also, EXP_temp-bg provides more reasonable dynamics and thermal structures compared with EXP_temp and EXP_bg. EXP_temp-bg shows advantages in the precipitation prediction skills due to the reasonable spatial distribution and proportion of each hydrometeor.
Compared to conventional Doppler weather radars, dual-polarization radar observations provide more accurate identification of the three-dimensional microphysical structures within precipitation systems. Consequently, dual-polarization radar data (e.g. differential reflectivity, specific differential phase, correlation coefficient) will be considered for identifying the hydrometeor types more accurately, aiming to enhance the effectiveness of radar data assimilation.
The GFS reanalysis data are available at https://doi.org/10.5065/D65D8PWK (National Centers for Environmental Prediction/National Weather Service/NOAA/U.S. Department of Commerce, 2015), and the source code of WRF and WRFDA can be downloaded from https://github.com/wrf-model (last access: 22 September 2025; https://doi.org/10.5065/1dfh-6p97, Skamarock et al., 2019). The radar observations after quality control are provided by Jiangsu and Liaoning Provincial Meteorological Bureau, and the precipitation observations can be found at http://data.cma.cn/dataService/cdcindex/datacode/NAFP_CLDAS2.0_NRT/show_value/normal.html (last access: 22 September 2025; China Meteorological Administration).
LS: visualization, writing (original draft). FS: conceptualization, writing (review and editing). ZH: conceptualization, methodology. LY: writing (review and editing). DX: writing (review and editing). AS: visualization. JC: software.
The contact author has declared that none of the authors has any competing interests.
Publisher's note: Copernicus Publications remains neutral with regard to jurisdictional claims made in the text, published maps, institutional affiliations, or any other geographical representation in this paper. While Copernicus Publications makes every effort to include appropriate place names, the final responsibility lies with the authors.
This research has been supported by National Key R&D Program of China (grant no. 2024YFC2815702), Key Laboratory of Urban Meteorology, China Meteorological Administration, Beijing (grant no. LUM-2025-02), the China Meteorological Administration Tornado Key Laboratory (grant no. TKL202306), Natural Science Fund of Anhui Province of China (grant no. 2308085MD127), the Shanghai Typhoon Research Foundation (grant no. TFJJ202107), and the Chinese National Natural Science Foundation of China (grant no. G41805070). We acknowledge the High Performance Computing Center of Nanjing University of Information Science & Technology for their support of this work.
This research has been supported by National Key R&D Program of China (grant no. 2024YFC2815702), Key Laboratory of Urban Meteorology, China Meteorological Administration, Beijing (grant no. LUM-2025-02), the China Meteorological Administration Tornado Key Laboratory (grant no. TKL202306), Natural Science Fund of Anhui Province of China (grant no. 2308085MD127), the Shanghai Typhoon Research Foundation (grant no. TFJJ202107), and the Chinese National Natural Science Foundation of China (grant no. G41805070).
This paper was edited by Dan Li and reviewed by two anonymous referees.
Bick, T., Simmer, C., Trömel, S., Wapler, K., Hendricks Franssen, H. J., Stephan, K., Blahak, U., Schraff, C., Reich, H., Zeng, Y., and Potthast, R.: Assimilation of 3D radar reflectivities with an ensemble Kalman filter on the convective scale, Q. J. Roy. Meteor. Soc., 142, 1490–1504, https://doi.org/10.1002/qj.2751, 2016.
Borderies, M., Caumont, O., Delanoë, J., Ducrocq, V., Fourrié, N., and Marquet, P.: Impact of airborne cloud radar reflectivity data assimilation on kilometre-scale numerical weather prediction analyses and forecasts of heavy precipitation events, Nat. Hazards Earth Syst. Sci., 19, 907–926, https://doi.org/10.5194/nhess-19-907-2019, 2019.
Chen, F. and Dudhia, J.: Coupling an advanced land surface-hydrology model with the Penn State-NCAR MM5 modeling system. Part I: Model implementation and sensitivity, Mon. Weather Rev., 129, 569–585, https://doi.org/10.1175/1520-0493(2001)129<0569:CAALSH>2.0.CO;2, 2001.
Chen, H., Chen, Y., Gao, J., Sun, T., and Carlin, J. T.: A radar reflectivity data assimilation method based on background-dependent hydrometeor retrieval: An observing system simulation experiment, Atmos. Res., 243, 105022, https://doi.org/10.1016/j.atmosres.2020.105022, 2020.
Chen, H., Gao, J., Wang, Y., Chen, Y., Sun, T., Carlin, J., and Zheng, Y.: Radar reflectivity data assimilation method based on background-dependent hydrometeor retrieval: Comparison with direct assimilation for real cases, Q. J. Roy. Meteor. Soc., 147, 2409–2428, https://doi.org/10.1002/qj.4031, 2021.
Chen, J., Xu, D., Shu, A., and Song, L.: The Impact of Radar Radial Velocity Data Assimilation Using WRF-3DVAR System with Different Background Error Length Scales on the Forecast of Super Typhoon Lekima (2019), Remote Sens., 15, 2592, https://doi.org/10.3390/rs15102592, 2023.
China Meteorological Administration: Near-real-time product data set of land data assimilation system (CLDAS-V2.0) of China Meteorological Bureau, Near-real-time product data set of land data assimilation system (CLDAS-V2.0) of China Meteorological Bureau [data set], http://data.cma.cn/dataService/cdcindex/datacode/NAFP_CLDAS2.0_NRT/show_value/normal.html (last access: 22 September 2025), 2017.
Courtier, P., Thépaut, J. N., and Hollingsworth, A.: A strategy for operational implementation of 4D-Var, using an incremental approach, Q. J. Roy. Meteor. Soc., 120, 1367–1387, https://doi.org/10.1002/qj.49712051912, 1994.
Dawson, D. T., Xue, M., Milbrandt, J. A., and Shapiro, A.: Sensitivity of real-data simulations of the 3 May 1999 Oklahoma City tornadic supercell and associated tornadoes to multimoment microphysics, Part I: Storm-and tornado-scale numerical forecasts, Mon. Weather Rev., 143, 2241–2265, https://doi.org/10.1175/MWR-D-14-00279.1, 2015.
Dowell, D. C., Wicker, L. J., and Snyder, C.: Ensemble Kalman filter assimilation of radar observations of the 8 May 2003 Oklahoma City supercell: Influences of reflectivity observations on storm-scale analyses, Mon. Weather Rev., 139, 272–294, https://doi.org/10.1175/2010MWR3438.1, 2011.
Dudhia, J.: Numerical study of convection observed during the winter monsoon experiment using a mesoscale, two-dimensional model, J. Atmos. Sci., 46, 3077–3107, https://doi.org/10.1175/1520-0469(1989)046<3077:NSOCOD>2.0.CO;2, 1989.
Evensen, G.: Sequential data assimilation with a nonlinear quasi-geostrophic model using Monte Carlo methods to forecast error statistics, J. Geophys. Res.-Oceans, 99, 10143–10162, https://doi.org/10.1029/94JC00572, 1994.
Gao, J. and Stensrud, D. J.: Assimilation of reflectivity data in a convective-scale, cycled 3DVAR framework with hydrometeor classification, J. Atmos. Sci., 69, 1054–1065, https://doi.org/10.1175/JAS-D-11-0162.1, 2012.
Gao, J., Xue, M., Brewster, K., and Droegemeier, K. K.: A three-dimensional variational data analysis method with recursive filter for Doppler radars, J. Atmos. Ocean. Tech., 21, 457–469, https://doi.org/10.1175/1520-0426(2004)021<0457:ATVDAM>2.0.CO;2, 2004.
Gustafsson, N., Janjić, T., Schraff, C., Leuenberger, D., Weissmann, M., Reich, H., Brousseau, P., Montmerle, T., Wattrelot, E., Bučánek, A., Mile, M., Hamdi, R., Lindskog, M., Barkmeijer, J., Dahlbom, M., Macpherson, B., Ballard, S., Inverarity, G., Carley, J., Alexander, C., Dowell, D., Liu, S., Ikuta, Y., and Fujita, T.: Survey of data assimilation methods for convective-scale numerical weather prediction at operational centres, Q. J. Roy. Meteor. Soc., 144, 1218–1256, https://doi.org/10.1002/qj.3179, 2017.
Hong, S. Y., Noh, Y., and Dudhia, J.: A new vertical diffusion package with an explicit treatment of entrainment processes, Mon. Weather Rev., 134, 2318–2341, https://doi.org/10.1175/MWR3199.1, 2006.
Hu, M., Xue, M., and Brewster, K.: 3DVAR and cloud analysis with WSR-88D level-II data for the prediction of the Fort Worth, Texas, tornadic thunderstorms. Part I: Cloud analysis and its impact, Mon. Weather Rev., 134, 675–698, https://doi.org/10.1175/MWR3092.1, 2006.
Huang, L., Xu, D., Li, H., Jiang, L., and Shu, A.: Assimilating FY-3D MWHS2 Radiance Data to Predict Typhoon Muifa Based on Different Initial Background Conditions and Fast Radiative Transfer Models, Remote Sens., 15, 3220, https://doi.org/10.3390/rs15133220, 2023.
Kain, J. S., Xue, M., Coniglio, M. C., Weiss, S. J., Kong, F., Jensen, T. L., Brown, B. G., Gao, J., Brewster, K., Thomas, K. W., Wang, Y., Schwartz, C S., and Levit, J. J.: Assessing advances in the assimilation of radar data and other mesoscale observations within a collaborative forecasting-research environment, Weather Forecast., 25, 1510–1521, https://doi.org/10.1175/2010WAF2222405.1, 2010.
Kong, R., Xue, M., and Liu, C.: Development of a hybrid En3DVar data assimilation system and comparisons with 3DVar and EnKF for radar data assimilation with observing system simulation experiments, Mon. Weather Rev., 146, 175–198, https://doi.org/10.1175/MWR-D-17-0164.1, 2018.
Kong, R., Xue, M., Liu, C., and Jung, Y. : Comparisons of hybrid En3DVar with 3DVar and EnKF for radar data assimilation: Tests with the 10 May 2010 Oklahoma tornado outbreak, Mon. Weather Rev., 149, 21–40, https://doi.org/10.1175/MWR-D-20-0053.1, 2020.
Li, X., Ming, J., Wang, Y., Zhao, K., and Xue, M.: Assimilation of T-TREC-retrieved wind data with WRF 3DVAR for the short-term forecasting of typhoon Meranti (2010) near landfall, J. Geophys. Res.-Atmos., 118, 10–361, https://doi.org/10.1002/jgrd.50815, 2013.
Li, X., Zeng, M., Wang, Y., Wang, W., Wu, H., and Mei, H.: Evaluation of two momentum control variable schemes and their impact on the variational assimilation of radar wind data: Case study of a squall line, Adv. Atmos. Sci., 33, 1143–1157, https://doi.org/10.1007/s00376-016-5255-3, 2016.
Lindskog, M., Salonen, K., Järvinen, H., and Michelson, D. B.: Doppler radar wind data assimilation with HIRLAM 3DVAR, Mon. Weather Rev., 132, 1081–1092, https://doi.org/10.1175/1520-0493(2004)132<1081:DRWDAW>2.0.CO;2, 2004.
Lilly, D. K.: Numerical prediction of thunderstorms-Has its time come?, Q. J. Roy. Meteor. Soc., 116, 779–798, https://doi.org/10.1002/qj.49711649402, 1990.
Liu, C., Xue, M., and Kong, R.: Direct assimilation of radar reflectivity data using 3DVAR: Treatment of hydrometeor background errors and OSSE tests, Mon. Weather Rev., 147, 17–29, https://doi.org/10.1175/MWR-D-18-0033.1, 2019.
Lopez, P.: Direct 4D-Var assimilation of NCEP stage IV radar and gauge precipitation data at ECMWF, Mon. Weather Rev., 139, 2098–2116, https://doi.org/10.1175/2010MWR3565.1, 2011.
Mlawer, E., Taubman, S., Brown, P., Iacono, M. J., and Clough, S. A.: Radiative transfer for inhomogeneous atmospheres: RRTM, a validated correlated-k model for the longwave, J. Geophys. Res.-Atmos., 102, 16663–16682, https://doi.org/10.1029/97JD00237, 1997.
National Centers for Environmental Prediction/National Weather Service/NOAA/U.S. Department of Commerce: NCEP GFS 0.25 Degree Global Forecast Grids Historical Archive, updated daily, Research Data Archive at the National Center for Atmospheric Research, Computational and Information Systems Laboratory [data set], https://doi.org/10.5065/D65D8PWK, 2015.
Navon, I. M.: Data assimilation for numerical weather prediction: a review. Data assimilation for atmospheric, Oceanic and hydrologic applications, Springer, 21–65, https://doi.org/10.1007/978-3-540-71056-1_2, 2009.
Parrish, D. F. and Derber, J. C.: The National Meteorological Center's spectral statistical-interpolation analysis system, Mon. Weather Rev., 120, 1747–1763, https://doi.org/10.1175/1520-0493(1992)120<1747:TNMCSS>2.0.CO;2, 1992.
Schenkman, A. D., Xue, M., Shapiro, A., Brewster, K., and Gao, J.: The analysis and prediction of the 8-9 May 2007 Oklahoma tornadic mesoscale convective system by assimilating WSR-88D and CASA radar data using 3DVAR, Mon. Weather Rev., 139, 224–246, https://doi.org/10.1175/2010MWR3336.1, 2011.
Shen, F., Min, J., and Xu, D.: Assimilation of radar radial velocity data with the WRF Hybrid ETKF–3DVAR system for the prediction of Hurricane Ike (2008), Atmos. Res., 169, 127–138, https://doi.org/10.1016/j.atmosres.2015.09.019, 2016.
Shen, F., Xu, D., and Min, J.: Effect of momentum control variables on assimilating radar observations for the analysis and forecast for Typhoon Chanthu (2010), Atmos. Res., 234, 104771, https://doi.org/10.1016/j.atmosres.2019.104622, 2019.
Shen, F., Xu, D., Li, H., and Liu, R.: Impact of radar data assimilation on a squall line over the Yangtze–Huaihe River Basin with a radar reflectivity operator accounting for ice-phase hydrometeors, Meteorol. Appl., 28, e1967, https://doi.org/10.1002/met.1967, 2020a.
Shen, F., Xu, D., Min, J., Chu, Z., and Li, X.: Assimilation of radar radial velocity data with the WRF hybrid 4DEnVar system for the prediction of hurricane Ike (2008), Atmos. Res., 234, 104771, https://doi.org/10.1016/j.atmosres.2019.104771, 2020b.
Shen, F., Min, J., Li, H., Xu, D., Shu, A., Zhai, D., Guo, Y., and Song, L.: Applications of radar data assimilation with hydrometeor control variables within the WRFDA on the prediction of landfalling hurricane IKE (2008), Atmosphere, 12, 853, https://doi.org/10.3390/atmos12070853, 2021.
Shen, F., Song, L., Li, H., He, Z., and Xu, D.: Effects of different momentum control variables in radar data assimilation on the analysis and forecast of strong convective systems under the background of northeast cold vortex, Atmos. Res., 280, 106415, https://doi.org/10.1016/j.atmosres.2022.106415, 2022.
Shen, F., Shu, A., Min, J., Wu, Z., Wang, Y., Xu, D., Chen, J., and Wan, S.: Assimilation of dual-pol radar KDP observations with the GSI ensemble Kalman filter for the analysis and prediction of a squall line, J. Geophys. Res.-Atmos., 130, e2024JD041933, https://doi.org/10.1029/2024JD041933, 2025a.
Shen, F., Wan, S., Li, H., Luo, J., He, Z., Fei, H., Song, L., Sun, Q., Xu, D., and Chen, J.: Data assimilation of weather radar reflectivity with a blending hydrometer retrieval scheme for two convective storms in East China, Atmos. Res., 321, 108110, https://doi.org/10.1016/j.atmosres.2025.108110, 2025b.
Simonin, D., Ballard, S. P., and Li, Z.: Doppler radar radial wind assimilation using an hourly cycling 3D-Var with a 1.5 km resolution version of the Met Office Unified Model for nowcasting, Q. J. Roy. Meteor. Soc., 140, 2298–2314, https://doi.org/10.1002/qj.2298, 2014.
Skamarock, W. C., Klemp, J. B., Dudhia, J., Gill, D. O., Liu, Z., Berner, J., Wang, W., Powers, J. G., Duda, M. G., Barker, D. M., and Huang, X.-Y.: A Description of the Advanced Research WRF Version 4, NCAR Tech. Note NCAR/TN-556+STR [code], https://doi.org/10.5065/1dfh-6p97 (last access: 22 September 2025), 2019.
Sun, J. and Crook, N. A.: Dynamical and microphysical retrieval from Doppler radar observations using a cloud model and its adjoint. Part I: Model development and simulated data experiments, J. Atmos. Sci., 54, 1642–1661, https://doi.org/10.1175/1520-0469(1997)054<1642:DAMRFD>2.0.CO;2, 1997.
Sun, J., Xue, M., Wilson, J. W., Zawadzki, I., Ballard, S. P., Onvlee-Hooimeyer, J., Joe, P., Barker, D. M., Li, W. P., Golding, B., Xu, M., and Pinto, J.: Use of NWP for nowcasting convective precipitation: Recent progress and challenges, B. Am. Meteor. Soc., 95, 409–426, https://doi.org/10.1175/BAMS-D-11-00263.1, 2014.
Tong, C. C., Jung, Y., Xue, M., and Liu, C.: Direct assimilation of radar data with ensemble Kalman filter and hybrid ensemble-variational method in the National Weather Service operational data assimilation system GSI for the stand-alone regional FV3 model at a convection-allowing resolution, Geophys. Res. Lett., 47, e2020GL090179, https://doi.org/10.1029/2020GL090179, 2020.
Tong, M. and Xue, M.: Ensemble Kalman filter assimilation of Doppler radar data with a compressible nonhydrostatic model: OSS experiments, Mon. Weather Rev., 133, 1789–1807, https://doi.org/10.1175/MWR2898.1, 2005.
Wan, S., Shen, F., Chen, J., Liu, L., Dong, D., and He, Z.: Evaluation of Two Momentum Control Variable Schemes in Radar Data Assimilation and Their Impact on the Analysis and Forecast of a Snowfall Case in Central and Eastern China, Atmosphere, 15, 342, https://doi.org/10.3390/atmos15030342, 2024.
Wang, H., Sun, J., Fan, S., and Huang, X.: Indirect assimilation of radar reflectivity with WRF 3D-Var and its impact on prediction of four summertime convective events, J. Appl. Meteor. Clim., 52, 889–902, https://doi.org/10.1175/JAMC-D-12-0120.1, 2013a.
Wang, H., Sun, J., Zhang, X., Huang, X. Y., and Auligné, T.: Radar data assimilation with WRF 4D-Var. Part I: System development and preliminary testing, Mon. Weather Rev., 141, 2224–2244, https://doi.org/10.1175/MWR-D-12-00168.1, 2013b.
Xiao, Q., Kuo, Y. H., Sun, J., Lee, W. C., Lim, E., Guo, Y. R., and Barker, D. M.: Assimilation of Doppler radar observations with a regional 3DVAR system: Impact of Doppler velocities on forecasts of a heavy rainfall case, J. Appl. Meteor., 44, 768–788, https://doi.org/10.1175/JAM2248.1, 2005.
Xiao, Q., Kuo, Y. H., Sun, J., Lee, W. C., Barker, D. M., and Lim, E.: An approach of radar reflectivity data assimilation and its assessment with the inland QPF of Typhoon Rusa (2002) at landfall, J. Appl. Meteor. Clim., 46, 14–22, https://doi.org/10.1175/JAM2439.1, 2007.
Xu, D., Shen, F., and Min, J.: Effect of adding hydrometeor mixing ratios control variables on assimilating radar observations for the analysis and forecast of a typhoon, Atmosphere, 10, 415, https://doi.org/10.3390/atmos10070415, 2019.
Xu, D., Shu, A., Li, H., Shen, F., Li, Q., and Su, H.: Effects of Assimilating Clear-Sky FY-3D MWHS2 Radiance on the Numerical Simulation of Tropical Storm Ampil, Remote Sens., 13, 2873, https://doi.org/10.3390/rs13152873, 2021.
Xu, D., Yang, G., Wu, Z., Shen, F., Li, H., and Zhai, D.: Evaluate radar data assimilation in two momentum control variables and the effect on the forecast of southwest China vortex precipitation, Remote Sens., 14, 3460, https://doi.org/10.3390/rs14143460, 2022.
Zhao, K., Li, X., Xue, M., Jou, B. J. D., and Lee, W. C.: Short-term forecasting through intermittent assimilation of data from Taiwan and mainland China coastal radars for Typhoon Meranti (2010) at landfall, J. Geophys. Res.-Atmos., 117, https://doi.org/10.1029/2011JD017109, 2012.