the Creative Commons Attribution 4.0 License.
the Creative Commons Attribution 4.0 License.
 | 10 Sep 2025
Anatomy of a Flash Flood in a Hyperarid Environment: From Atmospheric Masses to Sediment Dispersal in the Sea
Akos Kalman
Timor Katz
Miklos Vincze
Jake Longenecker
Alysse Mathalon
Paul Hill
Beverly Goodman-Tchernov
Flash floods in rivers near hyper-arid coastlines impact both land and marine environments, from recharging groundwater and supporting desert ecosystems to affecting marine water quality, organisms, and substrates. Few studies, however, have followed these events from atmospheric origins to marine effects. This study tracked a desert flash flood in October 2016 in Eilat, capturing stages from atmospheric conditions to sediment distribution at sea. Observations included satellite data, meteorological reports, floodwater discharge, and sediment levels from the Kinnet Canal outlet, alongside offshore turbidity and salinity data. Our findings indicate that a weakened polar vortex amplified a Rossby wave, triggering convective instability over the Eastern Mediterranean and northern Red Sea. In Eilat (mean annual rainfall = 27 mm, SD = 21 mm), 128 % of the average fell within hours, with the flood reaching the sea approximately 50 h later and lasting 27 h. Around 25 000 t of sediment were discharged, causing offshore salinity drops (up to 1.75 ‰ below the seawater background) and fluctuations of suspended sediment concentrations due to varying flow rates. In turn, particle dispersal in the sea switched several times between hypopycnal (surface) and hyperpycnal (bottom) flows. These findings link the different stages of the flood and their cascading effects from air masses to sedimentary processes in the sea.
- Article
(11972 KB) - Full-text XML
-
Supplement
(8733 KB) - BibTeX
- EndNote


-
A hyperarid desert flash flood is described and documented in situ from its meteorological development to arriving into the offshore
-
Flood triggered by weak polar vortex, amplified Rossby wave, causing intense rainfall in Eilat
-
Flood discharged 25 000 t of sediment within freshwater outflow, altering salinity and sediment concentrations in the sea
-
Sediment dispersal outflow alternated between hypopycnal and hyperpycnal flows due to shifting flood dynamics and related sediment concentrations
1.1 Background
A large portion of continental shelf sediments in the shallow offshore originate from terrestrial sources delivered through rivers (Syvitski et al., 2005). In higher precipitation regions it arrives primarily through large perennial rivers, while in drier climates, such as deserts, fluvial sediments are often delivered via ephemeral rivers during sporadic precipitation events that may produce flash floods (Cohen and Laronne, 2005).
Flash flood events are crucial for both sustaining desert terrestrial ecosystems (Gee and Hillel, 1988; Hereford et al., 2006) and enriching marine systems with essential nutrients and sediments, thereby altering the physical, chemical, and biological dynamics of coastal shelf ecosystems (Hickey et al., 2010). Rainfall in desert regions is typically short-lived, sometimes robust, spatiotemporally sporadic, and capable of evolving into flashfloods (Sharon, 1972). From a human perspective, these floods may cause property damage, loss of life, and disruptions to transportation and other infrastructure (Haggag and El-Badry, 2013). For instance, between 1900 and 2016, 39 severe floods in the Middle East – spanning Egypt, Israel, Jordan and Saudi Arabia – caused over 1500 fatalities and directly impacted around 300 000 people (de Vries et al., 2018).
Historically, cities along hyperarid coastlines were rare, but this has changed dramatically in recent decades (Neumann et al., 2015). Technological advancements, including desalination plants, air-conditioned buildings, and refrigerated freight containers, have facilitated the growth of cities worldwide in these less habitable locations (Barragán and de Andrés, 2015; Holdren and Ehrlich, 1974; Small and Nicholls, 2003). However, despite these advances, flood risk due to their relative rarity and unpredictability, remains an issue.
Flood forecasts generally rely on predictions of heavy precipitation, yet in hyperarid areas, rainfall is highly variable. This variability complicates the ability to predict whether the accumulation of runoff from different adjacent catchments will lead to coastal flashfloods, thereby posing challenges for early warnings and preparations in low-lying coastal cities (Cools et al., 2012). Understanding the specific processes and conditions that lead to, or do not lead to, flashflood and related fluvial sediment discharge is essential for improving forecast accuracy and flood preparedness.
Principally, in arid coastlines, the deposition of fluvial sediment into the sea represents the culmination of a series of interconnected events. These stages can be summarized as follows: (1) atmospheric conditions leading to precipitation, (2) the occurrence of precipitation, (3) the drainage of water through the watershed, (4) the formation of flash floods, (5) the transportation of water and sediments to the coastline, (6) the discharge of these elements from the coastal outlet into the sea, and (7) the subsequent dispersal and deposition within the marine environment (Cohen and Laronne, 2005; Kalman et al., 2020, 2022; Katz et al., 2015; Mathalon et al., 2019; Mulder et al., 2003; Reid and Frostick, 1987). While aspects of these stages have been the subject of research (Allison et al., 2012; Blum and Törnqvist, 2000; Merz et al., 2021; Mullenbach and Nittrouer, 2000), comprehensive studies tracing the entire sequence for a specific event are lacking. Developing a framework that traces the entire sequence of events during a single flood can serve as a model for understanding similar processes in other arid coastal systems, even when only partial or less detailed data are available. Such a methodology could enhance our broader understanding of sediment dynamics and support environmental management, ecological conservation, urban planning in coastal deserts, and natural hazard assessment.
The aims of this study were (1) to capture the full sequence of a desert flood from meteorological precursors to eventual sediment discharge from an ephemeral coastal river and its dispersal in the sea; (2) to assess the dependence or relationship between parts of the sequence and their outcomes, and (3) to track and identify specific atmospheric antecedent conditions that contributed to the triggering mechanism of the flash flood.
To achieve these aims, we integrated records from regional meteorological data with in-situ environmental measurements of salinity, turbidity, temperature, and surficial water velocity preceding and during a flash flood event that discharged into the northern Red Sea/southern Negev Desert of Israel.
1.2 Previous Atmospheric and Precipitation studies
For decades, there has long been an interest in the linkages between meteorological conditions and resulting floods (El-Fandy, 1948). One of the earliest studies on meteorological trends and flooding was conducted by Ashbel (1938), who described several extreme precipitation and flooding events in Rutbah, Damascus, the Dead Sea and the Sinai Peninsula. The events occurred with the northward propagation of the Red Sea Trough, and descending cold air from the north.
At present, based on nearly 70 years of data reanalysis, the RST is 96 % originated from Sudan (Awad et al., 2016), and is known to be the most active during the autumn and winter (Alpert et al., 2004a; Saaroni et al., 2020). Also, it is usually accompanied by upper-level westerlies or by an anticyclonic flow (Tsvieli and Zangvil, 2005); but under these conditions the RST is a dry system with no rain. Southeasterly winds blow the air over the sandy basins of Saudi Arabia, Iraq, and Syria, a process that often triggers aeolian transport of sediment towards the Eastern Mediterranean (Dayan et al., 2008). However, no single synoptic feature is solely responsible for the development of heavy rainfall over the Levant.
Kahana et al. (2002) labeled a thunderstorm producing RST as an “Active RST” (ARST). Krichak and Alpert (1998) outlined a sequence that leads to the formation of these storms: moisture transport from equatorial Africa (1), followed by convection (2), and intensification of The Subtropical Jet Stream (3) thus enhancing RST expansion (4) and related moisture (5) towards the Levant. A detailed analysis of a severe October 1997 ARST event by Dayan et al. (2001) confirmed stages (2), (3) and (5). Other studies (Dayan et al., 2001, 2021; Kahana et al., 2002; De Vries et al., 2013; Ziv et al., 2005) emphasize the significant role of mid-latitude upper-level troughs in amplifying instability and driving rainfall.
Ziv et al. (2022) identified climatological precursors for cyclogenesis associated with the RST extending toward the Levant. Using automated cyclone tracking (Hochman et al., 2020; Ziv et al., 2015) from 1979 to 2017, they identified four patterns of upper-level trough approaching the Eastern Mediterranean: (1) a cyclone crossing the Levant from the southwest, (2) a trough from the northeast, (3) a trough from the west, and (4) scenarios without upper-level support. Notably, in the second category, intense rainfalls occured, driven by cold advection resembling a polar intrusion, which greatly increases static instability over the Levant.
1.3 Runoff and flood development in the hyperarid GAE
Short-lived, but intense rainfall sometimes occurs over the terrestrial drainage in the hyperarid landscape surrounding the Gulf of Aqaba-Eilat (GAE). Within hours, this water runoff may accumulate in the otherwise dry riverbeds (wadis), and if the water volume that accumulates is large enough, it can produce a flashflood. Lack of vegetation and poor soil development with low permeability (Cohen and Laronne, 2005, and references therein) also contributes to the prompt development of floods. The time between rainfall and initiation of the flooding depends on storm intensity, duration, catchment size and which part of the catchment receives the rain. Because of the temporally sporadic nature of the rain events, sometimes years can pass between consecutive events in the same drainage system. These extended non-flood periods allow for surface weathering processes to dominate (and dust to settle), leaving ample sediment available when rains do arrive (Cohen and Laronne, 2005). Therefore, the emerging floods have high concentrations of suspended sediment that may even increase towards the terminal basins owing to transmission loss (Shentsis et al., 2001).
A sequence of instrument gauge stations was first installed in the southern Arava desert in 1966, set along ephemeral streams such as Nahal Yael (2 km long, 0.6 km2 catchment area) that lead into larger tributaries (Schick and Lekach, 1993). These gauges have provided information regarding flow and sediment loads, demonstrating that sediment discharge is inconsistent. For example, during 33 years of monitoring, 14 years lacked any flow, and 8 years had flood events during which the flow terminated prior to the gauge at the lowest elevation (Clapp et al., 2000). The measured floods that terminated before reaching the sea delivered large amounts of sediment to the wadi system (100 t of eroded sediment km−2 yr−1 (Schick and Lekach, 1993), 460 t of sediment in a single event (Clapp et al., 2000)). In this local hyperarid wadi, total suspended solids (TSS) during flooding were measured at 44 g L−1, based on an average from three flash floods (Lekach and Schick, 1982). This concentration is very high relative to averages recorded in large perennial rivers such as the tropical Amazon (0.19 g L−1), Mississippi (0.82 g L−1) (Milliman and Farnsworth, 2013), or pre-Aswan Nile River (3.43 g L−1) (Shalash, 1982).
1.4 Recent GAE Flood Research
Eilat, a coastal city established in 1951 with an increasing population of greater than 55 000 people (population 50 000 reported in by Azaryahu, 2005; and 55 000 reported in http://www.worldpopulationreview.com, last access: June 2025) is located in the northernmost part of the GAE immediately west of the neighboring city of Aqaba, Jordan which is home to over 150 000 residents (Arieli, 2021). Both Eilat and Aqaba expand significantly (> 1 million visitors) during holiday seasons with tourists arriving to enjoy attractions like the world's northernmost tropical coral reefs (Loya, 2004; Xilotl Soberon and Rofe, 2017).
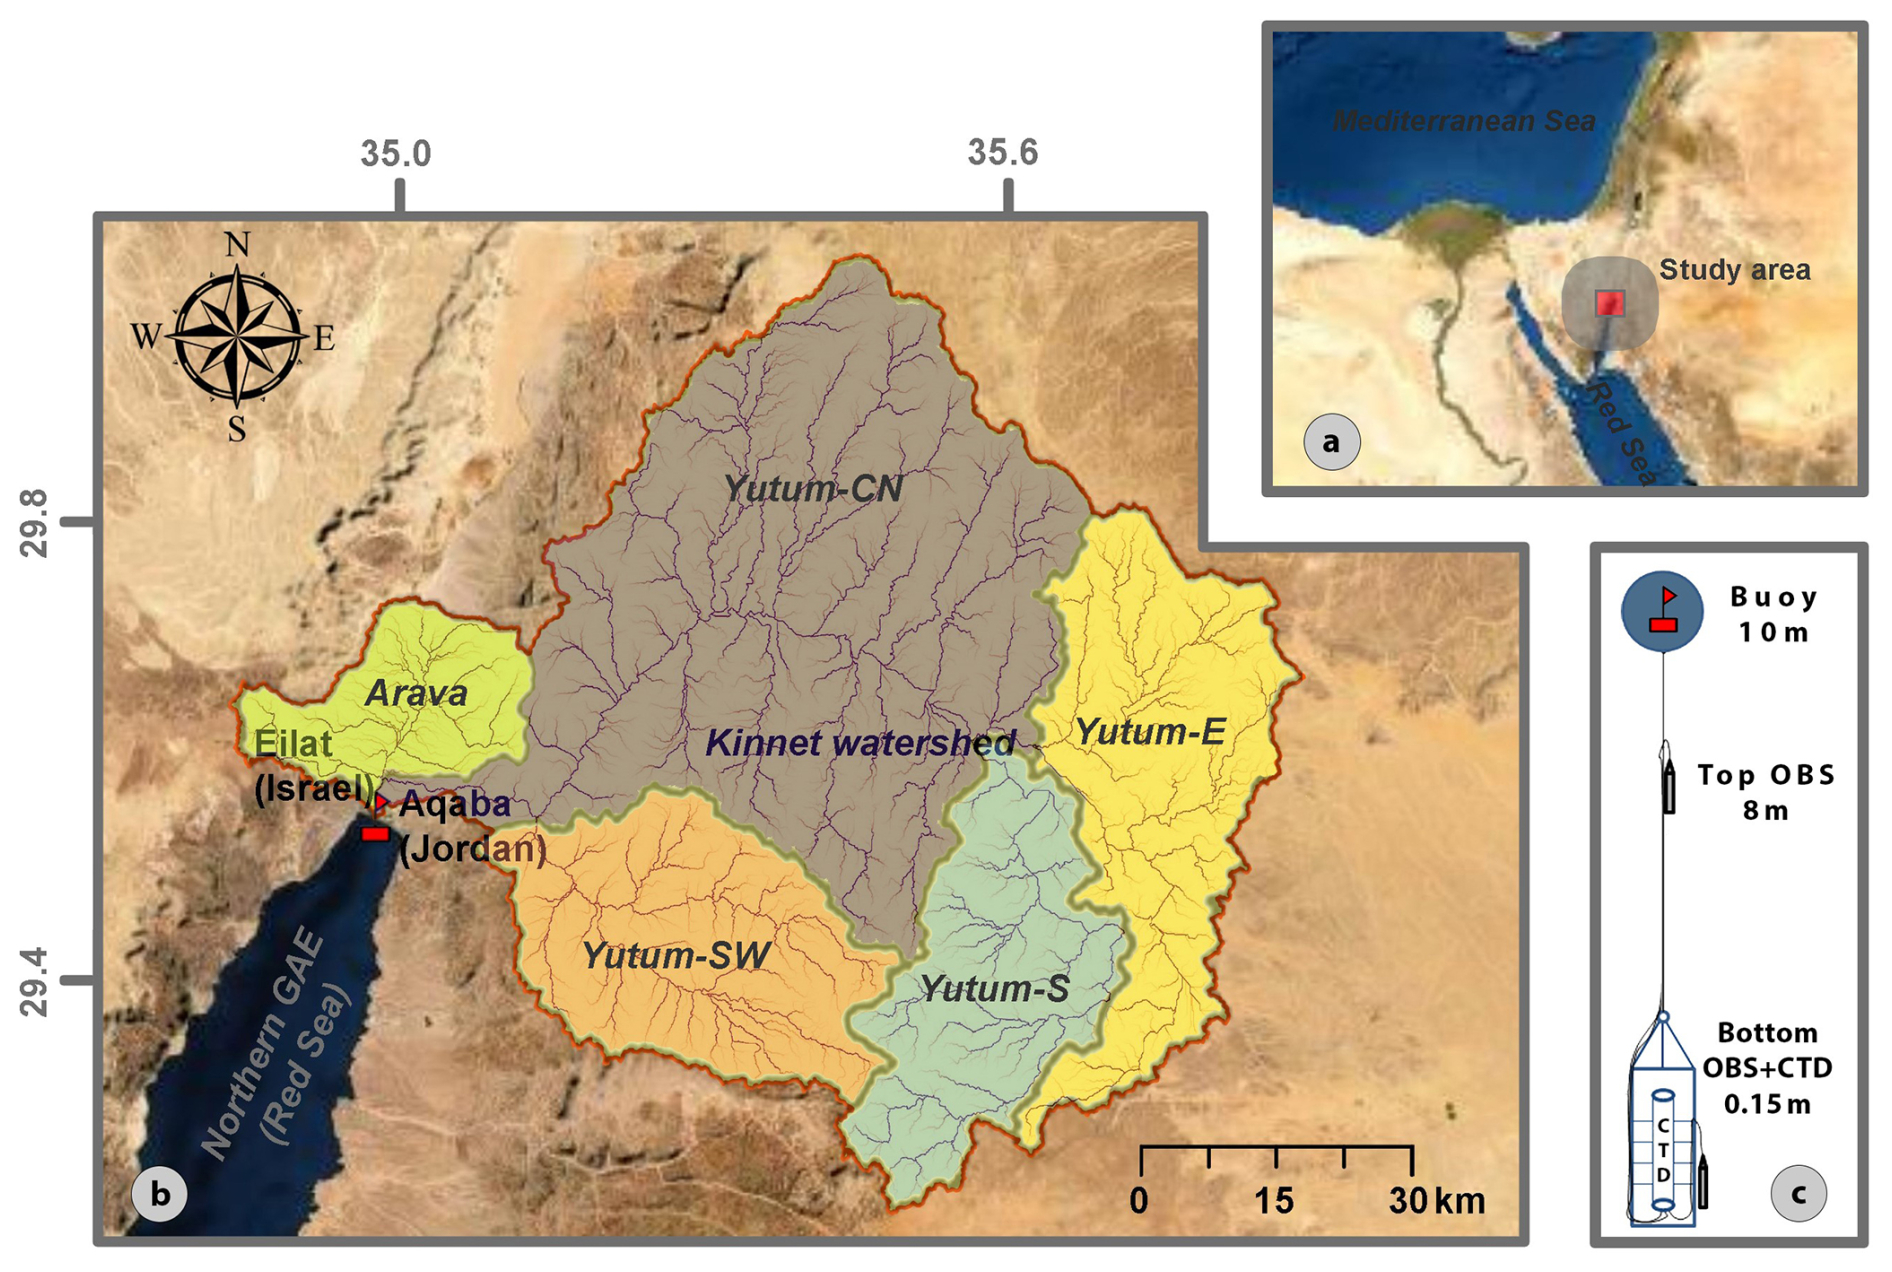
Figure 1(a) Regional map showing the location of the head of the GAE. (b) Local map illustrates the mooring's position along with ephemeral river systems. The delineation of streams transporting water and sediment to the northern shelf of the GAE is represented by the brown lines. Although all runoff ultimately converges at a single outlet, the Kinnet Canal, dividing the watershed into subbasins helps to identify distinct source areas and improves the estimation of flood arrival at the river mouth (Eilat city center). Maps adapted from Kalman et al. (2020). (c) Schematic drawing of the mooring station setup (Sea Bird Electric CTD and Campbell Electric 3+ OBS sensors), positioned 250 m offshore the Kinnet outlet at 13 m water depth.
Floods in the GAE can form within hours after rainfall affects the Kinnet watershed in the northern GAE (Fig. 1). The Kinnet Canal (Fig. 2) serves as a conduit for the Kinnet watershed, channeling both water and sediment loads (predominantly in suspension) toward the lowest elevation point. When the arriving water volume from the catchment area is substantial enough, floods can make their way into the sea (Katz et al., 2015).
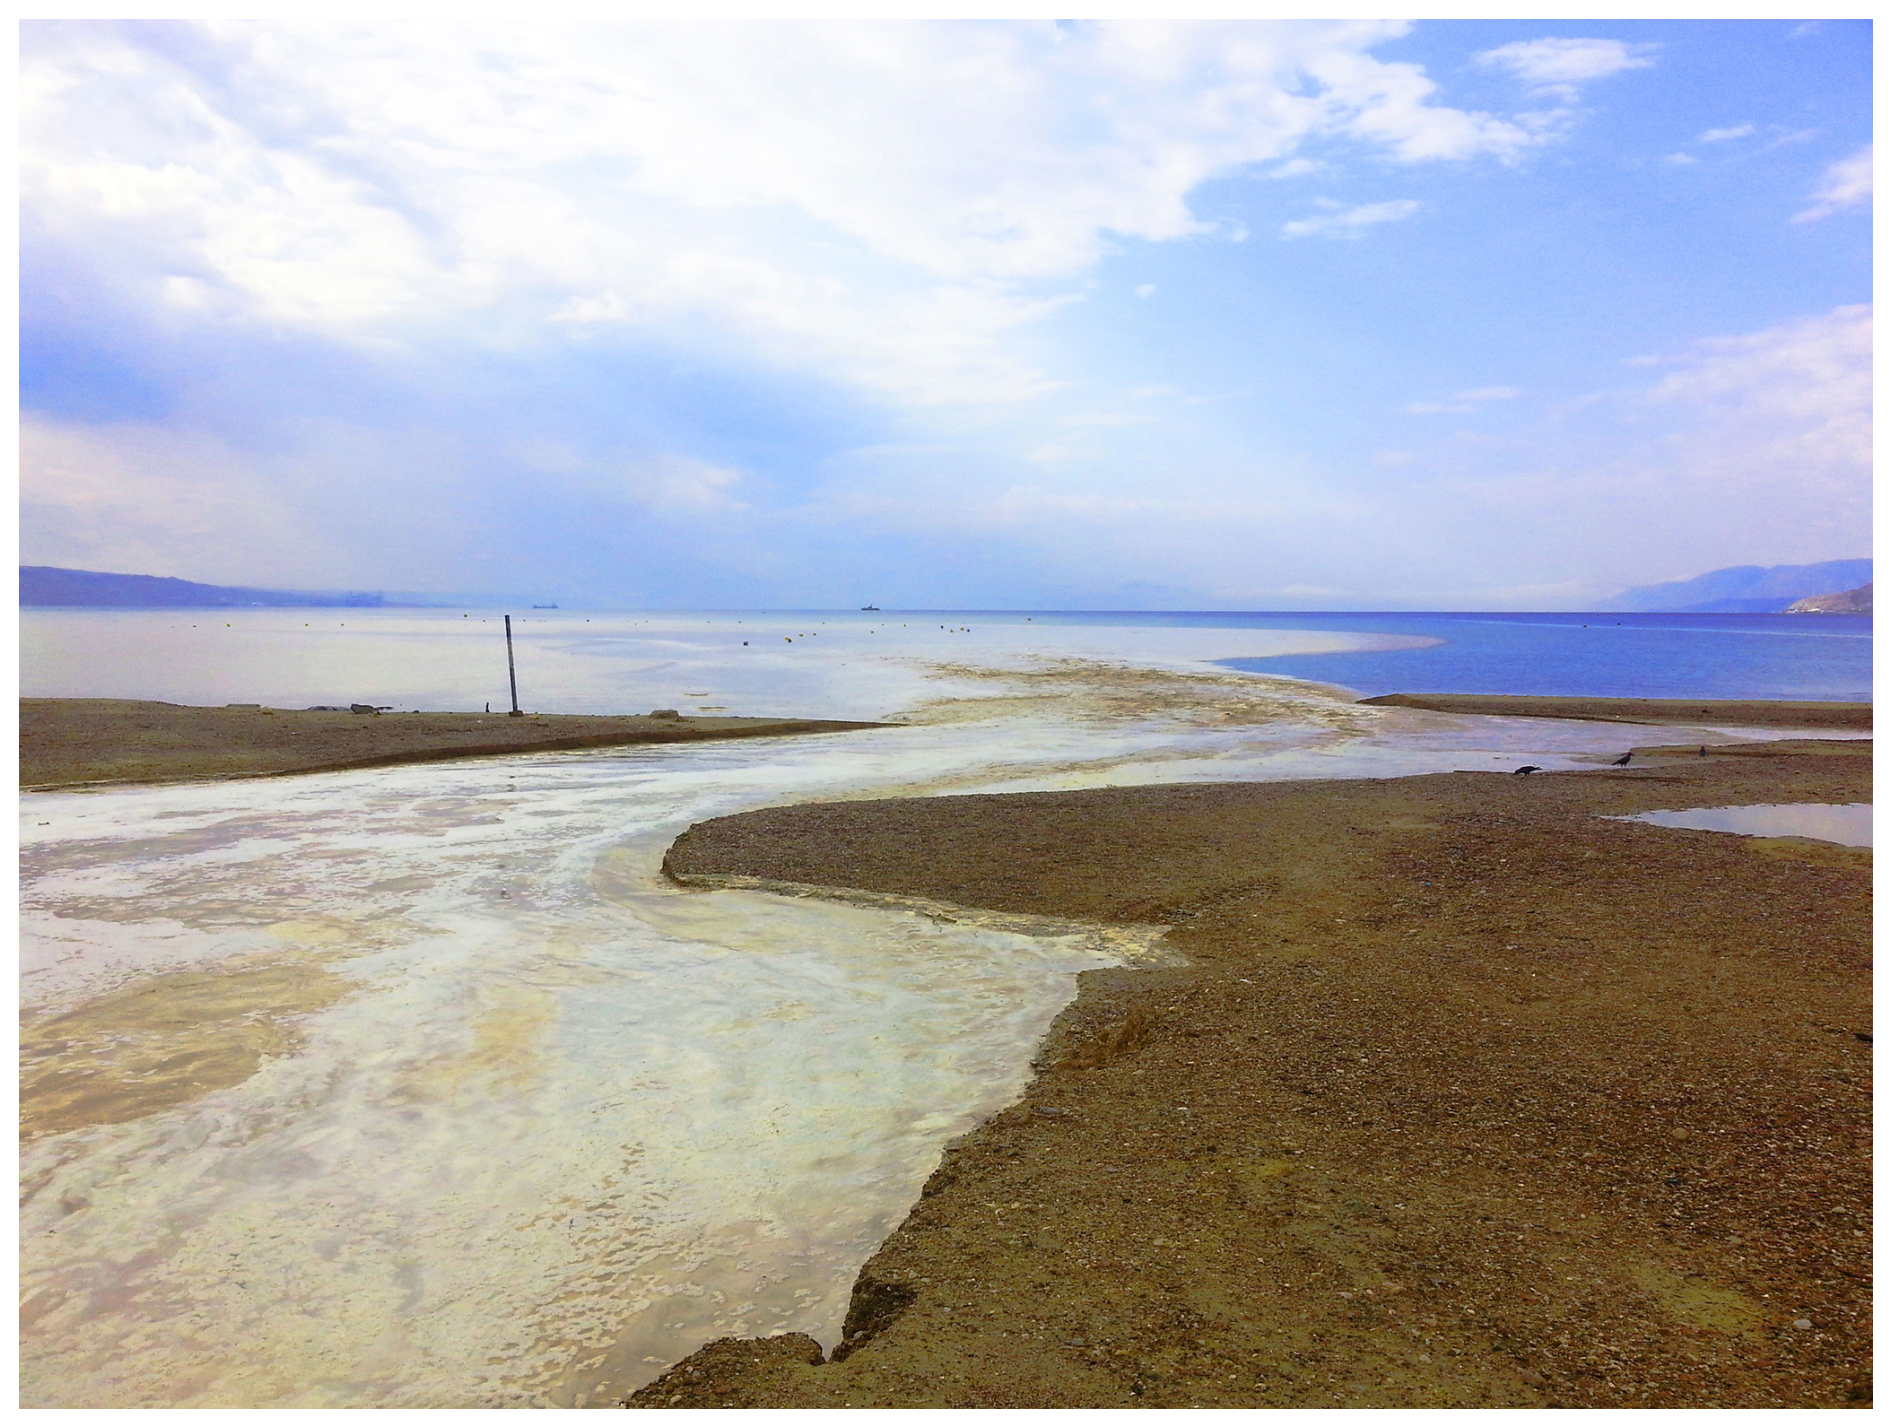
Figure 2Flash flood entering the northern Red Sea following a heavy precipitation event on 28 October 2016. Photo by Gal Eyal.
Flash floods reaching the sea through the Kinnet Canal (discharge located on Eilat shoreline) have been documented since 1994 (Kalman et al., 2020). Between 1994 and 2012, events were dominated by small to mid-scale floods, intermixed with extended dry periods (Kalman et al., 2020; Katz et al., 2015). In 2006, Aqaba was struck by an exceptionally large flood, causing extensive damage (Farhan and Anbar, 2014). Historical records also describe significant weather events, including a “terrific rain and hail storm that literally washed away half of modern Aqaba in 1940”, and a storm on 11 March 1966, classified as a 50-year return period event (Farhan and Anbar, 2014).
The west (Eilat) and the east (Aqaba) sides of the head of the Gulf have different flood potentials. The Wadi Yutum catchment on the east is 4867 km2, nine times larger than the Arava catchment on the west, and its higher elevation (∼ 1600 m) increases water flow speed and sediment transport. The northern part of Wadi Yutum catchment possesses several sinks and sabkhas in the north, but rainstorms in the rocky southern slopes send water towards Aqaba and the GAE (Farhan and Anaba, 2016). The smaller Arava catchment (458 km2 and lower elevation (∼ 500 m) still generate floods during rainstorms in the nearby Eilat Mountains.
In the northern GAE, Katz et al. (2015) documented a hyperpycnal plume created by a flashflood's high-density sediment load discharging into the sea. Their study characterized the floodwaters (temperature, salinity, sediment concentration) along the coastline and within the plume as well as the sediments deposited on the seafloor. They identified the distribution and thickness of the flood sediments and estimate the volume discharged (approximately 20 000 t), concluding that floods are the most dominant source of GAE seafloor sedimentation. Subsequent investigations explored bioturbation (Mathalon et al., 2019), Late-Holocene climate reconstructions (Kalman et al., 2020), and anthropogenically-driven changes in sediment dynamics (Kalman et al., 2022).
Throughout the study, meteorological data and weather reports surrounding the GAE were closely monitored in order to be “at ready” in the case of an opportunity to analyze an arriving flash flood. Given that the likelihood of floods occurring in a given day in the year is less than 0.5 % (Kalman et al., 2020), it was unknown whether any floods would actually occur during the designated observational period. Moreover, because of this low likelihood, it was understood that there was a high likelihood that the study could entirely miss an opportunity to make direct measurements, observations, and collections. To counter this issue, the study combined the use of a mooring station that collected regular interval measurements in situ, and a multi-person field team, equipped at all times with a field sampling set ready for arriving for taking field measurements if a flash flood occurred (Fig. 2). After (if) a flood occurred, the meteorological conditions preceding the production of the flash flood were analyzed in higher resolution. The following describes the methodological sequence performed from the identification of a potential flood event to field measurements, offshore deeper measurement casts, retrieval of mooring array data, and higher resolution meteorological analysis.
2.1 Meteorological data
The synoptic analysis in this study, used to track precipitation centers, was based on two data sources. One of these on a regional scale was the Precipitation Estimation from Remotely Sensed Information using Artificial Neural Networks (PERSIANN) dataset (Nguyen et al., 2019), obtained via CHRS Data portal, with a 0.5° × 0.5° resolution. Additionally, in a local scale, NASA's Global Precipitation Measurement (GPM) Integrated Multi Satellite Retrievals (IMERG) with a 0.1° × 0.1° resolution, were utilized to compensate for the lack of dense meteorological network in the trans-national Kinnet watershed, located at the northernmost tip of the Gulf of Eilat-Aqaba. Given the region's hyperarid conditions and limited gauging systems, satellite-derived precipitation data were essential for accurately estimating precipitated water.
The GPM's IMERG data is pivotal in this research due to its advanced capabilities in providing high-resolution precipitation estimates, which are particularly crucial in regions where conventional meteorological infrastructure is sparse or non-existent. The GPM constellation and ground validation suite employ a host of sensors including the active Dual-frequency Precipitation Radar enabling precise measurements of rain rates (Masaki et al., 2014) and the passive GPM Microwave Imager essential for measuring precipitation intensity and distribution (Draper et al., 2015). Following data collection, a series of steps, including ground validation (Tapiador et al., 2020), are undertaken to ensure the accuracy and reliability of the precipitation estimates (Huffman et al., 2020). The subsequent merging of data from various sources, complemented by rigorous quality control and validation procedures culminates in the final IMERG datasets (Huffman et al., 2020).
In the specific case of the Kinnet watershed, the utilization of IMERG datasets are necessary, and used alone, because physical meteorological stations are sparce. The two stations (Eilat, Israel and Aqaba, Jordan) present in the watershed are only 10 km from one another, and show nearly identical annual average precipitation values (Jordan Meteorological Department, Israel Meteorological Service; Katz et al., 2015). Therefore, they are not useful for measuring the overall contribution of rainfall for the entire watershed. This absence of adequate ground-based meteorological stations and gauging systems in this hyperarid region makes satellite-derived data the most reliable source for the accurate assessment of precipitation patterns. The integration of this high-resolution, satellite-based data with the NCEP/NCAR reanalysis imagery offers a comprehensive understanding of the hydrological dynamics within this trans-national watershed.
2.2 Time series mooring station
An instrumented mooring station was anchored ∼ 250 m offshore in front of the Kinnet Canal at a depth of 13 m. The instruments on the mooring array included a Sea Bird Electronics SBE 19plus v2 CTD (temperature, salinity, depth) positioned 0.15 m above the seafloor, and three Campbell Electric OBS 3+ optical backscatter sensors calibrated with pure, local flood sediments collected from slackwater deposit near the outlet, and attached to the instrument line at three different depths (0.15, 2, 8 m) above the seafloor 250 m offshore. Calculations for sediment concentration based on turbidity values from the OBS 3+ sensors was calculated using values derived from direct calibration of sediments from this site (see Mathalon et al., 2019, methods and description). The mooring station instruments collected the properties of the water column for a period of 9 months between April 2016 and January 2017. In moored mode, data was collected with a temporal frequency of 300 s with 4 measurements per sample. During the mooring period, instruments were cleaned and examined roughly every 10 d by scuba divers, data was retrieved, and the batteries were recharged.
2.3 Canal measurements
The research team collected a series of measurements and samples from the Kinnet Canal outlet during active flooding (e.g. 28 October 2016 event). Flow speed (m s−1) was calculated based on the surface speed obtained from time a drifting object traveled a predetermined distance (30 m), corrected (multiplied) by 0.6 to account for riverbed friction due to roughness and riverbed geometry at the measured sequence of the flood (Chie, 1992). Water samples were collected every ∼ 3 h from the centerline of the waterflow to calculate sediment concentration (g L−1). Similarly, at regular intervals the flood level at the banks was recorded and after the flood had finished, the cross-section areas of the Canal (m2) for each 3 h interval were calculated (Fig. S1 in the Supplement).
2.4 Suspended alluvium major element analysis
Major elements (Fe, Al, Mn) were measured from the canal flood water collections. To do this, approximately 1 g of dried (60 °C) sediment per sample was ground and homogenized with a mortar and pestle to a powder and analyzed in a vacuum chamber using an ED-XRF (Spectro Scout). The measurements were calibrated with 3–8 certified sediment standards as described in Zirks et al. (2021).
2.5 Stream order and watershed delineation
Hydrological modeling of the Kinnet watershed was performed (1) to understand the time lag between the cessation of rain and initiation of flooding at the river outlet; and (2) to describe hydrological behavior and structure of river system in case of flood events. Digital elevation models (DEMs) from the Shuttle Radar Topography Mission (SRTM) were downloaded (https://earthexplorer.usgs.gov/, last access: January 2023) and processed in a series of steps (fill, flow direction, flow accumulation, basin, stream order) using the Hydrology tool (Bajjali, 2017) in ArcGIS Pro (v3.1). This step delineates streams that possess significantly higher potential for flood related hazards.
During the study period, a major flash flood event that reached the sea was observed in the last week of October 2016. The results below are presented as a sequence of the event that includes (1) the analysis of mesoscale convective systems during this period, leading to (2) a heavy rainfall and (3) flash flood development with (4) high quantities of transported material in the southern Negev Desert that eventually (5) discharged from the Kinnet Canal to the tip of the northern Gulf of Aqaba-Eilat, Red Sea. The meteorological antecedent conditions leading up to the event were then assessed to consider possible unique features associated with flood production on a regional scale.
3.1 Kinnet Catchments
The hydrological analysis of the landscape shows that the Kinnet watershed is the largest among sub-catchments that direct water and sediment into the head of the northern GAE. Modeling performed by incorporating DEM data from satellite imagery delineated two major watershed basins; west (Arava catchment) and east (Yutum catchment) from the pull-apart basin (Wadi Arava) in between. The Yutum catchment is larger in size and, based on topography, can be further subdivided into four sub-basins, contributing uniquely to the overall hydrological dynamics of the hyperarid watershed (Fig. 1).
3.2 Meteorological Antecedent conditions (20 September–27 October)
The initial northward propagation of the Sudan Monsoon Low over the Red Sea (also known as the “Red Sea Trough”, RST) towards the Eastern Mediterranean was first detected 37 d before heavy precipitation event that ultimately led to a relatively large flash flood in Eilat. Rather than representing a continuous synoptic feature, this period comprised a series of RST-related disturbances with a trough axis retaining in the region and intermittently re-intensifying. Particularly, the RST strengthened on 24 October (3 mbar over 9 mbar), 3 d prior to the massive rainfall (Fig. S2). Congested clouds developed above Ethiopia beginning on 5 October, but there was no significant formation of clouds until 24 October above and in the vicinity of the Red Sea.
On 24 October, various atmospheric conditions prevailed in the Middle East. At first, velocities of the Polar Front decreased significantly. Based on 200 hPa vector wind map of the day, no sign of a continuous Polar Jet in the region prevailed whatsoever. Satellite imagery shows however a narrow, but long – stretching cloud formation around 22–23° N across the Red Sea and the Arabian Peninsula, in addition to scattered congested clouds above the Southern Red Sea. The 200 hPa vector wind composite confirms that the clouds were formed as a result of enhanced velocities of the STJ (Fig. S3). On 18 October, STJ velocities varied between 25–30 m s−1, located at the border of Chad-Lybia-Egypt-Sudan through the Red Sea towards the Middle East. Its shape elongated in east-west direction and its velocity intensified up to 43 m s−1 by 22 October, became the strongest at the difluence over the northern tip of the Persian Gulf. Later, the position of the STJ gradually moved southward and reached its southernmost position on 27 October above the Red Sea at 15–16° N, before moving back northward after the storm.
At low atmospheric levels, warm advection that had been formed previously above Sudan and Ethiopia prevailed, resulting in a 6° temperature rise to 33 °C in the center of the Red Sea Trough. Simultaneously, a −9 °C and 35 % relative humidity (5 °C less and 20 % more humid than ambient) upper-level trough reached the Middle East from northwestern direction.
These differential warming and cooling effects enhanced static instability with respect to normal conditions. The majority of the moisture (RH = 80 %–90 %) to the EM was transported at 700 hPa from tropical Sudan and Ethiopia. During the transport, relative humidity continuously increased in the Levant with no significant change of the temperature profile, which resulted in lowering of the lifting condensation level, embedding to a deep convection above the entire region. Clouds were forming along the fringing mountains at the southern part of the Red Sea on 25 October, but no precipitation occurred.
3.3 Mesoscale convection
While the RST was approaching the Middle East from the south at low (near sea) atmospheric levels, the well-developed upper-level trough (atmospheric Rossby wave), pointing southwest, formed over the Eastern Mediterranean. As a result, a cold convection took place on 25 October that turned to advection leading to a formation of a cold front over the EM. The combination of lower-level convergence and upper-level divergence are fundamentally linked to enhanced potential for the initiation of intense, but spatially spotty rainstorms due to the topographic heterogeneity of its mountainous local desert environment (El-Fandy, 1950). At the tip of the cold front, advection lifted the airmass above the border of Libya and Egypt and increased the relative humidity from 30 % to 65 % at 850 hPa geopotential height (gph). The wind vectors at 700 hPa gph showed that in addition to this humid air was transported towards the Red Sea, the intensified STJ prevailed and effected NE movement of airmasses located in lower atmospheric levels (Fig. S4). On 26 October, 12:00 LT, congested clouds were formed above the mid-Red Sea and heavy rainfall began ∼ 1000 km south from Eilat (Fig. S5).
During the morning of 26 October, a cloud system of approximately 480 km in diameter was formed above Sinai-southeast Jordan and northwest Saudi Arabia axis. The cloud system developed at the contact zone of the west side of the east pointing RST and the east side of the upper-level trough that occupied the EM at higher atmospheric levels. The rain cells were formed over the ridges along the leeside of the Red Sea mountains, moved further to the middle of the sea, then drifted northward by the RST. Within 18 h at 06:00 UTC 27 October 2016, showers and rainstorms were registered from the entire Negev desert (Israel Meteorological Service).
The tip of the RST on 27 October reached Cyprus and Syria, its deepest penetration into the Eastern Mediterranean portion of the Middle East. Polar Jet velocities at ∼ 31° N latitudes gradually increased, and on this day showed its strongest phase (45 m s−1 in the center) and turned 45°, already pointing northeast, reconnecting the opened high-altitude wind system.
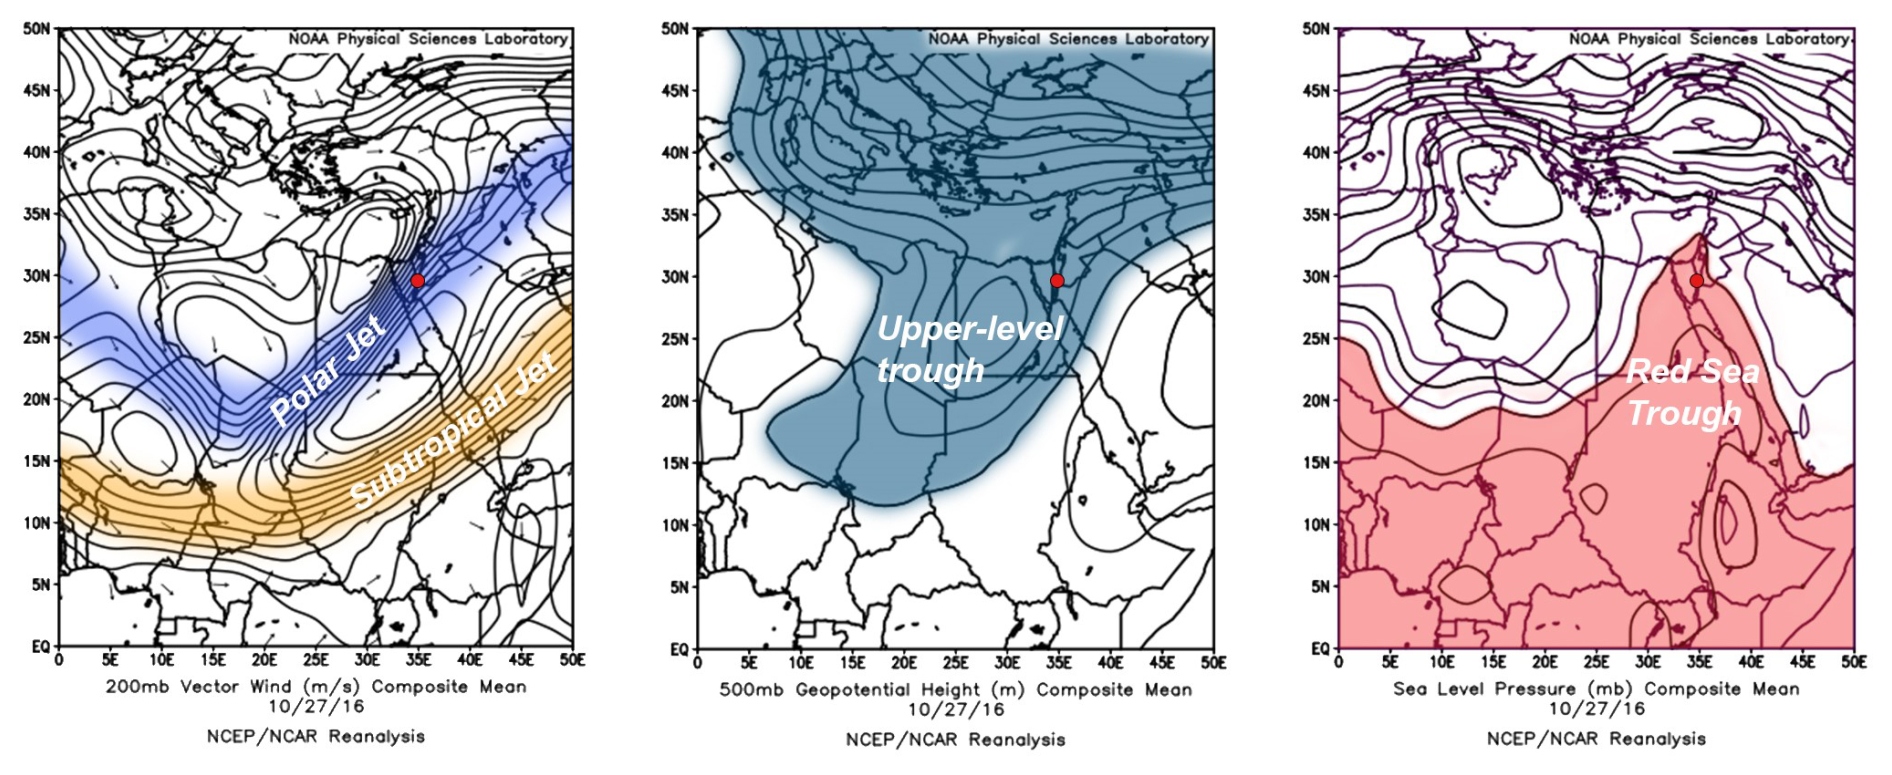
Figure 3Composites on the heavy rainfall in Eilat (red dot) showing three mesoscale systems (Polar Jet, Subtropical Jet, upper-level trough) and a synoptic scale system (Red Sea Trough) in which their fourfold contact zone narrowed down to ∼ 200 km wide gap over the Eastern Mediterranean contributing to the formation of the historical flashflood.
The center of the upper-level trough moved from the Nile delta to mid-Egypt within 2 d (27 October), narrowing the contact zone of four (upper-level trough, Red Sea Trough, Polar Jet, and Subtropical Jet) mesoscale systems to approximately 200 km wide channel in the Eastern Mediterranean (Fig. 3). As a result, precipitation centers reached the north of the Eastern Mediterranean, but also penetrated further into continental Syria and Iraq. A section of the cold upper-level trough disconnected from the main body of the trough on 27 October, creating a giant “cold ball” like feature above Eilat, which accelerated its mixing with the near sea level spreaded and warm RST. The northeast-pointing Polar Jet carried and dissipated the trough away and by the end of the day on 28 October, the pressure differences between the atmospheric layers equalized, resulting in the end of the storm.
3.4 Precipitation and Flashflood entering the sea
A flash flood reached the head of the GAE at ∼ 03:00 LT 28 October 2016; after an Active RST accompanied by scattered showers and thunderstorms made contact with a high-pressure belt over the mid-latitudes and inundated the Middle East region from Egypt, through Israel, Jordan, as well as Lebanon and Syria. The RST moved from the mid to the northern Red Sea within 18 h. During this time, nearly every segment of the 4867 km2 Kinnet watershed received some amount of precipitation (Fig. 4), which eventually contributed to the formation of a flash flood. The total precipitated rain during this time was calculated at 133 million m3 in the Kinnet catchment, accumulating for ∼ 51 h prior to the flashflood's arrival into the GAE.
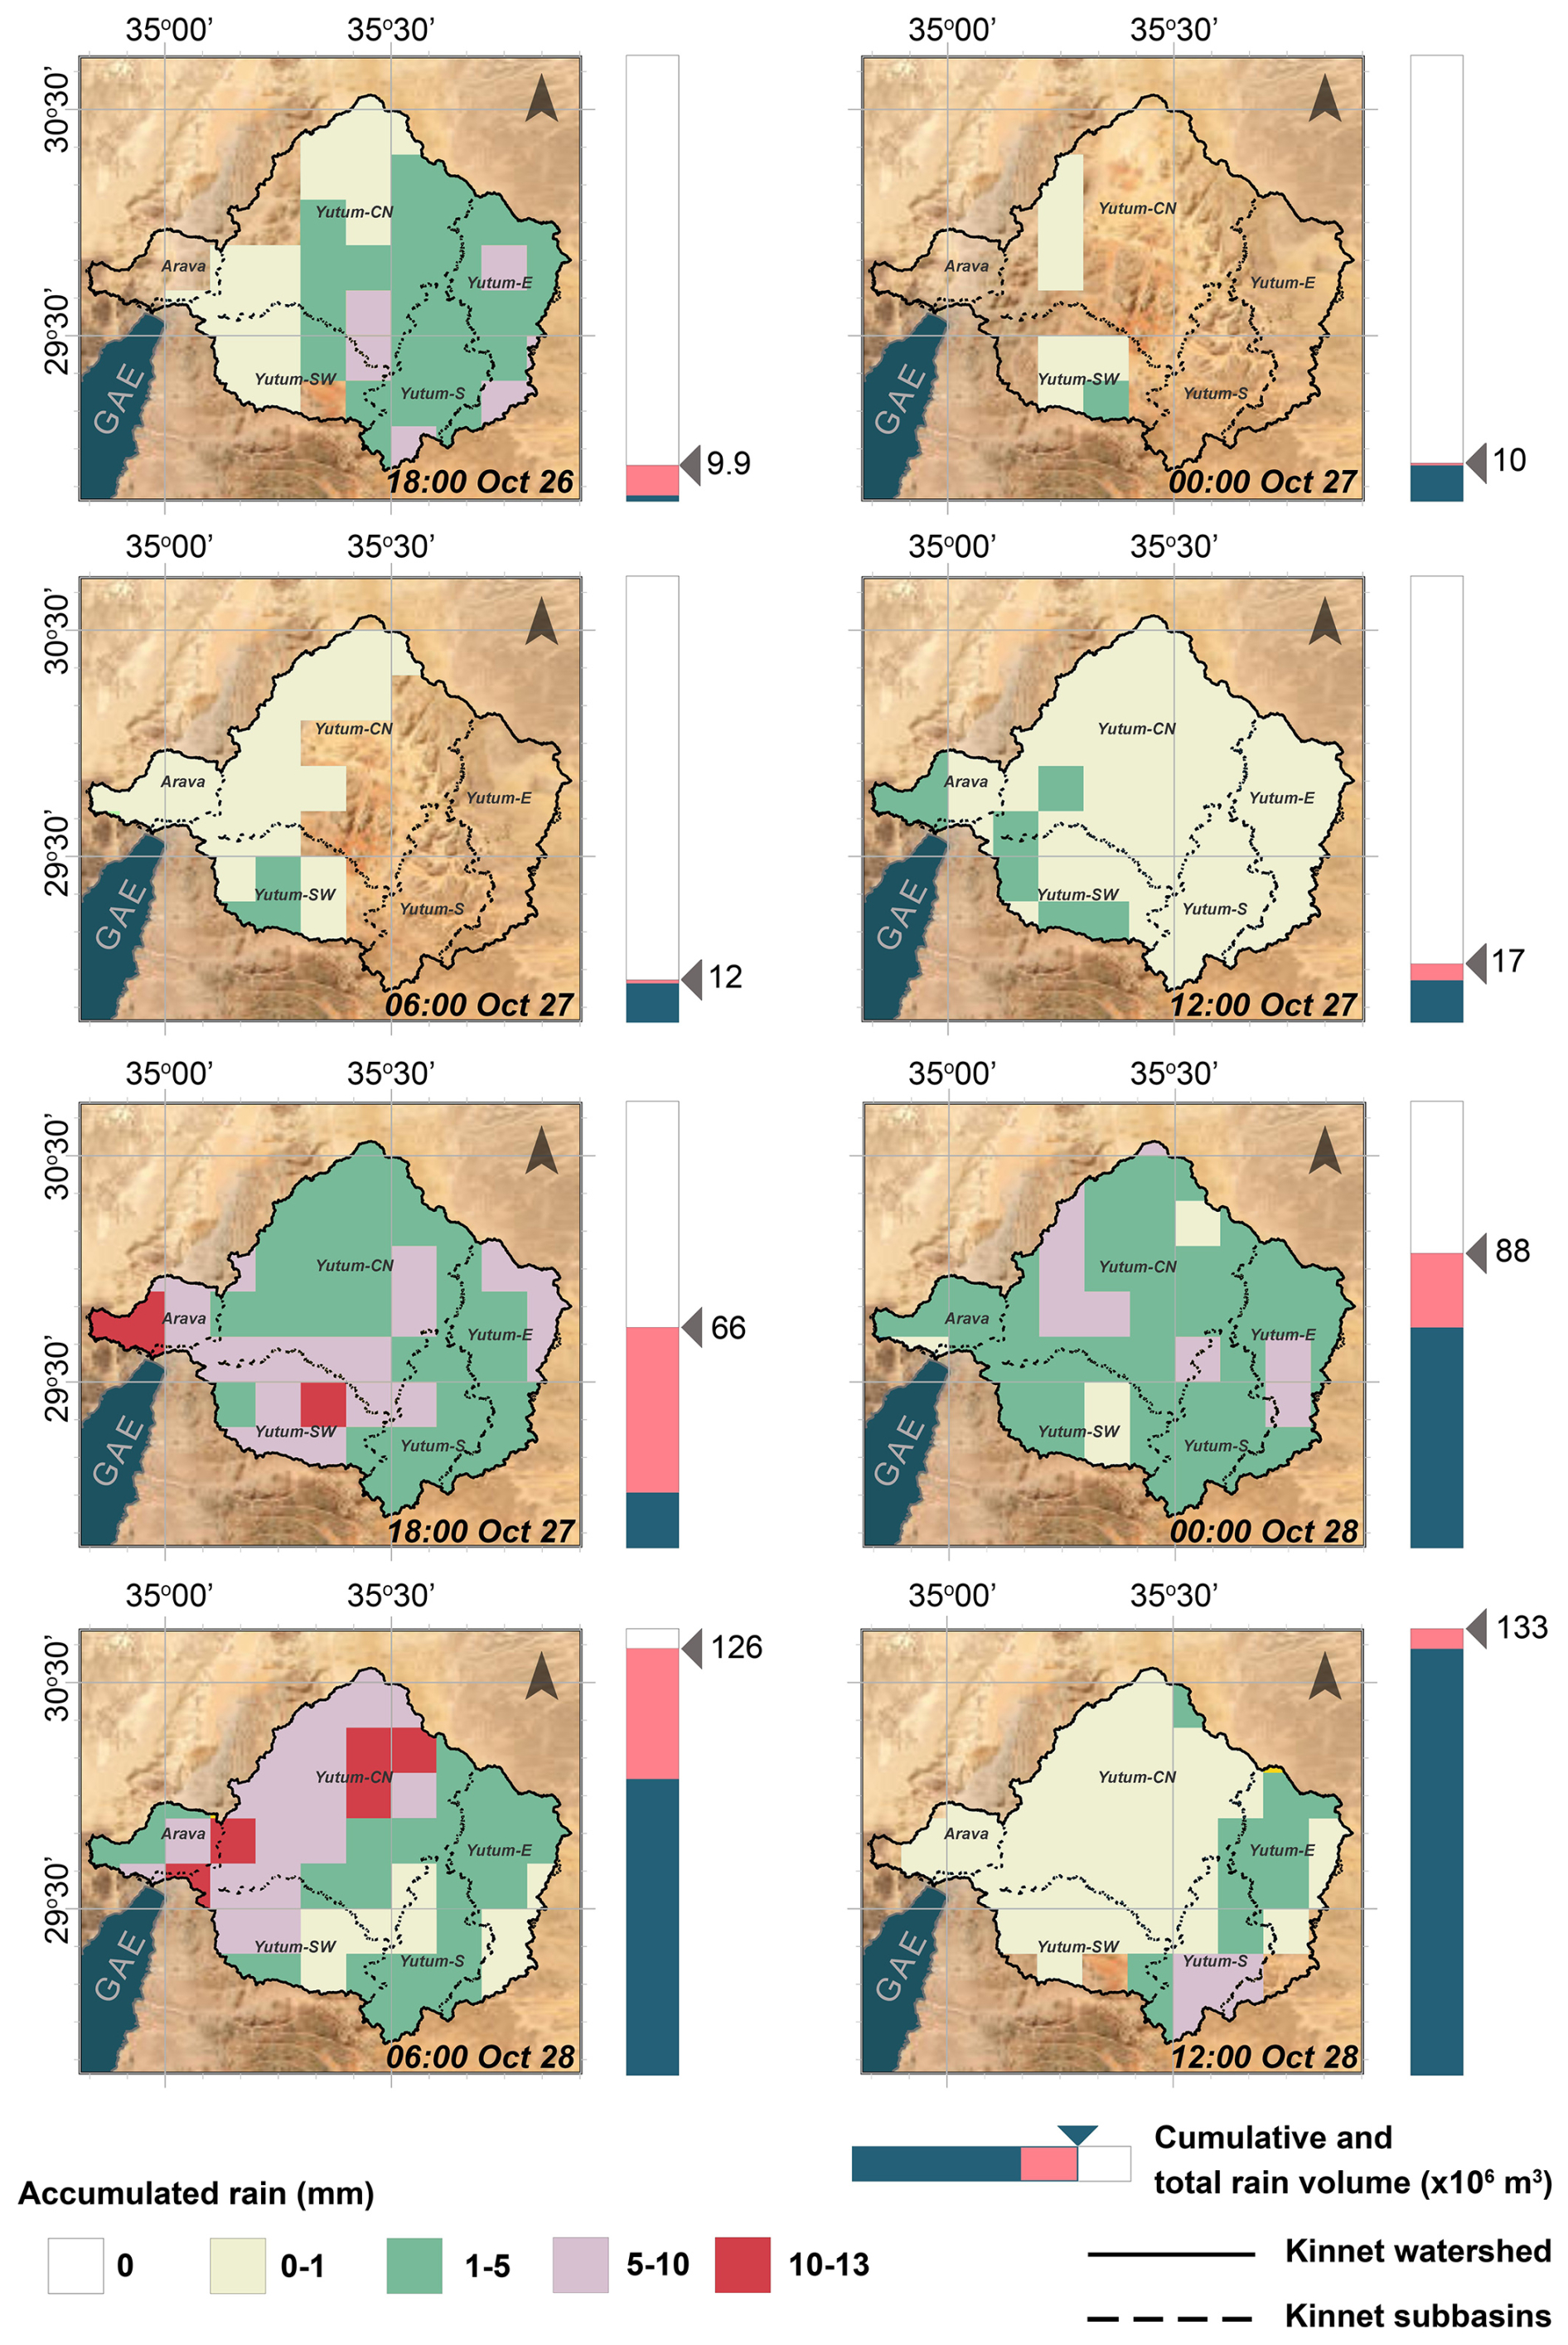
Figure 4GPM-IMERG satellite precipitation showing 6 h rain development in the Kinnet watershed in 0.1° × 0.1° resolution. Accumulated rain during hours between measurements (red bar) and total accumulated rain volume (blue + red bars) indicate that the majority of the water precipitated within only 18 h.
During the precipitation period, rain was temporally and spatially unevenly distributed. For the first 24 h, scattered and localized rain events in the catchment area resulted in the arrival of a total of 17 million m3 water (∼ 13 % of the total). In the following 18 h however, both sides of the Arava Valley (Eilat and Wadi Yutum catchments) experienced intense storms, adding 109 million m3 water (∼ 82 % of the total). The last 6 h resulted in an accumulation of an additional 7 million m3 rain water (∼ 5 % of the total), but similarly to the initial phase of the event, it was spatially spotty and mostly precipitated in the eastern side (Yutum-S, Yutum-SE) of the watershed. It was followed by a 6 h no precipitation period, before precipitating only ∼ 52 000 m3 rain (0.04 %) at both spatially and temporally highly varied stages.
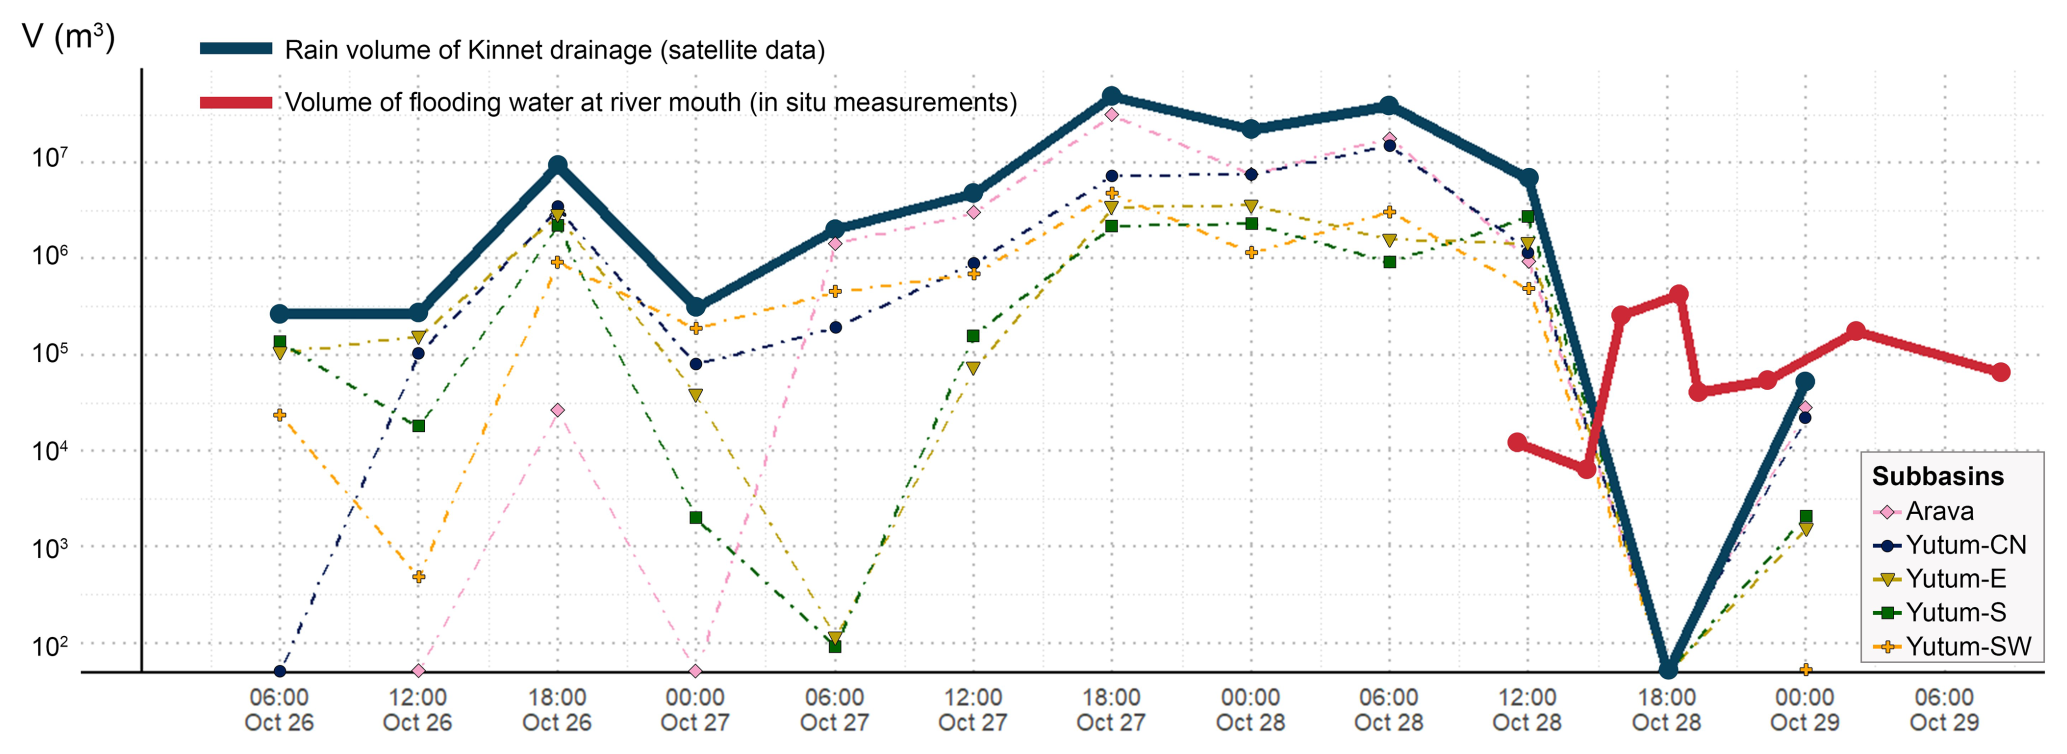
Figure 5Summary of quantitative analysis of the water before and during flooding on 28 October 2016 in Eilat based on satellite data and in-situ measurements. The distribution of the rain amongst the subbasins (dashed lines) indicate the patchy nature (unevenly distributed) of rain events in this hyperarid environment at the first 36 h of the storm, which was followed by concentrated and elevated quantities of rainfall in all subbasins. According to witnesses, the flash flood arrived at the sea at 09:00 in the morning and transported large quantities of suspended sediment over a period of 30 h.
According to conversations with witnesses, some flood waters arrived at the head of the GAE after the middle of the night, around 03:00 LT on 28 October (see Fig. 5), but no turbid water, only elevated discharge was described. The research team performed the first recording and sampling at 9 LT and continued to take 8 measurements for 30 h.
The water flow and the sediment concentrations of the flood increased from 1.33 m3 s−1 and 20.73 g L−1 at 09:00 LT to 47.42 m3 s−1 and 20.91 g L−1 at 02:30 pm, respectively. By 06:30 LT the flow decreased to 13.53 m3 s−1 and the sediment concentration increased to 27.55 g L−1 and by 02:30 LT in the next day the flow was further reduced to 2.87 m3 s−1 and the sediment concentrations rose to a 33.5 g L−1. In total, 1.04 × 10⁶ m3 water flowed into the sea through the Kinnet Canal and transported 2.44 × 10⁴ t of sediment over approximately 30 h, which the majority of this quantity was then deposited on the shallow marine shelf. The sea surface discoloration from transported sediments was visible for as long as 7 d. Estimations extrapolated from the elemental analysis of the samples taken during the event suggest that 1014 t of Fe, 1413 t of Al, and 20 t of Mn entered the sea.
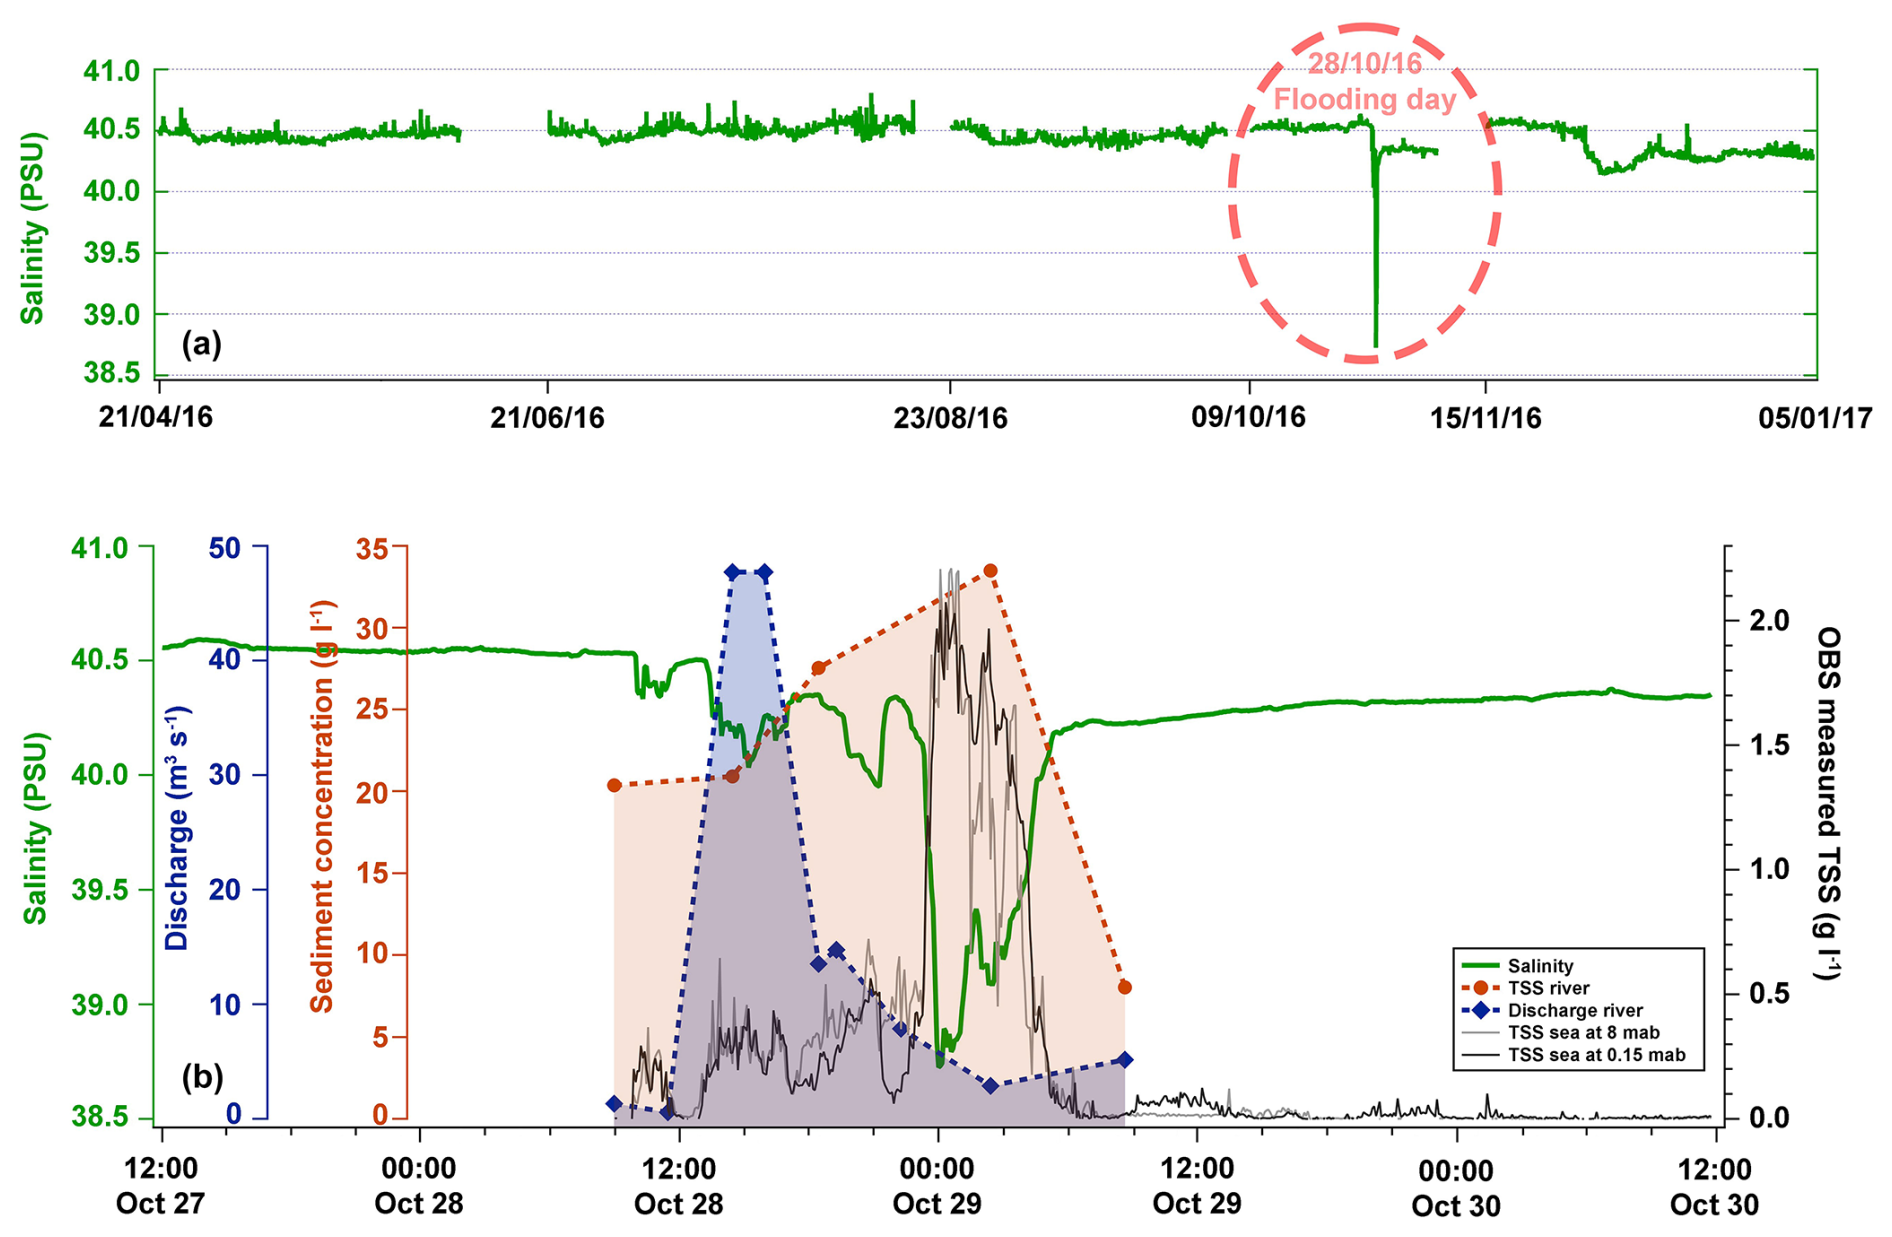
Figure 6Offshore mooring array measurements (a, b) and Kinnet water and sediment discharge collection and recording results including the flood event of 28 October 2016. (a) Nine months of salinity measurements from the mooring station. The flooding event is clearly visible as a sudden decrease in salinity. No significant temperature change was registered during the event. Gaps in the data indicate the periods during which the instruments were removed for downloading data and maintenance. (b) On-land measurements of changing of the flood discharge and sediment concentration over time, and expanded view of 3 d of mooring station measurements (TSS and salinity) including immediately before and after the flooding event. The OBS turbidity sensors from the 3 m depth (“top”) and 0.15 m depth (“bottom”) both show fluctuations and increases coinciding with the arrival of flood water.
Indications of the arriving flood waters were also recorded by the offshore mooring station instruments (Fig. 6). According to the sensors, water temperature did not change, but water salinity and turbidity started to fluctuate at 09:50 LT on 28 October 2016, 250 m offshore the canal outlet. These two parameters mirrored one another, as salinity dropped turbidity rose and vice versa. Ten minutes after midnight, turbidity increased to as high as 2.18 g L−1 sediment concentration, and salinity near the seafloor dropped to 38.73 PSU, a value that is 1.80 PSU less than the mean salinity (40.53 PSU) recorded over the 9 months of observations from this site. During the last stage of the flood, salinity returned to just below-background values 6 h after its lowest measured value (∼ 40.4 PSU), while turbidity was still highly variable. Later, this variance with minimal amplitudes was limited only to the bottommost conditions and remained diversified hours after the cessation of the flood.
This study followed the sequence of a storm that occurred on 28 October 2016 in Eilat from its initial phase to and through a flash flood that started deposited alluvium in the northern Red Sea a day later. The flood was the 13th flood recorded since records began in 1994 (Katz et al., 2015; Kalman et al., 2020). From 1994 to 2012, there was a drought period wherein flood occurrence was below 1 yr−1 (0.17), followed by increased occurrence of 1.7 floods yr−1 (2012–2020). With regard to the hazard level of the 28 October 2016 flood event, no death occurred, nor was property damage reported; and transportation and infrastructure (roads and airport) were not affected. The interpretation of reanalysis data revealed that multiple unstable atmospheric conditions led to the formation of the storm that within a day exceeded the annual average precipitation in Eilat. It began with the northern propagation of the RST 3 d prior to actual flash floods forming in the southern Negev. Tropical moisture was transported towards the Red Sea and enhanced velocities of the Polar Jet and intensified RST expansion towards the Eastern Mediterranean. At the same time, a well-developed upper-level cold front approached the Eastern Mediterranean and the combination of lower-level convergence and upper-level divergence initiated an intense rain event associated with thunderstorms.
4.1 Storm analysis and implications
At sea level, the RST as one of the key elements in the formation of the storms is one of the main synoptic patterns that influence weather in the Levant region (Alpert et al., 2004b). The northward propagation of this low-pressure system is not a rare case; RST is formed 43.7 % of the days between October and November during the rainy season (Saaroni et al., 2020). This means that RST is present roughly every second day during these months, providing the potential for heavy precipitation to form. Saaroni et al. (2020) developed an algorithm that identifies the northern part of the RST and classifies it according to the location of the trough axis with respect to longitude 35oE. This classification is important because RST expansion and orientation influences the distribution of a possible storm over the Levant in its “active” (ARST) phase (Kahana et al., 2002).
Hochman et al. (2021) used CMIP5 climate projections to categorize winter RSTs and analyzed their characteristics and impacts on the region. They found that rainfall associated with wet RST (WRST) is projected to decline by 37 % by the end of the 21st century due to shifts in atmospheric circulation patterns, increased temperatures, and a reduction in the frequency and intensity of WRST events. Additionally, they found that extreme precipitation events related to the WRST show distinct atmospheric pattern differences when compared to lighter precipitation events within the same system (Hochman et al., 2023).
Ziv et al. (2005) showed a December 1993 ARST example with flooding wherein a persistent southerly flow from over the Red Sea prior to the event (in addition to tropical moisture transport) induced air ascendance along the Red Sea, and carried it to the surrounding regions. During the October 2016 case, however, 2 d prior to the flood, at the tip of the upper-level trough, advection lifted the airmasses above the border of Libya and Egypt (westward of the study area) and increased the relative humidity by 35 %, which was then transported towards the Red Sea. Such elevated air moisture values fit those used in Krichak et al. (2012)'s algorithm for identifying ARST events. They concluded that high moisture content in the air influences the intensity of the developing storm in the Eastern Mediterranean; and conversely, drier air masses along the Eastern Mediterranean coasts reduces the possibility (and intensity) for an ARST event. The conditions observed during this 2016 event support the presence of an ARST event. In some rare cases, the lowest flank of the upper-level trough can disconnect from the meandering mid-latitude upper-level low system; and can form into an individual cut-off low resulting in a negative upper-level temperature anomaly. This is extremely favorable for thunderstorms in the atmosphere and can lead to and induce fatal flashfloods on land (Dayan et al., 2021).
At upper atmospheric levels, major mid - and high latitude cyclonic and anti-cyclonic systems affect the atmospheric Rossby waves (e.g. extension, direction and persistent time of upper-level troughs and ridges), and it is the cold upper-level trough introduced from northern regions that enhanced convective instability during the October event. A negative phase of the North Atlantic Oscillation created an amplified Rossby wave 3 d prior to the flood, resulting in two upper-level troughs extending southward: one in the Western Mediterranean up to latitude 17° and one in the Eastern Mediterranean up to latitude 15°. Because of a weak polar vortex, the cold air from the arctic region (from Scandinavia in the case of the eastern type) could escape, creating a hole in the Ferrel cell that cut through the Polar Front, and triggered the ARST event (Video S1). Since the polar vortex began to strengthen again on 25 October, enhanced velocities of the Polar Front “arrived” to the EM, and in the absence of the Polar Front, ran into the Subtropical Jet stream. By the following day, the enhanced high altitude wind pushed STJ at least 2° further south, meanwhile Polar Jet winds bounced back from this mid-latitude waveguide (Branstator, 2002) and further enhanced its velocities in the following days. Similar conditions were described in southwest Asia by Saligheh (2021); and concluded that pulling the Polar Jet southward that merges into the Subtropical Jet stream can enhance cyclogenesis and lead to hydrodynamic instability. Asiri et al. (2020) studied specifically the STJ over Africa and the Middle East and found based on nearly 60 years of reanalysis data that its north-south shifting is controlled by the temporal extension of the Azores High and the Siberian High. When the Azores High is weakened or shrank westward, the STJ shifts southward; and when the Siberian High is weakened or shrank eastward, the STJ shifts northward. This is in agreement with the October 2016 event. Prior to the Eilat flooding, the Azores High weakened and the STJ track gradually shifted southward and its position only changed direction when the Azores High was beginning to increase.
4.2 From precipitation to flow into the sea
During the October 2016 flooding event, the Kinnet watershed received 133 million m3 rain although most of the rain precipitated on the Jordanian mountains in the Wadi Yutum catchment (Fig. 4). Rainfalls in the desert are typically described as short lived and intense (Sharon, 1972); under extreme conditions they have been recorded as delivering ∼ 110 mm within 3 h (Youssef et al., 2016). This is certainly true for observations made in singular locations; whereas the satellite measurements show the overall lingering presence of the event.
The timing from the onset to final cessation of rainfall (including initial 12 h minimal precipitation period and a 6 h gap) was 66 h. During that time, floods were produced within the wadis in the watershed. Rain cells above the Kinnet watershed initially developed only in its eastern side, then later on in the entire watershed, and in some cases significantly larger amounts precipitated in the vicinity of Wadi Arava and Yutum-CN subbasin (Fig. 1b). This flood was most likely facilitated by the first rain period that pre-soaked the ground (13 % of the total precipitation), but it is likely the second rainy spell that provided the runoff that ultimately ended in the discharged flood water as the majority of the rain precipitated within the following 18 h (82 % of the total precipitation).
After the cessation of the rain, wadis continued to receive runoff which flowed downslope towards the outlet of the Kinnet Canal and the sea. This flow reached the sea approximately 50 h after the rain started, and roughly 3 h after most of the rainfall ended.
Unfortunately, in the poorly monitored (very low spatial dispersion of gages and weather stations) catchment area of the October 2016 event it was not possible to assess the transmission losses of the precipitated water. To overcome this issue and give an estimation of water loss from the formation of the rain until water discharge at the river mouth, we used GPM-IMERG precipitation data that has been shown to correlate well with precipitation gauge data both in humid (Pradhan et al., 2022; Yang et al., 2018) and arid regions (Chen et al., 2020; Mohammed et al., 2020). It is important to note that its 0.1° × 0.1° spatial resolution (10 × 10 km grid) does not allow to analyze precipitation accumulated in wadis and lower ranked streams specifically (which is important because same rain event can cause flooding in a particular wadi, while the neighboring wadi remains dry), making the quantification of the patchy nature of a hyperarid rain event impossible; its 30 min temporal resolution however enables to capture the sum of the precipitated water and give us the confidence to apply its dataset on the nearly 5000 km2 Kinnet watershed. We calculate that approximately 133 million m3 precipitated in the entire watershed of the Kinnet Canal during this event and that ∼ 1 million m3 (0.75 %) of it ultimately reached the GAE through the Kinnet Canal. This limited yield reflects the fact that runoff from more distant parts of the watershed (particularly from the eastern sub-basins) faces greater losses due to longer travel distances, allowing for increased infiltration and evaporation. The ∼ 99 % difference reflects infiltration relating to a complex matrix of soil properties and variations in rain intensity, duration, location and evaporation. In arid regions where sequential gage measurements were conducted, transmission loss rates showed considerable variations. For example, 13.2 % in an Australian desert stream (Dunkerley and Brown, 1999) up to 98 % in parts of Saudi Arabia (Walters, 1990); and in between 20 % and 85 %, located in Nahal Zin, Israel's Negev Desert (Greenbaum et al., 2001).
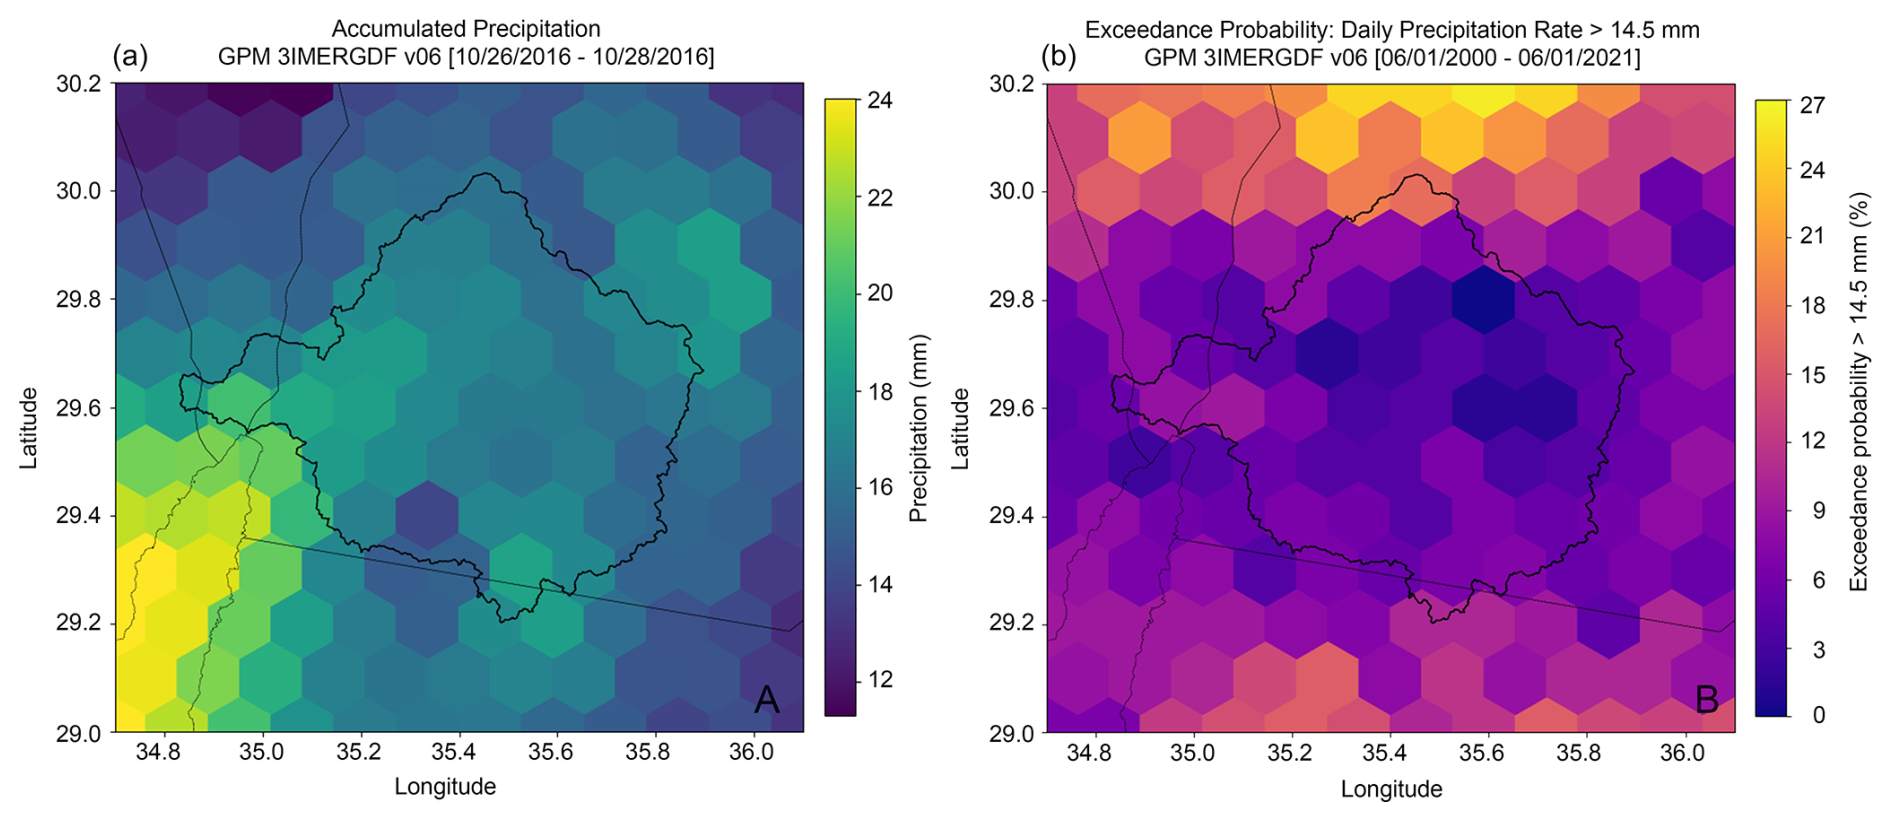
Figure 7GPM-IMERG data visualized in the Kinnet watershed at the head of the Gulf of Aqaba-Eilat, Red Sea. (a) Sum of accumulated rain preceding a flashflood on 27 October 2016. (b) Sum of accumulated rain preceding a flashflood on 27 October 2016. (b) Likelihood of precipitation exceeding 14.5 mm. This threshold corresponds to a local flashflood event recorded on 1 March 2017, when 14.5 mm of rain fell in under 3 h and temporarily flooded the streets of Eilat. This threshold was used to assess flashflood potential across the basin. Likelihood values represent the proportion of days with precipitation exceeding 14.5 mm relative to the total number of days during the analyzed period (2000–2021).
GPM data stretches back 21 years and gives us the opportunity to investigate which areas in the watershed have high(er) probabilities for the water to accumulate (Fig. 7). The 2000–2021 window in Eilat covers 12 years from a prolonged drought period (1994–2012) characterized by three flashfloods only, and a more humid 8-year period (2012–2020) with the occurrence of 12 flashfloods in total (Kalman et al., 2020).
Figure 7a shows the sum of precipitated water within the Kinnet watershed that preceded the formation of the 27 October 2016 flooding event in Eilat. The main accumulation centers during the event were around the surroundings of Wadi Arava and within the Yutum-center sub-basin. Because of the hypersensitivity for extreme weather events of the region, there is a great variety in the distribution of the rainwater that describe each precipitation event. Therefore, the accumulated precipitation case is rather a description of this particular event than an analog to generalize the distribution of the precipitation during any flashflood events.
On 1 March 2017, a small flashflood was generated after a hailstorm directly affected the Eilat mountains. The accumulated water in Eilat gauge station was 14.5 mm (54 % of the yearly total) that precipitated within 3 h. Streets were flooded and closed quickly, but also were reopened within 1 h, because rain water was not sufficient enough to induce waterflow in Yutum ephemeral riverbeds that, if it had occurred, would arrive with a lag to the Kinnet outlet and to its surroundings. Because the rain event was local and could trigger a flashflood, its precipitation (14.5 mm) was used as a threshold value to calculate exceedance probabilities for the Kinnet watershed (Fig. 7b). The highest probabilities for exceeding the threshold value can be found around the Wadi Arava, the southern Jordanian mountains and the northern part of the Yutum-center subbasin. On the other hand, in the center of the Yutum-center subbasin, the likelihood of exceeding the threshold value is near zero. The southern probabilities may be explained by the orographic effect, which forces the RST to flow over high topography as well as the northern probabilities may be explained by the interannual position of the diffluence of the upper-level trough interacting with the RST, and resulting in explosive cyclogenesis (Kouroutzoglou et al., 2015; Ziv et al., 2022).
4.3 Sediment dispersal at sea
Based on the flow and sediment concentrations in the Kinnet canal we calculated that during the October 2016 flashflood, approximately 24 000 t of suspended sediment entered the sea. This value likely and slightly underestimates the true total, as measurements were not available during the initial onset and possibly the waning stage of the flood. Nevertheless, the estimate captures the main body of the event and is representative of the overall magnitude. The amount is similar to the reported 21 000 t of suspended sediment transported to the GEA from the Kinnet Canal during the February 2013 flash flood event (Katz et al., 2015). In both cases the amount far exceeded the annual airborne dust introduced into the northern Gulf of Aqaba-Eilat (Chen et al., 2008). From shallow water sediment cores Katz et al. (2015) roughly estimated average of circa 10 kg sediment per meter square coverage of the alluvium on the seafloor primary deposition zone after a historical flooding in February 2006, which magnitude corresponds with 6 kg sediment on average per meter square coverage produced by the October 2016 event.
When desert floods arrive into the sea, if their sediment concentrations are high enough, their bulk density becomes higher than that of the seawater and they are expected to produce hyperpycnal flows that plunge and progress along the seafloor as turbidity currents (Katz et al., 2015). This high sediment load drags fresher water beneath saltier water layers that would otherwise float above the saltier, denser seawater. If however, sediment concentrations are not high enough and the bulk density of the discharged floodwater is lower than that of the seawater, they form hypopycnal plumes that disperse at and near the sea surface. Notably, in some cases hypopycnal flows can generate turbidity currents due to trickling down (fingering) and amassing of suspended sediments near the seafloor (Parsons et al., 2001).
According to witnesses, the Eilat flood arrived to the sea at 03:00 LT on 28 October, however the mooring data registered the initiation of salinity decrease and turbidity increase only at 09:50 LT in the morning, ∼ 7 h later. If these reports are correct, then this time lag between visual notice and instrumental registration suggests either low sediment concentrations in the discharged water at this initial stage that caused only a hypopycnal plume or a very slow (∼ 1 cm s−1), offshore progression of the mixed flood water. It was also possible that the witnesses in the darkness observed higher discharge without significantly elevated sediment concentration, which water might have originated from a nearby desalination factory. With no measurements from the station at this time, this question remains open. Flood related turbidity at the measuring station lasted from 09:50 LT 28 October until 05:15 LT 29 October and the increased turbidity was registered at approximately the same time in the 0.15 and 8 mab sensors (Fig. 6). This would suggest that by the time floodwater reached the station they were already mixed (though not homogeneously) in the water column. During the ∼ 31 h of the registered event, salinity and sediment concentrations at the measuring station mirror-imaging one another demonstrating considerable fluctuations near the seafloor (Fig. 6). Taking into consideration that there is some lag between the outlet and the measuring station, these fluctuations were likely caused by changes in floodwater and sediment discharge from the Kinnet canal. Such fluctuations would result from changes in the intensity and geographical distribution of the rainfall at the catchment area, many hours earlier. At its peak, salinity at the moored station was reduced to 38.75 ‰ which is approximately 1.75 ‰ less than the measured salinity in the 7 months of measurements prior to the event. This drop is 19 times greater than the standard deviation of the salinity observed during that period. This drop clearly demonstrates that the freshwater arriving with the flashflood was denser due to its high sediment load, and therefore was forced downward rather than being distributed on the water surface. The drop coincided with the highest TSS to salinity ratios suggesting a concurrent increase in sediment concentrations in the discharged floodwater (Fig. 8a).
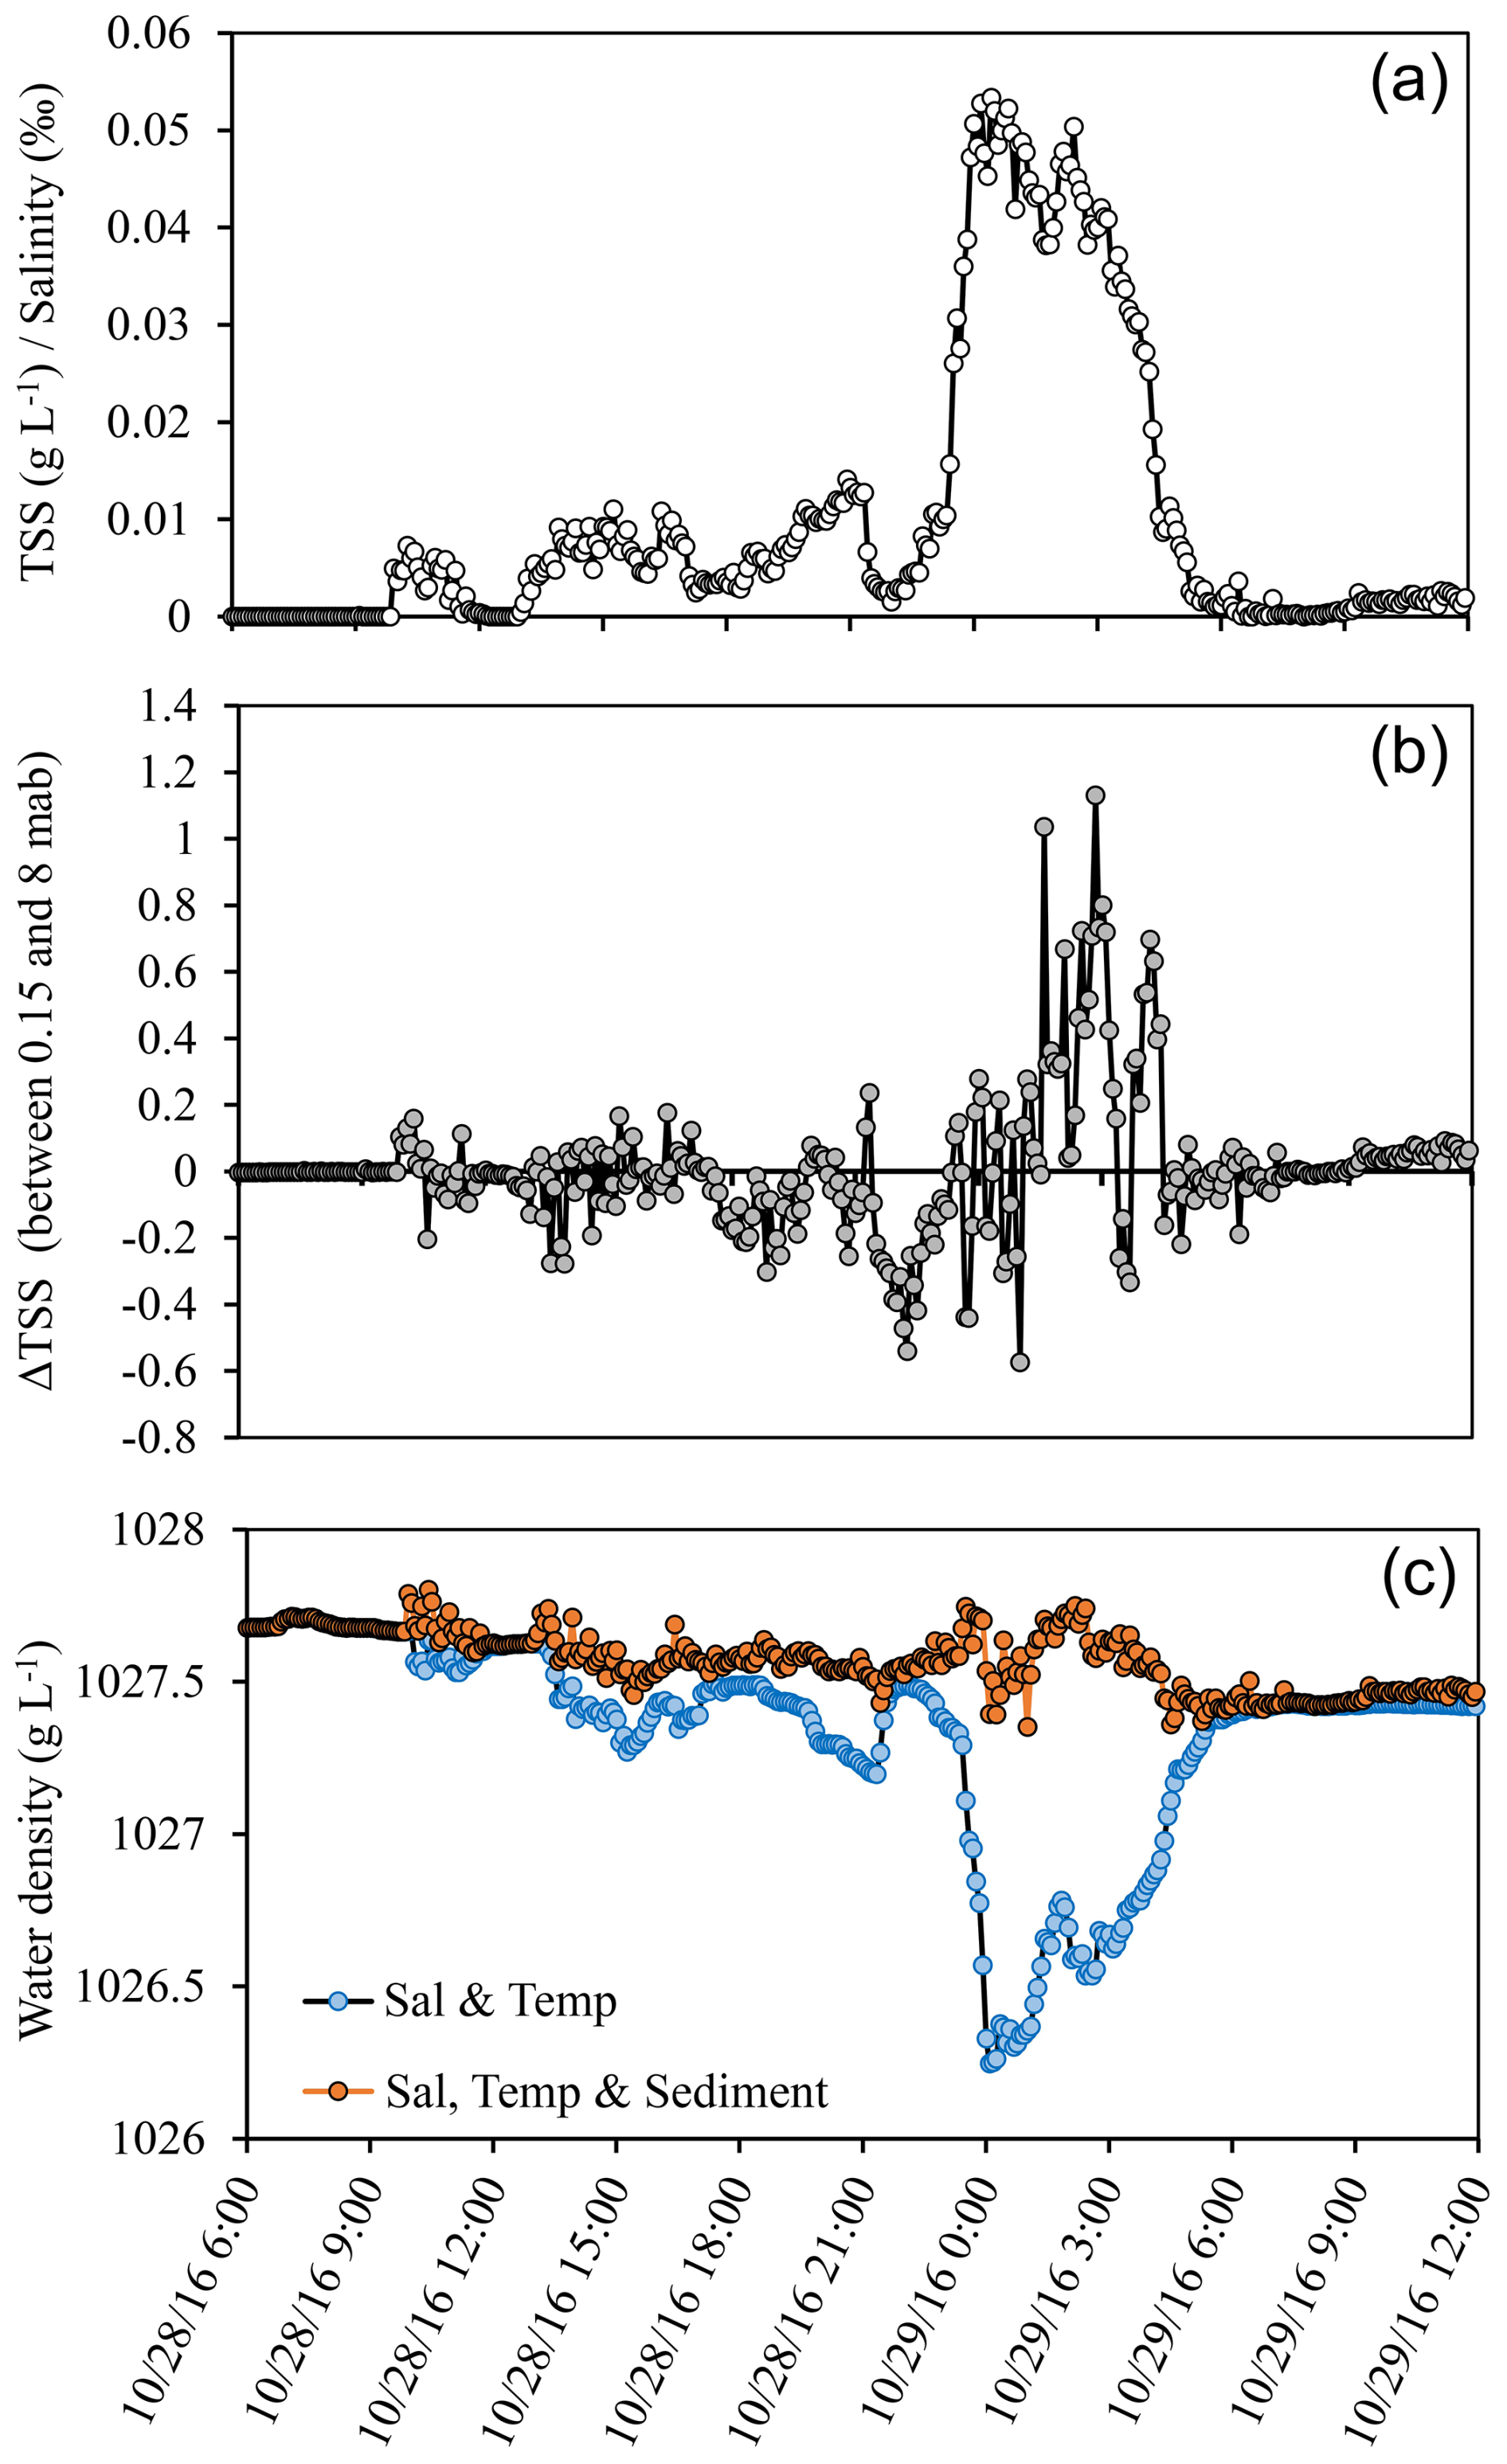
Figure 8Measurements of an offshore mooring station of the 27 October 2016 flashflood event that reached the sea in the northern Gulf of Aqaba-Eilat. The floodwater discharged with low salinities loaded with high concentrations of suspended sediments to the sea (a), resulted in both hypo- and hyperpycnal plumes (b), and elevated bottom water densities (c) during the evolution of the flood.
Moreover, during this and three prior, though much smaller events, sediment concentrations near the seafloor (0.15 mab) were higher than those measured at 8 mab, (Fig. 8b). Although floodwater and sediments were found throughout the water column at the station area early on, these measurements indicate intermittent occurrences of hyperpycnal flows during this time. This assumption is supported by calculated density of the bottom water, based only on the temperature and salinity and then after correcting it with the suspended sediment concentrations (assuming mean sediment particles density of 2.65 g cm−3). The results, shown in Fig. 8c demonstrate that the freshening of the seawater alone would have greatly reduced the bottom water density, causing it to float. However, when corrected with the suspended sediment concentrations, the bulk density of the near bottom water occasionally exceeds that of the undiluted seawater, enabling it to plunge and progress as a hyperpycnal flow. Even more so, when considering the gradual decrease in the salinity (and hence density) of the water column offshore the Kinnet outlet during the flood which further decreased the incoming floodwater buoyancy. Notably, in the 5, discrete measurements of sediment concentrations that were made in the Kinnet Canal during the flood, the highest value was 33.5 g L−1. This value is considerably less than the required ∼ 43 g L−1 to cause direct hyperpycnal plumes in the head of the GAE (Katz et al., 2015). We therefore expect that at the beginning of the floods, convective fingering of sediment from above may have caused smaller hyperpycnal events near the seafloor (Parsons et al., 2001). Conversely, the major hyperpycnal flow that was registered at the marine station between 11:00 LT 28 October and 04:30 LT 29 October was likely caused by direct plunging of dense flood water. This would suggest that sometime around 02:00 LT between the 3rd and 4th TSS measurements, sediment concentrations in the Kinnet may have reached the required minimum threshold (36–43 g L−1) to generate a hyperpycnal plume upon entering the GAE. Sediment concentration measurements at the outlet during both the 3rd and 4th collections were around 15-fold higher relative to the marine station 250 m offshore. These values record the process of both dilution with seawater and sediment dispersal as the suspected plume traveled along the seafloor. It is therefore reasonable to assume, given the relatively low sediment concentration values recorded (2.18 g L−1) at 250 m offshore that the proposed hyperpycnal plume dissipated before reasing the station's sensors. While a hyperpycnal plume may not have been present at that distance, sediment dispersal continued in the form of near-bottom transport, possibly enhanced by added sediment entrained in the turbulent flow. Salinity returned to near background levels by 05:45 LT 29 October, and remained at ∼ 40.3 PSU, ∼ 0.2 PSU less than average until the retrieval of the mooring 9 d after the flood event.
4.4 Storms, Rain, Flashfloods, and Planning
In this study, we show how climate and sediments are related. The synoptic analysis of the storms illustrate what key parameters contribute to the triggering mechanism of a storm and where in the particular watershed is likely to rain. Using reanalysis data, all these parameters can be collected for each flood event and a database can be formed. When flooding, large quantities of sediments from the catchments can be transported to the sea, where they may serve as a climate archive. Although sediments upon arriving to the sea in the northernmost GAE undergo different levels of post-depositional processes that alter their physical-chemical properties; by recognizing changes in flood deposit signatures, it is possible to reconstruct past climatic variations on the seafloor downcore (Kalman et al., 2020, 2022; Katz et al., 2015). Just as atmospheric parameters are catalogued in synoptic analyses, the physical and chemical properties of flashflood sediments in their depositional settings can be compiled into the same database, linking atmospheric triggers with sedimentary responses. While the use of machine learning requires large datasets, we propose that in locations where distinct flood layers are consistently preserved (potentially hundreds of well-characterized sediment-climate pairs), such datasets could be developed and applied to train machine learning models. It is expected that the combined analysis of climatology, hydrology and sedimentology of flash flood events will help to better understand the interlinkages between the otherwise separately discussed aspects of flood hazards in hyperarid regions (Fig. 9). Furthermore, it will impose careful site selection and proper planning in the establishment of new coastal cities and already existing cities planning to expand.
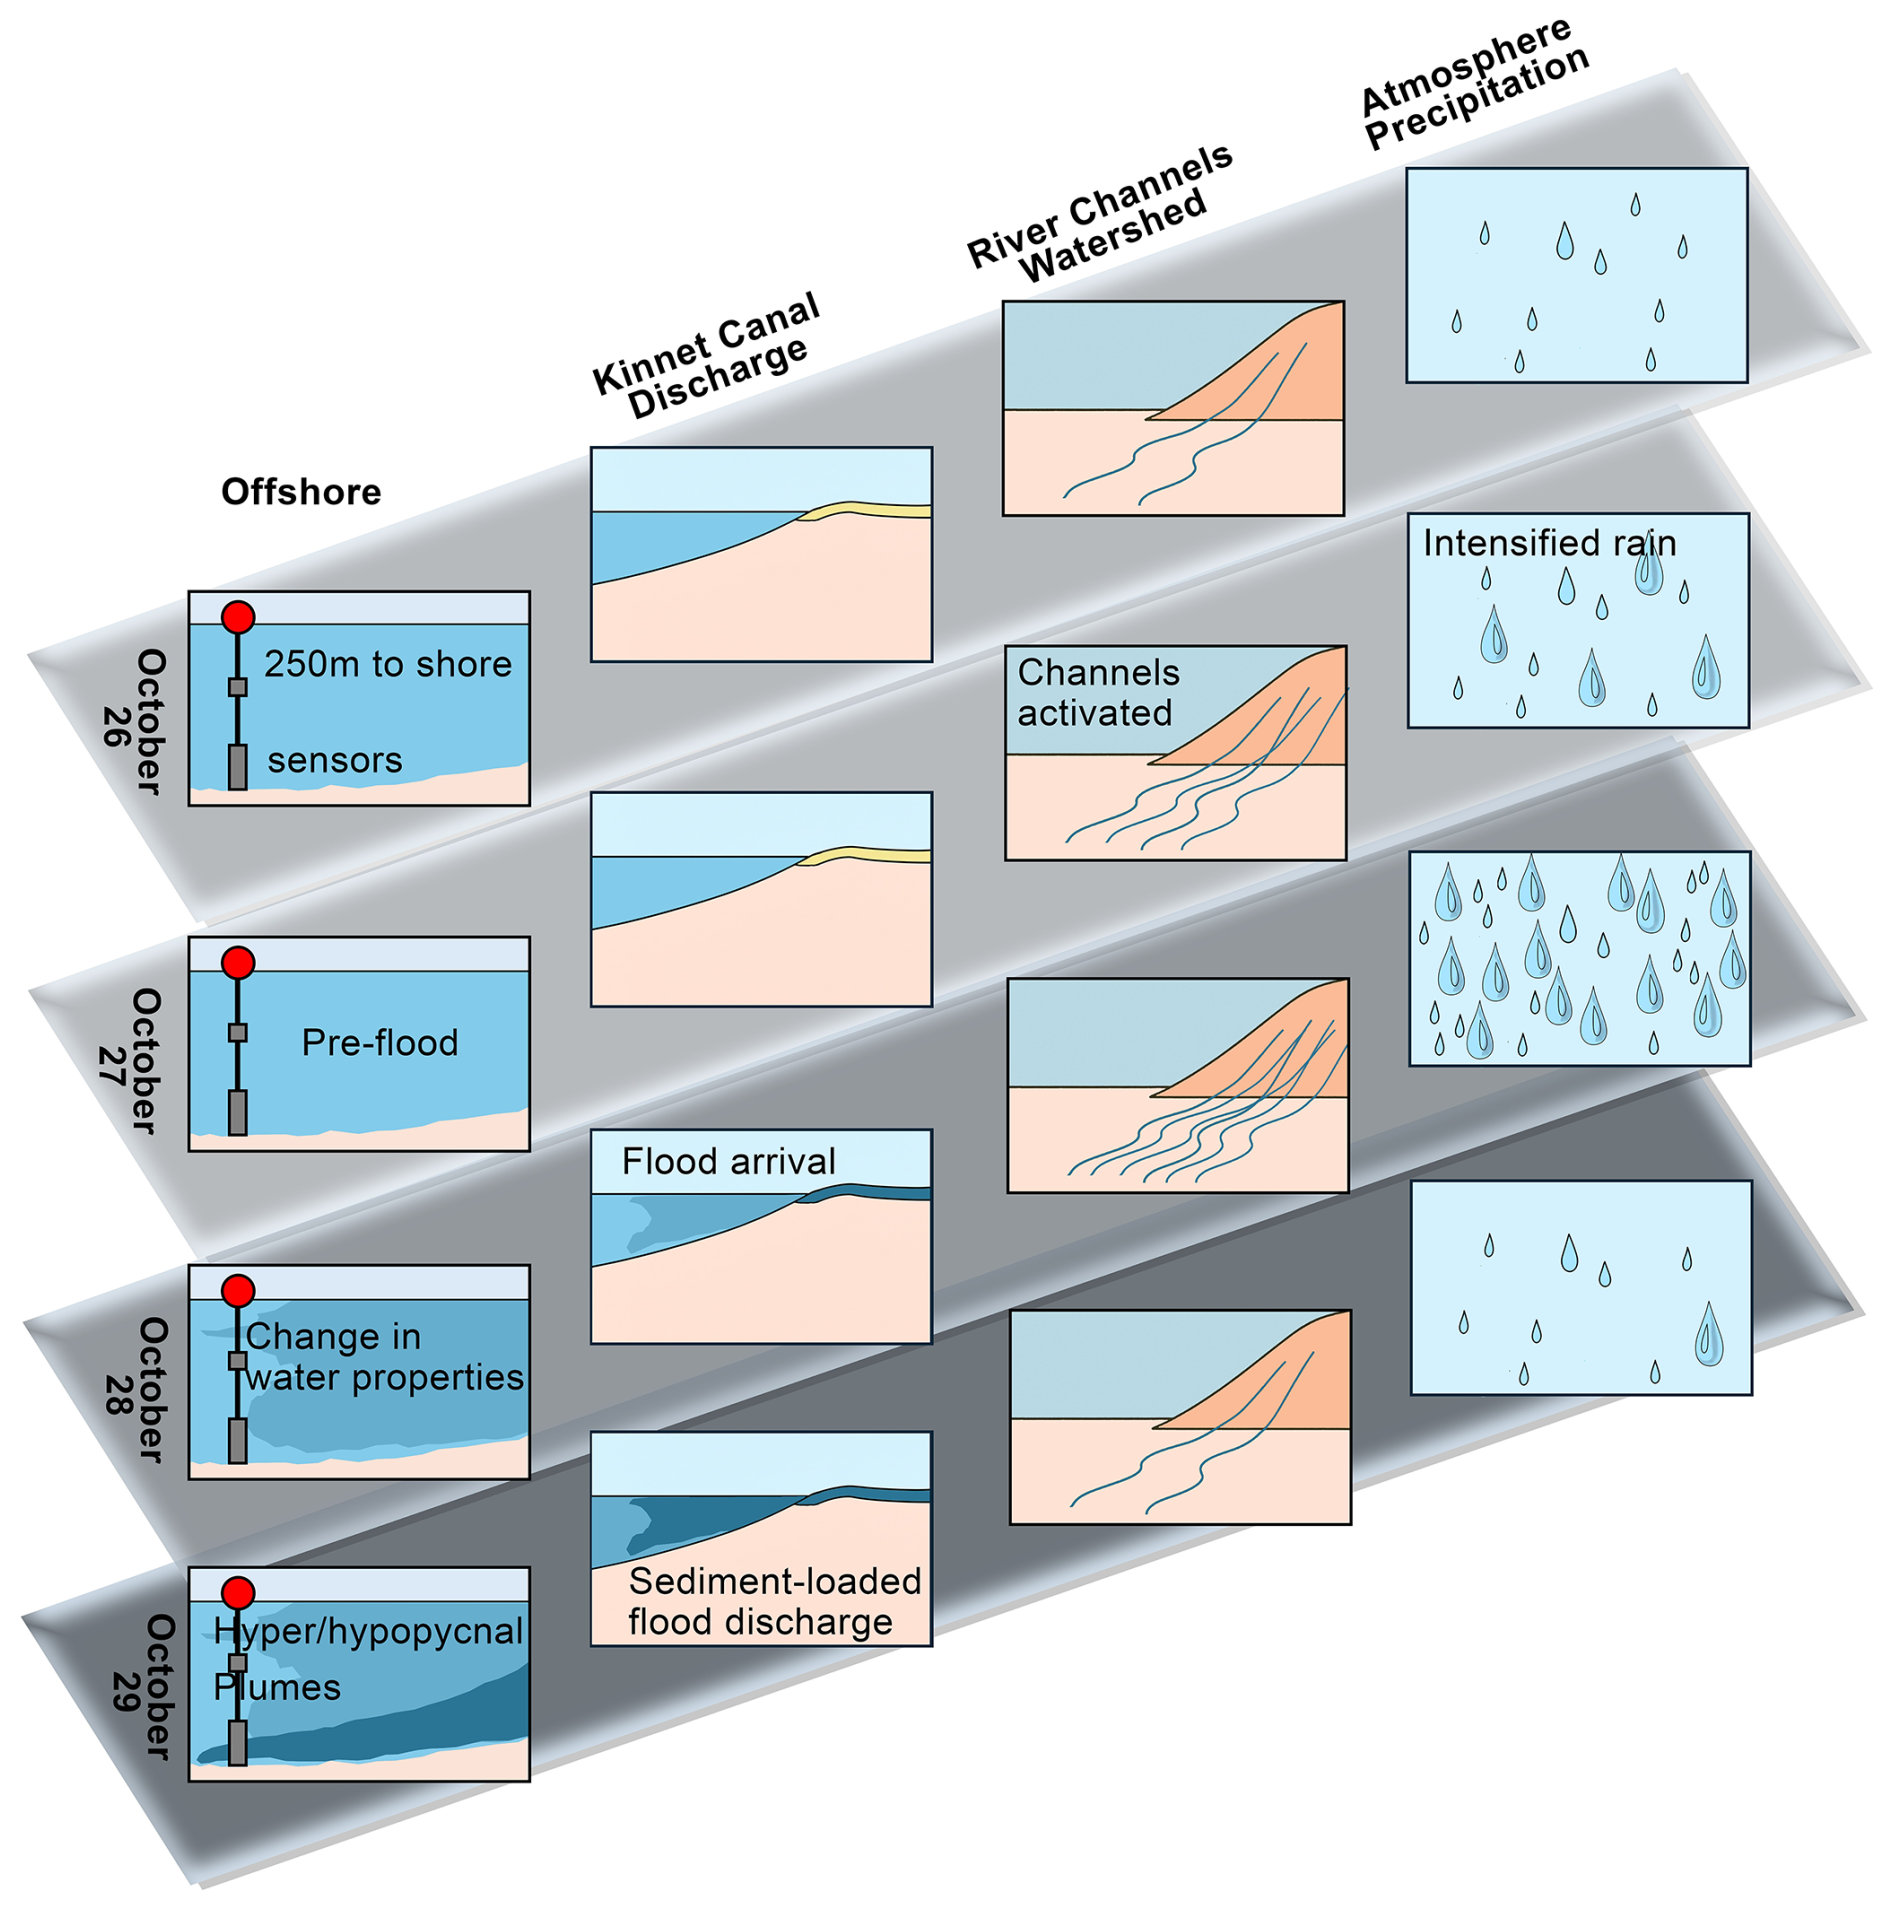
Figure 9Sequence of sediment transport processes during the October 2016 flash flood in Eilat. The figure illustrates daily changes from 26–29 October 2016, showing the evolution of sediment transport from precipitation to offshore deposition in the northern Red Sea. It details concurrent developments in offshore waters, at the canal discharge point, within the watershed, and includes rainfall intensity for each day. The seven key stages include: (1) atmospheric conditions conducive to precipitation, (2) precipitation events, (3) watershed drainage, (4) flash flood formation, (5) sediment and water transport to the coastline, (6) discharge at the coastal outlet, and (7) marine dispersal and deposition.
A hyper arid region flashflood event was studied from its preceding meteorological conditions, precipitation, run-off development, and ending with its arrival into the Gulf of Eilat-Aqaba. It was observed that a negative phase of the North Atlantic Oscillation triggered an amplified Rossby wave, whereas its lower flank reached the Levant region and created thunderstorms leading to an exceptional 3 d long rain event in Eilat, Israel. The precipitation was unevenly distributed in the watershed, and needed 51 h to reach the Kinnet canal outlet. Only 0.75 % of the precipitated water reached the sea eventually. Sediment transport into the sea during this single event far exceeded annual airborne dust precipitation. Both hypo- and hyperpycnal plumes during the flood event were instrumentally captured. It is concluded that meteorological and climate precursors are the earliest to identify actual environmental conditions, and since precipitation and sedimentation are linked, flash flood born sediment in marine deposits can provide a key to identifying paleoclimatic trends that together can serve as basic input for developing early warning systems against flash floods and related hazards.
The data supporting the findings of this study is available from the corresponding author upon reasonable request.
The Supplement contains a video (“Video S1.gif”) illustrating the visualization of cold air escaping from the Arctic region and triggering the ARST event. The supplement related to this article is available online at https://doi.org/10.5194/nhess-25-3201-2025-supplement.
Conceptualization: AK, TK, PH, BGT. Data curation: AK, TK, MV, JL, BGT. Formal analysis: AK, TK, MV, JL. Investigation: AK, AM. Methodology: AK, TK, AM, PH, BGT. Visualization: AK, TK, MV, JL, BGT. Writing – original draft preparation: AK. Writing – review & editing: AK, TK, MV, JL, AM, PH, BGT. Supervision: TK, BGT. Resources: TK, PH, BGT. Project administration: AK, TK, BGT. Funding acquisition: TK, PH, BGT.
The contact author has declared that none of the authors has any competing interests.
Publisher's note: Copernicus Publications remains neutral with regard to jurisdictional claims made in the text, published maps, institutional affiliations, or any other geographical representation in this paper. While Copernicus Publications makes every effort to include appropriate place names, the final responsibility lies with the authors. Also, please note that this paper has not received English language copy-editing. Views expressed in the text are those of the authors and do not necessarily reflect the views of the publisher.
The research was funded by the Schulich Foundation Canada-Israel Collaboration Project, the Ministry of Interior, Israel and the Yohay Ben-Nun Foundation NAF-IOLR. The authors thank the Interuniversity Institute for Marine Sciences Eilat for general support and members of the Institute who contributed during in situ sampling of the flash flood in harsh and sometimes dangerous conditions. We thank Hadas Saaroni for her thorough and precious feedback. Special thanks to Eyal Amitai, Emanuel Sestieri, Erez Levin, Asher Meir, Ofir Hameiri, Sivan David, Gabriele Guerrini, Gal Eyal, and Guilhem Banc-Prandi.
This paper was edited by Piero Lionello and reviewed by Piero Lionello and two anonymous referees.
Allison, M. A., Demas, C. R., Ebersole, B. A., Kleiss, B. A., Little, C. D., Meselhe, E. A., Powell, N. J., Pratt, T. C., and Vosburg, B. M.: A water and sediment budget for the lower Mississippi–Atchafalaya River in flood years 2008–2010: Implications for sediment discharge to the oceans and coastal restoration in Louisiana, J. Hydrol., 432–433, 84–97, https://doi.org/10.1016/j.jhydrol.2012.02.020, 2012.
Alpert, P., Osetinsky, I., Ziv, B., and Shafir, H.: Semi-objective classification for daily synoptic systems: Application to the eastern Mediterranean climate change, Int. J. Climatol., 24, 1001–1011, https://doi.org/10.1002/joc.1036, 2004a.
Alpert, P., Osetinsky, I., Ziv, B. and Shafir, H.: A new seasons definition based on classified daily synoptic systems: an example for the eastern Mediterranean, Int. J. Climatol., 24, 1013–1021, https://doi.org/10.1002/joc.1037, 2004b.
Arieli, T.: Aqaba and Eilat: Twenty-five years of “good neighborly relations” in a post-conflict environment, in: Twin Cities across Five Continents, Routledge, 133–146, ISBN 9781003102526, 2021.
Ashbel, D.: Great floods in Sinai Peninsula, Palestine, Syria and the Syrian Desert, and the influence of the red sea on their formation, Q. J. R. Meteorol. Soc., 64, 635–639, https://doi.org/10.1002/qj.49706427716, 1938.
Asiri, M. A., Almazroui, M., and Awad, A. M.: Synoptic features associated with the winter variability of the subtropical jet stream over Africa and the Middle East, Meteorol. Atmos. Phys., 132, 819–831, 2020.
Awad, A. M. and Almazroui, M.: Climatology of the winter Red Sea trough, Atmospheric Research, 182, 20–29, https://doi.org/10.1016/j.atmosres.2016.07.019, 2016.
Azaryahu, M.: The beach at the end of the world: Eilat in Israeli popular culture, Soc. Cult. Geogr., 6, 117–133, https://doi.org/10.1080/1464936052000335008, 2005.
Bajjali, W.: ArcGIS for environmental and water issues, Springer, https://doi.org/10.1007/978-3-319-61158-7, 2017.
Barragán, J. M. and de Andrés, M.: Analysis and trends of the world's coastal cities and agglomerations, Ocean Coast. Manag., 114, 11–20, https://doi.org/10.1016/j.ocecoaman.2015.06.004, 2015.
Blum, M. D. and Törnqvist, T. E.: Fluvial responses to climate and sea-level change: a review and look forward, Sedimentology, 47, 2–48, https://doi.org/10.1046/j.1365-3091.2000.00008.x, 2000.
Branstator, G.: Circumglobal teleconnections, the jet stream waveguide, and the North Atlantic Oscillation, J. Clim., 15, 1893–1910, 2002.
Chen, C., Chen, Q., Qin, B., Zhao, S., and Duan, Z.: Comparison of different methods for spatial downscaling of GPM IMERG V06B satellite precipitation product over a typical arid to semi-arid area, Front. Earth Sci., 8, 536337, https://doi.org/10.3389/feart.2020.536337, 2020.
Chen, Y., Paytan, A., Chase, Z., Measures, C., Beck, A. J., Sañudo-Wilhelmy, S. A., and Post, A. F.: Sources and fluxes of atmospheric trace elements to the Gulf of Aqaba, Red Sea, J. Geophys. Res. Atmos., 113, 1–13, https://doi.org/10.1029/2007JD009110, 2008.
Chie, Y. B.: Dimensionally Homogeneous Manning's Formula, J. Hydraul. Eng., 118, 1326–1332, https://doi.org/10.1061/(ASCE)0733-9429(1992)118:9(1326), 1992.
Clapp, E. M., Bierman, P. R., Schick, A. P., Lekach, J., Enzel, Y., and Caffee, M.: Sediment yield exceeds sediment production in arid region drainage basins, Geology, 28, 995–998, https://doi.org/10.1130/0091-7613(2000)28<995:SYESPI>2.0.CO;2, 2000.
Cohen, H. and Laronne, J. B.: High rates of sediment transport by flashfloods in the Southern Judean Desert, Israel, Hydrol. Process., 19, 1687–1702, https://doi.org/10.1002/hyp.5630, 2005.
Cools, J., Vanderkimpen, P., El Afandi, G., Abdelkhalek, A., Fockedey, S., El Sammany, M., Abdallah, G., El Bihery, M., Bauwens, W., and Huygens, M.: An early warning system for flash floods in hyper-arid Egypt, Nat. Hazards Earth Syst. Sci., 12, 443–457, https://doi.org/10.5194/nhess-12-443-2012, 2012.
Dayan, U., Ziv, B., Margalit, A., Morin, E. Y., and Sharon, D.: A severe autumn storm over the middle-east: synoptic and mesoscale convection analysis, Theor. Appl. Climatol., 122, 103–122, https://doi.org/10.1007/s007040170038, 2001.
Dayan, U., Ziv, B., Shoob, T., and Enzel, Y.: Suspended dust over southeastern Mediterranean and its relation to atmospheric circulations, Int. J. Climatol., 28, 915–924, https://doi.org/10.1002/joc.1587, 2008.
Dayan, U., Lensky, I. M., Ziv, B., and Khain, P.: Atmospheric conditions leading to an exceptional fatal flash flood in the Negev Desert, Israel, Nat. Hazards Earth Syst. Sci., 21, 1583–1597, https://doi.org/10.5194/nhess-21-1583-2021, 2021.
De Vries, A. J., Tyrlis, E., Edry, D., Krichak, S. O., Steil, B., and Lelieveld, J.: Extreme precipitation events in the Middle East: Dynamics of the Active Red Sea Trough, J. Geophys. Res. Atmos., 118, 7087–7108, https://doi.org/10.1002/jgrd.50569, 2013.
de Vries, A. J., Ouwersloot, H. G., Feldstein, S. B., Riemer, M., El Kenawy, A. M., McCabe, M. F., and Lelieveld, J.: Identification of Tropical-Extratropical Interactions and Extreme Precipitation Events in the Middle East Based On Potential Vorticity and Moisture Transport, J. Geophys. Res. Atmos., 123, 861–881, https://doi.org/10.1002/2017JD027587, 2018.
Draper, D. W., Newell, D. A., Wentz, F. J., Krimchansky, S., and Skofronick-Jackson, G. M.: The global precipitation measurement (GPM) microwave imager (GMI): Instrument overview and early on-orbit performance, IEEE J. Sel. Top. Appl. Earth Obs. Remote Sens., 8, 3452–3462, 2015.
Dunkerley, D. and Brown, K.: Flow behaviour, suspended sediment transport and transmission losses in a small (sub-bank-full) flow event in an Australian desert stream, Hydrol. Process., 13, 1577–1588, 1999.
El-Fandy, M. G.: The effect of the sudan monsoon low on the development of thundery conditions in Egpyt, Palestine and Syria, Quarterly Journal of the Royal Meteorological Society, 74, 31–38, 1948.
El-Fandy, M. G.: Effects of Topography and Other Factors on the Movement of Lows in the Middle East and Sudan, Bull. Am. Meteorol. Soc., 31, 375–381, https://doi.org/10.1175/1520-0477-31.10.375, 1950.
Farhan, Y. and Anaba, O.: Flash Flood Risk Estimation of Wadi Yutum (Southern Jordan) Watershed Using GIS Based Morphometric Analysis and Remote Sensing Techniques, Open J. Mod. Hydrol., 6, 79–100, https://doi.org/10.4236/ojmh.2016.62008, 2016.
Farhan, Y. and Anbar, A.: Fragile Landscape: Impact and Consequences of May 2014 Flash-flood Disaster in the Aqaba Area, Southern Jordan, Res. J. Environ. Earth Sci., 6, 451–465, https://doi.org/10.19026/rjees.6.5257, 2014.
Gee, G. W. and Hillel, D.: Groundwater recharge in arid regions: Review and critique of estimation methods, Hydrol. Process., 2, 255–266, https://doi.org/10.1002/hyp.3360020306, 1988.
Greenbaum, N., Enzel, Y., and Schick, A. P.: Magnitude and frequency of paleofloods and historical floods in the Arava basin, Negev Desert, Israel, Isr. J. Earth Sci., 50, 159–186, https://doi.org/10.1092/N5VU-FU5F-QNWC-UDCK, 2001.
Haggag, M. and El-Badry, H.: Mesoscale Numerical Study of Quasi-Stationary Convective System over Jeddah in November 2009, Atmos. Clim. Sci., 3, 73–86, https://doi.org/10.4236/acs.2013.31010, 2013.
Hereford, R., Webb, R. H., and Longpré, C. I.: Precipitation history and ecosystem response to multidecadal precipitation variability in the Mojave Desert region, 1893–2001, J. Arid Environ., 67, 13–34, https://doi.org/10.1016/j.jaridenv.2006.09.019, 2006.
Hickey, B. M., Kudela, R. M., Nash, J. D., Bruland, K. W., Peterson, W. T., MacCready, P., Lessard, E. J., Jay, D. A., Banas, N. S., Baptista, A. M., Dever, E. P., Kosro, P. M., Kilcher, L. K., Horner-Devine, A. R., Zaron, E. D., McCabe, R. M., Peterson, J. O., Orton, P. M., Pan, J., and Lohan, M. C.: River Influences on Shelf Ecosystems: Introduction and synthesis, J. Geophys. Res. Ocean., 115, https://doi.org/10.1029/2009JC005452, 2010.
Hochman, A., Alpert, P., Kunin, P., Rostkier-Edelstein, D., Harpaz, T., Saaroni, H., and Messori, G.: The dynamics of cyclones in the twentyfirst century: the Eastern Mediterranean as an example, Clim. Dyn., 54, 561–574, https://doi.org/10.1007/s00382-019-05017-3, 2020.
Hochman, A., Rostkier-Edelstein, D., Kunin, P., and Pinto, J. G.: Changes in the characteristics of “wet” and “dry” Red Sea Trough over the Eastern Mediterranean in CMIP5 climate projections, Theor. Appl. Climatol., 143, 781–794, https://doi.org/10.1007/s00704-020-03449-0, 2021.
Hochman, A., Plotnik, T., Marra, F., Shehter, E.-R., Raveh-Rubin, S., and Magaritz-Ronen, L.: The sources of extreme precipitation predictability; the case of the “Wet” Red Sea Trough, Weather and Climate Extremes, 40, 100564, https://doi.org/10.1016/j.wace.2023.100564, 2023.
Holdren, J. P. and Ehrlich, P. R.: Human population and the global environment, Am. Sci., 62, 282–292, 1974.
Huffman, G. J., Bolvin, D. T., Braithwaite, D., Hsu, K.-L., Joyce, R. J., Kidd, C., Nelkin, E. J., Sorooshian, S., Stocker, E. F., and Tan, J.: Integrated multi-satellite retrievals for the global precipitation measurement (GPM) mission (IMERG), Satell. Precip. Meas., 1, 343–353, 2020.
Kahana, R., Ziv, B., Enzel, Y., and Dayan, U.: Synoptic climatology of major floods in the Negev Desert, Israel, Int. J. Climatol., 22, 867–882, https://doi.org/10.1002/joc.766, 2002.
Kalman, A., Katz, T., Hill, P., and Goodman-Tchernov, B.: Droughts in the desert: Medieval Warm Period associated with coarse sediment layers in the Gulf of Aqaba-Eilat, Red Sea, Sedimentology, 67, 3152–3166, https://doi.org/10.1111/sed.12737, 2020.
Kalman, A., Goodman-Tchernov, B., Hill, P., Everhardt IV, C., Mathalon, A., and Katz, T.: Anthropogenic changes in waterways produce “drought-like” layers in shelf sediments, Elem. Sci. Anthr., 10, 39, https://doi.org/10.1525/elementa.2021.00039, 2022.
Katz, T., Ginat, H., Eyal, G., Steiner, Z., Braun, Y., Shalev, S., and Goodman-Tchernov, B. N.: Desert flash floods form hyperpycnal flows in the coral-rich Gulf of Aqaba, Red Sea, Earth Planet. Sci. Lett., 417, 87–98, https://doi.org/10.1016/j.epsl.2015.02.025, 2015.
Kouroutzoglou, J., Flocas, H. A., Hatzaki, M., Keay, K., Simmonds, I., and Mavroudis, A.: On the dynamics of a case study of explosive cyclogenesis in the Mediterranean, Meteorol. Atmos. Phys., 127, 49–73, 2015.
Krichak, S. O. and Alpert, P.: Role of large scale moist dynamics in November 1–5, 1994, hazardous Mediterranean weather, J. Geophys. Res. Atmos., 103, 19453–19468, https://doi.org/10.1029/98JD01710, 1998.
Krichak, S. O., Breitgand, J. S., and Feldstein, S. B.: A conceptual model for the identification of active Red Sea trough synoptic events over the southeastern Mediterranean, J. Appl. Meteorol. Climatol., 51, 962–971, 2012.
Lekach, J. and Schick, P.: Suspended sediment in desert floods in small catchments, Isr. J. Earth-Sciences, 31, 144–156, 1982.
Loya, Y.: The coral reefs of Eilat – past, present and future: three decades of coral community structure studies, in: Coral health and disease, Springer, 1–34, https://doi.org/10.1007/978-3-662-06414-6_1, 2004.
Masaki, T., Kubota, T., Oki, R., Kojima, M., Furukawa, K., Miura, T., Kai, H., Iguchi, T., Hanado, H., and Yoshida, N.: Development of level 1 algorithm of dual frequency precipitation radar (DPR) for the global precipitation measurement (GPM), in: 2014 IEEE Geoscience and Remote Sensing Symposium, 4962–4965, https://doi.org/10.1109/IGARSS.2014.6947609, 2014.
Mathalon, A., Goodman-Tchernov, B., Hill, P., Kálmán, Á., and Katz, T.: Factors influencing flashflood deposit preservation in shallow marine sediments of a hyperarid environment, Mar. Geol., 411, 22–35, https://doi.org/10.1016/j.margeo.2019.01.010, 2019.
Merz, B., Blöschl, G., Vorogushyn, S., Dottori, F., Aerts, J. C. J. H., Bates, P., Bertola, M., Kemter, M., Kreibich, H., Lall, U., and Macdonald, E.: Causes, impacts and patterns of disastrous river floods, Nat. Rev. Earth Environ., 2, 592–609, https://doi.org/10.1038/s43017-021-00195-3, 2021.
Milliman, J. D. and Farnsworth, K. L.: River discharge to the coastal ocean: a global synthesis, Cambridge University Press, ISBN 978-0-521-87987-3, 2013.
Mohammed, S. A., Hamouda, M. A., Mahmoud, M. T., and Mohamed, M. M.: Performance of GPM-IMERG precipitation products under diverse topographical features and multiple-intensity rainfall in an arid region, Hydrol. Earth Syst. Sci. Discuss. [preprint], https://doi.org/10.5194/hess-2019-547, 2020.
Mulder, T., Syvitski, J. P. M., Migeon, S., Faugères, J. C., and Savoye, B.: Marine hyperpycnal flows: Initiation, behaviorand related deposits. A review, Mar. Pet. Geol., 20, 861–882, https://doi.org/10.1016/j.marpetgeo.2003.01.003, 2003.
Mullenbach, B. L. and Nittrouer, C. A.: Rapid deposition of fluvial sediment in the Eel Canyon, northern California, Cont. Shelf Res., 20, 2191–2212, https://doi.org/10.1016/S0278-4343(00)00067-4, 2000.
Neumann, B., Vafeidis, A. T., Zimmermann, J., and Nicholls, R. J.: Future coastal population growth and exposure to sea-level rise and coastal flooding – A global assessment, PLoS One, 10, https://doi.org/10.1371/journal.pone.0118571, 2015.
Nguyen, P., Shearer, E., Tran, H., Ombadi, M., Hayatbini, N., Palacios, T., Huynh, P., Braithwaite, D., Updegraff, G., Hsu, K., and Kuligowski, B.: The CHRS Data Portal, an easily accessible public repository for PERSIANN global satellite precipitation data, Sci. Data, 6, 180296, https://doi.org/10.1038/sdata.2018.296, 2019.
Parsons, J. D., Bush, J. W. M., and Syvitski, J. P. M.: Hyperpycnal plume formation from riverine outflows with small sediment concentrations, Sedimentology, 48, 465–478, 2001.
Pradhan, R. K., Markonis, Y., Godoy, M. R. V., Villalba-Pradas, A., Andreadis, K. M., Nikolopoulos, E. I., Papalexiou, S. M., Rahim, A., Tapiador, F. J., and Hanel, M.: Review of GPM IMERG performance: A global perspective, Remote Sens. Environ., 268, 112754, https://doi.org/10.1016/j.rse.2021.112754, 2022.
Reid, I. and Frostick, L. E.: Flow dynamics and suspended sediment properties in arid zone flash floods, Hydrol. Process., 1, 239–253, https://doi.org/10.1002/hyp.3360010303, 1987.
Saaroni, H., Harpaz, T., Alpert, P., and Ziv, B.: Automatic identification and classification of the northern part of the Red Sea trough and its application for climatological analysis, Int. J. Climatol., 40, 3607–3622, https://doi.org/10.1002/joc.6416, 2020.
Saligheh, M.: The Effect of Merging Subtropical Jet Stream and Polar Fronts Jet Stream on Heavy Rainfall in Southwest Asia, https://doi.org/10.21203/rs.3.rs-839144/v1, 2021.
Schick, A. P. and Lekach, J.: An evaulation of two ten-year sediment budgets, Nahal Yael, Israel, Phys. Geogr., 14, 225–238, https://doi.org/10.1080/02723646.1993.10642477, 1993.
Shalash, S.: Effects of sedimentation on the storage capacity of the High Aswan Dam reservoir, Hydrobiologia, 91–92, 623–639, https://doi.org/10.1007/BF00000061, 1982.
Sharon, D.: The spottiness of rainfall in a desert area, J. Hydrol., 17, 161–175, https://doi.org/10.1016/0022-1694(72)90002-9, 1972.
Shentsis, I., Meirovich, L., Ben-Zvi, A., and Rosenthal, E.: Assessment of transmission losses and groundwater recharge from runoff events in watercourses of the Neqarot watershed, Israel, Isr. J. Earth Sci., 50, 201–215, https://doi.org/10.1092/J79L-39QP-NC9G-WFTF, 2001.
Small, C. and Nicholls, R.: A Global Analysis of Human Settlement in Coastal Zones, J. Coast. Res., 19, 584–599, ISSN 07490208, 2003.
Syvitski, J. P. M., Vörösmarty, C. J., Kettner, A. J., and Green, P.: Impact of humans on the flux of terrestrial sediment to the global coastal ocean, Science , 308, 376–380, https://doi.org/10.1126/science.1109454, 2005.
Tapiador, F. J., Navarro, A., García-Ortega, E., Merino, A., Sánchez, J. L., Marcos, C., and Kummerow, C.: The contribution of rain gauges in the calibration of the IMERG product: Results from the first validation over Spain, J. Hydrometeorol., 21, 161–182, 2020.
Tsvieli, Y. and Zangvil, A.: Synoptic climatological analysis of “wet” and “dry” Red Sea Troughs over Israel, Int. J. Climatol., 25, 1997–2015, https://doi.org/10.1002/joc.1232, 2005.
Walters, M. O.: Transmission losses in arid region, J. Hydraul. Eng., 116, 129–138, 1990.
Xilotl Soberon, J. R., Rofé, Y.: Modeling the bi-national city process of Eilat–Aqaba, a bi-national city in a cold peace setting, GeoJournal, 82, 1263–1274, https://doi.org/10.1007/s10708-016-9748-5, 2017.
Yang, H. F., Yang, S. L., Xu, K. H., Milliman, J. D., Wang, H., Yang, Z., Chen, Z., and Zhang, C. Y.: Human impacts on sediment in the Yangtze River: A review and new perspectives, Glob. Planet. Change, 162, 8–17, https://doi.org/10.1016/j.gloplacha.2018.01.001, 2018.
Youssef, A. M., Sefry, S. A., Pradhan, B., and Alfadail, E. A.: Analysis on causes of flash flood in Jeddah city (Kingdom of Saudi Arabia) of 2009 and 2011 using multi-sensor remote sensing data and GIS, Geomatics, Nat. Hazards Risk, 7, 1018–1042, https://doi.org/10.1080/19475705.2015.1012750, 2016.
Zirks, E., Krom, M., Schmiedl, G., Katz, T., Xiong, Y., Alcott, L. J., Poulton, S. W., and Goodman-Tchernov, B.: Redox evolution and the development of oxygen minimum zones in the Eastern Mediterranean Levantine basin during the early Holocene, Geochim. Cosmochim. Acta, 297, 82–100, https://doi.org/10.1016/j.gca.2021.01.009, 2021.
Ziv, B., Dayan, U., and Sharon, D.: A mid-winter, tropical extreme flood-producing storm in southern Israel: Synoptic scale analysis, Meteorol. Atmos. Phys., 88, 53–63, https://doi.org/10.1007/s00703-003-0054-7, 2005.
Ziv, B., Harpaz, T., Saaroni, H., and Blender, R.: A new methodology for identifying daughter cyclogenesis: Application for the Mediterranean Basin, Int. J. Climatol., 35, 3847–3861, https://doi.org/10.1002/joc.4250, 2015.
Ziv, B., Shimer, R., Harpaz, T., Drori, R., Alpert, P., Raveh-Rubin, S., and Saaroni, H.: Identification and classification of the wet Red Sea Trough over Israel, Int. J. Climatol., 42, 10062–10082, https://doi.org/10.1002/joc.7884, 2022.