the Creative Commons Attribution 4.0 License.
the Creative Commons Attribution 4.0 License.
 | 06 Feb 2023
A multi-disciplinary analysis of the exceptional flood event of July 2021 in central Europe – Part 1: Event description and analysis
Uwe Ehret
Michael Kunz
Patrick Ludwig
Alberto Caldas-Alvarez
James E. Daniell
Florian Ehmele
Hendrik Feldmann
Mário J. Franca
Christian Gattke
Marie Hundhausen
Peter Knippertz
Katharina Küpfer
Bernhard Mühr
Joaquim G. Pinto
Julian Quinting
Andreas M. Schäfer
Marc Scheibel
Frank Seidel
Christina Wisotzky
The July 2021 flood in central Europe was one of the five costliest disasters in Europe in the last half century, with an estimated total damage of EUR 32 billion. The aim of this study is to analyze and assess the flood within an interdisciplinary approach along its entire process chain: the synoptic setting of the atmospheric pressure fields, the processes causing the high rainfall totals, the extraordinary streamflows and water levels in the affected catchments, the hydro-morphological effects, and the impacts on infrastructure and society. In addition, we address the question of what measures are possible to generate added value to early response management in the immediate aftermath of a disaster.
The superposition of several factors resulted in widespread extreme precipitation totals and water levels well beyond a 100-year event: slow propagation of the low pressure system Bernd, convection embedded in a mesoscale precipitation field, unusually moist air masses associated with a significant positive anomaly in sea surface temperature over the Baltic Sea, wet soils, and steep terrain in the affected catchments. Various hydro-morphodynamic processes as well as changes in valley morphology observed during the event exacerbated the impact of the flood. Relevant effects included, among many others, the occurrence of extreme landscape erosion, rapidly evolving erosion and scour processes in the channel network and urban space, recruitment of debris from the natural and urban landscape, and deposition and clogging of bottlenecks in the channel network with eventual collapse. The estimation of inundation areas as well as the derived damage assessments were carried out during or directly after the flood and show the potential of near-real-time forensic disaster analyses for crisis management, emergency personnel on-site, and the provision of relief supplies. This study is part one of a two-paper series. The second part (Ludwig et al., 2022) puts the July 2021 flood into a historical context and into the context of climate change.
- Article
(10272 KB) - Full-text XML
- Companion paper
-
Supplement
(14428 KB) - BibTeX
- EndNote


The severe flood event in western Germany and neighboring countries in mid-July 2021 was one of the most severe catastrophes in Europe in the last half century. Precipitation totals of up to 150 mm over an extensive area falling within 15 to 18 h led to the severe flooding particularly on 14 and 15 July 2021. The flood claimed many lives, with at least 180 fatalities in Germany alone. The two German federal states of North Rhine-Westphalia (NRW) and Rhineland-Palatinate (RP) were particularly affected, but also the neighboring countries of Belgium, the Netherlands, and Luxembourg. In Germany, the flood had a devastating effect in the northeast of the low mountain range Eifel, where villages along the rivers Ahr and Erft, both left tributaries of the Rhine, were affected (Fig. 1). Severe damage was caused to buildings, household goods, industry, but also to infrastructure such as railways, roads, and bridges. According to Munich Re (2022), total losses amount to EUR 46 billion, EUR 33 billion of which was in Germany alone, making this event the most expensive catastrophe in Germany to date. The insured portion was relatively low at EUR 8.2 billion in Germany (all countries EUR 11 billion; Munich Re, 2022) because of a low insurance density of residential buildings (only about 37 % to 47 % are insured) and infrastructure damage in that region.
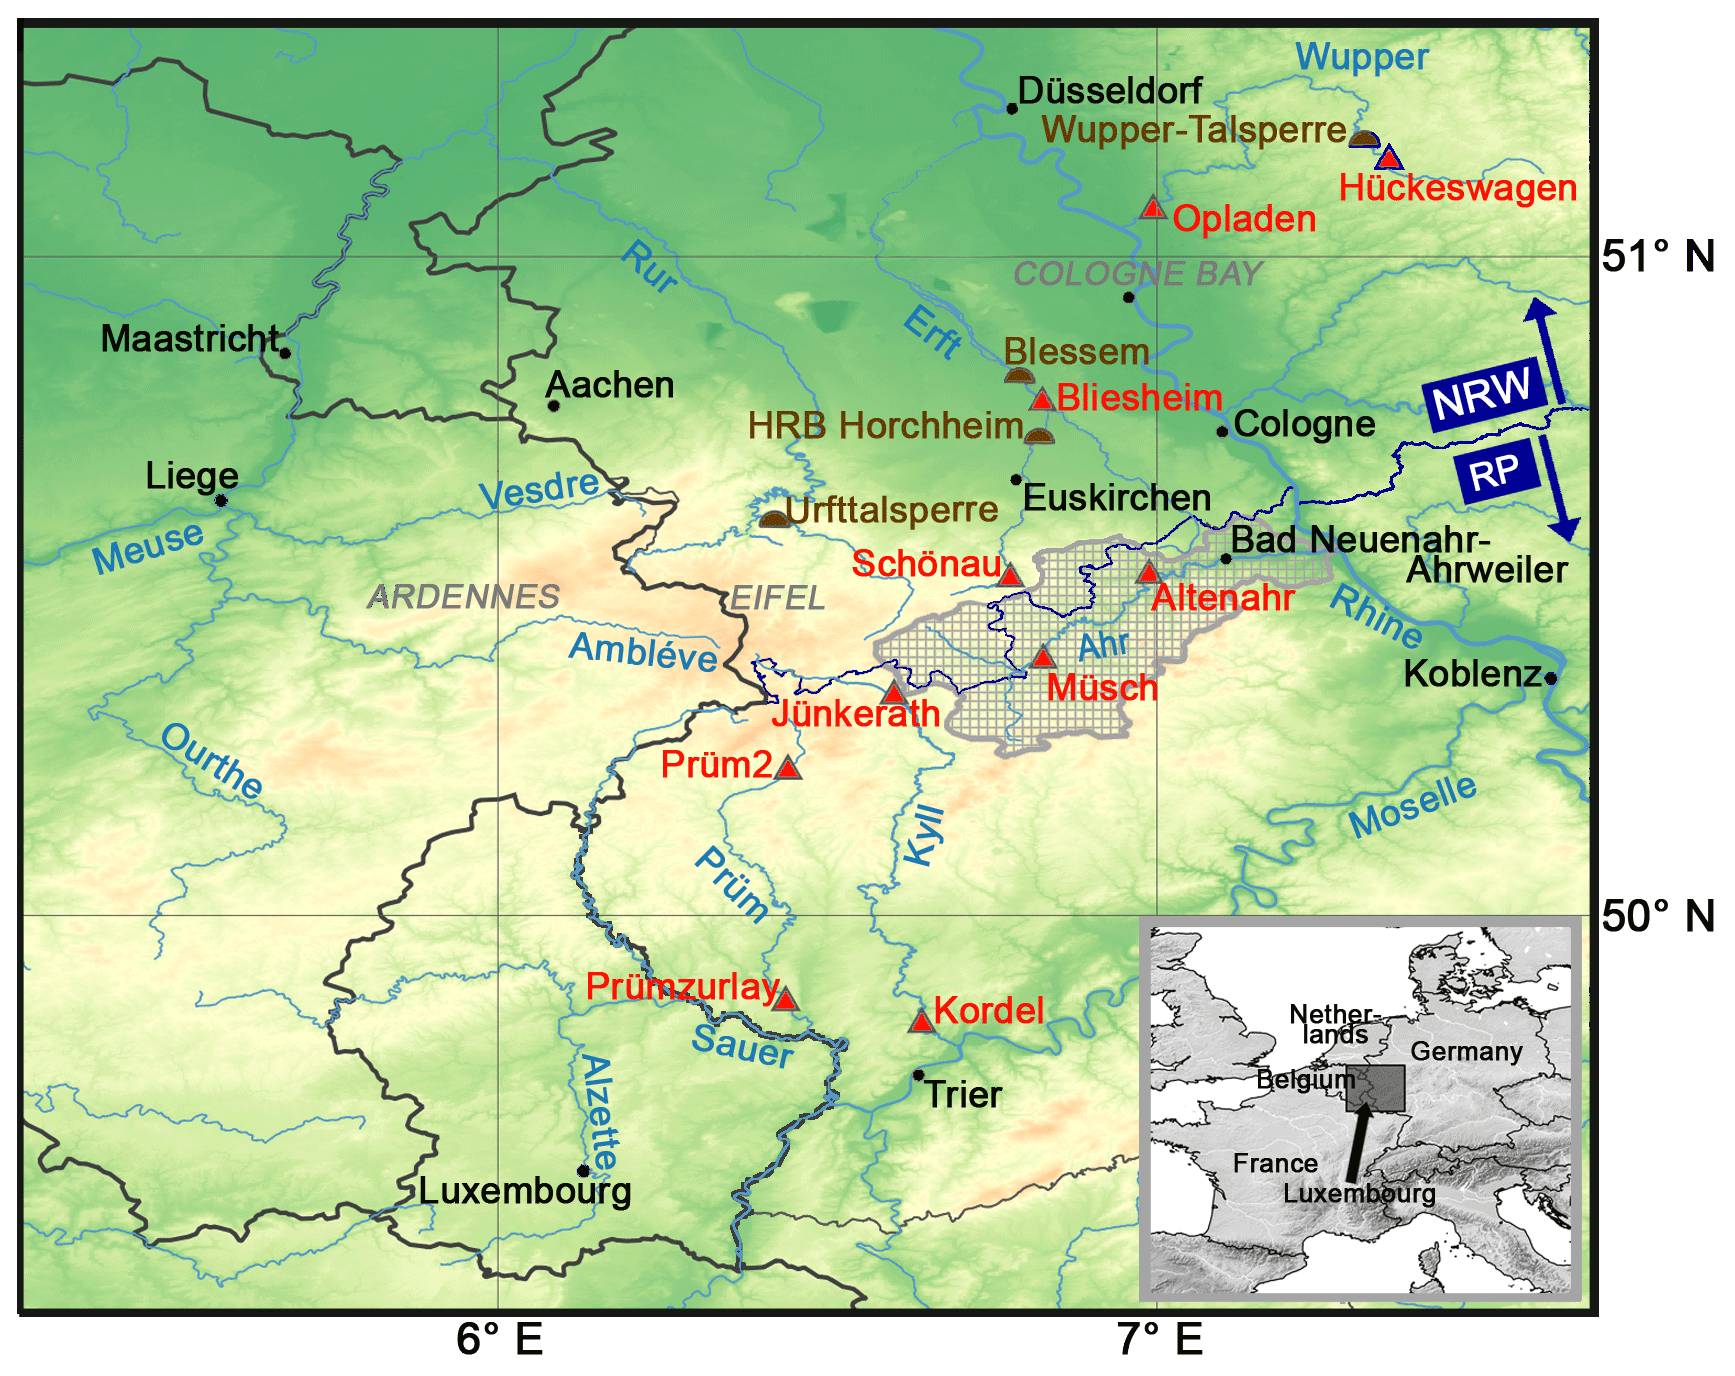
Figure 1Overview map of the most affected region within the European context (inset at small bottom right), with the main rivers (blue), river gauges (red), and reservoirs (brown) addressed in the paper, including the catchments of the rivers Ahr and Erft (hatched gray). In addition, the low mountain range Eifel, the Ardennes (both part of the Rhenish Slate Mountains), the low terrace plain Cologne Bay (gray capital letters), and the border between the two federal states North Rhine-Westphalia (NRW) and Rhineland-Palatinate (RP) are labeled (dark blue).
The Center for Disaster Management and Risk Reduction Technology (CEDIM, https://www.cedim.kit.edu/, last access: 13 November 2022), an interdisciplinary research center in the field of disasters, risks, and security at Karlsruhe Institute of Technology (KIT), Germany, has been conducting forensic disaster analyses (FDAs) in near-real-time since 2011 (e.g., Kunz et al., 2013; Merz et al., 2014; Piper et al., 2016; Wilhelm et al., 2021). The approach of forensically investigating disasters stems from the interdisciplinary research program integrated research on disaster risk (IRDR) and their program forensic investigation of disasters (FORIN; Burton, 2010). IRDR uses the forensic approach to uncover the root causes of disasters through in-depth investigations and to build an understanding of how hazards do or do not become disasters. CEDIM aims for a timely analysis within a few hours to a few days after the event. CEDIM's FDAs examine the dynamics and interrelations of disasters, identifies major risk drivers, estimates the impact (damage, fatalities, displaced people), and infers possible implications for disaster mitigation – as was the case in July 2021 on the extraordinary flood event, for which the report with first damage estimates was issued only 1 week after the event (Schäfer et al., 2021). This FDA report summarizing findings from different disciplines, but also more detailed analyses performed in the months after the flood, for example, concerning the relation to climate change, motivated us for this two-part paper.
Efficient and effective emergency management is essential to reduce the adverse effects from disasters, particularly in the case of sudden-onset natural hazards (Ye et al., 2020). A prerequisite for disaster response is to get as reliable and timely an overview as possible of the severity and extent of an event to identify most vulnerable facilities and areas, to prioritize emergency measures, or to organize evacuations if necessary (Merz et al., 2020). New opportunities for disaster response arise on the one hand from technological advances in recent years, such as surveillance by drones, information apps for smartphones, or crowd-sourcing of information via social networks, and on the other hand from better understanding of human behavior in the emergency phase and the societal context (Kreibich et al., 2017; Aerts et al., 2018). However, these are often not adequately taken into account and implemented in practice and decision-making processes – also showcased by the 2021 flood.
To better assess, predict, and manage catastrophes such as the July 2021 flood, close collaboration and interactions among scientists and practitioners across discipline boundaries are absolutely vital. A multi-disciplinary framework such as FDAs enables assessing the complex interactions of processes across different compartments from meteorology (e.g., weather situation, precipitation) to hydrological conditions (e.g., river basins, flow characteristics) to hydro-morphological impacts (e.g., changes in valleys morphology, erosion, and deposition areas) to impacts on assets and environment. The objective of this two-part study is a multi-disciplinary assessment of the entire process chain of the July 2021 flood in central Europe – from causes to impacts to historical classification and climatological context. We address the following main research questions: (1) what were the hydro-meteorological causes of the July 2021 flood, and what interactions and impacts were observed? What made the flood so exceptional? (2) What additional information can be generated directly in the aftermath of an extreme flood event to support disaster management and how reliable are first estimates? While Part 1 focuses on the description of the event across various disciplines (meteorological, hydrological, hydro-morphological, economic) and addresses the aspect regarding early response, the second part (Ludwig et al., 2022, henceforth referred to as PART2) puts the event in both historical and anthropogenic climate change contexts.
The paper is structured as follows: Sect. 2 introduces the different data sets and methods used. Section 3 discusses the prevailing meteorological and hydrological particularities and characteristics before and during the July 2021 flood, followed by a discussion of the hydro-morphodynamic processes in relation to the flood. Section 4 addresses the impacts and consequences with a focus on near-real-time estimation of inundation areas, damage assessment, and rail and road infrastructure failure. Finally, Sect. 6 discusses and summarizes the main results, draws conclusions, and provides an outlook on Part 2.
The region most affected in July 2021 by the heavy rainfall and subsequent flooding, and thus our region of main interest, is a low mountain range named Eifel with steep, deeply carved valleys. It is located in western Germany (mainly in the federal state of RP), eastern Luxembourg, and southeastern Belgium (see Fig. 1). In the west, the Eifel is limited by the river Meuse, in the south by the river Moselle, and in the east by the river Rhine. To the west, the Eifel is continued by the low mountain region of the Ardennes in Belgium and to the north by the lowland region of the Cologne Bay in Germany. In total, the region covers roughly 20 000 km2 (150×130 km), which is unusually large for the registered high precipitation intensities and totals (see Sect. 3.1) and a key characteristic of this event.
2.1 Analysis and weather forecast data
Geopotential pattern, precipitable water, and sea surface temperature (SST) from the European Centre for Medium-Range Weather Forecasts (ECMWF) ERA5 reanalysis data (Hersbach et al., 2020) interpolated to a 0.5∘ grid were used for analyses during the flood event and for climatological assessment (anomalies). In addition, based on these data, the pathway of air masses that reached the affected region was investigated with 10 d kinematic backward trajectories using the Lagrangian analysis tool (LAGRANTO; Sprenger and Wernli, 2015). The trajectories are based on the three-dimensional (3D) wind field (u, v, ω) on all model levels at a horizontal grid spacing of and temporal resolution of 3 h. The backward trajectories were initialized every 6 h between 14 July 06:00 UTC and 15 July 06:00 UTC at four grid points (51.0, 50.5, 50.0, 51.0∘ N; 7.0, 7.0, 6.5, 6.5∘ E; see Fig. 1). Following Sodemann et al. (2008), we started the trajectories vertically every 30 hPa between 970 and 590 hPa and considered only those which exhibit a relative humidity greater than 80 % at their initial time.
The predictability of the event is assessed by operational forecasts with the ICON model from the German Meteorological Service (Deutscher Wetterdienst, DWD) for different horizontal resolutions and lead times. The ICON model was introduced into DWD's operational forecast system in January 2015 (Zängl et al., 2015). In this study, we used the regional refinements of the global ICON forecast over Europe (ICON-EU, 7 km horizontal grid spacing) and Germany (ICON-D2, 2.2 km grid spacing) as well as output from the ICON-D2 ensemble prediction systems (ICON-D2-EPS). The considered ICON-EU simulations are initialized at 00:00, 06:00, 12:00, and 18:00 UTC and provide forecasts for the next 120 h. The higher resolved ICON-D2 simulations are initialized every 3 h (00:00, 03:00 UTC, etc.) and provide 27 h forecasts. In addition, the DWD produces ensemble forecasts with the ICON-D2-EPS based on 20 ensemble members (Reinert et al., 2020) for the same initial times and domain as ICON-D2.
Additionally, the extreme forecast index (EFI) for precipitation based on the ensemble prediction systems (EPS) of ECMWF was considered to assess the possibility of the occurrence of extreme weather. The EFI indicates whether the ECMWF-EPS forecast distribution is substantially different from the model climate (more details about EFI see, e.g., Lalaurette, 2003; Zsoter et al., 2015). An EFI of 0.5 to 0.8 indicates an unusual event, and EFI values above 0.8 indicate a very unusual or extreme event.
2.2 Precipitation data
To quantify precipitation amounts during the flood event, hourly and daily precipitation totals at single ground-based observational stations were taken from the network operated by DWD comprising about 2000 stations in Germany. The temporal resolution of the precipitation measurements is usually 1 h, but can reach up to 1 min. Unless otherwise noted, daily precipitation readings cover the period from 05:50 to 05:50 UTC to match with other data sets used in this study.
In addition, different gridded precipitation data sets provided by DWD were used in this study for both the event analysis and the estimation of return periods, including daily HYRAS data (Hydrometeorologische Rasterdatensätze; Rauthe et al., 2013) and hourly RADOLAN data (Radar-Online-Aneichung; Weigl and Winterrath, 2009; Winterrath et al., 2018). HYRAS is a gridded data set covering Germany and its relevant river basins in neighboring countries at a 5×5 km2 grid resolution currently available for the period from 1951 to 2015 (update in preparation). It is based on several thousand climate stations interpolated to the regular grid considering elevation, exposition, and climatology. A sub-sample of HYRAS is the HYRAS-DE data, formerly known as REGNIE (Regionalisierte Niederschlagshöhen), covering only Germany but with a higher resolution of 1 km2. HYRAS-DE is continuously updated on a daily basis and thus available for the July 2021 event. Caldas-Alvarez et al. (2022) found that HYRAS-DE reflects well the absolute frequency of precipitation observations and is well suited for process-based and statistical analyses of extreme precipitation.
RADOLAN is a radar-based near-real-time precipitation data set covering Germany and parts of the neighboring countries, with a horizontal resolution of roughly 1 km2 and an hourly temporal resolution and has been available since 2001. Measured reflectivities Z of the 17 radar sites operated by DWD are converted into precipitation rates R using seasonal differentiated empirical Z–R relations. To account for uncertainties in this conversion as well as for typical radar artifacts, the radar-based precipitation rates are calibrated using hourly data of over 1000 ground-based observational stations by applying different weighting and comparative techniques.
Antecedent wetness conditions in a river basin can be a decisive factor whether a rainfall event becomes a flood or not. Therefore, we used the established antecedent precipitation index (API; Kohler and Linsley, 1951; Viessman et al., 2002), which was applied to the RADOLAN data aggregated to a daily temporal resolution, to describe the conditions prior to the event. The suitability of API as a soil moisture proxy was shown, for example, by Blanchard et al. (1981) or Teng et al. (1993). API is based on a weighted precipitation accumulation over several days, typically 7 to 14 d (Heggen, 2001). In line with Schröter et al. (2015), we used a precondition period of 30 d in this study. The weighting factor k was set to k=0.9 as suggested by Heggen (2001) or Schröter et al. (2015).
2.3 River gauge data
All water level W and streamflow Q data from gauges used in this study were provided by the water administrations of Rhineland-Palatinate, the Erftverband, and the Wupperverband. From the large number of gauge data made available to us, for brevity we selected a representative subset based on the objectives of (a) covering our region of main interest – from the river Wupper in the east to the river Amblève in the west, (b) covering a range of basin sizes – from 31.9 km2 at gauge Schönau (Erft) to 816 km2 at gauge Kordel (Kyll), and (c) covering the position along streams – wherever possible we selected two gauges per river, one in the headwater and one close to its junction (see Fig. 1; river names in blue, gauge names in red, reservoir names in brown). Additionally, we selected gauges of special interest, such as gauge Schönau (Erft) for its proximity to retention basin Horchheim (see Sect. 3.2), gauge Bliesheim (Erft) for its proximity to the pit at Blessem (urban district of the town Erftstadt; see Sect. 3.3), and gauge Altenahr (Ahr) for the morphological effects in the river Ahr (see Sect. 3.3) and its historical context (cf. Part 2).
Table 1Key characteristics of river basins and gauges (water level W; streamflow Q; HQ100 means a flood with statistical 100-year return period; peak factor is defined as max(Q) in 2021 divided by HQ100) including statistics of previous historical extremes and the July 2021 flood event. Values for the latter are approximations (estimated).
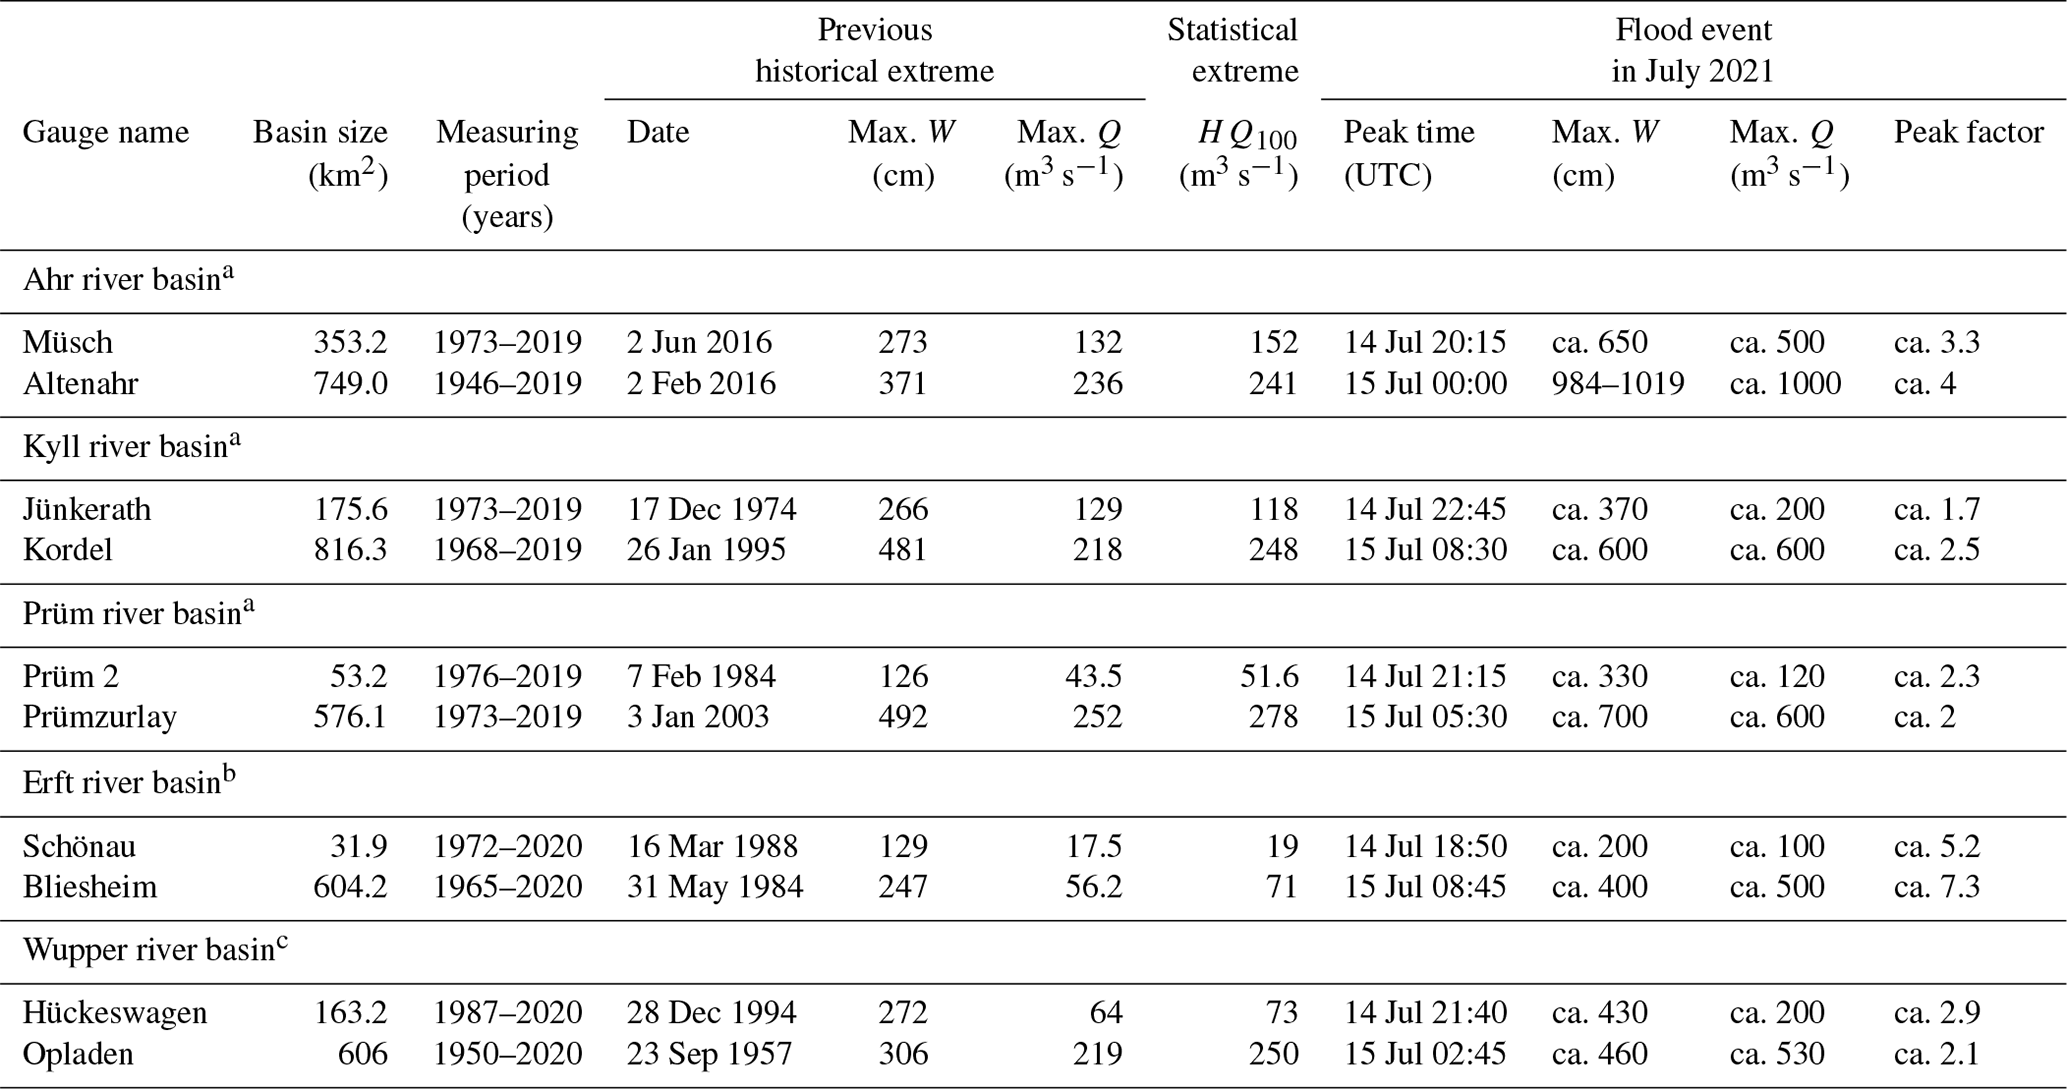
a Operator and data provider: water administration of Rhineland-Palatinate (https://lfu.rlp.de/de/startseite/, last access: 13 November 2022). b Operator and data provider: Erftverband (https://www.erftverband.de/, last access: 13 November 2022). c Operator and data provider: Wupperverband (https://www.wupperverband.de/, last access: 13 November 2022).
Water level data are from direct observations; streamflow data were calculated by the water authorities from water level observations and gauge-specific water level–discharge relations (W–Q relations), including uncertainties of about 15 % to 20 %. A summary of the gauge data is given in Table 1 (see Sect. 3.2). In cases where water level data were either not available (mainly due to gauge destruction), water levels exceeded the existing W–Q relations, or W–Q relations becoming invalid because of morphological changes of the river bed, streamflow data were estimated by the water authorities. In particular, the streamflow time series at gauge Altenahr (Ahr) that was completely destroyed during the flood was reconstructed based on floating debris lines at buildings, recordings of upstream gauges, and observed rainfall volumes. In the Erft river basin, most gauges – among them Schönau and Bliesheim – were heavily bypassed during the flood, and water levels exceeded any recorded levels and W–Q relations. For gauge Schönau, peak flow was estimated from rates of change of basin volume of the flood retention basin Eicherscheid, located 1.6 km downstream of the gauge. For gauge Bliesheim, the peak flow was estimated using a two-dimensional (2D) hydraulic model (Hydro_as-2d) to reproduce observed water levels. For the model, feasible ranges of roughness coefficients suggest an uncertainty range for peak flow of ±100 m3 s−1. At gauge Opladen (Wupper), the recorded peak water level of about 466 cm was also well beyond the limit of the existing W–Q relation of 400 cm. Streamflow values beyond were reconstructed using a 2D hydraulic model (Hydro_as-2d). During the flood, the river cross-section at Opladen was excavated by 40 to 50 cm, making the flood not only a hydrological but also a morphological event (see also Sect. 3.3).
2.4 Data for the estimation of inundation areas
Data of the earth observation satellites Sentinel-1 and Sentinel-2 of the Copernicus program (Sentinel Hub, 2021), among others, were used to estimate the inundation areas. Depending on the current ascension, new satellite imagery is available every second or third day. Sentinel-1 provides synthetic aperture radar imaging independent of weather conditions with a maximum spatial resolution of 5 m. These data allowed us to utilize imagery as early as 15 July, independent of the occurring cloud cover. In contrast, Sentinel-2 provides true color imagery with a maximum resolution of 10 m, which is sensitive to weather conditions. Thus, initial imagery of Sentinel-2 from 16 July could not be used due to extensive cloud cover. The first clear sky imagery was available from 18 July. The Sentinel-2 imagery proved more useful due to its true color imagery, as the Sentinel-1 radar images could not resolve most of the inundation areas (see Sect. 4).
While the flood was still ongoing, the CEDIM FDA task force manually gathered both aerial imagery and photos to get a quick overview of the overall situation of the inundation area. During this period, information about the extent of the flooding was disseminated mainly through news and social media. Some news channels broadcasted from helicopters flying over the region and provided aerial imagery. In addition, private videos from drone pilots (e.g., available via YouTube) supplemented the material. In particular, information from social media (e.g., YouTube, Twitter, Facebook) provided significant added value. Each photo and video collected was manually georeferenced and utilized to create geospatial vertices of the inundation areas. In many cases, the correct location, where a photo was taken or the flight path of the helicopter or drone, had to be determined first. Simple landmarks such as garden fences or buildings helped. By comparing the photo and video footage with satellite images acquired in previous years (e.g., Google Earth), it was possible to roughly estimate the inundation areas.
2.5 Traffic data
In order to estimate medium-term effects of the flood on transportation infrastructure, Deutsche Bahn AG (DB) provided data on rail traffic disruptions from mid-July to mid-October 2021 for NRW and from mid-July to mid-September 2021 for RP. The DB data were pre-filtered and contain only flood-related reports. The number of disrupted lines on certain key dates in the period under consideration (approx. every 4 weeks) was evaluated.
For the same time period, road traffic data were used, which are equivalent to the reports issued by the police to, for example, radio stations. We obtained the information from the internet platform https://stau1.de/ (last access: 13 November 2022), which provides historical congestion and traffic reports from Germany. As there was no pre-filtering for the road data regarding the flood, we developed our own filter that contains flood-related words. This ensured that all traffic reports that explicitly refer to the flood are included. Note that if traffic reports did not contain flood-related words but were induced by the flood, they were not evaluated. In order to check the validity of the data, the analysis was supplemented by quality controls. Reports for the same route and route section were combined.
2.6 Extreme value statistics
In both parts of this two-paper series, extreme value statistics were used to estimate return periods TRP(x) of precipitation events x (or vice versa, xRV(T)) from both observations (Part 1) and model data (Part 2). Making use of the Peak-over-threshold approach (POT; Wilks, 2006), only precipitation events above the 95th percentile were considered for the analysis. To this upper tail of the distribution, a three-parameter generalized Pareto distribution (GPD) was fitted (e.g., van Montfort and Witter, 1986; Coles et al., 2001; Brabson and Palutikof, 2000). The scale parameter and the shape parameter resulted from the fit using the maximum likelihood estimation (MLE). The statistical uncertainty of the return periods (95 % confidence interval) was estimated using a bivariate normal distribution (Kotz and Nadarajah, 2000).
Adjusting statistical distribution functions to a data series allows for estimating high return periods beyond the available time period. Furthermore, the comparatively strong noise or high random component of an empirical return period estimation (e.g., block maximum) is reduced to a certain degree (e.g., Bezak et al., 2014).
2.7 Loss modeling
Using the loss models available in CEDIM (e.g., Daniell et al., 2011, 2018; Mühr et al., 2017) and empirical data from past flood disasters (hazard information, infrastructural, and other damage), a first rapid loss assessment was carried out as part of the FDA activity immediately after the flood event (Schäfer et al., 2021). A central element for this assessment was a very large natural hazard database with over 60 000 entries (CATDAT; Daniell et al., 2011, 2016; EEA, 2022) built up by CEDIM in recent years.
The following characteristics and assumptions were made as part of the damage modeling:
- a.
Based on the inundation areas, 9694 buildings in RP and 9702 buildings in NRW were identified to be affected.
- b.
Based on the capital stock model used in Wilhelm et al. (2021), a capital stock of EUR 8.92 billion (excluding infrastructure) was associated with these buildings.
- c.
The damage ratio defined within the flooded locations of the inundation areas ranged between 15 % and 33 % (economic damage as percentage of capital stock). This was derived from previous analyses of past flood events. The damage ratio range was derived from the proportional integration of various vulnerability curves with building stock data of the most affected areas in NRW and RP assuming a typical building style of 2–3-story buildings.
- d.
Given the unknown number of affected buildings and infrastructure outside of the estimated footprints from Sect. 4.1, scaling factors ranging between 3.4 and 8.1 were used to estimate the share of damage in these regions. These scaling factors represent the additional exposure vs. that of the mapped inundation areas. This approach is in line with existing studies under the World Bank's global rapid post-disaster damage estimation (GRADE) methodology (Gunasekera et al., 2018)1 when estimating damage in locations where absolute inundation depths are unknown.
In terms of addressing the research question of what made the July 2021 flood event so extraordinary, it is becoming clear that several factors at various spatial and temporal scales were decisive for the catastrophic July 2021 flood event. Based on analyses of model and observational data and complemented by our own simulations and assessments, we discuss in the following the complex interactions between meteorological (Sect. 3.1), hydrological (Sect. 3.2), and hydro-morphodynamic (Sect. 3.3) processes and mechanisms.
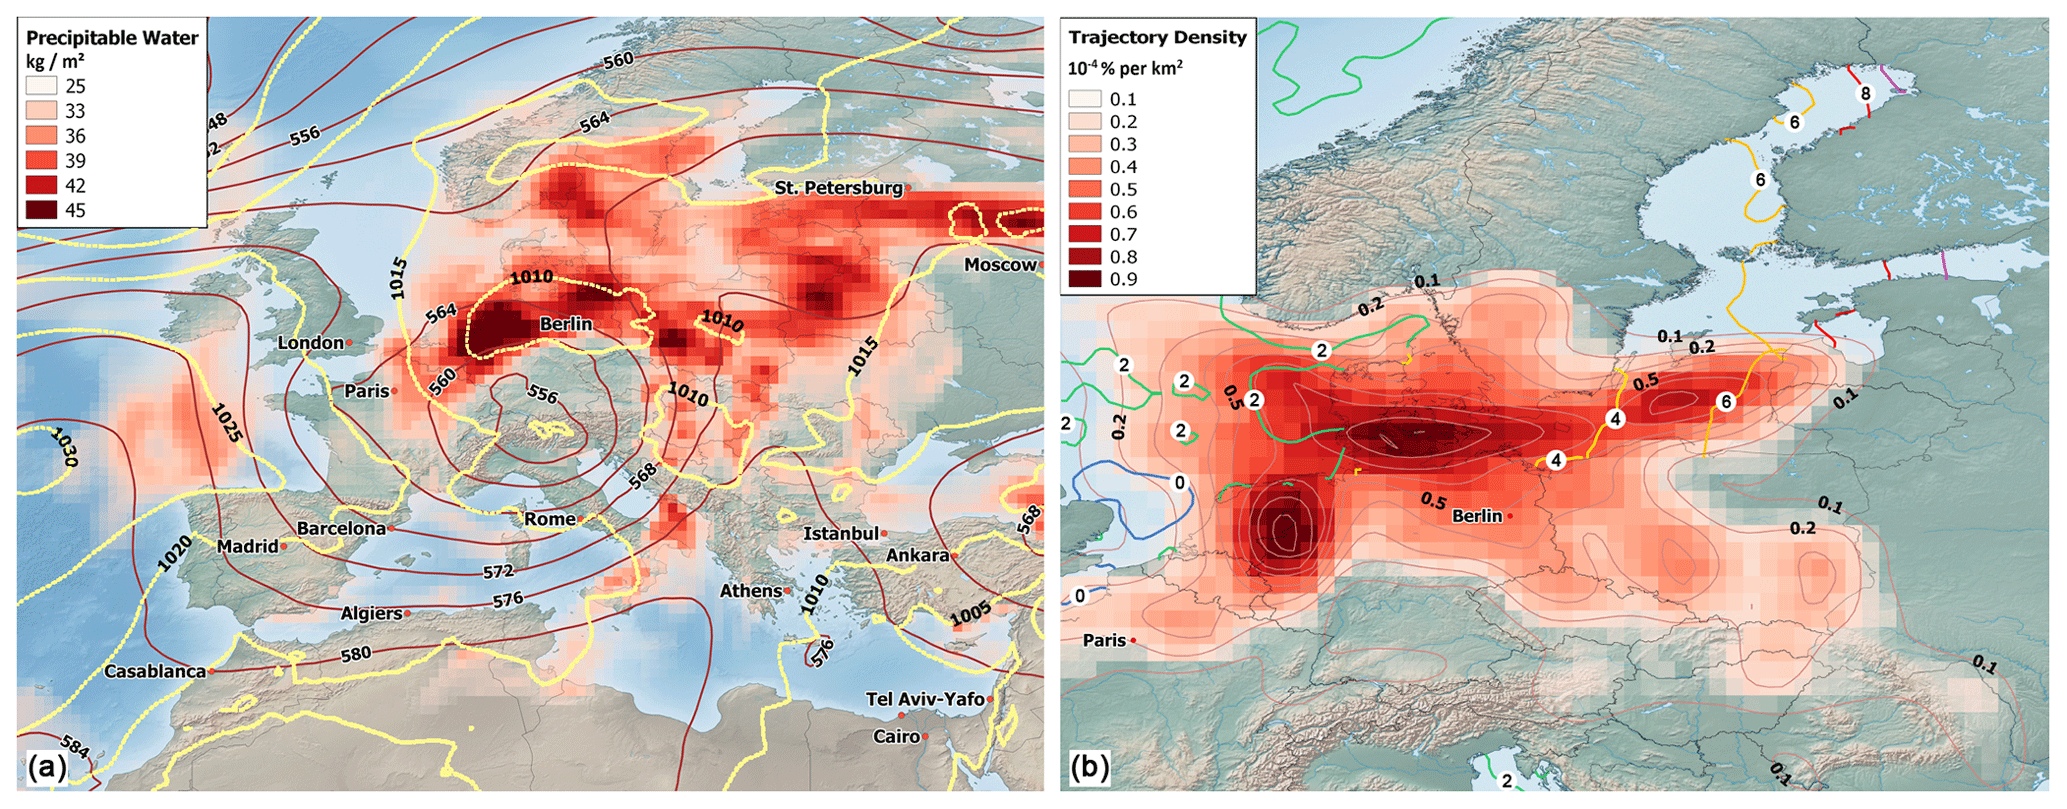
Figure 2(a) 500 hPa geopotential (solid contours in gpdm), mean sea level pressure (dashed contours in hPa), and total precipitable water (shading in kg m−2) on 14 July 2021 12:00 UTC (ERA5). (b) Density of air parcels (based on trajectories analysis) in the PBL (planetary boundary layer) over the entire 10 d period (shading and red contours every 0.1 % per area of 104 km2 starting at 0.1 % per area of 104 km2; ERA5); the outermost contour encloses 67 % of all air parcels. SST anomaly relative to the climatology (ERA5, 1971–2000; averaged from 8 to 15 July 2021; colored contours in K). Both backgrounds made with © Natural Earth.
3.1 Meteorological aspects
3.1.1 Atmospheric conditions prior and during the flood event
Synoptic overview and atmospheric characteristics
On 10 July 2021, a prominent upper-level trough was located over the Atlantic Ocean, moving rapidly to the southeast. Two days later, the trough structure with its meridional oriented axis extended from the western North Sea across the English Channel and the western half of France to the Balearic Islands. Subsequently, the upper-level trough was blocked by a quasi-stationary anticyclone located over northeastern Europe, which had already remained in the region for 3 weeks (not shown). Ahead of the approaching trough, the air pressure began to drop and a surface low pressure system named Bernd formed over the North German Plain (dashed 1010 hPa contour in Fig. 2a), exactly where the most intense precipitation was later observed. Bernd and the associated frontal system moved first very slowly eastward, with its center moving from southern Switzerland/northwestern Italy across the Alps towards southern Germany, and at later stages retrograde (westward). Analyses of the middle troposphere reveal a shortwave trough on the northwestern flank of the low pressure system (solid contour in Fig. 2a), which provided an additional atmospheric uplift, increasing the precipitation intensity. The extensive central European low pressure complex included extremely moist air masses in its circulation (colored areas in Fig. 2a). Over northern Germany, very high values of total precipitable water of more than 40 kg m−2 were reached.
These very high values of total precipitable water suggest that the moisture-laden air masses contributed to the extreme precipitation totals in the affected region. In order to investigate the pathway of the moisture-laden air mass and to identify possible source regions of moisture prior to the event, we evaluated the 10 d history of air masses with the trajectory approach (see Sect. 2.1). As we were particularly interested in moisture uptake due to surface evaporation, we focused on air parcels at the time when they were located in the planetary boundary layer (PBL). The density of air parcels located in the PBL over the entire 10 d period is shown in Fig. 2b. The majority were located over northern central Europe, the North Sea, and the Baltic Sea. From there, the air masses were transported towards the affected region on the northern flank of Bernd. Considering all air parcels in and above the PBL, a similar spatial distribution was obtained (not shown). The large fraction over the North and Baltic seas is noteworthy since both regions were characterized by unusual SST anomalies of up to 8 K during this period (colored contours in Fig. 2b), which was a consequence of the blocking situation described above and the associated cloud-free conditions and high solar insolation. This indicates that surface evaporation over the North Sea and Baltic Sea served as major moisture source prior to the event. Similar conclusions were also drawn by Tuel et al. (2022), who in addition to the unusual SST anomalies over the North and Baltic seas established a connection with the repeated Rossby wave breaking caused by a persistent meridionally amplified flow over the Atlantic, initiating a favorable dynamic setting on the large-scale for extremes. Heavy precipitation associated with quasi-stationary low pressure systems, their fronts, or convective systems located on the western flank of persistent blocking systems is observed frequently in Europe during summer and has often led to weather extremes with severe (economic) consequences (Grams et al., 2014; Piper et al., 2016; Lenggenhager and Martius, 2019; Mohr et al., 2019, 2020; Kautz et al., 2022).
Precipitation fields and statistics
As a result of upper-level shortwave troughs, a large area with widespread heavy precipitation formed over southwestern Germany already in the morning of 13 July (see Figs. S1a and S2a in the Supplement). This happened in accordance with the cyclonic rotation around the trough, and the precipitation area first moved northeastward, then northward, before turning westward over northern Germany and finally finding its way into NRW and RP. The heavy precipitation event leading to the devastating floods was predominantly stratiform in nature, but with embedded areas of convective heavier rain as shown by radar imagery (not shown). The rain began during the early morning hours on 14 July, for example, at the DWD weather station in Cologne-Stammheim around 04:00 UTC (see Fig. S3). In the Ahr catchment, precipitation started almost at the same time, for example at the DWD station of Bad Neuenahr-Ahrweiler, located near the mouth into the Rhine, at around 05:00 UTC. Initially, it rained only lightly and irregularly, but covering almost the entire catchment area from about 09:30 UTC. Around noon, precipitation intensified, and between 13:30 and 17:30 UTC, the highest precipitation intensities were observed in the Eifel region. From 17:30 UTC onwards, precipitation weakened from the east, and before midnight, the rain event ceased. Thus, the major part of the precipitation totals contributing to the flood fell in the affected river catchments within approximately 15 h on 14 July.
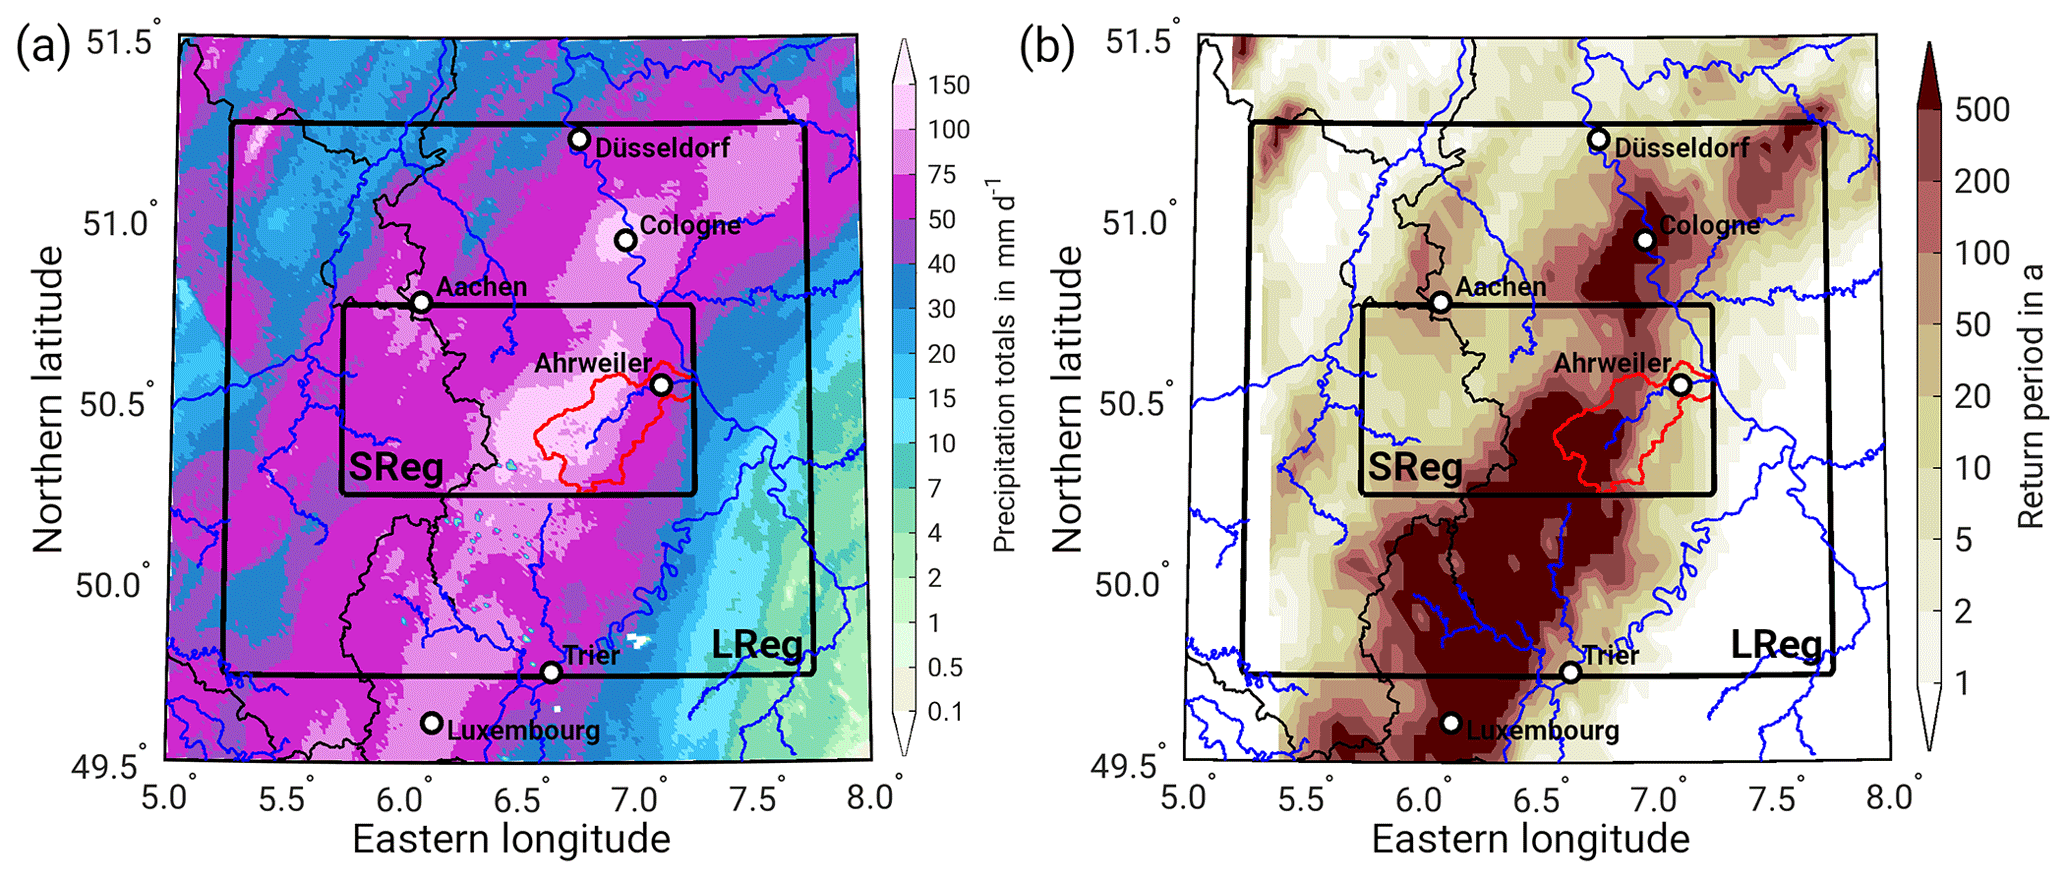
Figure 3Event characteristics with (a) 24 h precipitation totals based on RADOLAN data (14 July 05:50 UTC to 15 July 2021 05:50 UTC), and (b) statistical return periods of (a). Note that the RADOLAN data have been remapped to the 5 km HYRAS grid in (b) as the climatological values are taken from HYRAS (reference period: 1951 to 2015). The black rectangles indicate the regions named LReg and SReg; the red contour outlines the Ahr catchment; the main rivers are given by blue.
During this period, precipitation totals of up to 150 mm were recorded, for example, at Cologne-Stammheim (see Fig. S3 and Table S1 in the Supplement). The maximum hourly precipitation intensity reached 33 mm. The long-term average for the month of July at this station, however, is only 69 mm (1981–2010). Further measurements at DWD stations showed precipitation totals between 62 mm near the river Rhine and 144.8 mm in the Euskirchen district at the edge of the northern Eifel (station Kall-Sistig; see Table S1). Thus, the rain amounts exceeded the usual monthly July precipitation at most of the stations.
The large spatial extent of the high precipitation area can also be clearly seen in the RADOLAN data (Figs. 3a and S1). Our focus region regarding precipitation is largely represented by the larger blackrectangle in Fig. 3 (w.r.t. Part 2 hereafter LReg), while the smaller black rectangle (hereafter SReg, cf. part 2 Sect. 2 for details) covers the highest precipitation totals with the mainly affected Ahr catchment (red contour). On average, the 24 h precipitation totals on 14 July according to RADOLAN were 55.4 mm in the LReg and 75.2 mm in the SReg. On the same day, high precipitation totals of more than 50 mm were also observed over larger areas in the adjacent regions of Belgium and Luxembourg. Together with rain amounts of 20 to 50 mm already fallen on the previous day (see Fig. S2a), this resulted in 48 h rain sums of more than 75 mm (Fig. S2b). Note that Saadi et al. (2022) recently pointed out an underestimation of RADOLAN for this particular event of about 15 % to 20 % compared to station data.
For a first climatological classification of the precipitation event, return periods were calculated using the GPD with the POT method (see Sect. 2.6) based on 65 years of HYRAS data as reference. For this purpose, the 24 h precipitation totals of RADOLAN were interpolated on the HYRAS grid. The rather large area with high precipitation totals is reflected in high return periods (Fig. 3b) exceeding over 100 years. Especially in the southern part of the figure near the border between Germany and Luxembourg, observed rainfall was exceptionally high in a statistical context: on average, the return period was approximately 500 years (95 % confidence interval 40 to 2×10⁸ years) in LReg and 800 years (95 % confidence interval 50 to 4×10⁷ years) in SReg. This is the same order of magnitudes as in other studies. For example, Kreienkamp et al. (2021) and Tradowsky et al. (2022) estimated a return period of at least 400 years for an event with similar magnitude and extent occurring anywhere in the area in western Europe between the Alps and the Netherlands. Dietze et al. (2022) showed that the sub-daily as well as daily and multi-day precipitation totals at the DWD weather station Weilerswist-Lommersum (Erft catchment) exceeded the 500-year return level. According to the KOSTRA classification of DWD (KOSTRA-DWD-2010R), 24 h totals also exceeded the 100-year return level in a larger area between Cologne and the borders to Luxembourg and Belgium (see Fig. S4 including data description in the Supplement).

Figure 4(a) 24 h precipitation totals over LReg (14 July 06:00 UTC to 15 July 2021 06:00 UTC) as forecasted by ICON-EU, ICON-D2, and ICON-D2-EPS for different initialization times and observed precipitation total as reference based on RADOLAN: 55.4 mm (stippled black horizontal line). For the EPS, the boxes represent the median and 25 % or 75 % percentiles, the triangles the 10 % or 90 % percentiles and the whiskers the total ensemble range. (b) Extreme forecast index (EFI) for precipitation on 14 July 2021 based on the ECMWF-EPS for different initialization times. Horizontal lines at 0.5 and 0.8 denote the limits for classification of an unusual (EFI between 0.5 and 0.8) and very unusual or extreme event (EFI greater 0.8).
3.1.2 Weather forecast analysis
In the following section, the predictability of the event is analyzed based on weather forecasts by DWD and ECMWF (see Sect. 2.1). The deterministic forecast runs of the DWD ICON-EU model show the potential for a widespread heavy precipitation event in the border region between western Germany, eastern France, Belgium, Luxembourg, and the Netherlands as early as 12 July 00:00 UTC (see Fig. S5). While the affected area and intensity varies over the next forecasts, the potential for an extraordinary event in this region remains. Specifically for the affected area (LReg), high 24 h precipitation totals (within the range of the observations; see Sect. 3.1.1) were predicted more than 2 d (from 12 July 00:00 UTC) ahead of the event (blue dots in Fig. 4a). The DWD ICON-D2 forecasts also captured the magnitude of the event right from of their first initialization (13 July 06:00 UTC; red dots in Fig. 4a), as can also be seen in the spatial distribution of the precipitation forecasts by ICON-D2 and ICON-D2-EPS for different initialization times (Fig. S6). They consistently depict high precipitation totals over a wide area around the border between NRW, RP, Belgium, and Luxembourg, locally exceeding 150 mm d−1. Especially for the affected area, both ICON-EU and ICON-D2 forecasts oscillate around the observed precipitation totals (Fig. 4a), with even slightly higher predicted totals compared to the observations for the initialization shortly ahead of the start of the event. The DWD ICON-D2-EPS predictions (gray box plots in Fig. 4a) clearly show that the closer they were initialized to the event, the more the uncertainty of the prediction decreased. The predictions of the ECMWF-EPS also indicated the possibility of an unusual event early on (Fig. 4b). EFI values (see Sect. 2.1) above 0.5 are obtained from the forecasts initialized on 10 and 11 July 2021. From 12 July on, also 2 d before the event, the EFI for 24 h precipitation exceeds values of 0.8, indicating a very high probability of occurrence of a very unusual or extreme event in this region. The above results show that while the precise prediction of the rainfall totals for the affected areas as only possible a few hours in advance, the potential for a extraordinary precipitation event in the region was given at least 2 d in advance.
3.2 Hydrological aspects
In this section, we discuss the hydrological aspects of the event, including antecedent conditions in the catchments, river water levels and streamflow, effects on reservoirs, and a comparison of observed peak values with statistical design floods. However, we did not estimate statistical return periods of the July 2021 flood for several reasons. The first reason is that during the event, many gauging stations were partly or completely destroyed, and even if water level recordings existed, water level–discharge relations (W–Q relations) at many gauges were severely altered during the flood due to dynamical river bed changes or backwater effects from floating debris trapped upstream of bridges (see Sect. 3.3). Furthermore, the water levels observed during the flood were often all-time records exceeding existing W–Q relations. Reconstructing event discharge, the basis for a statistical treatment, is therefore a difficult and still ongoing task, and the values reported below should be interpreted as the best available to date but not as final estimates. Nevertheless, and despite considerable uncertainties, often the sheer magnitude of the estimates underline the exceptional nature of the event.
3.2.1 Antecedent conditions
Analyzing major historical floods in Germany, Schröter et al. (2015) found that they were triggered either by extensive precipitation events following a normal to dry period, or by moderate precipitation events following an exceptionally wet period. This means that catchment preconditions – namely soil wetness – are a crucial factor for flood occurrence and/or magnitude. For the 30 d prior to the event, API values (Sect. 2.2) quantified by RADOLAN data show a moderate wet period in most of Germany (Fig. S7a). Widespread values range between 20 and 60 mm, with spatial averages of 55.0 mm for LReg and 49.7 mm for SReg. This agrees with Junghänel et al. (2021), who reported frequent rainfall in this region in the 3 weeks prior to the flood leading to widespread high soil moisture. For Luxembourg, AGE (2021) also reported relatively wet antecedent conditions.
A climatological assessment of spatially averaged daily API values over LReg based on the HYRAS (1951–2015) reveals typical values for LReg ranging from 10 to 20 mm (Fig. 5). API values between 5 and 35 mm occur statistically once a month, while values up to 50 mm are observed only twice a year. Thus, the above mentioned mean value of 55.0 mm prior to the flood event (red line in Fig. 5) has a statistical return interval of about 1 year. Similar observations result from grid-point-based return analyses (Fig. S7b), which demonstrate corresponding return periods preferably between 1 and 5 years, with exceptions of more than 200 years in the northern part of LReg. In summary, moderate antecedent soil moisture was not decisive for the flood, but supported high surface runoff through saturation excess.

Figure 5Frequency distribution of spatially averaged daily API values over LReg based on HYRAS (blue; 1951–2015). The red line marks the mean API on 14 July 2021 over LReg based on RADOLAN; the dashed black lines represent exemplary selected empirical return intervals.

Figure 6Time series of water level (blue) and streamflow (red) for river gauges in the Ahr, Kyll, Prüm, Erft, and Wupper river basins (13 July 00:00 UTC to 17 July 2021 23:00 UTC; resolution: 15 min). Solid lines indicate values based on in situ measurements, dashed lines indicate reconstructed values (carried out by the data-providing water authorities). Dashed horizontal lines indicate the magnitude of the statistical 100-year flood in m3 s−1. Further details about the gauges are given in Table 1.
3.2.2 Ahr, Kyll, and Prüm river basins
While draining into different directions, the Ahr, Kyll, and Prüm rivers all originate from the central part of the Eifel plateau (see Fig. 1) and were hence exposed to the similar rainfall in their headwaters. As a consequence, their flood dynamics were quite similar and we therefore discuss them together here. In their headwaters (Fig. 6a, c, and e), with the onset of rainfall (see Sect. 3.1.1), water levels started rising in the morning of 14 July (08:00–10:00 UTC) and reached peak levels in the evening (20:00–22:00 UTC). Within only 12 h, water levels rose by about 3 m at Kyll and Prüm and by more than 5 m at the Ahr. All peak values were clearly beyond the peak flows of a 100-year flood event (HQ100), for Müsch even by a factor of about 3 (Table 1). After the peak, water levels in the headwaters started gradually declining, and by around midnight of the following day (15 July) the flood had ended.
At the downstream gauges (Fig. 6b, d, and f), peak water levels were reached in the early morning of 15 July (00:00 UTC at gauge Altenahr, 08:30 UTC at gauge Kordel, 05:30 UTC at gauge Prümzurlay). Like for the headwater gauges, water levels rose dramatically within only 12 h: almost 6 m at Kordel, almost 7 m at Prümzurlay, and almost 10 m at Altenahr. Likewise, the estimated peak flows are all clearly above the statistical HQ100 values, with a record factor of about 4 at gauge Altenahr (Table 1). Owing to its deeply incised topography, forcing settled areas into close vicinity of the river and leaving very little floodplains for safe inundation, the villages along the river Ahr were severely affected by the flood, including a large number of fatalities (see Sect. 4). Another consequence of the steep terrain and constricted conditions at the Ahr were high flow velocities, erosion, and transport of floating debris, causing substantial blocking and backwater effects (see Sect. 3.3). The estimated peak flow of about 900 to 1000 m3 s−1 (Fig. 6b) corresponds well with estimates of 1000 to 1200 m3 s−1 based on hydraulic considerations by Roggenkamp and Hergert (2022). It is also noteworthy that while large historical floods (in 1804 and 1910) have been documented at the Ahr (Roggenkamp and Herget, 2014a, b), only data from the continuous records starting in 1973 were used to estimate HQ100 values (see Part 2 for a detailed discussion).
3.2.3 Erft river basin
Like the rivers Ahr, Kyll, and Prüm, the river Erft originates in the Eifel, but it drains northward towards its confluence with the Rhine near the city of Düsseldorf (see Fig. 1). In the Erft headwater region, 130 to 150 mm of rain fell on 14 July, with highest intensities occurring between 10:00 and 19:00 UTC. As a consequence, the water level at headwater gauge Schönau (Fig. 6g), for example, started rising at 07:00 UTC, reaching its peak at 18:50 UTC in the evening, more than 5 times larger than the statistical HQ100 of the gauge. At gauge Bliesheim (Fig. 6h), 36 km downstream of Schönau, water levels started rising about 6 h later, but – due to the operation of the retention basins Eicherscheid and Horchheim located in-between – reached its peak only at 08:45 UTC on the following day. While the operation of the reservoirs delayed the peak somewhat, they were far too small to significantly reduce the flood peak: at Bliesheim, the maximum discharge exceeded the statistical HQ100 by a factor of more than 7 (Table 1), which is even higher than for Schönau. In fact, the magnitude of the flood not only rendered flood reduction by reservoir operation impossible, it even posed a great threat to many retention basins in the region most affected. As a typical example, we briefly summarize the course of events at retention basin Horchheim (see Fig. 1). It was built in the 1980s and is operated by the Erftverband for downstream flood protection. The reservoir volume and outlet gates are designed for protection from HQ100=58 m3 s−1, the design flood for ensuring dam stability is HQ10 000=90 m3 s−1. In the night from 14 to 15 July, water entering the reservoir exceeded any recorded values. Between 02:00 and 05:00 UTC in the morning of 15 July, i.e., in only 3 h, total inflow exceeded twice the entire retention volume. The peak inflow was estimated as about 390 m3 s−1, which is about 4 times the HQ10 000. As a consequence, and despite all flood gates opened, the dam overtopped at 05:35 UTC, causing destruction of all service infrastructure and partial destruction of the dam by backward erosion (Erftverband, 2021). Similar situations were – among many others – encountered at retention basins Eicherscheid and Niederberg and service water reservoir Steinbachtalsperre (all located in the Erft basin) and Urfttalsperre (river Urft, see Fig. 1). For the latter, the design discharge for dam stability of HQ10 000=289 m3 s−1 was surpassed by a factor of more than about 1 on the morning of 15 July (estimated peak flow is about 320 m3 s−1), fortunately without dam failure (Bung, 2021).
3.2.4 Wupper river basin
Unlike the above discussed river basins, the Wupper river basin is located east of the Rhine (see Fig. 1). It is characterized by low mountain terrain and several reservoirs, most of them operated by the Wupperverband. The largest reservoir is the Wupper-Talsperre. It has an upstream basin size of 212 km2 and an overall storage volume of 25.6×10⁶ m3; additionally, 9.9×10⁶ m3 are available for flood retention. Gauge Hückeswagen (Table 1 and Fig. 6i) is just upstream of the reservoir, and gauge Opladen (Table 1 and Fig. 6j) is far downstream, close to the confluence with the Rhine (see Fig. 1). Just like in the Eifel region west of the Rhine, the rainfall event in the Wupper basin on 14 July was characterized by high intensities, large sums, and large spatial extent (see Fig. 3a): in an area larger than 1000 km2, 120 to 150 mm of rainfall were recorded within 24 h on 14 July. Even compared to point statistics, these totals exceed 200-year return intervals (see Fig. 3b), in combination with its areal extent the return period is even more extreme and hard to quantify (cf. PART2). As a consequence, water levels and discharge at gauge Hückeswagen rose to magnitudes almost 3 times larger than the previously largest recorded flood and the statistical 100-year flood (Table 1). At about 15:00 UTC, the gauge was completely inundated and data transfer stopped. Thanks to warnings by DWD, the Wupper-Talsperre water level was drawn down at increasing rates since 12 July, creating additional retention volume prior to the flood. Despite these measures, its maximum water level was reached and exceeded at 22:00 UTC on 14 July, and the flood spillway was activated to prevent dam failure. Overall, and largely thanks to the pre-event water level drawdown, the reservoir fulfilled its protection task by reducing the unprecedented maximum inflow of about 230 to about 190 m3 s−1 downstream (Wupperverband, 2021). At the Wupper-Talsperre, like for the previously mentioned reservoirs Horchheim and Urfttalsperre, the maximum inflow exceeded even the HQ10 000=168 m3 s−1 design discharge, here by a factor of about 1.3. Despite the mitigating effect of the reservoir operation, and largely owing to the effect of the large intermediate catchment area, peak water levels and streamflow at downstream gauge Opladen also were the largest ever recorded, exceeding the statistical 100-year flood by a factor of more than 2 (Table 1).
3.2.5 Rivers in Belgium and Luxembourg
Flooding in Belgium occurred mainly in the southeastern parts, on tributaries to the river Meuse, originating from the Eifel and Ardennes region (see Fig. 1). Especially along the rivers Ourthe (basin size 1850 km2), Amblève (1100 km2) and Vesdre (700 km2), previously unobserved peak water levels and streamflow values were reached, leading to 39 fatalities and vast damage to buildings and infrastructure (Dewals et al., 2021). Rainfall amounts close to 200 mm in 24 h were observed in the region, which is far beyond the statistical 200-year return period (Dewals et al., 2021). For example, peak flow at the Ourthe river just upstream the Vesdre confluence was estimated to be about 1100 m3 s−1, which is about 50 % above the previously observed maximum and about 25 % above the statistical 100-year flood. Along other rivers such as the Vesdre, evidence from partial gauge observations (most were destroyed during the flood) suggests that 100-year floods were exceeded by a factor of about 3 (Dewals et al., 2021).
In Luxembourg, severe flooding occurred mainly along the rivers Alzette, Sur, and Our, and along tributaries in the east and southeast of the Grand Duchy (see Fig. 1). As a result of widespread 24 h precipitation totals reaching 100 mm (MeteoLux, 2021), streamflow surpassed the statistical HQ100 at 10 river gauges; at 15 gauges it was the highest ever recorded, resulting in widespread inundations and evacuation (AGE, 2021).
3.3 Hydro-morphodynamic processes
The July 2021 flood in Germany demonstrated that flood-induced alterations in the morphology of landscape, river channels, and urban areas have great potential to destruct and damage housing, farm land, industry, crucial infrastructure, and natural areas (see also Sect. 4; cf. also Dewals et al., 2021). Immediately after an extreme event, data on morphology changes in the valleys are sparse and unstructured. The time required to reconstruct hydro-morphodynamic processes with numerical models happening at this spatial scale is not compatible with an immediate post-event survey. Therefore, our analysis and interpretation are based on a qualitative assessment that draws on photo and video elements collected from social media, as well as historical reports, images, and topography. We complement information already advanced in other works on how hydro-morphodynamic aspects are related to an enhancement of hazard in the July 2021 floods (i.e., Dietze et al., 2022), focusing more specifically on (i) hydrodynamic and geomorphic processes in the channel network; (ii) morphology (natural or anthropic) channel network singularities; and (iii) anthropic modification of the catchment.
3.3.1 Fluvial morphology as a dynamic system
In the municipality of Rech (Ahrweiler district), for instance, the erosion and collapse of the right bank of the river Ahr destructed houses and infrastructure (cf. cover photo at Petermann, 2021). Another very visible morphological effect was the destruction of gauging stations (e.g., Altenahr; see Sect. 3.2) by local scour, bank erosion, and collapse, which hindered the hydrological monitoring and reconstruction of the event. In the municipality of Dernau (see Sect. 4.1 Fig. 10 for orientation), human-induced changes in the valley changed the response of the river network to floods over time; while the peak flood discharge estimated for the July 2021 flood was in the same order of magnitude as for the 1804 event (cf. Part 2 and Roggenkamp and Hergert, 2022), the flood level in 2021 was about 2.4 m higher (Fig. 7a). Dernau is located on a relatively wide section of the Ahr valley; immediately downstream, the river becomes single-threaded and narrow for approximately 2 km, widening again just upstream of the town of Bad Neuenahr-Ahrweiler. This downstream bottleneck makes Dernau naturally prone to water accumulation and consequent inundation due to backwater effects. Between 1804 and 2021, more precisely in the 1880s, the railroad of the Ahr valley (Ahrtalbahn) was constructed and four bridges were built precisely in the bottleneck river reach, which narrowed even further the channel cross-section. During the July 2021 flood, these bridges were destroyed along with the Ahr valley railroad (Fig. 7b). From the post-event analysis, we may argue that the higher peak water level – compared to 1804 – were due to a combination of both (a) the anthropogenic morphology change of the valley geometry, more specifically of the river cross-section, imposed by the construction of the railroad bridges, which increased the bottleneck effect; and (b) the probable damming and clogging of the river cross-sections at the location of the bridges by the trapping of large-scale debris transported from the upstream valley (in Fig. 7b) remains of this debris, mainly wood, are visible). Large volumes of large-scale debris, including wood; industrial components, such as vehicles and caravans, bins and containers; and construction materials were observed throughout the river channel network in the post-event survey. Most of this debris was nonexistent or limited in 1804.
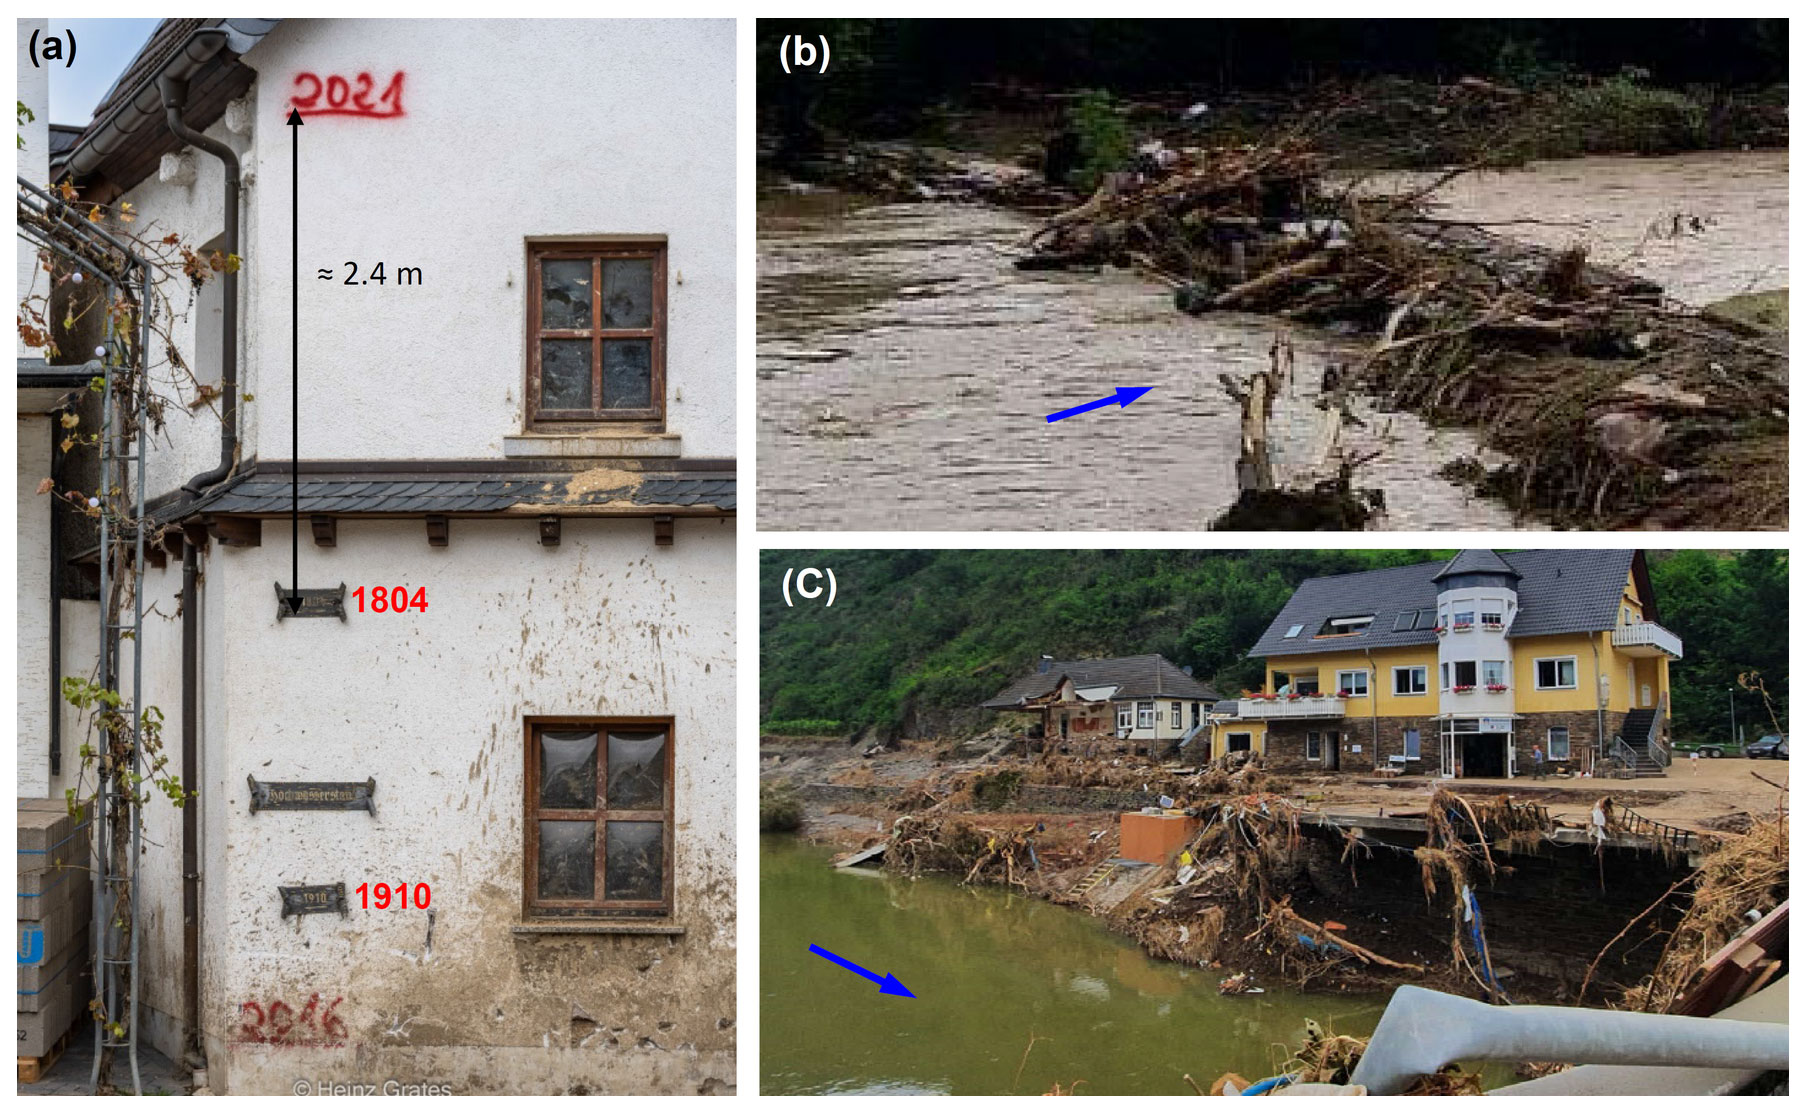
Figure 7(a) Flood marks in the municipality of Dernau (Ahrweiler district), including the floods of 1804, 1910, 2016, and 2021 (© Heinz Grates). (b) One of the collapsed bridges of the Ahr valley railroad (Ahrtalbahn) with trees eroded from the landscape (© Martin Seifert) and (c) bank erosion and collapsed road bridge, both in the municipality of Altenahr (Altenburg; © Bettina Vier). Blue arrows show the river flow direction.
3.3.2 More than water: sediment and debris
The July 2021 event was a showcase of how the excess of sediment reaching the river network, and changes in river morphology due to the excess of flow energy to perform geomorphic work, interact non-linearly with the flood propagation. In the post-event survey we observed, in all affected valleys with no exception, that river sections and streets were partially and sometimes entirely dammed by organic and inorganic large-scale debris, often with dimensions comparable to the cross-section available to the flow (cf. tweet on Twitter from NoeWehrtSich, 2021). Assuming that the transport of large debris follows the same modes as described in Ruiz-Villanueva et al. (2019) for large wood, the post-events images taken at the river Ahr indicate that, at least for some moments during the event, the large debris was transported in the so-called congested and hypercongested regimes, in which the debris elements are constantly in contact and are transported as a continuous carpet at the surface of the flow. The recruitment and transport of large debris are not considered in the current practice of flood hazard modeling, underestimating the real risk (see Sect. 4.2). We believe that the magnitude of the overland and river flows reported previously (see Sect. 3.2) corresponded to large periods when the flow exceeding the threshold for recruitment of sediment and debris, and that when the peak discharge occurred the channel network was already clogged with solid material.
3.3.3 Natural and anthropogenic landscape singularities
In a river catchment, many natural and anthropogenic singularities disrupt the continuity of the landscape and river network. The most visible anthropogenic singularities in valleys, which influence and are affected by floods, are bridges. Fekete and Sandholz (2021) refer to the destruction of 62 bridges, whereas BMI (2022) estimated that 103 bridges were damaged or completely destroyed during the July 2021 flood event, only in the Ahr valley. Several reasons can be pointed out for the bridge collapses, as in the two examples in the Ahrweiler district (see Fig. 7b and c): foundation excavation and scouring, impact and hydrodynamic action, lateral erosion of the abutments, and bank failure.
Ephemeral morphology features such as channel section blockage are provoked by the accumulation of sediments and debris, and these occurred at several locations during the July 2021 flood, as observed extensively in the survey and shown in social media. The eventual destruction and collapse of these impounding incidents caused downstream flood bursts (cf. also Fekete and Sandholz, 2021) with extra debris-charged peak flows traveling downstream as an abrupt front (with similar effects to dam break flows).
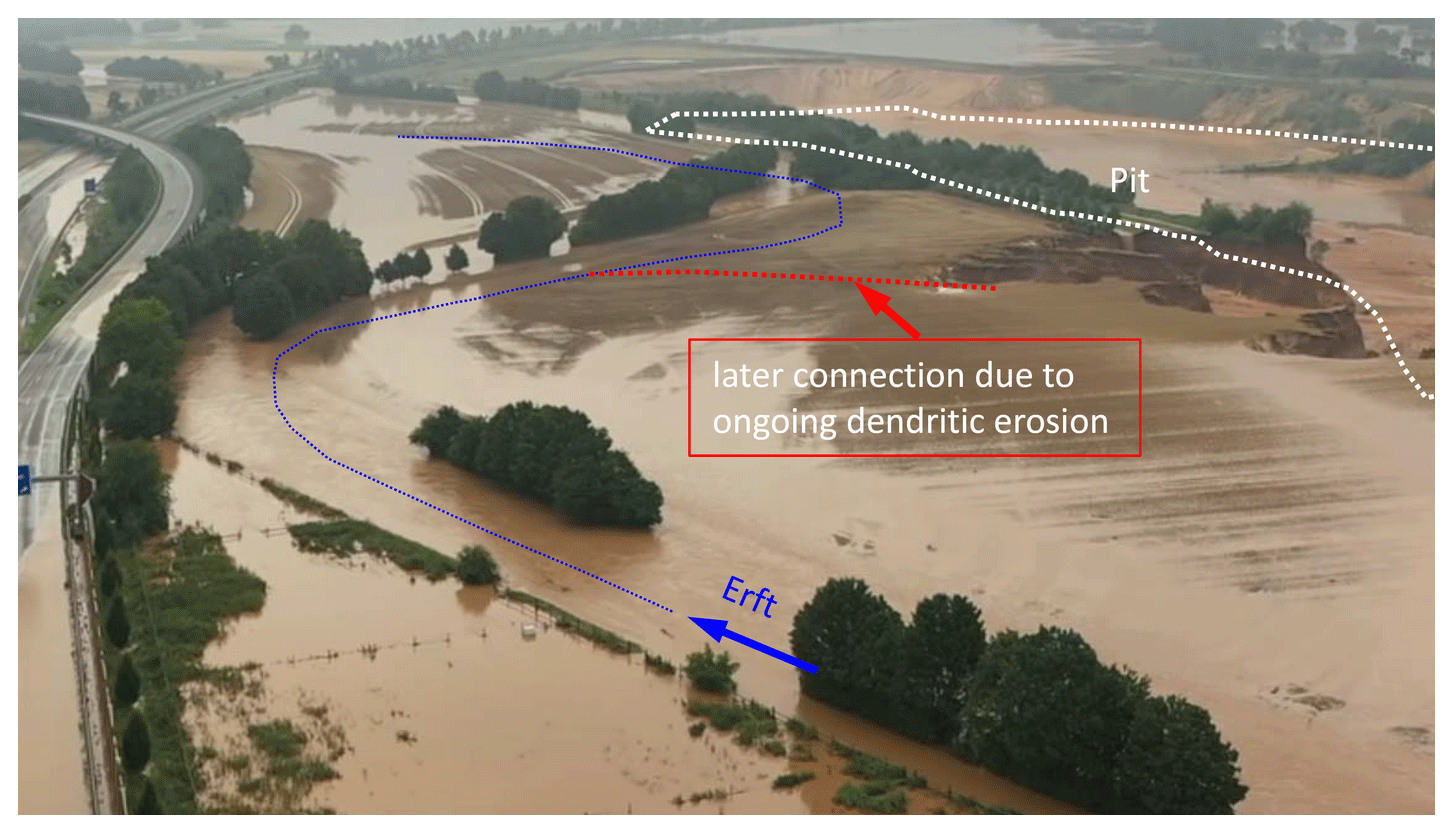
An (anthropogenic) landscape fragility in the Erft catchment had unforeseen consequences (and excessive media exposure): a mining pit as deep as 50 m and with an area of roughly 25 ha, located northwest of the town of Erftstadt (Erft catchment, Rhein-Erft-Kreis district). During the beginning of 15 July, the urban district of Blessem of the town of Erftstadt was inundated, and the flood flowed freely through the streets, roughly from south to north. The pathway of the water downstream through the town was along the natural landscape gradient and eventually into the pit through an existing depression on its south levee. This flow pattern corresponded remarkably to what the simulations from the flood hazard map produced by the district government of Cologne previewed for both cases: a flood with a return period of 100 years and an extreme flood (Bezirksregierung Köln, 2019). When the water started flowing on the pit slope, an unexpected major process of retro dendritic (tree-shaped) erosion occurred, which reached the urban district of Blessem in 6 to 8 h (Fig. 8). Eight houses were destroyed and considerable damage was reported to infrastructure and other buildings and assets. During the night of 15 to 16 July, the dendritic shape of the erosion reached the river Erft and redirected it into the pit; the configuration of the landscape drastically changed within 1.5 d. A flood attenuation side effect was observed once the river Erft was connected to the mining pit: the flood volume was partially absorbed by the reservoir formed by the pit. A valley bypass occurred through the road tunnel in the municipality of Altenahr constructed in 1834. When the flood in July 2021 reached a level higher than the western entrance of the road tunnel of the federal highway B267, the water started flowing freely through it, bypassing a 3 km meander of the river Ahr. Meanders generally contribute to peak flow attenuation (Buffin-Bélanger et al., 2015); in this particular case we argue that the bypass resulted in an increase (but non-significant) in the downstream discharge. Considerable destruction was caused at the eastern tunnel outlet, where massive scouring of the road and the neighboring slope occurred. A scour erosion step of more than 4 m was created, through which the water passed as a waterfall. Furthermore, the bypassed flow conditioned the flow in the downstream river, influencing its morphology and creating new areas of deposition and erosion.
3.3.4 3D hydrodynamic complex processes
In the municipality of Schuld (see Fig. 10 for orientation) and in the urban district of Altenburg (municipality of Altenahr), both located in a meandering region of the river Ahr, complex 3D hydrodynamic processes with consequences for flood propagation (as discussed in Bates, 2022) were observed. The southern part of the urban settlement of Schuld is located on the left-hand side of the inner region of an Ahr bend, an expected deposition area (cf. Blanckaert and de Vriend, 2003). During the July 2021 flood, the flow inundated this area of the urban settlement. Water charged with sediment and debris circulated through the streets, and the solid material deposited, with serious consequences for the security of the dwellers and buildings (see Fig. 9).
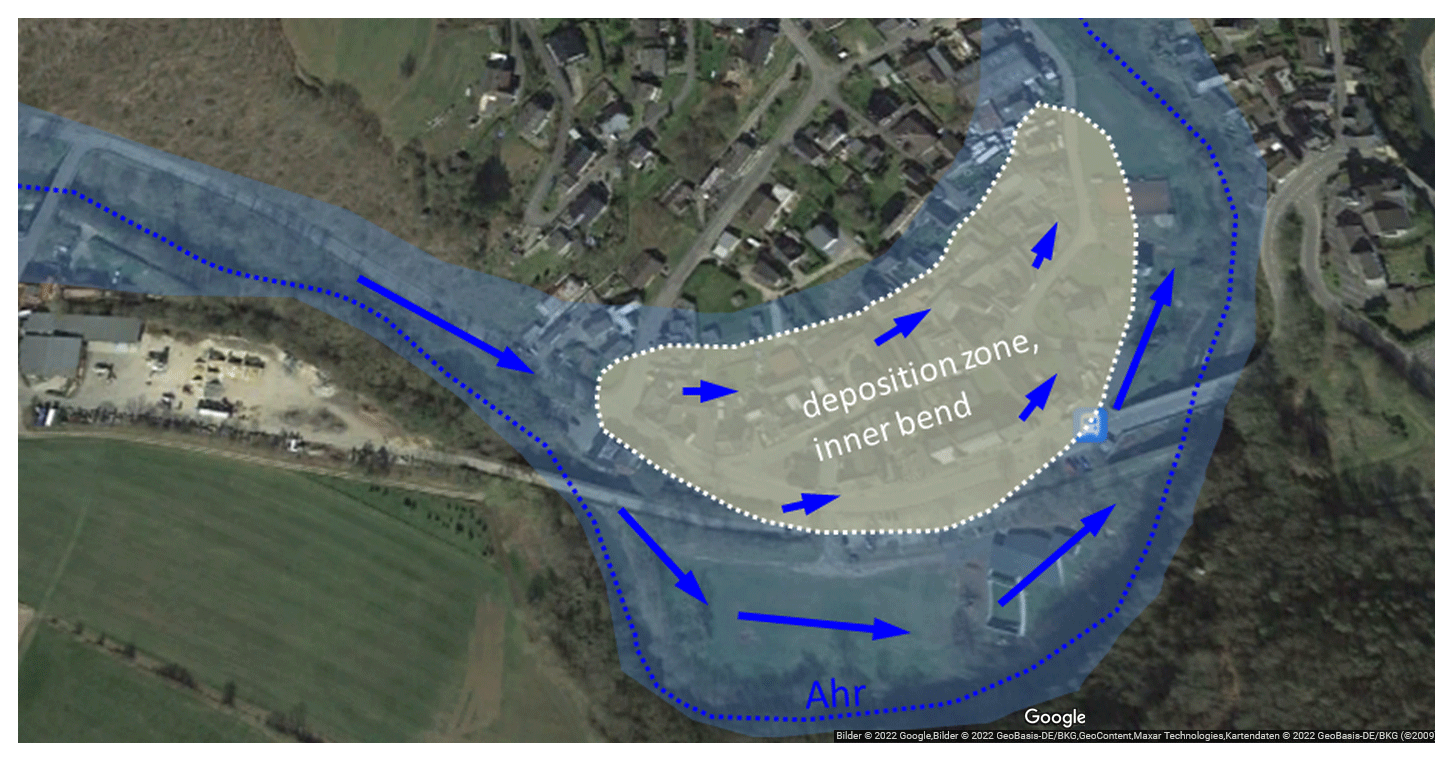
Figure 9Inner bend deposition in the municipality of Schuld (© Google Earth, 2021).
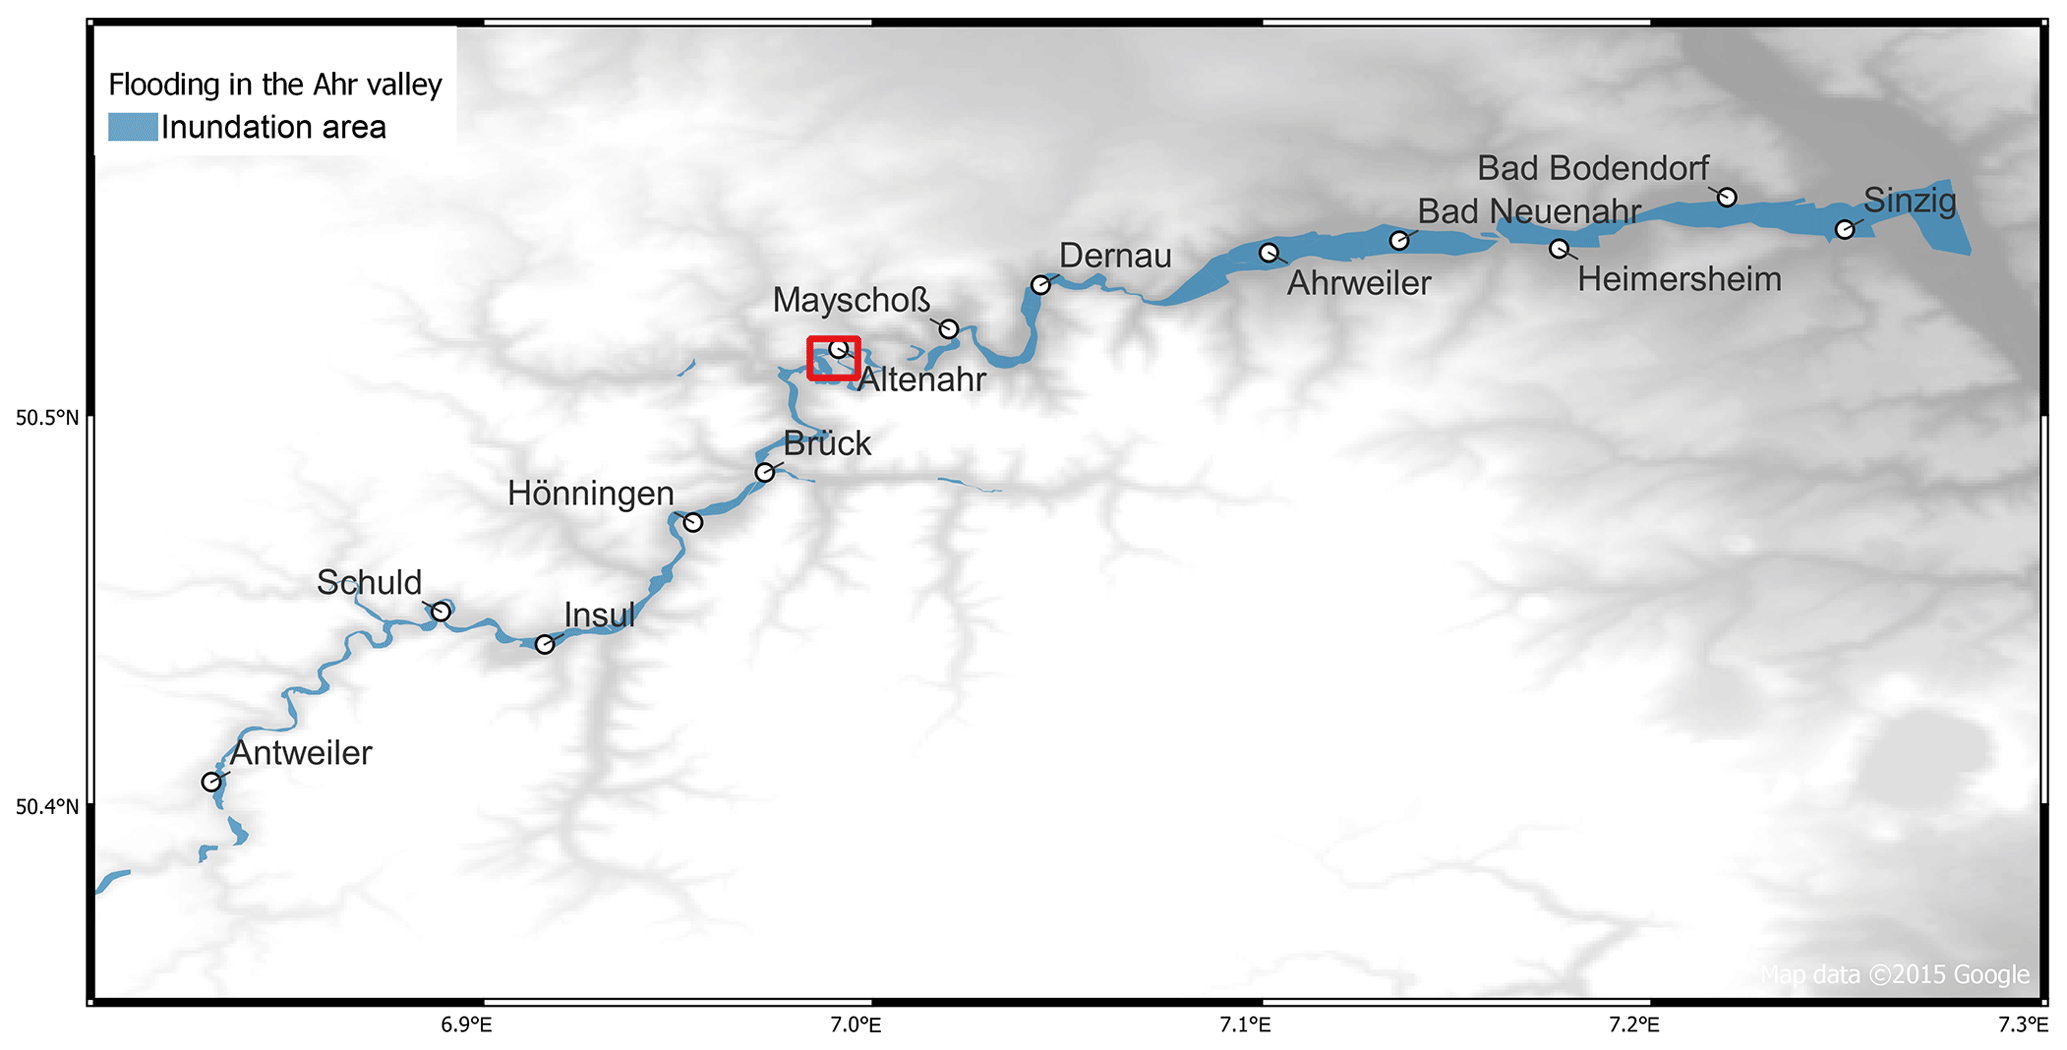
Figure 10Overview of the inundation area along the river Ahr between Antweiler and the mouth into the Rhine at the time of largest extent (blue), based on various sources including private drone footage, photos from social media, and satellite imagery (as of 18 July 2021). The red box indicates the area shown in Fig. 11 (© Google Earth).
In the second case, the water over-topped the levee of the river Ahr and was directed towards an old meander on the right-hand side riverbank, flooding the southeast of the urban district of Altenburg (see Fig. 11). The spreading of the flow through what possibly is an abandoned oxbow lake may have contributed to an attenuation of the downstream peak flow through the flood lamination effect (not measured but not expected to be significant in this case). Oxbow regions are preferential areas for the deposition of sediment and debris due to reduced flow velocities, which in the case of the urban district of Altenburg had destructive effects on the urban area.
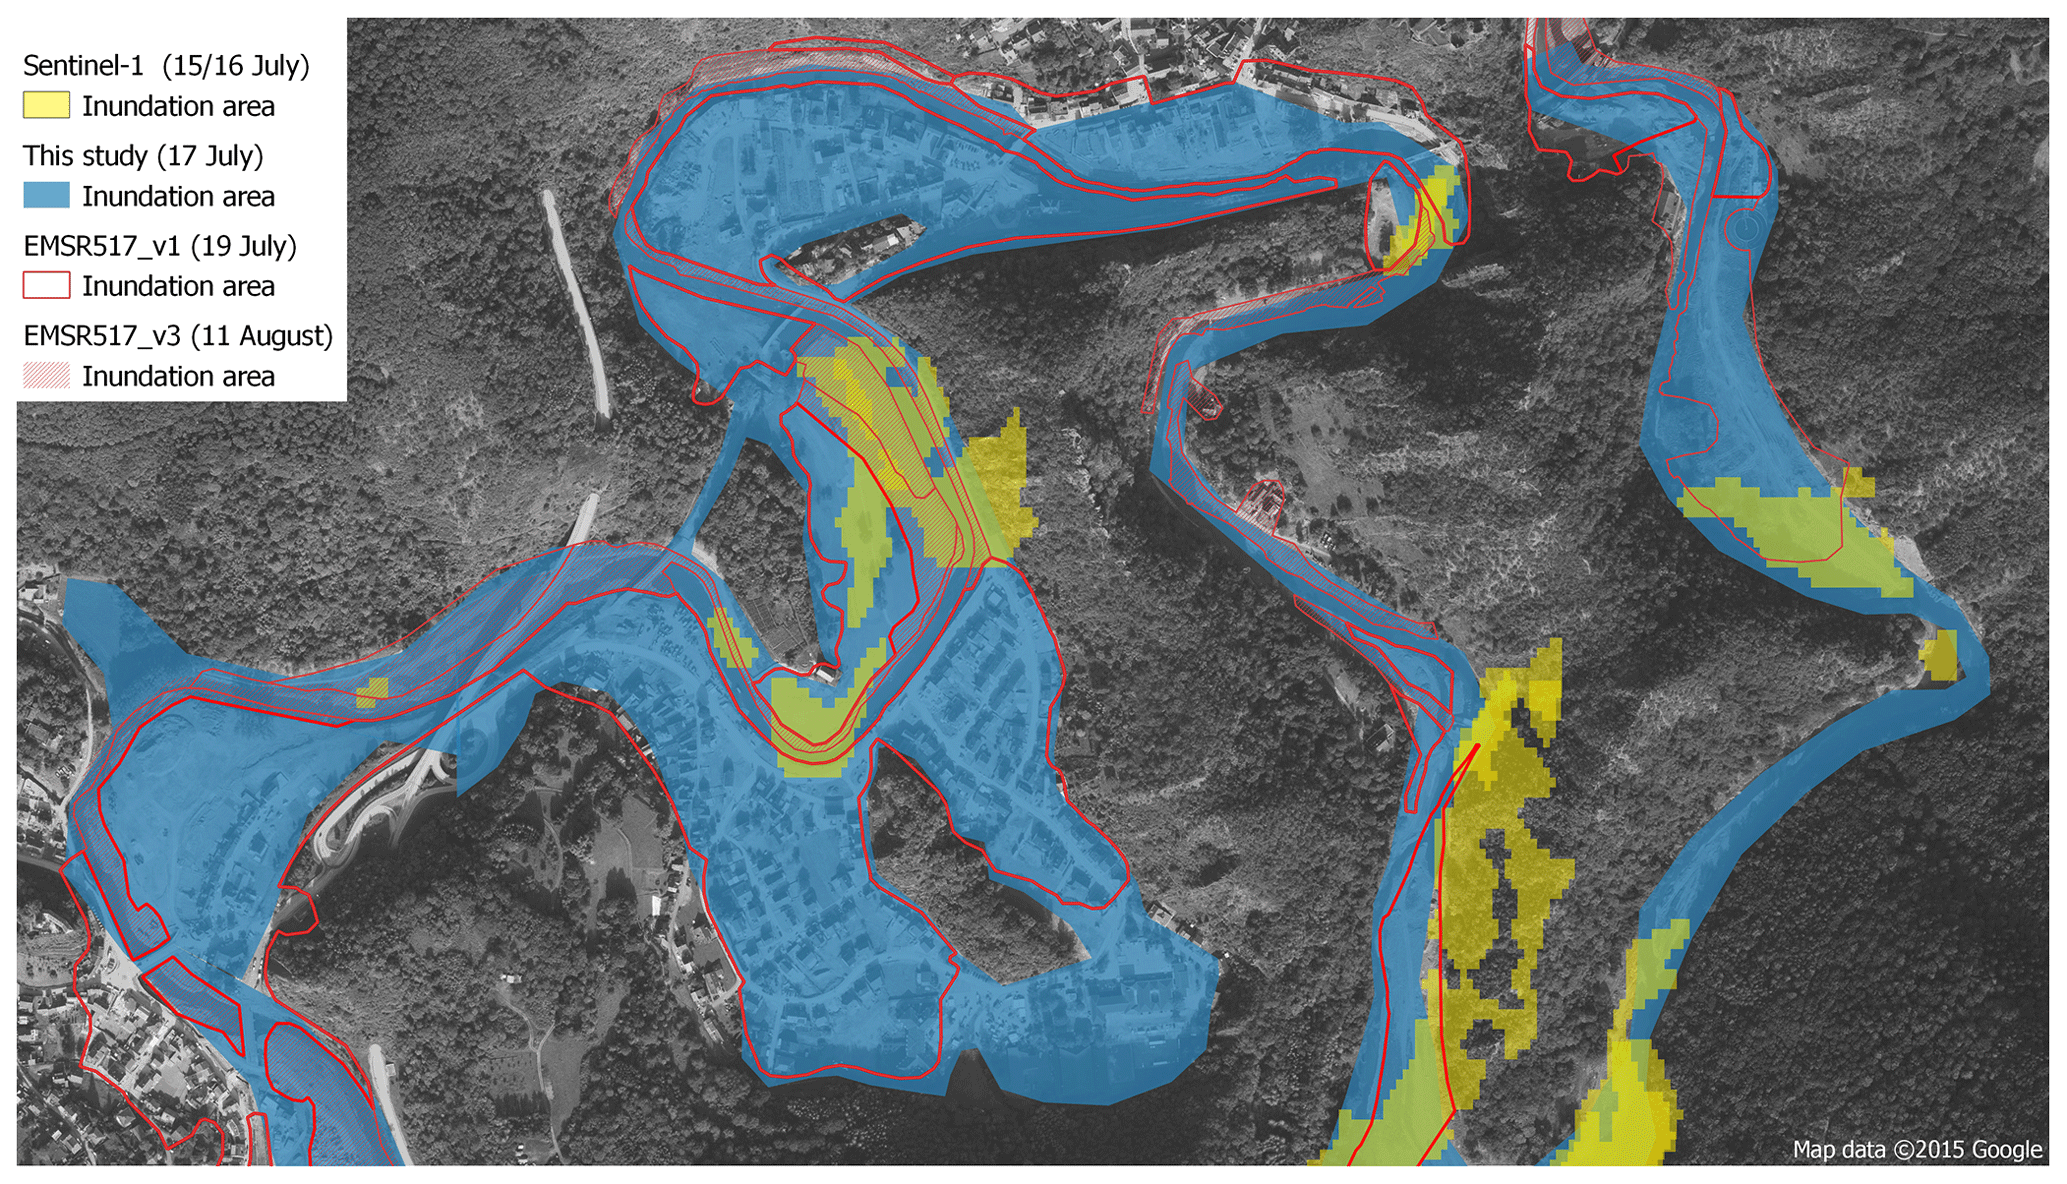
Figure 11Comparison of the inundation area (municipality of Altenahr): based on our method (in blue) from 17 July, results based on Sentinel-1 (in yellow; DLR, 2021) from July, and results of the Copernicus Emergency Management Service (CEMS, 2021) from 19 July (EMSR517_v1, red contour) and 11 August (EMSR517_v3; red hatched; © Google Earth). For a photo comparison of the river loop before and during the flood see also the following tweet on Twitter: https://twitter.com/WxNB_/status/1415629704472760324 (last access: 13 November 2022).
The July 2021 flood event caused severe damage to buildings and infrastructure in several German districts in the federal states NRW and RP. In total, at least 180 people lost their lives (see Table S2), 69 of them in the Ahrweiler district (RP) along the river Ahr, and over 800 people were seriously injured (BMI, 2022). The Ahr valley was the location affected most severely, with an estimated 17 000 out of 42 000 people losing most of their property (BMI, 2022). Due to gaps in the information warning chains (cf. Fekete and Sandholz, 2021; Thieken et al., 2022) and no widespread evacuations, many people surprised by the fast rising floodwaters were unable to get to safe places or underestimated the imminent danger, respectively (e.g., attempting to save belongings from the basement).
While the flood was ongoing and during the first days and weeks thereafter, the overall situation on site was relatively uncertain, which posed a major problem for crisis management, emergency personnel, and the provision of relief supplies. As part of CEDIM's concept of FDAs (see Sect. 1), a first rapid assessment of the situation on site was carried out within a few days after the event (cf. Schäfer et al., 2021) to obtain initial estimates of the inundation areas (Sect. 4.1), the associated potential losses (Sect. 4.2), and further consequences such as rail and road damage and blocking (Sect. 4.3).
4.1 Estimation of inundation areas in a rapid context
One of the first steps in rapid disaster analyses is to estimate the event's footprints and to identify affected areas. In the case of the July 2021 flood, the identification of the inundation area was key for early response management and first loss estimation. The flood along the river Ahr lasted for about 3 d. The onset of the event started in the late hours of 14 July and lasted until 16 July (see Fig. 6). While the flooding was still ongoing, live imagery (e.g., helicopters, drones) and social media imagery (e.g., Twitter, Facebook) was manually collected and processed as part of the CEDIM FDA (Sect. 2.4). Initially, it was unclear which towns and villages were flooded and to what extent, and how severe the flooding might be. This was not only the case for the Ahr valley, but also for most other affected regions such as along the river Erft. River gauge stations only provided limited information about the actual water level (destroyed gauges, see Sect. 3.2).
In addition to the mentioned visual material above, Sentinel-1 imagery (see Sect. 2.4) and analyses of automatic procedures by the German Aerospace Center (Deutsches Zentrum für Luft- und Raumfahrt; DLR, 2021) were integrated into the analyses (from 15 July) to identify further flooded areas. However, one constraint was that Sentinel-1's automated procedure is sensitive to topography and, for example, often identified hillslopes as inundation areas. Nonetheless, the information was an additional proxy to identify flooded areas, especially for regions without available photos or videos. News media focused mainly on severely affected places such as the town of Bad Neuenahr-Ahrweiler or the municipality of Insul and ignored many other villages in between. In some cases, this gap was closed by private footage, but this was not always the case.
On 17 July, Sentinel-2 imagery was made available, allowing further flooded areas to be identified despite some cloud cover and confirming previous findings. However, due to the low resolution of the imagery, manual assessment was necessary, for example by comparing the imagery with topography data to differentiate between flooded and muddy areas. One problem was that the mud extended to roads, due to traffic and rain, that were not flooded. In addition, some muddy roads were also caused by downhill water streams. Furthermore, from 19 July, first assessments by the Copernicus Emergency Management Service (CEMS, 2021) were added, which were similar but showed gaps as well.
Figure 10 provides an overview of the final product for the Ahr valley, where about 17 km2 of flooded area was mapped between the two municipalities of Antweiler and Sinzig (distance around 34 km), excluding areas for which no image data were available. Zoomed in, Fig. 11 compared exemplary different assessment products of the inundation area for the river loop near the municipality of Altenahr (red box in Fig. 10). For this specific region near Altenahr, photos highly supported the reconstruction of the inundation area (e.g., see tweet on Twitter: https://twitter.com/WxNB_/status/1415629704472760324, last access: 13 November 2022). It can be clearly seen that purely satellite-based (automated) products based on Sentinel-1 (in yellow; DLR, 2021), which were already available on July, detected significantly too less flood areas. The two versions of CEMS (2021, from 19 July and in a post-processed version from 11 August; both in red) are similar compared to our results (in blue), but these products also failed to detect all inundation areas in detail. A limitation of our technique is that areas, for which no photos or video sequences were available, may have flaws. In addition, our areas are defined by inundation area polygons and are thus not street-level accurate. In contrast, the EMSR model has a much higher level of detail down to the street level. Despite the lack of high quality satellite data and the exclusive use of social media imagery and early Sentinel satellite imagery, our inundation areas, which were created within 2 d, stands up to long-term assessments in terms of quality.
4.2 Rapid loss estimation and further loss statistics
Based on the rapid quantification of the mapped inundation areas (Sect. 4.1), a first loss estimation was carried out immediately after the flood (within 1 week; Schäfer et al., 2021) using the loss models (Sect. 4.2) available in CEDIM. The modeling was applied to the whole of Germany; damage proportion for Saxony and Bavaria, however, was only about 1 %. Damage was estimated to (a) damage to private assets (including household goods), EUR 4.4 to 13.0 billion; (b) damage to commercial, industrial, and other buildings, EUR 1.8 to 3.9 billion; and (c) damage to infrastructure, EUR 4.7 to 12 billion (each based on capital stock portions). This results in total estimated damage of EUR 11 to 29 billion (as of 21 July 2021). However, it must be taken into account that the flooded areas represent only a part of the total affected area, so that the extrapolation of the damaged area was associated with high uncertainty at the time.
Shortly after a disaster occurs, there is usually considerable uncertainty about the level of damage, so that such simplified methods are reasonable to provide timely loss estimations. In the case of the river Ahr, for example, this was necessary because no precise flood levels were initially available. Subsequently, these assessments were continuously improved – whenever new satellite products or analysis techniques became available for enhanced damage assessment. As a result, since summer 2021, various loss assessments have been made by both policy makers and the insurance industry (insurance associations, reinsurers, catastrophe modeling company), selectively compiled in Table S2. At the end of 2021, the German Insurance Association (Gesamtverband der Deutschen Versicherungswirtschaft, GDV) estimated insured losses for the July 2021 flood event at EUR 8.2 billion in Germany alone and EUR 11 billion for all affected countries (GDV, 2021). However, only about 37 % to 47 % of residential buildings were insured against floods, making the total damage significantly higher. In addition, infrastructure was massively affected (see also Sect. 4.3).
The German government estimated the total flood damage at EUR 32.05 billion, with 57 % of the damage attributable to RP and 41.5 % to NRW; the remainder is attributable to damage in Bavaria and Saxony (based on the EU solidarity fund application of the German government within the final report from March 2022; BMI, 2022). These damage estimates include reconstruction costs compared to some of the damage-only estimates in Table S2. However, it must be taken into account that by the time of writing it is still unclear what the final reconstruction costs and the associated damage costs will actually be.
Most reinsurance companies currently use the GDV or German government estimations, both of which are closely aligned (depending on the exact definitions). Based on our natural hazard database CATDAT (Sect. 4.2), this event is one of the two largest events for natural hazards damage in Europe in the last 43 years (after the 1980 Irpinia earthquake in Italy) and one of the five largest in general. The difference between book value damage, replacement costs, and reconstruction costs has yet to be determined and will likely be identified by follow-up analyses, meaning that the final economic damage value for comparison with other past disasters is not known at this point.
4.3 Affected rail and road infrastructure
The flood hit both the federal states of NRW and RP heavily concerning the transport and traffic sectors (cf. Koks et al., 2022; Szymczak et al., 2022), both of which are classified as critical infrastructures. Most of the disruptions regarding rail and road occurred directly after the event. In the Ahr valley alone, an estimated 103 bridges were damaged or completely destroyed (cf. BMI, 2022). On 15 July 2021, 4 % of the total road traffic reports issued by the police in RP and NRW (Sect. 2.5) were directly related to the flood event. Given the large size of the two states and a generally high number of traffic reports, and since this does not include indirect effects such as traffic jams, this can be considered a high percentage. In total, 39 road sections and 33 rail lines were affected. This decreased to 1.5 % on 23 July (15 rail lines, 15 road sections), but changed little until 31 July (11 rail lines, 11 road sections). At the end of August 2021, 1 % of total traffic reports issued in the two federal states was related to the flood event. The number of disruptions in rail traffic decreased only marginally until the end of September, while in road traffic there were only two reports related to the flood. The fact that there were still significantly more rail than road disruptions remaining in fall suggests that repairing rail infrastructure is more time-consuming than repairing road infrastructure. In NRW alone, around 600 km of railroad tracks were affected (Deutsche Bahn, 2021). When comparing traffic affected by the July 2021 flood with the situation of past flood events, for example the 2013 European floods (Thieken et al., 2016), the total number of disruptions for both rail and road traffic was much lower in 2021. This is likely due to the rather local scale of the flood event in 2021 as compared to 2013, where the flood affected a major part of eastern Germany. About twice as many districts were affected by rail disruptions as compared to road disruptions (see Fig. S8a). One possible explanation is that disruptions in train connections usually affect a longer section of track, while disruptions on the road affect shorter segments. Figure S8b shows that long-term disruptions (>25 d, equaling to 22 % of the total disruptions) mainly affected rail infrastructure (blue) in comparison to road infrastructure (yellow; as of mid-October 2021). Regional trains (i.e., Regionalbahn, RB; Regional-Express, RE; S-Bahn, S) were especially affected by long-term damage, whereas on the road especially the highways A1 and A61 were impacted. In mid-October 2021, 30 km of highways were still completely blocked, which equals 23 % of the roads blocked directly after the flooding (Schmitz, 2021). Regarding rail infrastructure, experts struggle to give an estimation on how long the reconstruction will take. In November, DB issued an update on the post-flood reconstruction work (SPIEGEL, 2021). First important connecting lines, e.g., on the Ahr valley railroad (Ahrtalbahn) have already been reopened; however, the reconstruction of further sections may take several years (cf. Szymczak et al., 2022).
The severe July 2021 flood with more than 180 fatalities was the result of the superposition and interaction of different mechanisms and processes on a wide range of temporal and spatial scales. In the four weeks before the flood, the region of main interest was affected by a high number of rain events, leading to moderate soil moisture conditions and thus limited infiltration capacity (see Fig. 12). During a similar period, persistent atmospheric blocking with corresponding high solar insulation over the Baltic Sea resulted in unusual high SST anomalies of up to 8 K compared to the climatological mean. This allowed considerable amounts of water to evaporate, which served as a major moisture source for the precipitation. According to our trajectory analysis, the easterly flow on the northern flank of the low-pressure system Bernd transported these moist air masses to the affected region.
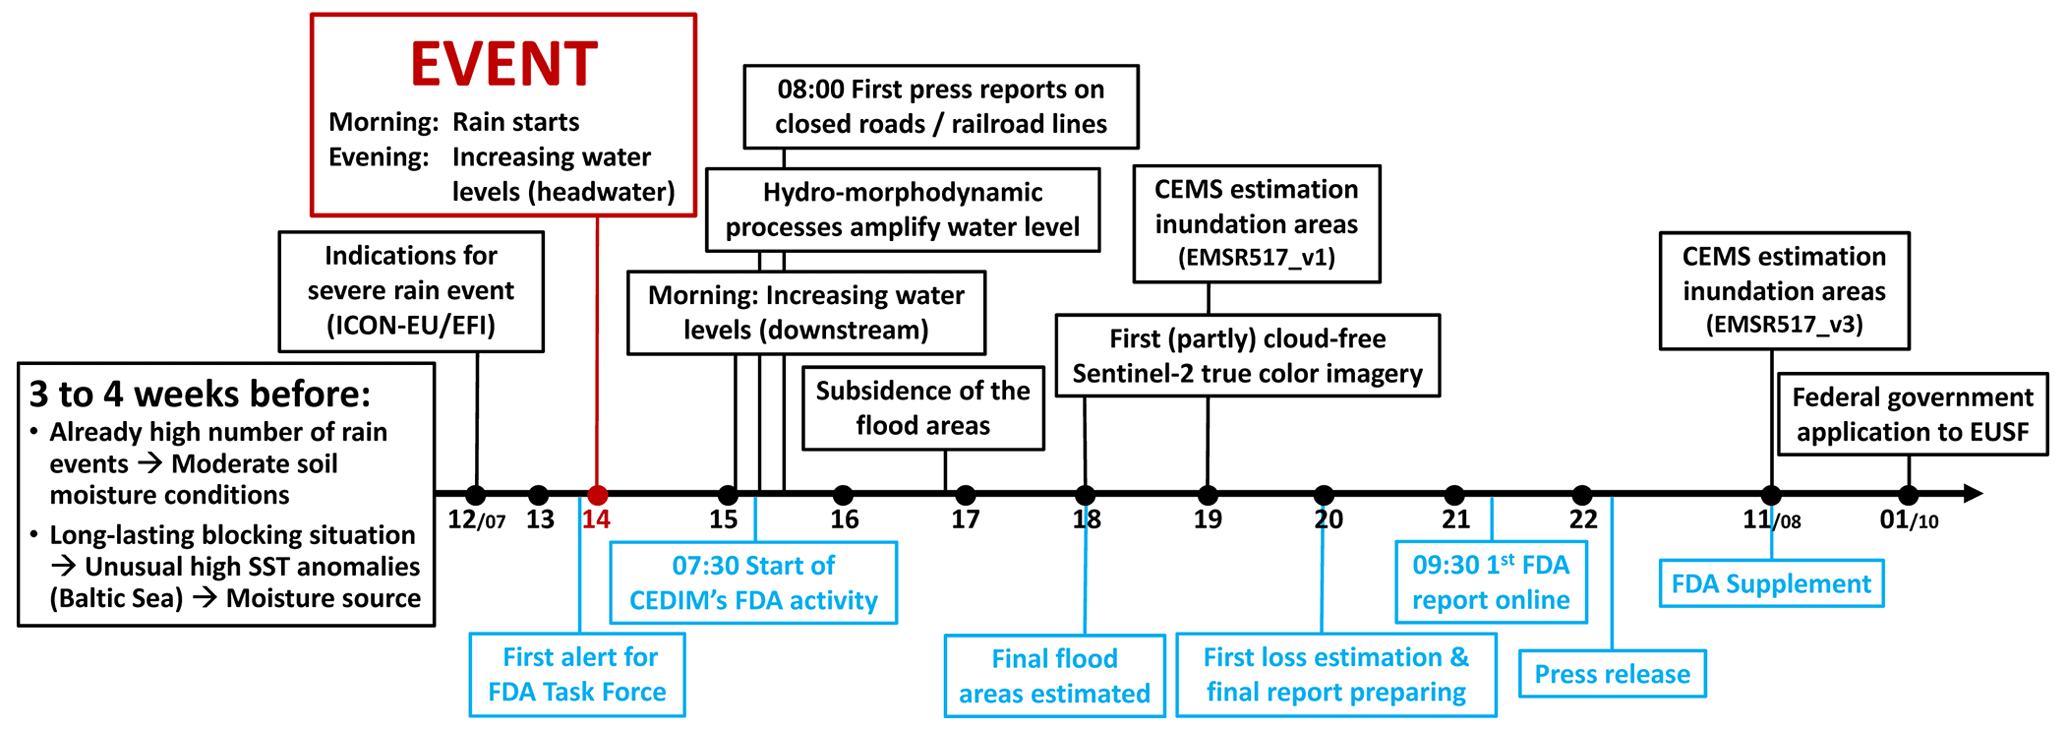
Figure 12Timeline (hours in UTC) of various relevant processes and activities before, during, and after the July 2021 flood starting on 14 July (dark red). Blue colors indicate activities within the FDA task force. More details see text.
Two days before the flood, on 12 July, a quasi-stationary anticyclone located over northeastern Europe blocked the upper-level trough associated with the low pressure system Bernd. As a result, Bernd and the associated frontal system moved very slowly westward toward the region of main interest. A slow propagating low with high moisture loading often results in localized large rain accumulations. At least 2 d ahead of the flood, the specific synoptic setting and the resulting rain fields were predicted well (within the range of the observations) by the operational deterministic (ICON-EU) and the ensemble (ECMWF) model runs. ECMWF's extreme forecast index (EFI) indicated a very high occurrence probability of an extreme event (Fig. 12).
Because of Bernd's slow propagation and a rain field orientation nearly parallel to the propagation direction, high rain totals starting in the early morning hours on 14 July affected a large area during approximately 15 h (Fig. 12). In addition, embedded convection further intensified the predominantly stratiform precipitation on the local-scale. According to our extreme value statistics, the observed totals of up to 150 mm correspond to return periods of more than 500 years. Combined with the steep slopes of the Ahr and other river valleys in the region and the almost saturated soils, the rainfall supported rapid rainfall-runoff transformation by overland flow through infiltration and saturation excess.
Because of heavy rain lasting several hours over an extended area, the water levels in the headwaters that originate from the central Eifel plateau (Ahr, Kyll, and Prüm rivers) rose very rapidly to unprecedented heights on 14 and 15 July (Fig. 12). All peak values were clearly beyond the peak discharges of a 100-year flood event, at some gauges even by a factor of more than five. At the downstream gauges, peak water levels were reached some hours later, in the early morning of 15 July, but with an even more dramatic increase. Estimated peak flows were all clearly above the statistical HQ100 values, with a record factor of around seven at the gauge Bliesheim (Erft). Owing to its deeply incised topography, forcing settled areas into close vicinity of the river and leaving very little floodplains for safe inundation, the villages along the river Ahr were most affected by the flood. Comparably dramatic rises and peak flows, however, were also reported east of the Rhine (Wupper river basin), and for several rivers in Belgium and Luxembourg, where rainfall amounts close to 200 mm in 24 h were observed.
The magnitude of the flood not only rendered flood reduction by reservoir operation impossible, it even posed a great threat to many retention basins in the region most affected. At retention basin Horchheim (river Erft), for example, the peak inflow was estimated to be about four times higher than the statistical HQ10 000. Although all floodgates were opened, the dam still overflowed, causing severe damage to all service infrastructure and partial destruction of the dam by backward erosion. Similar situations were observed at several other retention basins.
Various local-scale hydro-morphodynamic processes that condition the valley response to the flood, changes in the valley morphology, and sediment and debris transport contributed to the extraordinary water levels in some regions. Hillslope denudation and widespread landslides observed in some areas yielded an excess of sediment in the river channels network, which in turn contributed to changes in morphology. Flood levels increased in response to extra resistance to the flow and because of partial or complete blocking of cross-sections available to the flow. Other effects relevant for the high flood levels are anthropogenic morphology changes in the river cross-section attributable to railroad bridges (increased bottleneck effect) and probable damming and clogging of the river cross-sections at the bridges attributable to the trapping of debris transported from the upstream valley. Further, it can be assumed that a larger number of assets and industrial components caused a higher volume of debris available for recruitment in the upstream valley. All these effects, observed at several locations, may explain why the maximum water level of the 2021 flood at several sites was higher (e.g., Dernau by 2.4 m) compared to the 1804 flood, although the estimated peak flood discharges were in the same order of magnitude.
As part of CEDIM's FDA task force, we started to systematically assess inundation areas almost for the entire Ahr catchment on 14 July, while the flooding was still ongoing (Fig. 12). Rapid remote sensing of the inundation area is an essential component for estimating the impact of a disaster and for early response management to prioritize emergency response. For the analyses, live imagery from helicopters or drones and social media (e.g., YouTube, Twitter) were manually collected and processed. From July, Sentinel-1 imagery and first analyses of automatic procedures by DLR were available and integrated into the analyses to identify further flooded areas. From 17 July, Sentinel-2 imagery was used to identify further flooded areas despite partial cloud cover. On 18 July, the first final version of estimated inundation areas was available. A qualitative comparison with other products of inundation areas (e.g., EMSR517_v3, CEMS, 2021; SGD, 2021) is at a similar level to our near-real-time estimation.
In the Ahr valley alone, more than 100 bridges were damaged or completely destroyed. On 15 July 2021, about 4 % of the total road traffic reports issued by the police in RP and NRW were directly related to the flood event. In NRW, around 600 km of railroad tracks were affected. In general, about twice as many districts suffered from by rail disruptions – with longer required reconstruction times compared to road disruptions. Based on the rapid quantification of the mapped inundation areas, we carried out a first loss estimation using CEDIM's loss model 1 week after the onset of the flood (Fig. 12). Damage to private assets was estimated between EUR 4.4 and 13.0 billion, damage to commercial, industrial, and other buildings between EUR 1.8 and 3.9 billion, and damage to infrastructure between EUR 4.7 and 12 billion, thus in total EUR 11 to 29 billion. Several months later, the German government applied to the European Commission for a financial contribution from the European Union Solidarity Fund (EUSF), which was estimated at EUR 29.2 billion based on the numbers reported by the affected federal states and federal institutions (October 2021; BMI, 2022). The amount is thus at the upper end of our near-real-time estimations.
The July 2021 flood in western Germany and neighboring regions was one of the five most severe and expensive catastrophes related to natural hazards in Europe in the last half century. More than 180 people lost their lives, and well over 10 000 buildings were damaged. Numerous critical infrastructures, such as power and water supply networks, bridges, railway tracks, and roads, were partly or completely destroyed, which significantly hampered relief deliveries and clean-up work in the affected area. According to estimates from the German government in March 2022, the total damage in Germany alone amounts to EUR 32 billion (BMI, 2022), although it is still unclear how high the final reconstruction costs will actually be.
As part of CEDIM's Forensic Disaster Analyses (FDAs) in near-real-time, an interdisciplinary team of scientists investigated this severe flood event from different perspectives. Based upon analyses of available model and observational data and supplemented by own simulations and assessments, this paper has examined the complex interactions among meteorological, hydrological, hydraulic, and geomorphological processes and mechanisms that led to the extraordinary flood. Another objective of this study was to demonstrate how additional information immediately after a disaster can generate added value for early response management (e.g., prioritization of emergency measures), and how helpful these first assessments can be. Some of the analyses presented here were conducted while the flood was still ongoing – such as the estimation of inundation areas from photographs, video sequences, and satellite overflights, and derived damage assessments. Furthermore, we estimated the impact in terms of traffic disruptions and economic losses. Not only was the flood’s intensity decisive in the outcomes, but also the failure of the warning chain (Fekete and Sandholz, 2021; Thieken et al., 2022; DKKV, 2022). The population was informed too late or insufficiently about the extent of the imminent disaster despite the fact that both deterministic and ensemble weather forecasts issued, for example by DWD and ECMWF, predicted extreme rain totals and signified the potential of a very unusual or extreme event at least 2 d before the flood.
Based upon our analyses, we draw the following conclusions and make some recommendations to improve the estimation of flood hazard and risk:
-
Catastrophic events such as the July 2021 flood occur very rarely, mainly because the relevant processes and mechanisms on different spatial and temporal scales that amplify such an event must interact optimally. However, as such very rare events are responsible for the greatest number of fatalities and the highest economic losses, our still insufficient knowledge need to be further improved across disciplines through more dedicated research.
-
In recent years, the forecasting skill of numerical weather models has improved significantly due to increasing computational power, better observations and assimilation schemes, advanced model physics, higher resolution, and larger ensembles (Bauer et al., 2015). While the meteorological potential for an extraordinary event in the region was identified in the DWD and ECMWF forecasts at least 2 d in advance, it remains difficult to communicate the probabilistic nature of forecasts, in particular with respect to extremes, to users and the general public. Here, we have used the EFI based on ECMWF forecasts as a simple and intuitive metric that successfully gave indications for a potentially harmful event already several days before it occurred. We advertise usage of such concepts for other cases and forecasting systems to facilitate communication. However, a robust assessment of the model climate and predicted extremes as a reference is necessary to compute the EFI, which requires expensive re-forecasts. Currently, ECMWF is one of few operational centers internationally that provides such a metric operationally.
-
River gauges are a crucial source of information in the event of a flood. These gauges should be installed in such a way that they also function reliably in the event of an extreme flood. Therefore, particular care should be taken when replacing the river gauges lost during the recent flood to avoid similar issues in the future. The use of video analysis can be an alternative, allowing distance observation of flood levels and inference of flood discharges with fairly good results (Detert et al., 2017).
-
The flood hazard (e.g., a 100-year flood level) typically used as a design basis for flood protection is currently underestimated when historical severe floods are not considered (cf. Roggenkamp and Hergert, 2022). In the case of the Ahr catchment, historical analyses have shown that events comparable to the July 2021 flood had occurred already in 1804 and 1910, but only data from the continuous records (e.g., for gauge Altenahr starting in 1946) were used to estimate HQ100 values. Furthermore, when analyzing and interpreting hydrological data, it is important to consider that infrastructures, landscape occupation, and flood protection measures often change considerably with direct consequences on flood risk over timescales shorter than the return period considered for flood emergency management.
-
By interacting with the landscape and network morphology of river channels, flowing water enhances a flood’s destructive power. Relevant effects include (a) the occurrence of extreme landscape erosion, including rapidly developing rivulets and landslides; (b) rapidly evolving erosion and scour processes in the channel network and urban space; (c) recruitment of large-scale debris from the natural landscape and urban landscape; (d) deposition and clogging of bottlenecks in the channel network with eventual collapse; (e) possible intersection of the flow with landscape anthropogenic or natural singularities; and (f) interaction with vegetation. None of these aspects are considered in the current practice of flood hazard modeling, which leads to an underestimation of the actual risk (cf. also Dietze et al., 2022). We suggest an update of the floods directive, which should require that flood hazard and risk assessments include a heuristic hydro-morphodynamic approach that considers the landscape and network of river channels, including sediment transport and morphology changes (Nones, 2019).
-
The near-real-time analyses carried out within the frame of CEDIM's FDA task force (Schäfer et al., 2021) demonstrated that it is possible to meaningfully identify a large part of the flooded area from rapidly available ground data (photos, video sequences) in near-real-time during or after an event and thus generate valuable information for disaster management. A systematic flyover of the affected areas using drones or similar – as is currently being developed as part of a DLR pilot project (DLR, 2022) – would be highly desirable. Such results, made available to authorities or relevant stakeholders, can help to get a quick and better overview of the overall situation in order to assess the damage more quickly and to respond more appropriately in the aftermath of catastrophic events. This helps to mitigate associated adverse effects.
-
The impacts of extreme hydro-meteorological events also depend upon the way both authorities and individuals respond to predicted extremes and whether they take appropriate action (e.g., securing valuable assets and critical infrastructure, evacuations). Operational hydrological forecasts in Germany, however, currently mainly only provide forecasts of streamflow and water levels at gauges. To be as prepared as possible for upcoming extreme events, accurate predictions of both their physical characteristics and expected impacts on society and the built and natural environment are essential (Taylor et al., 2018; Merz et al., 2020; WMO, 2020). Impact-based forecasting that incorporates exposure, vulnerability, and social systems in addition to the hazard has great potential to reduce damage and increase resilience substantially. The feasibility of this has recently been demonstrated by Apel et al. (2022), who used a simplified hydrodynamic flood model to retroactively incorporate spatially explicit information (such as inundation area, depths, and flow velocities) based on predicted gauge discharges or water levels into current hydrological forecasting systems for the July 2021 flood. This provides real-time information on the expected extent of flooding and its impacts. By implementing the model on graphical processing units, simulation times are within the range required for operational flood warning.
PART2 of the paper (Ludwig et al., 2022) puts the July 2021 flood in historical context. This is accomplished not only by statistical analysis of observational data, but also by incorporating a large ensemble of regional climate simulations (comprising 12 000 years; cf. Ehmele et al., 2020, 2022). The second focus of PART2 is to examine how the precipitation causing the flood event could unfold in the context of climate change. The related analysis is based on a storyline approach using a series of pseudo global warming experiments and on a conventional ensemble of future climate projections.
HYRAS-DE, RADOLAN, KOSTRA, and German precipitation station data, all from DWD, are freely available at the Open Data Portal (https://opendata.dwd.de; DWD, 2023a). HYRAS data can be requested at DWD for research and education purposes. DWD weather forecasts (ICON-EU, ICON-D2, and ICON-D2-EPS) are available at Pamore (PArallel MOdel data REtrieve from Oracle databases) after registration (https://www.dwd.de/EN/ourservices/pamore/pamore.html; DWD, 2023b). The ECMWF-EPS data are available at the ECMWF Meteorological Archival and Retrieval System (MARS) after registration (https://apps.ecmwf.int/archive-catalogue/; ECMWF, 2023a). ERA5 data are freely available at https://apps.ecmwf.int/data-catalogues/era5/?class=ea; (ECMWF, 2023b). The LAGRANTO code Sprenger and Wernli (2015) is available at http://www.lagranto.ethz.ch (Atmospheric Dynamics Group, 2023). River gauge data are available on request from the responsible water authority: Water administration of Rhineland-Palatinate (https://www.lfu.rlp.de; LFU, 2023) for gauges Müsch, Altenahr, Jünkerath, Kordel, Prüm 2, and Prümzurlay; Erftverband (https://www.erftverband.de; Erftverband, 2023) for gauges Schönau and Bliesheim; and Wupperverband (https://www.wupperverband.de; Wupperverband, 2021) for gauges Hückeswagen and Opladen. Sentinel-1 and Sentinel-2 data can be freely accessed at https://www.sentinel-hub.com (Sentinel Hub, 2021). Information and data regarding traffic are available on request to Deutsche Bahn Press Office and on https://stau1.de/ (Stau1, 2023). CATDAT data are available at https://www.eea.europa.eu/data-and-maps/figures/total-economic-loss-caused-by-1 (EEA, 2022). The inundation areas and backward trajectories produced as part of this study are available online (https://doi.org/10.5445/IR/1000152962; Mohr et al., 2022).
The supplement related to this article is available online at: https://doi.org/10.5194/nhess-23-525-2023-supplement.
All KIT authors jointly designed the research questions of the study, continuously discussed the results, and wrote the text passages for their respective contributions. SM coordinated the joint collaboration, wrote the abstract and introduction, and prepared the final version of the paper. FE, BM, JQ, and PL were responsible for the meteorological analyses with the help of ACA, HF, MH, and JGP (including description of data and methods). UE, along with CG and MS, was responsible for the hydrological analyses (including description of data), with the latter two providing additional river gauge data. MF and FS were responsible for the analysis and discussion of hydro-morphodynamic processes. AS was responsible for remote sensing analysis and inundation area modeling, and JD was responsible for damage assessment, including further damage classification. KK and CW analyzed the affected rail and road infrastructure. MK wrote the discussion and conclusion. Paper revision and editing mainly involved SM, UE, MK, and PL with help from FE, PK, and JGP.
At least one of the (co-)authors is a member of the editorial board of Natural Hazards and Earth System Sciences. The peer-review process was guided by an independent editor, and the authors also have no other competing interests to declare.
Publisher's note: Copernicus Publications remains neutral with regard to jurisdictional claims in published maps and institutional affiliations.
This article is part of the special issue “Past and future European atmospheric extreme events under climate change”. It is not associated with a conference.
This study is the result of an interdisciplinary collaboration at the Karlsruhe Institute of Technology (KIT), originating from CEDIM's forensic disaster analyses (FDAs) on the flood of July 2021 in summer 2021. The Center for Disaster Management and Risk Reduction Technology (CEDIM) is a cross-disciplinary research center in the field of disasters, risks, and security at KIT. The authors thank DWD, ECMWF, CMC, the Copernicus program, and the responsible water authorities (water administrations of Rhineland-Palatinate, Erftverband, Wupperverband) for providing different observational data. Uwe Ehret thanks Michael Göller and Norbert Demuth from the water administration of Rhineland-Palatinate and Noémi Patz from the water administration of Luxembourg for providing valuable support related to gauge data and reconstruction of the flood event. Katharina Küpfer and Christina Wisotzky thank the Deutsche Bahn Working Group IT Platform and Services Traveler Information and Stau1.de for the provision of the traffic data. Susanna Mohr and Bernhard Mühr thank Robinson et al. (2014) for providing the EarthEnv-DEM90 digital elevation model data set and Natural Earth: https://www.naturalearthdata.com (last access: 13 November 2022). We thank all the private contributors of imagery during and after the flooding, which helped us in identifying the inundation area. Many thanks also to the photo- and videographers (Heinz Grates, Martin Seifert, Bettina Vier, and Maurice) who allowed us to use their photos or screenshots of their footage within this publication. Finally, we thank the open-access publishing fund of KIT.
This research has been supported by the Karlsruhe Institute of Technology (KIT), the Helmholtz Association (Research Program “Changing Earth – Sustaining our Future”, Climate Initiative REKLIM grant, grant VH-NG-124), the Bundesministerium für Bildung und Forschung (grant nos. 01LP1901A, 01LR2002B, 01LR2007B), Deutsche Forschungsgemeinschaft (SFB/TRR 165 “Waves to Weather”), and the AXA Research Fund (https://axa-research.org/en/project/joaquim-pinto, last access: 13 November 2022).
The article processing charges for this open-access publication were covered by the Karlsruhe Institute of Technology (KIT).
This paper was edited by Frank Kaspar and reviewed by two anonymous referees.
Aerts, J. C., Botzen, W. J., Clarke, K. C., Cutter, S. L., Hall, J. W., Merz, B., Michel-Kerjan, E., Mysiak, J., Surminski, S., and Kunreuther, H.: Integrating human behaviour dynamics into flood disaster risk assessment, Nat. Clim. Change, 8, 193–199, https://doi.org/10.1038/s41558-018-0085-1, 2018. a
AGE: Hochwasserereignis Juli 2021, l'Administration de la gestion de l'eau (AGE), Esch-sur-Alzette, Luxembourg, https://eau.gouvernement.lu/fr/actualites/2021/07-juillet/Hochwasserereignis2021.html (last access: 9 May 2022), 19 July 2021. a, b
Apel, H., Vorogushyn, S., and Merz, B.: Brief communication: Impact forecasting could substantially improve the emergency management of deadly floods: case study July 2021 floods in Germany, Nat. Hazards Earth Syst. Sci., 22, 3005–3014, https://doi.org/10.5194/nhess-22-3005-2022, 2022. a
Atmospheric Dynamics Group: LAGRANTO – The Lagrangian Analysis Tool, Institute for Atmospheric and Climate Science, ETH Zurich, Zurich, Switzerland, http://www.lagranto.ethz.ch, last access: 2 February 2023. a
Bates, P. D.: Flood inundation prediction, Annu. Rev. Fluid Mech., 54, 287–315, https://doi.org/10.1146/annurev-fluid-030121-113138, 2022. a
Bauer, P., Thorpe, A., and Brunet, G.: The quiet revolution of numerical weather prediction, Nature, 525, 47–55, https://doi.org/10.1038/nature14956, 2015. a
Bezak, N., Brilly, M., and Šraj, M.: Comparison between the peaks-over-threshold method and the annual maximum method for flood frequency analysis, Hydrolog. Sci. J., 59, 959–977, https://doi.org/10.1080/02626667.2013.831174, 2014. a
Bezirksregierung Köln: EG-Hochwasserrisikomanagement-Richtlinie: Hochwassergefahrenkarte – Erft-System A02, Erft (274), Swistbach (2742), Gefahren- und Risikokarten Erft System: Gewässer: Erft System, Teileinzugsgebiet: Erft, Ministerium für Umwelt, Landwirtschaft, Natur- und Verbraucherschutz des Landes Nordrhein-Westfalen, Cologne, Germany, https://www.flussgebiete.nrw.de/gefahren-und-risikokarten-erft-system-5894 (last access: 9 May 2022), 2019. a
Blanchard, B. J., McFarland, M. J., Schmugge, T. J., and Rhoades, E.: Estimation of soil moisture with API algorithms and microwave emission, J. Am. Water Resour. Assoc., 17, 767–774, https://doi.org/10.1111/j.1752-1688.1981.tb01296.x, 1981. a
Blanckaert, K. and de Vriend, H. J.: Nonlinear modeling of mean flow redistribution in curved open channels, Water Resour. Res., 39, 1375, https://doi.org/10.1029/2003WR002068, 2003. a
BMI: Bericht zur Hochwasserkatastrophe 2021: Katastrophenhilfe, Wiederaufbau und Evaluierungsprozesse, Bundesministerium des Innern und für Heimat, Berlin, Germany, https://www.bmi.bund.de/SharedDocs/downloads/DE/veroeffentlichungen/2022/abschlussbericht-hochwasserkatastrophe.pdf?__blob=publicationFile&v=1, last access: 9 May 2022. a, b, c, d, e, f, g
Brabson, B. B. and Palutikof, J. P.: Tests of the Generalized Pareto Distribution for predicting extreme wind speeds, J. Appl. Meteorol., 39, 1627–1640, https://doi.org/10.1175/1520-0450(2000)039<1627:TOTGPD>2.0.CO;2, 2000. a
Buffin-Bélanger, T., Biron, P. M., Larocque, M., Demers, S., Olsen, T., Choné, G., Ouellet, M.-A., Cloutier, C.-A., Desjarlais, C., and Eyquem, J.: Freedom space for rivers: An economically viable river management concept in a changing climate, Geomorphology, 251, 137–148, https://doi.org/10.1016/j.geomorph.2015.05.013, 2015. a
Bung, D. B.: Extreme flooding in Western Germany: Some thoughts on hazards, return periods and risk, Hydrolink Magazine, 4/2021, https://www.iahr.org/library/infor?pid=20509 (last access: 2 February 2023), 2021. a
Burton, I.: Forensic disaster investigations in depth: A new case study model, Environment, 52, 36–41, https://doi.org/10.1080/00139157.2010.507144, 2010. a
Caldas-Alvarez, A., Augenstein, M., Ayzel, G., Barfus, K., Cherian, R., Dillenardt, L., Fauer, F., Feldmann, H., Heistermann, M., Karwat, A., Kaspar, F., Kreibich, H., Lucio-Eceiza, E. E., Meredith, E. P., Mohr, S., Niermann, D., Pfahl, S., Ruff, F., Rust, H. W., Schoppa, L., Schwitalla, T., Steidl, S., Thieken, A. H., Tradowsky, J. S., Wulfmeyer, V., and Quaas, J.: Meteorological, impact and climate perspectives of the 29 June 2017 heavy precipitation event in the Berlin metropolitan area, Nat. Hazards Earth Syst. Sci., 22, 3701–3724, https://doi.org/10.5194/nhess-22-3701-2022, 2022. a
CEMS: The Copernicus Emergency Management Service forecasts, notifies, and monitors devastating floods in Germany, Netherlands, Belgium and Switzerland, COPERNICUS Emergency Management Service (CEMS) Mapping, European Commission, 16 July 2021, Brussels, Belgium, https://emergency.copernicus.eu/mapping/ems/copernicus-emergency-management-service-forecasts-notifies (last access: 9 May 2022), 2021. a, b, c, d
Coles, S., Bawa, J., Trenner, L., and Dorazio, P.: An introduction to statistical modeling of extreme values, in: Springer Series in Statistics, Springer, London, UK, https://doi.org/10.1007/978-1-4471-3675-0, 2001. a
Daniell, J., Wenzel, F., and Schaefer, A.: The economic costs of natural disasters globally from 1900–2015: historical and normalised floods, storms, earthquakes, volcanoes, bushfires, drought and other disasters, in: EGU General Assembly Conference Abstracts, 23–28 April 2017, Vienna, Austria, EPSC2016-1899, 2016. a
Daniell, J. E., Khazai, B., Wenzel, F., and Vervaeck, A.: The CATDAT damaging earthquakes database, Nat. Hazards Earth Syst. Sci., 11, 2235–2251, https://doi.org/10.5194/nhess-11-2235-2011, 2011. a, b
Daniell, J. E., Wenzel, F., and Schaefer, A. M.: The use of historic loss data for insurance and total loss modeling, in: Risk modeling for hazards and disasters, Elsevier, 107–137, https://doi.org/10.1016/B978-0-12-804071-3.00005-7, 2018. a
Detert, M., Johnson, E. D., and Weitbrecht, V.: Proof-of-concept for low-cost and non-contact synoptic airborne river flow measurements, Int. J. Remote Sens., 38, 2780–2807, https://doi.org/10.1080/01431161.2017.1294782, 2017. a
Deutsche Bahn: Zerstörungen in historischem Ausmaß: DB zieht nach lutkatastrophe Zwischenbilanz, Deutsche Bahn AG, Berlin, Germany, . Available: https://www.deutschebahn.com/de/presse/pressestart_zentrales (last access: 9 May 2022), 23 July 2021. a
Dewals, B., Erpicum, S., Pirotton, M., and Archambeau, P.: The July 2021 extreme floods in the Belgian part of the Meuse basin, Hydrolink Magazine, 4/2021, http://hdl.handle.net/2268/263750 (last access: 2 February 2023), 2021. a, b, c, d
Dietze, M., Bell, R., Ozturk, U., Cook, K. L., Andermann, C., Beer, A. R., Damm, B., Lucia, A., Fauer, F. S., Nissen, K. M., Sieg, T., and Thieken, A. H.: More than heavy rain turning into fast-flowing water – A landscape perspective on the 2021 Eifel floods, Nat. Hazards Earth Syst. Sci., 22, 1845–1856, https://doi.org/10.5194/nhess-22-1845-2022, 2022. a, b, c
DKKV: Die Flutkatastrophe im Juli 2021 in Deutschland – Ein Jahr danach: Aufarbeitung und erste Lehren für die Zukunft, Tech. rep., DKKV – Schriftenreihe Nr. 62 “Die Flutkatastrophe im Juli 2021 in Deutschland”, DKKV – Deutsche Komitee Katastrophenvorsorge, Bonn, Germany, https://www.dkkv.org/fileadmin/user_upload/DKKV_Schriftenreihe_62_2.Auflage.pdf (last access: 2 February 2023), 2022. a
DLR: Storms and heavy rain cause floods in Western Germany, German Aerospace Center (DLR), Center for Satellite Based Crisis Information (ZKI), Weßling, Germany, https://activations.zki.dlr.de/en/activations/items/ACT152.html (last access: 9 May 2022), 15 July 2021. a, b, c
DLR: Aktuelles: Drohnen sammeln Daten für schnelle Katastrophenhilfe – Übung mit Rettungskräften im Ahrtal, 31 October 2022, DLR – Deutsches Zentrum für Luft- und Raumfahrt, Cologne, Germany, https://www.dlr.de/content/de/artikel/news/2022/04/20221031_drohnen-sammeln-daten-fuer-schnelle-katastrophenhilfe.html, last access: 17 November 2022. a
DWD: Open Data Portal, Deutscher Wetterdienst, Offenbach, Germany, https://opendata.dwd.de (last access: 2 February 2023), 2023a. a
DWD: Pamore – Retrieving archived forecast model data, Deutscher Wetterdienst, Offenbach, Germany, https://www.dwd.de/EN/ourservices/pamore/pamore.html (last access: 2 February 2023), 2023b. a
ECMWF: Archive Catalogue, ECMWF – European Centre for Medium-Range Weather Forecasts, Reading, UK, https://apps.ecmwf.int/archive-catalogue/, (last access: 2 February 2023), 2023a. a
ECMWF: ERA5 Catalogue, ECMWF – European Centre for Medium-Range Weather Forecasts, Reading, UK, https://apps.ecmwf.int/data-catalogues/era5/?class=ea (last access: 2 February 2023), 2023b. a
EEA: Total economic loss caused by weather- and climate-related extreme events in EEA member countries (1980–2020) – per square kilometre based on CATDAT, EEA – European Environment Acency, 19 January 2022, Copenhagen, Denmark, https://www.eea.europa.eu/data-and-maps/figures/total-economic-loss-caused-by-1, last access: 9 May 2022. a, b
Ehmele, F., Kautz, L.-A., Feldmann, H., and Pinto, J. G.: Long-term variance of heavy precipitation across central Europe using a large ensemble of regional climate model simulations, Earth Syst. Dynam., 11, 469–490, https://doi.org/10.5194/esd-11-469-2020, 2020. a
Ehmele, F., Kautz, L.-A., Feldmann, H., He, Y., Kadlec, M., Kelemen, F. D., Lentink, H. S., Ludwig, P., Manful, D., and Pinto, J. G.: Adaptation and application of the large LAERTES-EU regional climate model ensemble for modeling hydrological extremes: a pilot study for the Rhine basin, Nat. Hazards Earth Syst. Sci., 22, 677–692, https://doi.org/10.5194/nhess-22-677-2022, 2022. a
Erftverband: Hochwasser an der Erft und ihren Nebengewässern 14. bis 16.07.2021, Erste Auswertung des Niederschlags- und Abflussgeschehens, Revision 2 as of 2021/08/20, available on request from info@erftverband.de, 2021. a
Erftverband: Erftverband – Wasserwirtschft für unsere Region, Bergheim, Germany, https://www.erftverband.de, last access: 2 February 2023. a
Fekete, A. and Sandholz, S.: Here comes the flood, but not failure? Lessons to learn after the heavy rain and pluvial floods in Germany 2021, Water, 13, 3016, https://doi.org/10.3390/w13213016, 2021. a, b, c, d
GDV: 2021 teuerstes Naturgefahrenjahr für die Versicherer, GDV – Gesamtverband der Deutschen Versicherungswirtschaft e.V., Medieninformationen vom 27 December 2021, Berlin, Germany, https://www.gdv.de/de/medien/aktuell/2021-teuerstes-naturgefahrenjahr-fuer-die-versicherer-74092 (last access: 9 May 2022), 2021. a
Google Earth: Germany, 50.443280 N, 6.873047 E, https://earth.google.com/web/search/50.44568101718479,+6.885674462802995 (last access: 20 January 2022), 2021. a
Grams, C. M., Binder, H., Pfahl, S., Piaget, N., and Wernli, H.: Atmospheric processes triggering the central European floods in June 2013, Nat. Hazards Earth Syst. Sci., 14, 1691–1702, https://doi.org/10.5194/nhess-14-1691-2014, 2014. a
Gunasekera, R., Daniell, J. E., Pomonis, A., Arias, R. A. D., Ishizawa, O., and Stone, H.: Methodology Note: The global rapid post-disaster damage estimation (GRADE) approach, World Bank and GFDRR Technical Report, World Bank and GFDRR, Washington, USA, https://www.gfdrr.org/en/publication/methodology-note-global-rapid-post-disaster-damage-estimation (last access: 9 May 2022), 2018. a
Heggen, R. J.: Normalized antecedent precipitation index, J. Hydrol. Eng., 6, 377–381, https://doi.org/10.1061/(ASCE)1084-0699(2001)6:5(377), 2001. a, b
Hersbach, H., Bell, B., Berrisford, P., Hirahara, S., Horányi, A., Muñoz-Sabater, J., Nicolas, J., Peubey, C., Radu, R., Schepers, D., Simmons, A., Soci, C., Abdalla, S., Abellan, X., Balsamo, G., Bechtold, P., Biavati, G., Bidlot, J., Bonavita, M., De Chiara, G., Dahlgren, P., Dee, D., Diamantakis, M., Dragani, R., Flemming, J., Forbes, R., Fuentes, M., Geer, A., Haimberger, L., Healy, S., Hogan, R. J., Hólm, E., Janisková, M., Keeley, S., Laloyaux, P., Lopez, P., Lupu, C., Radnoti, G., de Rosnay, P., Rozum, I., Vamborg, F., Villaume, S., and Thépaut, J.-N.: The ERA5 global reanalysis, Q. J. Roy. Meteorol. Soc., 146, 1999–2049, https://doi.org/10.1002/qj.3803, 2020. a
Junghänel, T., Bissolli, P., Daßler, J., Fleckenstein, R., Imbery, F., Janssen, W., Kaspar, F., Lengfeld, K., Leppelt, T., Rauthe, M., Rauthe-Schöch, A., Rocek, M., Walawender, E., and Weigl, E.: Hydro-klimatologische Einordnung der Stark- und Dauerniederschläge in Teilen Deutschlands im Zusammenhang mit dem Tiefdruckgebiet “Bernd” vom 12. bis 19. Juli 2021, DWD – Deutscher Wetterdienst, Offenbach, Germany, https://www.dwd.de/DE/leistungen/besondereereignisse/niederschlag/20210721_bericht_starkniederschlaege_tief_bernd.html (last access: 9 May 2022), 22 July 2021. a
Kautz, L.-A., Martius, O., Pfahl, S., Pinto, J. G., Ramos, A. M., Sousa, P. M., and Woollings, T.: Atmospheric blocking and weather extremes over the Euro-Atlantic sector – A review, Weather Clim. Dynam., 3, 305–336, https://doi.org/10.5194/wcd-3-305-2022, 2022. a
Kohler, M. A. and Linsley, R. K.: Predicting the runoff from storm rainfall, in: vol. 30, US Department of Commerce, Weather Bureau, Washington, USA, https://www.nrc.gov/docs/ML0819/ML081900279.pdf (last access: 2 February 2023), 1951. a
Koks, E., Van Ginkel, K., Van Marle, M., and Lemnitzer, A.: Brief Communication: Critical Infrastructure impacts of the 2021 mid-July western European flood event, Nat. Hazards Earth Syst. Sci., 22, 3831–3838, https://doi.org/10.5194/nhess-22-3831-2022, 2022. a
Kotz, S. and Nadarajah, S.: Extreme value distributions: theory and applications, Imperial College Press, London, World Scientific Publishing, Singapore, https://doi.org/10.1142/9781860944024_0001, 2000. a
Kreibich, H., Müller, M., Schröter, K., and Thieken, A. H.: New insights into flood warning reception and emergency response by affected parties, Nat. Hazards Earth Syst. Sci., 17, 2075–2092, https://doi.org/10.5194/nhess-17-2075-2017, 2017. a
Kreienkamp, F., Philip, S. Y., Tradowsky, J. S., Kew, S. F., Lorenz, P., Arrighi, J., Belleflamme, A., Bettmann, T., Caluwaerts, S., Chan, S. C., Ciavarella, A., Cruz, L. D., de Vries, H., Demuth, N., Ferrone, A., Fischer, E. M., Fowler, H. J., Goergen, K., Heinrich, D., Henrichs, Y., Lenderink, G., Kaspar, F., Nilson, E., Otto, F. E. L., Ragone, F., Seneviratne, S. I., Singh, R. K., Skålevåg, A., Termonia, P., Thalheimer, L., van Aalst, M., den Bergh, J. V., de Vyver, H. V., Vannitsem, S., van Oldenborgh, G. J., Van Schaeybroeck, B., Vautard, R., Vonk, D., and Wanders, N.: Rapid attribution of heavy rainfall events leading to the severe flooding in Western Europe during July 2021, WWA – World Weather Attribution, https://www.worldweatherattribution.org/heavy-rainfall-which-led-to-severe-flooding-in-western-europe (last access: 9 May 2022), 2021. a
Kunz, M., Mühr, B., Kunz-Plapp, T., Daniell, J. E., Khazai, B., Wenzel, F., Vannieuwenhuyse, M., Comes, T., Elmer, F., Schröter, K., Fohringer, J., Münzberg, T., Lucas, C., and Zschau, J.: Investigation of superstorm Sandy 2012 in a multi-disciplinary approach, Nat. Hazards Earth Syst. Sci., 13, 2579–2598, https://doi.org/10.5194/nhess-13-2579-2013, 2013. a
Lalaurette, F.: Early detection of abnormal weather conditions using a probabilistic extreme forecast index, Q. J. Roy. Meteorol. Soc., 129, 3037–3057, https://doi.org/10.1256/qj.02.152, 2003. a
Lenggenhager, S. and Martius, O.: Atmospheric blocks modulate the odds of heavy precipitation events in Europe, Clim. Dynam., 53, 4155–4171, https://doi.org/10.1007/s00382-019-04779-0, 2019. a
LFU: Landesamt für Umwelt Rheinland-Pfalz, Mainz, Germany, https://www.lfu.rlp.de, last access: 2 February 2023. a
Ludwig, P., Ehmele, F., Franca, M. J., Mohr, S., Caldas-Alvarez, A., Daniell, J. E., Ehret, U., Feldmann, H., Hundhausen, M., Knippertz, P., Küpfer, K., Kunz, M., Mühr, B., Pinto, J. G., Quinting, J., Schäfer, A. M., Seidel, F., and Wisotzky, C.: A multi-disciplinary analysis of the exceptional flood event of July 2021 in central Europe. Part 2: Historical context and relation to climate change, Nat. Hazards Earth Syst. Sci. Discuss. [preprint], https://doi.org/10.5194/nhess-2022-225, in review, 2022. a, b, c
Maurice: Hochwasser Erftstadt Blessem, YouTube, Maurice, https://www.youtube.com/watch?v=rIJx4qJI0oU (last access: 9 May 2022), 15 July 2021. a
Merz, B., Elmer, F., Kunz, M., Mühr, B., Schröter, K., and Uhlemann-Elmer, S.: The extreme flood in June 2013 in Germany, Houille Blanche, 100, 5–10, https://doi.org/10.1051/lhb/2014001, 2014. a
Merz, B., Kuhlicke, C., Kunz, M., Pittore, M., Babeyko, A., Bresch, D. N., Domeisen, D. I. V., Feser, F., Koszalka, I., Kreibich, H., Pantillon, F., Parolai, S., Pinto, J. G., Punge, H. J., Rivalta, E., Schröter, K., Strehlow, K., Weisse, R., and Wurpts, A.: Impact forecasting to support emergency management of natural hazards, Rev. Geophys., 58, e2020RG000704, https://doi.org/10.1029/2020RG000704, 2020. a, b
MeteoLux: Hochwasserereignis Juli 2021, MeteoLux – Météo au Luxembourg, l'Administration de la navigation aérienne, Sandweiler, Luxembourg, https://www.meteolux.lu/de/aktuelles/ruckblick-auf-den-ergiebigen-dauerregen-vom-14-und-15-juli-2021 (last access: 9 May 2022), 1 September 2021. a
Mohr, S., Wandel, J., Lenggenhager, S., and Martius, O.: Relationship between atmospheric blocking and warm season thunderstorms over western and central Europe, Q. J. Roy. Meteorol. Soc., 145, 3040–3056, https://doi.org/10.1002/qj.3603, 2019. a
Mohr, S., Wilhelm, J., Wandel, J., Kunz, M., Portmann, R., Punge, H. J., Schmidberger, M., Quinting, J. F., and Grams, C. M.: The role of large-scale dynamics in an exceptional sequence of severe thunderstorms in Europe May–June 2018, Weather Clim. Dynam., 1, 325–348, https://doi.org/10.5194/wcd-1-325-2020, 2020. a
Mohr, S., Schäfer, A., and Quinting, J.: Data supplement for the publication: A multi-disciplinary analysis of the exceptional flood event of July 2021 in central Europe. Part 1: Event description and analysis, KIT – Karlsruher Institut für Technologie [data set], https://doi.org/10.5445/IR/1000152962, 2022. a
Mühr, B., Daniell, J., Kron, A., Jahanbazi, M., Bartsch, M., Raskob, W., Wisotzky, C., Barta, T., Kunz, M., Wandel, J., Becker, F., Latt, C., and Mohr, S.: CEDIM Forensic Disaster Analysis (FDA) Group “Hurricane/Tropical Storm Harvey” Report Nr 1, Tech. rep., CEDIM – Center for Disaster Management and Risk Reduction Technology, Karlsruhe, Germany, https://www.cedim.kit.edu/download/FDA_Harvey_2017_report1.pdf (last access: 9 May 2022), 2017. a
Munich Re: Hurricanes, cold waves, tornadoes: Weather disasters in USA dominate natural disaster losses in 2021 – Europe: Extreme flash floods with record losses, Munich Re, Media relations on 10 January 2022: Natural disaster losses 2021, Munich, Germany, https://www.munichre.com/en/company/media-relations/media-information-and-corporate-news/media-information/2022/natural-disaster-losses-2021.html, last access: 9 May 2022. a, b
NoeWehrtSich: #Walporzheim. Es ist nicht zu glauben, Twitter [WxNB_] on 17 July 2021, https://twitter.com/NoeWehrtSich/status/1416405504117575685 (last access: 9 May 2022), 2021. a
Nones, M.: Dealing with sediment transport in flood risk management, Acta Geophys., 67, 677–685, 2019. a
Petermann, A.: Nach der Flutkatastrophe im Ahrtal: Leben mit dem Risiko; Um Dernau herum wurde die ganze Talsohle zugebaut – Futter für die Flut, die im Juli kam (© imago/Bonnfilm/Klaus Schmidt/Sepp Spiegl), Deutschlandfunk Kultur, Cologne, Germany, https://www.deutschlandfunkkultur.de/nach-der-flutkatastrophe-im-ahrtal-leben-mit-dem-risiko-100.html (last access: 9 May 2022), 22 October 2021. a
Piper, D., Kunz, M., Ehmele, F., Mohr, S., Mühr, B., Kron, A., and Daniell, J.: Exceptional sequence of severe thunderstorms and related flash floods in May and June 2016 in Germany. Part I: Meteorological background, Nat. Hazards Earth Syst. Sci., 16, 2835–2850, https://doi.org/10.5194/nhess-16-2835-2016, 2016. a, b
Rauthe, M., Steiner, H., Riediger, U., Mazurkiewicz, A., and Gratzki, A.: A Central European precipitation climatology – Part I: Generation and validation of a high-resolution gridded daily data set (HYRAS), Meteorol. Z., 22, 235–256, https://doi.org/10.1127/0941-2948/2013/0436, 2013. a
Reinert, D., Prill, F., Frank, H., Denhard, M., Baldauf, M., Schraff, C., Gebhardt, C., Marsigli, C., and Zängl, G.: DWD database reference for the global and regional ICON and ICON-EPS forecasting system, Tech. rep., DWD – Deutscher Wetterdienst, Offenbach, Germany, https://www.dwd.de/DWD/forschung/nwv/fepub/icon_database_main.pdf (last access: 9 May 2022), 2020. a
Robinson, N., Regetz, J., and Guralnick, R. P.: EarthEnv-DEM90: A nearly-global, void-free, multi-scale smoothed, 90 m digital elevation model from fused ASTER and SRTM data, ISPRS J. Photogram. Remote Sens., 87, 57–67, https://doi.org/10.1016/j.isprsjprs.2013.11.002, 2014.
Roggenkamp, T. and Herget, J.: Reconstructing peak discharges of historic floods of the River Ahr, Germany, Erdkunde, 68, 49–59, 2014a. a
Roggenkamp, T. and Herget, J.: Historische Hochwasser der Ahr – Die Rekonstruktion von Scheitelabflüssen ausgewählter Ahr-Hochwasser, in: Heimatjahrbuch Kreis Ahrweiler 2015, 150–154, https://relaunch.kreis-ahrweiler.de/kvar/VT/hjb2015/hjb2015.47.pdf (last access: 2 February 2023), 2014b. a
Roggenkamp, T. and Hergert, J.: Hochwasser der Ahr im Juli 2021 – Abflusseinschätzung und Einordnung, HyWa – Hydrologie und Wasserbewirtschaftung, 66, 40–49, 2022. a, b, c
Ruiz-Villanueva, V., Mazzorana, B., Bladé, E., Bürkli, L., Iribarren-Anacona, P., Mao, L., Nakamura, F., Ravazzolo, D., Rickenmann, D., Sanz-Ramos, M., Stoffel, M., and Wohl, E.: Characterization of wood-laden flows in rivers, Earth Surf. Proc. Land., 44, 1694–1709, https://doi.org/10.1002/esp.4603, 2019. a
Saadi, M., Furusho-Percot, C., Belleflamme, A., Chen, J.-Y., Trömel, S., and Kollet, S.: How uncertain are precipitation and peakflow estimates for the July 2021 flooding event?, Nat. Hazards Earth Syst. Sci. Discuss. [preprint], https://doi.org/10.5194/nhess-2022-111, in review, 2022. a
Schäfer, A., Mühr, B., Daniell, J. E., Ehret, U., Ehmele, F., Küpfer, K., Brand, J., Wisotzky, C., Skapski, J., Rentz, L., Mohr, S., and Kunz, M.: CEDIM Forensic Disaster Analysis (FDA) Group “Hochwasser Mitteleuropa, Juni 2021 (Deutschland)” Bericht Nr. 1 “Nordrhein-Westfalen & Rheinland-Pfalz”, Tech. rep., CEDIM – Center for Disaster Management and Risk Reduction Technology, Karlsruhe, Germany, https://doi.org/10.5445/IR/1000135730, 2021. a, b, c, d, e
Schmitz, O.: Hochwasser-Schäden NRW: Welche Autobahnen noch gesperrt sind, wo es es wieder läuft, 24RHEIN.de, Hamm, Germany, https://www.24rhein.de/leben-im-westen/verkehr/a1-a61-a553-autobahn-ueberblick-sperrung-stoerung-oeffnung (last access: 9 May 2022), 18 October 2021. a
Schröter, K., Kunz, M., Elmer, F., Mühr, B., and Merz, B.: What made the June 2013 flood in Germany an exceptional event? A hydro-meteorological evaluation, Hydrol. Earth Syst. Sci., 19, 309–327, https://doi.org/10.5194/hess-19-309-2015, 2015. a, b, c
Sentinel Hub: Sentinel Hub, Cloud API for Satellite Imagery, Sentinel Hub [data set], https://www.sentinel-hub.com (last access: 9 May 2022), 2021. a, b
SGD: Überschwemmungsgebiet Ahr, Struktur- und Genehmigungsdirektion (SGD) Nord, Obere Landesbehörde des Landes Rheinland-Pfalz, Koblenz, Germany, https://sgdnord.rlp.de/de/wasser-abfall-boden/wasserwirtschaft/hochwasserschutz/uesg/laufende-verfahren/uesg-ahr/ (last access: 17 November 2022), 2021. a
Sodemann, H., Schwierz, C., and Wernli, H.: Interannual variability of Greenland winter precipitation sources: Lagrangian moisture diagnostic and North Atlantic Oscillation influence, J. Geophys. Res.-Atmos., 113, D03107, https://doi.org/10.1029/2007JD008503, 2008. a
SPIEGEL: Rheinland-Pfalz: Erster Abschnitt der Ahrtalbahn wird nach Flut wiedereröffnet, DER SPIEGEL online, Hamburg, Germany, https://www.spiegel.de/wirtschaft/unternehmen/rheinland-pfalz-erster-abschnitt-der-ahrtal-bahn-wird-nach-flut (last access: 9 May 2022), 8 November 2021. a
Sprenger, M. and Wernli, H.: The LAGRANTO Lagrangian analysis tool – Version 2.0, Geosci. Model Dev., 8, 2569–2586, https://doi.org/10.5194/gmd-8-2569-2015, 2015. a, b
Stau1: Aktuelle Verkehrslage – Alle Staus und Baustellen in Deutschland, TechSeed GmbH (formerly Stau1 GmbH), Cologne, Germany, https://stau1.de, last access: 2 February 2023. a
Szymczak, S., Backendorf, F., Bott, F., Fricke, K., Junghänel, T., and Walawender, E.: Impacts of Heavy and Persistent Precipitation on Railroad Infrastructure in July 2021: A Case Study from the Ahr Valley, Rhineland-Palatinate, Germany, Atmosphere, 13, 1118, https://doi.org/10.3390/atmos13071118, 2022. a, b
Taylor, A. L., Kox, T., and Johnston, D.: Communicating high impact weather: improving warnings and decision making processes, Int. J. Disast. Risk Reduct., 30, 1–4, https://doi.org/10.1016/j.ijdrr.2018.04.002, 2018. a
Teng, W. L., Wang, J. R., and Doraiswamy, P. C.: Relationship between satellite microwave radiometric data, antecedent precipitation index, and regional soil moisture, Int. J. Remote Sens., 14, 2483–2500, https://doi.org/10.1080/01431169308904287, 1993. a
Thieken, A. H., Bessel, T., Kienzler, S., Kreibich, H., Müller, M., Pisi, S., and Schröter, K.: The flood of June 2013 in Germany: How much do we know about its impacts?, Nat. Hazards Earth Syst. Sci., 16, 1519–1540, https://doi.org/10.5194/nhess-16-1519-2016, 2016. a
Thieken, A. H., Bubeck, P., Heidenreich, A., von Keyserlingk, J., Dillenardt, L., and Otto, A.: Performance of the flood warning system in Germany in July 2021 – insights from affected residents, EGUsphere [preprint], https://doi.org/10.5194/egusphere-2022-244, 2022. a, b
Tradowsky, J. S., Philip, S. Y., Kreienkamp, F., Kew, S. F., Lorenz, P., Arrighi, J., Belleflamme, A., Bettmann, T., Caluwaerts, S., Chan, S. C., Ciavarella, A., De Cruz, L., de Vries, H., Demuth, N., Ferrone, A., Fischer, E. M., Fowler, H. J., Goergen, K., Heinrich, D., Henrichs, Y., Lenderink, G., Kaspar, F., Nilson, E., Otto, F. E. L., Ragone, F., Seneviratne, S. I., Singh, R. K., Skålevåg, A., Termonia, P., Thalheimer, L., van Aalst, M., Van den Bergh, J., Van de Vyver, H., Vannitsem, S., van Oldenborgh, G. J., Van Schaeybroeck, B., Vautard, R., Vonk, D., and Wanders, N.: Attribution of heavy rainfall events leading to the severe flooding in Western Europe during July 2021, Climatic Change, in revision, 2022. a
Tuel, A., Steinfeld, D., Ali, S. M., Sprenger, M., and Martius, O.: Large-scale drivers of persistent extreme weather during early summer 2021 in Europe, Geophys. Res. Lett., 49, e2022GL099624, https://doi.org/10.1029/2022GL099624, 2022. a
van Montfort, M. A. and Witter, J. V.: The Generalized Pareto distribution applied to rainfall depths, Hydrolog. Sci. J., 31, 151–162, https://doi.org/10.1080/02626668609491037, 1986. a
Viessman, W., Lewis, G. L., Knapp, J. W., and Harbaugh, T. E.: Introduction to Hydrology, in: 5th Edn., Prentice Hall, New York, USA, ISBN 13:9789332555297, ISBN 10:933255529X, 2002. a
Weigl, E. and Winterrath, T.: Radargestützte Niederschlagsanalyse und -vorhersage (RADOLAN, RADVOR-OP), Promet, 35, 78–86, 2009. a
Wilhelm, J., Mohr, S., Punge, H. J., Mühr, B., Schmidberger, M., Daniell, J. E., Bedka, K. M., and Kunz, M.: Severe thunderstorms with large hail across Germany in June 2019, Weather, 76, 228–237, https://doi.org/10.1002/wea.3886, 2021. a, b
Wilks, D. S.: Statistical methods in the atmospheric sciences: An introduction, in: 2nd Edn., Academic Press, San Diego, California, USA, ISBN 13:9780127519654, ISBN 10:0127519653, 2006. a
Winterrath, T., Brendel, C., Hafer, M., Junghänel, T., Klameth, A., Lengfeld, K., Walawender, E., Weigl, E., and Becker, A.: RADKLIM Version 2017.002: Reprozessierte, mit Stationsdaten angeeichte Radarmessungen (RADOLAN), 5-Minuten-Niederschlagsraten (YW), https://doi.org/10.5676/DWD/RADKLIM_YW_V2017.002, 2018. a
WMO: WMO Updates Guidelines on multi-hazard impact-based forecast and warning services, Tech. rep., WMO-No. 1150, WMO – World Meteorological Organization, Geneva, Switzerland, https://library.wmo.int/index.php?lvl=notice_display&id=17257#.Y9vNNa2ZOHs (last access: 2 February 2023), 2020. a
Wupperverband: Statusbericht zum Hochwasserereignis vom 14. und 15. Juli 2021 im Wupperverbandsgebiet – Stand Untersuchungen: 08.09.2021, Wupperverband, Wuppertal, Germany, https://www.wupperverband.de/internet/mediendb.nsf/gfx/411FA3F1EBD426ABC1258813004D90D2/$file/20220321_Statusbericht_Hochwasser.pdf (last access: 9 May 2022), 2021. a
Wupperverband: Wupperverband für Wasser, Mensch und Umwelt, Wuppertal, Germany, https://www.wupperverband.de, last access: 2 February 2023. a
Ye, Y., Jiao, W., and Yan, H.: Managing relief inventories responding to natural disasters: Gaps between practice and literature, Prod. Oper. Manage., 29, 807–832, https://doi.org/10.1111/poms.13136, 2020. a
Zängl, G., Reinert, D., Rípodas, P., and Baldauf, M.: The ICON (ICOsahedral Non-hydrostatic) modelling framework of DWD and MPI-M: Description of the non-hydrostatic dynamical core, Q. J. Roy. Meteorol. Soc., 141, 563–579, https://doi.org/10.1002/qj.2378, 2015. a
Zsoter, E., Pappenberger, F., and Richardson, D.: Sensitivity of model climate to sampling configurations and the impact on the Extreme Forecast Index, Meteorol. Appl., 22, 236–247, https://doi.org/10.1002/met.1447, 2015. a
The GRADE approach, developed by the World Bank and supported by the Global Facility for Disaster Reduction and Recovery (GFDRR), is designed to provide governments and other key stakeholders involved in post-disaster damage assessment, relief, and recovery phases with initial rapid estimations of physical post-disaster damage within 2 weeks.
- Abstract
- Introduction
- Data and methods
- Event description and analysis
- Impacts and consequences
- Synopsis
- Discussion and conclusions
- Code and data availability
- Author contributions
- Competing interests
- Disclaimer
- Special issue statement
- Acknowledgements
- Financial support
- Review statement
- References
- Supplement