the Creative Commons Attribution 4.0 License.
the Creative Commons Attribution 4.0 License.
 | 09 Nov 2023
Prediction of natural dry-snow avalanche activity using physics-based snowpack simulations
Stephanie Mayer
Frank Techel
Jürg Schweizer
Alec van Herwijnen
Predicting the timing and size of natural snow avalanches is crucial for local and regional decision makers but remains one of the major challenges in avalanche forecasting. So far, forecasts are generally made by human experts interpreting a variety of data and drawing on their knowledge and experience. Using avalanche data from the Swiss Alps and one-dimensional physics-based snowpack simulations for virtual slopes, we developed a model predicting the probability of dry-snow avalanches occurring in the region surrounding automated weather stations based on the output of a recently developed instability model. This new avalanche day predictor was compared with benchmark models related to the amount of new snow. Evaluation on an independent data set demonstrated the importance of snow stratigraphy for natural avalanche release, as the avalanche day predictor outperformed the benchmark model based on the 3 d sum of new snow height (F1 scores: 0.71 and 0.65, respectively). The averaged predictions of both models resulted in the best performance (F1 score: 0.75). In a second step, we derived functions describing the probability for certain avalanche size classes. Using the 24 h new snow height as proxy of avalanche failure depth yielded the best estimator of typical (median) observed avalanche size, while the depth of the deepest weak layer, detected using the instability model, provided the better indicator regarding the largest observed avalanche size. Validation of the avalanche size estimator on an independent data set of avalanche observations confirmed these findings. Furthermore, comparing the predictions of the avalanche day predictors and avalanche size estimators with a 21-year data set of re-analysed regional avalanche danger levels showed increasing probabilities for natural avalanches and increasing avalanche size with increasing danger level. We conclude that these models may be valuable tools to support forecasting the occurrence of natural dry-snow avalanches.
- Article
(4203 KB) - Full-text XML
- BibTeX
- EndNote


Forecasting natural snow avalanches is highly relevant in areas where avalanches may threaten people or infrastructure. Erroneous forecasts may cause costs as missed alarms may result in damage to people or infrastructure, and as false alarms may lead to economic loss due to unnecessary closures or evacuations. Therefore, accurately predicting the occurrence of natural avalanches is crucial, though it is still a major challenge in avalanche forecasting. Currently, forecasts are made by human experts drawing on their knowledge and experience. To forecast natural dry-snow avalanches, the (expected) amount of new snow is one of the main parameters. Accumulated sums of precipitation were found to be among the most important explanatory variables in several studies relating observed avalanche activity to meteorological drivers and observed snowpack parameters (e.g. Ancey et al., 2004; Kronholm et al., 2006; Hendrikx et al., 2014). However, new snow height alone is not sufficient for forecasting; instead, other contributing factors, in particular the presence of potential weak layers in the snowpack, have to be taken into account (e.g. Stoffel et al., 1998; Schirmer et al., 2009; Schweizer et al., 2009).
While physical snowpack models, such as CROCUS (Brun et al., 1989, 1992; Vionnet et al., 2012) or SNOWPACK (Lehning et al., 1999; Bartelt and Lehning, 2002; Lehning et al., 2002a, b), are commonly used to model new snow amounts for operational avalanche forecasting, they have so far only rarely been used to assess snowpack instability based on simulated snow stratigraphy in an operational context (Morin et al., 2020). Some recent studies included information on simulated snow stratigraphy as explanatory variables to predict natural avalanche activity with statistical or machine learning models (Viallon-Galinier et al., 2023; Reuter et al., 2022). Viallon-Galinier et al. (2023) found a random forest (RF) classifier that included mechanically based stability indices to outperform a classifier that only relied on meteorological and bulk snow parameters simulated with CROCUS. However, the precision of the improved classifier was low (3.4 %), which was attributed to the scarcity of avalanche events and the potential misclassification of non-avalanche days in the observations. The uncertainty inherent in avalanche observation data generally poses a major challenge when developing avalanche prediction models. Errors in visual observations arise from the difficulty of retrospectively determining the exact date of an avalanche release and from missed avalanche events due to limited visibility during periods of heavy snowfall, when the probability of natural avalanche events is particularly high. Avalanche activity data recorded by detection systems (e.g. Heck et al., 2019; Mayer et al., 2020) is a promising alternative but commonly covers only very limited areas (a few square kilometres), much smaller than typical forecasting regions (order of 100 km2). Moreover, due to the relatively new technologies of automated avalanche detection, avalanche catalogues only cover a few winter seasons (van Herwijnen et al., 2016). For instance, Reuter et al. (2022) trained and tested a model using automatically detected avalanches using only 31 non-avalanche days and 15 avalanche days.
An alternative approach to develop snow instability models is to use a target variable based on surrogate data that implicitly contain information on avalanche activity, e.g. avalanche danger levels or stability test results from field observations. According to the definitions of the European avalanche danger levels (EAWS, 2023), natural avalanches are expected at levels 4 (high) and 5 (very high) but unlikely at the two lowest levels (1 (low) and 2 (moderate)). In addition, avalanche size increases with increasing danger level (e.g. EAWS, 2022; Schweizer et al., 2020a; Techel et al., 2020). Pérez-Guillén et al. (2022) recently developed an RF classifier that uses meteorological parameters and snow cover properties simulated with SNOWPACK to predict danger levels. Another recent RF classifier was trained on stability tests related to human-triggered avalanches (Mayer et al., 2022). This model, which we refer to as the instability model herein, assesses the probability that a simulated SNOWPACK profile is potentially unstable considering human triggering. As the instability model was trained using stability tests related to human-triggered avalanches, its applicability to predict natural avalanches is not self-evident. However, its input features describing the potential weak layer (e.g. grain size) and the overlying slab (e.g. the ratio of the mean slab density and the mean slab grain size) are important variables not only with respect to human triggering but also regarding natural release. Comparing the classification of SNOWPACK profiles simulated using measurements from more than 100 automated weather stations (AWSs) in Switzerland with a large number of avalanche forecasts showed plausible results: the instability model yielded low probabilities of instability at the lower danger levels (i.e. level 1 (low) or 2 (moderate)) or in aspects and at elevations not indicated as critical in the forecast, whereas high probabilities were predicted for the upper danger levels (i.e. level 3 (considerable) or 4 (high)) (Techel et al., 2022). The instability model was tested in an operational setting by the national avalanche warning service in Switzerland during the 2021/2022 winter season, with promising results.
The objective of this study was to investigate whether the instability model developed by Mayer et al. (2022) applied to one-dimensional SNOWPACK simulations can be used to predict natural dry-snow avalanches at the regional scale. More specifically, we aim to derive a transformation of the current model output (probability of instability) to an index describing the probability of observing natural dry-snow avalanches in the surroundings of an AWS. For this purpose, we use avalanche observations recorded for avalanche forecasting in Switzerland during three winter seasons and SNOWPACK simulations from automated weather stations located at the elevations of potential avalanche starting zones. To reduce the uncertainty associated with visual avalanche observations, we apply a filter using observations from the wider surroundings. Furthermore, as a secondary objective, we explore whether we can estimate avalanche size based on one-dimensional SNOWPACK simulations. The avalanche day predictor and the avalanche size estimator are both validated using 21 years of re-analysed regional danger level data and an independent data set of avalanche observations (5 years) from the region of Davos in the eastern Swiss Alps. With these validation data, we also demonstrate the usefulness of predictions based on the instability model compared with the use of simple indicators of snow instability as the amount of new snow during the previous 24 or 72 h.
We used different data sets to train and validate the avalanche day predictor and the avalanche size estimator (Fig. 1). To develop the avalanche day predictor, we used avalanche observations (data set AV1; Sect. 2.1.1) combined with SNOWPACK simulations and predictions of the instability model described in Sect. 2.2. The avalanche size estimator was trained using only avalanche observations (data set AV2; Sect. 2.1.2). For validation of both models, we used a third independent data set of avalanche observations (data set AV3; Sect. 2.1.3), as well as a data set of quality-checked regional avalanche danger levels (DL; Sect. 2.3).
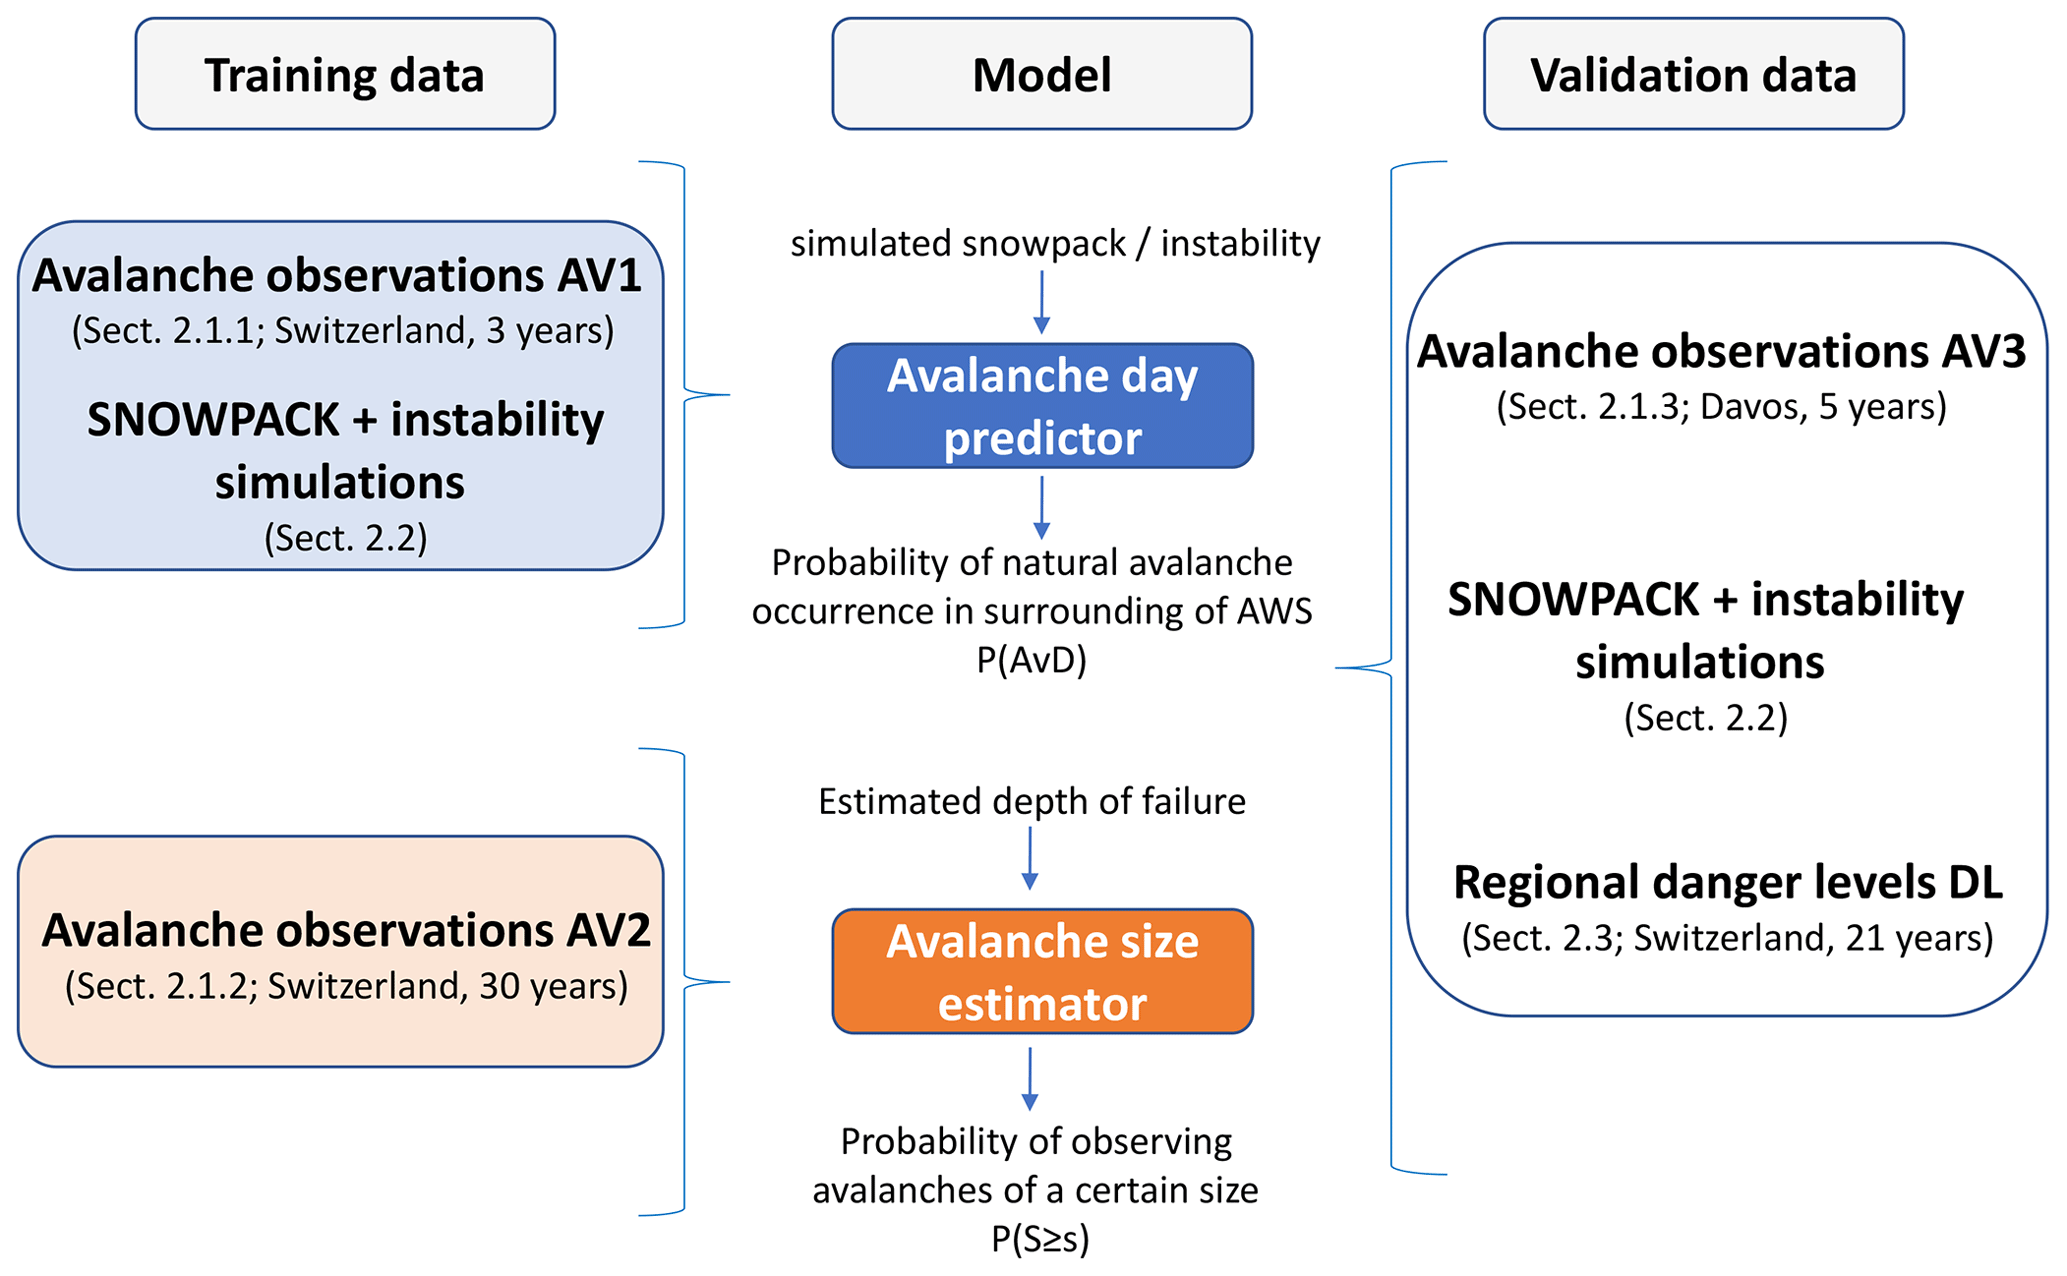
Figure 1Several data sets were used to develop and validate the functions describing the probability of natural avalanche occurrence and avalanche size. The data are described in the sections indicated.
2.1 Avalanche data
2.1.1 Swiss Alps, observed avalanches (data set AV1, 2019/2020 to 2021/2022, 3 years)
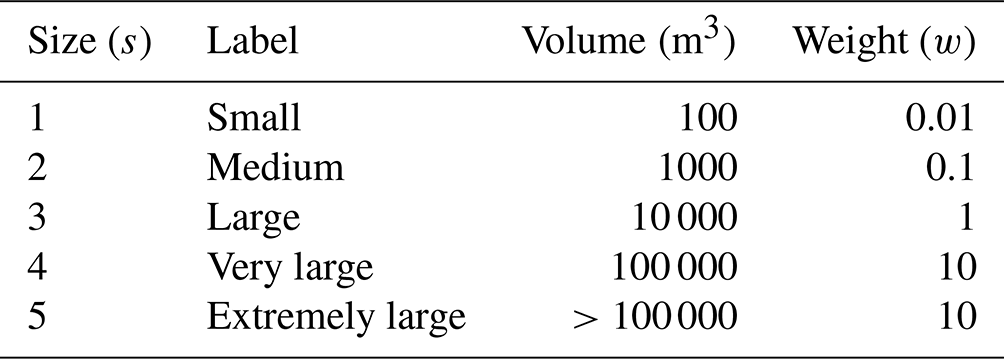
To develop the avalanche day predictor and test the avalanche size estimator, we used avalanche observations collected for the purpose of avalanche forecasting in Switzerland. During the winter season, generally from early December until late April, about 80 observers report avalanches in their region on a daily basis. These observations are highly relevant for the day-to-day verification of the avalanche forecast, particularly at the higher danger levels. Reported avalanche properties include the approximate location and the date of the avalanche release, the elevation and the slope aspect of the release area, the release type (i.e. natural or human-triggered), whether it was a dry- or a wet-snow avalanche (SLF, 2020), and a size estimate according to the European avalanche size classification ranging from 1 (small) to 5 (extremely large) (EAWS, 2021, see Table 1). In many cases, the release date and time, and further parameters, are estimated, as the actual avalanche release was not observed and access to the starting zone of an avalanche is generally not possible. Other avalanche characteristics, such as the type (i.e. slab or loose snow avalanche), the length and width or the failure depth, are also reported sometimes.
Table 1Avalanche size classification (according to SLF, 2020; EAWS, 2021) and the corresponding weight, w, used to calculate the avalanche activity index (AAI).
For this study, we only considered natural dry-snow avalanches that were recorded between 1 December and 30 April in the three winter seasons 2019/2020, 2020/2021 and 2021/2022 in the Swiss Alps. In total, 12 940 avalanches were reported. Even though the operational avalanche database also contains avalanche observations prior to 2019, the recording standards were different and did not allow us to unambiguously identify natural dry-snow avalanches.
2.1.2 Swiss Alps, observed avalanches (data set AV2, 1992/1993 to 2021/2022, 30 years)
The data set described in Sect. 2.1.1 only rarely contained an estimate of avalanche failure depth, which is equal to slab thickness. To derive a relationship between the failure depth of avalanches and avalanche size, we extracted all dry-snow avalanches that contained an estimation of avalanche size and the (mean estimated) failure depth from the operational database. Between November 1992 and June 2022 (30 years), this resulted in 5912 dry-snow avalanches.
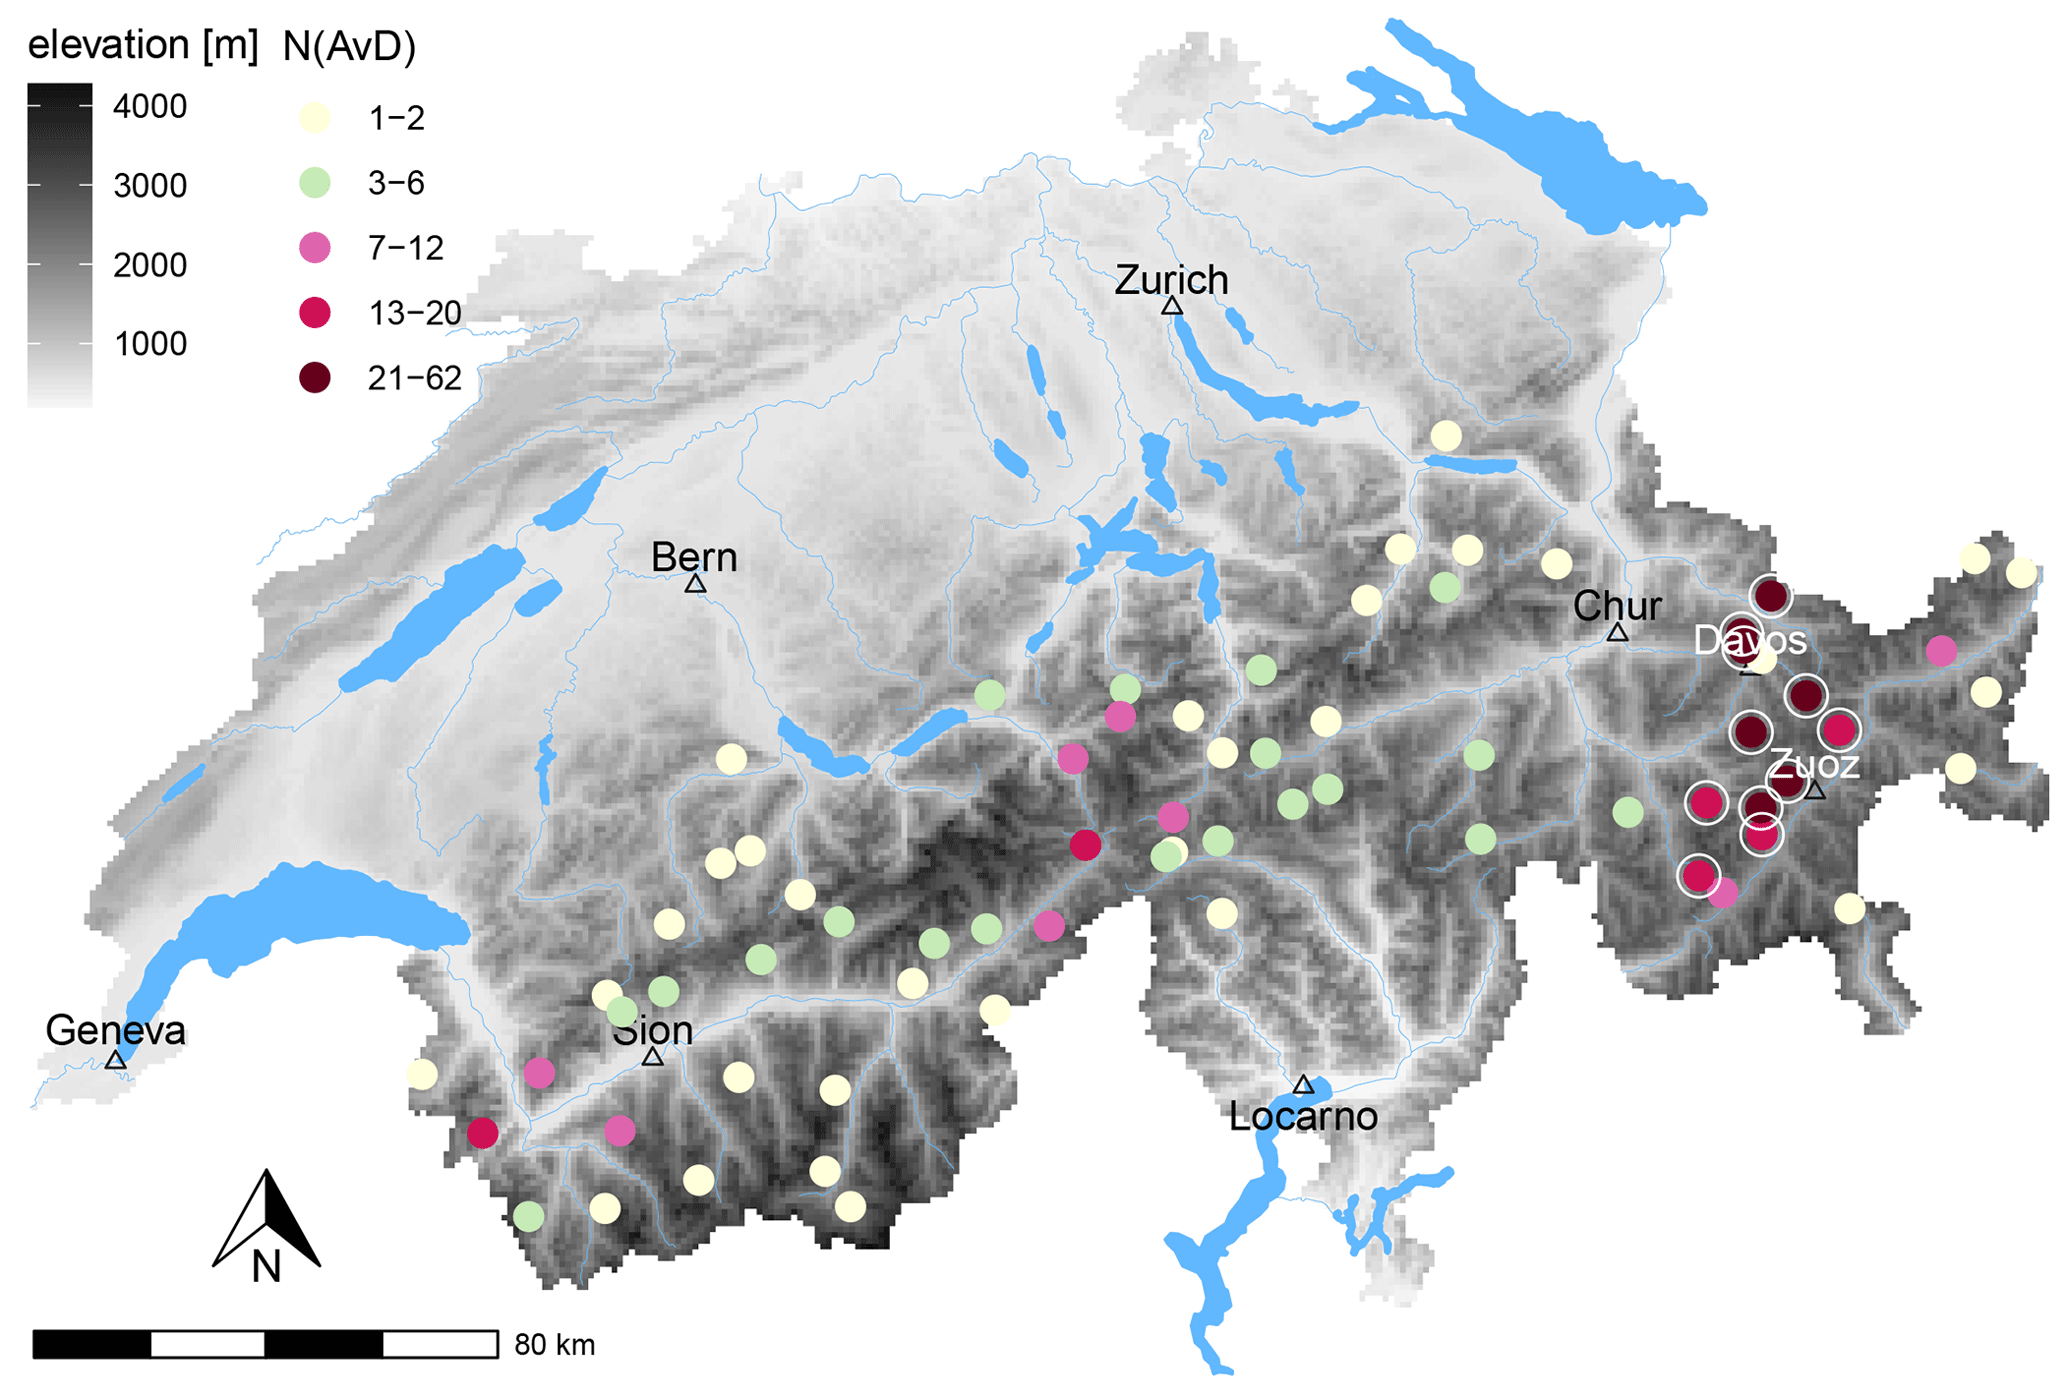
Figure 2Map of Switzerland showing the location of the automated weather stations (dots). The colouring indicates the number of avalanche days (AvDs) per station, summed up over all aspects and over the three winter seasons 2019/2020 to 2021/2022. Stations in the Davos–Zuoz area, which had N≥13 AvDs per station, were combined in a subset “Davos–Zuoz” (marked with white circles), and all other stations as “elsewhere”. For illustration purposes, the major rivers and lakes are shown in blue and the elevation in grey (digital elevation model – source: Federal Office of Topography swisstopo).
2.1.3 Davos (eastern Swiss Alps), observed avalanches (data set AV3, 2014/2015 to 2018/2019, 5 years)
For validation, we used avalanches mapped in the region of Davos in the eastern Swiss Alps (e.g. described by Hafner et al., 2021). These data were used in several studies (e.g. Schweizer et al., 2020a; Mayer et al., 2022) and are publicly available (Schweizer et al., 2020b). From an updated version of this data set, we extracted all natural dry-snow avalanches that released in the five winters 2014/2015 to 2018/2019, which resulted in 1995 avalanches.
2.2 Snowpack and instability simulations
We applied the operational setup of the SNOWPACK model (Lehning et al., 2002b) used for avalanche forecasting in Switzerland. The simulations were driven with meteorological data from AWSs located in flat terrain at the elevation of potential avalanche starting zones throughout the Swiss Alps (Lehning et al., 1999; Morin et al., 2020). An overview of the spatial distribution of these AWSs is provided in Fig. 2. The measured meteorological data were pre-processed with MeteoIO (Bavay and Egger, 2014) to filter out potential measurement errors and fill measurement gaps using temporal interpolation or spatial interpolation with neighbouring stations. To reduce errors related to the meteorological input data in the validation (Sect. 4.4.1) of the models developed in this study, we also produced SNOWPACK simulations using a quality-checked data set of meteorological measurements from the AWS Weissfluhjoch (2536 m a.s.l.) (WSL Institute for Snow and Avalanche Research SLF, 2015).
In addition to the simulations on flat terrain, forced with measured snow depths, simulations were also performed for four “virtual” slope orientations (north, east, south and west) with a slope angle of 38∘, including snow redistribution from windward to leeward slopes as described in Lehning et al. (2000) and Lehning and Fierz (2008). Model output was available for up to 124 AWSs. We used SNOWPACK simulations for the four “virtual” slope orientations from the 21 winters 2001/2002 to 2021/2022.
To assess snow instability from simulated snow stratigraphy, we applied the instability model to the simulated snow profile at 12:00 LT on the day of interest, as described in Techel et al. (2022). The instability model requires six input features describing the simulated snow layer of interest and the overlying slab. The output probability Punstable that a snow layer is unstable is determined by the fraction of trees in the ensemble of 400 classification trees that classify the layer as potentially unstable. Applying the instability model to every snow layer of a given snow profile allows computing the following properties (see also Fig. 3):
-
Critical weak layer properties: the critical weak layer relevant for natural avalanche release is defined as the layer with the highest probability of instability, i.e. the layer where Punstable=max(Punstable). In case of ties, we selected the layer deepest in the snowpack. For each snow profile, we then extracted the following three layer properties: max(Punstable), which we refer to as Pcrit; the depth z below the snow surface in centimetres (zcrit); and the grain type (gtcrit). We grouped grain types into three classes considering the primary grain type: (i) persistent grain types (pg), including depth hoar, buried surface hoar, facets and rounding facets; (ii) precipitation particles (pp), including decomposing and fragmented precipitation particles; and (iii) other grain types (other), including rounded grain types, melt forms, melt-freeze crusts and ice layers. (See also Fierz et al., 2009 for the grain type classification.)
-
Deepest weak layer properties: in addition to the critical weak layer, we searched for potential weak layers deeper in the snowpack. We selected the deepest weak layer as the deepest layer fulfilling Punstable≥0.77 – the best-splitting threshold suggested by Mayer et al. (2022) to distinguish between stable and potentially unstable layers. If no such layer existed, the deepest weak layer was the critical weak layer. For each profile, we then extracted the probability of instability for the deepest weak layer Pdeep, the depth below the snow surface (zdeep) and the grain type (gtdeep).
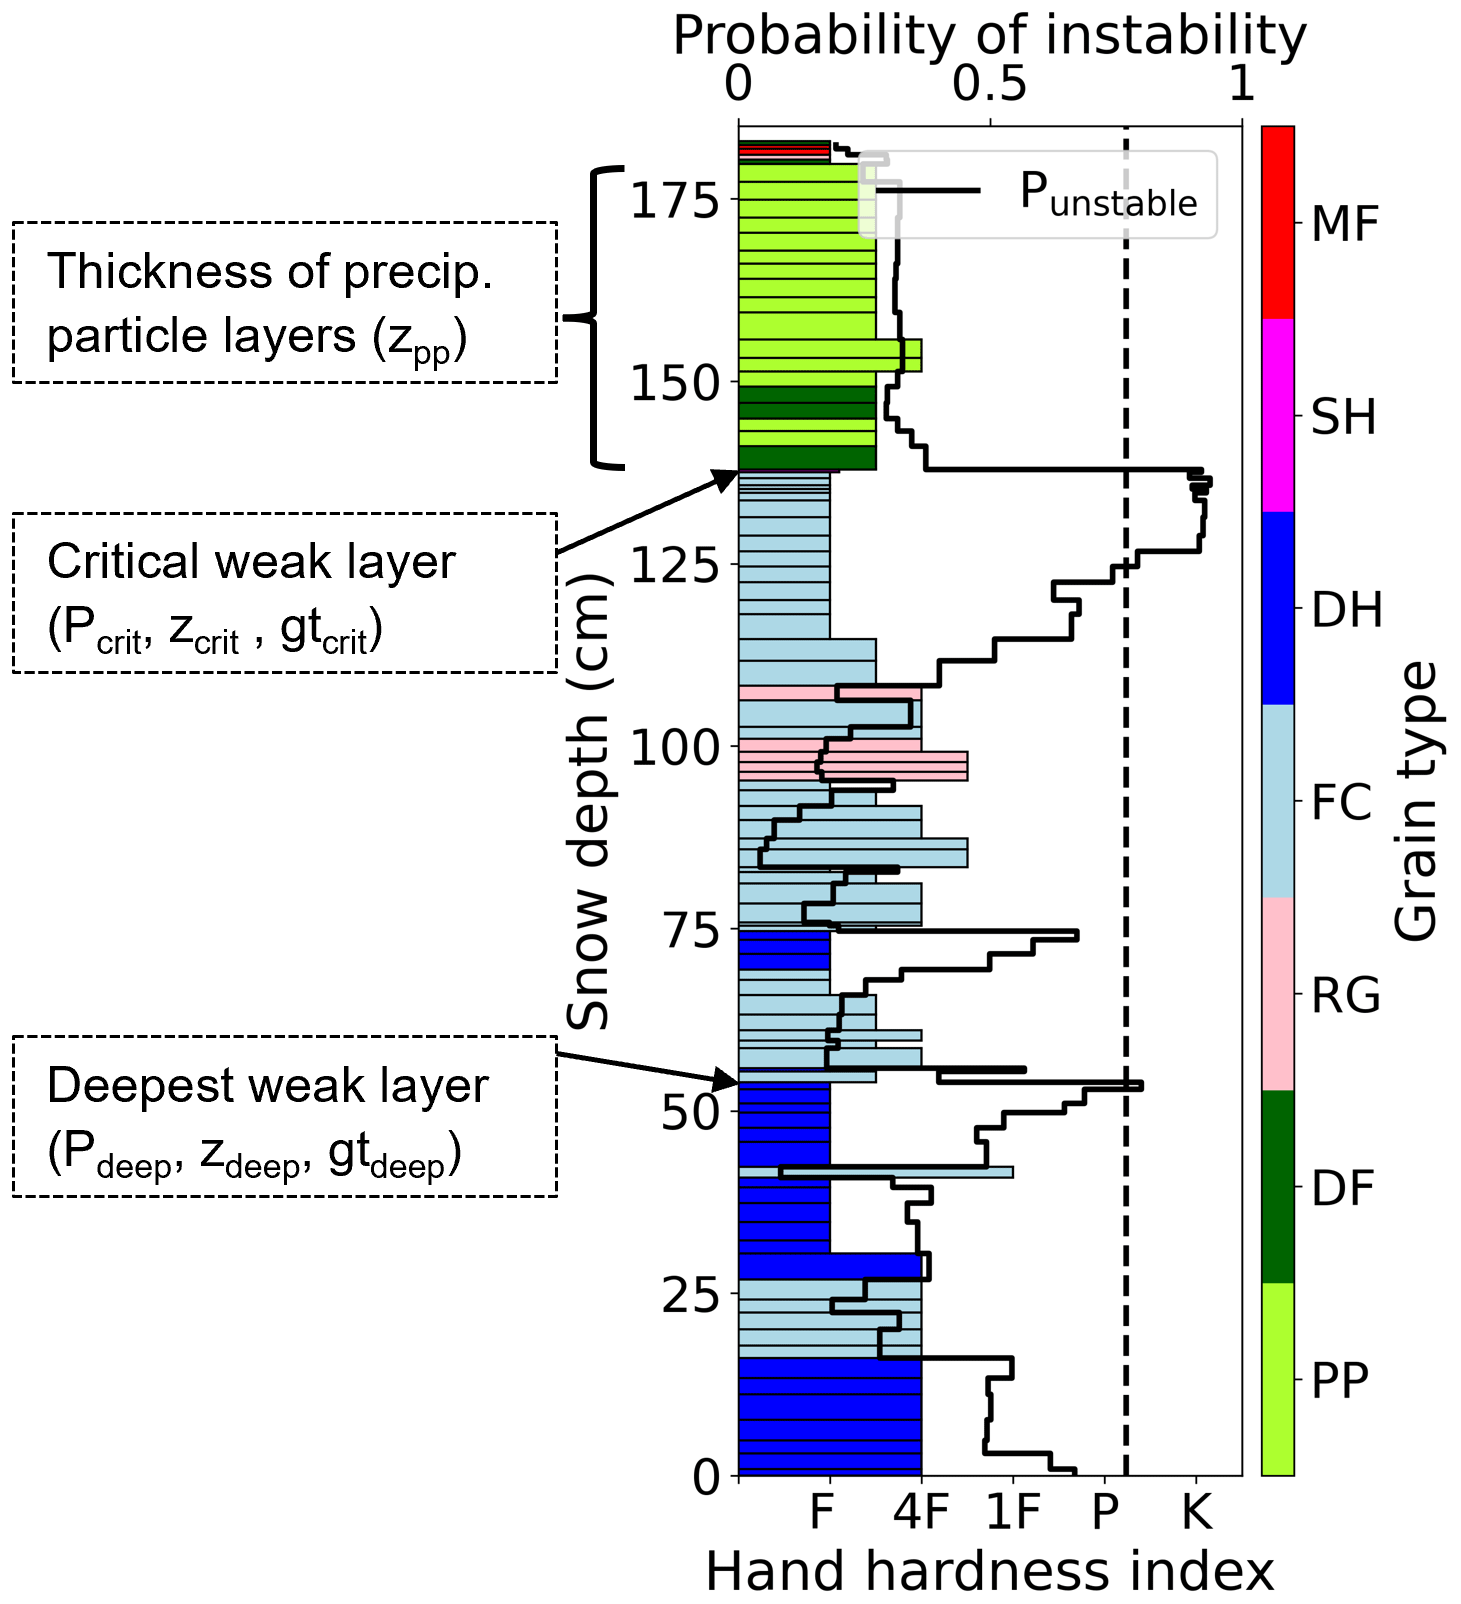
Figure 3Example of a simulated snow profile showing the hand hardness profile, the grain type of the simulated layers (colouring of the layers) and the probability of instability Punstable (black line). The critical weak layer is defined as the layer where Punstable is maximal. Hand hardness (F: fist, 4F: four fingers, 1F: one finger, P: pencil and K: knife) and grain type (PP: precipitation particles, DF: decomposing and fragmented precipitation particles, RG: rounded grains, FC: faceted crystals, DH: depth hoar, SH: surface hoar and MF: melt forms) were coded after Fierz et al. (2009). The dashed vertical line displays the threshold of Punstable=0.77 discriminating between stable and potentially unstable layers derived by Mayer et al. (2022). The depth of precipitation particles and the deepest weak layer, i.e. the deepest layer exceeding the instability threshold, are indicated.
The rate of snowfall and the amount of new snow are known to be important indicators of natural dry-snow avalanche activity, also called direct-action avalanches (e.g. Conway and Wilbour, 1999), and also for the potential size of avalanches (e.g. Schweizer et al., 2009). Therefore, we also calculated:
-
Height of new snow in 24 h (HN1d).
-
Height of the 3 d sum of new snow (HN3d), calculated as the sum of three consecutive HN1d values .
-
Thickness of precipitation particle layers: the thickness of layers in the simulated profile, where the primary grain type was either new snow or partially decomposing and fragmented precipitation particles (zpp).
Conventionally, the height of new snow is measured in the flat field. Consistent with this definition, the new snow amounts provided by SNOWPACK are therefore for the flat field as well, regardless of whether it is a simulation in the flat or on a virtual slope. However, we also considered the thickness of precipitation particle layers, zpp, which should capture the amount of recently fallen snow including snow transport by wind, since we used the SNOWPACK version including snow redistribution by wind. All other parameters depend on aspect since they were selected from the virtual slope simulations where, for instance, energy input and snow accumulation vary depending on aspect.
Lastly, we also extracted the minimum of the natural stability index sn38, which is implemented in SNOWPACK. Sn38 describes for each snow layer the ratio of the shear strength of the layer to the shear stress exerted by the overlying slab (Jamieson and Johnston, 1998; Lehning et al., 2004).
2.3 Re-analysed regional avalanche danger level (data set DL)
To validate model predictions, we used a data set of re-analysed regional danger levels. This data set is a subset of the forecast regional avalanche danger levels published by the national avalanche warning service in Switzerland. The data set only contains cases for which the forecast danger level was either validated or corrected (about 5 % of the cases) after considering multiple pieces of evidence, as described by Pérez-Guillén et al. (2022). An updated version of this data set is publicly available (Techel, 2023). The data set consists of 36 582 re-analysed regional danger levels for specified warning regions, the smallest spatial units used in the Swiss avalanche forecast, for the forecast seasons from winter 2001/2002 to 2021/2022. In addition, the critical aspects and elevation range where the danger level applies, and the validity date of the forecast, are indicated. The danger level is assigned according to the five-level European Avalanche Danger Scale (EAWS, 2022). The frequency of the danger levels in this data set is: 1 (low) 35 %, 2 (moderate) 29 %, 3 (considerable) 29 %, 4 (high) 7 % and 5 (very high) 0.3 %. In this re-analysed subset, the proportions for 4 (high) and 5 (very high) are slightly larger than in the original forecasts.
In a first step, we developed an avalanche day predictor (Sect. 3.1) addressing the following question: For a given Pcrit value, what is the probability of natural avalanches occurring in a specific aspect and elevation band in the surroundings of an AWS? We compared this approach with benchmark models based on conventional indicators related to the amount of new snow. Second, we built an avalanche size estimator (Sect. 3.2) with the objective to extract information on the expected typical or largest avalanche size based on (simulated) weak layer depth or the height of new snow.
3.1 Avalanche day predictor
3.1.1 Definition of avalanche days and non-avalanche days
To differentiate days with natural dry-snow avalanche activity (avalanche days, AvDs) from days without any avalanche activity (non-avalanche days, nAvDs), we relied on data set AV1 (Sect. 2.1.1). The two main challenges in using these data relate to reliably labelling days with no avalanches and the correct estimation of the release date. For instance, even in areas that are regularly observed, the absence of reported avalanches may be due to poor visibility (i.e. continuous snowfall) rather than a true absence of recent avalanches, making it challenging to accurately determine situations without natural avalanches. Moreover, the accuracy of the release date depends on observation frequency in an area, on visibility conditions and the overall observation quality. To enhance the reliability of the avalanche day labels, we therefore applied the approach developed by Hendrick et al. (2023) to extract AvDs and nAvDs from the avalanche observations, with a specific focus on dry-snow avalanches.
We define the aspect-specific avalanche day index (Y) in the surroundings of an automated weather station and within an elevation band ±250 m of the station elevation for four slope orientations (aspect: north, east, south and west) as
with NaN not a number. The avalanche activity index AAI refers to the weighted sum of the reported avalanches within the respective elevation band, aspect and area (Schweizer et al., 2003). The size-dependent weights w are defined as in Table 1. The gap check requirement is AAI (5000 km2)>AAI (1000 km2) and AAI (1000 km2)>AAI (250 km2), ensuring avalanche activity increases for larger areas and is not only local. As described in Hendrick et al. (2023), considering observation areas of increasing size allows to cross-check the absence or occurrence of avalanches.
This definition separates days with widespread avalanche activity (AvD; Y=1) of a certain magnitude from days with absolutely no avalanches (nAvD; Y=0), and excludes days with either only local avalanche activity (close to the station) or widespread activity but without any avalanches in the vicinity of the station. Regarding model development, it should be noted that we thus trained and tested our model using rather extreme cases, which are, however, comparably reliable in terms of the quality of the label.
By applying Eq. (1) to the training data set AV1, we obtained aspect-specific time series containing AvDs and nAvDs for three winter seasons for each station. As it was still difficult to distinguish between cases classified as nAvD, which were solely due to missing observations rather than actual nAvD, we only retained the winter seasons with at least one AvD for a given station–aspect combination. In the end, the data set contained about 10 times more nAvDs (N=8511) than AvDs (N=872). Overall, AvDs had a median of two avalanches (interquartile range IQR: 2–7) in the aspect and elevation of the snowpack simulation within an area of 250 km2 surrounding the station. Two or more avalanches were recorded on 559 of the 872 AvDs. The median AAI on AvD was 1 (IQR 0.3–3.6), the typical avalanche (median avalanche size) was of size 2 (IQR 2–3) and the typical largest avalanche (median) was of size 3 (IQR 2–3).
3.1.2 Model development and evaluation
To develop the avalanche day model, we tested a set of predictor variables, including HN1d, HN3d, zpp, Pcrit and sn38, in two different modelling approaches, namely a threshold-based binary classification model and continuous regression functions describing the probability for an AvD.
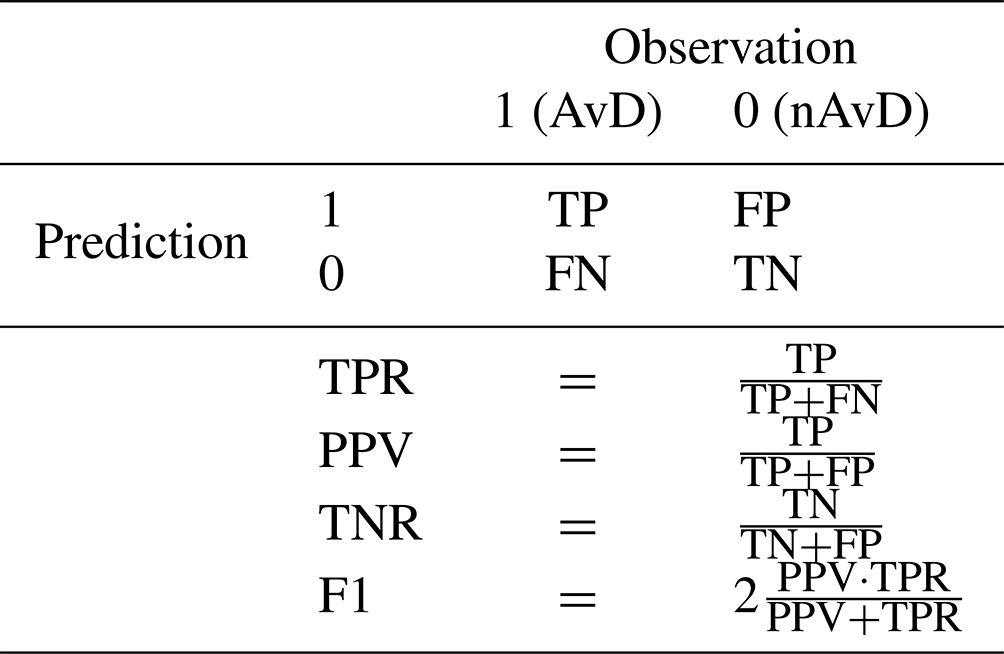
In a first step, we investigated the performance of each predictor variable in discriminating between AvDs and nAvDs from the training data set (i.e. data set AV1 and the corresponding SNOWPACK simulations) using a simple threshold-based binary classification model. To find the best threshold, “thr”, for each classification model, we optimized the F1 score, defined as the harmonic mean of the precision, also termed positive predictive value (PPV), and the true-positive rate (TPR; see Table 2 for the definitions of these performance measures). This approach favours a balanced trade-off between the TPR, which is the probability of detecting an AvD, and the PPV, the rate of correct positive predictions.
Table 2Confusion matrix defining the possible combinations of observed and predicted labels (upper part) and definition of resulting performance measures true-positive rate (TPR), positive predictive value (PPV), true-negative rate (TNR) and F1 score (F1; lower part).
To examine the robustness of the threshold values and the resulting classification performance, we split the training data into the following subsets, each of which was tested with the complementary data not used for deriving “thr”:
-
Hydrological year: each hydrological year had its own pattern of snowpack evolution and avalanche hazard characteristics.
-
Grain type characteristics of the critical weak layer: we distinguished between layers composed of persistent grain types and precipitation particles. There were only a few AvD cases for other grain types; therefore, we did not train on this subset.
-
Region: the AvDs are not equally distributed over the Swiss Alps (see Fig. 2). Ten of the 11 stations with the most AvDs are all located in the eastern Swiss Alps, in an area we refer to as Davos–Zuoz. This region is characterized by an inner-alpine climate. To ascertain that the threshold was independent of this spatial bias in the data, we compared a subset Davos–Zuoz (white-circled points in Fig. 2) to elsewhere.
In a second step, we derived avalanche day predictors P(AvD) describing the probability for an AvD as continuous functions of a single input feature, i.e.
To estimate the relationship between the binary avalanche index data and the predictor variables, we applied regression analysis with four-parameter sigmoidal (S-shaped) functions (see Table A1). The functions were fit on the complete training data set using non-linear least squares with parameter constraints to ensure that modelled probabilities did not exceed 1. For each input feature, we defined the best-fitting function by minimizing the Brier score (BS; Wilks, 2011, p. 331), which is the mean squared prediction error:
where N is the number of the prediction–observation samples denoted with index i, pi the predicted probability – here f(xi) – and Yi the observed outcome (1 for AvD and 0 for nAvD). A perfect model would thus result in a Brier score equal to zero. As the data set AV1 contained about 10 times more nAvDs than AvDs, a model with a strong tendency to predict nAvDs could result in low Brier scores simply because the evaluation on the minority subset of AvDs has lower weight compared with the subset of nAvDs. To indicate how well the minority class of AvDs was captured by the model, we therefore additionally calculated the Brier score on the subset of AvDs only (BS+).
3.2 Avalanche size estimator
To estimate avalanche size for a given failure layer depth, we used data set AV2 (Sect. 2.1.2) to relate avalanche size to observed failure depth (zobs) using logistic regression functions of the form
where P(S≥s) is the probability that avalanches greater than or equal to size s (; Table 1) were observed given the observed failure depth (zobs).
The P(S≥s) functions were derived using observed data only, as SNOWPACK simulations were not available for the locations of the avalanche release areas. To analyse the performance of the size indicators combined with the depth parameters extracted from SNOWPACK, we estimated probabilities for different avalanche sizes on the AvDs from the training data set (Sect. 3.1.1) using the simulated depth parameters z (HN1d, HN3d, zpp, zcrit and zdeep, described in Sect. 2.2) as proxies for the potential failure depth. The resulting estimated probabilities for different avalanche sizes () were then compared with the observed median and maximum avalanche sizes on the respective AvD using the Brier score (Eq. 3) with the probabilities and the observed outcome Yi equal to 1 if an avalanche of size ≥s was observed and 0 otherwise. To evaluate how well the avalanche size estimator captures rare events, we also calculated the Brier score BS+ on the subset of positive observed outcomes, i.e. the data points that had an observed avalanche of size ≥ s.
3.3 Validation and application
To evaluate the performance of the avalanche day predictors (P(AvD)) and the avalanche size estimators (P(S≥s)), we used two independent data sets:
-
We used the observations of natural dry-snow avalanches in the region of Davos (data set AV3; Sect. 2.1.3) to determine AvDs and nAvDs as described in Sect. 3.1.1. We labelled a day as a nAvD if there were no dry-snow avalanches in the region of Davos and the two surrounding regions (1000 and 5000 km2), which is in line with the definition described in Sect. 3.1.1. A day was labelled as an aspect-specific AvD if the AAI in the region of Davos was larger than 0.01 for the respective aspect and within an elevation band of ±250 m around the AWS Weissfluhjoch (2536 m a.s.l.) and if at least one natural dry-snow avalanche was observed within each of the two surrounding regions (1000 and 5000 km2), regardless of aspect and elevation. The definition of an AvD was thus slightly adapted compared with Eq. (1) due to the lack of consistent information on aspect and elevation of the observed avalanches within the two larger surrounding regions. Thus, AvD labels in the validation data set are somewhat less reliable compared with the original definition. The resulting data set consisted of 273 avalanche days and 984 non-avalanche days during the five winter seasons 2014/2015 to 2018/2019. For each of these 1257 d, we calculated aspect-specific values of P(AvD) and P(S≥s) using SNOWPACK virtual slope simulations driven with quality-checked data from the AWS Weissfluhjoch (see Sect. 2.2). With the adapted definition of AvD (no consideration of aspect for the two surrounding areas not covered by the avalanche observations in the region of Davos), we obtained some more AvDs than in the other data sets. This follows from the fact that an east-facing avalanche in the region of Davos will count towards an AvD if there are other avalanches in the surrounding areas with unknown aspect.
-
We compared the re-analysed forecast regional avalanche danger levels (DL, Sect. 2.3) to values of P(AvD) and P(S≥s) computed for the stations and virtual slopes that matched the elevation and the critical aspects of the respective danger level data point. As for the other analyses, we used the snowpack simulations at 12:00 LT on the day of interest. For the winter seasons 2019–2020 to 2021–2022, we removed all data points used to develop the P(AvD)-model and which had a simulated snow depth < 30 cm.
4.1 Avalanche days vs. non-avalanche days
Avalanche days were generally associated with new snow (HN1d=25 cm, HN3d=59 cm, p<0.001; see row = All in Table 3). In contrast, nAvDs were typically characterized by no new snow (HN1d=0, HN3d=0, median values and p<0.001). Consequently, the median thickness of the layers including precipitation particles varied in a similar way (AvD: zpp=73 cm; nAvD: zpp=0 cm). The simulated critical weak layer was at a median depth of 75 cm on AvDs and 22 cm on nAvDs. The simulated critical weak layer had a significantly higher probability of instability on AvDs compared to nAvDs (Pcrit=0.92 vs. Pcrit=0.33, respectively; p≤0.001) and it was more often composed of persistent grain types (77 % vs. 47 % of cases, respectively; p≤0.001). As indicated in Table 3, these values varied between subsets. For instance, the median depth of the most critical weak layer was 44 cm on AvDs in 2020 and 91 cm in 2021, while on nAvDs the values were 4 and 65 cm, respectively. Similarly, on AvDs, the depth of the weak layer was 88 cm when the critical weak layer consisted of persistent grains (pg) compared with 47 cm for precipitation particles (pp).
Table 3Overview of avalanche data and properties of the simulated most critical weak layer as selected by the instability model and thickness of the overlying slab consisting of precipitation particles (recent slab). Subsets are shown by hydrological year (2020, 2021 and 2022), by region (Davos–Zuoz area and elsewhere; see also Fig. 2) and as function of the grain type of the critical weak layer (pg: persistent grain types; pp: precipitation particles). The seven numbered subsets were used for cross-validation. Median values are shown for HN1d, HN3d, Pcrit, zcrit and zpp, and the proportion of critical weak layers consisting of persistent grain types (gtcrit=pg).
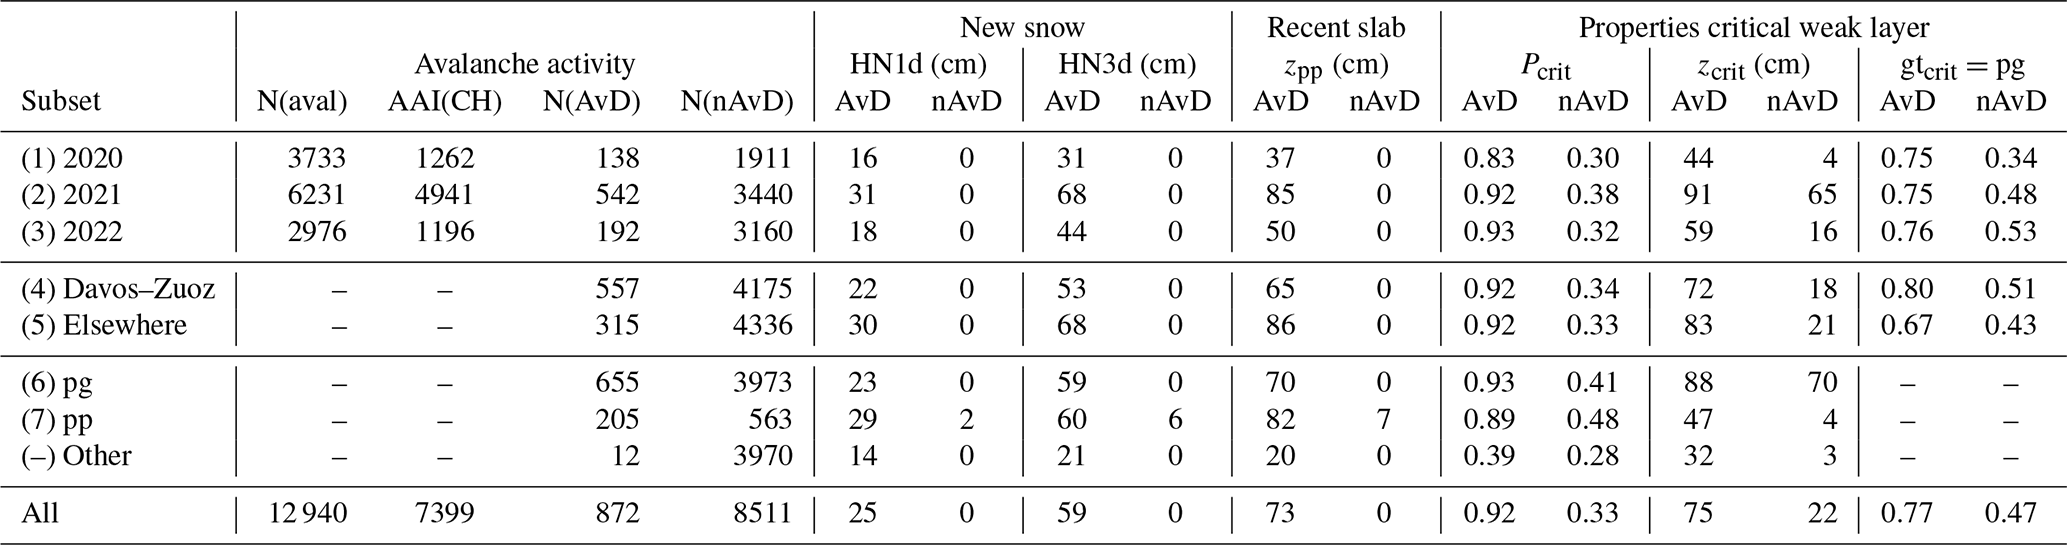
At least one potentially unstable layer was detected in 84 % of the AvDs, and in only 2 % of the nAvDs. Moreover, in 7 % of the profiles, there was at least one other potentially unstable layer below the critical weak layer. These cases were rare on nAvDs (1 % of the profiles), but quite frequent on AvDs (66 %). The median difference in the depth between the critical and the deepest potentially unstable layer (zdeep−zcrit) was 14 cm (IQR: 4–44 cm). On AvDs, these layers were 15 cm deeper (IQR: 5–49 cm) compared with only 4 cm (IQR: 2–26 cm) on nAvDs. If such a deeper weak layer existed, it primarily consisted of persistent grains (90 %).
4.2 Predicting avalanche days and non-avalanche days
All explored variables (HN1d, HN3d, zpp and Pcrit) showed highly significant differences between avalanche days and non-avalanche days as demonstrated in the previous section. In the following, we will first explore their potential for a binary classification of AvDs and nAvDs, and then derive continuous functions describing the probability for an AvD.
The optimal thresholds (“thr”) to distinguish between nAvD and AvD for the seven subsets varied when cross-validating the model. For instance, threshold values ranged from 9 to 17 cm for the 24 h amount of new snow HN1d (median 12 cm) or from 22 to 47 cm for zpp (median 32 cm) (Table A2). Applying these thresholds to the test sets, i.e. the data not used for training, showed that all four variables performed similarly well in correctly predicting nAvDs (; Fig. 4). In contrast, larger variations were observed in the TPR, i.e. the proportion of correctly predicted AvDs. TPR was highest for HN3d (TPR=0.81) and Pcrit (TPR=0.79). The precision, i.e. the proportion of predicted AvDs that also were observed as AvDs, was highest for the two new snow parameters (PPV(HN1d)=0.84, PPV(HN3d)=0.83). However, these two parameters also showed a greater variation in PPV between subsets compared with Pcrit, which had a more consistent performance though a slightly lower PPV of 0.80. Overall, in terms of a balanced performance maximizing the F1 score, both HN3d and Pcrit had similar values (median F1 score of 0.80 in cross-validation). All approaches by far outperformed the natural stability index sn38 (median cross-validated F1 score of 0.24). Due to the limited discriminatory power of sn38, this variable was not considered further in the subsequent development of continuous models.
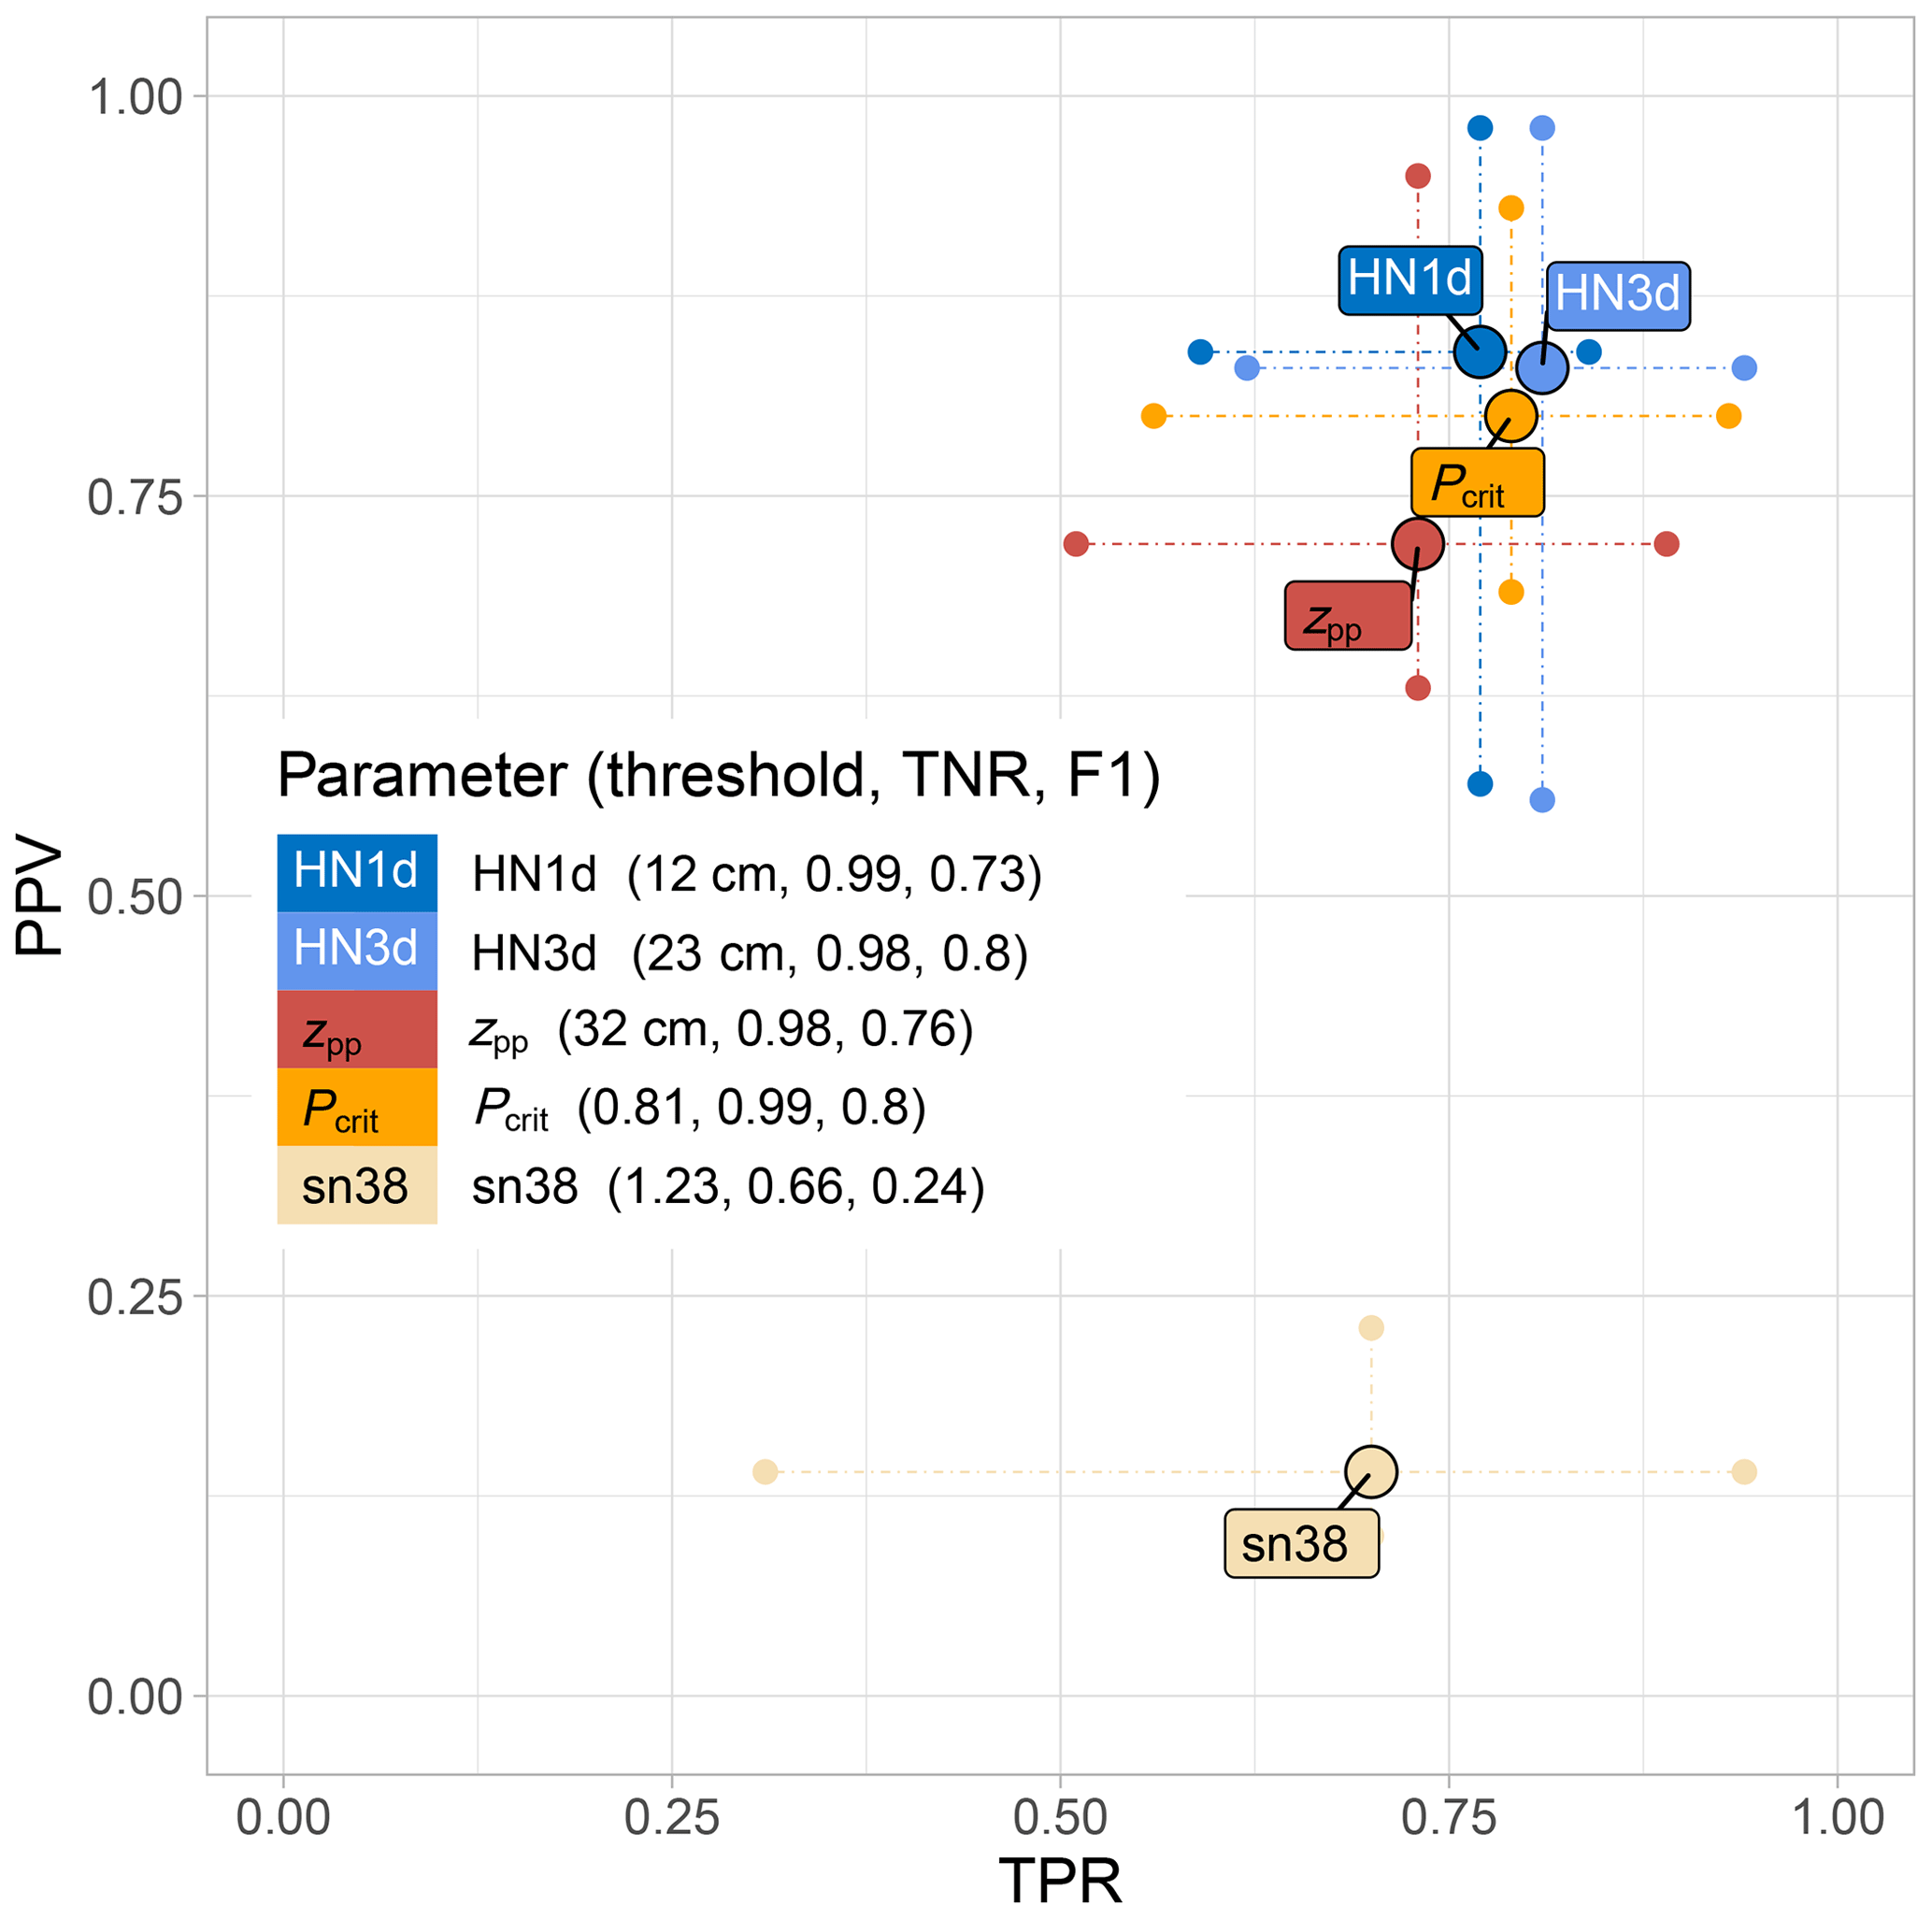
Figure 4Performance statistics for avalanche day predictors (binary classification). Shown are the cross-validated TPR and PPV values for the seven subsets numbered in Table 3. The whiskers mark the respective minimum and maximum values, and the larger circles display the median values of these performance measures on the seven subsets. In addition, for each parameter, the median threshold, TNR and F1 score are indicated.
Analysing differences between the subsets in more detail also provided interesting insights. For instance, the optimal balanced zpp threshold to differentiate AvD from nAvD was 40 cm when the critical weak layer consisted of precipitation particles (pp) compared with 22 cm for persistent grains (pg); it was 47 cm in the region “elsewhere” and 22 cm in the inner-alpine region of Davos–Zuoz, where persistent weak layers are more frequently observed (e.g. Schweizer et al., 2021, see Table 3). Similar results were also obtained for the two new snow variables, thus confirming what is known from a process-based point of view: when persistent weak layers are present, less new snow is needed to trigger natural avalanches (Stoffel et al., 1998; Schweizer et al., 2009).
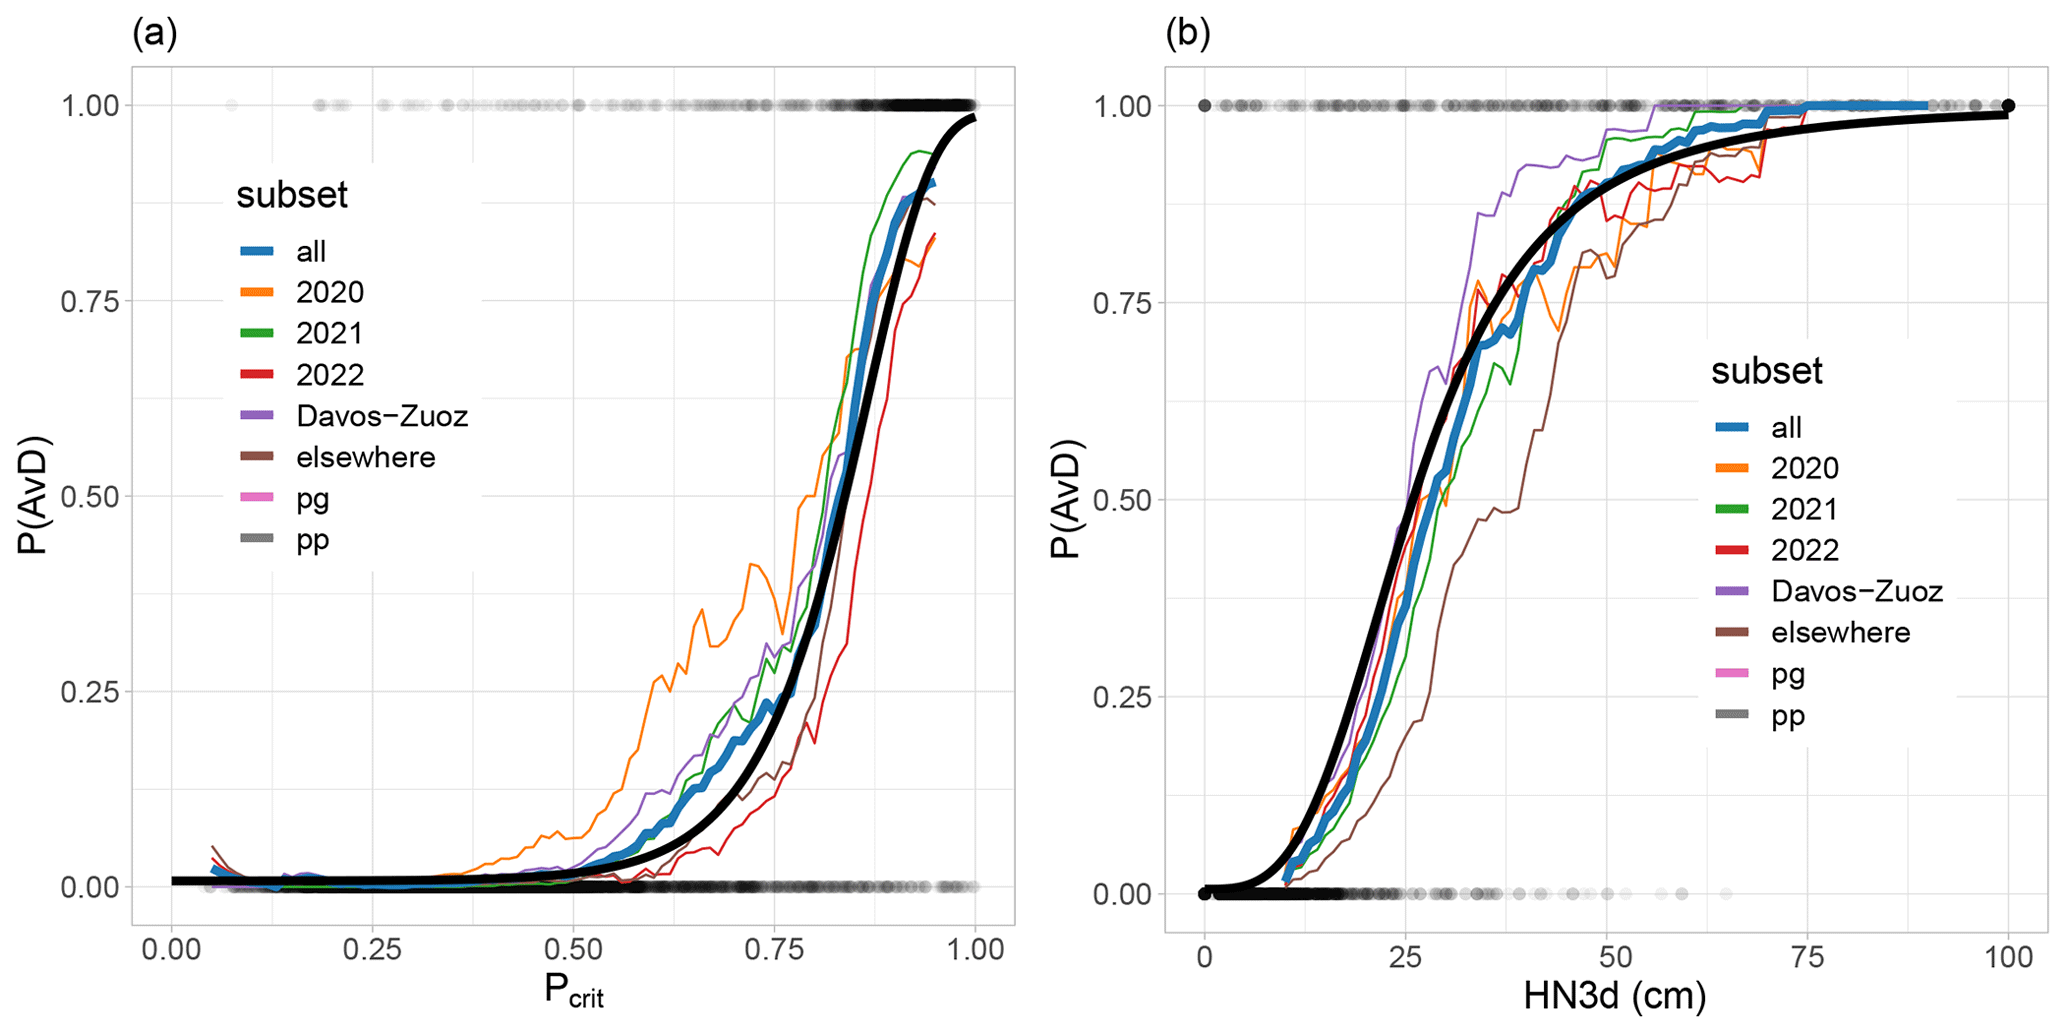
Figure 5Probability that a day is an avalanche day (P(AvD)) as a function of (a) Pcrit and (b) HN3d for the data subsets shown in Table 3. The subsets are binned with bin-size being 0.1 in (a) and 10 cm in (b). The best-fitting function describing all data is shown in black.
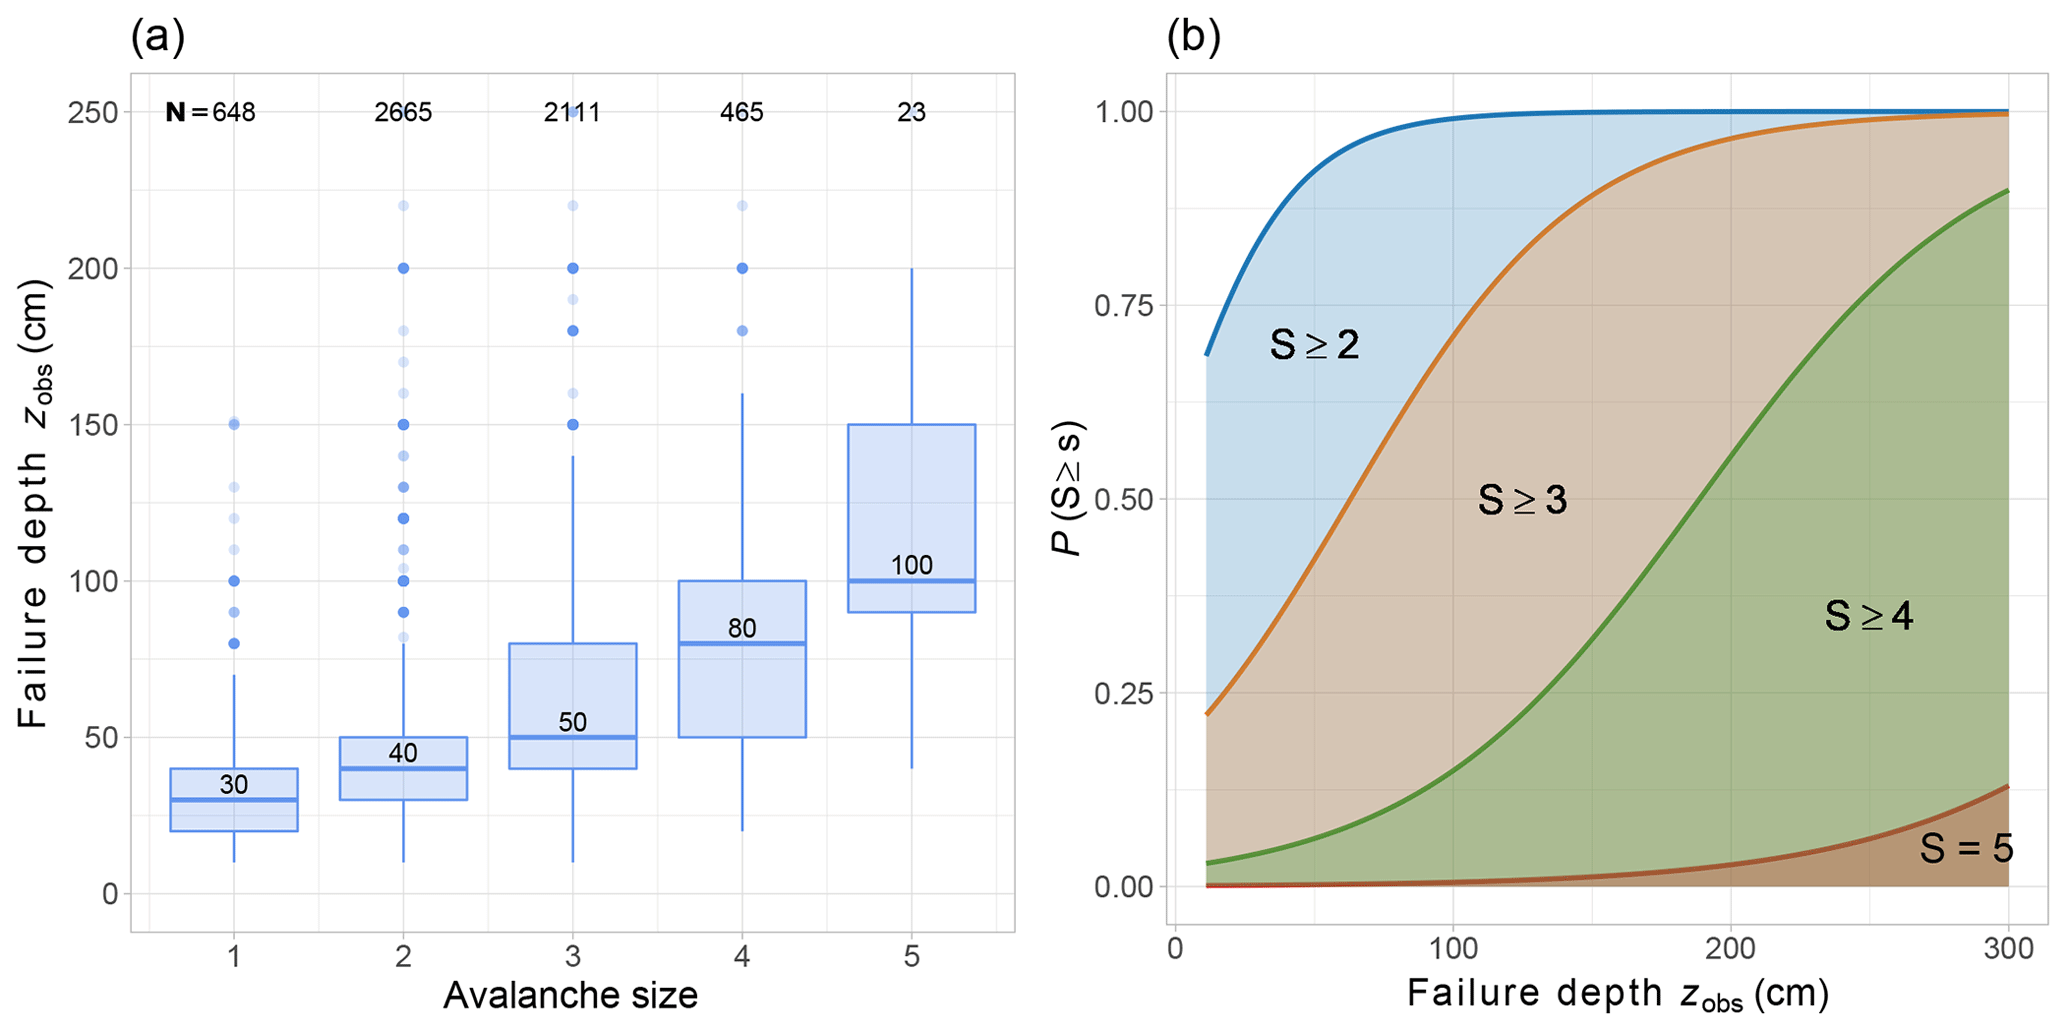
Figure 6Panel (a) shows distribution of mean estimated failure depth (zobs) for 5912 avalanches as a function of avalanche size. Panel (b) shows visualization of logistic regression functions describing the probability that the avalanche size S is larger than a certain size s (P(S≥s)) as a function of zobs. The coefficients for these functions are shown in Table A4.
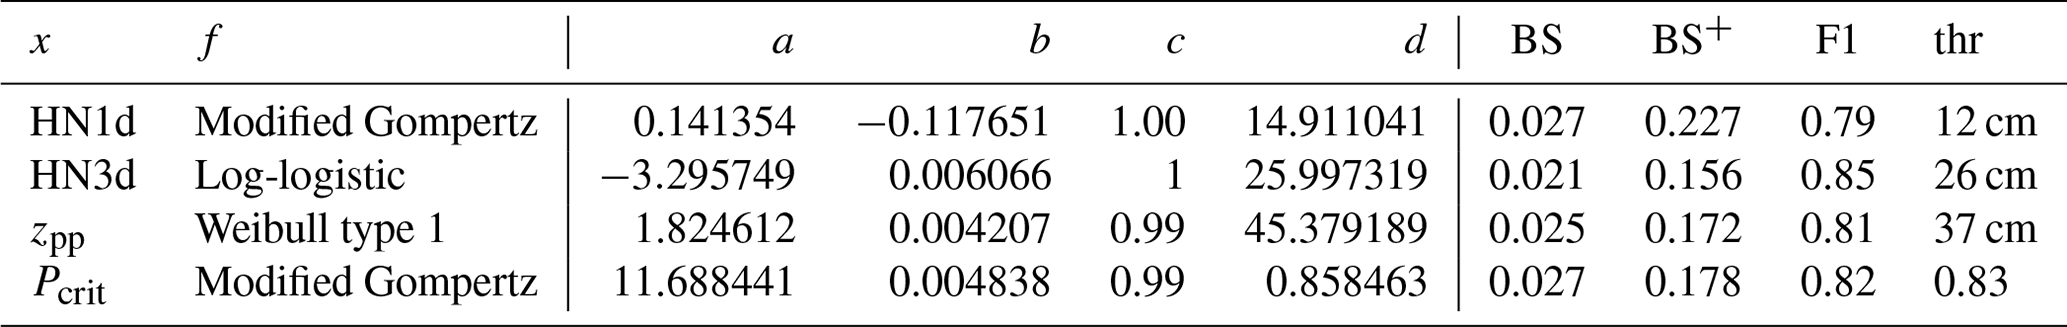
The coefficients for the best-fitting sigmoidal functions f yielding the avalanche day estimators P(AvD)(x)=f(x) with x given by HN1d, HN3d, zpp or Pcrit are shown in Table A3. The Brier score (BS) was lowest for HN3d (BS=0.021 and ; Table A3). Exemplarily, Fig. 5 shows the P(AvD) functions for Pcrit and HN3d. The values of P(AvD) predicted with these two variables correlated strongly (Pearson correlation coefficient r=0.82). The thresholds where the functions reached P(AvD)=0.5 (Table A3) were slightly higher compared with the thresholds of the binary classification models described above (Table A2). The F1 scores resulting from these thresholds deviated from the optimal F1 scores obtained with the simple classifiers by less than 1 %. Therefore, we only evaluated the performance of the continuous avalanche day predictor functions in the validation (Sect. 4.4).
Finally, we explored the performance when averaging the P(AvD) predictions based on HN3d and Pcrit. Taking the mean of both models resulted in slightly better performance compared with the best-performing approach P(AvD)(HN3d): the BS decreased from 0.021 to 0.019, while the BS on the subset of AvDs, BS+, decreased from 0.156 to 0.144. Translating the mean probability into a binary classification resulted in a TPR of 0.81, a TNR of 0.99 and a high PPV of 0.95. Thus, the combined model detected more than 80 % of the avalanche days correctly and had the overall highest F1 score of 0.87.
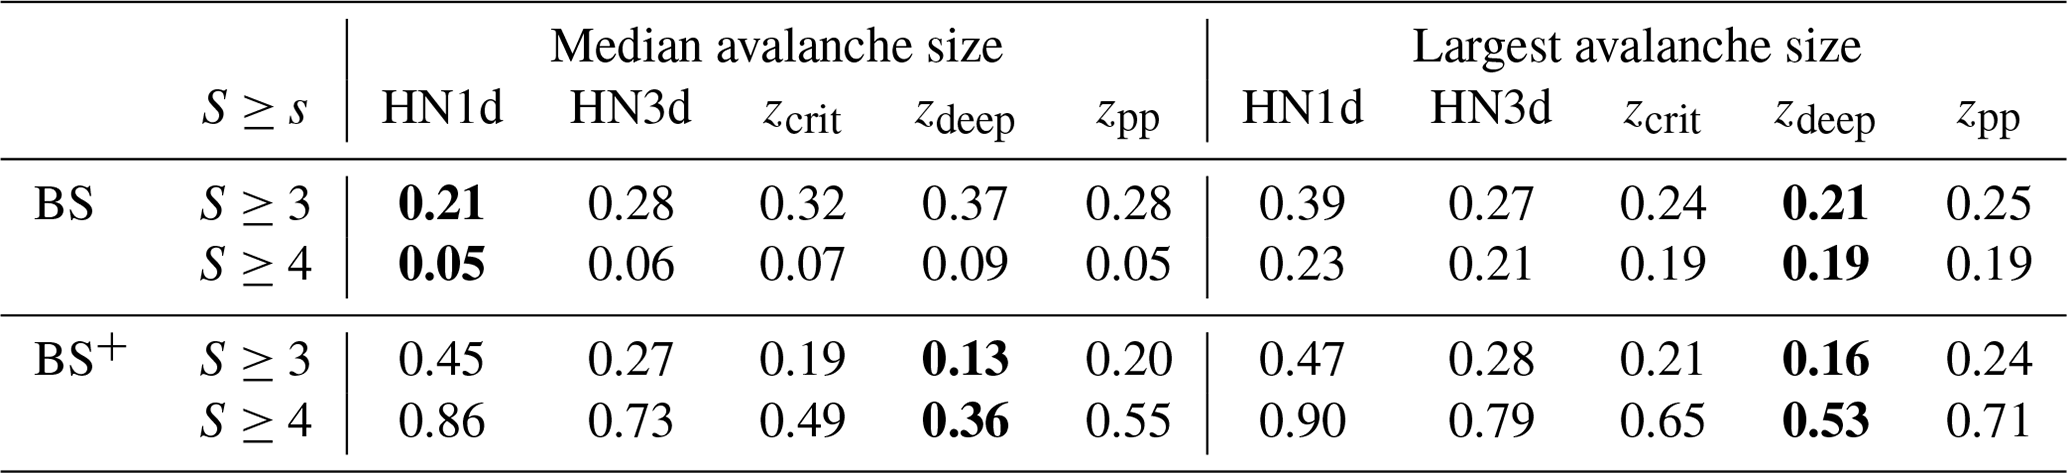
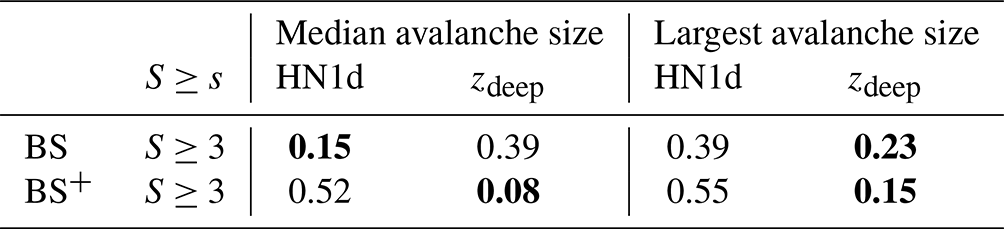
Table 4Brier scores for predicting the median or the largest avalanche for all avalanche days (AvD) with ≥2 avalanches (N=559) using as input different predictor variables. BS+ evaluates only the subset of data points where the avalanche size of interest was indeed observed (median/maximum S≥3: N=175/N=436; median/maximum S≥4: N=31/N=140). The best-performing approach is highlighted in bold.
4.3 Estimating avalanche size
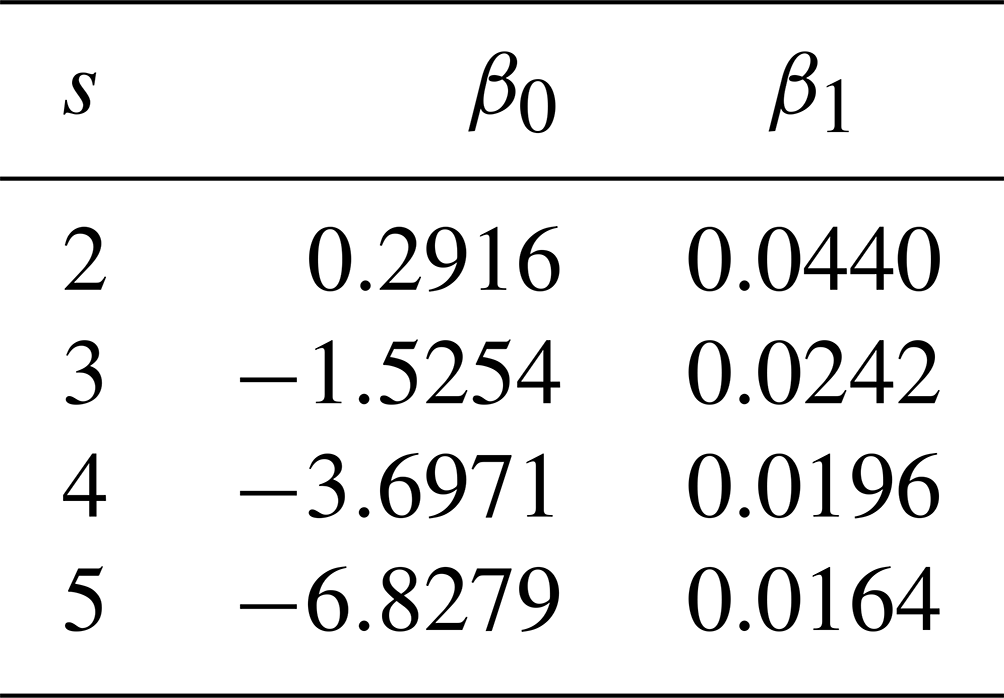
In data set AV3, containing 5912 observed avalanches (Sect. 2.1.2), the recorded failure depth zobs correlated with avalanche size (rs=0.45 and p<0.001; Fig. 6a). The median failure depth increased from 30 cm for size 1 avalanches to 100 cm for size 5 avalanches. While there is considerable overlap, the distributions of zobs were significantly different between pairs of consecutive avalanche size classes (Wilcoxon rank-sum test: p<0.001). Based on this data set, we derived logistic functions P(S≥s)(zobs) to estimate avalanche size from zobs (Fig. 6b; the respective coefficients are provided in Table A4).
Comparing P(S≥3) and P(S≥4) with the observations from the data set AV1 on AvDs with at least two recorded avalanches, we obtained the lowest BS if the median avalanche size was estimated with HN1d as a proxy for the failure depth. For the largest recorded avalanche, on the other hand, zdeep was the best predictor (Table 4). Considering only the subsets of data points where the avalanche size of interest was indeed observed (BS+ in Table 4), i.e. for the 175 cases S≥3 when an avalanche of size 3 or larger was observed, zdeep had the lowest Brier scores for both the median and the largest avalanche size. Thus, zdeep outperforms the variables related to the amount of new snow in terms of capturing minority events, even for the median avalanche size, but has a tendency to predict avalanches larger than observed.
4.4 Validation
4.4.1 Predicting natural avalanche activity in the region of Davos
While the predictive power of the continuous models P(AvD)(Pcrit) and P(AvD)(HN3d) was similar when applied to the training data set AV1 (see Table A3), there were substantial differences in the performance of these models on the validation data set AV3 of observed avalanches from the region of Davos (Sect. 2.1.3), as seen in Fig. 7 and Table 5. For both models, the predicted AvD probability was low for nAvDs (median values 0.03 and 0.01, respectively), yet for AvDs, the P(AvD) values based on HN3d were significantly lower (median: 0.55) than the values obtained with Pcrit (median: 0.95). Using the P(AvD)(HN3d) model and the default classification threshold of 0.5, 149 of the 273 AvDs were correctly predicted (TPR=0.55) and 77 % of the 193 predicted AvDs corresponded to actual observed AvDs (PPV=0.77; Table 5). The P(AvD)(Pcrit) model, on the other hand, had a higher probability of detecting AvDs (TPR=0.90), while the proportion of predicted AvDs that matched an observed AvD was lower (PPV=0.59). In terms of F1 score, the P(AvD)(Pcrit) model (F1=0.71) outperformed the P(AvD)(HN3d) model (F1=0.64). When using the averaged probability of both models, an even higher F1 score of 75 % was obtained. This combined model yielded the highest precision (PPV=0.79), but with a TPR of 0.72, less AvDs were detected than by the P(AvD)(Pcrit) model alone.
Table 5Performance statistics of different avalanche day predictors P(AvD) on the independent validation data set (AV3) with observed avalanches from the region of Davos including 273 AvDs and 984 nAvDs.
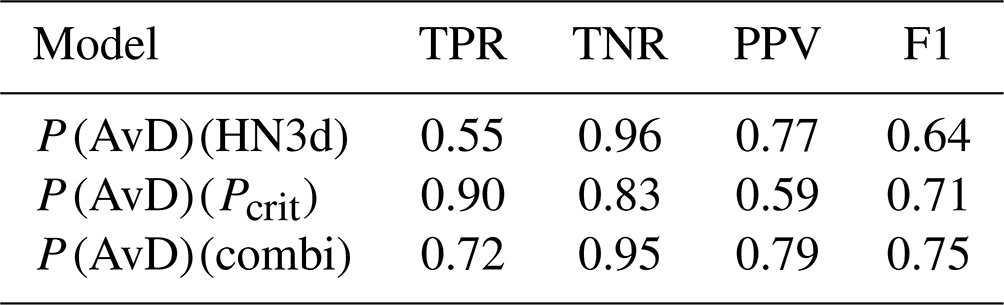
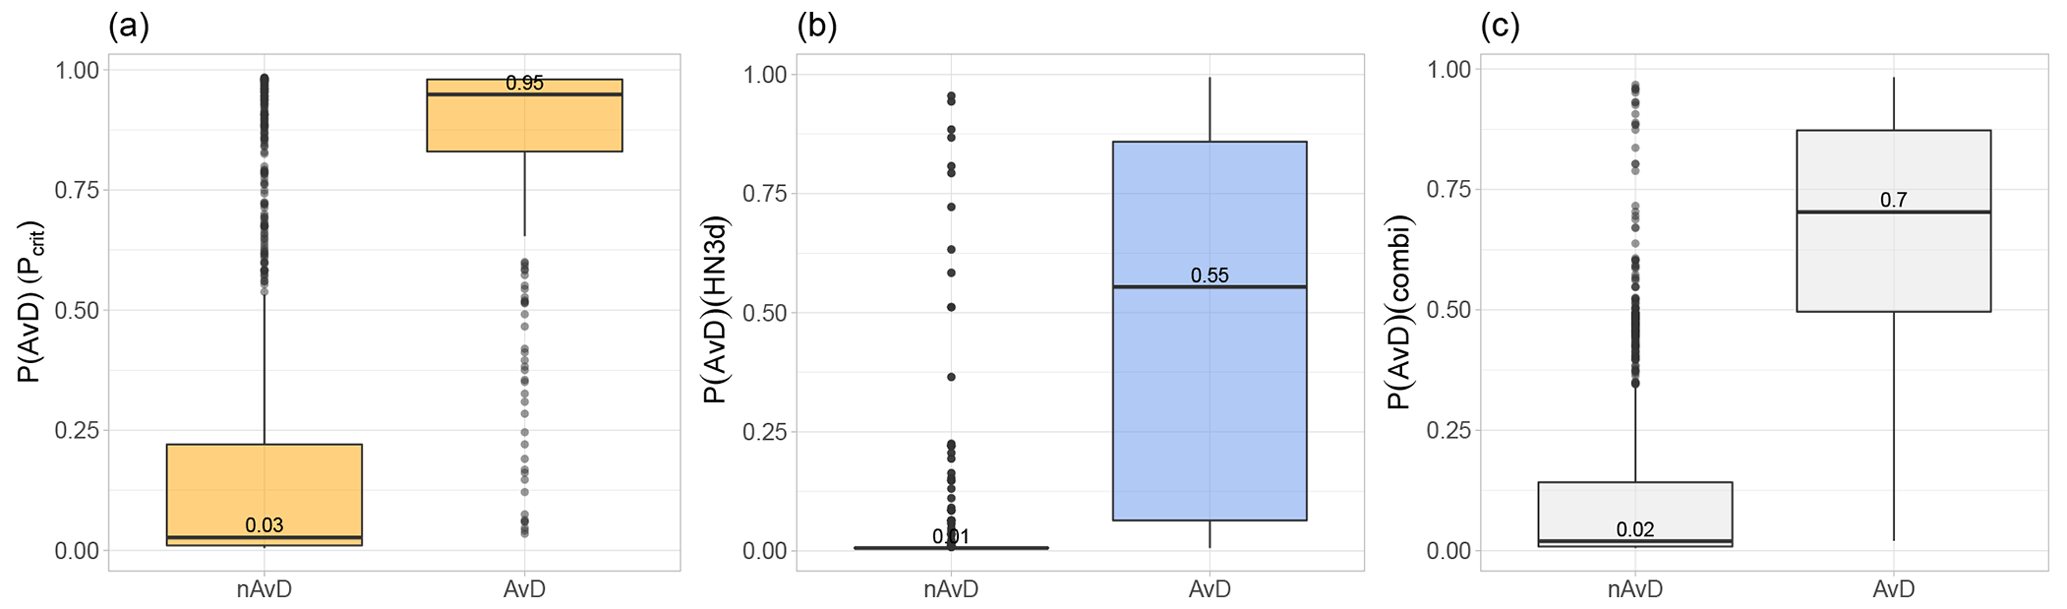
Figure 7Estimated probabilities P(AvD) for avalanche days and non-avalanche days based on the data set of observed avalanches from the region of Davos using the models based on (a) Pcrit, (b) HN3d and (c) the averaged predictions P(AvD)(combi) of the models based on Pcrit and HN3d.
To evaluate the performance of the avalanche size estimators, we compared P(S≥3) values estimated using HN1d or zdeep with the observed median and maximum avalanche size on AvDs with at least two observed avalanches. The resulting Brier scores shown in Table 6 are in line with the performance for data set AV1 (Table 4): the lowest BS for the estimation of median avalanche size was obtained when using HN1d, while for the largest observed avalanche zdeep was again the better predictor. Considering only events when median avalanches sizes greater than or equal to size 3 were observed (N=33), using zdeep again resulted in the lower error rate BS+.
Table 6Brier scores for predicting the median or the largest avalanche size for all avalanche days with ≥2 avalanches (N=185) from the validation data set AV3 of the region of Davos using the predictor variables HN1d and zdeep as input for the P(S≥3) function. BS+ evaluates only a subset of the data when the condition is fulfilled (median/maximum S≥3: ). The best-performing approach is highlighted in bold.
4.4.2 Comparison with the regional avalanche danger level
We compared individual model predictions with the quality-checked regional avalanche danger level for 21 winter seasons (data set DL; Sect. 2.3) relating the model predictions to the three factors determining avalanche danger: snowpack stability, the frequency of snowpack stability and avalanche size (Techel et al., 2020; EAWS, 2022). After removing data used for the development and testing of the P(AvD) models, 98 065 data points remained.
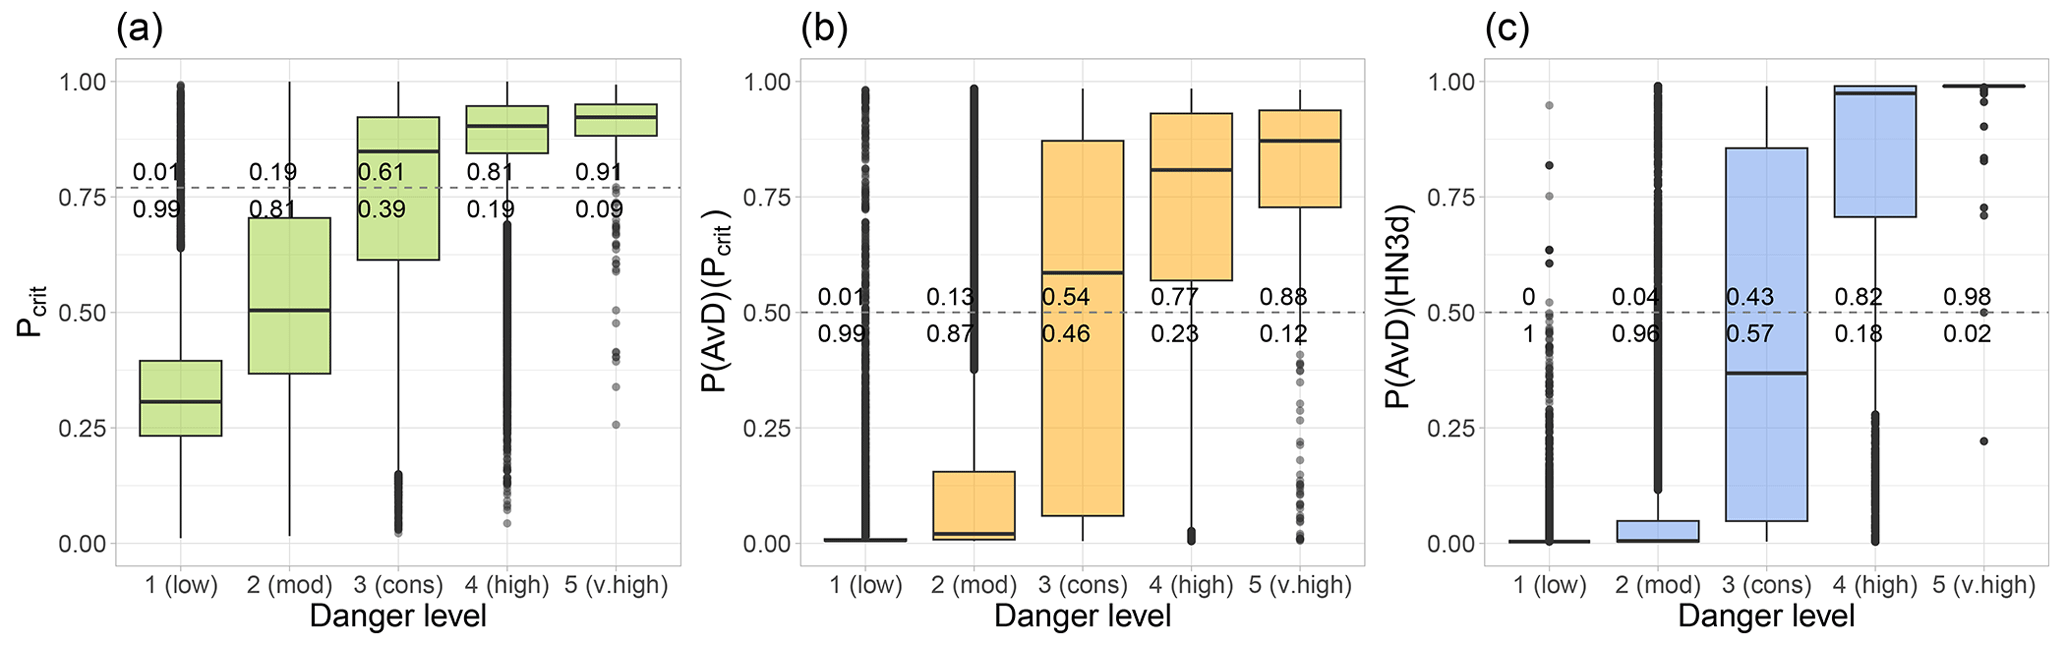
Figure 8Comparison between quality-checked regional danger levels for 21 years (data set DL, N=98 065, entire Swiss Alps; 1 (low), 2 (moderate), 3 (considerable), 4 (high) and 5 (very high)) and simulated snow instability in terms of (a) the probability of instability of the critical weak layer Pcrit, (b) the probability of an AvD provided by the avalanche day predictor P(AvD)(Pcrit) and (c) the probability of an AvD based on P(AvD)(HN3d), the benchmark model. Model predictions were computed for the stations and virtual slopes that matched the elevation and the critical aspects of the respective danger level data point. The dashed horizontal line represents the best-splitting threshold to distinguish between (a) stable and potentially unstable profiles (0.77; Mayer et al., 2022), and (b, c) between AvDs and nAvDs. The respective proportions above and below this threshold are indicated for each danger level.
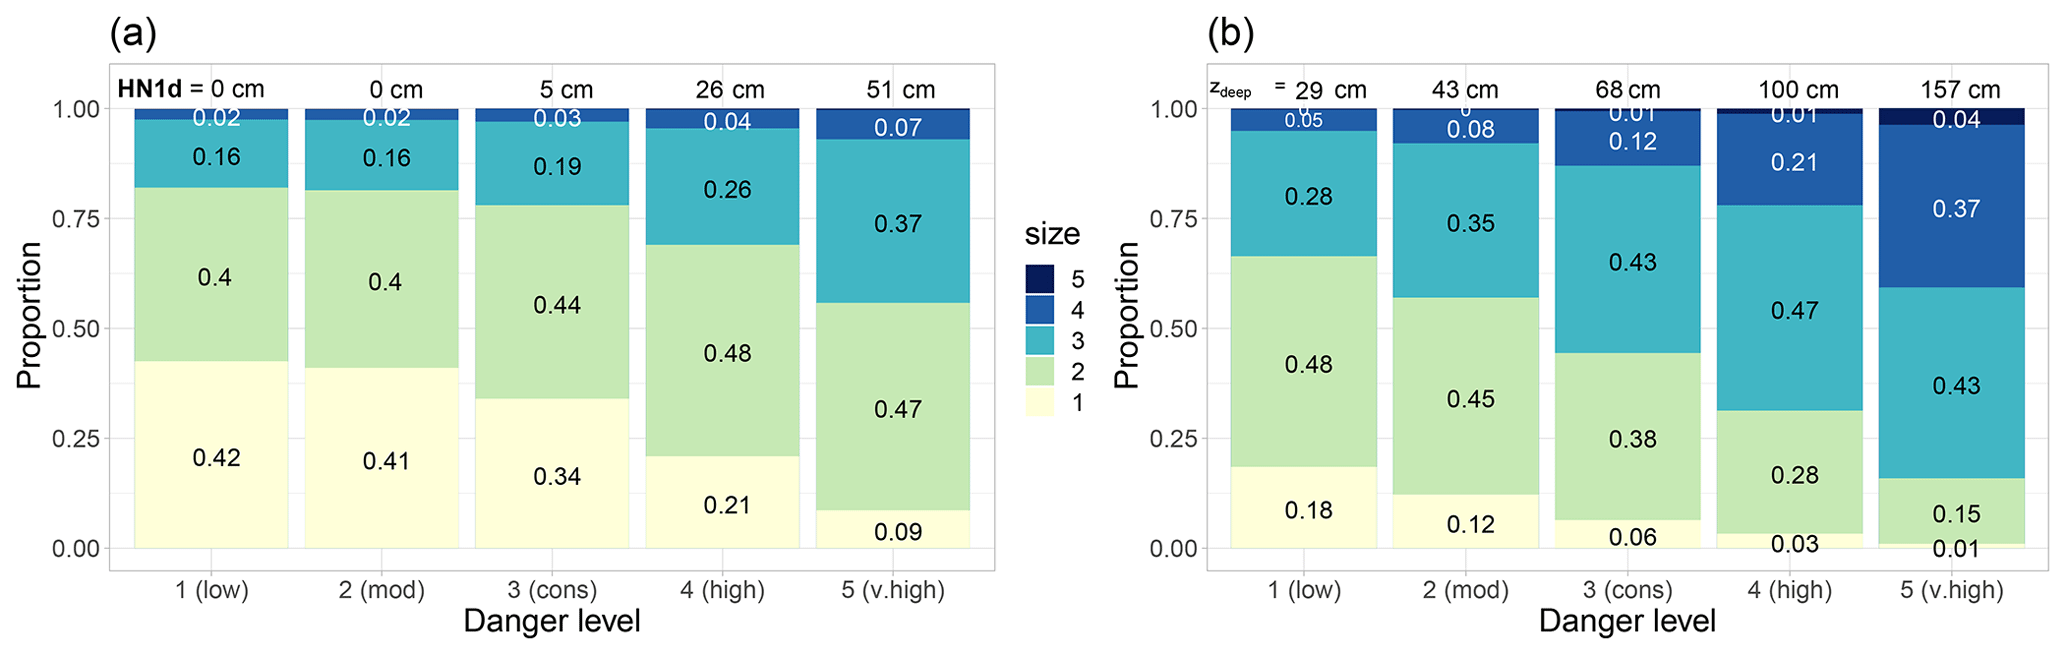
Figure 9Comparison of quality-checked regional danger levels for 21 years (data set DL, N=98 065, entire Swiss Alps; 1 (low), 2 (moderate), 3 (considerable), 4 (high) and 5 (very high)) with simulated avalanche size distributions relying on the avalanche size estimators based on (a) HN1d and (b) zdeep. For each danger level, the respective estimated proportions are shown for each avalanche size (coloured bars). Median values of (a) HN1d and (b) zdeep are indicated at the top of the bars for each danger level.
First, we consider snowpack stability, for which we consider Pcrit, related to human triggering of avalanches, and P(AvD)(Pcrit) and P(AvD)(HN3d), related to the occurrence of natural avalanches, as suitable proxies. The proportion of simulated profiles, which included a critical weak layer classified as potentially unstable Pcrit≥0.77, increased significantly from danger level 1 (low) (0.01) to 2 (moderate) (0.19) to 3 (considerable) (0.61) (Fig. 8a). At the higher danger levels, the vast majority of the simulated critical weak layers were classified as potentially unstable (4 (high): 0.81 and 5 (very high): 0.91). The median predicted probabilities for natural avalanches using the avalanche day predictor P(AvD)(Pcrit) were low at danger level 1 (low) (0.01) and 2 (moderate) (0.02), and increased with increasing danger level (3 (considerable): 0.56, 4 (high): 0.81 and 5 (very high): 0.87) (Fig. 8b). At the two lowest danger levels, less than 13 % of the profiles indicated an AvD, while at the two highest danger levels, more than 77 % of the data points were classified as AvD. The benchmark model P(AvD)(HN3d) showed a similar increase in predicted avalanche probabilities with increasing danger level and differentiated even more clearly between the two lowest danger levels and the two highest danger levels (proportions ≤ 0.04 and ≥0.82, respectively) (Fig. 8c). For both P(AvD) models, danger level 3 (considerable) had the largest spread in simulated avalanche probabilities. With the default threshold of 0.5, the proportion of data points at danger level 3 (considerable) that were classified as AvD by the P(AvD)(Pcrit) and P(AvD)(HN3d) predictors were 54 % and 43 %, respectively.
Avalanche sizes, estimated using the 24 h new snow height HN1d, were mostly size 1 (proportions 0.34–0.42) and size 2 (proportions 0.4–0.44) for danger levels 1 (low) to 3 (considerable) (Fig. 9a). At these danger levels, HN1d was 0 cm in 64 % of the cases, and hence similar size distributions resulted. At 4 (high) and 5 (very high), new snow was recorded 94 % of the time. The most frequently predicted avalanche size at the upper danger levels was size 2 (proportions 0.47–0.48), followed by size 3 (0.26–0.38).
The second proxy of failure depth given by the depth of the simulated deepest weak layer, zdeep, increased continuously with increasing danger level from median values of 29 cm at 1 (low) to 157 cm at 5 (very high) (Fig. 9b). According to Mayer et al. (2022), the instability model detects the critical weak layer, and hence the depth of the weak layer, reliably only if the critical weak layer is potentially unstable. The results presented in Fig. 9b were therefore calculated from the subset of zdeep values for weak layers rated as potentially unstable. Based on these values of zdeep, the most frequently predicted avalanche size was size 2 (proportions 0.45–0.48) at 1 (low) and 2 (moderate), and size 3 (proportions 0.43–0.48) at the three highest danger levels. While the proportions of size 3 were approximately similar at the three highest danger levels, the combined proportions of size 4 and size 5 avalanches increased considerably with increasing danger level from 0.13 at 3 (considerable) to 0.41 at 5 (very high) (Fig. 9b). Considering zdeep, regardless of whether the respective layer was classified as potentially unstable or not, resulted in the following median values for 1 (low) to 5 (very high): 31, 31, 53, 90 and 154 cm, and, hence, in approximately similar size distributions as when considering only zdeep for layers classified as potentially unstable.
Lastly, we explore predictions expected to describe the frequency distribution of snowpack stability. Applying the instability model and the avalanche day predictor to spatially distributed snowpack simulations may yield frequency distributions of snowpack stability with respect to human triggering and natural release, respectively. Spatially distributed simulations of snow stratigraphy can be obtained either with high-resolution output of numerical weather prediction models (e.g. Vionnet et al., 2012; Bellaire and Jamieson, 2013b; Horton et al., 2015) or precipitation input scaled according to terrain properties (e.g. Reuter et al., 2016; Richter et al., 2021). While the demonstration of such an approach was beyond the scope of this study, here we compare the frequency of locations indicating natural avalanche activity based on the mean of P(AvD)(Pcrit) and P(AvD)(HN3d) using posterior knowledge to aggregate AWSs from regions with the same danger level to estimate a frequency distribution of snowpack stability by the proportion of AWSs indicating natural avalanche occurrence (P(AvD)(combi)≥0.5). Similarly, we calculated the mean approximated failure depth zdeep per day and region with the same danger level. Results suggest that avalanche probability and zdeep, the estimator best correlating with the largest avalanche size, increased non-linearly with danger level. As can already be expected based on Fig. 8b and c, the largest spread in conditions can be noted at danger level 3 (considerable), where the frequency of locations for which natural avalanches are predicted spanned almost the entire range of possible values (see shape of orange density contours in Fig. 10). In contrast, at 2 (moderate), frequency values were either low (median P(AvD)(combi)=0.05) or zdeep was comparably small (median zdeep=30 cm), while at 4 (high), both the frequency of locations with natural avalanches predicted and zdeep were comparably high (median P(AvD)(combi)=0.88 and zdeep=75 cm).
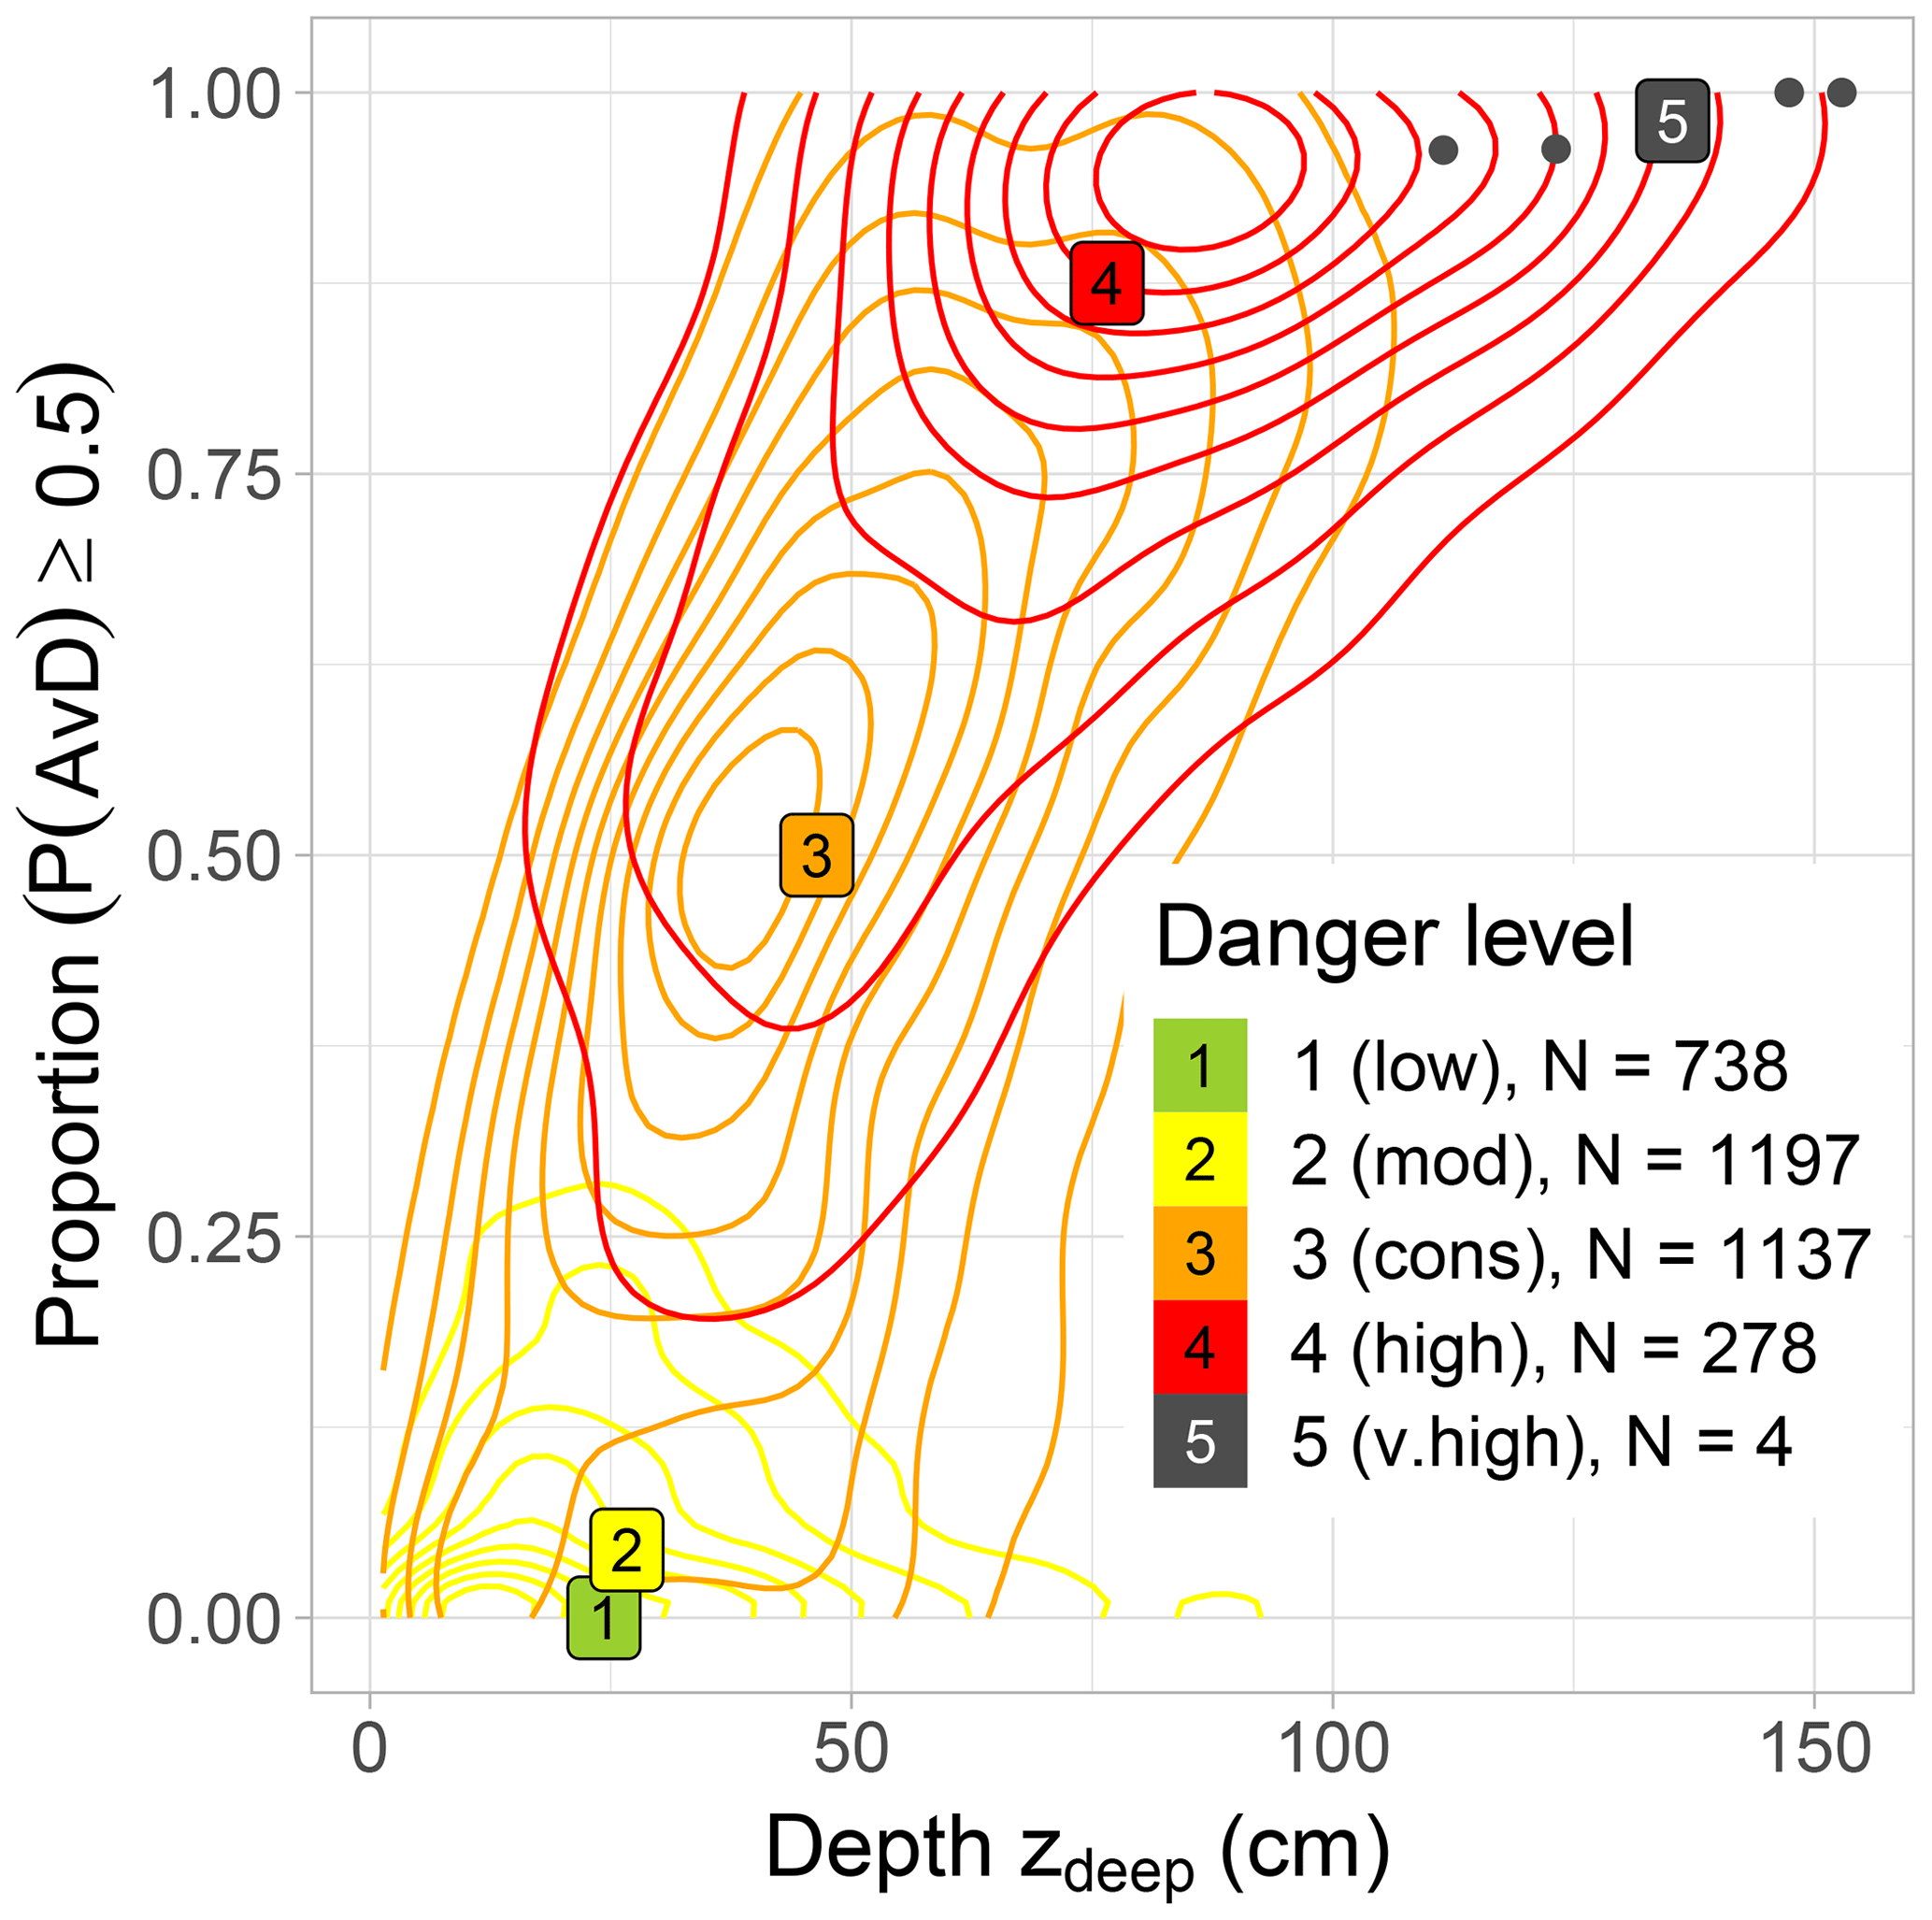
Figure 10Proportion of predictions with P(AvD)(combi)≥0.5 and mean depth of the deepest weak layer zdeep per day, and danger level. Shown are the respective median values (labels). Contour lines indicate the two-dimensional density distributions for 2 (moderate), 3 (considerable) and 4 (high). The respective outermost contour line represents the (0, 0.1] percentile interval and the innermost contour line the (0.9, 1.0] percentile interval. Not shown are density estimates for 1 (low), as only few cases with a proportion ≥ 0.01 existed, and for 5 (very high), as only the four data points shown existed.
We developed an avalanche day predictor P(AvD)(Pcrit) describing the probability for natural dry-snow avalanches in the surroundings of an AWS for a given slope aspect based on simulated snow stratigraphy. We compared the performance of this index with benchmark models relying on the amount of new snow. The combination of P(AvD)(Pcrit) with a model based on the 3 d sum of new snow height, P(AvD)(HN3d), yielded the overall best performance (Sects. 4.2 and 4.4.1). In a second step, we derived an avalanche size estimator based on the relationship between the reported failure depth of avalanches and avalanche size, providing the probability of observing avalanches of a certain size using different approximations of potential failure depth. The depth of the deepest weak layer, zdeep, indicated by the instability model, was a better indicator of maximum avalanche size than modelled new snow amounts (Sects. 4.3 and 4.4.1). In the following, we will discuss the performance and limitations of the avalanche day predictors (P(AvD)) (Sect. 5.2) and avalanche size estimators (P(S≥s)).
5.1 Data reliability
To develop the avalanche day predictor, we created a robust binary target variable (AvD versus nAvD) imposing restrictions on the observed avalanche activity in the vicinity of the AWS (Eq. 1), ensuring a high reliability of the labelling. With this approach, the target variable included rather extreme cases of widespread activity versus no activity at all, which should be taken into account in model interpretation. Due to the necessary adaptation of the AvD nAvD definition in the Davos validation data set, described in Sect. 3.3, the reliability of the avalanche day labels is lower as the definition is relaxed. This also shows in the ratio AvD nAvD, which ranged from 6 % to 15 % in the training data set, while for the Davos validation set it was 27 %. In conclusion, the adapted definition leads to a higher proportion of AvDs, which seems responsible for the lower performance.
As the exact timing of avalanche release was not included in the data sets of observed avalanches, the explanatory variables were extracted from the snowpack and instability model simulations at fixed time steps (12:00 LT). This introduced uncertainty in the explanatory variables of both the training and validation data sets. With avalanche data sets from remote detection systems, providing the exact release time, this uncertainty would be removed. However, so far such data sets only cover short time periods and are very local in scope (e.g. van Herwijnen et al., 2016; Heck et al., 2019; Mayer et al., 2020; Reuter et al., 2022), whereas the training data set used in this study included avalanches from the entire Swiss Alps observed over three winter seasons.
5.2 Predicting avalanche days
In a first step, we analysed the predictive power of the explanatory variables to distinguish between AvDs and nAvDs using different subsets of the training data set (AV1). An optimized threshold-based classification resulted in a reasonably high performance (cross-validated F1 score: 0.80) of Pcrit and clearly outperformed the conventional natural stability index sn38 (cross-validated F1 score: 0.24). While sn38 seems well suited to model natural avalanche activity from a physical point of view, the parameterization of this simple criterion within SNOWPACK has some weaknesses. Indeed, the shear stress can be simply calculated from the load and thus only inherits the errors from estimating precipitation mass based on measured snow depths, yet shear strength is a rather complex microstructural parameter. The current SNOWPACK parameterization of shear strength is based on density and grain type (Jamieson and Johnston, 2001), which may not be sufficient to capture the influence of microstructure as also pointed out by Richter et al. (2020). In particular, the evolution of the SNOWPACK shear strength over time only depends on density if grain type does not change. The poor performance of sn38 is in line with other studies (Jamieson et al., 2007; Reuter et al., 2022). For instance, Jamieson et al. (2007) analysed sn38 based on field measurements and concluded that critical values of stability indices are less useful than their trends, a result confirmed by Reuter et al. (2022) who showed that using time derivatives of sn38 has a higher predictive power. In contrast, the 3 d sum of new snow (HN3d), recognized as an important indicator of avalanche activity in past studies (Ancey et al., 2004; Schweizer et al., 2009), yielded a classification performance (cross-validated F1 score: 0.80) similar to that obtained with Pcrit. Interestingly, the thickness of layers including precipitation particles, zpp, resulted in a slightly lower classification performance (cross-validated F1 score: 0.76), although it presumably captures the complete snowfall event, in contrast to HN3d. Potentially, using the mass of recent slab layers, which is more directly related to the load on the weak layer, may lead to better results than the depth of these layers.
Evaluating continuous one-dimensional sigmoidal P(AvD) functions for the four considered input variables (HN1d, HN3d, zpp and Pcrit) on the training data (AV1) resulted in negligible differences in F1 scores (≤1 %) compared with the F1-optimized threshold-based classification. The best performance in terms of F1 and Brier scores was obtained by taking the average probability from P(AvD)(Pcrit) and P(AvD)(HN3d), which was also confirmed by the validation on the independent data set from the region of Davos (data set AV3; F1=0.75). With this data set (AV3), the performance of the P(AvD)(HN3d) model in terms of predicting AvDs was rather low (TPR=0.55). A possible explanation is the more frequent formation of persistent weak layers in the region of Davos due to its relatively dry, inner-alpine snow climate, compared with the mean snow climate in the Swiss Alps. If weak layers are present within or at the snow surface, avalanches can release with smaller amounts of new snow (e.g. Schweizer et al., 2009; Schneebeli et al., 1998), which was also illustrated by the differences in optimal thresholds for the subsets from the training data (Sect. 4.1). The combination of P(AvD)(HN3d) with P(AvD)(Pcrit) presents an alternative to using snow-climate-specific thresholds, as the Pcrit variable captures the presence of weak layers.
Most of the recently developed snow instability models (Viallon-Galinier et al., 2023; Pérez-Guillén et al., 2022; Hendrick et al., 2023; Sielenou et al., 2021) are based on statistical methods which account for non-linear, complex relationships between target and explanatory variables. Here, we chose a rather simple approach based on one-dimensional sigmoidal functions which cannot account for interactions between explanatory variables but do allow for a simple interpretation of model output. Nevertheless, it should be noted that Pcrit itself is based on the output of a random forest model, which renders the interpretation of P(AvD)(Pcrit) difficult with respect to the original input parameters of the instability model. For a discussion of the influence of these input parameters on the direct output of the instability model, the layer-specific probability of instability, Punstable, see Mayer et al. (2022).
For a model to be considered useful, it has to provide more information than can be obtained from basic prior information (Honts and Schweinle, 2009), for instance, when simply assuming the base rate of avalanche days as the constant probability for an avalanche day. Thus, the potential benefits of a threshold-based classification can also be explored using the concept of information gain (Honts and Schweinle, 2009). Applied to our context, information gain is defined as the difference between the base rate probability of avalanche days and the posterior probability (or the positive predictive value or precision; Honts and Schweinle, 2009). As shown in Table 5 for the avalanche observations in the region of Davos (data set AV3), particularly combining the models P(AvD)(Pcrit) and P(AvD)(HN3d) provided a clear information gain (PPV≥0.76) compared with the base rate of avalanche days in this data set (BR=0.22). While the new snow model P(AvD)(HN3d) had a similar PPV, the combination of the two approaches resulted in a comparably balanced proportion of correctly detected AvDs and nAvDs.
5.3 Estimating avalanche size
Avalanche size is classified according to the destructive potential of the avalanche (e.g. EAWS, 2019), which is strongly influenced by the volume and mass of the snow in motion. Thus, avalanche size depends on the failure depth and the extent of the slab which released, the snow entrained in the avalanche path and also on the terrain itself (e.g. Bartelt et al., 2017). Of these factors, the one-dimensional snowpack simulations in combination with the instability model only provide information on the failure depth.
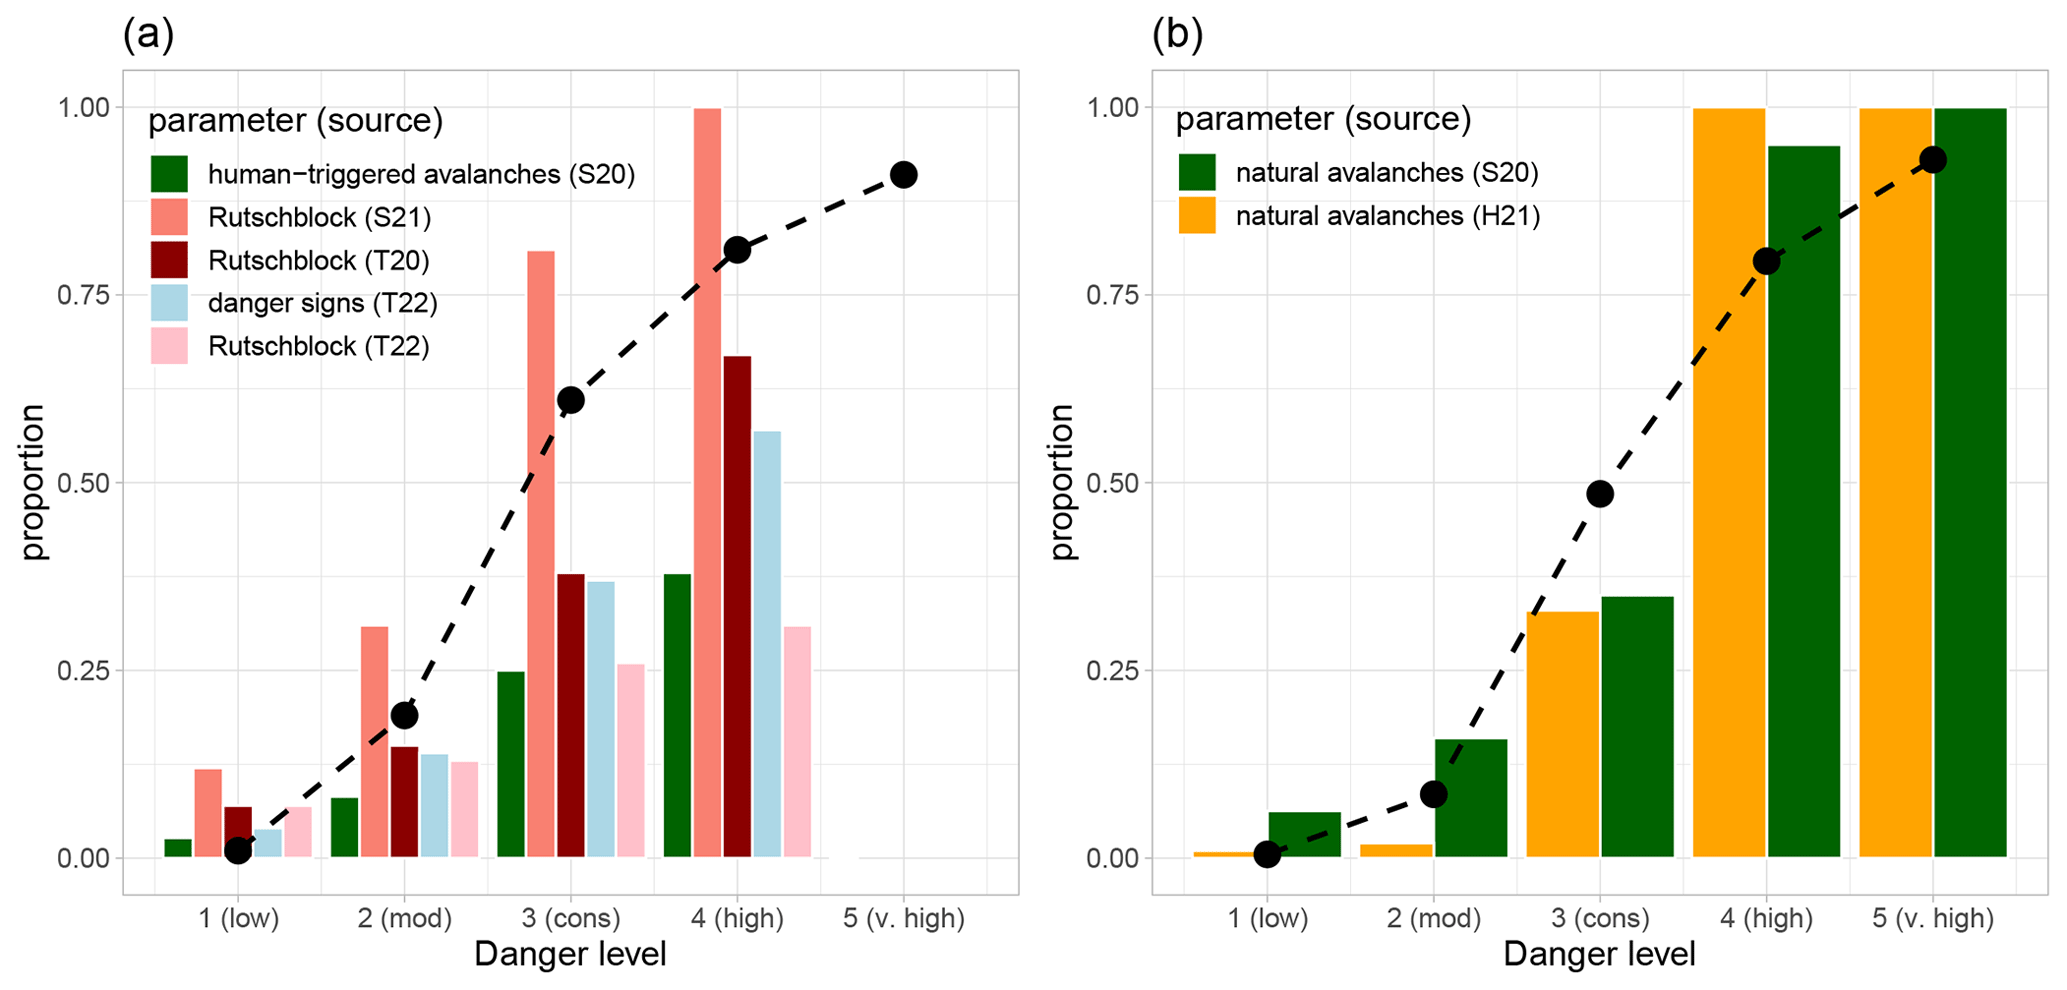
Figure 11Comparison of modelled instability with recent studies analysing observed or forecast indicators of instability with respect to the five danger levels. Panel (a) shows the proportion of simulated SNOWPACK profiles classified as potentially unstable by the instability model (dashed line) as compared with the proportion of Rutschblock test results, the proportion of days when a human-triggered avalanche was observed and the proportion of observations reporting danger signs. Panel (b) shows the proportion of profiles that indicated a natural avalanche day based on the combined avalanche predictor P(AvD)(combi)≥0.5 as compared with observed and expected avalanche occurrence. Comparison data sets are abbreviated as follows and refer to the following studies: S20 (Schweizer et al., 2020a), S21 (Schweizer et al., 2021), T20 (Techel et al., 2020), T22 (Techel et al., 2022) and H21 (Hutter et al., 2021).
We estimated avalanche size as a function of various proxies of failure depth (HN1d, HN3d, zpp and zdeep). The correlation between size and failure depth of observed avalanches was demonstrated here (Fig. 6) and in previous studies (van Herwijnen and Jamieson, 2007; Bellaire and Jamieson, 2013a). The overall best indicator of the largest avalanche size in terms of Brier scores was obtained with the avalanche size estimator based on the simulated depth of the deepest weak layer, zdeep. This suggests that information on snow stratigraphy provides important additional information on avalanche size compared with using only indicators related to the amount of new snow. The size estimator based on zdeep, however, overestimated the occurrence of large avalanches. This might result from the above-noted oversimplification of the size estimator with one single input parameter, but also from the quality of the observed avalanche size distributions which represent a single, and often rather small, sample (median of two avalanches on avalanche days) from the potential avalanches on a given day. Moreover, there may be a reporting bias towards reporting larger avalanches (Schweizer et al., 2020a; Techel et al., 2020). In addition, and as recently shown by Hafner et al. (2023), considerable uncertainty related to individual avalanche size estimates may exist. We cannot account for any of these factors in our analysis. Interestingly, Bellaire and Jamieson (2013a) also used a functional fit on the observed relation between avalanche size and failure depth to estimate avalanche size from a simulated proxy of failure depth. However, a comparison between our avalanche size estimator and this previous approach is not yet possible, as Bellaire and Jamieson (2013a) only indirectly validated simulated avalanche size as part of a classification tree for the prediction of danger levels.
5.4 Comparison with regional avalanche danger levels
The three key factors that characterize the avalanche danger levels are snowpack stability, the frequency distribution of snowpack stability and avalanche size (Techel et al., 2020; EAWS, 2022). The models developed allow, for the first time, the use of a fully data- and model-driven approach to estimate these key factors of regional avalanche danger. We demonstrated that with increasing danger level, the probability for natural avalanches estimated by the avalanche day predictor P(AvD)(Pcrit) also increased for the stations and virtual slopes that matched the elevation and the critical aspects of the respective danger level (Sect. 4.4.2; Fig. 8). Interestingly, the benchmark model P(AvD)(HN3d) separated danger levels 1 (low) and 2 (moderate) from the upper danger levels high (4) and very high (5) even more strictly. This simple model P(AvD)(HN3d) could thus be of particular use for operational forecasting, especially when only meteorological variables and no detailed snow stratigraphy simulations are available. In line with these results, the proportion of AWSs predicting natural avalanche activity in regions with the same danger level increased from 1 (low) to 4 (high). Of particular note is that the avalanche day predictors indicated a wide range of conditions for danger level 3 (considerable), suggesting that splitting this danger level into several sub-levels as proposed by Techel et al. (2022) may allow for a better differentiation of avalanche situations. With respect to avalanche size, the predictions of the estimator based on zdeep showed a reasonable increase in the probability for large avalanches with increasing danger level, which is consistent with the definition of the danger levels.
Comparing the model-driven predictions of instability related to human-triggered avalanches with other studies exploring the relationship between the indicators of instability characterizing regional avalanche danger and the danger levels showed similar patterns (Fig. 11a). For instance, studies exploring Rutschblock stability test results, a stability test indicative of human triggering of avalanches (Föhn, 1987; Schweizer, 2002), showed that the proportion of test results classified as very poor or poor increased with increasing danger level (Schweizer et al., 2021; Techel et al., 2020, 2022). Similarly, the proportion that at least one human-triggered avalanche was recorded in the area of observation (Schweizer et al., 2021) or the proportion of observations indicating human-triggered whumpfs or shooting cracks (Techel et al., 2022) increased in a similar manner. A similarly good agreement between model predictions and studies describing the (expected or observed) occurrence of natural avalanches is visualized in Fig. 11b. For instance, the proportion of P(AvD) predictions and the proportion of days on which natural avalanches were mentioned in the danger description in the Swiss avalanche forecast (Hutter et al., 2021), or on which avalanches were observed (in the region of Davos; Schweizer et al., 2020a), showed low values at 1 (low) and 2 (moderate), and high values at 4 (high) and 5 (very high).
We relied on simulated snowpack stratigraphy for virtual slopes with a 38∘ incline as used for operational avalanche forecasting in Switzerland. This simulation setup has been used operationally for several years, for instance, to assess snowpack wetting (e.g. using the approach by Mitterer et al., 2013) or to monitor the presence of persistent weak layers. More recently, the Swiss avalanche warning service has been testing machine-learning models predicting wet-snow avalanche activity (Hendrick et al., 2023), snowpack instability (Mayer et al., 2022) and the avalanche danger level (Pérez-Guillén et al., 2022) in a real-time setting. These models use as input snowpack simulations made for the four virtual slope aspects. As shown by Techel et al. (2022) for the instability model and the avalanche danger model, and by Hendrick et al. (2023) for the wet-snow avalanche model, predictions based on these simulations correlated with the aspects considered the most avalanche-prone or with signs of instability or avalanche activity.
Overall, we conclude that fully data- and model-driven aspect-specific predictions describing the probability of human-triggered avalanches and the occurrence of natural avalanches are clearly related to observational data and may therefore be suitable for estimating snowpack stability at the regional scale.
To investigate whether the instability model based on one-dimensional SNOWPACK simulations recently developed by Mayer et al. (2022) can be used to predict natural dry-snow avalanche activity, we compared model output (Pcrit) with quality-controlled avalanche observations. We found that Pcrit is well suited to discriminate between days with widespread natural avalanche activity and days with no activity at all. We then transformed Pcrit into a probability for natural dry-snow avalanche occurrence in the surroundings of an AWS using regression analysis. The new avalanche day predictor P(AvD)(Pcrit) performed well (F1=0.82), but not better than a benchmark model P(AvD)(HN3d) based on the 3 d sum of new snow height (F1=0.85) regarding the classification of avalanche days and non-avalanche days from the training data set of observed avalanches from all over Switzerland (AV1). This suggests that for the occurrence of natural dry-snow avalanches, snow stratigraphy seems to be of secondary importance compared with the amount of new snow. However, model evaluation on an independent data set from the region of Davos (AV3) (Sect. 4.2) and the analysis of specific subsets of the training data showed that accounting for snow stratigraphy is important when prominent persistent weak layers are present in the snowpack, as less new snow is required to cause a decrease in stability. In the classification of avalanche days from the region of Davos, P(AvD)(Pcrit) outperformed P(AvD)(HN3d) (F1=0.71 and 0.64, respectively), and the averaged predictions of both models yielded the overall best performance (F1=0.75). The performance of this combined model should be evaluated on further independent data sets to investigate its applicability to snow climates that were not represented by the data used in this study.
We also explored whether indicators of avalanche size can be obtained from one-dimensional SNOWPACK simulations. Our avalanche size estimator, developed using observations of avalanche size and failure depth, produced the best results in predicting the largest avalanche size when the depth of the deepest simulated weak layer (zdeep) was used as a proxy for failure depth. This demonstrates that including information on snow stratigraphy is critical for estimating avalanche size, compared with relying exclusively on parameters based on the amount of new snow.
Lastly, as part of the model validation, we showed that model predictions (avalanche day and size) were related to the danger levels. The results were in line with current definitions of the avalanche danger levels and with previous data-driven studies, highlighting the models' potential to support decision making in regional avalanche forecasting.
The models developed in this study allow for the estimation of two determinants of regional avalanche danger, snow instability and avalanche size. Applied to one-dimensional snowpack simulations driven with data from AWSs or numerical weather prediction models, these models can thus provide valuable support in operational avalanche forecasting.
Table A1Definition of four-parameter sigmoidal functions f(x) used for fitting of P(AvD) functions.
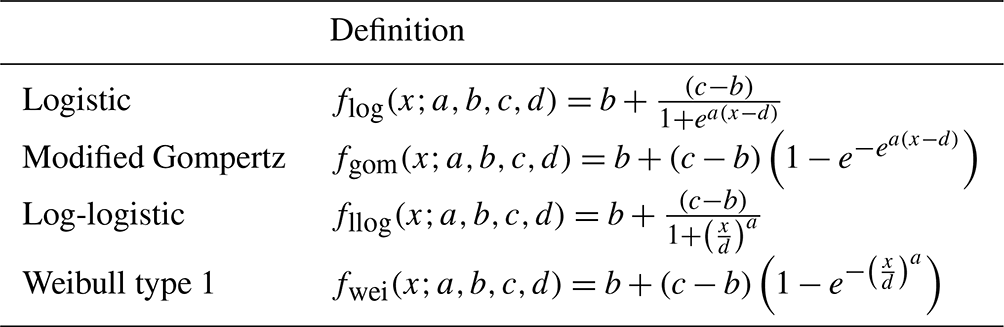
Table A2Performance statistics for different avalanche day predictors (binary classification). The best-splitting threshold “thr” is indicated. A case is classified as AvD if the respective value is ≥thr, except for sn38 where ≤thr.
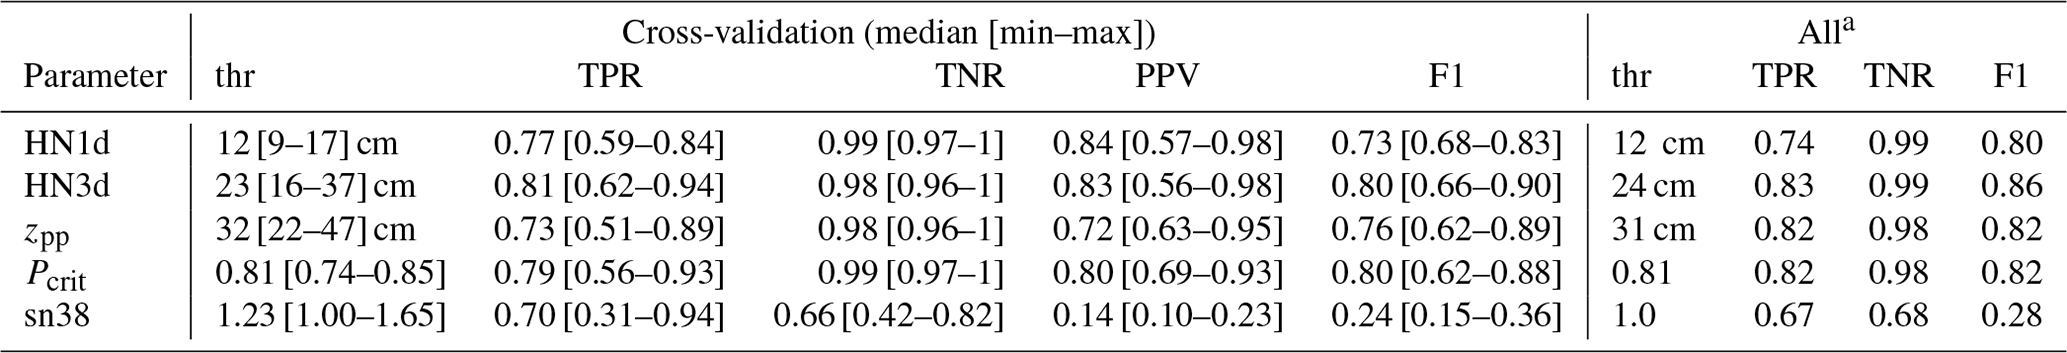
a The data set “All” was trained and tested on the same data.
Table A3Coefficients () of best-fitting function f(x) describing the probability for an AvD, P(AvD), and corresponding Brier score (BS), Brier score on positive events (BS+) and F1 score resulting from classification based on threshold (thr) with P(AvD)(thr)=0.5. Definitions of the functions f are given in Table A1.
The data are available at the Envidat data repository https://doi.org/10.16904/envidat.425 (Mayer and Techel, 2023).
SM and FT contributed equally to this study (concept, data curation and analysis, and preparation of manuscript; joint first authorship). JS and AvH provided feedback during the analysis. All authors discussed the findings and contributed to the writing of the manuscript.
The contact author has declared that none of the authors has any competing interests.
Publisher's note: Copernicus Publications remains neutral with regard to jurisdictional claims made in the text, published maps, institutional affiliations, or any other geographical representation in this paper. While Copernicus Publications makes every effort to include appropriate place names, the final responsibility lies with the authors.
We thank Lukas Graz (ETH Zurich) and Marc Ruesch (WSL Institute for Snow and Avalanche Research SLF, Davos) for valuable advice on the development of the regression models.
This work was partly funded by the WSL research programme Climate Change Impacts on Alpine Mass Movements – CCAMM (https://ccamm.slf.ch/en/general-overview.html, last access: 1 September 2023).
This paper was edited by Pascal Haegeli and reviewed by Christoph Mitterer and two anonymous referees.
Ancey, C., Gervasoni, C., and Meunier, M.: Computing extreme avalanches, Cold Reg. Sci. Technol., 39, 161–180, https://doi.org/10.1016/j.coldregions.2004.04.004, 2004. a, b
Bartelt, P. and Lehning, M.: A physical SNOWPACK model for the Swiss avalanche warning Part I: Numerical model, Cold Reg. Sci. Technol., 35, 123–145, https://doi.org/10.1016/S0165-232X(02)00074-5, 2002. a
Bartelt, P., Bühler, Y., Christen, M., Deubelbeiss, Y., Salz, M., Schneider, M., and Schumacher, L.: RAMMS::AVALANCHE User Manual – A numerical model for snow avalanches in research and practice, WSL Institute for Snow and Avalanche Research SLF, Davos, Switzerland, https://ramms.slf.ch/fileadmin/user_upload/WSL/Microsite/RAMMS/Downloads/RAMMS_AVAL_Manual.pdf (last access: 28 July 2022), 2017. a
Bavay, M. and Egger, T.: MeteoIO 2.4.2: a preprocessing library for meteorological data, Geosci. Model Dev., 7, 3135–3151, https://doi.org/10.5194/gmd-7-3135-2014, 2014. a
Bellaire, S. and Jamieson, B.: On estimating avalanche danger from simulated snow profiles, in: Proceedings of the International Snow Science Workshop, 7–11 October 2013, Grenoble and Chamonix, France, 154–161, https://arc.lib.montana.edu/snow-science/item/1740 (last access: 7 November 2023), 2013a. a, b, c
Bellaire, S. and Jamieson, B.: Forecasting the formation of critical snow layers using a coupled snow cover and weather model, Cold Reg. Sci. Technol., 94, 37–44, https://doi.org/10.1016/j.coldregions.2013.06.007, 2013b. a
Brun, E., Martin, E., Simon, V., Gendre, C., and Coléou, C.: An energy and mass model of snow cover suitable for operational avalanche forecasting, J. Glaciology, 35, 333–342, https://doi.org/10.3189/S0022143000009254, 1989. a
Brun, E., David, P., Sudul, M., and Brunot, G.: A numerical model to simulate snow-cover stratigraphy for operational avalanche forecasting, J. Glaciol., 38, 13–22, https://doi.org/10.3189/S0022143000009552, 1992. a
Conway, H. and Wilbour, C.: Evolution of snow slope stability during storms, Cold Reg. Sci. Technol., 30, 67–77, https://doi.org/10.1016/S0165-232X(99)00009-9, 1999. a
EAWS: Standards: avalanche size, https://www.avalanches.org/standards/avalanche-size/ (last access: 13 May 2022), 2019. a
EAWS: Standards: Avalanche size, European Avalanche Warning Services (EAWS), https://www.avalanches.org/standards/avalanche-size/ (last access: 17 November 2021), 2021. a, b
EAWS: Definition of avalanche danger, avalanche danger level and their contributing factors, Tech. rep., https://www.avalanches.org/wp-content/uploads/2022/12/EAWS_matrix_definitions_EN.pdf (last access: 2 January 2022), 2022. a, b, c, d
EAWS: Standards: European Avalanche Danger Scale, European Avalanche Warning Services (EAWS), https://www.avalanches.org/standards/avalanche-danger-scale/ (last access: 24 May 2023), 2023. a
Fierz, C., Armstrong, R., Durand, Y., Etchevers, P., Greene, E., McClung, D., Nishimura, K., Satyawali, P., and Sokratov, S.: The international classification for seasonal snow on the ground, HP-VII Technical Document in Hydrology, in: 83. UNESCO-IHP, Paris, France, p. 90, https://unesdoc.unesco.org/ark:/48223/pf0000186462 (last access: 7 November 2023), 2009. a, b
Föhn, P. M. B.: The “Rutschblock” as a practical tool for slope stability evaluation, IAHS Publ., 162, 223–228, 1987. a
Hafner, E. D., Techel, F., Leinss, S., and Bühler, Y.: Mapping avalanches with satellites – evaluation of performance and completeness, The Cryosphere, 15, 983–1004, https://doi.org/10.5194/tc-15-983-2021, 2021. a
Hafner, E. D., Techel, F., Daudt, R. C., Wegner, J. D., Schindler, K., and Bühler, Y.: Avalanche size estimation and avalanche outline determination by experts: reliability and implications for practice, Nat. Hazards Earth Syst. Sci., 23, 2895–2914, https://doi.org/10.5194/nhess-23-2895-2023, 2023. a
Heck, M., van Herwijnen, A., Hammer, C., Hobiger, M., Schweizer, J., and Fäh, D.: Automatic detection of avalanches combining array classification and localization, Earth Surf. Dynam., 7, 491–503, https://doi.org/10.5194/esurf-7-491-2019, 2019. a, b
Hendrick, M., Techel, F., Volpi, M., Olevski, T., Pérez-Guillén, C., van Herwijnen, A., and Schweizer, J.: Automated prediction of wet-snow avalanche activity in the Swiss Alps, J. Glaciol., 69, 1365–1378, https://doi.org/10.1017/jog.2023.24, 2023. a, b, c, d, e
Hendrikx, J., Murphy, M., and Onslow, T.: Classification trees as a tool for operational avalanche forecasting on the Seward Highway, Alaska, Cold Reg. Sci. Technol., 97, 113–120, https://doi.org/10.1016/j.coldregions.2013.08.009, 2014. a
Honts, C. and Schweinle, W.: Information gain of psychophysiological detection of deception in forensic and screening settings, Appl. Psychophysiol. Biofeed., 34, 161–172, https://doi.org/10.1007/s10484-009-9096-z, 2009. a, b, c
Horton, S., Schirmer, M., and Jamieson, B.: Meteorological, elevation, and slope effects on surface hoar formation, The Cryosphere, 9, 1523–1533, https://doi.org/10.5194/tc-9-1523-2015, 2015. a
Hutter, V., Techel, F., and Purves, R. S.: How is avalanche danger described in textual descriptions in avalanche forecasts in Switzerland? Consistency between forecasters and avalanche danger, Nat. Hazards Earth Syst. Sci., 21, 3879–3897, https://doi.org/10.5194/nhess-21-3879-2021, 2021. a, b
Jamieson, B., Zeidler, A., and Brown, C.: Explanation and limitations of study plot stability indices for forecasting dry snow slab avalanches in surrounding terrain, Cold Reg. Sci. Technol., 50, 23–34, https://doi.org/10.1016/j.coldregions.2007.02.010, 2007. a, b
Jamieson, J. and Johnston, C.: Refinements to the stability index for skier-triggered dry-slab avalanches, Ann. Glaciol., 26, 296–302, https://doi.org/10.3189/1998AoG26-1-296-302, 1998. a
Jamieson, J. and Johnston, C.: Evaluation of the shear frame test for weak snowpack layers, Ann. Glaciol., 32, 59–68, 2001. a
Kronholm, K., Vikhamar-Schuler, D., Jaedicke, C., Isaksen, K., Sorteberg, A., and Kristensen, K.: Forecasting snow avalanche days from meteorological data using classification trees; Grasdalen, Norway, in: Proceedings ISSW 2006, International Snow Science Workshop, 1–6 October 2006, Telluride, 786–795, https://arc.lib.montana.edu/snow-science/item/1016 (last access: 7 November 2023), 2006. a
Lehning, M. and Fierz, C.: Assessment of snow transport in avalanche terrain, Cold Reg. Sci. Technol., 51, 240–252, https://doi.org/10.1016/j.coldregions.2007.05.012, 2008. a
Lehning, M., Bartelt, P., and Brown, B.: SNOWPACK model calculations for avalanche warning based upon a new network of weather and snow stations, Cold Reg. Sci. Technol., 30, 145–157, https://doi.org/10.1016/S0165-232X(99)00022-1, 1999. a, b
Lehning, M., Doorschot, J., and Bartelt, P.: A snowdrift index based on SNOWPACK model calculations, Ann. Glaciol., 31, 382–386, https://doi.org/10.3189/172756400781819770, 2000. a
Lehning, M., Bartelt, P., Brown, R., and Fierz, C.: A physical SNOWPACK model for the Swiss avalanche warning; Part III: meteorological forcing, thin layer formation and evaluation, Cold Reg. Sci. Technol., 35, 169–184, https://doi.org/10.1016/S0165-232X(02)00072-1, 2002a. a
Lehning, M., Bartelt, P., Brown, R., Fierz, C., and Satyawali, P.: A physical SNOWPACK model for the Swiss avalanche warning; Part II. Snow microstructure, Cold Reg. Sci. Technol., 35, 147–167, https://doi.org/10.1016/S0165-232X(02)00073-3, 2002b. a, b
Lehning, M., Fierz, C., Brown, B., and Jamieson, B.: Modeling snow instability with the snow-cover model SNOWPACK, Ann. Glaciol., 38, 331–338, https://doi.org/10.3189/172756404781815220, 2004. a
Mayer, S. and Techel, F.: Data-set for prediction of natural dry-snow avalanche activity and avalanche size using physics-based snowpack simulations, EnviDat [data set], https://doi.org/10.16904/envidat.425, 2023. a
Mayer, S., van Herwijnen, A., Ulivieri, G., and Schweizer, J.: Evaluating the performance of an operational infrasound avalanche detection system at three locations in the Swiss Alps during two winter seasons, Cold Reg. Sci. Technol., 173, 102962, https://doi.org/10.1016/j.coldregions.2019.102962, 2020. a, b
Mayer, S., van Herwijnen, A., Techel, F., and Schweizer, J.: A random forest model to assess snow instability from simulated snow stratigraphy, The Cryosphere, 16, 4593–4615, https://doi.org/10.5194/tc-16-4593-2022, 2022. a, b, c, d, e, f, g, h, i, j
Mitterer, C., Techel, F., Fierz, C., and Schweizer, J.: An operational supporting tool for assessing wet-snow avalanche danger, in: Proceedings ISSW 2013, International Snow Science Workshop, 7–11 October 2013, Grenoble – Chamonix Mont-Blanc, France, 334–338, https://arc.lib.montana.edu/snow-science/item/1860 (last access: 7 November 2023), 2013. a
Morin, S., Horton, S., Techel, F., Bavay, M., Coléou, C., Fierz, C., Gobiet, A., Hagenmuller, P., Lafaysse, M., Lžar, M., Mitterer, C., Monti, F., Müller, K., Olefs, M., Snook, J. S., van Herwijnen, A., and Vionnet, V.: Application of physical snowpack models in support of operational avalanche hazard forecasting: A status report on current implementations and prospects for the future, Cold Reg. Sci. Technol., 170, 102910, https://doi.org/10.1016/j.coldregions.2019.102910, 2020. a, b
Pérez-Guillén, C., Techel, F., Hendrick, M., Volpi, M., van Herwijnen, A., Olevski, T., Obozinski, G., Pérez-Cruz, F., and Schweizer, J.: Data-driven automated predictions of the avalanche danger level for dry-snow conditions in Switzerland, Nat. Hazards Earth Syst. Sci., 22, 2031–2056, https://doi.org/10.5194/nhess-22-2031-2022, 2022. a, b, c, d
Reuter, B., Richter, B., and Schweizer, J.: Snow instability patterns at the scale of a small basin, J. Geophys. Res.-Earth, 257, 257–282, https://doi.org/10.1002/2015JF003700, 2016. a
Reuter, B., Viallon-Galinier, L., Horton, S., van Herwijnen, A., Mayer, S., Hagenmuller, P., and Morin, S.: Characterizing snow instability with avalanche problem types derived from snow cover simulations, Cold Reg. Sci. Technol., 194, 103462, https://doi.org/10.1016/j.coldregions.2021.103462, 2022. a, b, c, d, e
Richter, B., van Herwijnen, A., Rotach, M. W., and Schweizer, J.: Sensitivity of modeled snow stability data to meteorological input uncertainty, Nat. Hazards Earth Syst. Sci., 20, 2873–2888, https://doi.org/10.5194/nhess-20-2873-2020, 2020. a
Richter, B., Schweizer, J., Rotach, M. W., and van Herwijnen, A.: Modeling spatially distributed snow instability at a regional scale using Alpine3D, J. Glaciol., 67, 1147–1162, https://doi.org/10.1017/jog.2021.61, 2021. a
Schirmer, M., Lehning, M., and Schweizer, J.: Statistical forecasting of regional avalanche danger using simulated snow-cover data, J. Glaciol., 55, 761–768, https://doi.org/10.3189/002214309790152429, 2009. a
Schneebeli, M., Laternser, M., Föhn, P., and Ammann, W.: Wechselwirkungen zwischen Klima, Lawinen und technischen Massnahmen, Schlussbericht NFP 31, vdf Hochschulverlag AG an der ETH, Zurich, ISBN 3728126047, 1998. a
Schweizer, J.: The Rutschblock test – procedure and application in Switzerland, Avalanche Rev., 20, 14–15, 2002. a
Schweizer, J., Kronholm, K., and Wiesinger, T.: Verification of regional snowpack stability and avalanche danger, Cold Reg. Sci. Technol., 37, 277–288, https://doi.org/10.1016/S0165-232X(03)00070-3, 2003. a
Schweizer, J., Mitterer, C., and Stoffel, L.: On forecasting large and infrequent snow avalanches, Cold Reg. Sci. Technol., 59, 234–241, https://doi.org/10.1016/j.coldregions.2009.01.006, 2009. a, b, c, d, e
Schweizer, J., Mitterer, C., Techel, F., Stoffel, A., and Reuter, B.: On the relation between avalanche occurrence and avalanche danger level, The Cryosphere, 14, 737–750, https://doi.org/10.5194/tc-14-737-2020, 2020a. a, b, c, d, e
Schweizer, J., Mitterer, C., Techel, F., Stoffel, A., and Reuter, B.: Snow avalanche data Davos, Switzerland, 1999–2019, Envidat [data set], https://doi.org/10.16904/envidat.134, 2020b. a
Schweizer, J., Mitterer, C., Reuter, B., and Techel, F.: Avalanche danger level characteristics from field observations of snow instability, The Cryosphere, 15, 3293–3315, https://doi.org/10.5194/tc-15-3293-2021, 2021. a, b, c, d
Sielenou, P. D., Viallon-Galinier, L., Hagenmuller, P., Naveau, P., Morin, S., Dumont, M., Verfaillie, D., and Eckert, N.: Combining random forests and class-balancing to discriminate between three classes of avalanche activity in the French Alps, Cold Reg. Sci. Technol., 187, 103276, https://doi.org/10.1016/j.coldregions.2021.103276, 2021. a
SLF: SLF-Beobachterhandbuch (observational guidelines), 55 pp., https://www.dora.lib4ri.ch/wsl/islandora/object/wsl:24954 (last access: 1 May 2022), 2020. a, b
Stoffel, A., Meister, R., and Schweizer, J.: Spatial characteristics of avalanche activity in an Alpine valley – a GIS approach, Ann. Glaciol., 26, 329–336, 1998. a, b
Techel, F.: Re-analyzed regional avalanche danger levels in Switzerland, EnviDat [data set], https://doi.org/10.16904/envidat.426, 2023. a
Techel, F., Müller, K., and Schweizer, J.: On the importance of snowpack stability, the frequency distribution of snowpack stability, and avalanche size in assessing the avalanche danger level, The Cryosphere, 14, 3503–3521, https://doi.org/10.5194/tc-14-3503-2020, 2020. a, b, c, d, e, f
Techel, F., Mayer, S., Pérez-Guillén, C., Schmudlach, G., and Winkler, K.: On the correlation between a sub-level qualifier refining the danger level with observations and models relating to the contributing factors of avalanche danger, Nat. Hazards Earth Syst. Sci., 22, 1911–1930, https://doi.org/10.5194/nhess-22-1911-2022, 2022. a, b, c, d, e, f, g
van Herwijnen, A. and Jamieson, B.: Snowpack properties associated with fracture initiation and propagation resulting in skier-triggered dry snow slab avalanches, Cold Reg. Sci. Technol., 50, 13–22, https://doi.org/10.1016/j.coldregions.2007.02.004, 2007. a
van Herwijnen, A., Heck, M., and Schweizer, J.: Forecasting snow avalanches using avalanche activity data obtained through seismic monitoring, Cold Reg. Sci. Technol., 132, 68–80, https://doi.org/10.1016/j.coldregions.2016.09.014, 2016. a, b
Viallon-Galinier, L., Hagenmuller, P., and Eckert, N.: Combining modelled snowpack stability with machine learning to predict avalanche activity, The Cryosphere, 17, 2245–2260, https://doi.org/10.5194/tc-17-2245-2023, 2023. a, b, c
Vionnet, V., Brun, E., Morin, S., Boone, A., Faroux, S., Le Moigne, P., Martin, E., and Willemet, J.-M.: The detailed snowpack scheme Crocus and its implementation in SURFEX v7.2, Geosci. Model Dev., 5, 773–791, https://doi.org/10.5194/gmd-5-773-2012, 2012. a, b
Wilks, D.: Statistical methods in the atmospheric sciences, in: vol. 100 of International Geophysics Series, 3rd Edn., Academic Press, San Diego, CA, USA, ISBN 9780123850225, 2011. a
WSL Institute for Snow and Avalanche Research SLF: WFJ_MOD: Meteorological and snowpack measurements from Weissfluhjoch, WSL Institute for Snow and Avalanche Research SLF, https://doi.org/10.16904/1, 2015. a