the Creative Commons Attribution 4.0 License.
the Creative Commons Attribution 4.0 License.
 | 05 Oct 2023
Testing machine learning models for heuristic building damage assessment applied to the Italian Database of Observed Damage (DaDO)
Subash Ghimire
Philippe Guéguen
Adrien Pothon
Danijel Schorlemmer
Assessing or forecasting seismic damage to buildings is an essential issue for earthquake disaster management. In this study, we explore the efficacy of several machine learning models for damage characterization, trained and tested on the database of damage observed after Italian earthquakes (the Database of Observed Damage – DaDO). Six models were considered: regression- and classification-based machine learning models, each using random forest, gradient boosting, and extreme gradient boosting. The structural features considered were divided into two groups: all structural features provided by DaDO or only those considered to be the most reliable and easiest to collect (age, number of storeys, floor area, building height). Macroseismic intensity was also included as an input feature. The seismic damage per building was determined according to the EMS-98 scale observed after seven significant earthquakes occurring in several Italian regions. The results showed that extreme gradient boosting classification is statistically the most efficient method, particularly when considering the basic structural features and grouping the damage according to the traffic-light-based system used; for example, during the post-disaster period (green, yellow, and red), 68 % of buildings were correctly classified. The results obtained by the machine-learning-based heuristic model for damage assessment are of the same order of accuracy (error values were less than 17 %) as those obtained by the traditional RISK-UE method. Finally, the machine learning analysis found that the importance of structural features with respect to damage was conditioned by the level of damage considered.
- Article
(5177 KB) - Full-text XML
- BibTeX
- EndNote


Population growth worldwide increases exposure to natural hazards, increasing consequences in terms of global economic and human losses. For example, between 1985 and 2014, the world's population increased by 50 % and average annual losses due to natural disasters increased from USD 14 billion to over USD 140 billion (Silva et al., 2019). Among other natural hazards, earthquakes represent one-fifth of total annual economic losses and cause more than 20 000 deaths per year (Daniell et al., 2017; Silva et al., 2019). To develop effective seismic risk reduction policies, decision-makers and stakeholders rely on a representation of consequences when earthquakes affect the built environment. Two main risk metrics generally considered at the global scale are associated with building damage: direct economic losses due to costs of repair/replacement and loss of life of inhabitants due to building damage. The damage is estimated by combining the seismic hazard, exposure models, and vulnerability/fragility functions (Silva et al., 2019).
For scenario-based risk assessment, damage and related consequences are computed for a single earthquake defined in terms of magnitude, location, and other seismological features. Many methods have been developed to characterize the urban environment for exposure models. In particular, damage assessment requires vulnerability/fragility functions for all types of existing buildings, defined according to their design characteristics (shape, position, materials, height, etc.) and grouped in a building taxonomy (e.g. among other conventional methods, FEMA, 2003; Grünthal, 1998; Guéguen et al., 2007; Lagomarsino and Giovinazzi, 2006; Mouroux and Le Brun, 2006; Silva et al., 2022). At the regional/country scale, damage assessment is therefore confronted with the difficulty of accurately characterizing exposure according to the required criteria and assigning appropriate vulnerability/fragility functions to building features. Unfortunately, the necessary information is often sparse and incomplete, and the exposure model development suffers from economic and time constraints.
Over the past decade, there has been growing interest in artificial intelligence methods for seismic risk assessment due to their superior computational efficiency, their easy handling of complex problems, and the incorporation of uncertainties (e.g. Riedel et al., 2014, 2015; Azimi et al., 2020; Ghimire et al., 2022; Hegde and Rokseth, 2020; Kim et al., 2020; Mangalathu and Jeon, 2020; Morfidis and Kostinakis, 2018; Salehi and Burgueño, 2018; Seo et al., 2012; Sun et al., 2021; Wang et al., 2021; Xie et al., 2020; Y. Xu et al., 2020; Z. Xu et al., 2020). In particular, several studies have tested the effectiveness of machine learning methods in associating damage degrees with basic building features and spatially distributed seismic demand with acceptable accuracy compared with conventional methods or with post-earthquake observations (e.g. Riedel et al., 2014, 2015; Guettiche et al., 2017; Harirchian et al., 2021; Mangalathu et al., 2020; Roeslin et al., 2020; Stojadinović et al., 2021; Ghimire et al., 2022). In parallel, significant efforts have been made to collect post-earthquake building damage observations after damaging earthquakes (Dolce et al., 2019; MINVU, 2010; MTPTC, 2010; NPC, 2015). With more than 10 000 samples compiled, the Database of Observed Damage (DaDO) in Italy, a platform of the Civil Protection Department, developed by the Eucentre Foundation (Dolce et al., 2019), allows exploration of the value of heuristic vulnerability functions calibrated on observations (Lagomarsino et al., 2021), as well as the training of heuristic functions using machine learning models (Ghimire et al., 2022) and considering sparse and incomplete building features.
The main objective of this study is to investigate the effectiveness of several machine learning models trained and tested on information from DaDO to develop a heuristic model for damage assessment. The model may be classified as heuristic because it applies a problem-solving approach in which a calculated guess based on previous experience is considered for damage assessment (as opposed to applying algorithms that effectively eliminate the approximation). The damage is thus estimated in a non-rigorous way defined during the training phase, and the results must be validated and then tested against observed damage. By analogy with psychology, this procedure can reduce the cognitive load associated with uncertainties when making decisions based on damage assessment by explicitly considering the uncertainties in the assessment, being aware of the incompleteness of the information and the accuracy level to make a decision. The dataset and methods are described in the Data and Method sections, respectively. The fourth section presents the results of damage prediction produced by machine learning models compared with conventional methods, followed by the Discussion and Conclusions sections.
The Database of Observed Damage (DaDO; Dolce et al., 2019) is accessible through a web-based geographic information system (GIS) platform and is designed to collect and share information about building features, seismic ground motions, and observed damage following major earthquakes in Italy from 1976 to 2019 (with the exclusion of the 2016–2017 central Italy earthquake for which data processing is ongoing). A framework was adopted to homogenize the different forms of information collected and to translate the damage information into the EMS-98 scale (Grünthal, 1998) using the method proposed by Dolce et al. (2019). For this study, we selected building damage data from seven earthquakes summarized in Table 1 and presented in Fig. 1.
Table 1Building damage data from DaDO for the seven earthquakes considered in this study. “Ref” is the reference to the earthquake used in the paper. “DL” is the number of the damage grade available in DaDO. “NB” is the number of buildings considered in this study. AeDES is the post-earthquake damage survey form, first introduced in 1997 and which became the official operational tool recognized by the Italian Civil Protection Department in 2002.
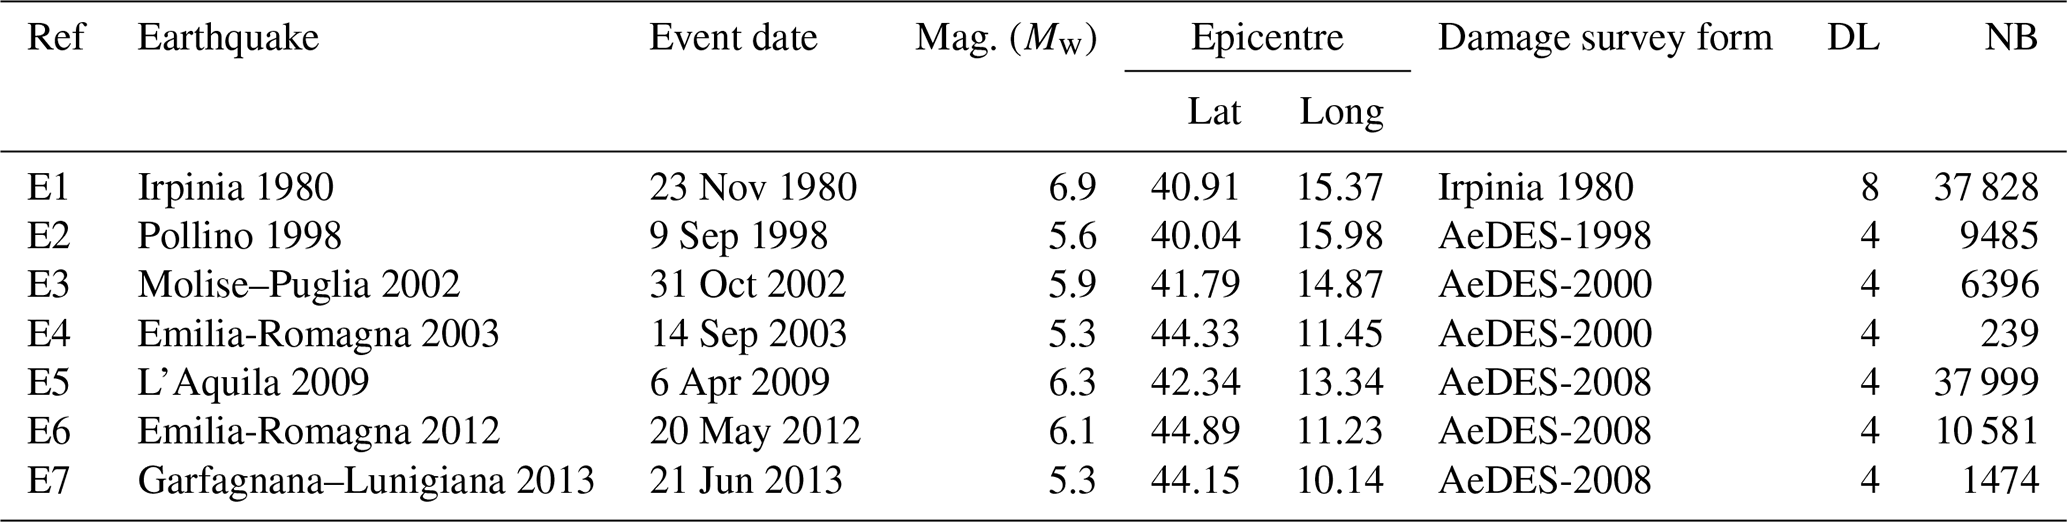
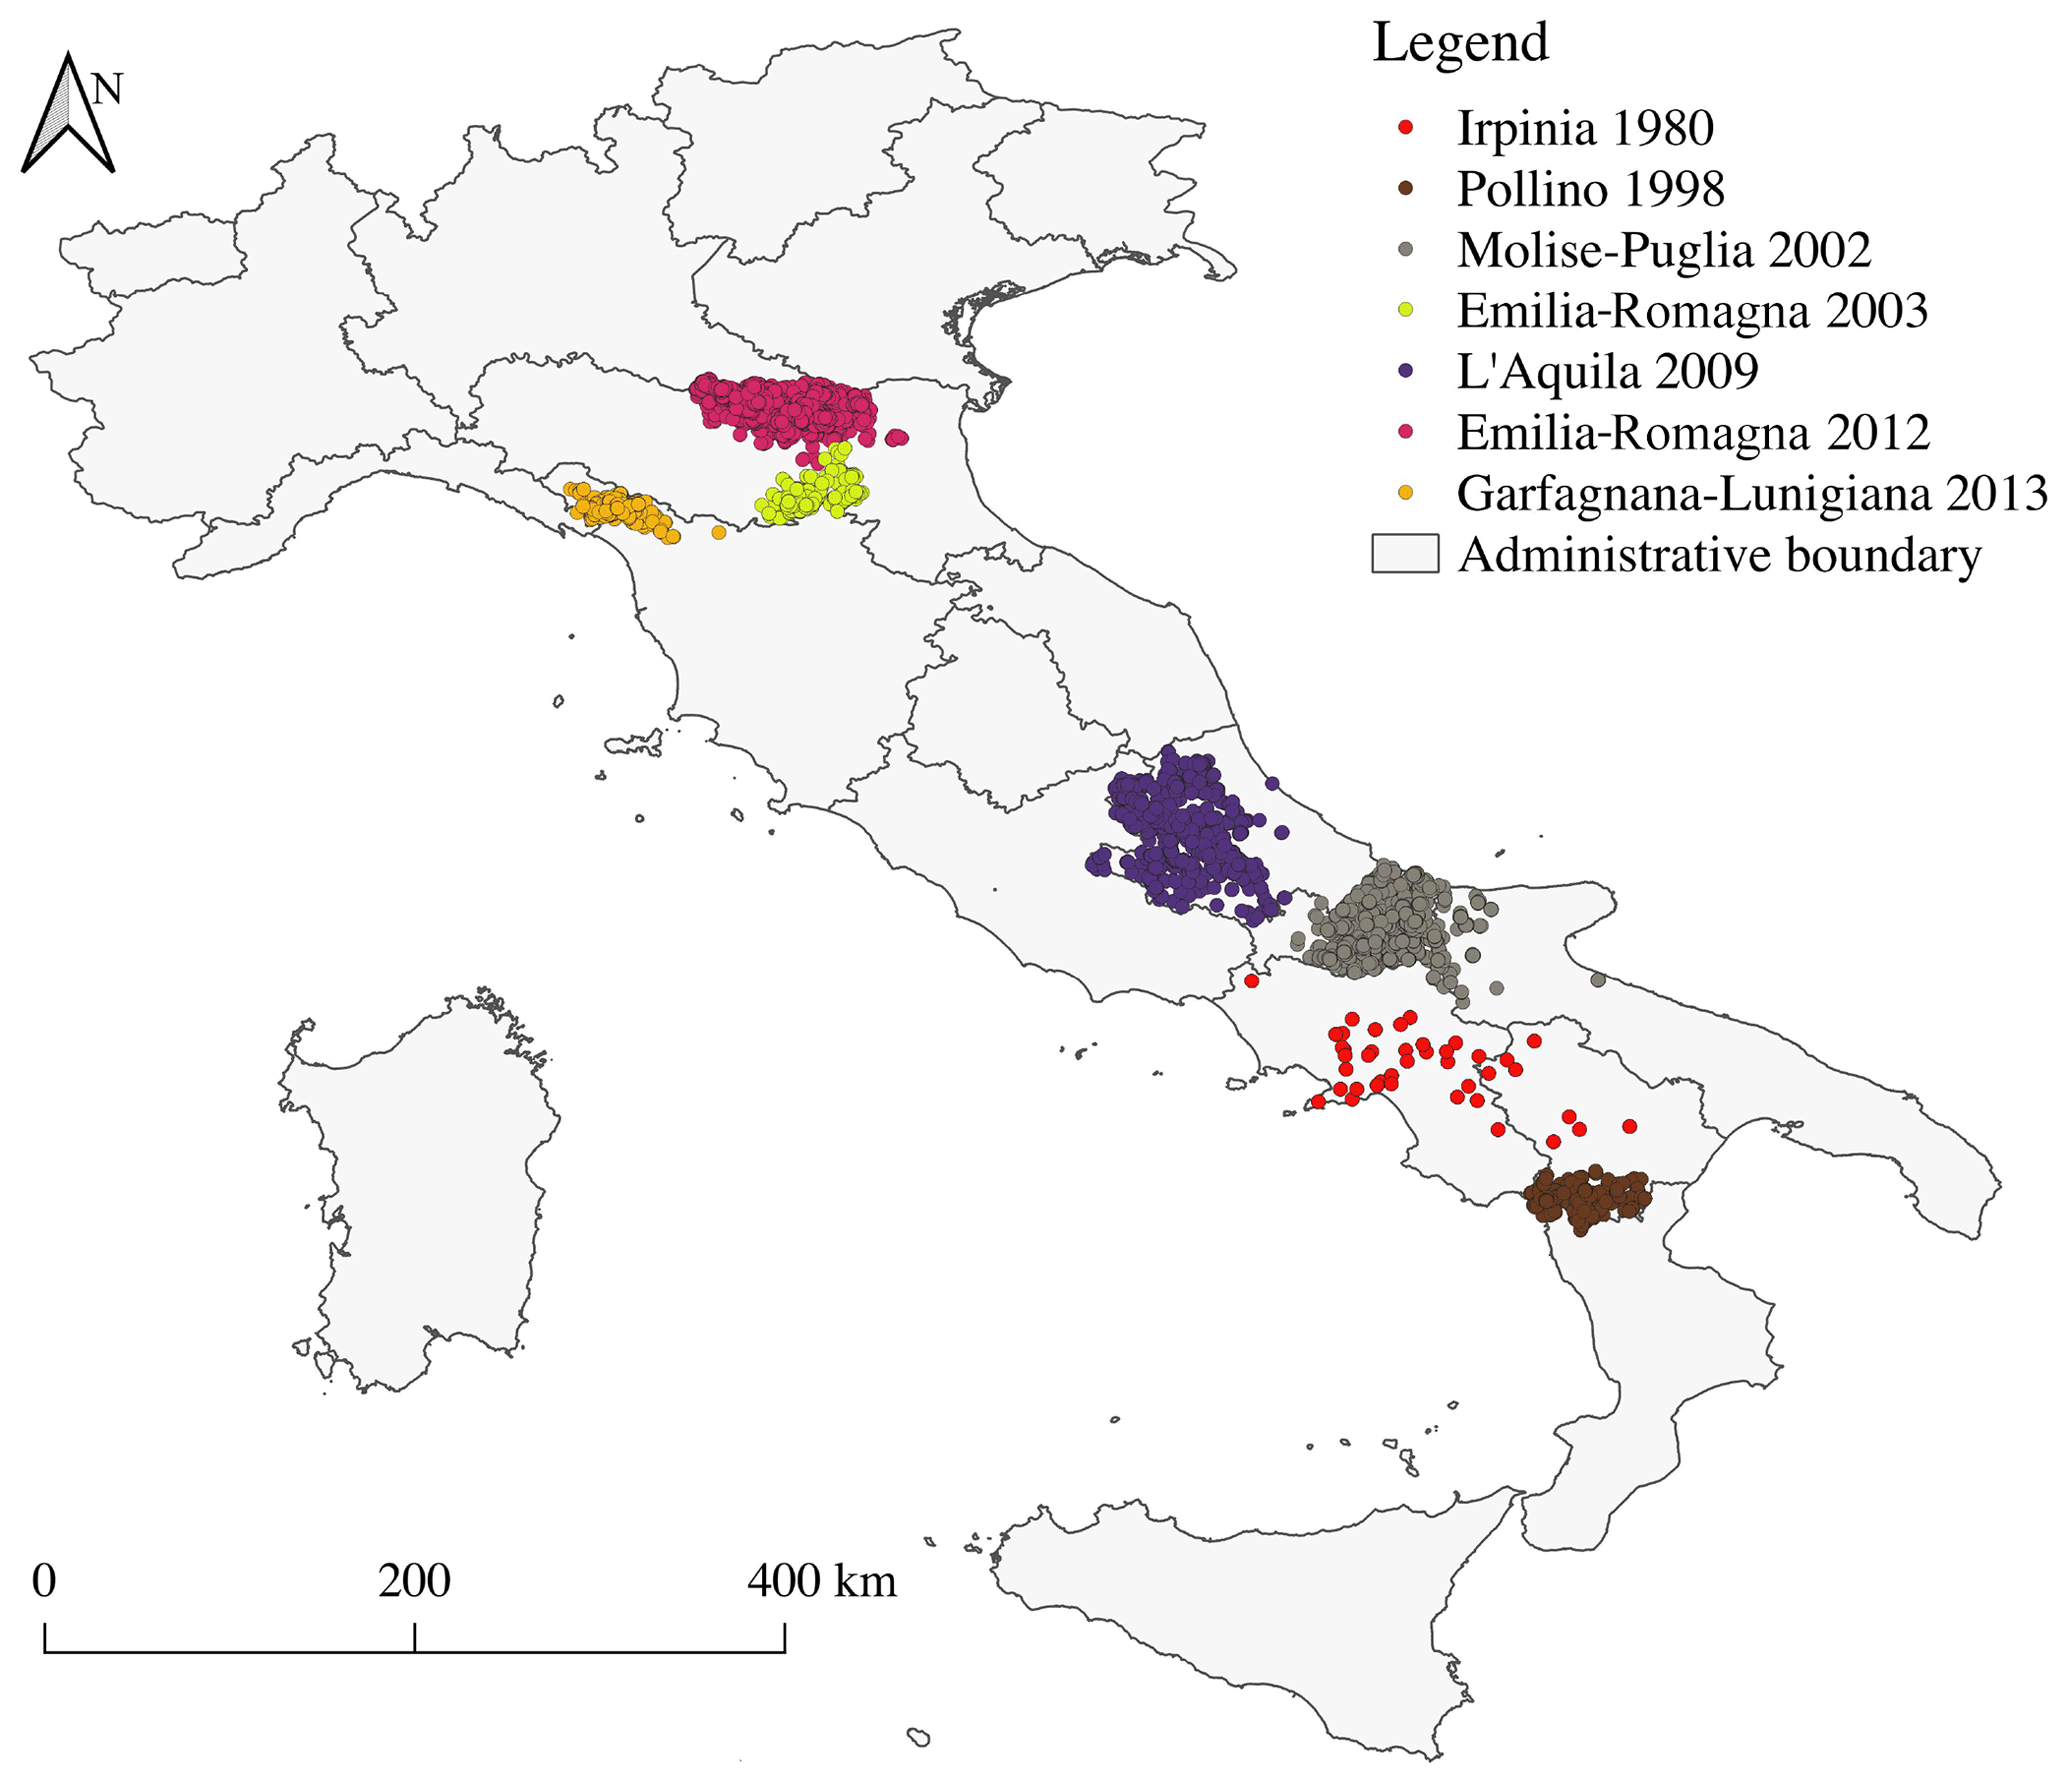
Figure 1Geographic location of the buildings considered in this study.
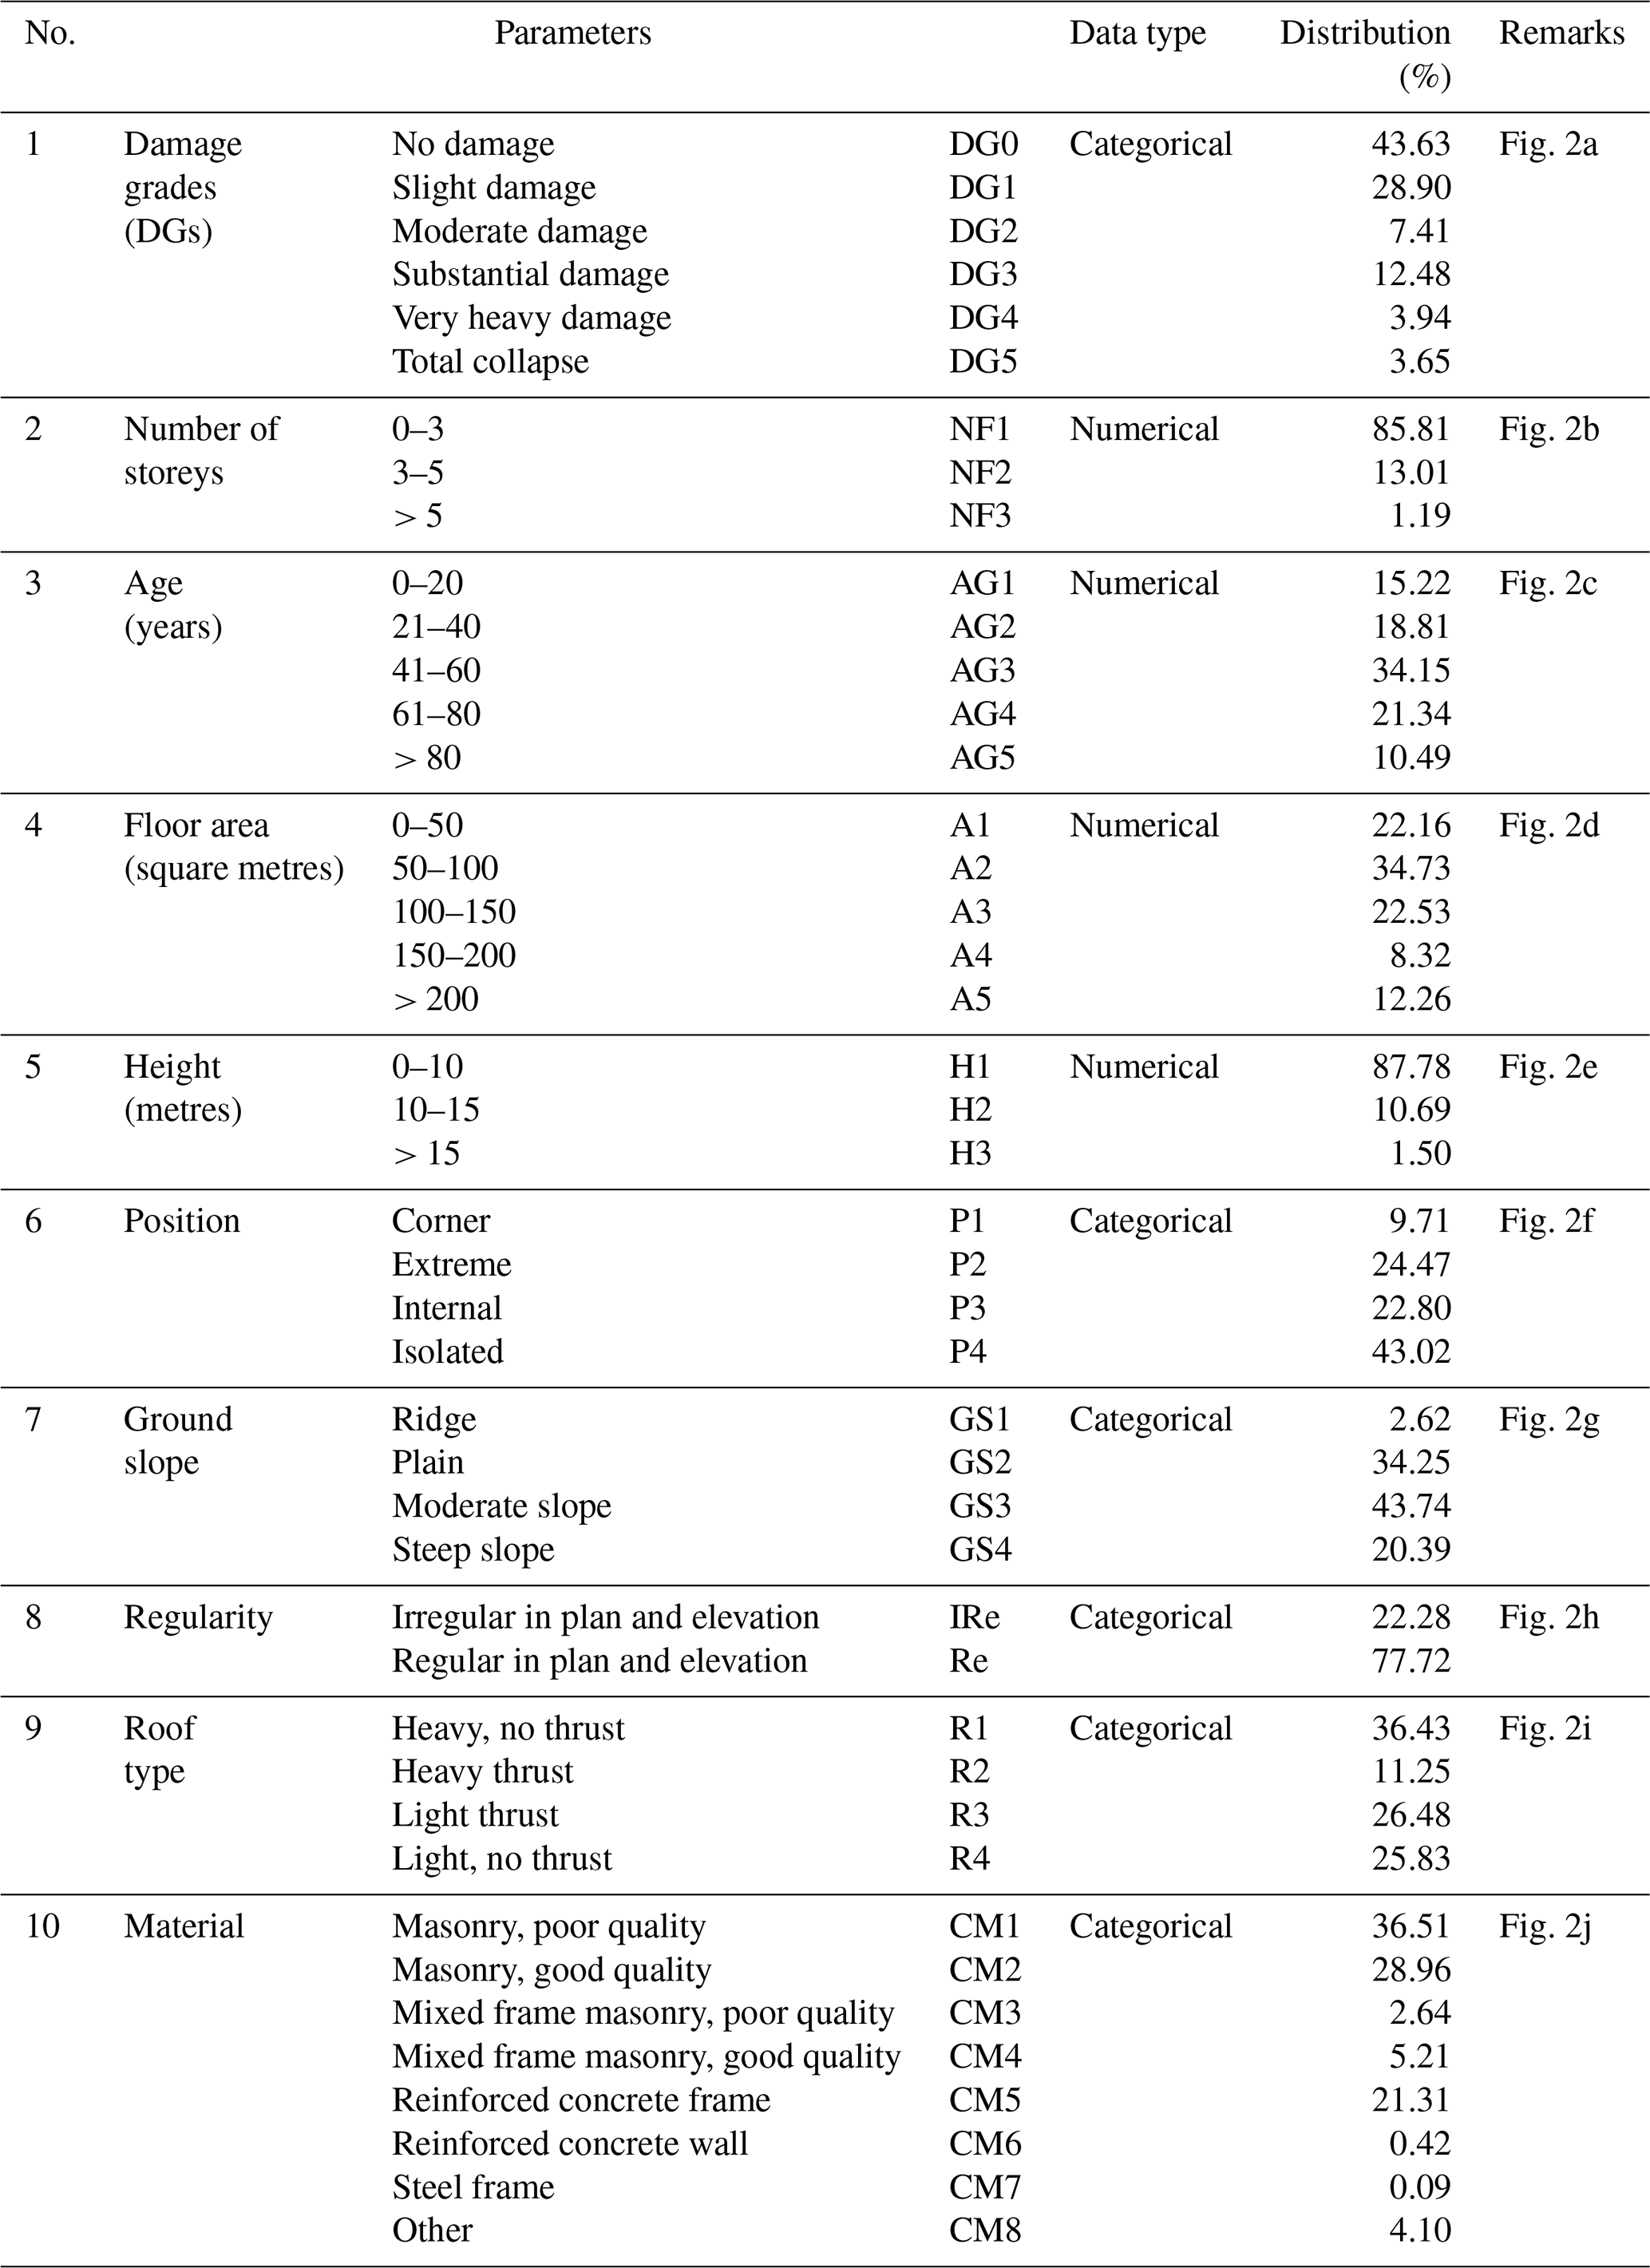
The converted EMS-98 damage grade (DG) ranges from damage grade DG0 (no damage) to DG5 (total collapse). The building features are available for each individual building and relate to the shape and design of the building and the built-up environment (Table 2, Fig. 2) as follows:
-
building location – defined by its latitude and longitude, assigned using either the exact address of the building if available or the address of the local administrative centre (Dolce et al., 2019);
-
number of storeys – total number of floors above the surface of the ground;
-
age of building – time difference between the date of the earthquake and the date of building construction/renovation;
-
height of building – total height of the building above the surface of the ground, in metres;
-
floor area – average of the storey surface area, in square metres;
-
ground slope condition – four types of ground slope conditions (flat, mild slope, steep slope, and ridge);
-
roof type – four types of roofs (thrusting heavy roof, non-thrusting heavy roof, thrusting light roof, and non-thrusting light roof);
-
position of building – indication of the building's position in the block (isolated, extreme, corner, and intermediate);
-
regularity – building regularity in terms of plan and elevation, classified as either irregular or regular;
-
construction material – vertical elements of good- and poor-quality masonry, good- and poor-quality mixed frame masonry, reinforced concrete frame and wall, steel frame, and other.
For features defined as value ranges (e.g. date of construction/renovation, floor area, and building height), the average value was used. Furthermore, the Irpinia 1980 building damage portfolio (E1) was constructed using the specific Irpinia 1980 damage survey form, while the AeDES damage survey form was used for the others. The Irpinia 1980 dataset will therefore be analysed separately.
Table 2Distribution of the different features used in this study.
Building damage data from earthquake surveys other than the Irpinia 1980 earthquake damage survey primarily include damaged buildings. This is because the data were collected based on requests for damage assessments after the earthquake event (Dolce et al., 2019). The damage information in the DaDO database is still relevant for testing the machine learning models for heuristic damage assessment. Mixing these datasets to train machine learning models can lead to biased outcomes. Therefore, the machine learning models were developed on the other earthquake dataset excluding the Irpinia dataset, and the Irpinia earthquake dataset was used only in the testing phase.
The distribution of the samples is very imbalanced (Fig. 2): for example, there is a small proportion of buildings in the DG4 + DG5 categories (7.59 %) and a large majority of masonry (65.47 %) compared to reinforced concrete frame (21.31 %) buildings. This imbalance should be taken into account when defining the machine learning models.
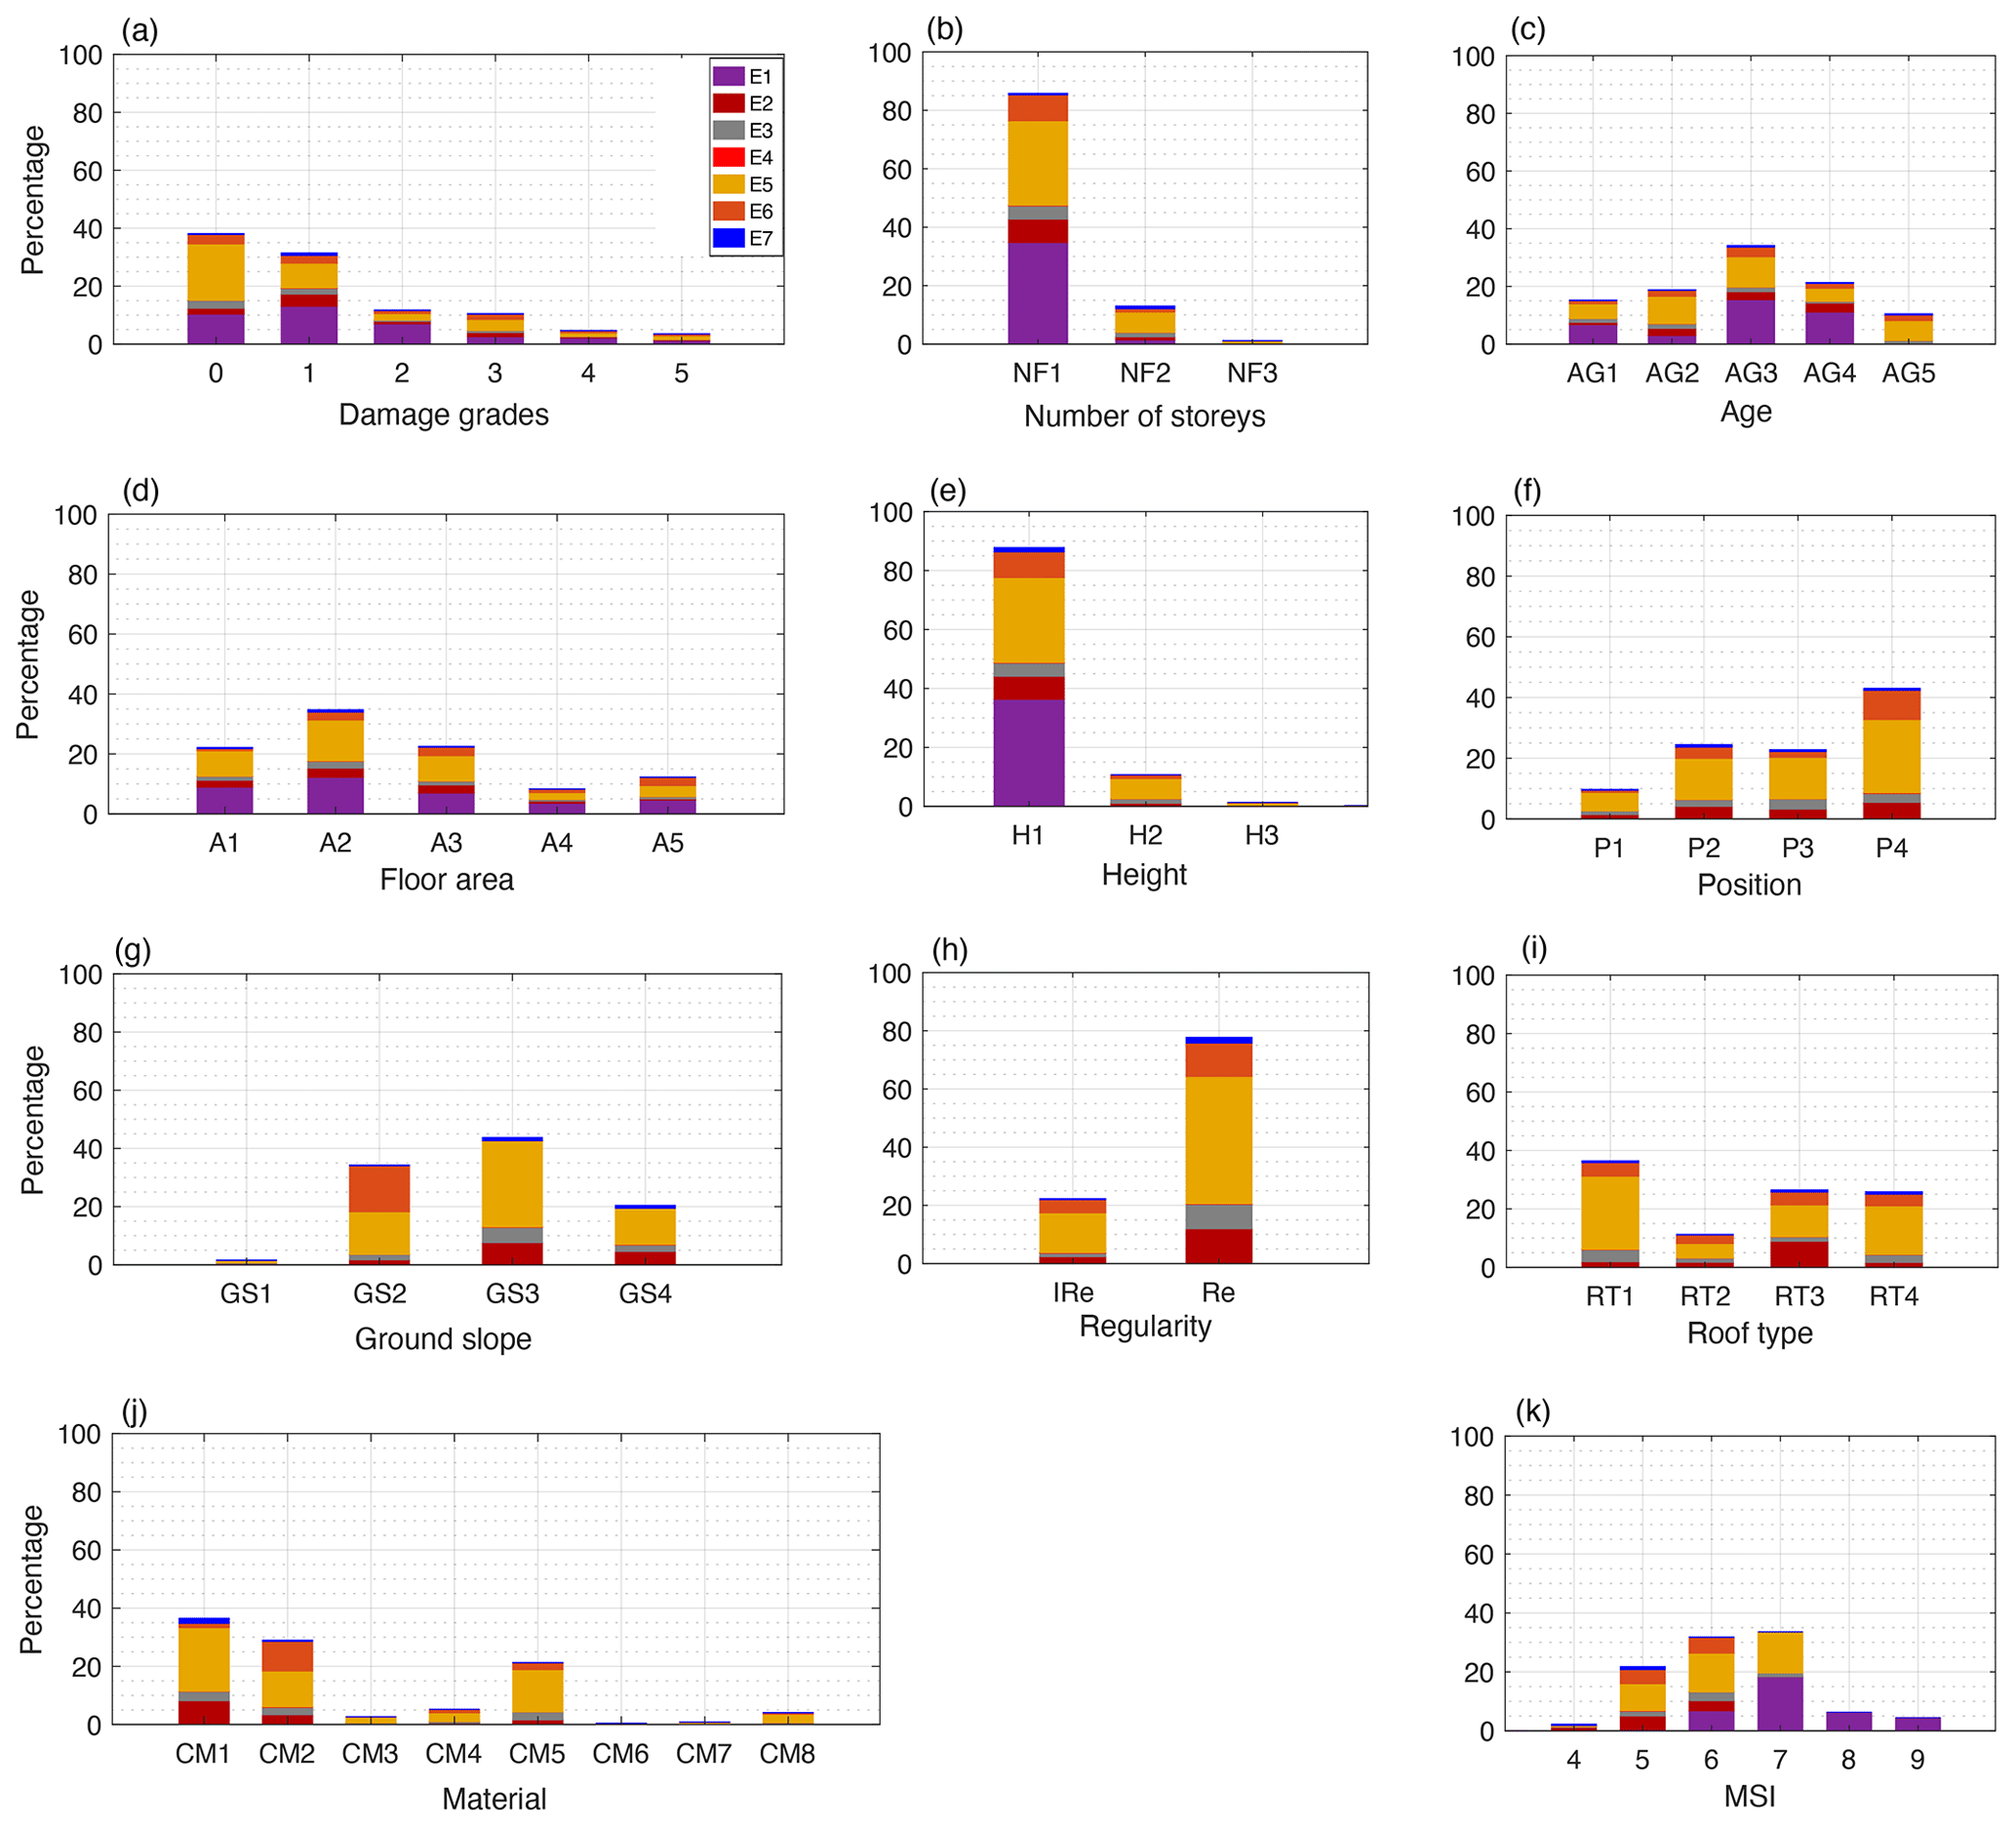
Figure 2Distribution of the different features in the database. E1, E2, E3, E4, E5, E6, and E7 represent Irpinia 1980, Pollino 1998, Molise–Puglia 2002, Emilia-Romagna 2003, L'Aquila 2009, Emilia-Romagna 2012, and Garfagnana–Lunigiana 2013 building damage portfolios, respectively. The y axis is the percentage distribution. and the x axis is (a) damage grade, (b) number of storeys (NF1: 0–3, NF2: 3–5, NF3: > 5 storeys), (c) building age (AG1: 0–20, AG2: 21–40, AG3: 41–60, AG4: 61–80, AG5: > 80 years), (d) floor area (A1: 0–50, A2: 51–100, A3: 101–150, A4: 151–200, A5: > 200 m2), (e) height (H1: 0–10, H2: 10–15, H3: > 15 m), (f) building position (P1: corner, P2: extreme, P3: internal, P4: isolated), (g) ground slope condition (GS1: ridge, GS2: plain, GS3: moderate slope, GS4: steep slope), (h) regularity in plan and elevation (IRe: irregular, Re: regular), (i) roof type (RT1: heavy, no thrust, RT2: heavy thrust, RT3: light, no thrust, RT4: light thrust), (j) construction material (CM1: poor-quality masonry, CM2: good-quality masonry, CM3: poor-quality mixed frame masonry, CM4: good-quality mixed frame masonry, CM5: reinforced concrete frame, CM6: reinforced concrete wall, CM7: steel frames, CM8: other), and (k) macroseismic intensity.
To consider spatially distributed ground motion, the original DaDO data are supplemented with the main-event macroseismic intensities (MSIs) provided by the United States Geological Survey (USGS) ShakeMap tool (Wald et al., 2005). MSIs given in terms of modified Mercalli intensities are considered and assigned to buildings based on their location. The distribution of MSI values in the database is shown in Fig. 2k.
3.1 Machine learning models
Ghimire et al. (2022) applied classification- and regression-based machine learning models to the damage observed after the 2015 Gorkha earthquake, Nepal (NPC, 2015). The main concepts for method selection, the definition of the dataset for training and testing, and the representation of model performance are presented here.
To develop the heuristic damage assessment model, the damage grades are considered the target feature. The damage grades are discrete labels, from DG0 to DG5. The three most advanced classification and regression machine learning algorithms were selected: random forest (RFC) and random forest regression (RFR) (Breiman, 2001), gradient boosting classification (GBC) and gradient boosting regression (GBR) (Friedman, 1999), and extreme gradient boosting classification (XGBC) and extreme gradient boosting regression (XGBR) (Chen and Guestrin, 2016). A label (or class) was thus assigned to the categorical response variables (DG) for the classification-based machine learning models. For the regression-based machine learning models, DG is converted into a continuous variable to minimize misclassifications (Ghimire et al., 2022). For the regression-based machine learning models, DG is converted into a continuous variable as tested by Ghimire et al. (2022): first, the damage grades were ordered and considered a continuous variable ranging between 0 (DG0) and 5 (DG5). Because the regression model outputs a real value between 0 and 5 and not an integer, we rounded the output (real number) to the nearest integer to plot the confusion matrix. However, the error matrices were computed without rounding the model outputs to the nearest integer.
Building features and macroseismic intensities were considered input features. A one-hot encoding technique was used to convert the categorical features (i.e. ground slope condition, building position, roof type, construction material) into binary values (1 or 0), resulting in 28 input variables (Table 2). No input features were removed from the dataset: some building features (e.g. number of storeys and height) may be correlated, but we assumed that the presence of correlated features does not impact the overall performance of these machine learning methods (Ghimire et al., 2022). No specific data cleaning methods were applied to the DaDO database.
The machine learning algorithms from the scikit-learn package developed in Python (Pedregosa et al., 2011) were applied. The machine learning models were trained and tested on the randomly selected training (60 % of the dataset) and testing (40 % of the dataset) subsets of data, considering a single earthquake dataset or the whole DaDO dataset. The testing subset was kept hidden from the model during the training phase.
3.2 Machine learning model efficacy
The efficacy of the heuristic damage assessment model (i.e. its ability to predict damage to a satisfactory or expected degree) was analysed in three stages: comparison of the efficacy of the machine learning models using metrics, analysis of specific issues related to machine learning using the selected models, and application of the heuristic model to the whole DaDO dataset.
3.2.1 First stage: model selection
In the first stage, only the L'Aquila 2009 portfolio was considered for the training and testing phases. This is the largest dataset in terms of the number of buildings and was obtained using the AeDES survey format (Baggio et al., 2007; Dolce et al., 2019). Model efficacy was provided by a confusion matrix, which represents model prediction compared with the so-called “ground truth” value. Accuracy was then represented on the confusion matrix by the ratio of the number of correctly predicted DGs to the total number of observed values per DG (ADG).
Total accuracy (AT) was computed as the ratio of the number of correctly predicted DGs to the total number of observed values. AT and ADG values close to 1 indicate high efficacy. Moreover, the quantitative statistical error was also calculated as the mean of the absolute value of errors (MAE) and the mean squared error (MSE) (MAE and MSE values close to 0 indicate high efficacy). For classification-based machine learning models, the ordinal value of the DG was used to calculate the MAE and MSE scores directly. For the regression-based machine learning models, the output DG values were rounded to the nearest integer for the accuracy scores plotted for the confusion matrix but not for the MAE and MSE value calculations.
3.2.2 Second stage: machine-learning-related issues
In the second stage, the best heuristic model for damage assessment was selected based on the highest efficacy and used to analyse and test specific issues related to machine learning: (1) the imbalance distribution of DGs in DaDO; (2) the performance of the selected model when only some basic, but accurately assessed, building features are considered (i.e. number of storeys, location, age, floor area); and (3) the simplification of the heuristic model, in the sense that DGs are grouped into a traffic-light-based classification (i.e. green, yellow, and red, corresponding to DG0 + DG1, DG2 + DG3, and DG4 + DG5, respectively). In the second stage, the issues related to machine learning were first analysed using the L'Aquila 2009 portfolio. The whole DaDO dataset was then used.
3.2.3 Third stage: application to the whole DaDO portfolio and comparison with RISK-UE
In the third stage, several learning and testing sequences were considered, with the idea of moving to an operational configuration in which past information is used to predict damage from future earthquakes: either learning based on a portfolio of damage caused by one earthquake and tested on another portfolio or learning based on a series of damage portfolios and tested on the portfolio of damage caused by an earthquake placed in the chronological continuity of the earthquake sequence considered. In this stage, the efficacy of the heuristic damage assessment model was analysed by comparing the prediction values with the so-called ground truth values through the error distribution as follows:
where ne is the total number of buildings at a given error level (difference between observed and predicted DGs) and N is the total number of buildings in the damage portfolio.
In this stage, the efficacy of the heuristic damage assessment model was compared with the conventional damage prediction framework proposed by the RISK-UE method (Milutinovic and Trendafiloski, 2003). The RISK-UE method assigns a vulnerability index (IV) to a building, based on its construction material and structural properties (e.g. height, building age, position, regularities, geographic location). For a given level of seismic demand (MSI), the mean damage (μd) and the probability (pk) of observing a given damage level k (k= 0 to 5) are given by
Herein, comparing the heuristic model and the RISK-UE method amounts to considering the following steps, based on the equations given by RISK-UE.
-
Step 1. The buildings in the training and testing datasets are grouped into different classes according to construction material.
-
Step 2. For a given building class in the training dataset, computation of the following is performed:
- -
Step 2.1. The mean damage (μd) using the observed damage distribution at a given MSI value is given by
- -
Step 2.2. The vulnerability index (IV) with the μd obtained in step 2.1 is given by
- -
-
Step 3. For the same building class in the test dataset, calculation of the following is performed:
- -
Step 3.1. The mean damage (μd) of Eq. (2) for a given MSI value with the value of IV obtained in step 2.2 is calculated.
- -
Step 3.2. The damage probability (pk) of Eq. (3) with the value of μd obtained in step 3.1 is calculated.
- -
Step 3.3. The distribution of buildings in each damage grade within a range of MSI values observed in the test dataset is calculated as
where nobs,MSI is the total number of buildings observed in the test set for a given MSI value.
- -
Step 3.4. The absolute error (εk) in each damage level k is given by
where Nobs,k is the total number of buildings observed in the given damage grade k.
- -
Similarly, the heuristic damage assessment model was also compared with the mean damage relationship (Eq. 4) applied to the test set. Thus, for each building class in the test set, the error value (Eq. 7) for each DG was computed from the μd of the observed damage using Eq. (4), the probability pk of obtaining a given DG k (k= 0 to 5) using Eq. (3), and the distribution of buildings in each DG Npred,k for a given MSI value using Eq. (6).
4.1 First stage: model selection
The efficacy of the regression (RFR, GBR, XGBR) and classification (RFC, GBC, XGBC) machine learning models trained and tested on the randomly selected 60 % (training set) and 40 % (test set) of the 2009-L'Aquila earthquake building damage portfolio is summarized in Table 3. The hyperparameters indicated in Table 3 were chosen after tests performed by Ghimire et al. (2022). The regression-based machine learning models RFR, GBR, and XGBR yielded similar MSE scores (1.22, 1.22, and 1.21) and accuracy scores (AT= 0.49, 0.50, and 0.50), considering the five DGs of the EMS-98 scale. In the confusion matrix (Fig. 3a: RFR, Fig. 3b: GBR, Fig. 3c: XGBR), the accuracy ADG values show that the efficacy of these models is higher for the lower DGs (around 60 % for DG0 and 55 % for DG1) and lower for the higher DGs (6 % and 1 % of the buildings are correctly classified in DG4 and DG5, respectively).
Table 3Summary of optimized hyperparameter parameters, accuracy AT, and quantitative statistical error values for the regression-based and classification-based machine learning methods in the test set. The parameters are the hyperparameters chosen for the machine learning models (the other model parameters not mentioned here are the default parameters in the scikit-learn documentation; Pedregosa et al., 2011). The best accuracy and error values are indicated in bold. The optimum hyperparameters were selected thanks to k-fold cross-validation (10-fold), by randomly selecting a percentage for training and percentage for testing, for different combinations of hyperparameters and the optimum evaluated in terms of performance metrics on testing is finally selected.
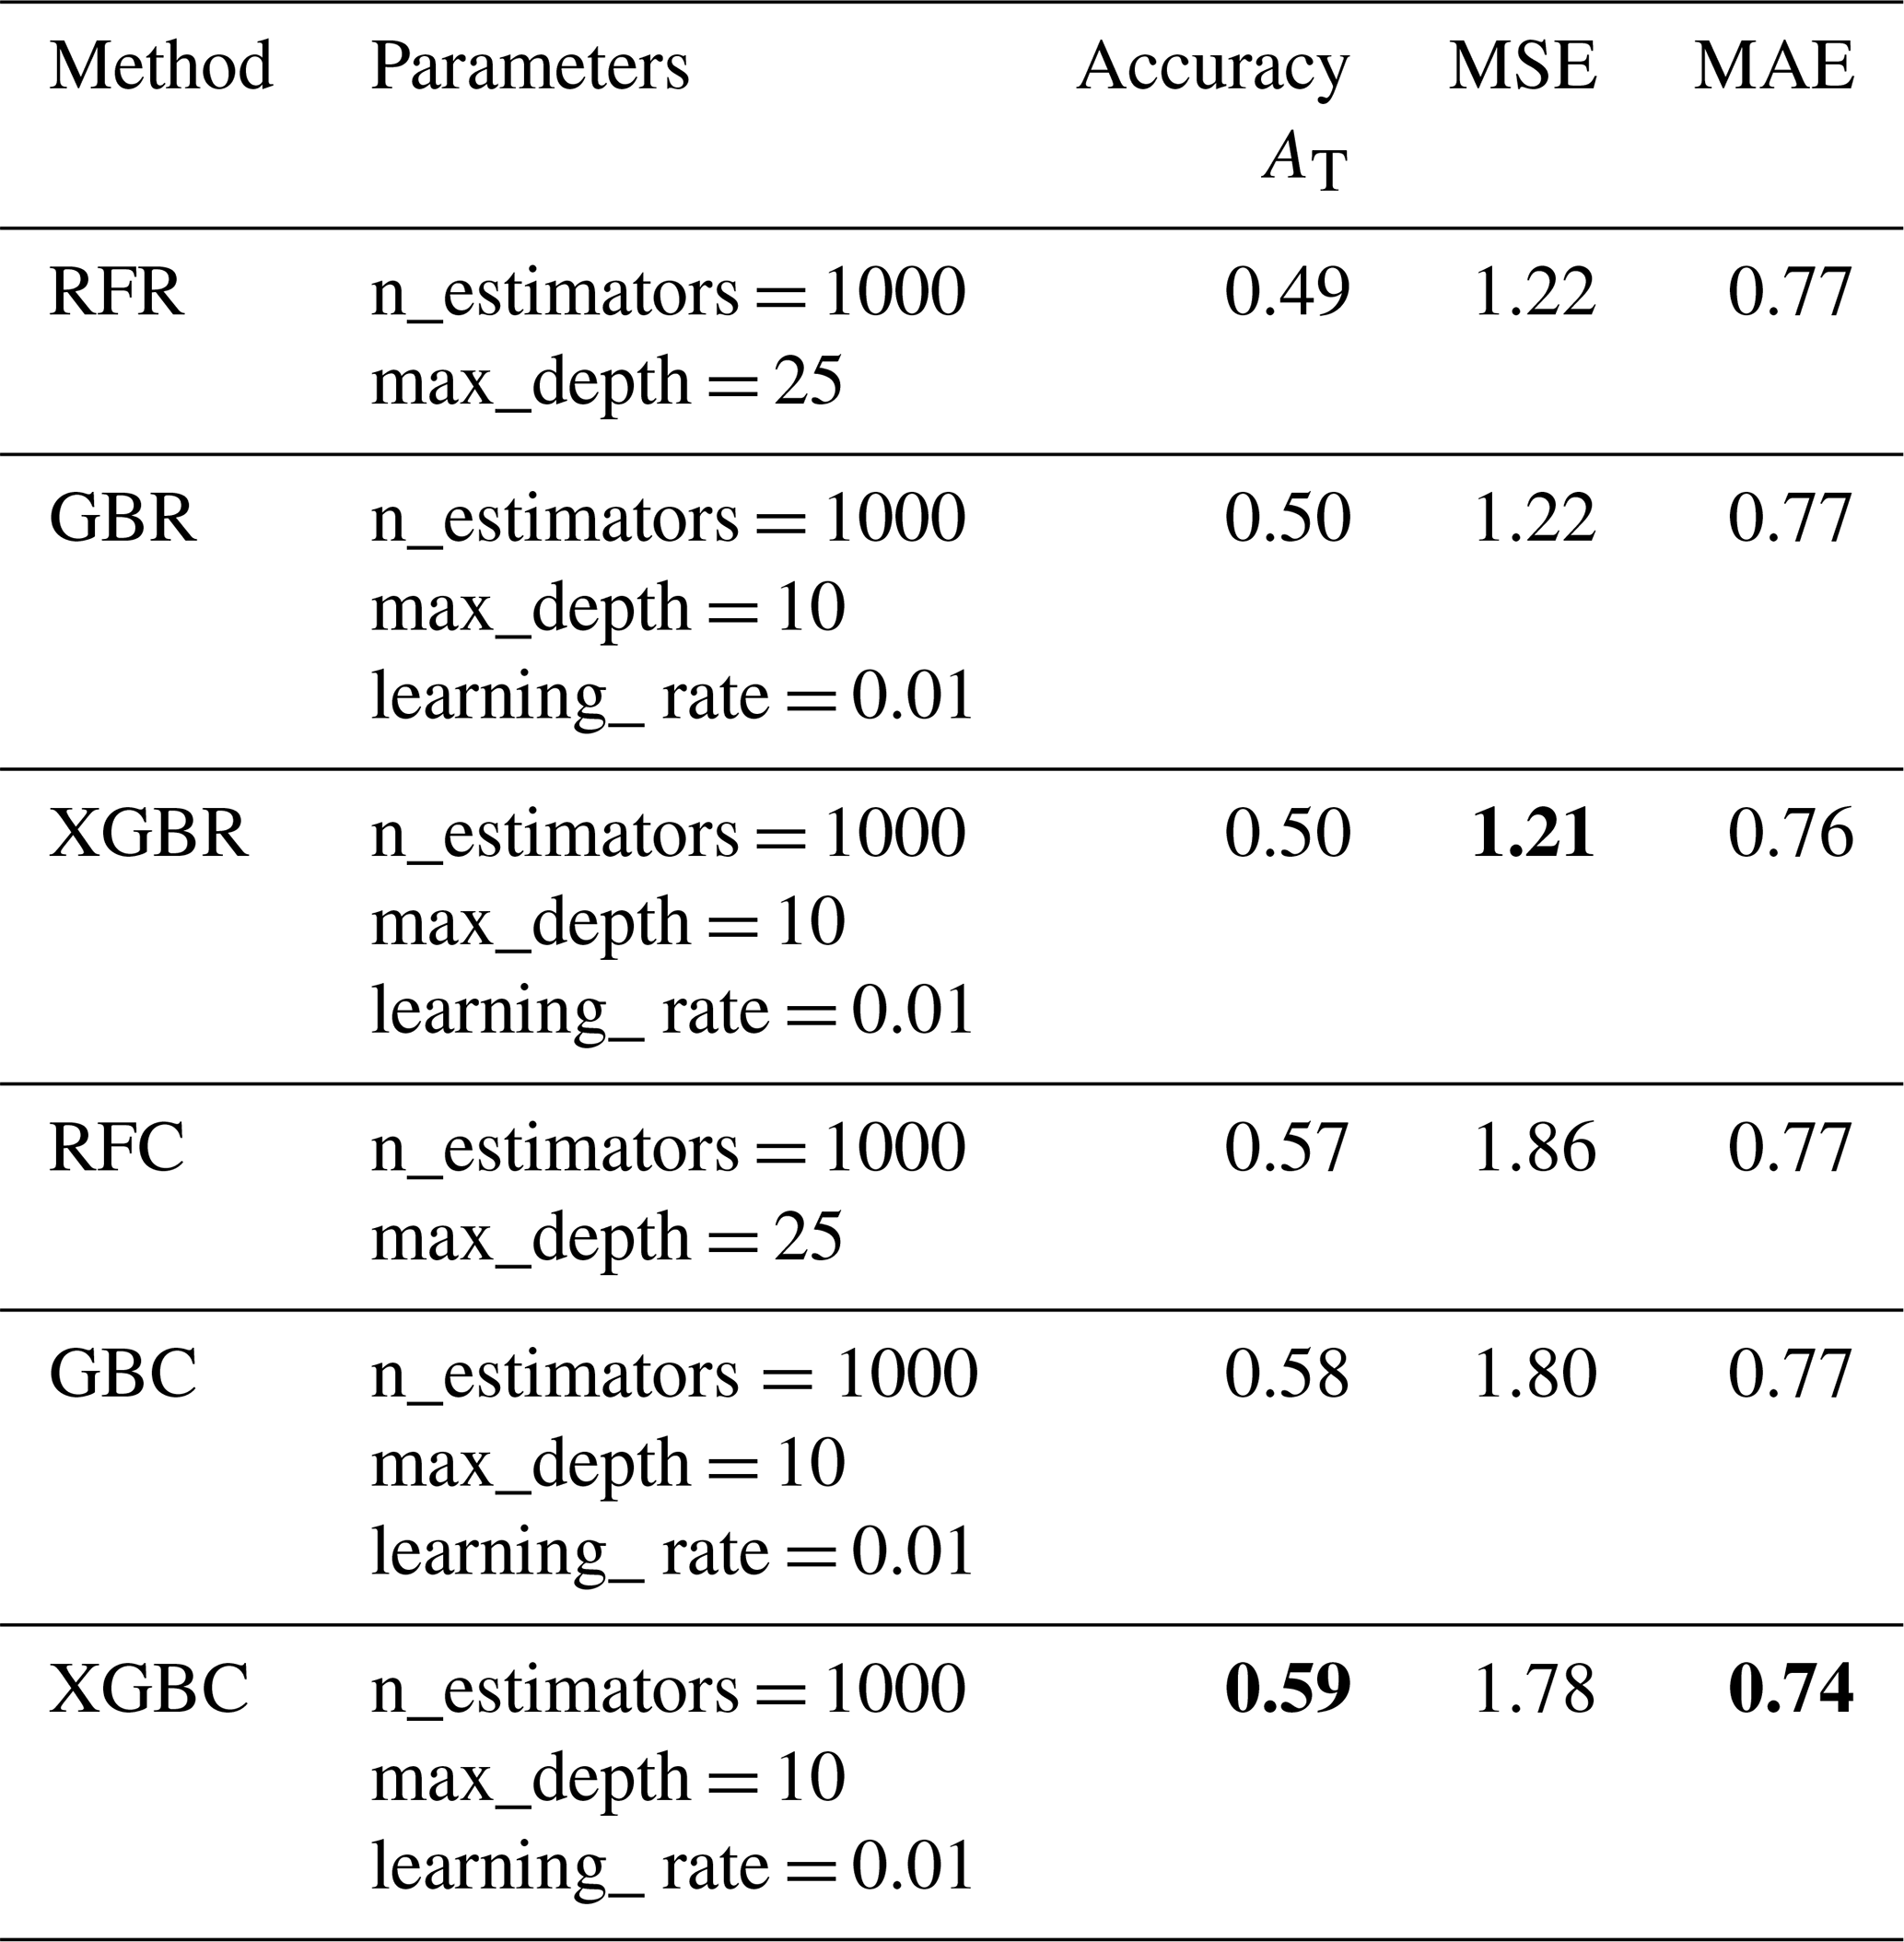
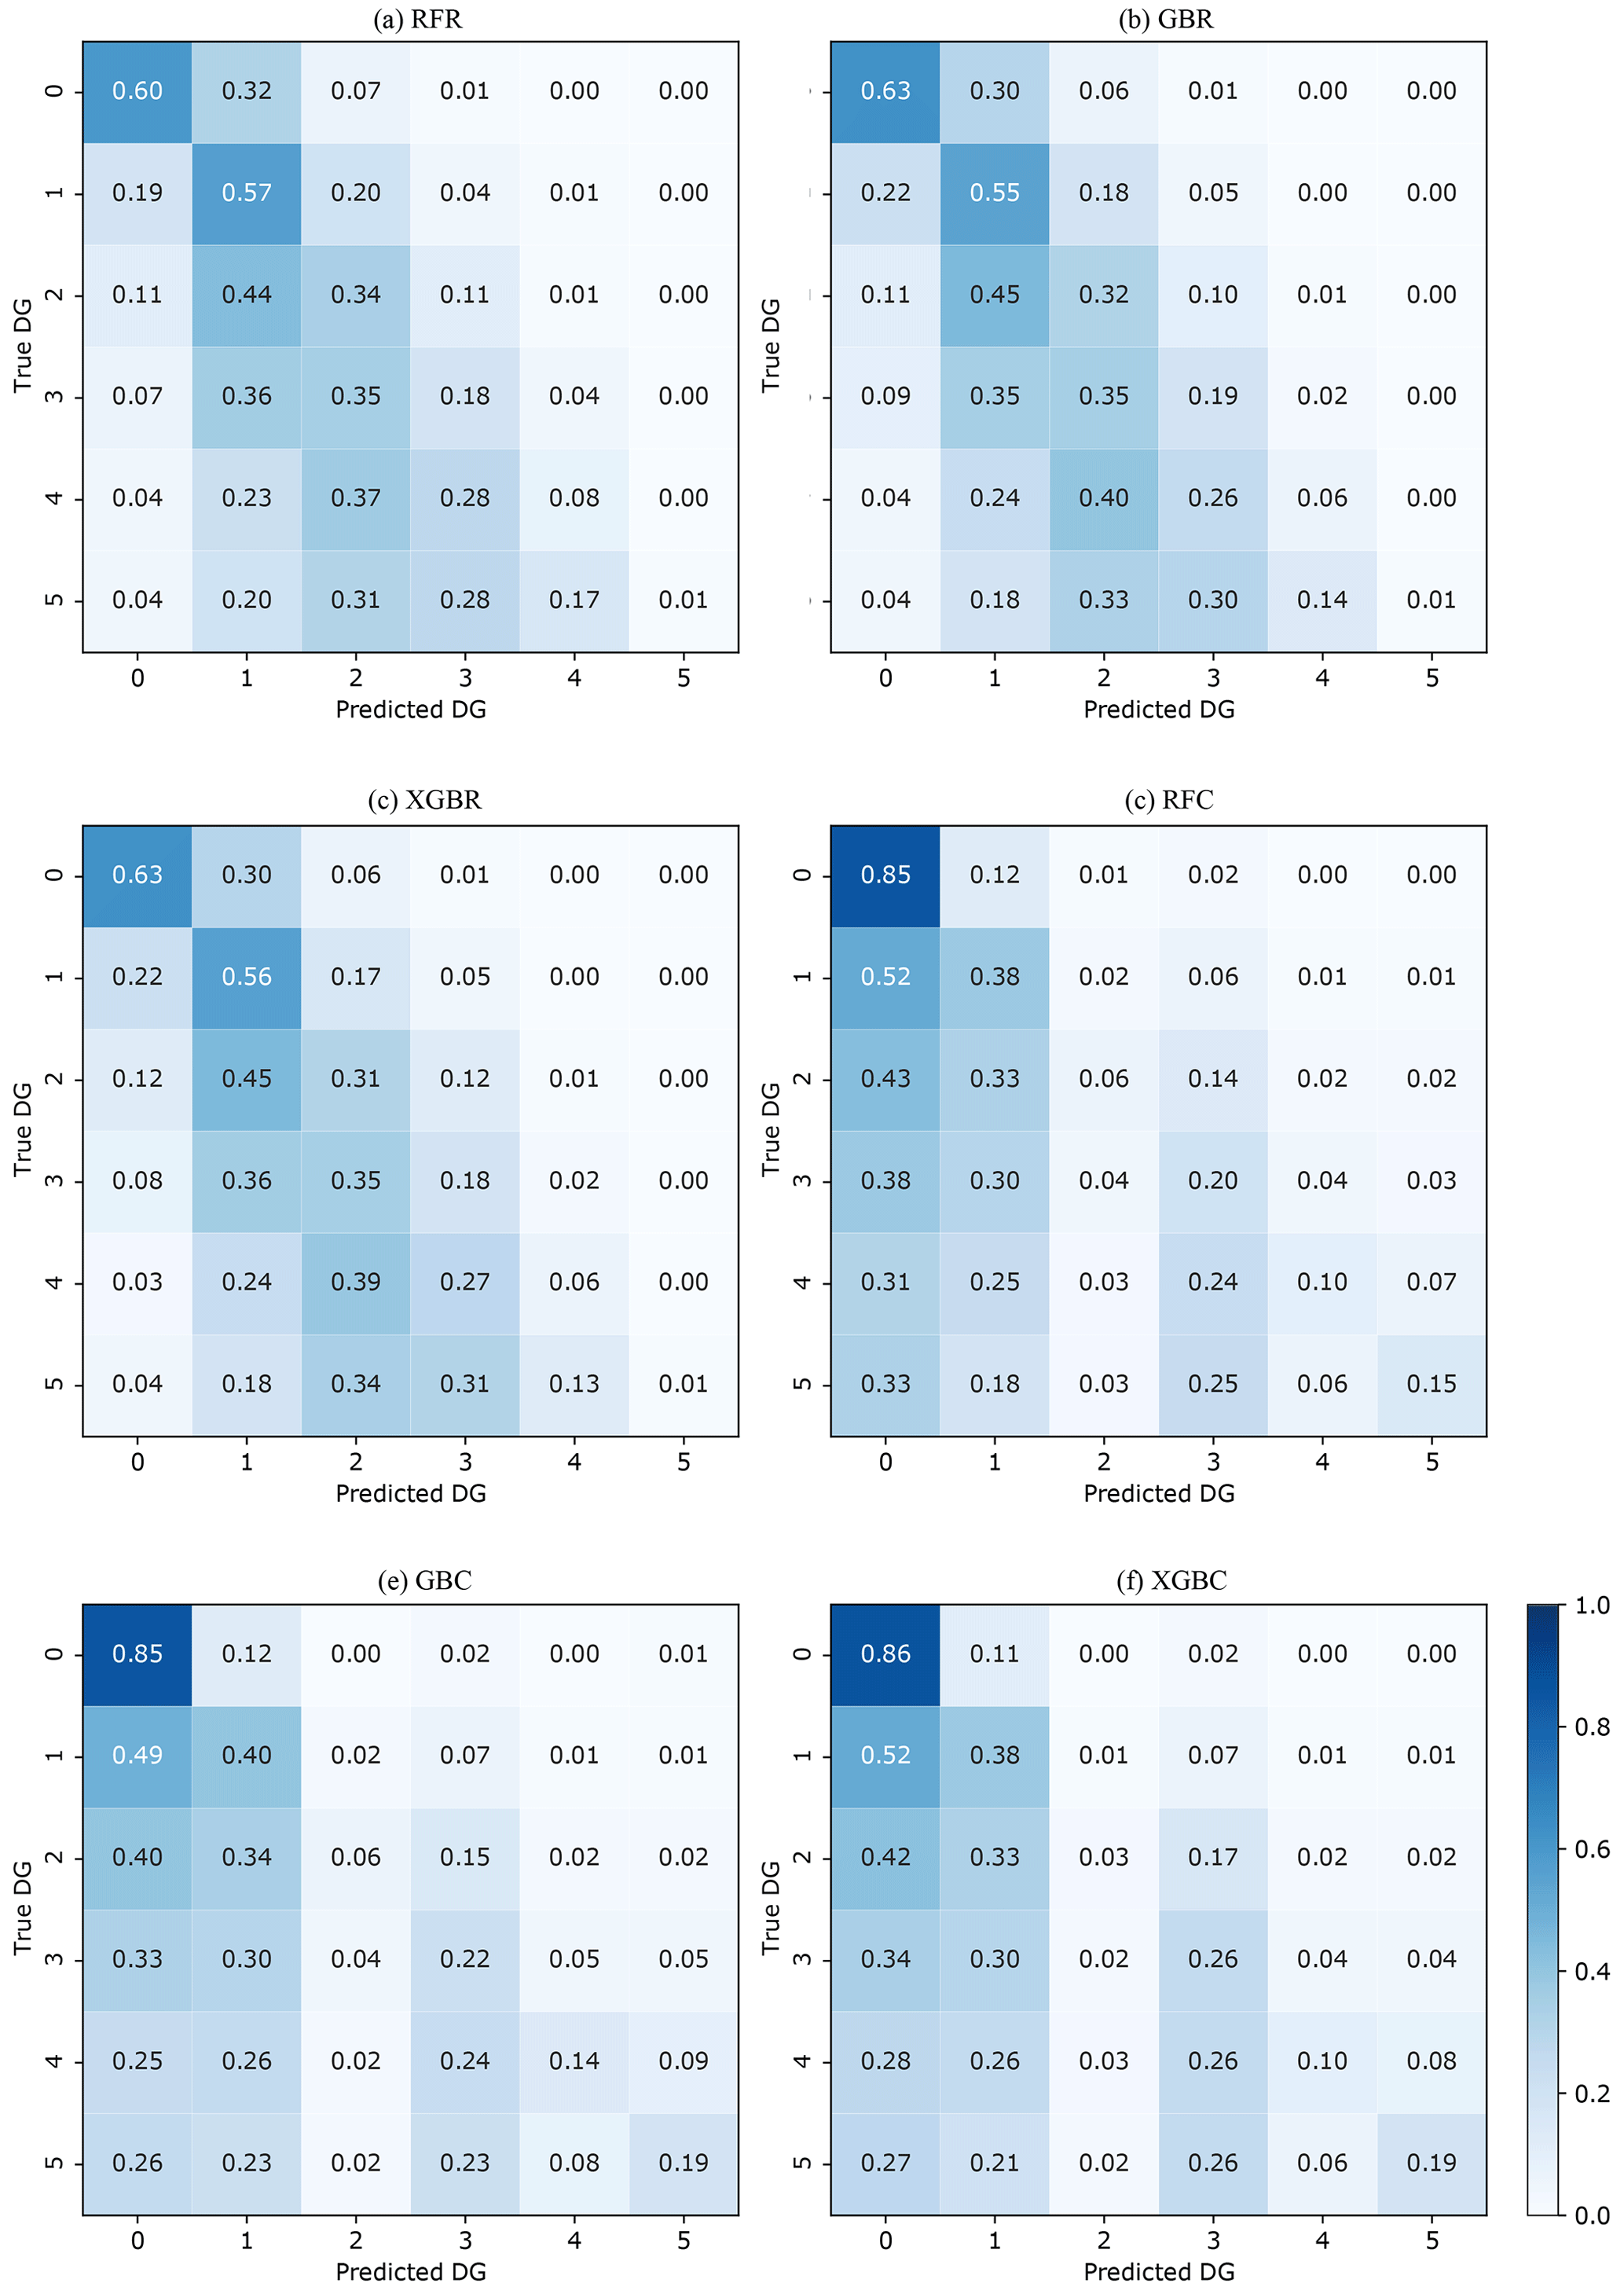
Figure 3Normalized confusion matrix between predicted and observed DGs. The values given in each main diagonal cell are the accuracy scores ADG. All values are also represented by the colour scale.
For the classification-based machine learning models, the XGBC model ([MSE, AT] = [1.78, 0.59]) was more effective than the RFC ([MSE, AT]= [1.86, 0.57]) and GBC ([MSE, AT] = [1.80, 0.58]) models, considering the EMS-98 scale. In the confusion matrix (Fig. 3d: RFC, Fig. 3e: GBC, Fig. 3f: XGBC), the accuracy ADG values also show higher model efficacy for the lower DGs (86 % for DG0 and 39 % for DG1) and lower efficacy for the higher DGs (5 %, 23 %, 12 %, and 17 % buildings correctly classified in DG2, DG3, DG4, and DG5, respectively).
The classification-based machine learning models thus yielded slightly better predictive efficacy, but it was still lower than in recent studies using other datasets (Ghimire et al., 2022; Harirchian et al., 2021; Mangalathu et al., 2020; Roeslin et al., 2020; Stojadinović et al., 2021). The high classification error in the higher DGs could be related to the characteristics of the building portfolio and the imbalance of DG distribution. Among the classification methods, the XGBC model showed slightly higher classification efficacy; the XGBC model was therefore selected for the next stages, stages 2 and 3.
4.2 Second stage: issues related to machine learning
4.2.1 Imbalance distribution of the DGs in DaDO
The efficacy of the heuristic damage assessment model depends on the distribution of target features in the training dataset. This can lead to low prediction efficacy, especially for minority classes (Estabrooks and Japkowicz, 2001; Japkowicz and Stephen, 2002; Branco et al., 2017; Ghimire et al., 2022). The previous section reports significant misclassification associated with the highest DGs for all classification- and regression-based models (Fig. 3), i.e. for the DGs with the lowest number of buildings (Fig. 2a). The efficacy of the XGBC model is analysed below, addressing the class-imbalance issue with data resampling techniques applied to the training phase and considering the L'Aquila 2009 portfolio.
Four strategies to solve the class-imbalance issue were tested:
- a.
random undersampling – randomly selecting the number of data entries in each class equal to the number of data entries in the minority class (DG4 in our case);
- b.
random oversampling – randomly replacing the number of data entries in each class equal to the number of data entries in the majority class (DG0 in our case);
- c.
the synthetic minority oversampling technique (SMOTE) – creating an equal number of data entries in each class by generating synthetic samples by interpolating the neighbouring data in the minority class;
- d.
a combination of oversampling and undersampling methods – oversampling of the minority class using the SMOTE method, followed by the edited nearest neighbours (ENN) undersampling method to eliminate data that are misclassified by their three nearest neighbours (SMOTE-ENN).
Figure 4 shows the confusion matrices of the four strategies considered for the class-imbalance issue. Compared with Fig. 3f (i.e. XGBC), the effects of addressing the issue of imbalance were as follows:
- a.
Undersampling (Fig. 4a). The ADG value increased by 20 %/22 %/26 % for DG2/DG4/DG5 and decreased by 29 % for DG0.
- b.
Oversampling (Fig. 4b). The ADG value increased by 11 %/16 %/18 % for DG2/DG4/DG5 and decreased by 13 % for DG0.
- c.
SMOTE (Fig. 4c). The ADG value increased by 4 %/1 %/4 % for DG2/DG4/DG5 and decreased by 3 % for DG0.
- d.
SMOTE-ENN (Fig. 4d). The ADG value increased by 13 %/9 %/8 % for DG2/DG4/DG5 and decreased by 25 % for DG0.
The AT, MAE, and MSE scores are given in Table 4 with the associated effects.
Table 4Scores of the accuracy AT, MSE, and MAE metrics in the test set considering the imbalance issue and their variation Δ compared with values without consideration of the imbalance.
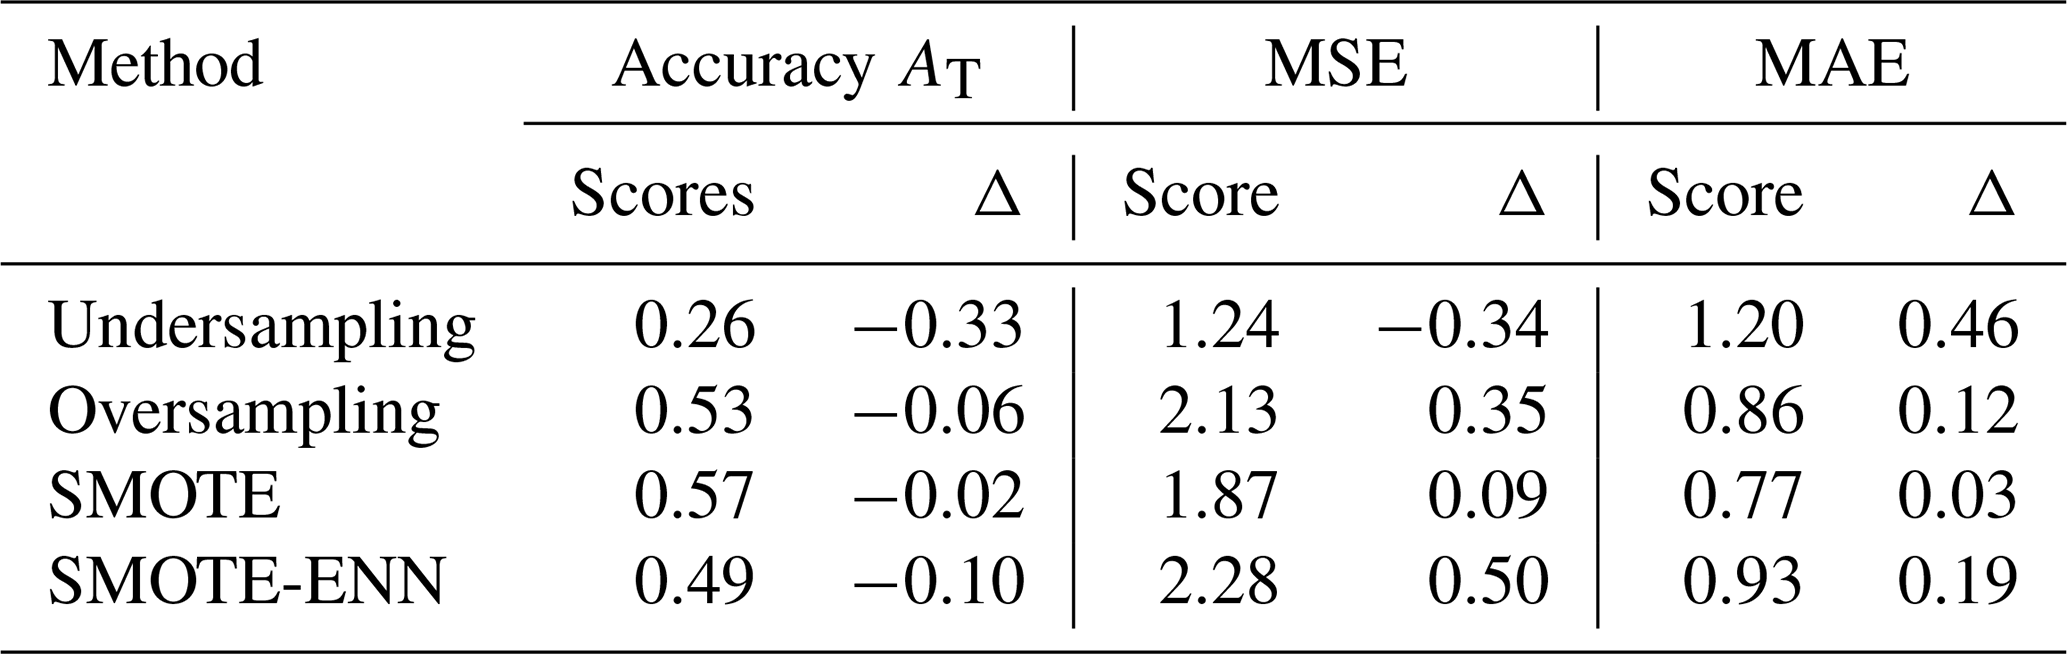
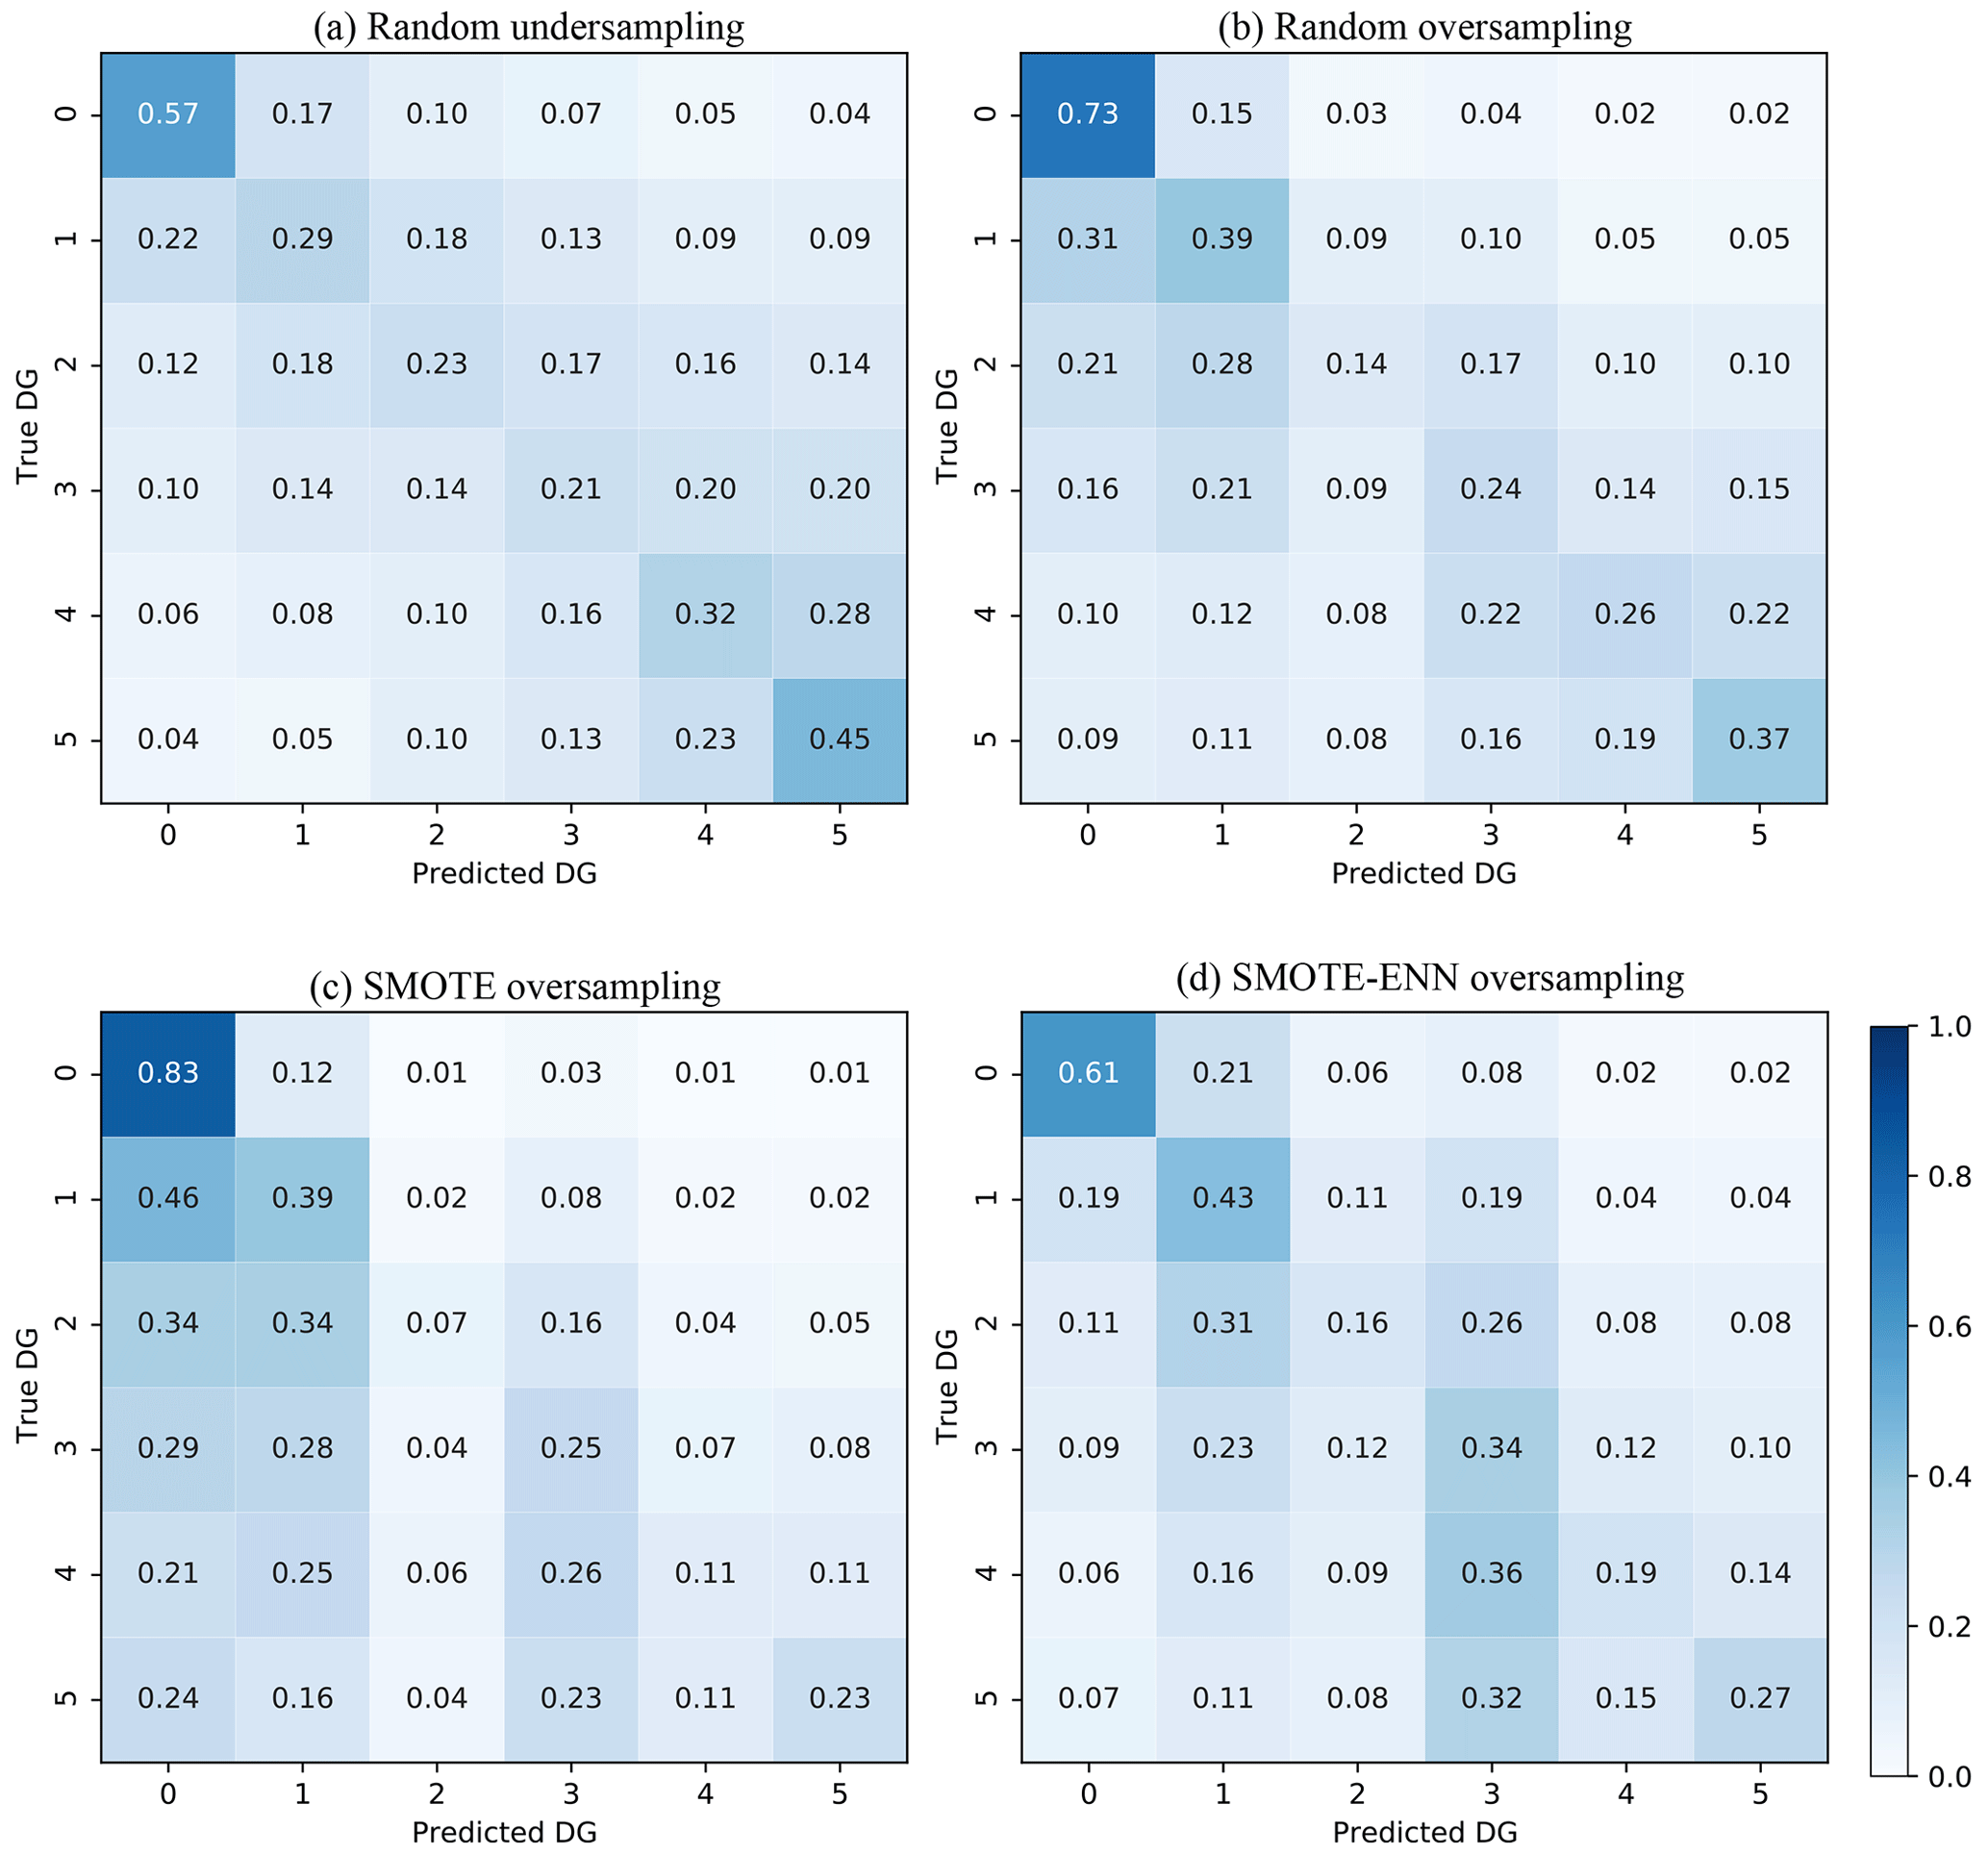
Figure 4Confusion matrices for the four methods to solve the DG imbalance issue in DaDO. The values given in each main diagonal cell are the accuracy scores ADG. All values are also represented by the colour scale.
In conclusion, the random oversampling method improves prediction in the minority class without significantly decreasing prediction in the majority class. The random oversampling method was therefore applied in this study.
4.2.2 Testing the XGBC model with basic features
This section begins by exploring the importance of each feature in the heuristic damage assessment model applied to the L'Aquila 2009 portfolio. We used the Shapley additive explanations (SHAP) method developed by Lundberg and Lee (2017). The SHAP method compares the efficacy of the model with and without considering each input feature to measure its average impact, provided in terms of mean absolute SHAP values.
Figure 5a shows the average SHAP value associated with each feature considered in this study as a function of DG. The most weighted features are building age, location (latitude and longitude), material (poor-quality masonry, reinforced concrete (RC) frame), MSI, roof type, floor area, and height. Interestingly, the mean SHAP values are dependent on the DG; i.e. the weight of the feature is not linear depending on the DG considered – this is never taken into account in vulnerability methods. For example, Scala et al. (2022) and Del Gaudio et al. (2021) observed a decrease in the vulnerability of structures as the construction year increases, without distinguishing the DG considered, which is not the case herein. Note also that the importance score associated with the location feature can indirectly capture variations in local geological properties and the spatially distributed vulnerability associated with the built-up area of the L'Aquila 2009 portfolio (e.g. the distinction between the historic town and more modern urban areas). Furthermore, the average SHAP value obtained for poor-quality masonry buildings for DG3, DG4, and DG5 confirms the same high vulnerability of this typology as in the EMS-98 scale (Grünthal, 1998), regardless of DG.
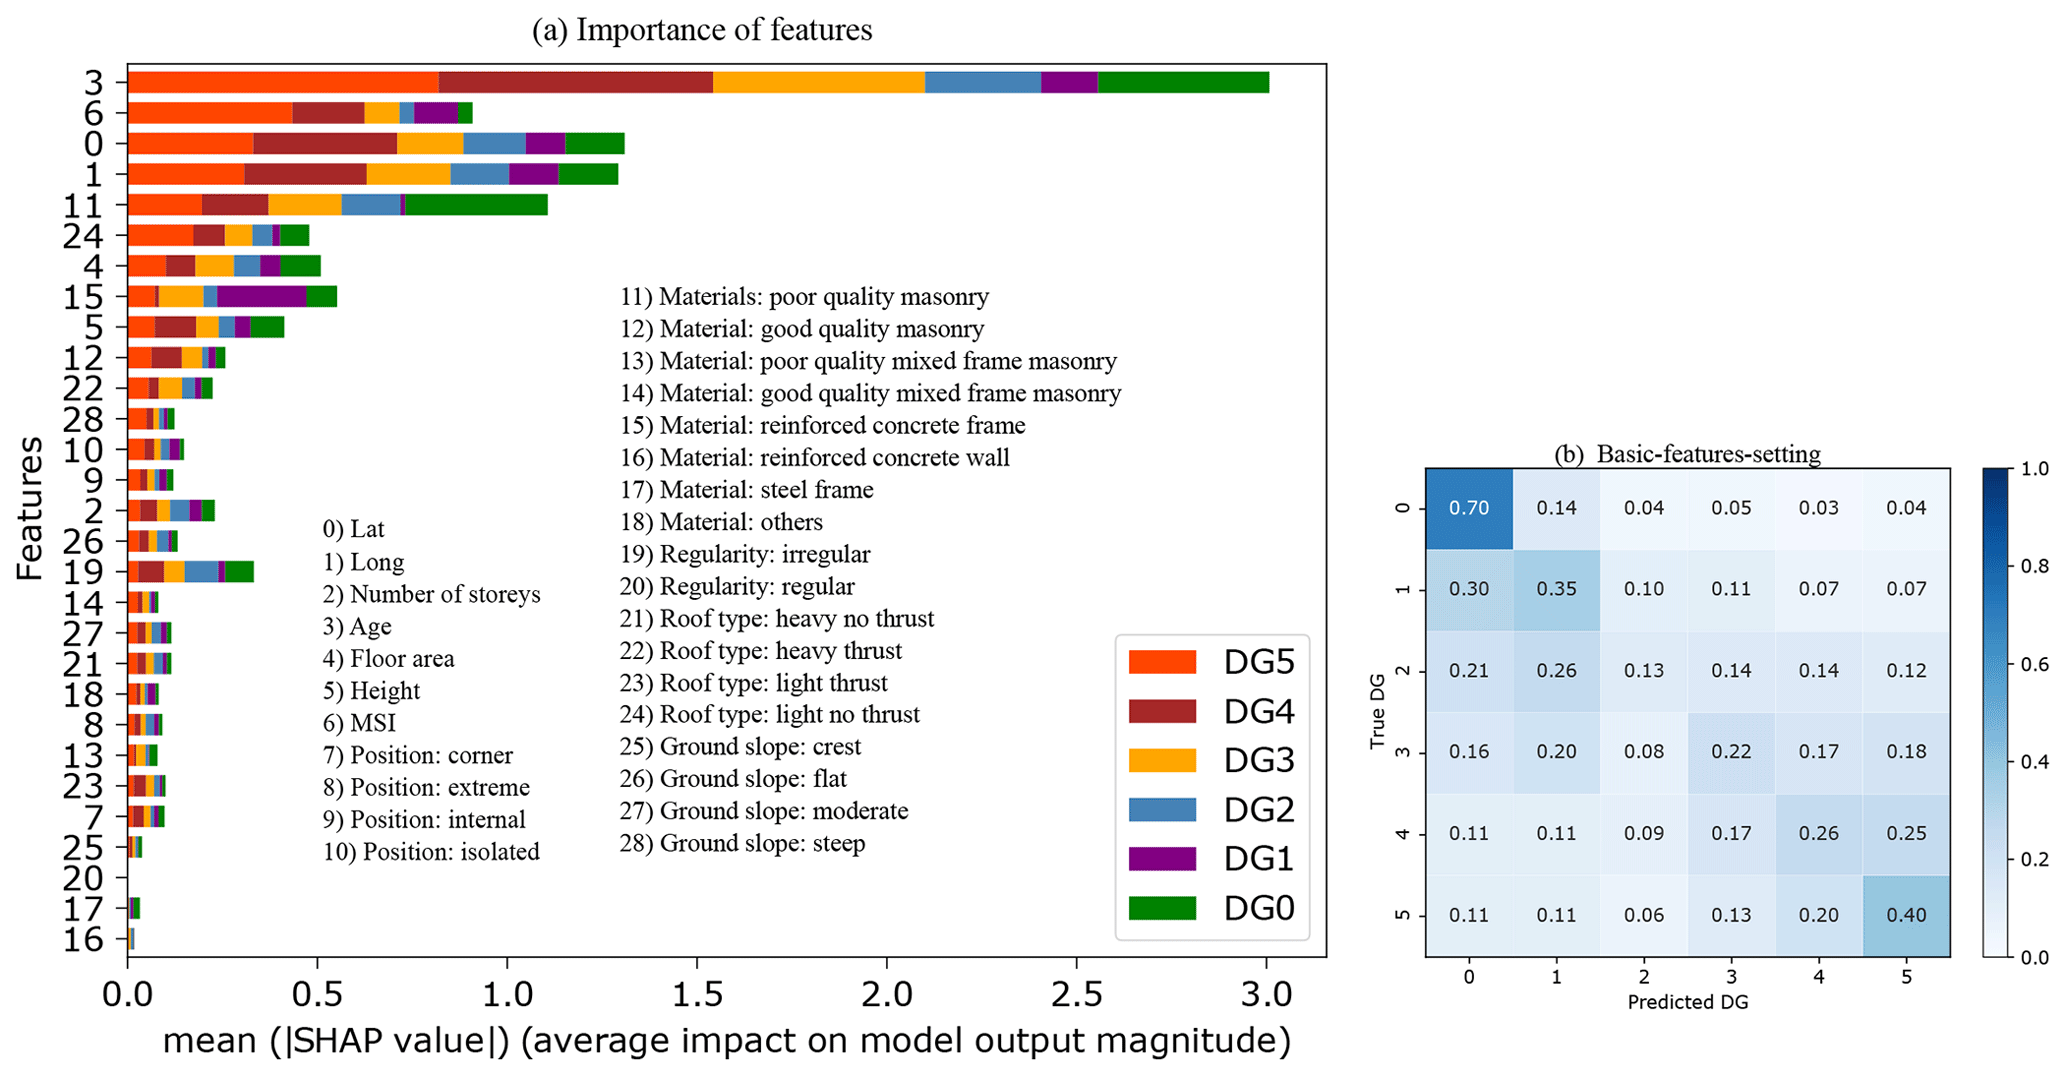
Figure 5(a) Graphic representation of the importance scores associated with the different input features considered for the XGBC model. The features (the same as in Fig. 2) considered in this study are on the y axis, and the x axis is the mean SHAP score according to DG. (b) Confusion matrices considering the basic-features setting. The values given in each main diagonal cell are the accuracy scores ADG. All values are also represented by the colour scale.
Some basic features of the building (e.g. location, age, floor area, number of storeys, height) are observed with a high mean SHAP value (Fig. 5a). Compared with others, these five basic features can easily be collected from the field or provided by national census databases, for example. Figure 5b shows the efficacy of the heuristic damage assessment model using XGBC trained with a set of easily accessible building features (i.e. basic-features setting: geographic location, floor area, number of stories, height, age, MSI), after addressing the class-imbalance issue using the random oversampling method. Compared with Fig. 4b (considering all features and named as the full-features setting), the XGBC model with the basic-features setting (Fig. 5b) gives almost the same efficacy, with only a 6 % average reduction in the accuracy scores.
4.2.3 Testing the XGBC model with the traffic-light system for damage grades
In this section, a simplified version of the DG scale was used, in the sense that the DGs are classified according to a traffic-light system (TLS) (i.e. green G, yellow Y, and red R classes, corresponding to DG0 + DG1, DG2 + DG3, and DG4 + DG5, respectively), as monitored during post-earthquake emergency situations (Mangalathu et al., 2020; Riedel et al., 2015; ATC, 2005; Bazzurro et al., 2004). For the TLS-based damage classification, the XGBC model (after oversampling to compensate for the imbalance issue) with the basic-features setting applied to the L'Aquila 2009 portfolio (Fig. 6a) gives almost the same efficacy compared to the full-features setting (Fig. 6b). For example, accuracy values ADG using the basic-features setting and the full-features setting were 0.76/0.34/0.56 and 0.82/0.36/0.54 for G/Y/R classes, with the accuracy scores (AT) of 0.68 and 0.72, respectively. Mangalathu et al. (2020), Roeslin et al. (2020), and Harirchian et al. (2021) reported similar damage grade classification accuracy values of 0.66, 0.67, and 0.65, respectively.
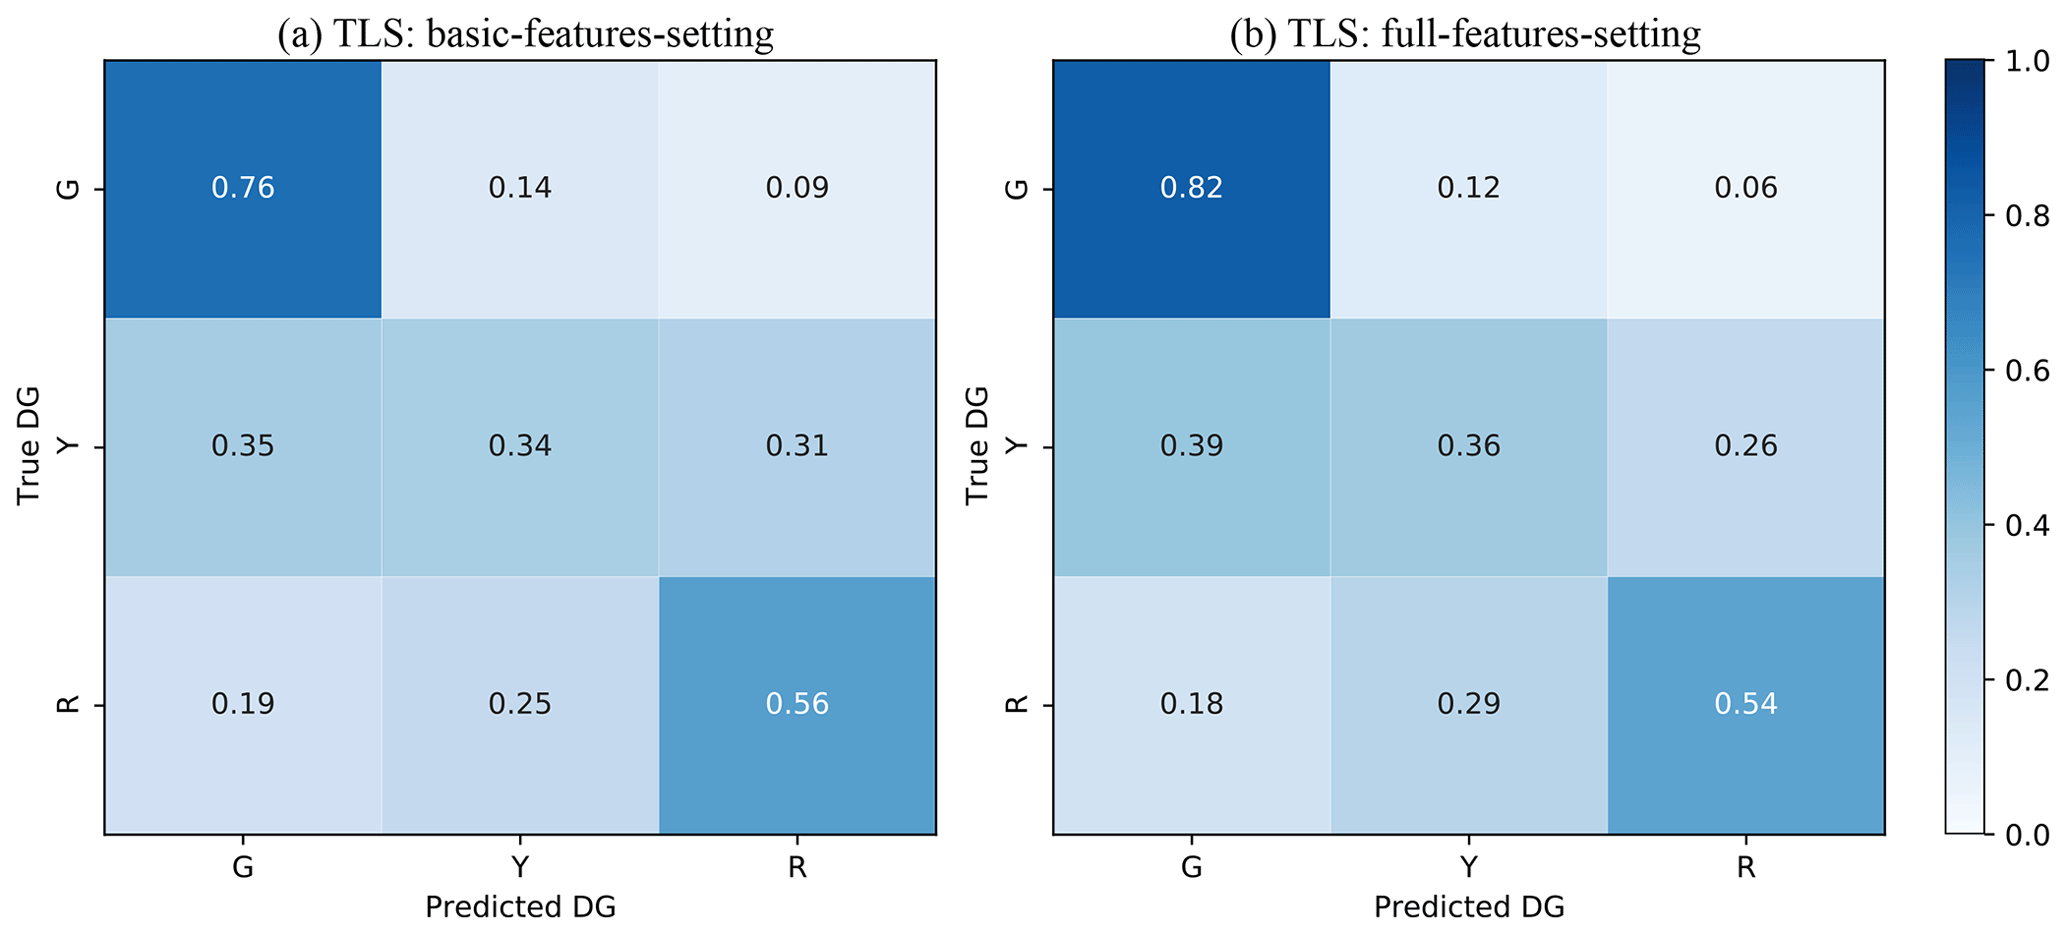
Figure 6Confusion matrices for (a) the basic-features setting and (b) the full-features setting using the classification based on the traffic-light system (TLS), grouping the EMS-98 damage grades (DGs) into three classes (green for no or slight damage, yellow for moderate damage, and red for heavy damage). The values given in each main diagonal cell are the accuracy scores ADG. All values are also represented by the colour scale.
The efficacy of the heuristic damage assessment model using TLS-based damage classification indicates that classifying damage into three classes is much easier for the machine learning model compared with the six-class classification system (EMS-98 damage classification). This is also observed during damage surveys in the field, which sometimes find it hard to distinguish between the intermediate damage grades, such as between DG2 and DG3 or between DG3 and DG4. Similar observations have been reported in previous studies by Guettiche et al. (2017), Harirchian et al. (2021), Riedel et al. (2015), Roeslin et al. (2020), and Stojadinović et al. (2021).
4.2.4 Testing the XGBC model with the whole dataset
The efficacy of the XGBC model was tested using a dataset with six building damage portfolios, excluding the 1980-Irpinia building damage portfolio. The XGBC model was trained and tested on the randomly selected 60 % (training set) and 40 % (test set) of the dataset for EMS-98/TLS damage classification, with two sets of features (full-features setting and basic-features setting), applying the random oversampling method to compensate for class-imbalance issues. Figure 7 shows the associated confusion matrix.
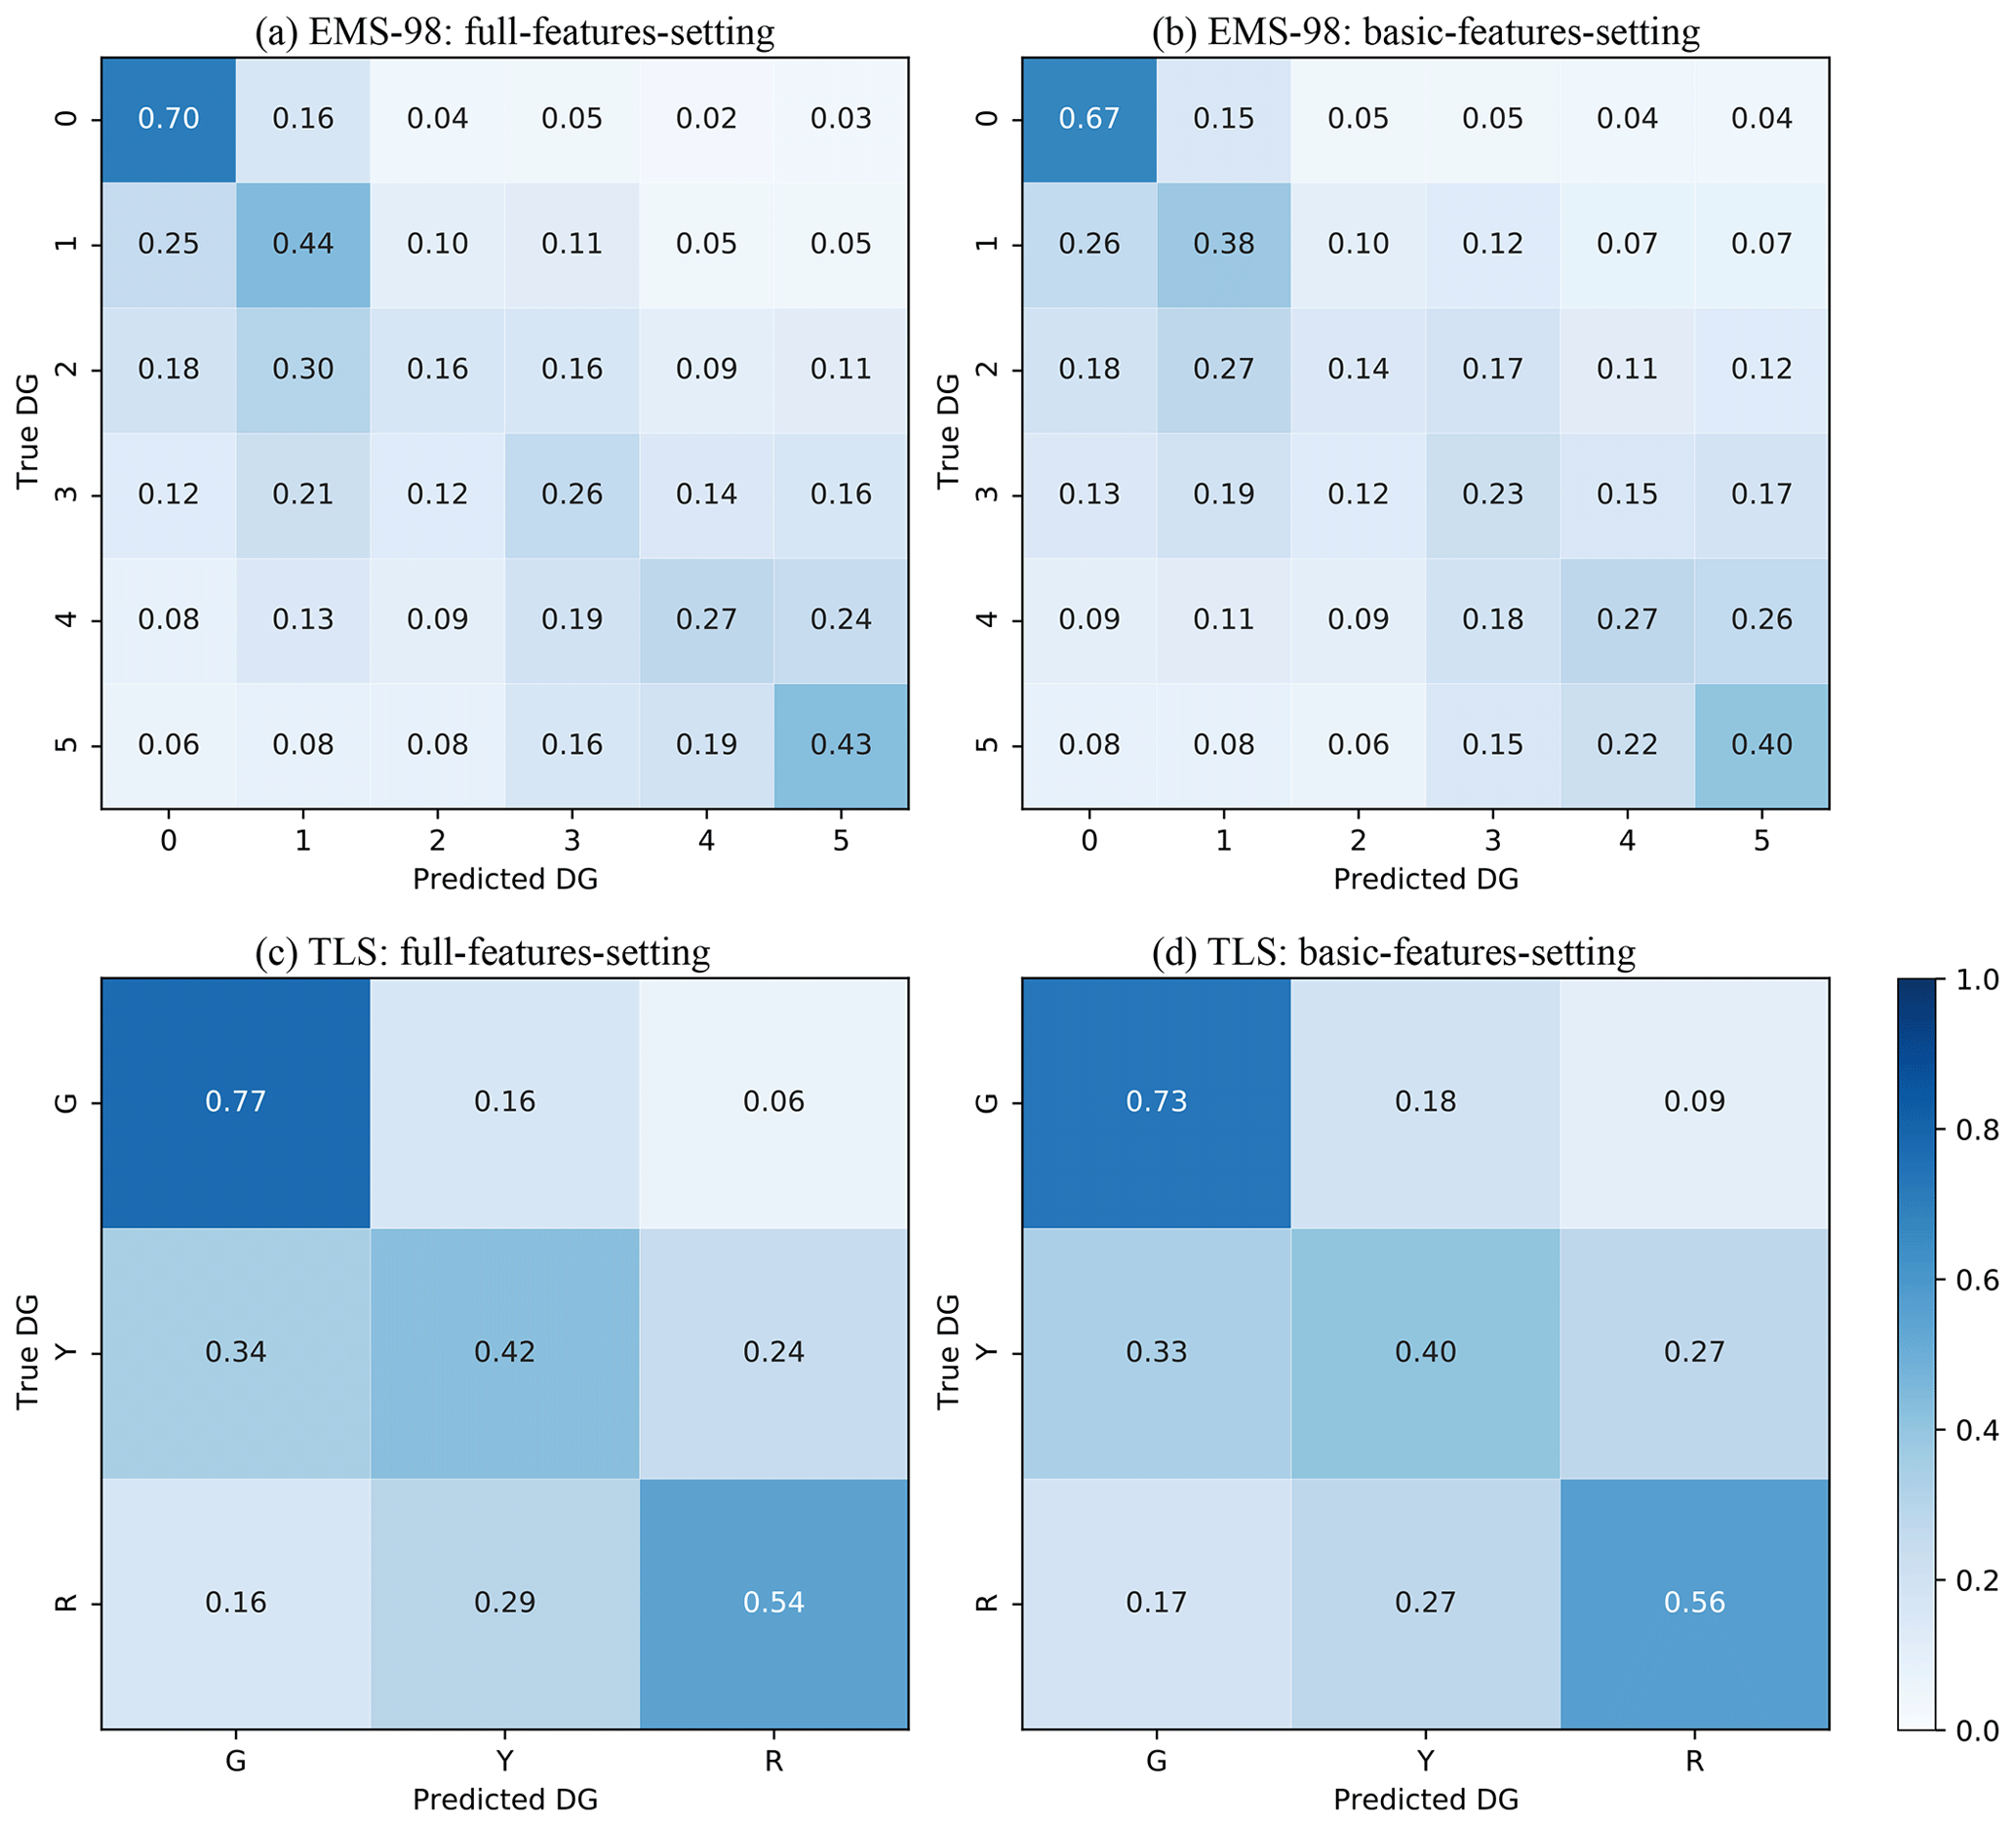
Figure 7Confusion matrices for EMS-98 (a, b) and TLS (green for no or slight damage, yellow for moderate damage, red for heavy damage) (c, d) damage classification systems using the full-features setting (a, c) and the basic-features setting (b, d). The values given in each main diagonal cell are the accuracy scores ADG. All values are also represented by the colour scale.
The basic-features setting resulted in a similar level of damage prediction compared with the full-features setting for both EMS-98-based and TLS-based damage classification systems. For EMS-98 damage classification (Fig. 7a, b), the accuracy ADG scores indicated in the confusion matrices are almost the same for the basic-features setting and the full-features setting. Furthermore, the accuracy AT and MAE scores are also almost the same (0.45 and 1.08 for the basic-features setting and 0.48 and 0.95 for the full-features setting).
Likewise, for TLS-based damage classification (Fig. 7c, d), the accuracy values ADG for the basic-features setting/full-features setting are almost the same, with similar accuracy AT and MAE scores (0.63/0.45 and 0.67/0.39, respectively).
4.3 Third stage: application to the whole DaDO portfolio and comparison with Risk-UE
In this section, the efficacy of the heuristic damage assessment model was considered for building damage predictions, without considering the time frame of the earthquakes. Two scenarios were considered: (1) a single building damage portfolio was used for training, and the model was then tested on the others (named single-single), in situations using a single portfolio to predict future damage, and (2) some building damage portfolios were used for training but testing was performed on a single portfolio (named aggregate-single); i.e. more damage portfolios were used as a training set to predict the damage caused by the next earthquake. The model XGBC was applied with the basic-features setting (number of storeys, building age, floor area, height, MSI for EMS-98) and EMS-98-based and TLS-based damage classification.
4.3.1 Single-single scenario
First, a series of building damage portfolios, concerning earthquakes occurring in northern or southern Italy and of different magnitudes, were used for training and testing:
- i.
training set E3 and test sets E1, E5, and E7;
- ii.
training set E5 and test sets E1, E3, and E7;
- iii.
training set E7 and test sets E1, E3, and E5.
Figure 8 shows the distribution of correct DG classification (i.e. 1−εd in percent given by Eq. 1) observed for each building for the EMS-98 damage grade (Fig. 8a) and the TLS (Fig. 8b) systems. The x axis represents the incremental error in the damage grade (e.g. 1 corresponds to the Δ of the damage grade between observation and prediction, regardless of the DG considered).
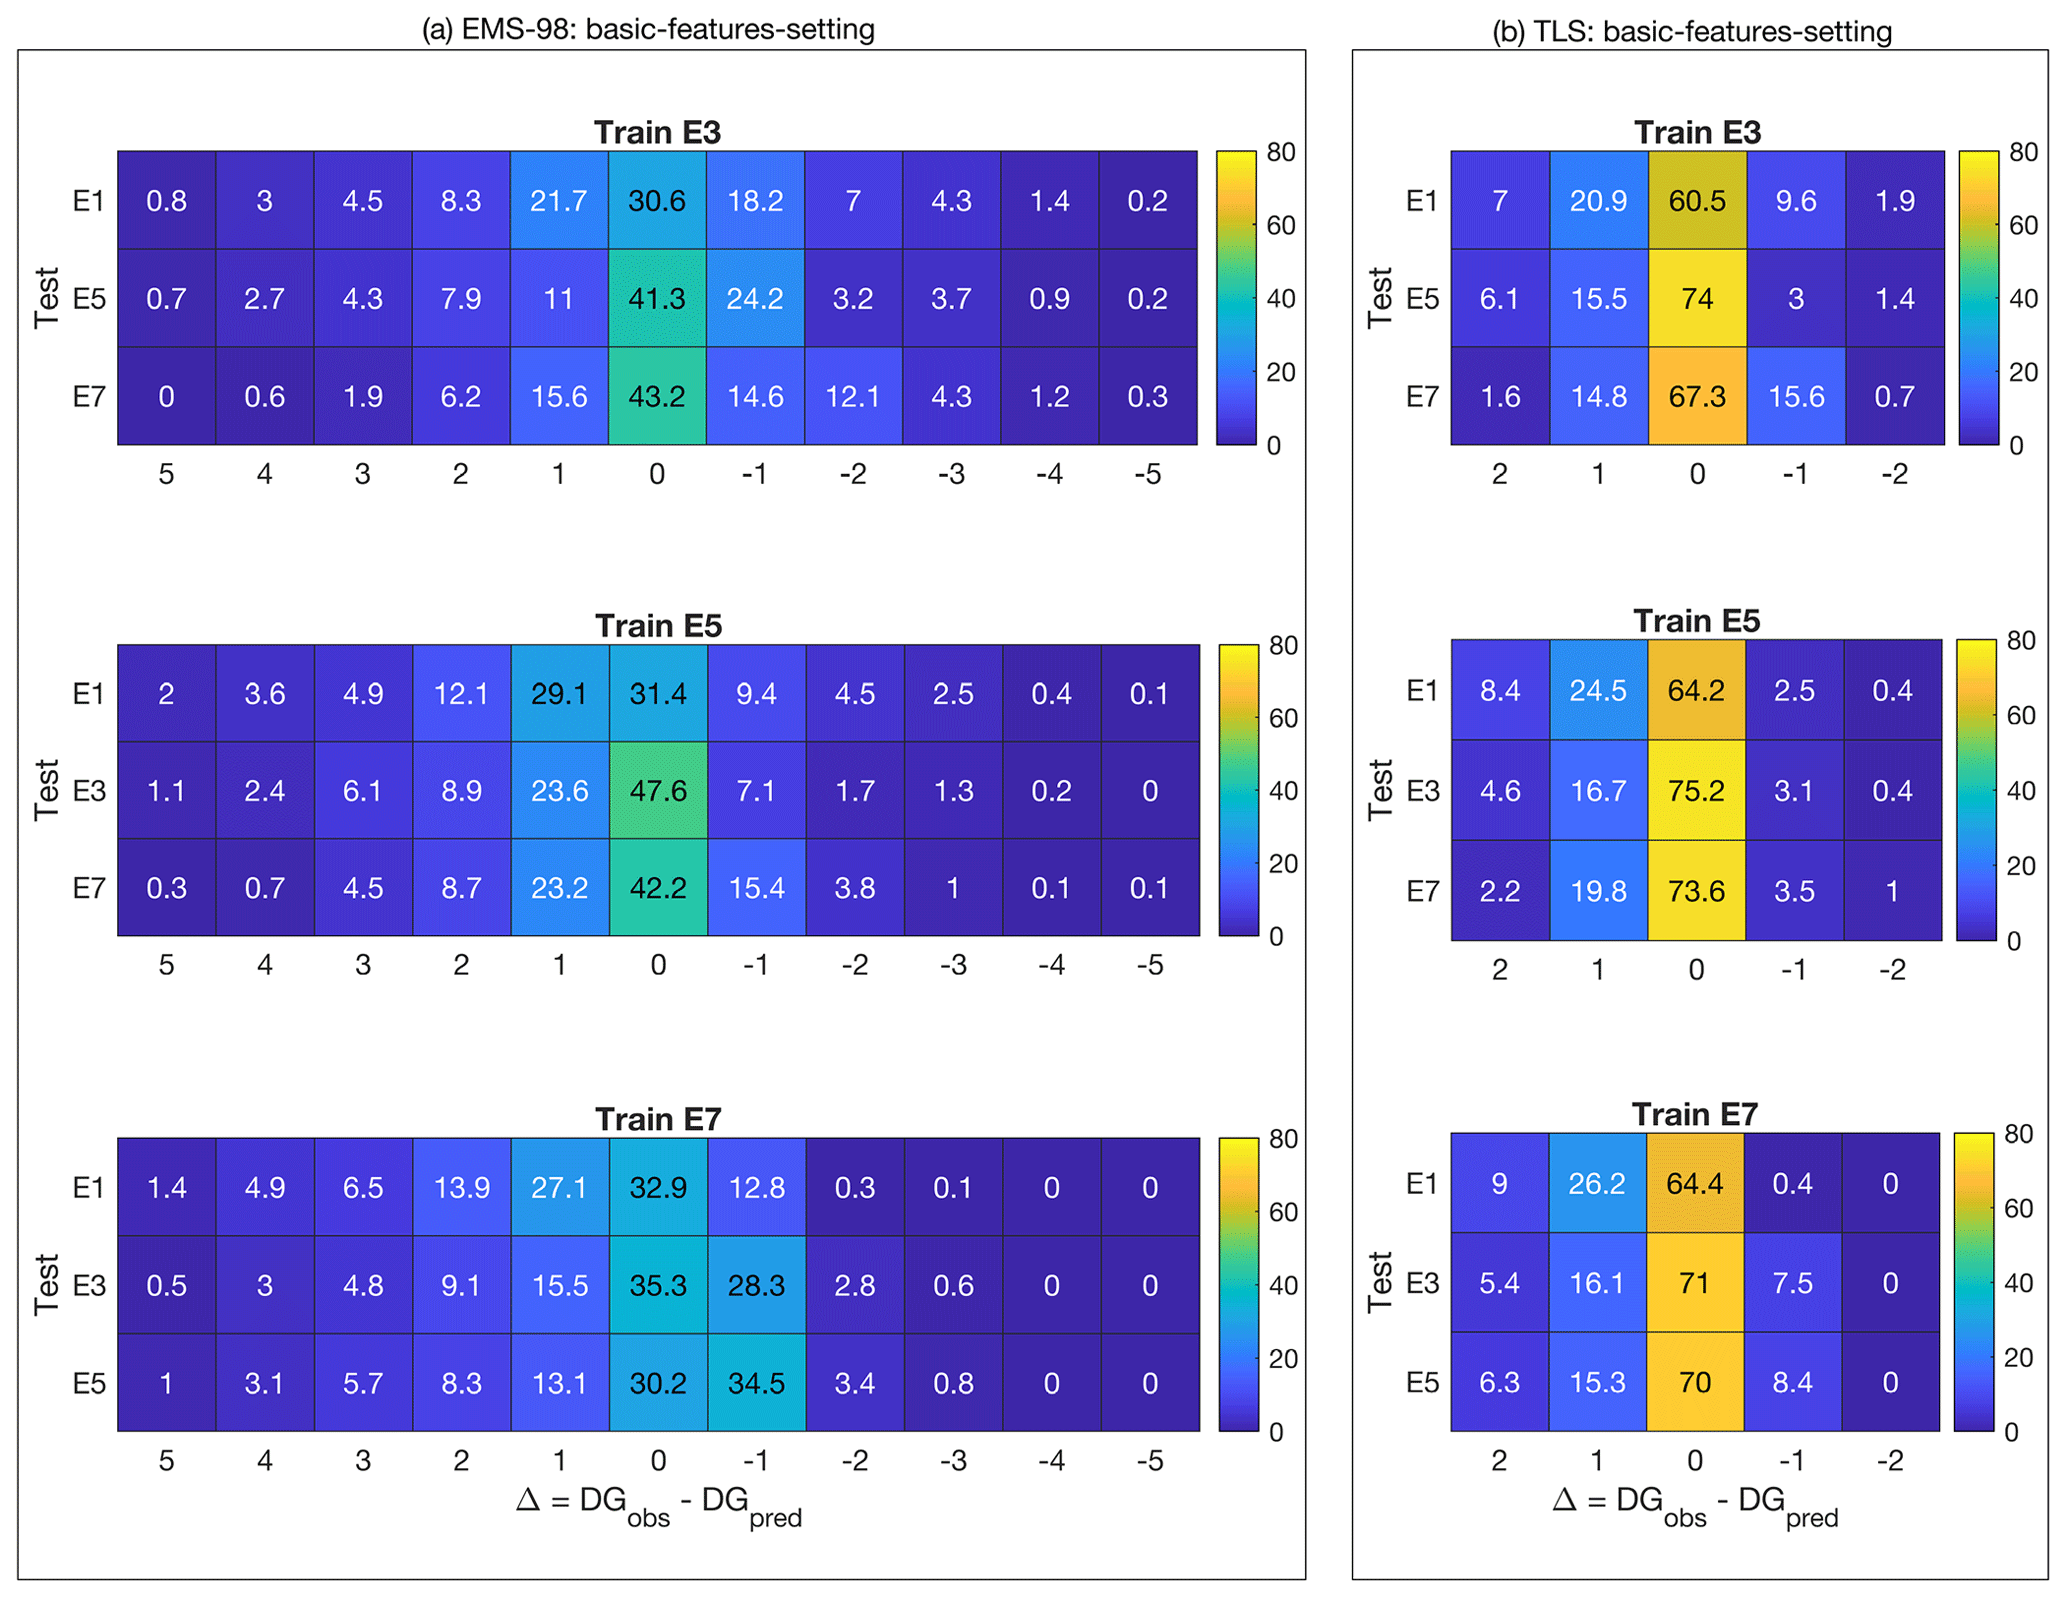
Figure 8Distribution of the classification value (1−εd in percent given by Eq. 1) for (a) EMS-98-based and (b) TLS-based damage classification using XGBC machine learning models and considering a single damage portfolio to predict a single portfolio (single-single scenario). The colour bar indicates the associated value in each cell. The x values are the difference between the DG observed and the DG predicted, regardless of the DG considered.
For the EMS-98 damage scale, correct classification (x value centred on 0) in the range of 31 % to 48 % was found, depending on the training/test datasets. The error distribution is quite wide with incorrect predictions of ±1 DG in the range of ±13 % to 35 %. Remarkably, when considering the E1 portfolio (Irpinia 1980), for which the post-earthquake inventory was based on another form, as the test set, the error is larger. The predictions at ±1 DG (i.e. the sum of the x values in Fig. 8a between −1 and +1) were 70.5 %, 69.9 %, and 72.8 % with portfolios E3, E5, and E7 as the test set, respectively, for an average of 71 %. For the other portfolios, the average of the predictions at ±1 DG was 77 %, 78 %, and 77 %, respectively, for portfolios E5, E3, and E7 as the test set. This tendency was also observed for the TLS damage system (Fig. 8b). In this case, the classification of the E1 portfolio was correct on average (average of x values centred on 0) at 63 % and equal to 72 %, 73 %, and 70.5 % for the test on portfolios E5, E3, and E7. For both damage scales, the distributions were skewed, with a larger number of predictions being underestimated (positive x values), which is certainly a consequence of the choice of machine learning models, their implementation (including imbalance issues), the distribution of input and target features considered, or all of these aspects. The interest of the machine learning model is also to have a relevant representation of the errors and limits of these methods.
4.3.2 Aggregate-single scenario
Secondly, several aggregated building damage portfolio scenarios were considered to predict a single earthquake, thus testing whether the prediction was improved by increasing the number of post-earthquake damage observations. Three scenarios were tested. They are represented in Fig. 9, applying the EMS-98 damage grade (Fig. 9a) and the TLS (Fig. 9b):
- i.
training set E2 + E3 + E4 + E6 (shown as E2346) and test sets E1, E5, and E7;
- ii.
training set E2 + E4 + E5 + E6 (shown as E2456) and test sets E1, E3, and E7;
- iii.
training set E2 + E4 + E6 + E7 (shown as E2467) and test sets E1, E3, and E5.
For the EMS-98 damage scale, correct classification (x value centred on 0) in the range of 27 % to 49 % was found, depending on the training/test datasets. As in Fig. 8, using the E1 (Irpinia 1980) earthquake for testing scored lower regardless of the portfolio used for training (28.7 %, 27.2 %, and 27.4 % prediction accuracy). With E1 as the test set, the predictions at ±1 DG (i.e. the sum of the x values in Fig. 9a between −1 and +1) were 65.7 %, 63.8 %, and 62.4 % considering the E2346, E2456, and E2467 portfolios as the training set, respectively, for an average of 64 % (compared with the 70 % score for the single portfolio scenario, Fig. 8a). Other scenarios were also tested by aggregating the building damage portfolios differently (not presented herein), leading to two main conclusions: (1) the quality and homogeneity of the input data (i.e. building features) affect the efficacy of the heuristic model and (2) this efficacy is limited and not improved by increasing the number of building damage observations, with a score (excluding E1) of between 40 % and 49 % (x value centred on 0) and up to 78 % (average of the two scenarios, Figs. 8a and 9a) at ±1 DG. Considering the TLS damage scale (Fig. 9b), a damage prediction efficacy of about 72 % was obtained (compared with 72 % in Fig. 8b), but no significant improvement was observed when the number of damaged buildings in the training portfolio was increased. For EMS-98 and TLS, the distributions were skewed, with a larger number of predictions being underestimated (positive x values).
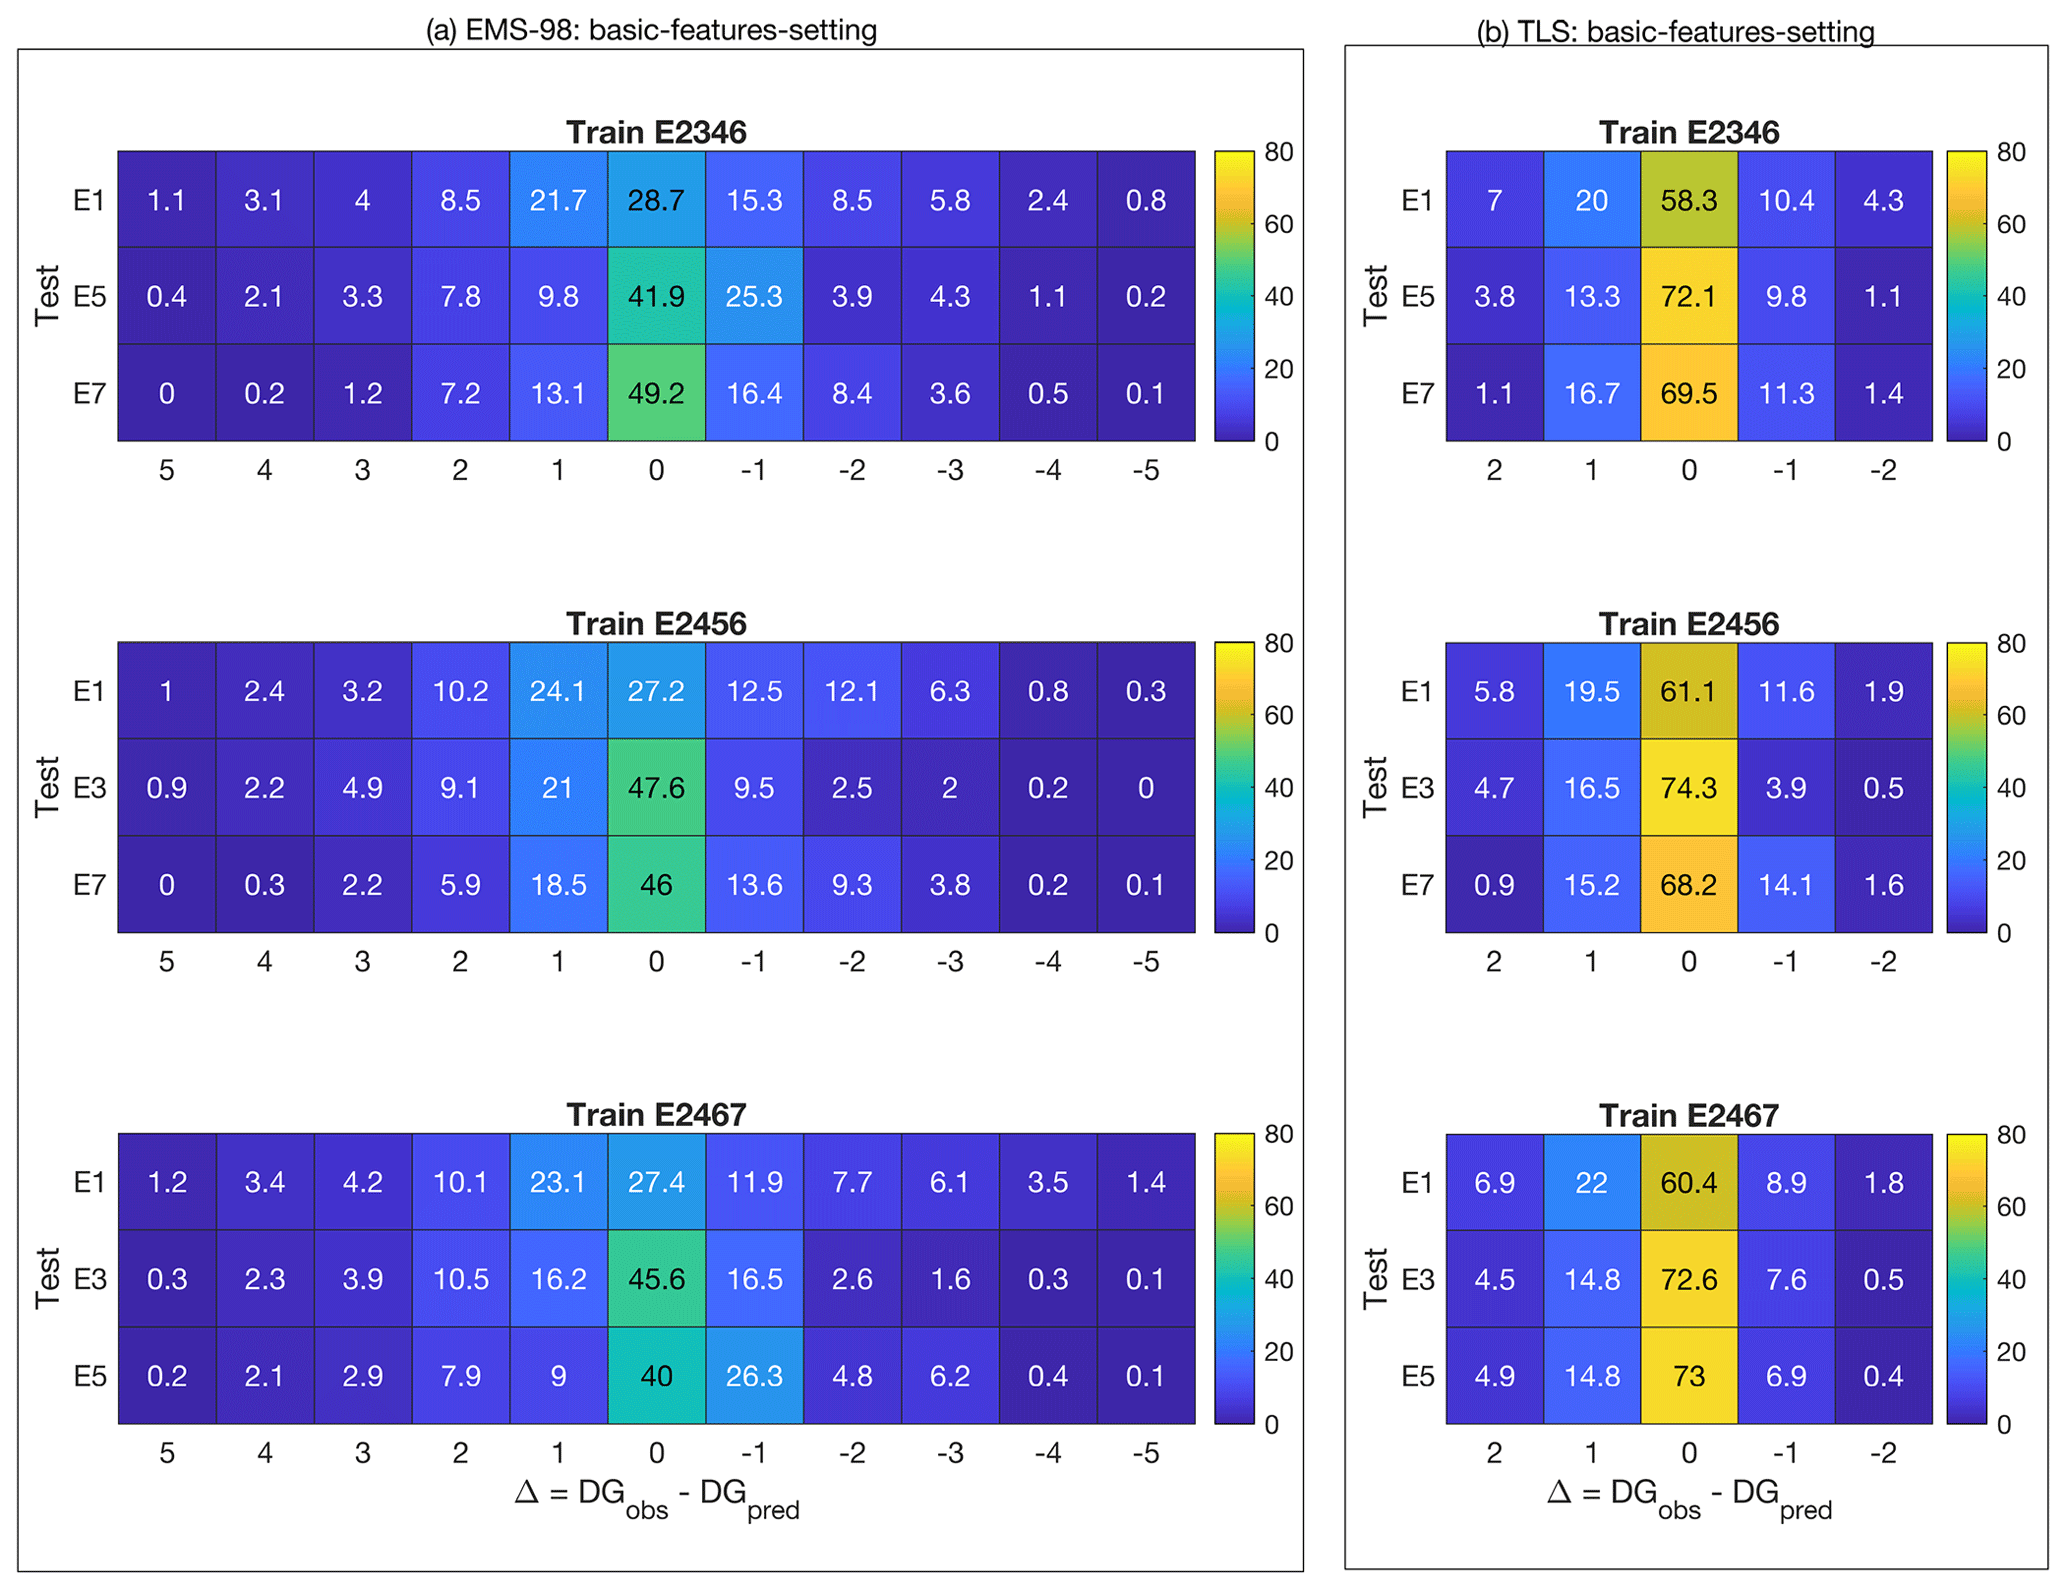
Figure 9Distribution of the classification value (1−εd in percent given by Eq. 1) for (a) EMS-98-based and (b) TLS-based damage classification using XGBC machine learning models and considering an aggregate damage portfolio to predict a single portfolio (aggregate-single scenario). The colour bar indicates the associated value in each cell. The x values are the difference between the DG observed and the DG predicted, regardless of the DG considered.
In conclusion, the heuristic damage assessment model based on the XGBC model gives a better score for TLS damage assessment than for the EMS-98 damage scale. The TLS system also allows for quick assessment of damage on a large scale such as a city or region from an operational point of view.
4.3.3 Comparing efficacy with the RISK-UE model
The efficacy of the heuristic damage assessment model was then compared with conventional damage prediction methods, i.e. RISK-UE and the mean damage relationship (Eqs. 2 to 7), considering the basic-features settings. For RISK-UE, mean damage μd (Eq. 4) was computed using the training set and the vulnerability index IV for each building (Eq. 5). A vulnerability index was then attributed to all the buildings in each class defined according to building features. The vulnerability indexes were then attributed to every building in the test set; mean damage (μd) was computed with Eq. (2) and then DG distribution with Eq. (3), before being compared with the damage portfolio used for testing. Finally, the distribution of the mean damage observed (Eq. 4) was compared with the distribution of damage directly on the test set, using Eq. (3).
Figure 10 shows the distribution of absolute errors associated with the RISK-UE, mean damage relationship, and XGBC methods (with and without compensation for the class-imbalance issue) trained on earthquake building damage portfolio E5 and tested on E3. For EMS-98 damage classification (Fig. 10a), the XGBC model (without compensation for class-imbalance issues) resulted in a level of absolute errors similar to that of the RISK-UE and/or mean damage relationship, except for DG0 (24 %). Random oversampling to compensate for the class-imbalance issues improved the distribution of errors for the XGBC model (errors less than 8 %, except for DG1 at 13 %).
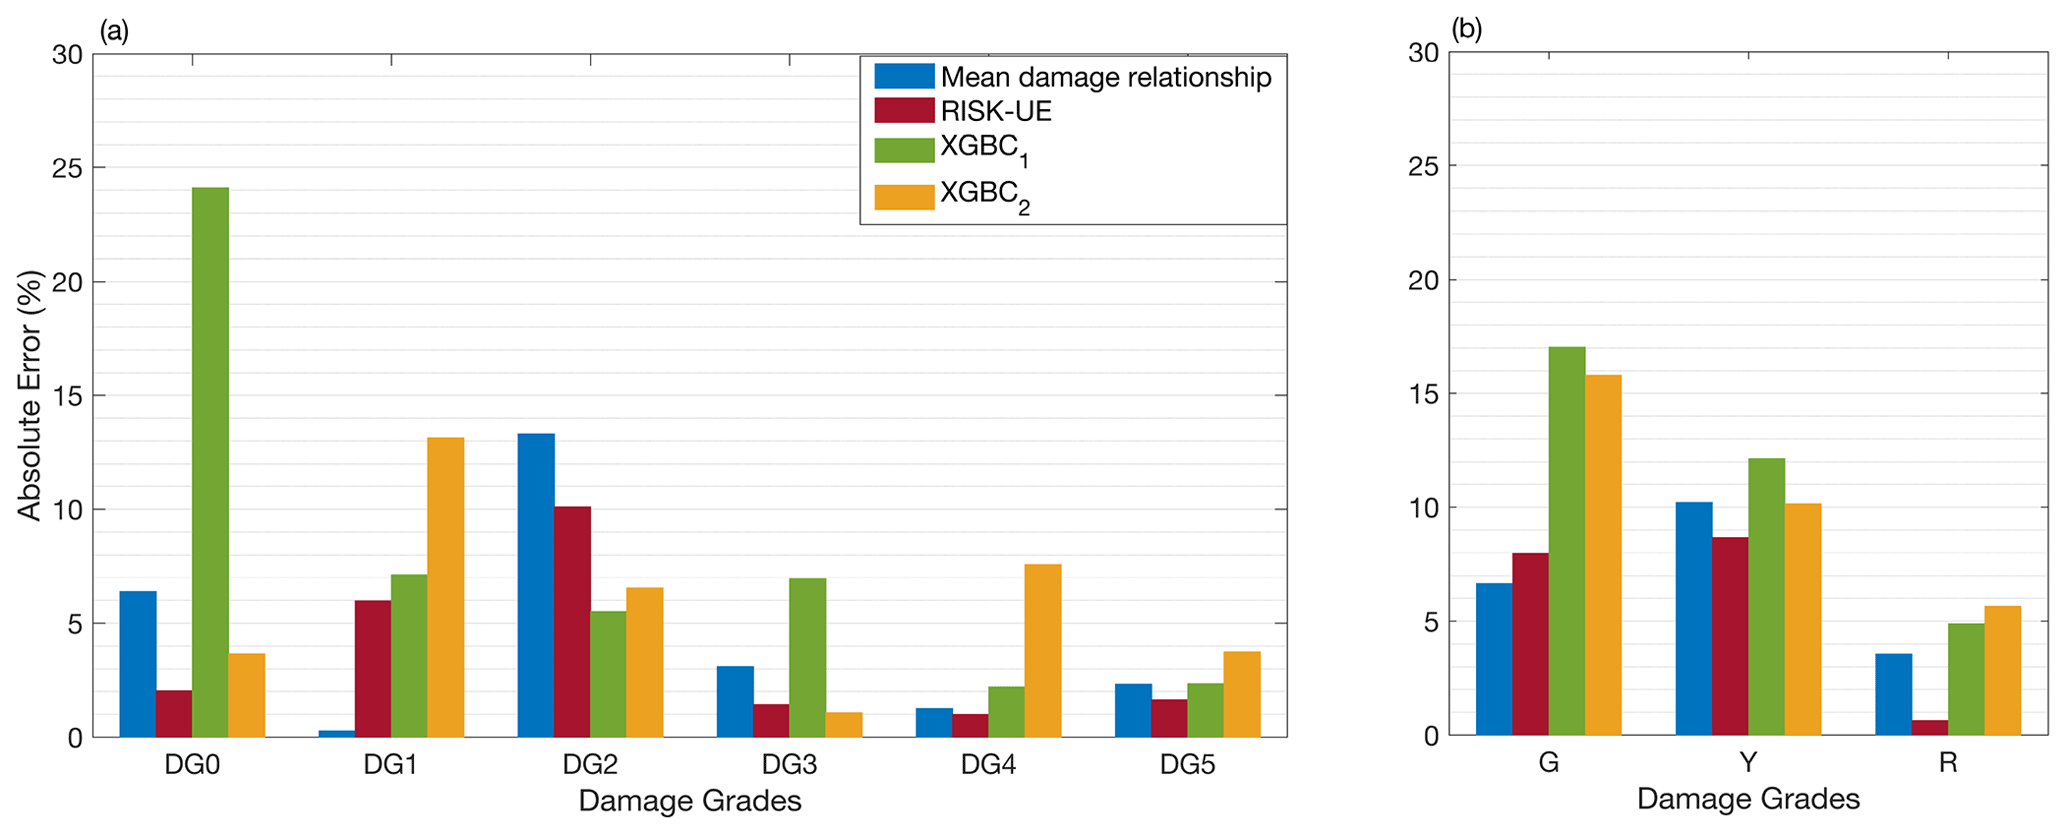
Figure 10Comparison of the efficacy of the heuristic model with the conventional model considering the DaDO portfolio (training set: E5; test set: E3) for (a) EMS-98-based and (b) TLS-based damage classification. The x axis is the damage grade, and the y axis is the percentage of absolute error (εk in percent given by Eq. 7). The blue bar corresponds to the mean damage relationship; the red bar corresponds to the RISK-UE method; and the green and orange bars correspond to the heuristic model without (XGBC1) and with (XGBC2) compensation for the class-imbalance issues, respectively.
For TLS-based damage classification, the XGBC model also resulted in a similar level of errors compared with the mean damage relationship and/or RISK-UE methods (Fig. 10b), except for the green class (no or slight damage, 17.04 %). Compensation for class-imbalance issues slightly improved the distribution of errors for the XGBC model with a 2 % drop in errors for the green (no/slight damage) and yellow (moderate damage) classes.
Figure 11 shows the distribution of absolute errors trained using the E2456 portfolio and tested on the E3 portfolio. For EMS-98 damage classification (Fig. 11a), the XGBC model (without compensation for class-imbalance issues) resulted in a level of errors similar to that of the RISK-UE and/or mean damage relationship; errors were highest for DG0 with 15.15 %. With compensation for the class-imbalance issues, the XGBC model achieved a slightly lower error distribution for DG0 (5 %) and DG3 (4 %); however, for other damage grades, the error value increased significantly (DG1: 11 %, DG2: 12 %, DG4: 7 %, DG5: 2 %). For TLS-based damage classification, the distribution of absolute errors was similar for both the XGBC model and the mean damage relationship and/or RISK-UE methods (Fig. 11b). The highest absolute error value was associated with the green (no or slight damage) class of buildings (16.40 %). Compensation for the class-imbalance issues slightly increased the error distribution for the XGBC model, with nearly 5 % for buildings in the green (no or slight damage) and red (heavy damage) classes.
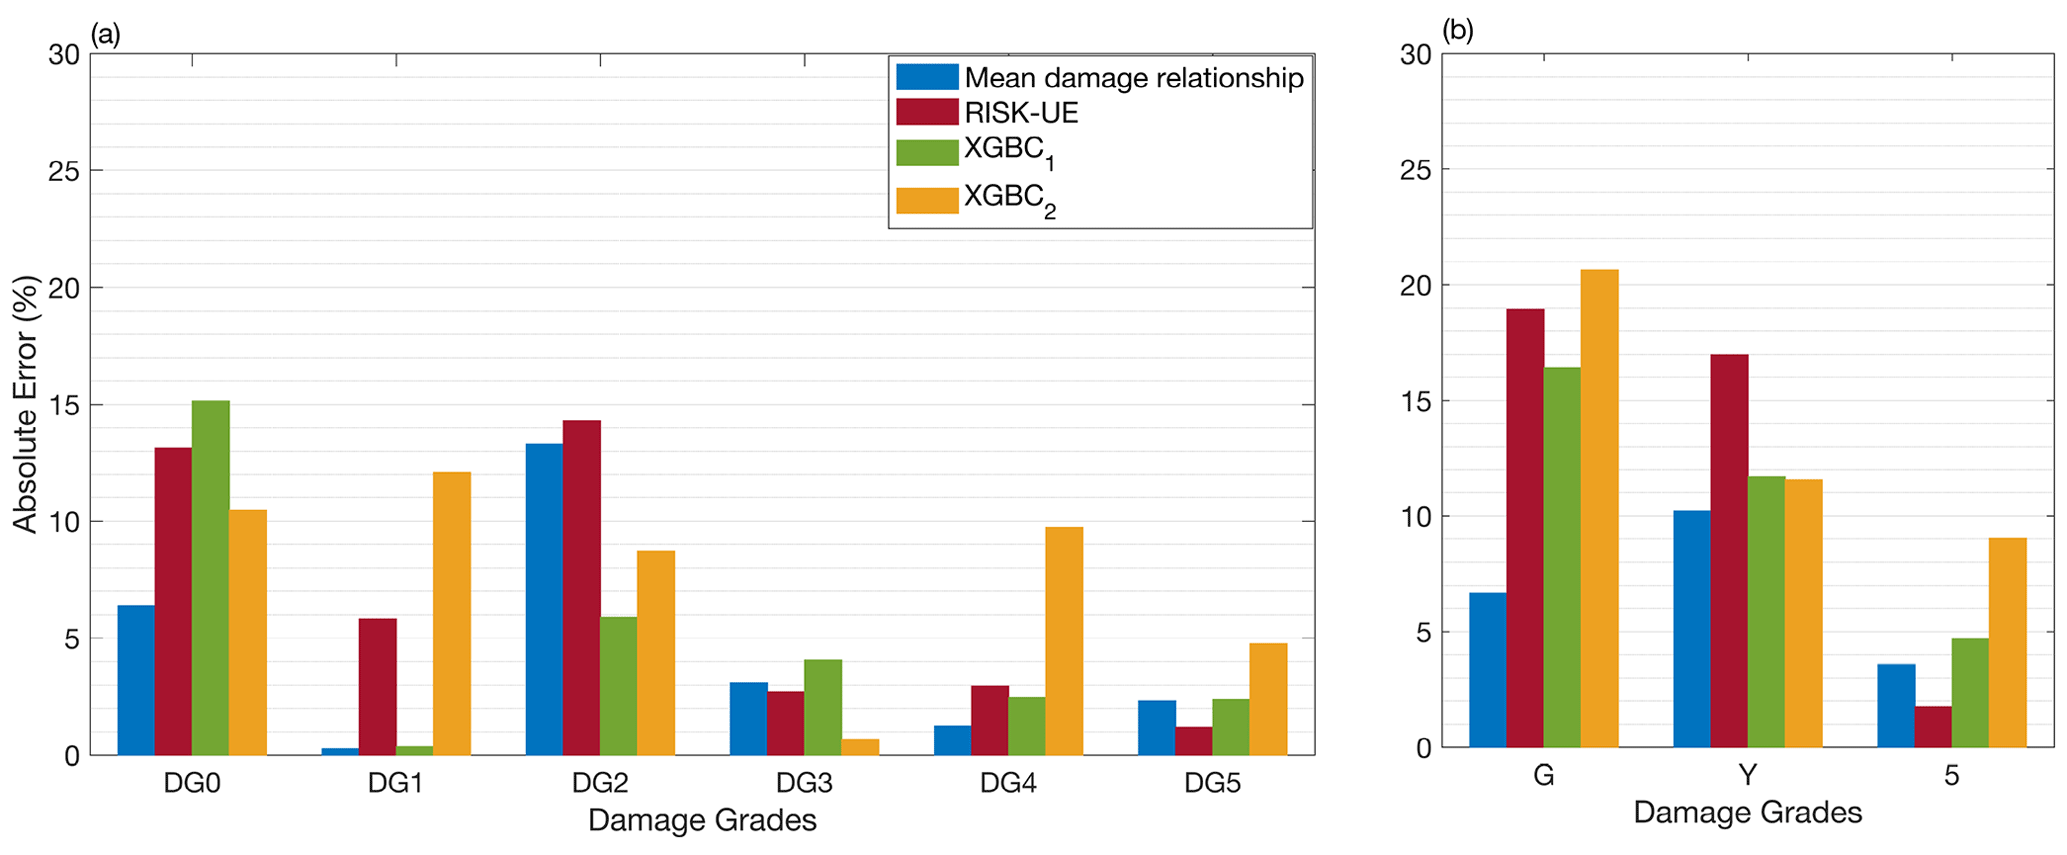
Figure 11Comparison of the efficacy of the heuristic model with the conventional model considering the DaDO portfolio (training set: E2456; test set: E3) for (a) EMS-98-based and (b) TLS-based damage classification. The x axis is the damage grade, and the y axis is the percentage of absolute error (εk in percent given by Eq. 7). The blue bar corresponds to the mean damage relationship; the red bar corresponds to the RISK-UE method; and the green and orange bars correspond to the heuristic model without (XGBC1) and with (XGBC2) compensation for the class-imbalance issues, respectively.
These results show that the heuristic building damage model based on the XGBC model, trained using building damage portfolios with the basic-features setting, provides a reasonable estimation of potential damage, particularly with TLS-based damage classification.
Previous studies have aimed to test a machine learning framework for seismic building damage assessment (e.g. Mangalathu et al., 2020; Roeslin et al., 2020; Harirchian et al., 2021; Ghimire et al., 2022). They evaluated various machine learning and data balancing methods to classify earthquake damage to buildings. However, these studies (Mangalathu et al., 2020; Roeslin et al., 2020; Harirchian et al., 2021) had limitations such as limited data samples, limited damage classes, and building characteristics limited to a spatial coverage and range of seismic demand values. Ghimire et al. (2022) also used a larger building damage database but did not investigate the importance of input features as a function of damage levels and did not compare machine learning with conventional damage assessment methods.
This study aims to go beyond previous studies by testing advanced machine learning methods and data resampling techniques using the unique DaDO dataset collected from several major earthquakes in Italy. This database covers a wide range of seismic damage and seismic demands of a specific region, including undamaged buildings. Most importantly, this study highlights the importance of input features according to the degrees of damage and finally compares the machine learning models with a classical damage prediction model (RISK-UE). The machine learning models achieved comparable accuracy to the RISK-UE method. In addition, TLS-based damage classification, using red for heavily damaged, yellow for moderate damage, and green for no to slight damage, could be appropriate when the information about undamaged buildings is unavailable during model training.
Indeed, it is worth noting that the importance of the input features used in the learning process changes with the degree of damage: this indicates that each feature may have a contribution to the damage that changes with the damage level. Thus, the weight of each feature does not depend linearly on the degree of damage, which is not considered in conventional vulnerability methods.
The prediction of seismic damage by machine learning remains until now has been tested on geographically limited data. The damage distribution is strongly influenced by region-specific factors such as construction quality and regional typologies, implementation of seismic regulations, and hazard level. Therefore, machine-learning-based models can only work well in regions with comparable characteristics, and a host-to-target transfer of these models should be studied. In addition, the distribution of damage is often imbalanced, impacting the performance of machine learning models by assigning higher weights to the features of the majority class. However, data balancing methods like random oversampling can reduce bias caused by imbalanced data during the training phase, but they may also introduce overfitting issues depending on the distribution of input and target features. Thus, integrating data from a wider range of input features and earthquake damage from different regions, relying on a host-to-target strategy, could help achieve a more natural balance of datasets and lead to less biased results. Moreover, the machine learning methods only train on the data available in the learning phase that reflect the building portfolio in the study area. The importance of the features contributing to the damage could thus be modulated and would require a host-to-target adjustment for the application of the model to another urban zone/seismic region.
However, the machine learning models trained and tested on the DaDO dataset resulted in similar damage prediction accuracy values to those reported in existing literature using different models and datasets with different combinations of input features. This might suggest that the uncertainty related to building vulnerability in damage classification may be smaller than the primary source of uncertainty related to the hazard component (such as ground motion, fault rupture, or slip duration).
In recent years, there has been a proliferation of open building data, such as the OpenStreetMap-based dynamic global exposure model (Schorlemmer et al., 2020) and building damage datasets after an earthquake (such as DaDO). We must therefore continue this paradigm shift initiated by Riedel et al. (2014, 2015), which consisted in identifying the exposure data available and with as much certainty as possible and in finding the most effective relationships for estimating the damage, unlike conventional approaches, which proposed established and robust methods but relied on data that were not available or were difficult to collect. The global dynamic exposure model will make it possible to meet the challenge of modelling exposure on a larger scale with available data, using a tool capable of integrating this large volume of data. Machine learning methods are one such rapidly growing tool that can aid in exposure classification and damage prediction by leveraging readily available information. It is therefore necessary to continue in this direction in order to evaluate the performance of the methods and their pros and cons for maximum efficacy of the prediction of damage.
Future works will therefore have to address several key issues that have been discussed here but that need to be further investigated. For example, the weight of the input features varies according to the level of damage, but one can question the systematization of this observation whatever the dataset and feature considered. The efficiency of the selected models and the management of imbalance data remain to be explored, in particular by verifying regional independence. Taking advantage of the increasing abundance of exposure data and post-seismic observations, the imbalanced feature distribution and observed damage levels could be solved by aggregating datasets independent of the exposure and hazard contexts of the regions, once the host-to-target transfer of the models has been resolved. Finally, key input features (still not yet identified) describing hazard or vulnerability may be unexplored, and incorporating them into the models may improve the accuracy of damage classification.
In this study, we explored the efficacy of machine learning models trained using DaDO post-earthquake building damage portfolios. We compared six machine learning models: RFC, GBC, XGBC, RFR, GBR, and XGBR. These models were trained on a number of building features (location, number of storeys, age, floor area, height, position, construction material, regularity, roof type, ground slope condition) and ground motion intensity defined in terms of macroseismic intensity. The classification models performed slightly better than the regression methods, and the XGBC model was ultimately found to be the most efficient model for this dataset. To solve the imbalance issue concerning observed damage, the random oversampling method was applied to the training dataset to improve the efficacy of the heuristic damage assessment model by rectifying the skewed distribution of the target features (DGs).
Surprisingly, we found that the weight of the most important building feature evolves according to DG; i.e. the weight of the feature for damage prediction changes depending on the DG considered. This is not taken into account in conventional methods.
The basic-features setting (i.e. considering the number of storeys, age, floor area, height, and macroseismic intensity, which are accurately evaluated for the existing building portfolio) gave the same accuracy (0.68) as the full-features setting (0.72) with the TLS-based damage classification method. For training and testing, the homogeneity of the information in the portfolios is a key issue for the definition of a highly effective machine learning model, as shown by the data from the E1 earthquake (Irpinia-1990). However, the efficacy of the model reaches a limit which is not improved by increasing the number of damaged buildings in the portfolio used as the training set, for example. For damage prediction, this type of heuristic model results in approximately 75 % correct classification. Other authors (e.g. Riedel et al., 2014, 2015; Ghimire et al., 2022) have already reached this same conclusion by increasing the percentage of the training set compared with the test set.
Despite this limit threshold, the level of accuracy achieved remains similar to that attained by conventional methods, such as RISK-UE and the mean damage relationship, for the basic-features settings and TLS-based damage classification (error values less than 17 %). Machine learning models trained on post-earthquake building damage portfolios could provide a reasonable estimation of damage for a different region with similar building portfolios, after host-to-target adjustment.
Some variability may have been introduced into the damage prediction model due to the framework defined to translate the original damage scale to the EMS-98 damage scale and because, in the DaDO database, the year of construction and the floor area of each building are provided as interval values and missing locations of buildings have been replaced with the location of local administrative centres. The latter can lead to a smoothing of the macroseismic intensities to be considered for each structure and also affect the distance to the earthquake. Similarly, the building damage surveys were carried out after the seismic sequence, which includes aftershocks as well as the mainshock, whereas the MSI input corresponds to the mainshock from the USGS ShakeMap. All these issues may reduce the efficacy of the heuristic model and its limit threshold. Addressing these issues could improve the damage prediction performance of machine learning models.
The machine learning models were developed using scikit-learn documentation, and the value of hyperparameters used are provided in Table 3 (https://scikit-learn.org/stable/install.html, Pedregosa et al., 2011).
The data used in this study are available in the Database of Observed Damage (DaDO) web-based GIS platform of the Italian Civil Protection Department, developed by the Eucentre Foundation (https://egeos.eucentre.it/danno_osservato/web/danno_osservato?lang=EN, Dolce et al., 2019).
SG: conceptualization, methodology, data preparation, investigation, visualization, and draft preparation. PG: conceptualization, investigation, visualization, supervision, and review and editing draft. AP: conceptualization, supervision, and review and editing draft. DS: conceptualization, supervision, and review and editing draft.
The contact author has declared that none of the authors has any competing interests.
Publisher's note: Copernicus Publications remains neutral with regard to jurisdictional claims in published maps and institutional affiliations.
This article is part of the special issue “Harmonized seismic hazard and risk assessment for Europe”. It is not associated with a conference.
The authors thank the editor and the reviewers. Adrien Pothon and Philippe Guéguen thank the AXA Research Fund supporting the project New Probabilistic Assessment of Seismic Hazard, Losses and Risks in Strong Seismic Prone Regions. Philippe Guéguen thanks LabEx OSUG@2020 (Investissements d’avenir – ANR10LABX56).
This research has been supported by the URBASIS-EU project (H2020-MSCA-ITN-2018, grant no. 813137), the Agence Nationale de la Recherche (grant no. ANR10LABX56), and the AXA Research Fund (New Probabilistic Assessment of Seismic Hazard, Losses and Risks in Strong Seismic Prone Regions).
This paper was edited by Helen Crowley and reviewed by Zoran Stojadinovic, Marta Faravelli, and one anonymous referee.
ATC: ATC-20-1, Field Manual: Postearthquake Safety Evaluation of Buildings Second Edition, Applied Technology Council, Redwood City, California, ISBN ATC20-1, 2005.
Azimi, M., Eslamlou, A. D., and Pekcan, G.: Data-driven structural health monitoring and damage detection through deep learning: State-of-the-art review, Sensors, 20, 2778, https://doi.org/10.3390/s20102778, 2020.
Baggio, C., Bernardini, A., Colozza, R., Pinto, A. V., and Taucer, F.: Field Manual for post-earthquake damage and safety assessment and short term countermeasures (AeDES) Translation from Italian: Maria ROTA and Agostino GORETTI, European Commission – Joint Research Centre – Institute for the Protection and Security of the Citizen, EUR 22868, 2007.
Bazzurro, P., Cornell, C. A., Menun, C., and Motahari, M.: Guidelines for seismic assessment of damaged buildings, in: 13th World Conference on Earthquake Engineering, Vancouver, B.C., Canada, 74–76, https://doi.org/10.5459/bnzsee.38.1.41-49, 2004.
Branco, P., Ribeiro, R. P., Torgo, L., Krawczyk, B., and Moniz, N.: SMOGN: a Pre-processing Approach for Imbalanced Regression, Proc. Mach. Learn. Res., 74, 36–50, 2017.
Breiman, L.: Random Forests, Mach. Learn., 45, 5–32, 2001.
Chen, T. and Guestrin, C.: XGBoost: A Scalable Tree Boosting System, in: 22nd acm sigkdd international conference on knowledge discovery and data mining, San Francisco, CA, USA, 13–17 August 2016, 785–794, https://doi.org/10.1145/2939672.2939785, 2016.
Daniell, J. E., Schaefer, A. M., Wenzel, F., and Tsang, H. H.: The global role of earthquake fatalities in decision-making: earthquakes versus other causes of fatalities, Proc. Sixt. World Conference Earthq. Eng. Santiago, Chile, 9–13 January 2017, http://www.wcee.nicee.org/wcee/article/16WCEE/WCEE2017-170.pdf (last access: 29 September 2023), 2017.
Dolce, M., Speranza, E., Giordano, F., Borzi, B., Bocchi, F., Conte, C., Di Meo, A., Faravelli, M., and Pascale, V.: Observed damage database of past italian earthquakes: The da.D.O. WebGIS, Bulletin of Geophyiscs and Oceanography, 60, 141–164, https://doi.org/10.4430/bgta0254, 2019 (data available at: https://egeos.eucentre.it/danno_osservato/web/danno_osservato?lang=EN).
Estabrooks, A. and Japkowicz, N.: A mixture-of-experts framework for learning from imbalanced data sets, Lect. Notes Comput. Sc., 2189, 34–43, https://doi.org/10.1007/3-540-44816-0_4, 2001.
FEMA: Hazus – MH 2.1 Multi-hazard Loss Estimation Methodology Earthquake, https://www.fema.gov/sites/default/files/2020-09/fema_hazus_earthquake-model_technical-manual_2.1.pdf (last access: 29 September 2023), 2003.
Friedman, J. H. Greedy function approximation: a gradient boosting machine, Ann. Stat., 29, 1189–1232, 2001.
Del Gaudio, C., Scala, S. A., Ricci, P., and Verderame, G. M.: Evolution of the seismic vulnerability of masonry buildings based on the damage data from L'Aquila 2009 event, B. Earthq. Eng., 19, 4435–4470, 2021.
Ghimire, S., Guéguen, P., Giffard-Roisin, S., and Schorlemmer, D.: Testing machine learning models for seismic damage prediction at a regional scale using building-damage dataset compiled after the 2015 Gorkha Nepal earthquake, Earthq. Spectra, 38, 2970–2993, https://doi.org/10.1177/87552930221106495, 2022.
Grünthal, G.: Escala Macro Sísmica Europea EMS – 98, 101 pp., https://www.franceseisme.fr/EMS98_Original_english.pdf (last access: 29 September 2023), 1998.
Guéguen, P., Michel, C., and Lecorre, L.: A simplified approach for vulnerability assessment in moderate-to-low seismic hazard regions: Application to Grenoble (France), B. Earthq. Eng., 5, 467–490, https://doi.org/10.1007/s10518-007-9036-3, 2007.
Guettiche, A., Guéguen, P., and Mimoune, M.: Seismic vulnerability assessment using association rule learning: application to the city of Constantine, Algeria, Nat. Hazards, 86, 1223–1245, https://doi.org/10.1007/s11069-016-2739-5, 2017.
Harirchian, E., Kumari, V., Jadhav, K., Rasulzade, S., Lahmer, T., and Das, R. R.: A synthesized study based on machine learning approaches for rapid classifying earthquake damage grades to rc buildings, Appl. Sci., 11, 7540, https://doi.org/10.3390/app11167540, 2021.
Hegde, J. and Rokseth, B.: Applications of machine learning methods for engineering risk assessment – A review, Safety Sci., 122, 104492, https://doi.org/10.1016/j.ssci.2019.09.015, 2020.
Japkowicz, N. and Stephen, S.: The class imbalance problem A systematic study fulltext.pdf, Intelligent Data Analysis, 6, 429–449, 2002.
Kim, T., Song, J., and Kwon, O. S.: Pre- and post-earthquake regional loss assessment using deep learning, Earthq. Eng. Struct. D., 49, 657–678, https://doi.org/10.1002/eqe.3258, 2020.
Lagomarsino, S. and Giovinazzi, S.: Macroseismic and mechanical models for the vulnerability and damage assessment of current buildings, B. Earthq. Eng., 4, 415–443, https://doi.org/10.1007/s10518-006-9024-z, 2006.
Lagomarsino, S., Cattari, S., and Ottonelli, D.: The heuristic vulnerability model: fragility curves for masonry buildings, Springer Netherlands, 3129–3163, https://doi.org/10.1007/s10518-021-01063-7, 2021.
Lundberg, S. M. and Lee, S.-I.: A Unified Approach to Interpreting Model Predictions, in: 31st Conference on Neural Information Processing Systems 30, Annual Conference on Neural Information Processing Systems, 4–9 December 2017, Long Beach, CA, USA, 2017.
Mangalathu, S. and Jeon, J.-S.: Regional Seismic Risk Assessment of Infrastructure Systems through Machine Learning: Active Learning Approach, J. Struct. Eng., 146, 04020269, https://doi.org/10.1061/(asce)st.1943-541x.0002831, 2020.
Mangalathu, S., Sun, H., Nweke, C. C., Yi, Z., and Burton, H. V.: Classifying earthquake damage to buildings using machine learning, Earthq. Spectra, 36, 183–208, https://doi.org/10.1177/8755293019878137, 2020.
Milutinovic, Z. and Trendafiloski, G.: Risk-UE An advanced approach to earthquake risk scenarios with applications to different european towns, Rep. to WP4 vulnerability Curr. Build., 1–83, https://doi.org/10.1007/978-1-4020-3608-8_23, 2003.
Ministerio de Vivienda y Urbanismo (MINVU): National Housing Reconstruction Program, https://www.preventionweb.net/files/28726_plandereconstruccinminvu.pdf (last access: 29 September 2023), 2010 (in Spanish).
Morfidis, K. and Kostinakis, K.: Approaches to the rapid seismic damage prediction of r/c buildings using artificial neural networks, Eng. Struct., 165, 120–141, https://doi.org/10.1016/j.engstruct.2018.03.028, 2018.
Mouroux, P. and Le Brun, B.: Presentation of RISK-UE Project, B. Earthq. Eng., 44, 323–339, https://doi.org/10.1007/S10518-006-9020-3, 2006.
Ministere des Travaux Publics, Transports et Communications (MTPTC): Evaluation des Bâtiments: https://www.mtptc.gouv.ht/accueil/recherche/article_7.html, last access: 26 September 2023.
NPC: Post disaster needs assessment, https://www.npc.gov.np/images/category/PDNA_volume_BfinalVersion.pdf (last access: 27 September 2023), 2015.
Pedregosa, F., Varoquaux, G., Buitinck, L., Louppe, G., Grisel, O., and Mueller, A.: Scikit-learn, GetMobile Mob. Comput. Commun., 19, 29–33, https://doi.org/10.1145/2786984.2786995, 2011 (code available at: https://scikit-learn.org/stable/install.html).
Riedel, I., Guéguen, P., Dunand, F., and Cottaz, S.: Macroscale vulnerability assessment of cities using association rule learning, Seismol. Res. Lett., 85, 295–305, https://doi.org/10.1785/0220130148, 2014.
Riedel, I., Guéguen, P., Dalla Mura, M., Pathier, E., Leduc, T., and Chanussot, J.: Seismic vulnerability assessment of urban environments in moderate-to-low seismic hazard regions using association rule learning and support vector machine methods, Nat. Hazards, 76, 1111–1141, https://doi.org/10.1007/s11069-014-1538-0, 2015.
Roeslin, S., Ma, Q., Juárez-Garcia, H., Gómez-Bernal, A., Wicker, J., and Wotherspoon, L.: A machine learning damage prediction model for the 2017 Puebla-Morelos, Mexico, earthquake, Earthq. Spectra, 36, 314–339, https://doi.org/10.1177/8755293020936714, 2020.
Salehi, H. and Burgueño, R.: Emerging artificial intelligence methods in structural engineering, Eng. Struct., 171, 170–189, https://doi.org/10.1016/j.engstruct.2018.05.084, 2018.
Scala, S. A., Del Gaudio, C., and Verderame, G. M.: Influence of construction age on seismic vulnerability of masonry buildings damaged after 2009 L'Aquila earthquake, Soil Dyn. Earthq. Eng., 157, 107199, https://doi.org/10.1016/J.SOILDYN.2022.107199, 2022.
Schorlemmer, D., Beutin, T., Cotton, F., Garcia Ospina, N., Hirata, N., Ma, K.-F., Nievas, C., Prehn, K., and Wyss, M.: Global Dynamic Exposure and the OpenBuildingMap - A Big-Data and Crowd-Sourcing Approach to Exposure Modeling, EGU General Assembly 2020, Online, 4–8 May 2020, EGU2020-18920, https://doi.org/10.5194/egusphere-egu2020-18920, 2020.
Seo, J., Dueñas-Osorio, L., Craig, J. I., and Goodno, B. J.: Metamodel-based regional vulnerability estimate of irregular steel moment-frame structures subjected to earthquake events, Eng. Struct., 45, 585–597, https://doi.org/10.1016/j.engstruct.2012.07.003, 2012.
Silva, V., Pagani, M., Schneider, J., and Henshaw, P.: Assessing Seismic Hazard and Risk Globally for an Earthquake Resilient World, Contrib. Pap. to GAR 2019, 24 pp., https://api.semanticscholar.org/CorpusID:208785925 (last access: 29 September 2023), 2019.
Silva, V., Brzev, S., Scawthorn, C., Yepes, C., Dabbeek, J., and Crowley, H.: A Building Classification System for Multi-hazard Risk Assessment, Int. J. Disast. Risk Sc., 13, 161–177, https://doi.org/10.1007/s13753-022-00400-x, 2022.
Stojadinović, Z., Kovačević, M., Marinković, D., and Stojadinović, B.: Rapid earthquake loss assessment based on machine learning and representative sampling, Earthq. Spectra, 38, 152–177, https://doi.org/10.1177/87552930211042393, 2021.
Sun, H., Burton, H. V., and Huang, H.: Machine learning applications for building structural design and performance assessment: State-of-the-art review, J. Build. Eng., 33, 101816, https://doi.org/10.1016/j.jobe.2020.101816, 2021.
Wald, D. J., Worden, B. C., Quitoriano, V., and Pankow, K. L.: ShakeMap manual: technical manual, user's guide, and software guide, Techniques and Methods, 134 pp., https://doi.org/10.3133/tm12A1, 2005.
Wang, C., Yu, Q., Law, K. H., McKenna, F., Yu, S. X., Taciroglu, E., Zsarnóczay, A., Elhaddad, W., and Cetiner, B.: Machine learning-based regional scale intelligent modeling of building information for natural hazard risk management, Autom. Constr., 122, 103474, https://doi.org/10.1016/j.autcon.2020.103474, 2021.
Xie, Y., Ebad Sichani, M., Padgett, J. E., and DesRoches, R.: The promise of implementing machine learning in earthquake engineering: A state-of-the-art review, Earthq. Spectra, 36, 1769–1801, https://doi.org/10.1177/8755293020919419, 2020.
Xu, Y., Lu, X., Cetiner, B., and Taciroglu, E.: Real-time regional seismic damage assessment framework based on long short-term memory neural network, Comput. Civ. Infrastruct. Eng., 1–18, https://doi.org/10.1111/mice.12628, 2020.
Xu, Z., Wu Y., Qi, M., Zheng, M., Xiong, C., and Lu, X.: Prediction of structural type for city-scale seismic damage simulation based on machine learning, Appl. Sci., 10, 1795, https://doi.org/10.3390/app10051795, 2020.