the Creative Commons Attribution 4.0 License.
the Creative Commons Attribution 4.0 License.
 | 04 Feb 2022
ProbFire: a probabilistic fire early warning system for Indonesia
Tadas Nikonovas
Allan Spessa
Stefan H. Doerr
Gareth D. Clay
Symon Mezbahuddin
Recurrent extreme landscape fire episodes associated with drought events in Indonesia pose severe environmental, societal and economic threats. The ability to predict severe fire episodes months in advance would enable relevant agencies and communities to more effectively initiate fire-preventative measures and mitigate fire impacts. While dynamic seasonal climate predictions are increasingly skilful at predicting fire-favourable conditions months in advance in Indonesia, there is little evidence that such information is widely used yet by decision makers.
In this study, we move beyond forecasting fire risk based on drought predictions at seasonal timescales and (i) develop a probabilistic early fire warning system for Indonesia (ProbFire) based on a multilayer perceptron model using ECMWF SEAS5 (fifth-generation seasonal forecasting system) dynamic climate forecasts together with forest cover, peatland extent and active-fire datasets that can be operated on a standard computer; (ii) benchmark the performance of this new system for the 2002–2019 period; and (iii) evaluate the potential economic benefit of such integrated forecasts for Indonesia.
ProbFire's event probability predictions outperformed climatology-only based fire predictions at 2- to 4-month lead times in south Kalimantan, south Sumatra and south Papua. In central Sumatra, an improvement was observed only at a 0-month lead time, while in west Kalimantan seasonal predictions did not offer any additional benefit over climatology-only-based predictions. We (i) find that seasonal climate forecasts coupled with the fire probability prediction model confer substantial benefits to a wide range of stakeholders involved in fire management in Indonesia and (ii) provide a blueprint for future operational fire warning systems that integrate climate predictions with non-climate features.
- Article
(7152 KB) - Full-text XML
-
Supplement
(1690 KB) - BibTeX
- EndNote


Recurrent severe fires in Indonesia release globally significant amounts of greenhouse gases and particulate matter into the atmosphere. Emitted toxic haze can shroud the region for several months (Marlier et al., 2013), with devastating impacts on people's health and livelihoods (Crippa et al., 2016; H. H. Lee et al., 2017), whilst also damaging local ecosystems and biodiversity (B. P. Lee et al., 2017). Every year, during the dry season, fire is widely used for land clearing and in agriculture across the archipelago. In some years, however, anomalously severe droughts do develop, triggering catastrophic uncontrolled burning events. Two of the biggest such episodes, the 1997–1998 and 2015 events each released 0.81–2.57 (Page et al., 2002) and 0.21–0.53 Tg C (Huijnen et al., 2016; Yin et al., 2016), equivalent to 12 %–40 % and 2 %–5 % of total global carbon emissions for the year, respectively (Boden et al., 2017). Increasingly skilful seasonal climate predictions by dynamic forecasting systems (Doblas-Reyes et al., 2013; Johnson et al., 2019) can potentially be utilized in early warning systems, helping to prepare for and mitigate the worst of the damaging burning events. However, relevant non-climatic drivers of fire occurrence have to date not been integrated with seasonal climate predictions, leaving an untapped potential for improving early fire event prediction systems. Furthermore, evaluation of the potential value of such predictions for the decision makers in the region has not yet been carried out to date.
In recent decades, Indonesia's fire problem has been exacerbated by non-climatic drivers such as commodity-driven loss and degradation of primary forests (Turubanova et al., 2018), drainage of peatlands (Hooijer et al., 2012), and conversion of land to industrial plantations and small-holder agriculture (Miettinen et al., 2012). Loss of fire-resilient closed-canopy forests (Cochrane et al., 1999; Nikonovas et al., 2020) has resulted in more severe local fire weather due to increased surface heating and substantially warmer microclimates in the deforested landscapes (Sabajo et al., 2017). In peatlands, fire presence was also increased by artificially lowered water table depth due to extensive drainage, which, in combination with increased surface heating, has exposed more peat to desiccation (Jauhiainen et al., 2014) and the establishment of fire-prone herbaceous vegetation in deforested areas (Hoscilo et al., 2011). These factors, coupled with widespread use of fire by humans for land clearing and crop rotation (Cattau et al., 2016), have dramatically amplified drought sensitivity of fire activity across the region.
The duration and severity of the dry season in different parts of the Indonesian archipelago is modulated by interactions between atmospheric processes associated with interannual irregular oscillations in sea surface temperature anomalies in the Pacific and Indian oceans. Drier-than-normal conditions across Indonesia are generally associated with cooler-than-normal sea surface temperatures (SSTs) which occur during a strong positive El Niño–Southern Oscillation (ENSO) event (El Niño) and/or positive phase of the Indian Ocean Dipole (IOD) cycle. Reduced precipitation in south Sumatra, south Kalimantan and south Papua are typically linked to El Niño events, while dry conditions in northern central Sumatra tend to coincide with a positive IOD phase (Aldrian and Dwi Susanto, 2003; Field and Shen, 2008; Field et al., 2016). While the most severe droughts and widespread burning do occur when both El Niño and IOD are in positive phases (Reid et al., 2012; Pan et al., 2018), short droughts and associated burning events can also develop in neutral ENSO and IOD years, triggered by events such as the dry phase of the Madden–Julian Oscillation (Gaveau et al., 2014; Oozeer et al., 2020).
The chaotic nature of atmospheric circulation (Lorenz, 1963) prevents reliable numerical weather prediction beyond a couple of weeks (Bauer et al., 2015). Nonetheless, current state-of-the-art dynamic seasonal forecasting systems show skill in seasonal prediction of 2 m air temperature and precipitation, especially in tropical regions (Doblas-Reyes et al., 2013; Johnson et al., 2019). The predictability of these chaotic weather parameters at monthly timescales is attributable to an increasingly realistic representation of slowly evolving SST anomalies associated with the ENSO and IOD variability in seasonal climate forecasting systems (Stockdale et al., 1998; Johnson et al., 2019; Fan et al., 2020; Lavaysse et al., 2020).
Global assessments of seasonal predictability of fire activity have shown that climate information from dynamic models (Turco et al., 2018) and observed sea surface temperature anomalies (Chen et al., 2016, 2020) can be used to skilfully predict fire occurrence across different regions, including Indonesia. Other studies focused on Indonesia have demonstrated that anomalous drought conditions can be predicted up to a few months in advance (Spessa et al., 2015; Shawki et al., 2017). However, these previous efforts did not integrate non-climate information into fire activity prediction models and had only aggregated regional resolution.
The climate–fire relationship in Indonesia is strongly regulated at finer spatial scales by human-driven rapid transformation of land cover in Indonesia, particularly in peatland ecosystems (Miettinen et al., 2012; Turubanova et al., 2018; Nikonovas et al., 2020). As such, land cover change and forest fragmentation are critical ingredients for predicting fire activity in Indonesia. No studies have assessed how well the skill of seasonal drought prediction at regional scales translates to fire activity forecasting at fine spatial scales, which would add value to potential users of the forecasts such as fire managers, forest conservationists and peatland protection agencies. While the integration of non-climate information datasets, development of high-spatial-resolution probabilistic forecasting models and long-term performance validation have been identified by the previous studies as key requirements for building future early warning systems and increasing the usability of the seasonal climate information in fire management (Spessa et al., 2015; Chen et al., 2016; Turco et al., 2018), these challenges have not yet been addressed.
This study aims to (i) move beyond seasonal forecasting of fire activity solely as a function of climate variables, (ii) provide a blueprint for future operational landscape-scale fire forecasting systems and (iii) evaluate the system from a potential user's perspective in terms of skill and economic utility. Specifically, we developed a probabilistic early fire warning system (ProbFire) for Indonesia that integrates information from ECMWF SEAS5 (fifth-generation seasonal forecasting system) seasonal climate forecasts and non-climate datasets and produces probabilistic fire event predictions at 0.25∘ spatial resolution with monthly time steps. ProbFire performance was assessed using MODIS active-fire observations during the 2002–2019 period. To assess the added value of SEAS5 seasonal forecasts, the ERA5 climatology-based model was used as a benchmark. In addition to evaluating model skill at predicting observed fire occurrences, we also assessed the economic value and benefits of ProbFire predictions for potential stakeholders in Indonesia and beyond.
2.1 Fire activity data
As a proxy for fire activity across Indonesia this study used the Collection 6.1 active-fire dataset MCD14ML (Giglio et al., 2016) based on Moderate Resolution Imaging Spectroradiometer (MODIS) imagery at thermal wavelengths. The product contains centre coordinates of MODIS pixels (∼ 1 km2 at nadir, ∼10 km2 at the extreme sensor view edge) which were flagged as active fires by the thermal-anomalies algorithm.

Figure 1Study region showing total MODIS active-fire counts for the 2002–2019 period at 0.25∘ resolution. Also shown are the bounding boxes of the sub-regions used in the study.
The MCD14ML product has been shown to perform well in detecting large fire events and to have a low false-alarm rate. Validation of the product for the equatorial Asia region indicated 8 % error of commission (Giglio et al., 2016). Low levels of false detections were also confirmed during the 2013 burning episode in north Riau, where 96 % of MODIS active-fire pixels were found to fall within the burned-area extent estimated using higher-resolution imagery (Gaveau et al., 2014). Omission errors for small fires of the MODIS active-fire product are inevitably high due to the relatively coarse spatial resolution of the sensor (pixel size of 500 m at nadir). For fires over 0.125 km2 in size, the estimated omission error was 10 %, while for fires of 0.250 km2 or larger, the omission error was below 5 % (Giglio et al., 2016). Although low-temperature smouldering peatland fires are generally more difficult to detect using thermal-anomalies algorithms (Giglio et al., 2016), such fires typically have long residence times, and as a result detection probability increases with each satellite overpass. In any case, omission of small fires in the product is not critical for early warning systems aimed at alerting the risk of unusually high-fire-activity events, rather than quantify fire effects such as fire-affected area. A recent study comparing fire emission inventories based on MODIS burned-area and active-fire datasets for Indonesia showed that active-fire-based emission models reproduce regional aerosol optical thickness more accurately when compared to burned-area methods, resulting in a smaller underestimation of fire activity in extreme burning years (Liu et al., 2020).
Fire occurrence patterns in Indonesia and prediction objective
The MODIS active-fire detections were aggregated to a 0.25∘ spatial grid and monthly time step. Monthly active-fire counts were used both as model training targets and for prediction validation. Most of the grid cells (∼80 %) did not have any active fires for the given month. Active-fire counts for the grid cells with fire detections (∼20 % of the dataset) were highly skewed, with the majority containing very few detections, while the relatively low number of grid cells had very high monthly fire counts (up to ∼2500). Approximately three-quarters of the grid cells with active-fire detections had 1–10 fire pixels, while the remaining upper quartile (5 % of the total dataset) had >10 active-fire detections per month. Importantly, while the number of grid cells having a low active-fire pixel count (1–10) show a clear pattern of Indonesia's dominant dry season (Aldrian and Dwi Susanto, 2003), there are only small differences when comparing the fire grid cell counts for different years (Fig. 2a). In contrast, the number of the top quartile of all fire-containing grid cells varied considerably more between years. Total active-fire counts depicted in Fig. 2b exhibit even greater interannual variability indicating that most of the region's fire impacts can be attributed to the grid cells containing >10 fire pixels.
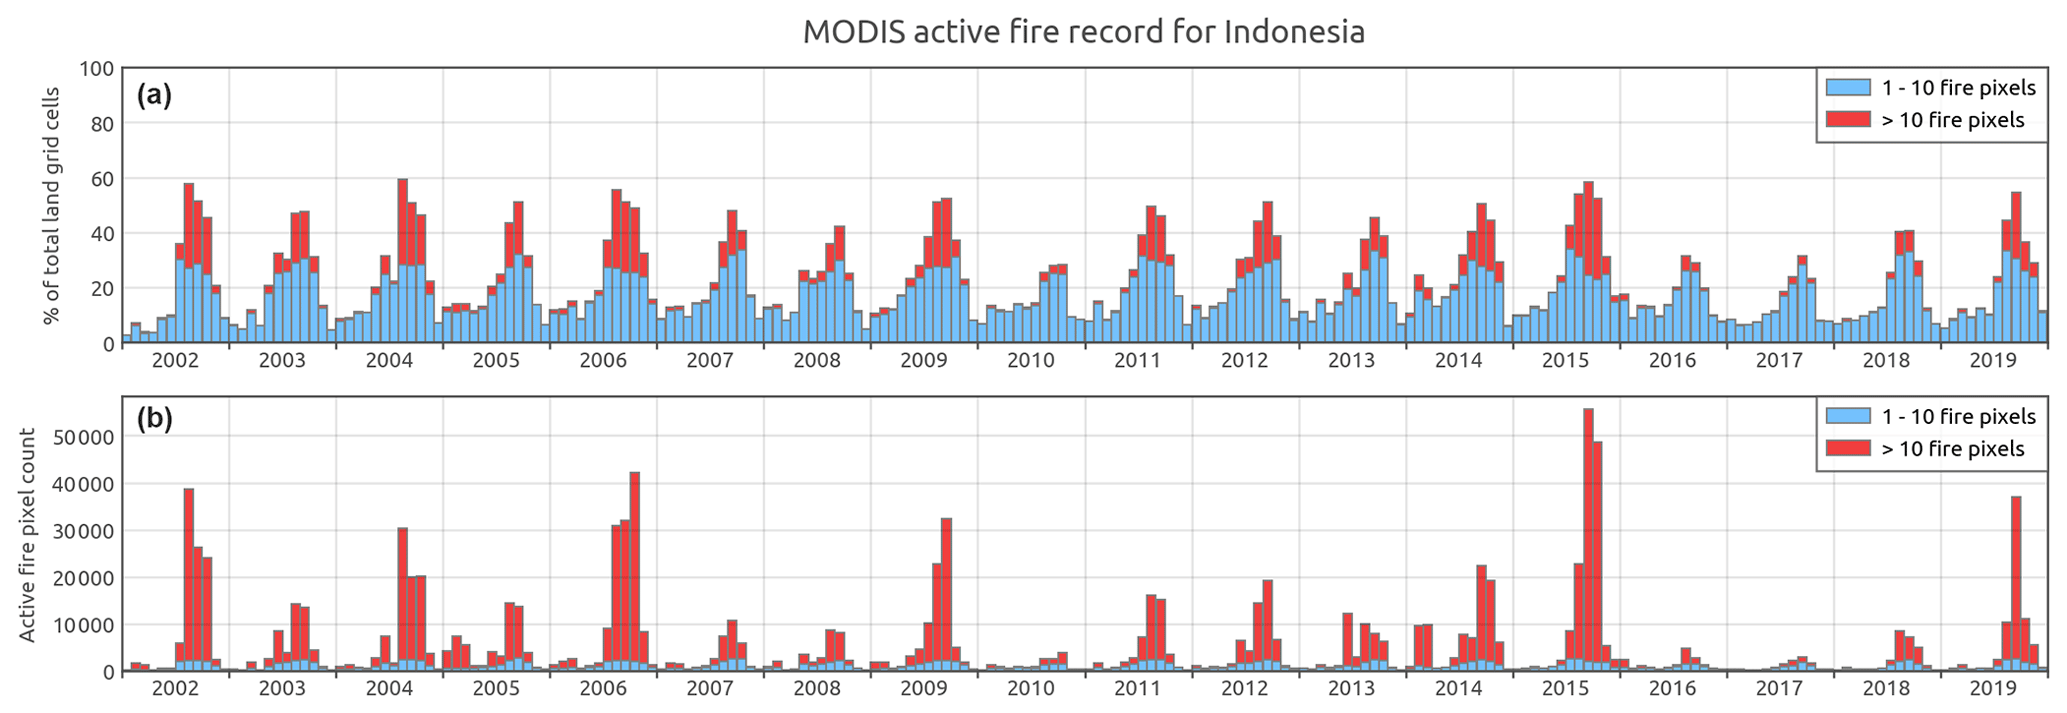
Figure 2MODIS active-fire record for Indonesia during the 2002–2019 period. (a) Percentage of total land grid cells in the study region (n=2080) with active-fire detections. The two categories shown are for grid cells with relatively low fire counts (1–10 fire pixels per month) and a higher degree of fire presence (>10 fire pixels) in blue and red colours, respectively. (b) Total monthly MODIS active-fire counts attributable to grid cells of the two categories.
The main objective of ProbFire is to predict the probability that the monthly active-fire count will exceed a given threshold. We present results of predicting both the monthly active-fire count of >0 cases (20 % of the dataset) and the monthly active-fire count of >10 cases (5 % of the dataset); our analysis focuses on the latter class. While prediction of increasingly rare events is a more challenging problem, it is also a more important one due to the greater impacts that such fire events have.
2.2 Climate variables
This study used three climatic variables as inputs for prediction of fire activity in Indonesia: total precipitation, air temperature and relative humidity. These climate indicators are strongly linked to fire occurrence and as a result are widely used as key inputs for calculating various fire danger indices (van Wagner and Forest, 1987; Dowdy et al., 2009). The variables were obtained from the European Centre for Medium-Range Weather Forecasts (ECMWF) gridded reanalysis and long-range forecasts products distributed via the Copernicus Climate Change Service. For model training, validation and computing climatological values we employed the ECMWF's ERA5 reanalysis dataset, while for predictions of fire occurrence probability at 0- to 5-month lead times we have used ECMWF's SEAS5 long-range forecasting model simulations.
ERA5 is the latest version of ECMWF reanalysis products. It is based on the centre's Integrated Forecast System's coupled atmosphere–ocean model simulations constrained with many assimilated satellite-based and in situ observational datasets (Hersbach et al., 2020). The ERA5 product used in this study has a regular longitude–latitude grid with a 0.25∘ spatial resolution and 1-hourly time step. We have resampled the ERA5 weather parameters to monthly values by computing the monthly mean 2 m temperature, mean monthly 2 m relative humidity and total monthly precipitation.
SEAS5 is the fifth-generation ECMWF seasonal forecasting system and has been operational since 2017 (Johnson et al., 2019). The system consists of 51 ensemble members which are initialized on the first day of every month and simulate the state of the atmosphere for a 7-month period. The individual ensemble members are initialized using perturbed initial conditions and atmospheric model parameters to represent uncertainties associated with the initial state and missing or misrepresented model processes. While the system consists of 51 ensemble members when operated in forecasting mode (since 2017), for the years prior to 2017 the SEAS5 system was initialized using only 25 members producing climate hindcasts (alternatively termed reforecasts) for the period covering 1981–2016. In this study, we used the same subset of 25 SEAS5 members which were available for the whole of the study period covering 2002 through 2019, and we also used term forecasts in describing SEAS5 data from both hindcast and forecast periods. The spatial resolution of the SEAS5 product was 1∘, while the temporal step was 1 month.
While the mean 2 m temperature was readily available and total monthly precipitation was simply calculated from precipitation rates given in the respective ERA5 and SEAS5 products, relative humidity was derived from the 2 m temperature and 2 m dew point temperature using August–Roche–Magnus approximation (Alduchov and Eskridge, 1996):
where RH is relative humidity, td is the 2 m dew point temperature and t is the 2 m temperature. In total, we used eight climate features as inputs into ProbFire: total monthly precipitation, total monthly precipitation for the 5 preceding months (t−1 to t−5), mean monthly temperature and mean monthly relative humidity. Precipitation for 5 months preceding the month of interest was included to characterize long-term build-up of drought conditions, and the number of months was determined empirically during the model optimization stage.
SEAS5 bias and variance adjustment
Raw SEAS5 model ensemble forecasts, like any other long-range climate modelling system outputs, are affected by systematic model biases and drift, and, as a result, forecast climatology (for example long-term mean and variance) is often significantly different from the observed climatology (Doblas-Reyes et al., 2013; Johnson et al., 2019). Furthermore, publicly available SEAS5 forecasts have a spatial resolution of 1∘ and consequently cannot represent local conditions well, particularly in coastal and mountainous areas (Fig. 3).
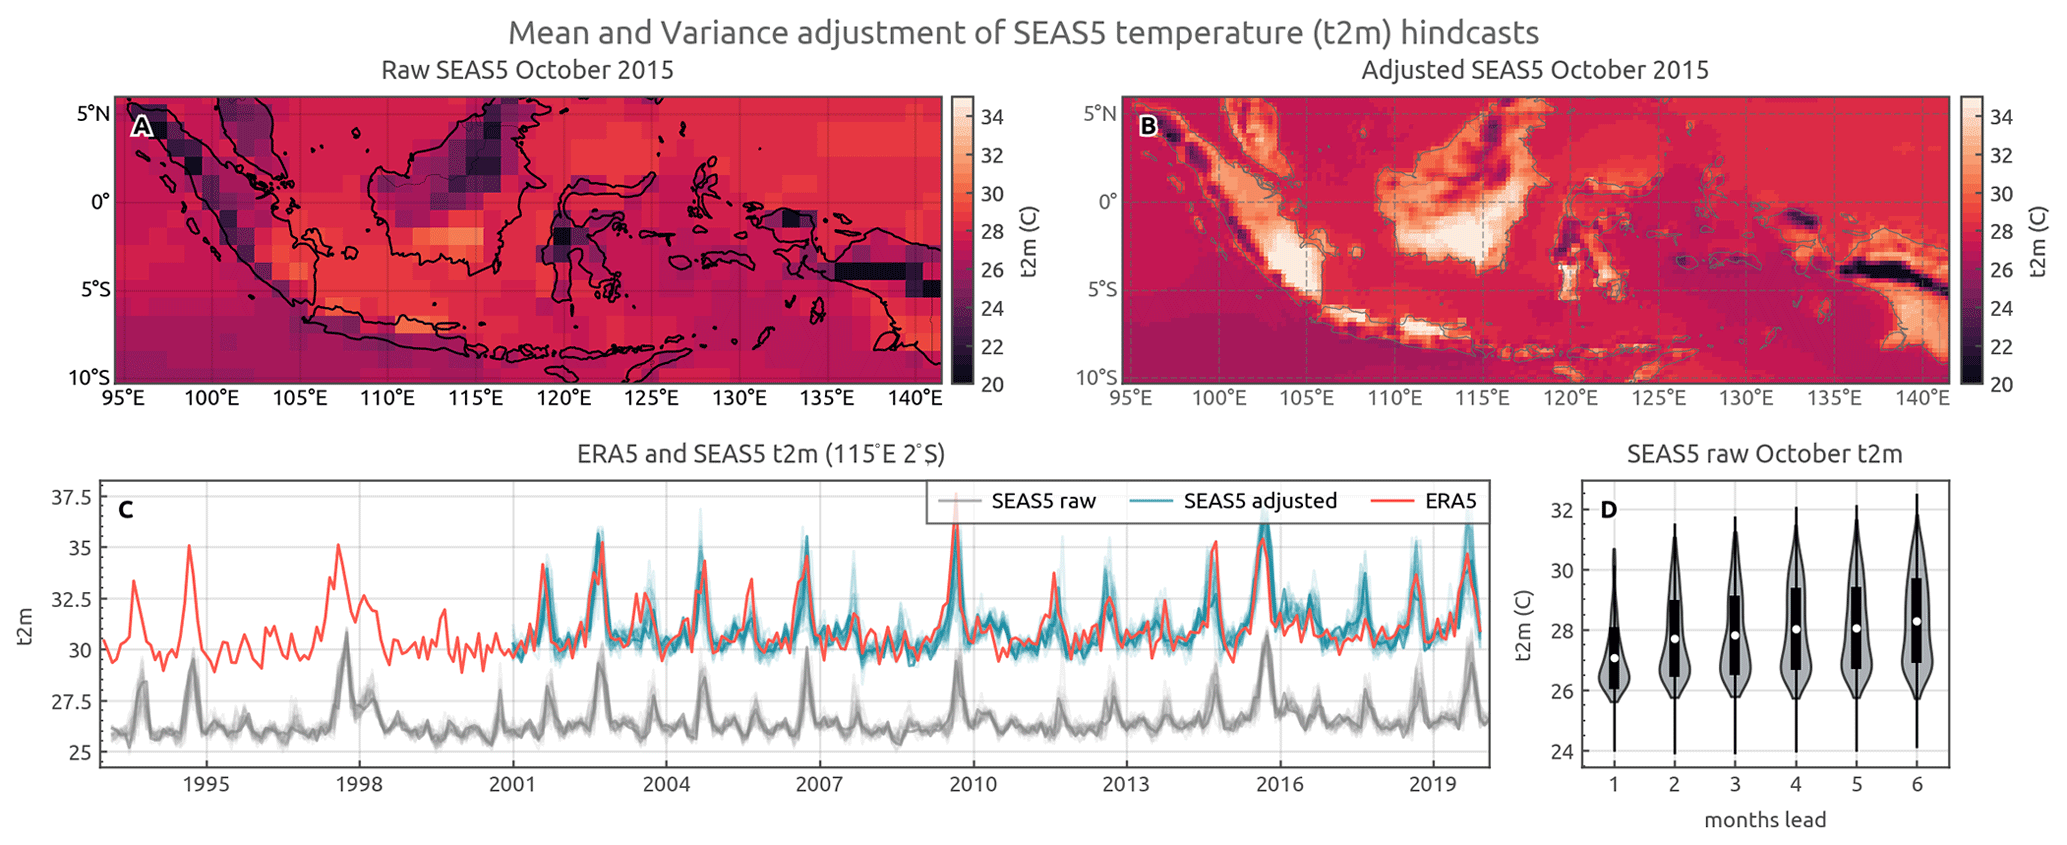
Figure 3Illustration of mean and variance adjustment applied to raw SEAS5 ensemble member forecasts. (a) Raw SEAS5 member of 1 for temperature at 2 m (t2m) for October 2015 with a lead time of 2 months. (b) October 2015 mean-and-variance-adjusted 2 m temperature of the same SEAS5 member based on calibration against overlapping 1993–2019 series between the ERA5 reanalysis and SEAS5 forecasts. (c) SEAS5 ensemble member raw and bias-adjusted and ERA5 2 m temperature at the 115∘ E, 2∘ S location for the 1993–2019 period (bias-corrected SEAS5 is only shown for the study period 2002–2019). (d) Mean SEAS5 member 2 m temperature for all October months in the record for different lead times, showing ensemble mean drift (warming in this case) and increasing spread.
To address SEAS5 biases and to downscale SEAS5 hindcasts to match the spatial resolution of the ERA5 reanalysis (0.25∘), we performed a mean and variance adjustment (MVA) of the raw SEAS5 outputs. The method has been extensively applied in seasonal forecasting (Barnston, 1994; Doblas-Reyes et al., 2005) and has been shown to have similar performance when compared to more complex and computationally intensive methods (Manzanas et al., 2019).
The MVA was applied in two steps. First, the raw SEAS5 forecast data at 1∘ resolution were re-gridded to match the 0.25∘ resolution of the ERA5 reanalysis data using nearest-neighbour interpolation. Second, the mean and variance of monthly hindcasts for each SEAS5 ensemble member were transformed to match those ERA5 values of the 1993–2019 period for that grid cell following Eq. (2):
where fcorm,t and frawm,t are the mean-and-variance-adjusted and raw SEAS5 hindcast ensemble member m for month t, is the SEAS5 ensemble mean of all times t, is the ERA5 mean for month t, σo denotes the ERA5 standard deviation, and σf is the SEAS5 ensemble standard deviation for the calibration period (Fig. 3). The calibration period was 1993–2019, as determined by the availability of both the SEAS5 hindcasts and ERA5 reanalysis on the Copernicus Climate Change Service system (https://cds.climate.copernicus.eu, last access: 31 January 2022).
2.3 Non-climate variables
In addition to the climate variables, we used environmental features which are closely associated with fire occurrence in the region. These datasets were per-grid-cell peatland extent, past fire activity, primary-forest cover extent, primary-forest loss in the previous year and secondary-forest loss in the previous year (described in detail in the following paragraphs). In contrast to climate features which had a monthly time step, all the environmental features had an annual time resolution except for peatland extent, which was fixed for the whole study period. While numerous other sources of potential feature data exist, they were not selected because they did not cover the whole of Indonesia for the full study period and/or did not have at least an annual time step. This last criterion was particularly important for determining the selection of datasets because the fire prediction model was built to form the basis for an operational early fire warning system.
2.3.1 Past fire activity
In many parts of the region, in deforested and unmanaged peatlands in particular, the fire return interval is short due to frequent repeated anthropogenic burning (Cattau et al., 2016). Frequent fires prevent forest regrowth, and the landscape becomes dominated by flammable grasses (Hoscilo et al., 2011). The positive feedback between fire and vegetation means that areas which did experience burning in the past are more likely to burn again. To represent fire occurrence in previous years as a model input, the maximum monthly active-fire detection count for each 0.25∘ grid cell in the years preceding the prediction year was used.
We used two different active-fire products to cover past fire observations for all years in the study period (2002–2019). The MODIS active-fire record was extended beyond 2002 with Along Track Scanning Radiometer (ATSR) World Fire Atlas (WFA) nighttime fire monthly counts for the 1997–2001 period. This was done to reduce the impact of the lack of past fire observations for the first few years in the study period on the model performance. The ATSR WFA nighttime fire product contains several times fewer active-fire detections when compared to the MODIS product due to a lack of daytime retrievals (Arino et al., 2012), and as a result, pre-2002 maximum monthly counts are underestimated when compared to the MODIS estimates. However, this step was important to identify areas affected by the 1997–1998 El Niño event and the associated fire episode which was one of most severe in Indonesia's history (Page et al., 2002).
2.3.2 Forest cover features
Loss and degradation of primary-forest cover in recent decades has been closely associated with an increase in fire occurrence in the region (Langner and Siegert, 2009; Field et al., 2016). Undisturbed humid primary forests in Indonesia are extremely fire-resilient (Cochrane et al., 1999; Nikonovas et al., 2020) and can resist ignition even during prolonged droughts. By contrast, industrial plantations and agricultural land, which are replacing primary forests, have substantially higher fire activity rates (Nikonovas et al., 2020). We used two high-resolution Landsat data-based tree cover datasets used to represent changes in forest cover during the study period at 0.25∘ spatial resolution and at an annual time step. A co-located analysis of primary-forest cover extent in the year 2000 (Margono et al., 2014) and version 1.6 of the dataset of global annual forest cover loss (Hansen et al., 2013), which covers 2001 to 2018, was performed to determine annual primary-forest cover fraction, primary-forest loss and secondary-forest loss. Pixels classed as primary forest in the year 2000 were matched with the pixels for annual forest loss for the years 2001–2018. Firstly, we determined if the estimated forest loss had occurred in primary- or secondary-forest areas. Secondly, primary-forest cover loss for each year was derived by subtracting cumulative primary-forest loss from the year 2000 primary-forest extent estimate. Following these two steps, the annual primary-forest cover, primary-forest loss and secondary-forest cover loss estimates at the Landsat pixel level were aggregated to the study's 0.25∘ resolution.
Definitions of forest cover and primary forests in this study follow the definitions given in the global forest cover loss and primary-forest extent of the year 2000 products. Both datasets considered all Landsat pixels with a tree height of >5 m and canopy cover of >30 % as forest cover. Primary forest was defined as a contiguous block of >5 ha of natural forest which has not been cleared in recent decades. Note that the definition of primary forest includes both intact and degraded primary-forest types (Margono et al., 2014). Forest cover loss in the dataset of annual forest cover loss was defined as a stand replacement disturbance. Both Landsat-based forest cover datasets were found to agree well with alternative estimates. The primary-forest extent of the year 2000 dataset showed approximately 90 % agreement when compared to the primary-forest map of the year 2000 issued by the Ministry of Forestry of Indonesia (Margono et al., 2014), while validation of tree cover loss suggested that forest loss was correctly flagged in more than 80 % of the cases (producer's accuracy of 83.1 %) in tropical regions (Hansen et al., 2013).
2.3.3 Peatland fraction
Deforestation and drainage of the region's carbon-rich peatlands in recent decades has rendered large amounts of near-surface peat vulnerable to frequent repeated burning (Hoscilo et al., 2011). Intentional fires in peatlands that are ignited to clear land and prevent vegetation regrowth often develop into uncontrolled sub-surface peat combustion events which may last weeks or even months (Widyastuti et al., 2020). As a result, the region's peatlands experience fire occurrence rates up to several times higher when compared to non-peatlands (Vetrita and Cochrane, 2020; Nikonovas et al., 2020). To represent elevated fire activity in peatland areas we estimated the peatland fraction in the 0.25∘ grid cells using the high-resolution vector maps of peatland distribution and carbon content by Haryono et al. (2011). The vector maps were rasterized to a 0.01∘ grid. Any cells whose centroid was inside the peatlands polygons were considered peat areas. Following the rasterization step, the peatland's fraction at 0.25∘ resolution was determined from the number of 0.01∘ cells classed as peatlands falling within the lower-resolution cells.
2.3.4 Sub-region identifier features
Drivers of fire activity varying across different parts of the archipelago have different fire activity rates even when experiencing comparable drought conditions (Aldrian and Dwi Susanto, 2003; Field and Shen, 2008; Field et al., 2016). To enable the model to represent regional differences in drought sensitivity across Indonesia, we used five additional features representing binary identifiers for each of five sub-regions within Indonesia (Fig. 1).
3.1 The model
To predict fire occurrence probability we used a multilayer perceptron (MLP) classifier (i.e. a shallow artificial neural network) (Hastie et al., 2009). The main reason for choosing an MLP model was the fact that MLPs do produce well-calibrated probabilities, while at the same time they are able to approximate more complex non-linear relationships when compared to simpler probabilistic prediction models such as logistic regression (Niculescu-Mizil and Caruana, 2005; Guo et al., 2017).
The model consisted of three fully connected layers: a layer with 18 inputs (see Fig. S3), one hidden layer with 15 nodes and an output layer with 2 nodes. For the hidden layer, rectified linear unit (ReLU) activations were used, while sigmoid activation was applied to the output layer nodes to obtain class (active-fire counts below or above the threshold) probabilities. The model weights were optimized by employing an LBFSG (limited-memory Broyden–Fletcher–Goldfarb–Shanno algorithm) solver with a learning rate value of 0.001 and cross-entropy loss function using L2 regularization with an alpha parameter value of 1. The input features (climate parameters and land cover information) were scaled to a zero mean and unit variance. The model architecture and optimal parameter setup were determined by performing grid search cross-validation and evaluating the model's performance on validation data. The model (http://github.com/ToFEWSI/ProbFire, last access: 31 January 2022) was implemented in the Python 3 programming language using the scikit-learn machine learning library (Pedregosa et al., 2011).
3.2 Model validation design
To evaluate ProbFire performance, we employed a leave-1-year-out training and testing dataset splitting strategy. This approach provides a more realistic representation of the potential of the model to forecast fire occurrence probabilities for future fire seasons. The whole 17-year record was used (2002–2019), and the MLP model was iteratively trained using 16 years' worth of ERA5 reanalysis climate and land cover data and predicting fire probabilities for the left-out year. For example, fire occurrence probabilities for year x were predicted and evaluated using data from all years except year x for model training. This resulted in 17 different realizations of the model (one for each year in the record) all having different weights and biases, due to different subsets of the dataset being used for training. Pretrained models with weights and biases are available at https://doi.org/10.5281/zenodo.5206278 (Nikonovas, 2021a).
3.3 ERA5-based predictions
The first set of model predictions was made using ERA5 reanalysis monthly climate values employing the leave-1-year-out strategy. This set of predictions represents the base model and the best-case scenario of this study's fire activity prediction results.
3.4 SEAS5-based predictions
ProbFire prediction of fire probability at lead times of 0–5 months was based on SEAS5 climate forecasts for the corresponding lead times. Total precipitation for the previous months (t−1 through t−5) was also based on SEAS5 values for the months within the lead time window, while ERA5 precipitation for the previous months was used if those months were outside the lead time period. For example, prediction for October 2015 at a 2-month lead time was based on the SEAS5 hindcast issued in August 2015. Precipitation for the preceding months, t−1 and t−2, was also based on the SEAS5 hindcasts issued in August; meanwhile total precipitation for the months t−3 through t−5 was derived from ERA5 precipitation rates for July–May 2015. This approach enabled us to utilize all the observational information available at the time when forecasts were issued.
3.5 Climatology model
The potential skill and value of long-range fire predictions based on SEAS5 seasonal climate forecasts was benchmarked against climatology-based model predictions. The climatology model had the same input features, except that SEAS5 forecasts were substituted with ERA5 mean values for the 1993–2019 period for a given month. Like the forecasting feature setup, climatological values of total precipitation for the preceding months were used for the months within the forecasting time window; otherwise ERA5 total precipitation was used. For example, climatology-based prediction for October 2015 at a lead time of 2 months was constructed using mean climate values for October 1993–2019 and climatological values of total precipitation for September and August (t−1 and t−2), but ERA5-based values were used for total precipitation at months t−3 to t−5.
3.6 Model performance evaluation
3.6.1 Skill scores
To assess model performance, we used reliability diagrams (Murphy and Winkler, 1992), the probability of detection and false-alarm rate analysis (receiver operating characteristic) (Mason, 1982), and the Brier score (Murphy, 1973). Reliability diagrams inform how well predicted-event occurrence probabilities correspond to the actual observed-event frequency. For example, we would have a reliable forecast if taking all cases when 70 % event probability was issued; the event would have occurred in close to 70 % of those cases. The reliability diagrams were calculated by splitting predicted probabilities into 10 equally spaced bins in a range of [0, 1] with a step of 0.1 and determining fire event occurrence frequency for each of the bins. To complement the reliability diagrams, we also constructed prediction histograms, which indicate forecast sharpness. Sharpness is a measure of the ability of a forecast to issue a range of probabilities. It is a desirable property of a forecasting system because forecasts that issue low or high event probabilities are potentially more useful. In contrast, while a forecast that often gives probabilities close to event climatological frequency may be reliable, it lacks sharpness and hence is of little use for decision makers.
The probability of detection expresses the fraction of all events that were correctly classified, while the false-alarm rate indicates the fraction of predicted events which did not occur:
where “pod” refers to the probability of detection; “far” refers to the false-alarm rate; TP refers to a true positive, which equals the number of events that have been correctly classified as events; FN refers to a false negative, which is the number of events that were not predicted; and FP refers to false positives, which indicates the number of predicted events that did not occur. The probability of detection is sensitive to true positives but ignores false positives, while the false-detection rate is sensitive to false alarms but ignores false negatives. Both scores may be artificially inflated, by increasing and reducing the number of event forecasts in the case of the probability of detection and false-alarm rate, respectively. While both scores can indicate if the forecasts are potentially useful, they are calculated at a particular probability threshold. In reality, different users might benefit from choosing different probability thresholds at which they decide to act. The receiver operating characteristic (ROC) curve addresses this by showing both the probability of detection and false-alarm rate at a range of increasing probability thresholds. The metric indicates the ability of the forecasting system to discriminate between events and non-events. The area under the receiver characteristic curve is a single number summary score which is used in this study to compare receiver characteristic curves obtained by different models.
The Brier score is a metric that is widely used to evaluate probabilistic predictions (Murphy, 1973; Gneiting and Raftery, 2004). Conceptually it is similar to mean squared error but rather than measuring the difference between observed and predicted real values, the Brier score evaluates the difference between predicted probability in the range [0, 1] and event occurrence:
where ft is the probability of the tth forecast and ot is 0 if the event did not occur and 1 if it did. The score takes values between 0 and 1, with smaller values indicating better skill. The Brier score is sensitive both to discrimination and calibration (reliability), and it is strictly a “proper” score. The latter property forces forecasters to issue a probability which is equal to their true expectation (Gneiting and Raftery, 2004). In contrast to proper scores, “improper” scores can be improved by “hedging”, i.e. issuing probabilities which are different from the true expected probability. The Brier score is sensitive to class prevalence and suffers from becoming vanishingly small for extremely rare events. As a result, it only makes sense to compare the scores of different forecasts for the same sample.
3.6.2 Relative value of the forecasts
The scores discussed above are useful in assessing forecast skill and for comparing the performance of different models; however, they do not explicitly reveal if the decision makers would benefit from using the proposed forecasting system. Indeed, it is possible for forecasts to be simultaneously skilful but not useful. The cost–loss ratio analysis (Murphy, 1985; Richardson, 2000) addresses the usefulness question directly by providing an assessment of the potential economic value of the forecasts. This model, while simplistic and of limited applicability when accounting for non-economic impacts, nonetheless allows us to quantify the value of forecasts for a range of users with a range of specific cost–loss ratios.
For example, if the event is a “peatland fire”, and the action is “fire-preventative measures”, then loss would equal the total economic loss caused by the fire event, and the cost would be the total economic cost of the preventative measures. Each time a decision maker takes no action and a fire event occurs, it results in a loss. Alternatively, every time the decision maker acts it incurs a specific cost. Every time action is taken, and the predicted fire event occurs, the difference between the reduced loss and invested costs constitutes the total amount saved. In Indonesia, a range of different fire-preventative actions could be utilized depending on the lead time of forecasts. Early warning (lead times of several months) would allow forecasters and relevant authorities to inform the communities in fire-prone areas, legislate to prevent agricultural fire use for the season, and increase preparedness and train fire service personal. Forecasts issued at less than 1-month lead times could be utilized to implement local bans of specific fire uses (e.g. agricultural waste burning) and to deploy monitoring and fire-fighting resources to the high-risk areas. A reliable forecasting system, therefore, can inform the decision maker when (and where) to act to minimize the total expenditure. As a result, such a forecasting system has a potential economic benefit, and the cost–loss analysis indicates this potential economic gain, or in other words, the relative value of the forecasts.
This relative value is expressed as a fraction of value of a perfect (theoretical) forecast and indicates improvement over a scenario when the only information available to the user is the climatological-event occurrence frequency. The relative value of a forecast depends on the user-specific cost and loss and is positive over a limited range of cost–loss ratios. If the cost is larger than the loss, not acting is always better and vice versa; if the cost is very low in relation to the potential loss, always acting is the best option. Both these scenarios negate the need for a forecasting system. The potential value of the forecasts is highest at the cost–loss ratio value which is equal to the event climatological frequency. Benefits vary for different users with different cost–loss ratios, and, assuming reliable probabilistic forecasts, an optimum probability decision threshold is equal to the user cost–loss ratio (Richardson, 2000). As a result, users with high cost–loss ratios would benefit most from choosing to act at higher event probability thresholds and vice versa. In this study, relative value was calculated for a range of cost–loss ratios [0.001, 1] following Eqs. (7) and (8).
where is the cost–loss ratio and Pclim is the climatological probability of occurrence of the fire event (i.e. active-fire count of >10 cases) for the sub-region of interest. Note that the relative value (same as the probability of detection and false-alarm rate) is calculated at a particular probability threshold, in effect transforming the continuous probabilistic forecasts to binary predictions of fire event vs. no fire event to derive true positives, false positives and false negatives. As a result, relative values are derived for a range of probability thresholds indicating potential benefits for users with different cost–loss ratios.
3.6.3 Mean SEAS5 ensemble probability
In contrast to the traditional ensemble evaluation methods that derive probabilistic forecasts from the distribution of deterministic predictions of the individual ensemble members, the modelling method employed by this study predicts probabilities of fire counts exceeding a given threshold for all 25 members of the SEAS5 ensemble. For deriving ensemble mean skill scores we combined the estimates based in individual members into a single probability estimate by computing a simple equally weighted average probability.
4.1 Reliability of probability prediction
ProbFire forecasts of active-fire counts of >0 cases in any given grid cell in any particular month generally exhibited a good degree of reliability (Fig. 4). Reliability diagrams of ERA5-based prediction for the study years indicate, with a few exceptions, that for most years reliability curves were close to the perfect diagonal line (Fig. 4a). For low-fire-activity years, the predictions were generally overconfident (i.e. probabilities higher than the observed fire event frequency). Predictions were less reliable only for two of the relatively high-fire-activity years, 2002 and 2019. Predictions for 2002 were underconfident, meaning that the model generally underestimated fire event occurrence frequency for that year. Active fires were more frequently detected in grid cells for which the model issued low probabilities. This underestimation may be because 2002 was the first year in the record which had no prior MODIS active-fire observations and also only a limited primary-forest loss record. Although we tried to extend back the MODIS observations beyond 2002 with the ATSR WFA nighttime active-fire dataset, the later product has much lower fire counts and could not provide a sufficient record of fire activity prior to 2002.
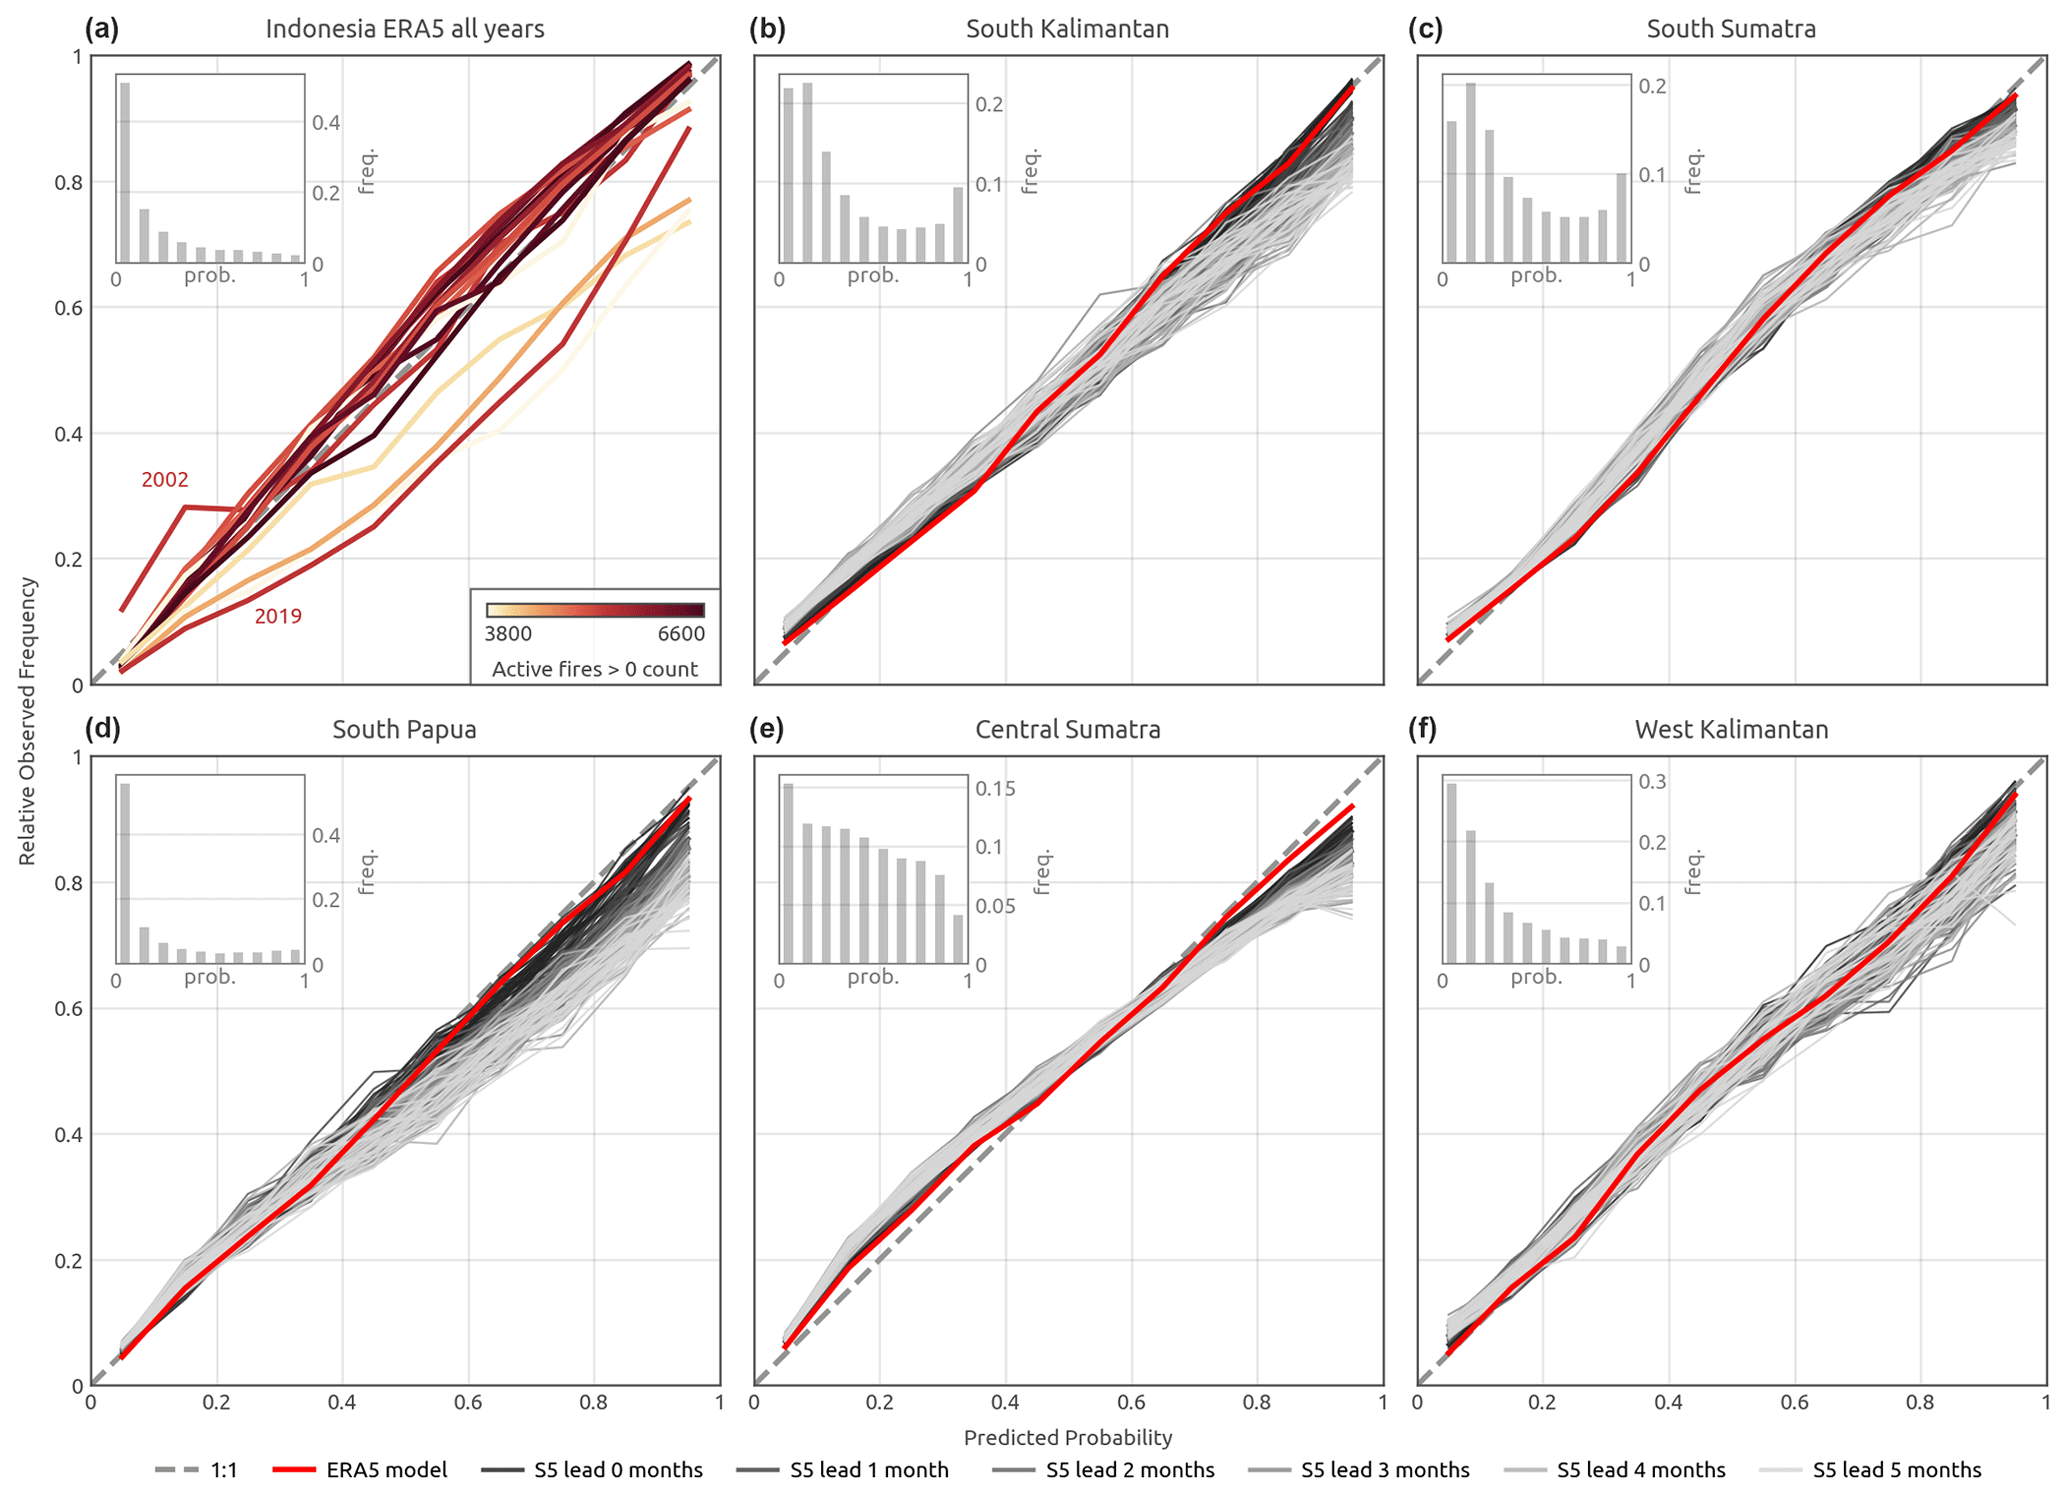
Figure 4Reliability diagrams of occurrence probability predictions of active-fire counts of >0 cases. Inset axes show ERA5-based probability prediction frequency histograms. (a) ERA5-based prediction reliability curves for all of Indonesia for each year in the record. The colour of the lines corresponds to an active-fire count of >0 cases for the year. (b–f) Mean reliability curves for the sub-regions (Fig. 1), showing ERA5- (red) and SEAS5-based ensemble mean prediction reliability curves at different lead times (shades of grey, bottom legend). Dotted lines indicate perfect reliability (1:1 fit).
By contrast, predictions issued for the year 2019 were too high across the whole range of probabilities. This overestimation could be due to several factors. Firstly, the 2019 drought was driven by a positive IOD, while ENSO was neutral. Secondly, since the 2015 burning episode, the Indonesian government has implemented further policies aimed at reducing deforestation and fire occurrence (Hergoualc'h et al., 2018; Carmenta et al., 2020), which may have contributed to lower-than-expected fire detections in 2019.
ERA5- and SEAS5-based prediction probabilities for an active-fire count of >0 cases pooled for all years but split into different sub-regions generally indicate good reliability (Fig. 1b–f). However, there are some notable differences when comparing the spatial domains. Notably, all predictions for south Kalimantan and south Papua indicate overconfidence, while forecast (SEAS5-based) probabilities for west Kalimantan were underconfident. SEAS5-based predictions performed generally well for all regions and all lead times, exhibiting only a gradual degradation in the reliability of high-probability predictions with increasing lead times. There were noteworthy differences when comparing the ERA5-based probability histograms for different sub-regions. Predictions for central Sumatra and west Kalimantan lack sharpness, a property which is manifested by a relatively low number of very high probabilities issued for those regions. In contrast, the model was able to discriminate between no fire and an active-fire count of >0 cases more easily in south Sumatra, south Kalimantan and south Papua. This difference coincides with the fact that drought severity in the latter group of sub-regions is influenced by El Niño, while in central Sumatra and west Kalimantan, a positive IOD is the most important driver of droughts (Field et al., 2016; Pan et al., 2018).
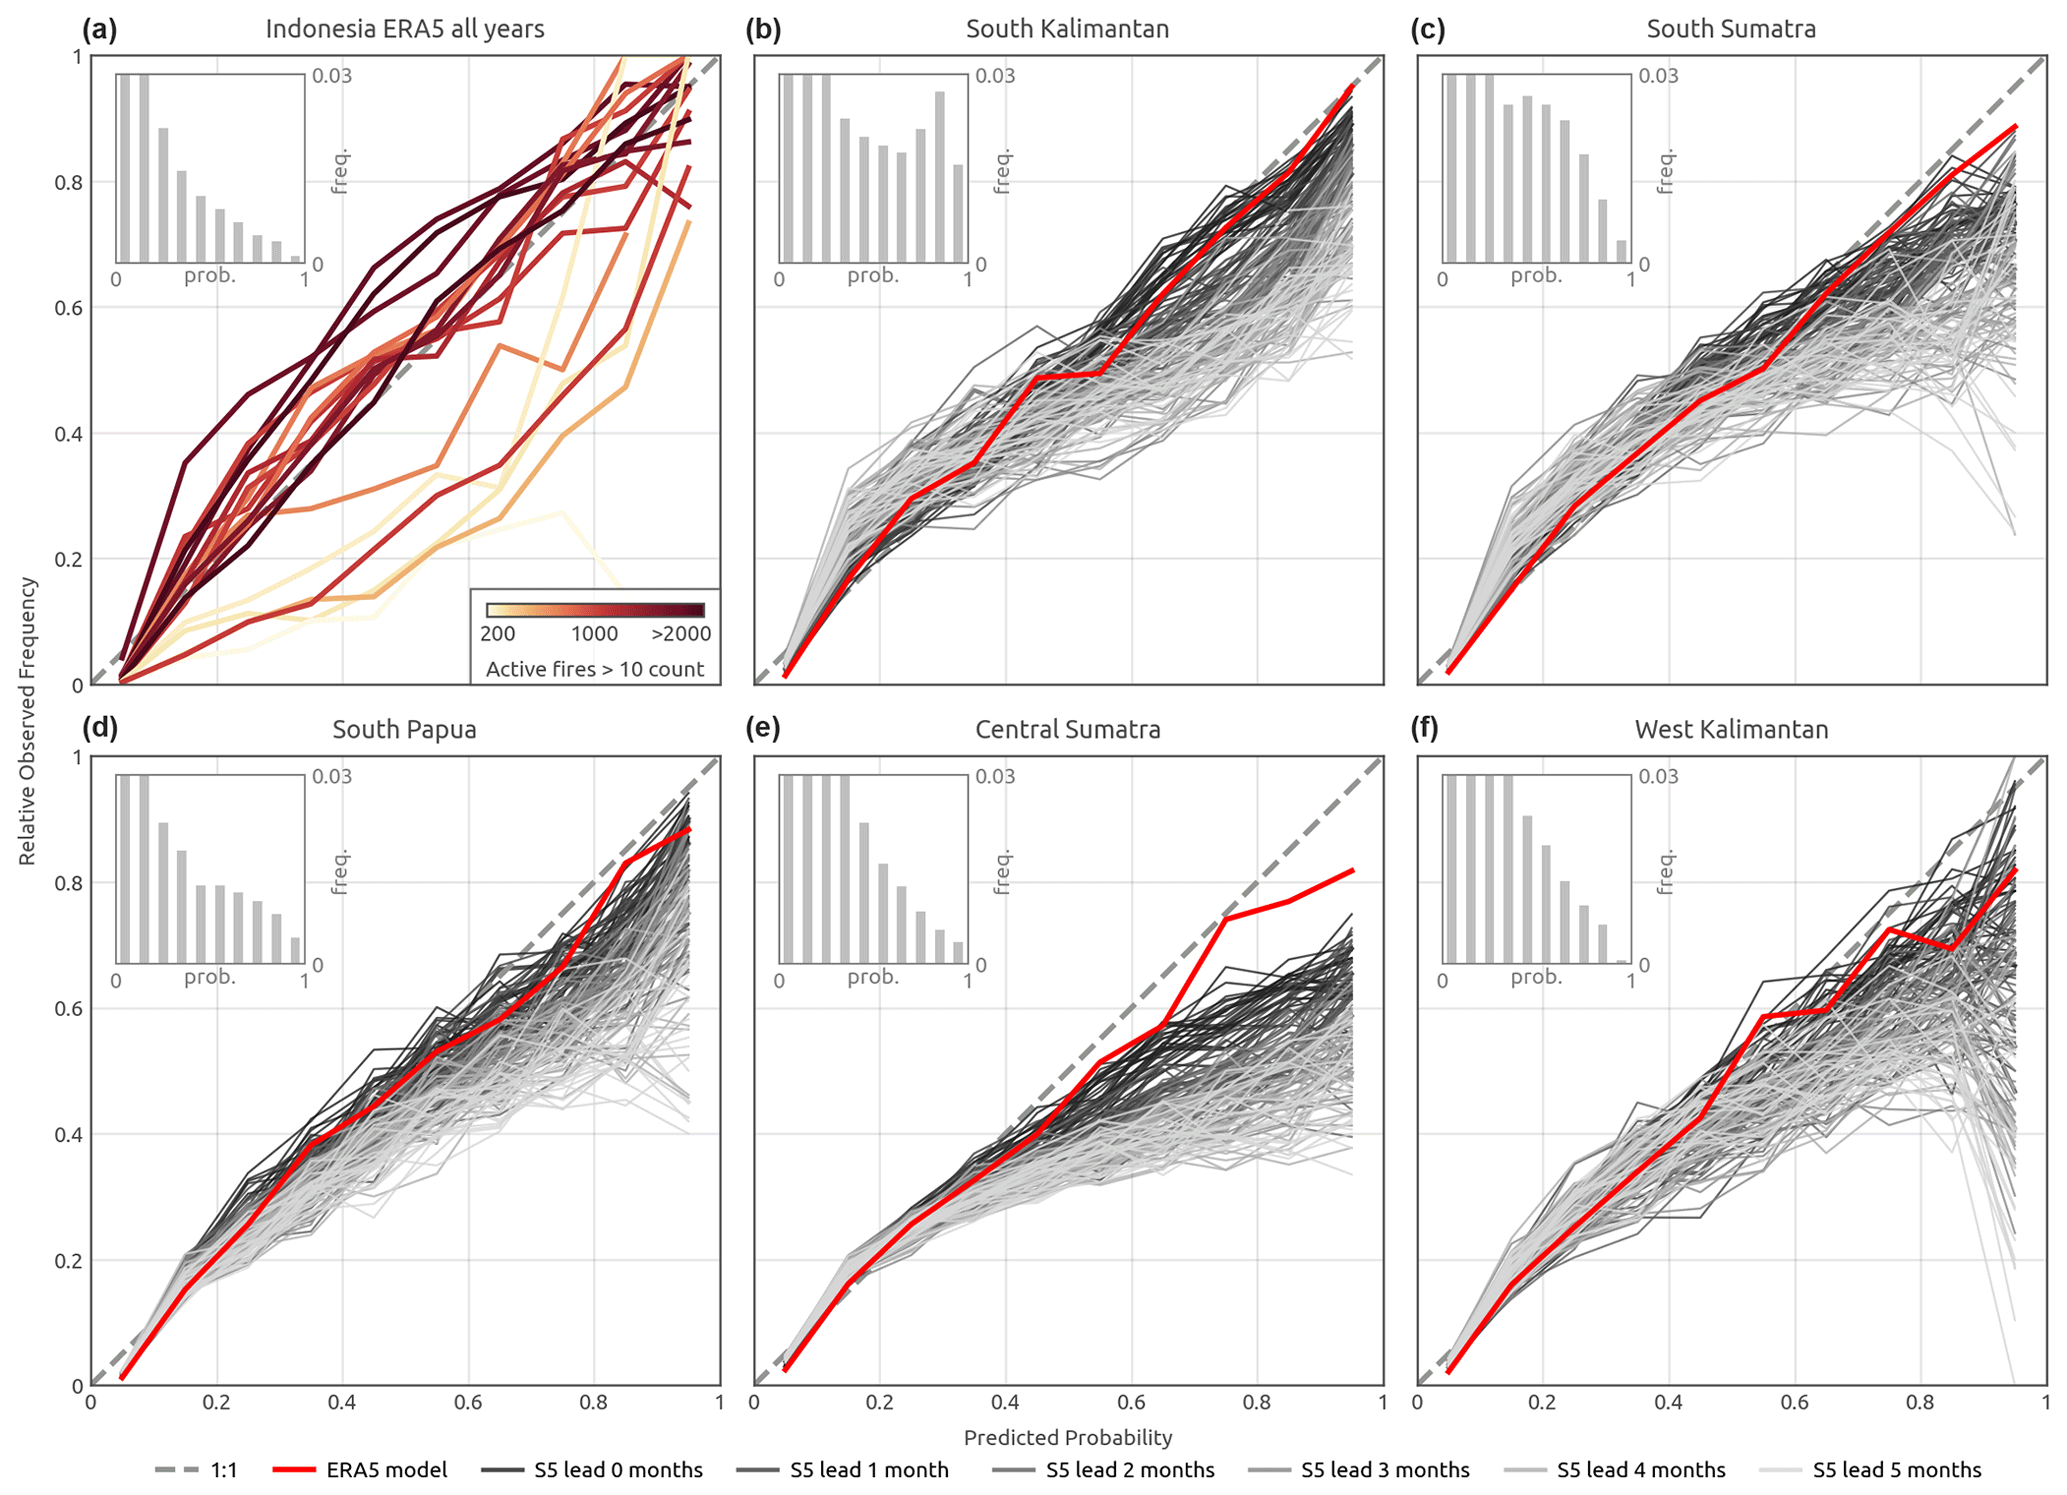
Figure 5Same as Fig. 4 but for prediction of probability for an active-fire count of >10 cases.
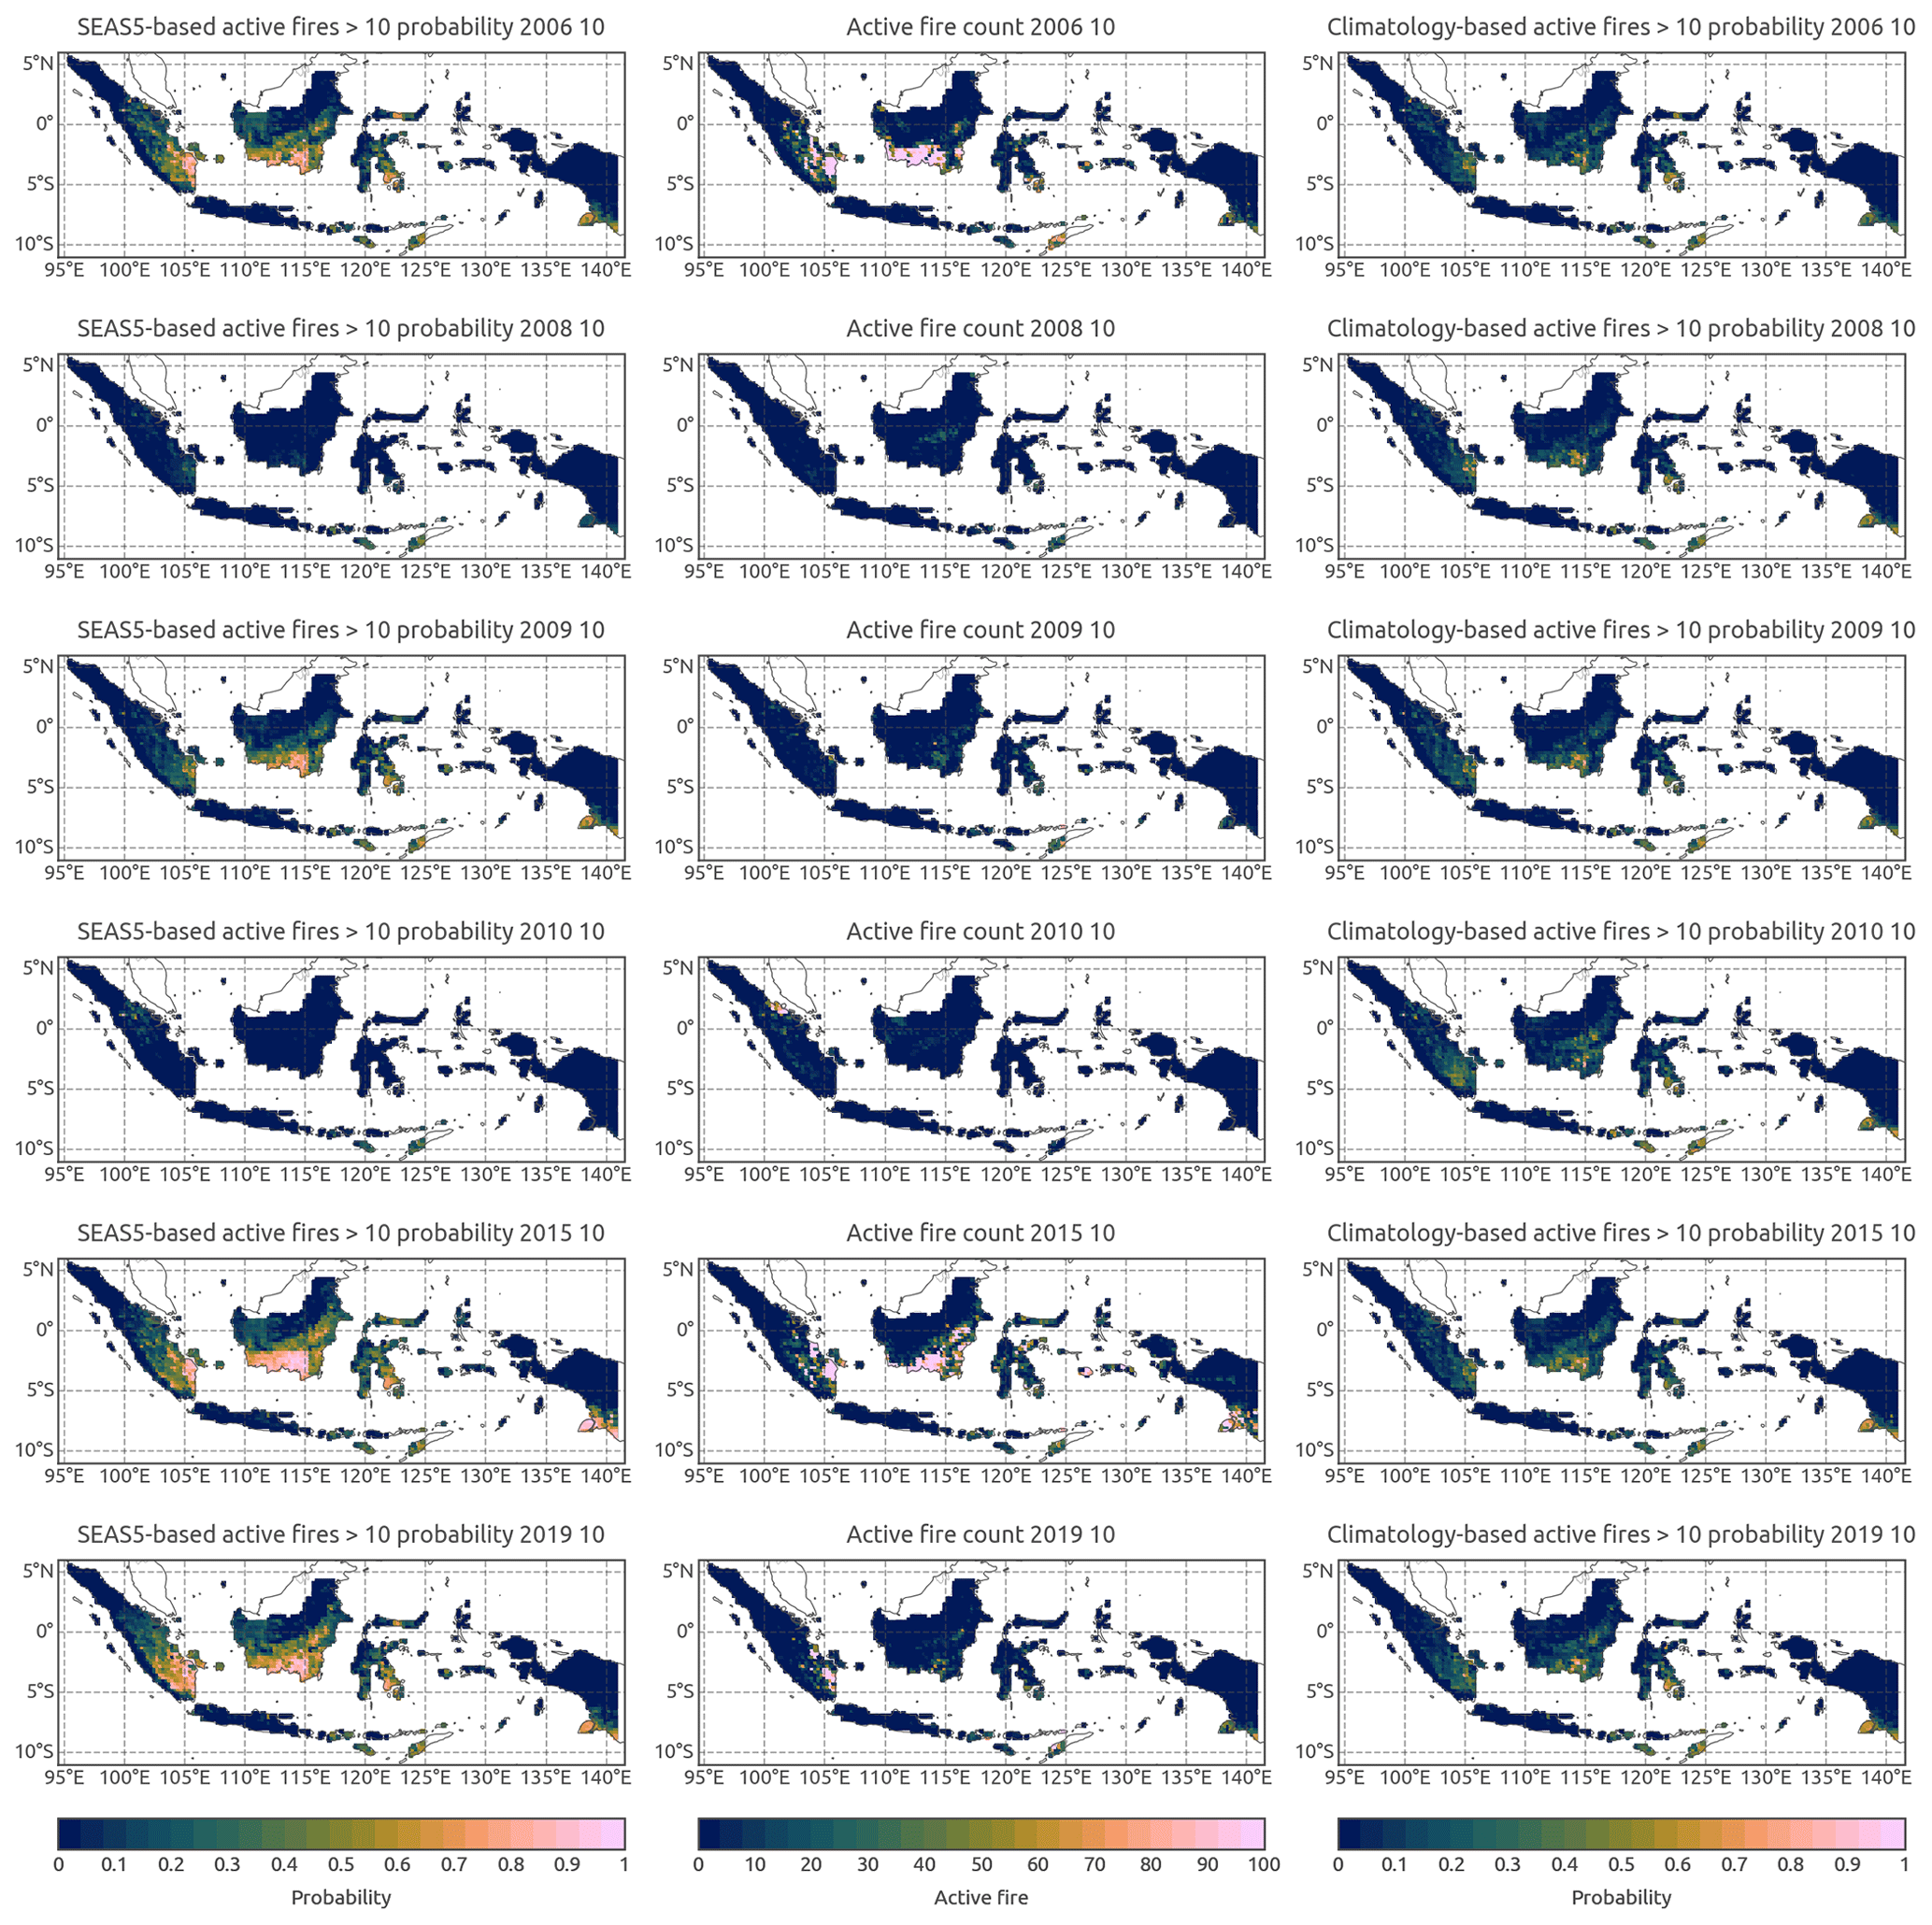
Figure 6Model prediction of probability of an active-fire count of >10 cases and observed active-fire counts. Shown are SEAS5-based (left column) and climatology-based (right column) probability predictions at lead time of 2 months and observed monthly active-fire counts (middle row) for October in 6 example years (rows). Please note that the date format used in this figure is year month.
ProbFire prediction of an active-fire count of >10 cases class occurrence probability was generally less reliable and substantially less confident (Fig. 5) when contrasted with the model reliability performance for an active-fire count of >0 cases seen in Fig. 4. Reliability of ERA5-based predictions for different years (Fig. 5a) exhibited much more variability. The large spread is partially attributable to the fact that low-fire-activity years did not have enough grid cells of an active-fire count of >10 cases needed to determine the reliability of probability prediction. The reliability of ERA5-based predictions for different sub-regions (Fig. 5b–f) was also slightly worse when compared to the prediction diagrams of an active-fire count of >0 cases, in particular for central Sumatra and west Kalimantan (Fig. 5e and f). The biggest difference in reliability of predictions between the two fire occurrence classes was observed for SEAS5-based issued probabilities. The reliability of high-probability predictions of occurrences of an active-fire count of >10 cases deteriorated rapidly with lead time. Notably, low numbers of high-confidence predictions limited the reliability estimation for the central Sumatra and west Kalimantan sub-regions, which had very small numbers of high-confidence predictions (low sharpness). This highlights that a reliable and confident prediction of an active-fire count of >10 cases is more difficult compared to predicting an active-fire count of >0 cases. Low prediction confidence could be in part attributable to dataset imbalance as grid cells of an active-fire count of >10 cases comprise only ∼5 % of the training dataset. However, the most important factor here is perhaps an intrinsic difficulty of the discrimination between grid cells which do contain a few active fires (0> active fires <11) and those in which the count exceeded 10 active fires. Fire occurrence and severity in Indonesia, besides the climatic drivers, is influenced by the interplay of many location-specific factors including land management practices, policy decisions and fire suppression efforts (Page and Hooijer, 2016; Tacconi, 2016), none of which could be realistically represented in a region-wide fire prediction model. Despite this difficulty, our results indicated that prediction of the category of an active-fire count of >10 cases (Fig. 6) was potentially more useful for decision makers.
4.2 Prediction skill scores
The model prediction metrics for an active-fire count of >10 cases (Fig. 7) exhibited patterns which generally followed those of the reliability diagrams. All of the scores were better for the El Niño-dominated sub-regions (i.e. south Kalimantan, south Sumatra and south Papua). By contrast, west Kalimantan and in particular central Sumatra had a lower AUC (area under the curve), higher Brier score and substantially lower probability of detection. Importantly, not only were the climatology- and SEAS5-based forecast scores worse, but also the ERA5-based predictions yielded lower validation values. This result indicates that the model was not able to optimize the classification problem as well for the latter sub-regions given the predictors used in this study. Consequently, even in the case of perfect seasonal forecasts, fire activity prediction performance would be worse in central Sumatra and west Kalimantan when compared to the other sub-regions. Lower model skill is likely to be attributable to different dry-season patterns coupled with a stronger influence of human drivers. West Kalimantan and central Sumatra in particular do experience early-season drought (in February–March) as well as the main dry season (July–September) which is common across all sub-regions. In contrast to El Niño-dominated regions, high-fire-activity episodes in central Sumatra and west Kalimantan are typically shorter and do occur outside the times of the two dry seasons (Gaveau et al., 2014) (Fig. 8). As a result, the monthly time step used by the modelling system of this study may be insufficient for resolving this rapid climatic variability.
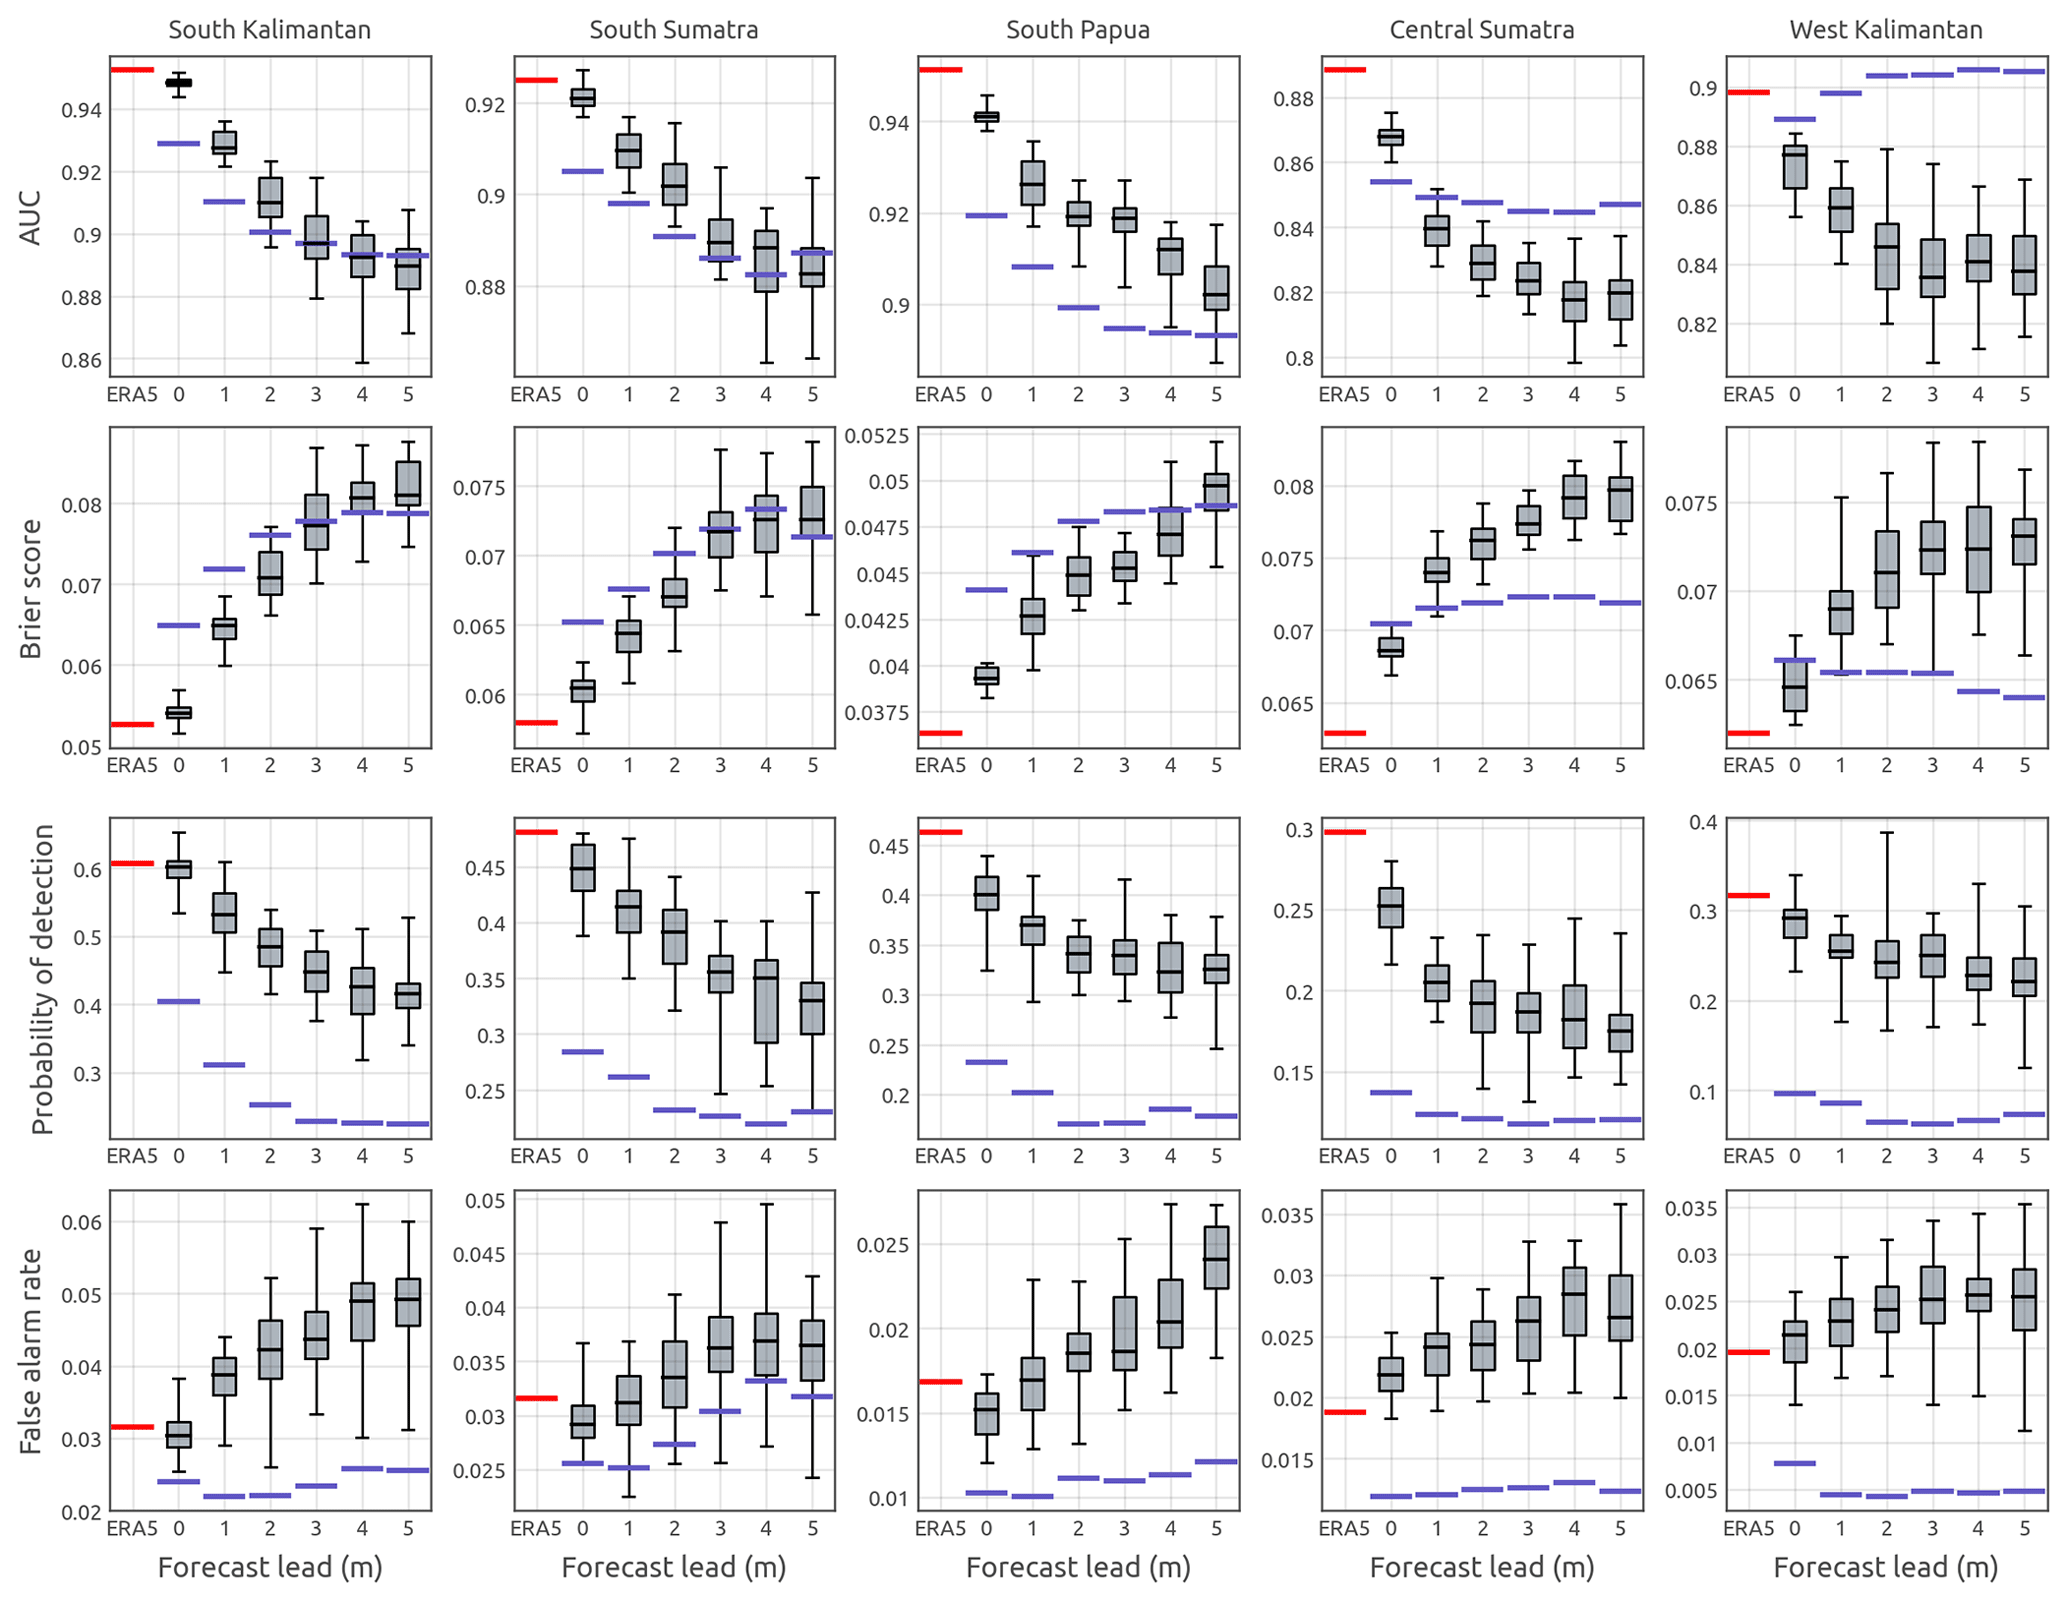
Figure 7Skill scores for prediction of an active-fire count of >10 cases. Shown are mean values of the area under the receiver operating characteristic curve (AUC), Brier score, probability of detection and false-alarm rate (figure rows) for the different sub-regions (figure columns). ROC curves are shown in Fig. S2 in the Supplement. The values for ERA5-based model predictions are shown as red bars, and climatology-based predictions are depicted as blue bars, while boxplots indicate SEAS5 ensemble member prediction values at different lead times. For boxplots, shown are the median value (grey bar), interquartile range (boxplot body) and the full range (boxplot whiskers) of the SEAS5 ensemble member predictions at a given lead time.
SEAS5-based prediction skill scores gradually degraded with increasing lead time in all sub-regions. The performance of seasonal forecasts was substantially better in the El Niño-dominated sub-regions. Notably, in south Papua SEA5 ensemble predictions had both AUC and Brier scores better when compared to climatology predictions at lead times up to 4 months. Skill scores of SEAS5 ensemble predictions in south Kalimantan and south Sumatra indicated potential gains when compared to climatology-based model predictions at lead times of up to 2 months. By contrast, AUC and Brier scores of SEAS5-based predictions in central Sumatra outperformed climatology-based model predictions only at a 0-month lead. In west Kalimantan there was no benefit of using SEAS5 ensemble forecasts at any lead times.
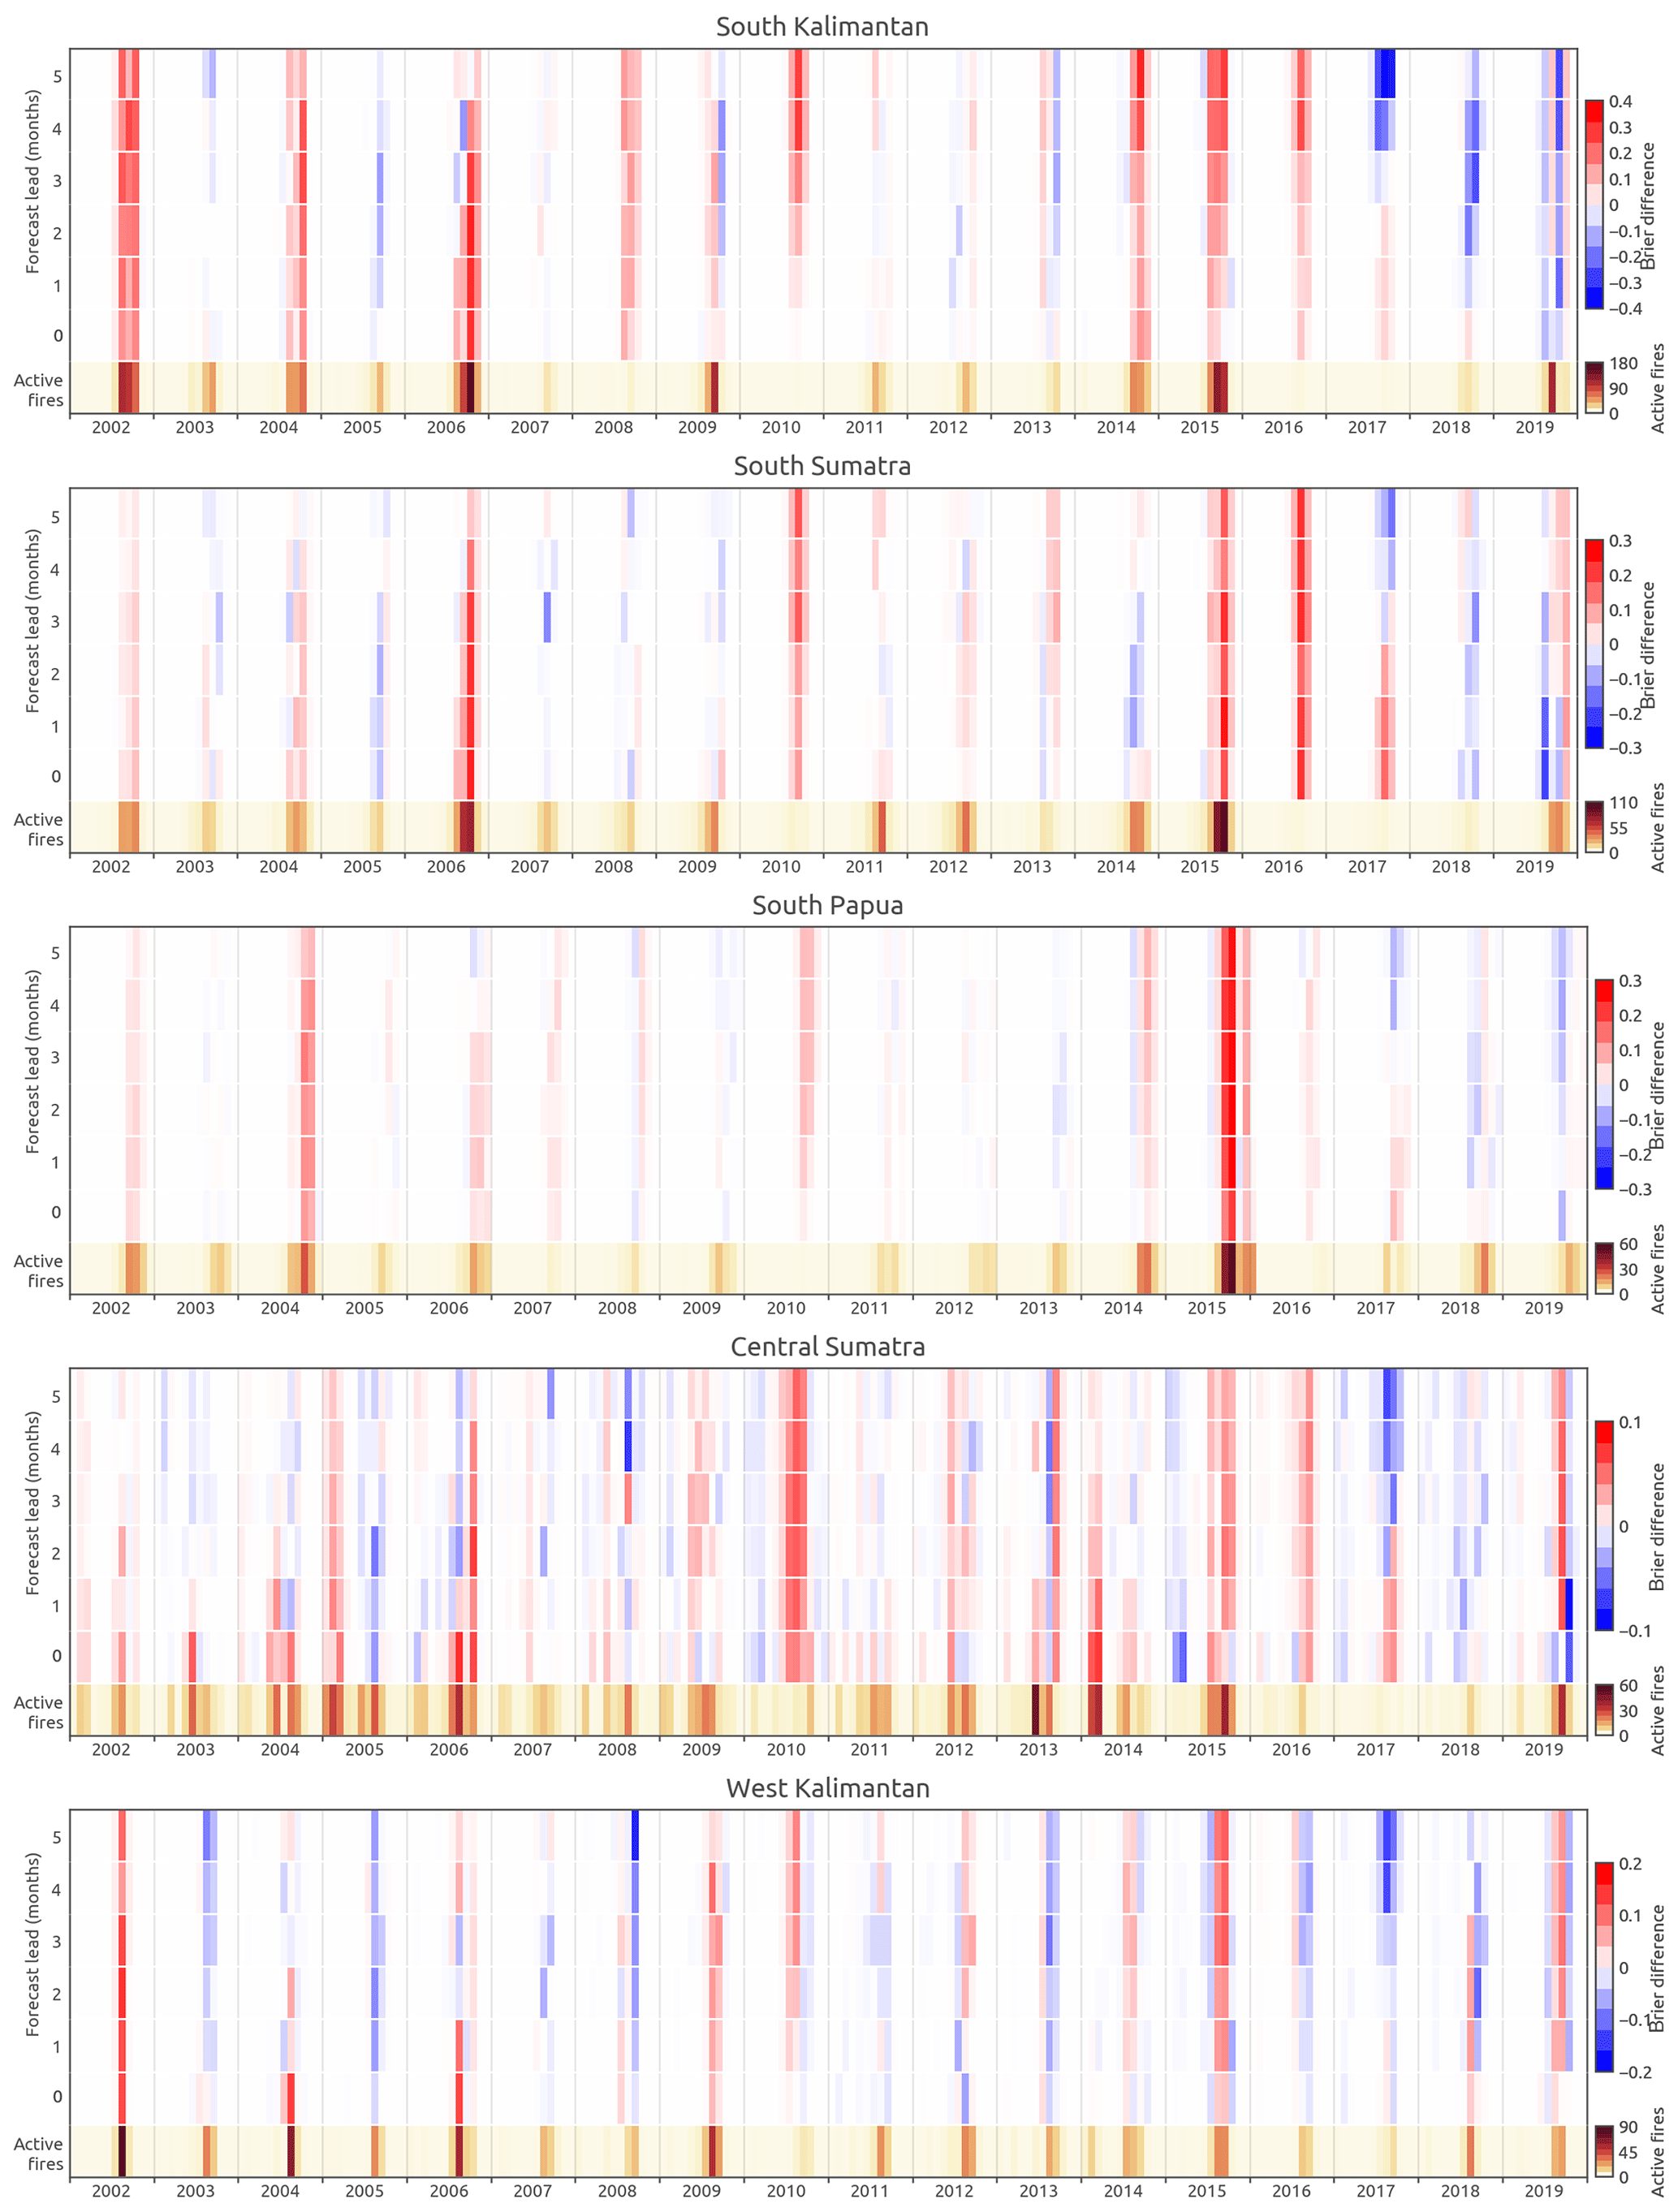
Figure 8Difference in mean monthly Brier scores between climatology-based and SEAS5-based model predictions of occurrence predictions at lead times of 0–5 months of an active-fire count of >10 cases and a mean monthly active-fire count for the study's sub-regions. Positive Brier score difference values (red shades) indicate smaller Brier values for SEAS5-based predictions (better), while negative Brier difference values (blue shades) indicate that climatology-based predictions performed better for that month and lead time. Note different colour scales for different sub-regions.
These results demonstrate that ProbFire driven by SEAS5 ensemble forecasts has a relatively high potential value for the development of early warning systems in south Kalimantan, south Sumatra and south Papua. Skilful and reliable prediction of elevated fire activity 2 to 4 months in advance allows for ample time to act on the predictions. This result may be attributable to the increasingly realistic representation of ENSO-driven SST variability in seasonal forecasting models (Johnson et al., 2019). The skill of SEAS5-based fire occurrence forecasts at a 0-month lead in central Sumatra indicated some potential value; however, utilization of such forecasts in the early warning systems is challenging because warnings could be issued at most a few weeks before the onset of a potentially elevated fire activity phase.
ProbFire predictions of events of a monthly active-fire count of >10 cases derived using seasonal forecasts had a substantially higher probability of detection (Fig. 7) when compared to climatology-based predictions in all sub-regions. This was true for all lead times, although there was a consistent decrease in the probability of detection with an increasing lead time. At the same time, SEAS5-based predictions had slightly higher false-alarm rates which were also increasing with lead time. Such a pattern was an expected result and is a manifestation of differences in forecasted probability sharpness. Climatology-based prediction lacked sharpness and therefore had a low probability of detection and low false-alarm rate. Meanwhile, SEAS5 forecasts enabled the model to issue more confident probabilities (Fig. S1) which consequently had not only a higher probability of detection but also somewhat higher false-alarm rates.
4.3 Relative value of the forecasts
The cost–loss analysis of ProbFire fire activity forecasts demonstrated the potential economic benefit of the system's fire occurrence predictions when compared to forecasts based only on the fire event climatological occurrence frequency (Figs. 8 and 9). While at least some forecasts users in all study sub-regions would have benefited to some degree, the potential maximum value and range of user cost–loss ratios that would have gained from using the system varied considerably across Indonesia. This analysis also revealed that there was a greater benefit from using forecasted probabilities of relatively rare, elevated fire activity grid cells (monthly active-fire count of >10 cases) rather than all fire-containing grid cells (active-fire count of >0 cases) (Fig. S1 vs. 9).
The relative value of SEAS5-based forecasts was substantially higher than ERA5 climatology forecasts but only for predictions of an active-fire count of >10 cases (Fig. 9). By contrast, climatology-based predictions were very close to or equal in their potential economic benefits at all lead times when compared to those derived from SEAS5-based predictions for an active-fire count of >0 cases (Fig. S1). This was an expected result given that the number of low-fire-activity grid cells did not exhibit the same level of interannual variability as numbers of high-fire-activity grid cells did during the study period (Fig. 2). This result indicates that skilful prediction of widespread annually occurring burning can be achieved by a model based on ERA5 climatology and non-climate information. However, ProbFire predictions based on seasonal hindcasts had higher potential economic benefits when predicting a highly variable occurrence of elevated fire activity (grid cells with a monthly active-fire count of >10 cases).
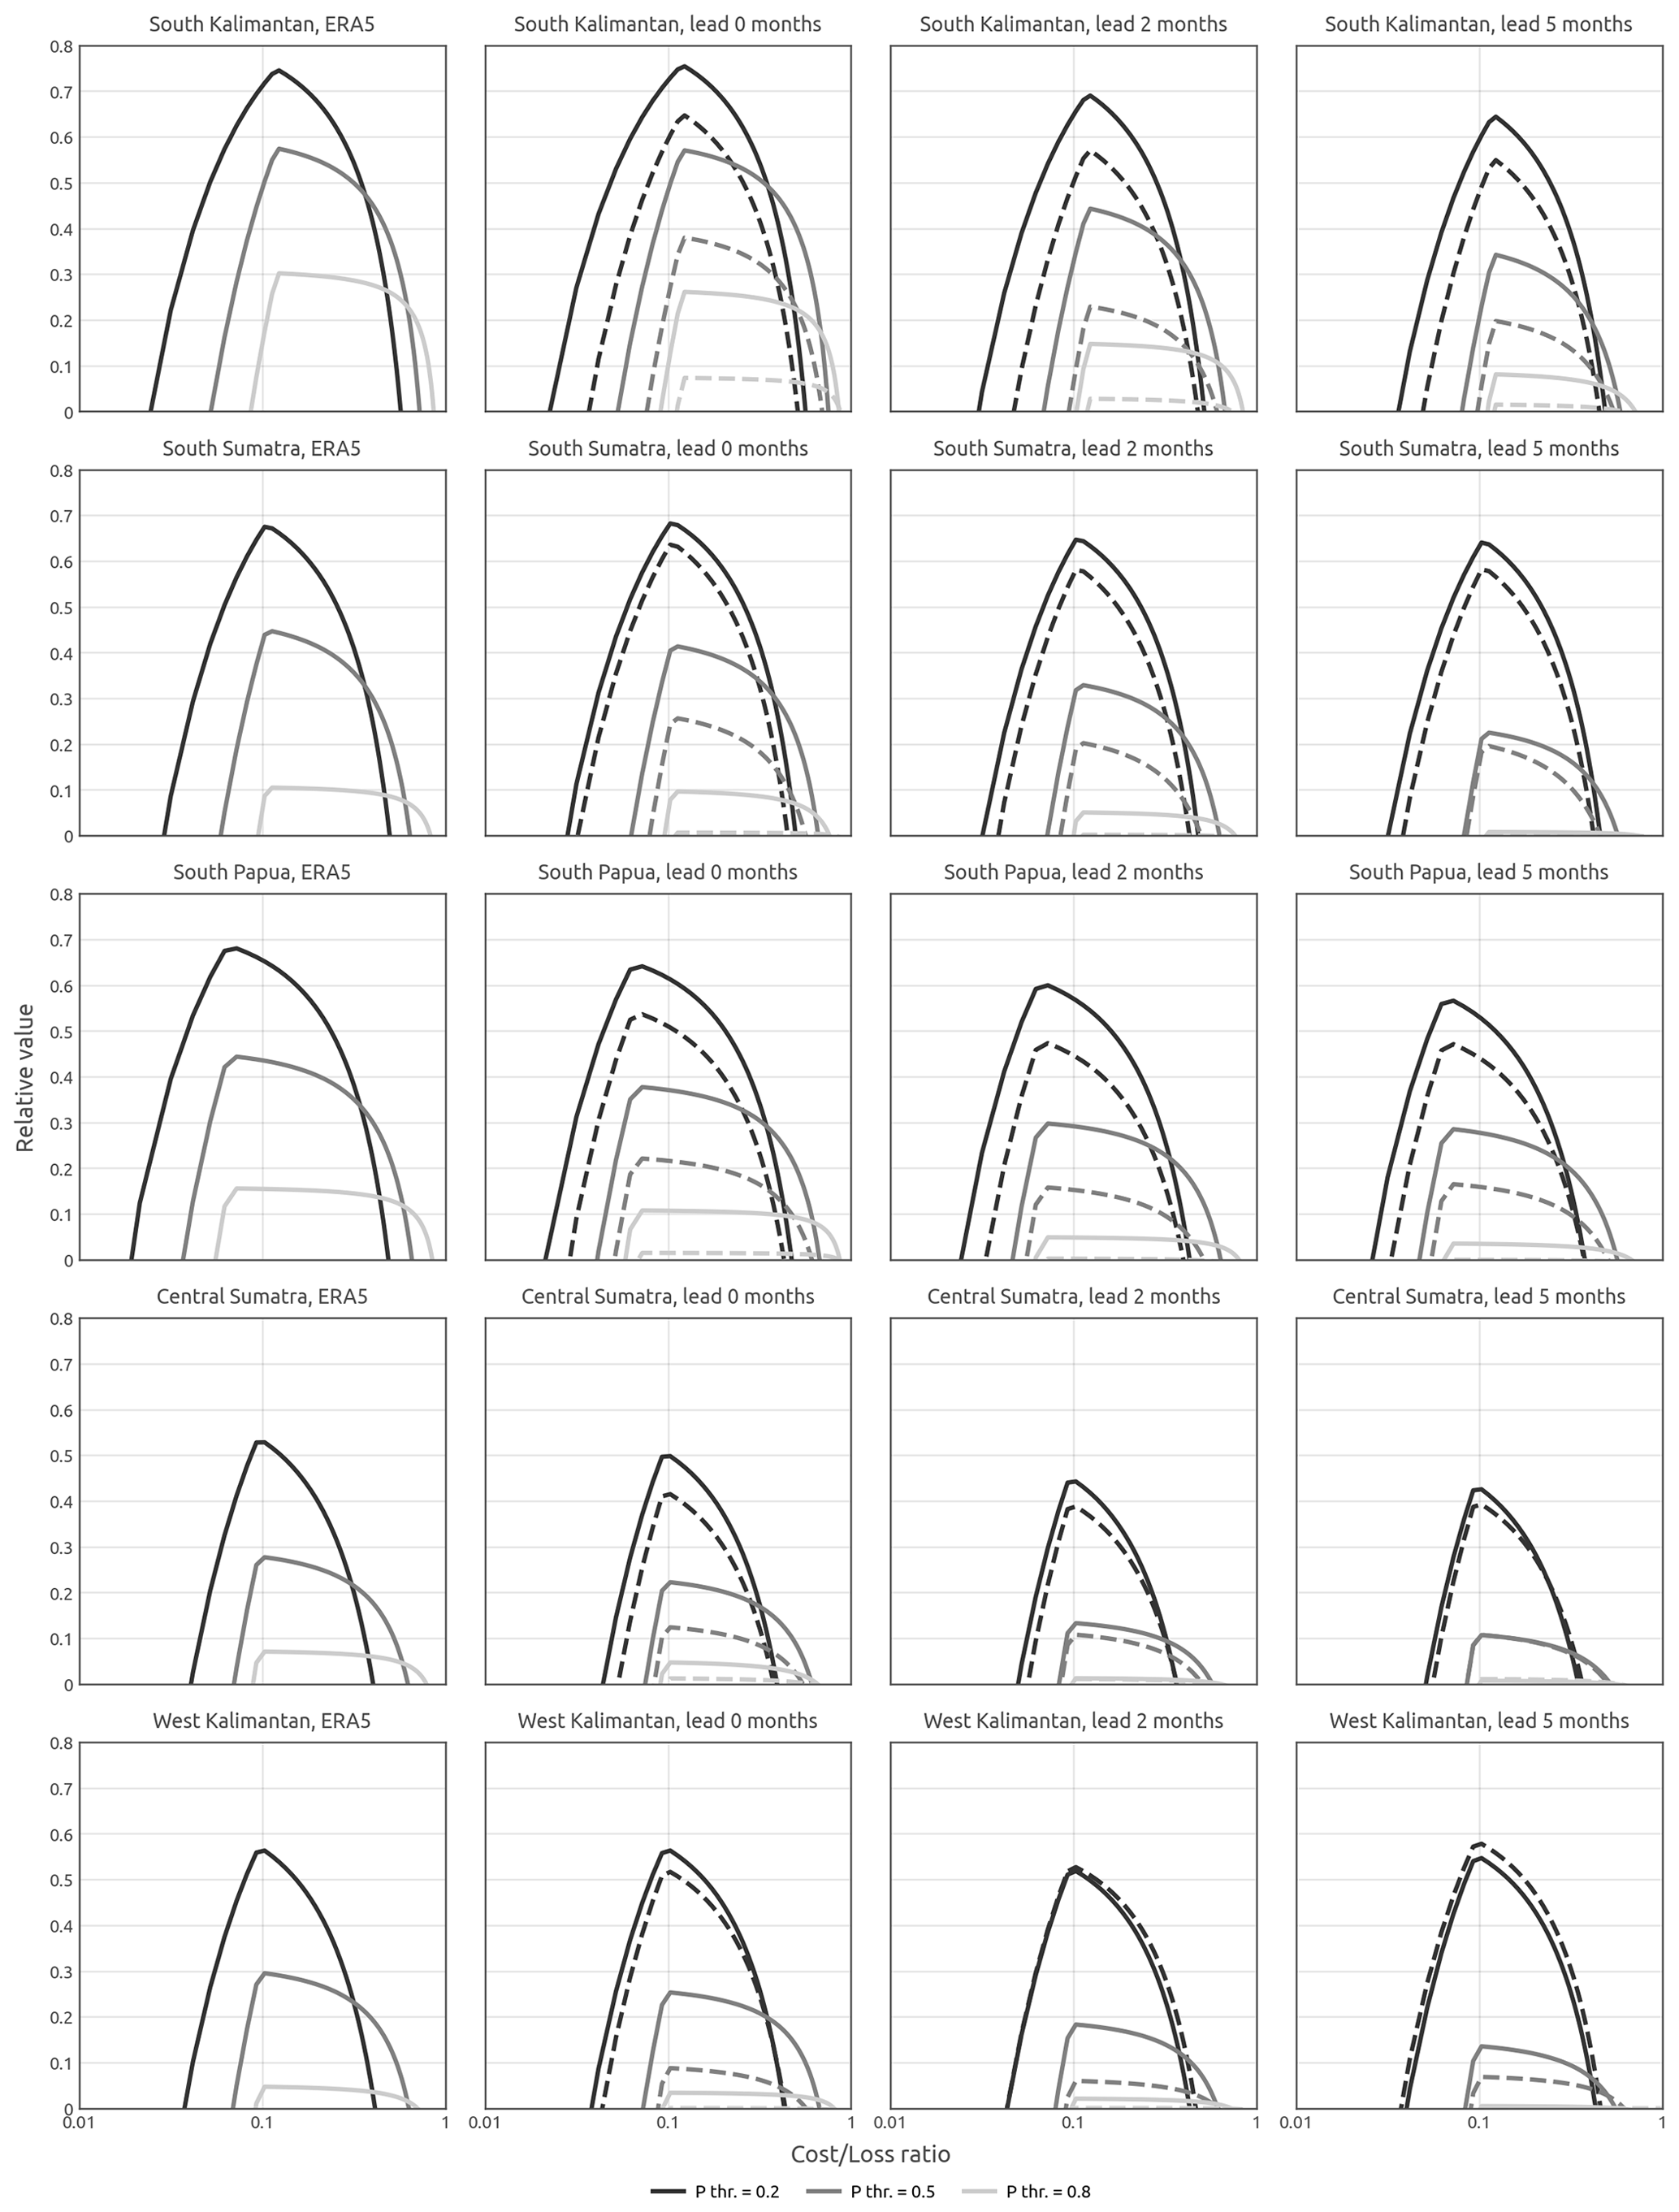
Figure 9Relative value of prediction of an active-fire count of >10 cases for users with different cost–loss ratios. Shown are relative values of ERA5-based predictions and SEAS5-based (solid lines) and climatology-based (dashed lines) predictions at different lead times (columns) for different sub-regions (rows). Line shading (legend) indicates different fire prediction probability thresholds (P thr.) at which the relative value curves are calculated.
Overall, the forecasts had the highest potential economic value for the widest range of cost–loss ratios in south Kalimantan, south Papua and south Sumatra. In these sub-regions, where the dry-season severity is primarily influenced by El Niño, predictions of probabilities of an active-fire count of >10 cases indicate a potential gain of over 60 % of the benefit from a perfect forecasting system at cost–loss ratios close to the fire event occurrence frequency ratios (Fig. 9). SAES5-based predictions had relative values higher when compared to the climatology model at all lead times (0–56 months) and all probability thresholds. The potential economic gain over the climatology model predictions was increasingly higher for larger cost–loss ratios. This indicates that users with larger cost–loss ratios would have benefited the most from the SEAS5-based forecasts using high probability thresholds for decision making. This was particularly true for south Kalimantan, where forecasts of probabilities of an active-fire count of >10 cases also indicated the highest sharpness (Fig. 4). At the same time, for cost–loss ratios over 0.5, climatology-based predictions offered little in terms of potential economic benefit.
By contrast, ProbFire forecasts for central Sumatra and west Kalimantan a indicated potential benefit for a narrower range of cost–loss ratios and lower total relative values of less than 60 % of perfect forecast performance (Fig. 9). While SEAS5-based predictions had a modestly higher relative value when compared to the climatology model, this was true only at a lead time of 0 months. In addition, the potential economic benefit at a 0-month lead was present for lower cost–loss ratios. This result is a manifestation of low sharpness and reliability of SEAS5-based forecasts in these regions (Fig. 4), at longer lead times.
Predicting highly variable landscape fire activity is an inherently difficult problem due to the complexity of factors influencing fire dynamics at different scales of time and space and the large uncertainties associated with datasets used to characterize these fire drivers. Previous studies have shown that climate information from current state-of-the-art seasonal forecasting systems can be utilized for seasonal fire prediction in parts of the globe (Turco et al., 2018), including Indonesia (Spessa et al., 2015; Shawki et al., 2017). While climate is clearly an important driver of fire activity, these climate–fire relationships are modified by human activity across a range of spatial scales, especially in regions undergoing rapid land cover changes such as Indonesia. To reflect this additional source of variability, early fire warning systems in the region need to utilize non-climate information for fire prediction.
In this study we have developed and tested ProbFire, a new probabilistic early fire warning modelling system for Indonesia which provides a blueprint for future operational warning systems in the region and beyond. Compared with previous regression-based fire forecasting studies focused on climate–fire relationships (Spessa et al., 2015; Chen et al., 2016; Turco et al., 2018; Chen et al., 2020), ProbFire integrates ECMWF ERA5 reanalysis and SEAS5 seasonal climate predictions with non-climate features and employs a multilayer perceptron classification model for probabilistic fire event prediction at 0.25∘ spatial resolution. The probabilistic approach adopted by this study is better suited for predicting rare and/or newly occurring fire events and allows for the forecasts to be evaluated from a user perspective using the cost–loss model.
Validation of ProbFire performance for the 2002–2019 period showed that SEAS5-based fire event probabilities were generally well calibrated, although as expected, the reliability of high-confidence predictions gradually decreased with increasing lead times. SEAS5-based fire predictions outperformed the climatology-based model at lead times of 2 to 4 months in south Kalimantan, south Sumatra and south Papua, where drought severity is strongly influenced by El Niño. By contrast, SEAS5-based forecasts for central Sumatra had higher skill scores only at 0-month lead times, while in west Kalimantan they showed no improvement at all when compared to climatology-based predictions. Analysis of potential economic benefits of the forecasts indicated that forecast users with a wide range of cost–loss ratios would have benefited from using the SEAS5-based predictions in decision making in the El Niño-dominated regions of Indonesia. This demonstrates that early fire warning systems based on ECMWF SEAS5 seasonal climate forecasts and non-climate information can support the work of various stakeholders involved in fire prevention and management including Indonesian government agencies, local communities and commercial entities.
ProbFire has limitations, and further research is needed to improve the skill of the predictions, especially in parts of Indonesia that lie outside the El Niño zone of influence. The lack of predictability in central Sumatra and west Kalimantan at lead times beyond the current month indicates the generally low skill of SEAS5 climate predictions in these IOD-dominated parts of Indonesia and could potentially be improved by the integration of seasonal forecasts from different modelling centres.
However, even the ERA5-based model had lower predictability in those areas, which indicates that different input data may be needed. In addition, in central Sumatra severe burning episodes can be triggered by short-term droughts (Gaveau et al., 2014) which cannot be represented at the monthly temporal resolution of this system. Furthermore, the non-climate datasets used in this study cannot represent the full range of environmental and anthropogenic factors which modulate fire occurrence across Indonesia. Consequently, the system uses primitive identifier features for the five sub-regions, as none of the used datasets could reflect the full range of differences in fire climate sensitivity between the sub-regions. In addition, past and future changes in national and local policies and fire suppression efforts are currently not included in ProbFire. These changes could affect the future performance of the system if they reduce the region's fire sensitivity to the climatic and biogeographic features used to drive ProbFire. To address these issues, the development of long-term, consistent and regularly updated datasets on vegetation, land management status and socio-economic drivers of fire activity is needed.
The ProbFire source code can be found at https://doi.org/10.5281/zenodo.5939892 (Nikonovas, 2021b).
ProbFire input datasets aggregated to 0.25∘ resolution can be accessed at https://doi.org/10.5281/zenodo.5206278 (Nikonovas, 2021a).
The supplement related to this article is available online at: https://doi.org/10.5194/nhess-22-303-2022-supplement.
TN and AS designed the study. TN implemented the analyses and wrote the manuscript. AS, SHD, GDC and SM contributed to interpreting the findings and writing the final paper.
The contact author has declared that neither they nor their co-authors have any competing interests.
Publisher's note: Copernicus Publications remains neutral with regard to jurisdictional claims in published maps and institutional affiliations.
This study forms part of the Towards a Fire Early Warning System for Indonesia (ToFEWSI) project, which is funded through the UK’s National Environment Research Council – Newton Fund on behalf of UK Research & Innovation as well as through the Indonesia Endowment Fund for Education and the Indonesian Science Fund.
This research has been supported by the UK's National Environment Research Council – Newton Fund on behalf of UK Research & Innovation (grant no. NE/P014801/1).
This paper was edited by Margreth Keiler and reviewed by two anonymous referees.
Aldrian, E. and Dwi Susanto, R.: Identification of three dominant rainfall regions within Indonesia and their relationship to sea surface temperature, Int. J. Climatol., 23, 1435–1452, https://doi.org/10.1002/joc.950, 2003.
Alduchov, O. A. and Eskridge, R. E.: Improved Magnus Form Approximation of Saturation Vapor Pressure, J. Appl. Meteorol. Climatol., 35, 601–609, https://doi.org/10.1175/1520-0450(1996)035<0601:IMFAOS>2.0.CO;2, 1996.
Arino, O., Casadio, S., and Serpe, D.: Global night-time fire season timing and fire count trends using the ATSR instrument series, Remote Sens. Environ., 116, 226–238, https://doi.org/10.1016/j.rse.2011.05.025, 2012.
Barnston, A. G.: Linear Statistical Short-Term Climate Predictive Skill in the Northern Hemisphere, J. Climate, 7, 1513–1564, https://doi.org/10.1175/1520-0442(1994)007<1513:LSSTCP>2.0.CO;2, 1994.
Bauer, P., Thorpe, A., and Brunet, G.: The quiet revolution of numerical weather prediction, Nature, 525, 47–55, https://doi.org/10.1038/nature14956, 2015.
Boden, T. A., Marland, G., and Andres, R. J.: Global, Regional, and National Fossil-Fuel CO2 Emissions, Carbon Dioxide Information Analysis Center, Oak Ridge National Laboratory, U.S. Department of Energy, Oak Ridge, Tenn., USA, https://doi.org/10.3334/CDIAC/00001_V2017, 2017.
Carmenta, R., Zabala, A., Trihadmojo, B., Gaveau, D., Salim, M. A., and Phelps, J.: Evaluating bundles of interventions to prevent peat-fires in Indonesia, Global Environ. Change, 67, 102154, https://doi.org/10.1016/j.gloenvcha.2020.102154, 2020.
Cattau, M. E., Harrison, M. E., Shinyo, I., Tungau, S., Uriarte, M., and DeFries, R.: Sources of anthropogenic fire ignitions on the peat-swamp landscape in Kalimantan, Indonesia, Global Environ. Change, 39, 205–219, https://doi.org/10.1016/j.gloenvcha.2016.05.005, 2016.
Chen, Y., Morton, D. C., Andela, N., Giglio, L., and Randerson, J. T.: How much global burned area can be forecast on seasonal time scales using sea surface temperatures?, Environ. Res. Lett., 11, 045001, https://doi.org/10.1088/1748-9326/11/4/045001, 2016.
Chen, Y., Randerson, J. T., Coffield, S. R., Foufoula-Georgiou, E., Smyth, P., Graff, C. A., Morton, D. C., Andela, N., van der Werf, G. R., Giglio, L., and Ott, L. E.: Forecasting global fire emissions on subseasonal to seasonal (S2S) time scales, J. Adv. Model. Earth. Syst., 12, e2019MS001955, https://doi.org/10.1029/2019MS001955, 2020.
Cochrane, M. A., Alencar, A., Schulze, M. D., Souza, C. M., Nepstad, D. C., Lefebvre, P., and Davidson, E. A.: Positive feedbacks in the fire dynamic of closed canopy tropical forests, Science, 284, 1832–1835, https://doi.org/10.1126/science.284.5421.1832, 1999.
Crippa, P., Castruccio, S., Archer-Nicholls, S., Lebron, G. B., Kuwata, M., Thota, A., Sumin, S., Butt, E., Wiedinmyer, C., and Spracklen, D. V.: Population exposure to hazardous air quality due to the 2015 fires in Equatorial Asia, Sci. Rep.-UK, 6, 37074, https://doi.org/10.1038/srep3707, 2016.
Doblas-Reyes, F. J., Hagedorn, R., and Palmer, T. N.: The rationale behind the success of multi-model ensembles in seasonal forecasting – II. Calibration and combination, Tellus A, 57, 234–252, https://doi.org/10.3402/tellusa.v57i3.14658, 2005.
Doblas-Reyes, F. J., García-Serrano, J., Lienert, F., Biescas, A. P., and Rodrigues, L. R. L.: Seasonal climate predictability and forecasting: status and prospects, WIREs Clim. Change, 4, 245–268, https://doi.org/10.1002/wcc.217, 2013.
Dowdy, A. J., Mills, G. A., Finkele, K., and de Groot, W.: Australian fire weather as represented by the McArthur forest fire danger index and the Canadian forest fire weather index, Centre for Australian Weather and Climate Research Tech. Rep, 10, 91, 2009.
Fan, H., Wang, L., Zhang, Y., Tang, Y., Duan, W., and Wang, L.: Predictable Patterns of Wintertime Surface Air Temperature in Northern Hemisphere and Their Predictability Sources in the SEAS5, J. Climate, 33, 10743–10754, https://doi.org/10.1175/JCLI-D-20-0542.1, 2020.
Field, R. D. and Shen, S. S. P.: Predictability of carbon emissions from biomass burning in Indonesia from 1997 to 2006, J. Geophys. Res., 113, G04024, https://doi.org/10.1029/2008JG000694, 2008.
Field, R. D., Van Der Werf, G. R., Fanin, T., Fetzer, E. J., Fuller, R., Jethva, H., Levy, R., Livesey, N. J., Luo, M., Torres, O., and Worden, H. M.: Indonesian fire activity and smoke pollution in 2015 show persistent nonlinear sensitivity to El Niño-induced drought, P. Natl. Acad. Sci., 113, 9204–9209, https://doi.org/10.1073/pnas.1524888113, 2016.
Gaveau, D. L., Salim, M. A., Hergoualc'h, K., Locatelli, B., Sloan, S., Wooster, M., Marlier, M. E., Molidena, E., Yaen, H., DeFries, R., and Verchot, L.: Major atmospheric emissions from peat fires in Southeast Asia during non-drought years: evidence from the 2013 Sumatran fires, Sci. Rep.-UK, 4, 6112, https://doi.org/10.1038/srep06112, 2014.
Giglio, L., Schroeder, W., and Justice, C. O.: The collection 6 MODIS active fire detection algorithm and fire products, Remote Sens. Environ., 178, 31–41, https://doi.org/10.1016/j.rse.2016.02.054, 2016.
Gneiting, T. and Raftery, A. E.: Strictly Proper Scoring Rules, Prediction, and Estimation, J. Am. Stat. Assoc., 102, 359–378, https://doi.org/10.1198/016214506000001437, 2004.
Guo, C., Pleiss, G., Sun, Y., and Weinberger, K. Q.: On calibration of modern neural networks, Proc. Mach. Learn. Res., 70, 1321–1330, 2017.
Hansen, M. C., Potapov, P. V., Moore, R., Hancher, M., Turubanova, S. A., Tyukavina, A., Thau, D., Stehman, S. V., Goetz, S. J., Loveland, T. R., and Kommareddy, A.: High-resolution global maps of 21st-century forest cover change, Science, 342, 850–853, https://doi.org/10.1126/science.1244693, 2013.
Haryono, S. M., Ritung, S., Wahyunto, N. K., Sukarman, H., and Supardo, T. C.: Peatland Map of Indonesia. Center for Research and Development of Agricultural Land Resources, Agricultural Research and Development Agency, Indonesia Ministry of Agriculture [data set], Bogor, Indonesia, https://data.globalforestwatch.org/datasets/indonesia-peat-lands (last access 1 February 2022), 2011.
Hastie, T., Tibshirani, R., and Friedman, J.: The Elements of Statistical Learning: Data Mining, Inference, and Prediction, Springer Series in Statistics, Springer, New York, NY, https://doi.org/10.1007/978-0-387-84858-7, 2009.
Hergoualc'h, K., Carmenta, R., Atmadja, S., Martius, C., Murdiyarso, D., and Purnomo, H.: Managing peatlands in Indonesia: challenges and opportunities for local and global communities, CIFOR Infobrief 205, Center for International Forestry Research (CIFOR), Bogor, Indonesia, https://doi.org/10.17528/cifor/006449, 2018.
Hersbach, H., Bell, B., Berrisford, P., Hirahara, S., Horányi, A., Muñoz-Sabater, J., Nicolas, J., Peubey, C., Radu, R., Schepers, D., Simmons, A., Soci, C., Abdalla, S., Abellan, X., Balsamo, G., Bechtold, P., Biavati, G., Bidlot, J., Bonavita, M., De Chiara, G., Dahlgren, P., Dee, D., Diamantakis, M., Dragani, R., Flemming, J., Forbes, R., Fuentes, M., Geer, A., Haimberger, L., Healy, S., Hogan, R. J., Hólm, E., Janisková, M., Keeley, S., Laloyaux, P., Lopez, P., Lupu, C., Radnoti, G., de Rosnay, P., Rozum, I., Vamborg, F., Villaume, S., and Thépaut, J.-N.: The ERA5 global reanalysis, Q. J. Roy. Meteor. Soc., 146, 1999–2049, https://doi.org/10.1002/qj.3803, 2020.
Hooijer, A., Page, S., Jauhiainen, J., Lee, W. A., Lu, X. X., Idris, A., and Anshari, G.: Subsidence and carbon loss in drained tropical peatlands, Biogeosciences, 9, 1053–1071, https://doi.org/10.5194/bg-9-1053-2012, 2012.
Hoscilo, A., Page, S. E., Tansey, K. J., and Rieley, J. O.: Effect of repeated fires on land-cover change on peatland in southern Central Kalimantan, Indonesia, from 1973 to 2005, Int. J. Wildland Fire, 20, 578–588, https://doi.org/10.1071/WF10029, 2011.
Huijnen, V., Wooster, M. J., Kaiser, J. W., Gaveau, D. L., Flemming, J., Parrington, M., Inness, A., Murdiyarso, D., Main, B., and Van Weele, M.: Fire carbon emissions over maritime southeast Asia in 2015 largest since 1997, Sci. Rep.-UK, 6, 26886, https://doi.org/10.1038/srep26886, 2016.
Jauhiainen, J., Kerojoki, O., Silvennoinen, H., Limin, S., and Vasander, H.: Heterotrophic respiration in drained tropical peat is greatly affected by temperature – a passive ecosystem cooling experiment, Environ. Res. Lett., 9, 105013, https://doi.org/10.1088/1748-9326/9/10/105013, 2014.
Johnson, S. J., Stockdale, T. N., Ferranti, L., Balmaseda, M. A., Molteni, F., Magnusson, L., Tietsche, S., Decremer, D., Weisheimer, A., Balsamo, G., Keeley, S. P. E., Mogensen, K., Zuo, H., and Monge-Sanz, B. M.: SEAS5: the new ECMWF seasonal forecast system, Geosci. Model Dev., 12, 1087–1117, https://doi.org/10.5194/gmd-12-1087-2019, 2019.
Langner, A. and Siegert, F.: Spatiotemporal fire occurrence in Borneo over a period of 10 years, Global Change Biol., 15, 48–62, https://doi.org/10.1111/j.1365-2486.2008.01828.x, 2009.
Lavaysse, C., Stockdale, T., McCormick, N., and Vogt, J.: Evaluation of a New Precipitation-Based Index for Global Seasonal Forecasting of Unusually Wet and Dry Periods, Weather Forecast., 35, 1189–1202, https://doi.org/10.1175/WAF-D-19-0196.1, 2020.
Lee, B. P., Davies, Z., and Struebig, M.: Smoke pollution disrupted biodiversity during the 2015 El Niño fires in Southeast Asia, Environ. Res. Lett., 12, 9, https://doi.org/10.1088/1748-9326/aa87ed, 2017.
Lee, H.-H., Bar-Or, R. Z., and Wang, C.: Biomass burning aerosols and the low-visibility events in Southeast Asia, Atmos. Chem. Phys., 17, 965–980, https://doi.org/10.5194/acp-17-965-2017, 2017.
Liu, T., Mickley, L. J., Marlier, M. E., DeFries, R. S., Khan, M. F., Latif, M. T., and Karambelas, A.: Diagnosing spatial biases and uncertainties in global fire emissions inventories: Indonesia as regional case study, Remote Sens. Environ., 237, 111557, https://doi.org/10.1016/j.rse.2019.111557, 2020.
Lorenz, E. N.: Deterministic nonperiodic flow, J. Atmos. Sci., 20, 130–141, https://doi.org/10.1175/1520-0469(1963)020<0130:DNF>2.0.CO;2, 1963.
Manzanas, R., Gutiérrez, J. M., Bhend, J., Hemri, S., Doblas-Reyes, F. J., Torralba, V., Penabad, E., and Brookshaw, A.: Bias adjustment and ensemble recalibration methods for seasonal forecasting: a comprehensive intercomparison using the C3S dataset, Clim. Dynam., 53, 1287–1305, https://doi.org/10.1007/s00382-019-04640-4, 2019.
Margono, B. A., Potapov, P. V., Turubanova, S., Stolle, F., and Hansen, M. C.: Primary forest cover loss in Indonesia over 2000–2012, Nat. Clim. Change, 4, 730, https://doi.org/10.1038/nclimate2277, 2014.
Marlier, M. E., DeFries, R. S., Voulgarakis, A., Kinney, P. L., Randerson, J. T., Shindell, D. T., Chen, Y., and Faluvegi, G.: El Niño and health risks from landscape fire emissions in southeast Asia, Nat. Clim. Change, 3, 131–136, https://doi.org/10.1038/nclimate1658, 2013.
Mason, I.: A model for assessment of weather forecasts, Aust. Met. Mag., 30, 291–303, 1982.
Miettinen, J., Hooijer, A., Wang, J., Shi, C., and Liew, S. C.: Peatland degradation and conversion sequences and interrelations in Sumatra, Reg. Environ. Change, 12, 729–737, https://doi.org/10.1007/s10113-012-0290-9, 2012.
Murphy, A. H.: A new vector partition of the probability score, J. Appl. Meteorol., 12, 595–600, https://doi.org/10.1175/1520-0450(1973)012<0595:ANVPOT>2.0.CO;2, 1973.
Murphy, A. H.: Decision making and the value of forecasts in a generalized model of the cost-loss ratio situation, Mon. Weather Rev., 113, 362–369, https://doi.org/10.1175/1520-0493(1985)113<0362:DMATVO>2.0.CO;2, 1985.
Murphy, A. H. and Winkler, R. L.: Diagnostic verification of probability forecasts, Int. J. Forecast., 7, 435–455, https://doi.org/10.1016/0169-2070(92)90028-8, 1992.
Niculescu-Mizil, A. and Caruana, R.: Predicting good probabilities with supervised learning, in: Proceedings of the 22nd international conference on Machine learning (ICML '05), Association for Computing Machinery, New York, NY, USA, 625–632, https://doi.org/10.1145/1102351.1102430, 2005.
Nikonovas, T.: ProbFire: a probabilistic fire early warning system for Indonesia (0.1), Zenodo [data set], https://doi.org/10.5281/zenodo.5206278, 2021a.
Nikonovas, T.: ProbFire, Zenodo [code], https://doi.org/10.5281/zenodo.5939892, 2021b.
Nikonovas, T., Spessa, A., Doerr, S. H., Clay, G. D., and Mezbahuddin, S.: Near-complete loss of fire-resistant primary tropical forest cover in Sumatra and Kalimantan, Commun. Earth Environ., 1, 65, https://doi.org/10.1038/s43247-020-00069-4, 2020.
Oozeer, Y., Chan, A., Wang, J., Reid, J. S., Salinas, S. V., Ooi, M. C., and Morris, K. I.: The Uncharacteristic Occurrence of the June 2013 Biomass-Burning Haze Event in Southeast Asia: Effects of the Madden-Julian Oscillation and Tropical Cyclone Activity, Atmosphere, 11, 55, https://doi.org/10.3390/atmos11010055, 2020.
Page, S. E. and Hooijer, A.: In the line of fire: the peatlands of Southeast Asia, Philos. T. Roy. Soc. B, 371, 20150176, https://doi.org/10.1098/rstb.2015.0176, 2016.
Page, S. E., Siegert, F., Rieley, J. O., Boehm, H. D. V., Jaya, A., and Limin, S.: The amount of carbon released from peat and forest fires in Indonesia during 1997, Nature, 420, 61–65, https://doi.org/10.1038/nature01131, 2002.
Pan, X., Chin, M., Ichoku, C. M., and Field, R. D.: Connecting Indonesian fires and drought with the type of El Niño and phase of the Indian Ocean dipole during 1979–2016, J. Geophys. Res.-Atmos., 123, 7974–7988, https://doi.org/10.1029/2018JD028402, 2018.
Pedregosa, F., Varoquaux, G., Gramfort, A., Michel, V., Thirion, B., Grisel, O., Blondel, M., Prettenhofer, P., Weiss, R., Dubourg, V., and Vanderplas, J.: Scikit-learn: Machine learning in Python, J. Mach. Learn. Res., 12, 2825–2830, 2011.
Reid, J. S., Xian, P., Hyer, E. J., Flatau, M. K., Ramirez, E. M., Turk, F. J., Sampson, C. R., Zhang, C., Fukada, E. M., and Maloney, E. D.: Multi-scale meteorological conceptual analysis of observed active fire hotspot activity and smoke optical depth in the Maritime Continent, Atmos. Chem. Phys., 12, 2117–2147, https://doi.org/10.5194/acp-12-2117-2012, 2012.
Richardson, D. S.: Skill and relative economic value of the ECMWF ensemble prediction system, Q. J. Roy. Meteor. Soc., 126, 649–667, https://doi.org/10.1002/qj.49712656313, 2000.
Sabajo, C. R., le Maire, G., June, T., Meijide, A., Roupsard, O., and Knohl, A.: Expansion of oil palm and other cash crops causes an increase of the land surface temperature in the Jambi province in Indonesia, Biogeosciences, 14, 4619–4635, https://doi.org/10.5194/bg-14-4619-2017, 2017.
Shawki, D., Field, R. D., Tippett, M. K., Saharjo, B. H., Albar, I., Atmoko, D., and Voulgarakis, A.: Long-lead prediction of the 2015 fire and haze episode in Indonesia, Geophys. Res. Lett., 44, 9996–10005, https://doi.org/10.1002/2017GL073660, 2017.
Spessa, A. C., Field, R. D., Pappenberger, F., Langner, A., Englhart, S., Weber, U., Stockdale, T., Siegert, F., Kaiser, J. W., and Moore, J.: Seasonal forecasting of fire over Kalimantan, Indonesia, Nat. Hazards Earth Syst. Sci., 15, 429–442, https://doi.org/10.5194/nhess-15-429-2015, 2015.
Stockdale, T., Anderson, D. L. T., Alves, J. O. S., and Balmaseda, M. A.: Global seasonal rainfall forecasts using a coupled ocean-atmosphere model, Nature, 392, 370–373, https://doi.org/10.1038/32861, 1998.
Tacconi, L.: Preventing fires and haze in Southeast Asia, Nat. Clim. Change, 6, 640, https://doi.org/10.1038/nclimate3008, 2016.
Turco, M., Jerez, S., Doblas-Reyes, F.J., AghaKouchak, A., Llasat, M. C., and Provenzale, A.: Skilful forecasting of global fire activity using seasonal climate predictions, Nat. Commun., 9, 1–9, https://doi.org/10.1038/s41467-018-05250-0, 2018.
Turubanova, S., Potapov, P. V., Tyukavina, A., and Hansen, M. C.: Ongoing primary forest loss in Brazil, Democratic Republic of the Congo, and Indonesia, Environ. Res. Lett., 13, 074028, https://doi.org/10.1088/1748-9326/aacd1c, 2018.
Van Wagner, C. E. and Forest, P.: Development and structure of the Canadian forest fire weather index system, vol. 35, Canadian Forestry Service, Headquarters, Ottawa, 1987.
Vetrita, Y. and Cochrane, M. A.: Fire Frequency and Related Land-Use and Land-Cover Changes in Indonesia's Peatlands, Remote Sens., 12, 5, https://doi.org/10.3390/rs12010005, 2020.
Widyastuti, K., Imron, M.A., Pradopo, S.T., Suryatmojo, H., Sopha, B.M., Spessa, A., and Berger, U.: PeatFire: an agent-based model to simulate fire ignition and spreading in a tropical peatland ecosystem, Int. J. Wildland Fire, 30, 71–89, https://doi.org/10.1071/WF19213, 2020.
Yin, Y., Ciais, P., Chevallier, F., Van der Werf, G.R., Fanin, T., Broquet, G., Boesch, H., Cozic, A., Hauglustaine, D., Szopa, S., and Wang, Y.: Variability of fire carbon emissions in equatorial Asia and its nonlinear sensitivity to El Niño, Geophys. Res. Lett., 43, 10–472, https://doi.org/10.1002/2016GL070971, 2016.