the Creative Commons Attribution 4.0 License.
the Creative Commons Attribution 4.0 License.
 | 29 Jan 2026
From typhoon rainfall to slope failure: optimizing susceptibility models and dynamic thresholds for landslide warnings in Zixing City, China
Weifeng Xiao
Guangchong Yao
Zhenghui Xiao
Ge Liu
Luguang Luo
Yunjiang Cao
Wei Yin
Typhoon-specific rainfall-induced landslides pose critical hazards in mountainous regions, yet existing warning systems inadequately capture the distinct rainfall dynamics of these extreme events. To address this limitation, we propose an integrated framework combining optimized susceptibility predictions with dynamic rainfall thresholds tailored to typhoon patterns. The approach enhances machine learning accuracy through buffer-based negative sampling and variable weighting. It also introduces a spatiotemporal rainfall analysis to distinguish between short-term intense downpours and cumulative soil saturation. Tested in Zixing City, Hunan Province, China, where over 700 landslides were triggered by Typhoon Gaemi, the framework proved effective. The support vector machine (SVM) model achieved the best performance using frequency ratio (FR) inputs with a 0.5 km buffer (F1-score: 0.859, AUC: 0.914), correctly classifying 86.4 % of landslides as high or very high susceptibility. The rainfall analysis identified 24 h intensity combined with 7 d antecedent rainfall as the optimal trigger, effectively capturing both immediate and cumulative moisture effects. Spatially, rhyolite and granite slopes and areas near roads emerged as hotspots for failure (distance <800 m, FR=1.499 for roads; FR=1.546 for rhyolite). The integrated warning system shows high spatial efficiency, with high-risk areas covering only 34.2 % of the study region yet capturing 71.4 % of historical landslides. Additionally, the framework generated high-risk zone maps that align strongly with historical events. This work highlights the unique nature of typhoon-driven slope instability and provides a transferable framework for disaster risk reduction in cyclone-prone regions.
- Article
(15760 KB) - Full-text XML
-
Supplement
(1328 KB) - BibTeX
- EndNote


Landslides pose significant threats to mountainous regions globally (Froude and Petley, 2018), especially in areas where steep terrain, complex geology (Thiene et al., 2017), and extreme weather events like typhoons intersect. In Southeast China, typhoon-induced landslides have become a growing concern due to the region's rapid urbanization and the increasing variability in climate patterns (Gariano and Guzzetti, 2016; Fan et al., 2018). The Nanling Mountains, in southern China, are particularly vulnerable to landslides due to a combination of extreme topographic relief and complex geological conditions during the typhoon season (Zou et al., 2023).
Typhoons typically bring prolonged antecedent rainfall, followed by intense, short bursts of precipitation (Li et al., 2019). These conditions create unique hydrological environments that exceed the complexity of typical rainfall-triggered landslides (Chung and Li, 2022). These events trigger slope failures through cumulative soil saturation and sudden hydrological stress, challenging traditional landslide prediction methods (Yang et al., 2017). Despite advances in landslide susceptibility prediction (LSP) and rainfall threshold modeling, current approaches remain inadequate. Three critical limitations persist: severe data imbalance effects, suboptimal integration of variable selection with machine learning algorithms, and lack of spatially-explicit rainfall thresholds for typhoon-specific conditions (Segoni et al., 2018a; Regmi et al., 2024).
Most existing studies employ ad-hoc buffer distances without systematic optimization, leading to inconsistent model performance across different geological settings (Lombardo and Mai, 2018). Traditional methods attempt to mitigate this imbalance by randomly sampling non-landslide points across the study area (Steger et al., 2016; Dou et al., 2023). However, random selection can introduce spatial bias, as non-landslide points might include areas that are unstable but have not yet been identified as landslide-prone (Kalantar et al., 2018).
To address this limitation, more recent approaches have employed buffer-based negative sampling, which systematically excludes non-landslide points near known landslide sites. This method assumes that adjacent areas share similar environmental conditions (e.g., slope, lithology) and therefore should not be classified as “stable” (Achu et al., 2022). Several studies have tested varying buffer distances, ranging from tens to thousands of meters, to determine the optimal distance for different regions. However, systematic evaluation of buffer distance optimization coupled with variable weighting methods remains largely unexplored.
LSP is primarily focused on identifying areas prone to slope failure, based on static environmental factors such as topography, lithology, land cover, and hydrology (Zêzere et al., 2017; Guo et al., 2024). Traditional approaches to LSP often rely on deterministic and statistical methods, including information value (IV), certainty factor (CF), frequency ratio (FR), logistic regression (LR), and weight of evidence (WOE). These methods quantify the relationship between historical landslide occurrences and predisposing factors using linear or semi-linear approaches (Ciurleo et al., 2017; Reichenbach et al., 2018). However, these methods oversimplify the complex, nonlinear interactions that govern slope stability (Merghadi et al., 2020).
In contrast, machine learning (ML) algorithms, such as support vector machine (SVM) and light gradient boosting machine (LightGBM), have emerged as powerful alternatives. SVM excels in high-dimensional classification tasks and effectively identifies optimal hyperplanes separating landslide-prone from stable areas (San, 2014; Huang and Zhao, 2018). LightGBM offers superior scalability and computational efficiency for processing large geospatial datasets (Sun et al., 2023). Both SVM and LightGBM capture intricate relationships among variables without restrictive assumptions, making them superior to traditional methods in terms of predictive accuracy (Yang et al., 2023). However, frameworks that systematically integrate variable weighting methods with advanced ML algorithms for LSP optimization are lacking.
For temporal prediction, existing rainfall threshold approaches predominantly use generalized regional thresholds that inadequately capture local geological heterogeneity and typhoon-specific rainfall patterns (Calvello and Piciullo, 2016; Guzzetti, 2021; Banfi and De Michele, 2024). These thresholds are typically defined based on cumulative or intensity-duration (I-D) rainfall values (Piciullo et al., 2017; Segoni et al., 2018a). In typhoon-prone regions, dynamic rainfall thresholds are crucial due to the unique combination of long-duration antecedent rainfall and sudden high-intensity bursts of precipitation (Guzzetti et al., 2020). Traditional empirical methods fail to provide spatially continuous threshold surfaces that account for local environmental variability (Piciullo et al., 2018).
Recent advances have integrated multi-temporal rainfall parameters with advanced statistical techniques to optimize rainfall thresholds (Segoni et al., 2015; Huang et al., 2022), accounting for diverse triggering mechanisms. Additionally, spatial interpolation methods, such as Kriging, have been applied to generate continuous rainfall threshold surfaces that allow for local variations in geological and environmental conditions (Kenanoglu et al., 2019; Segoni et al., 2018b). This approach, when combined with high-resolution susceptibility maps, contributes to the development of integrated hazard warning systems that can dynamically adjust to typhoon-specific rainfall-induced scenarios (Piciullo et al., 2018; Mirus et al., 2018).
This study examines Zixing City, a mountainous region in southeastern Hunan Province, frequently affected by typhoon-induced extreme rainfall. Its steep slopes, fractured geology, and high sensitivity to rapid pore-pressure increase render it particularly vulnerable (Ma et al., 2025). The large number of landslides (>700) triggered by Typhoon Gaemi in July 2024 provides a valuable dataset for model calibration and validation.
Here we developed an integrated framework that combines (i) optimized buffer distances for negative sampling, (ii) bivariate weighting methods (IV, CF, FR) with advanced machine learning classifiers (SVM, LightGBM), and (iii) spatially continuous, typhoon-specific rainfall thresholds derived through Kriging interpolation. The specific objectives are to (1) determine optimal buffer distances that minimize spatial bias in imbalanced datasets, (2) evaluate the performance gain from coupling bivariate weights with machine learning algorithms, (3) establish dynamic rainfall thresholds suited to typhoon rainfall patterns, (4) generate continuous threshold surfaces via Kriging, and (5) integrate high-resolution susceptibility maps with these thresholds to support an operational early warning system. This approach improves landslide prediction in typhoon-prone mountainous regions and provides a transferable methodology for similar environments.
2.1 Study area
Zixing City (25°34′–26°18′ N, 113°08′–113°44′ E), covering 2747 km2 in southeastern Hunan Province, China (Fig. 1), is located within the Nanling Mountains geological province. Situated approximately 400 km inland from the South China Sea, Zixing lies at the intersection of the Nanling Mountains and low hills, forming a watershed divide between the Yangtze and Pearl River basins. The region is characterized by steep topography, with elevations ranging from 125 to 1691 m and slopes exceeding 30° across 78 % of the area. This mountainous terrain, combined with fractured geology and active NE-SW trending faults such as the Chaling-Yongxing Fault Zone, creates a permeable fracture network that facilitates groundwater drainage.
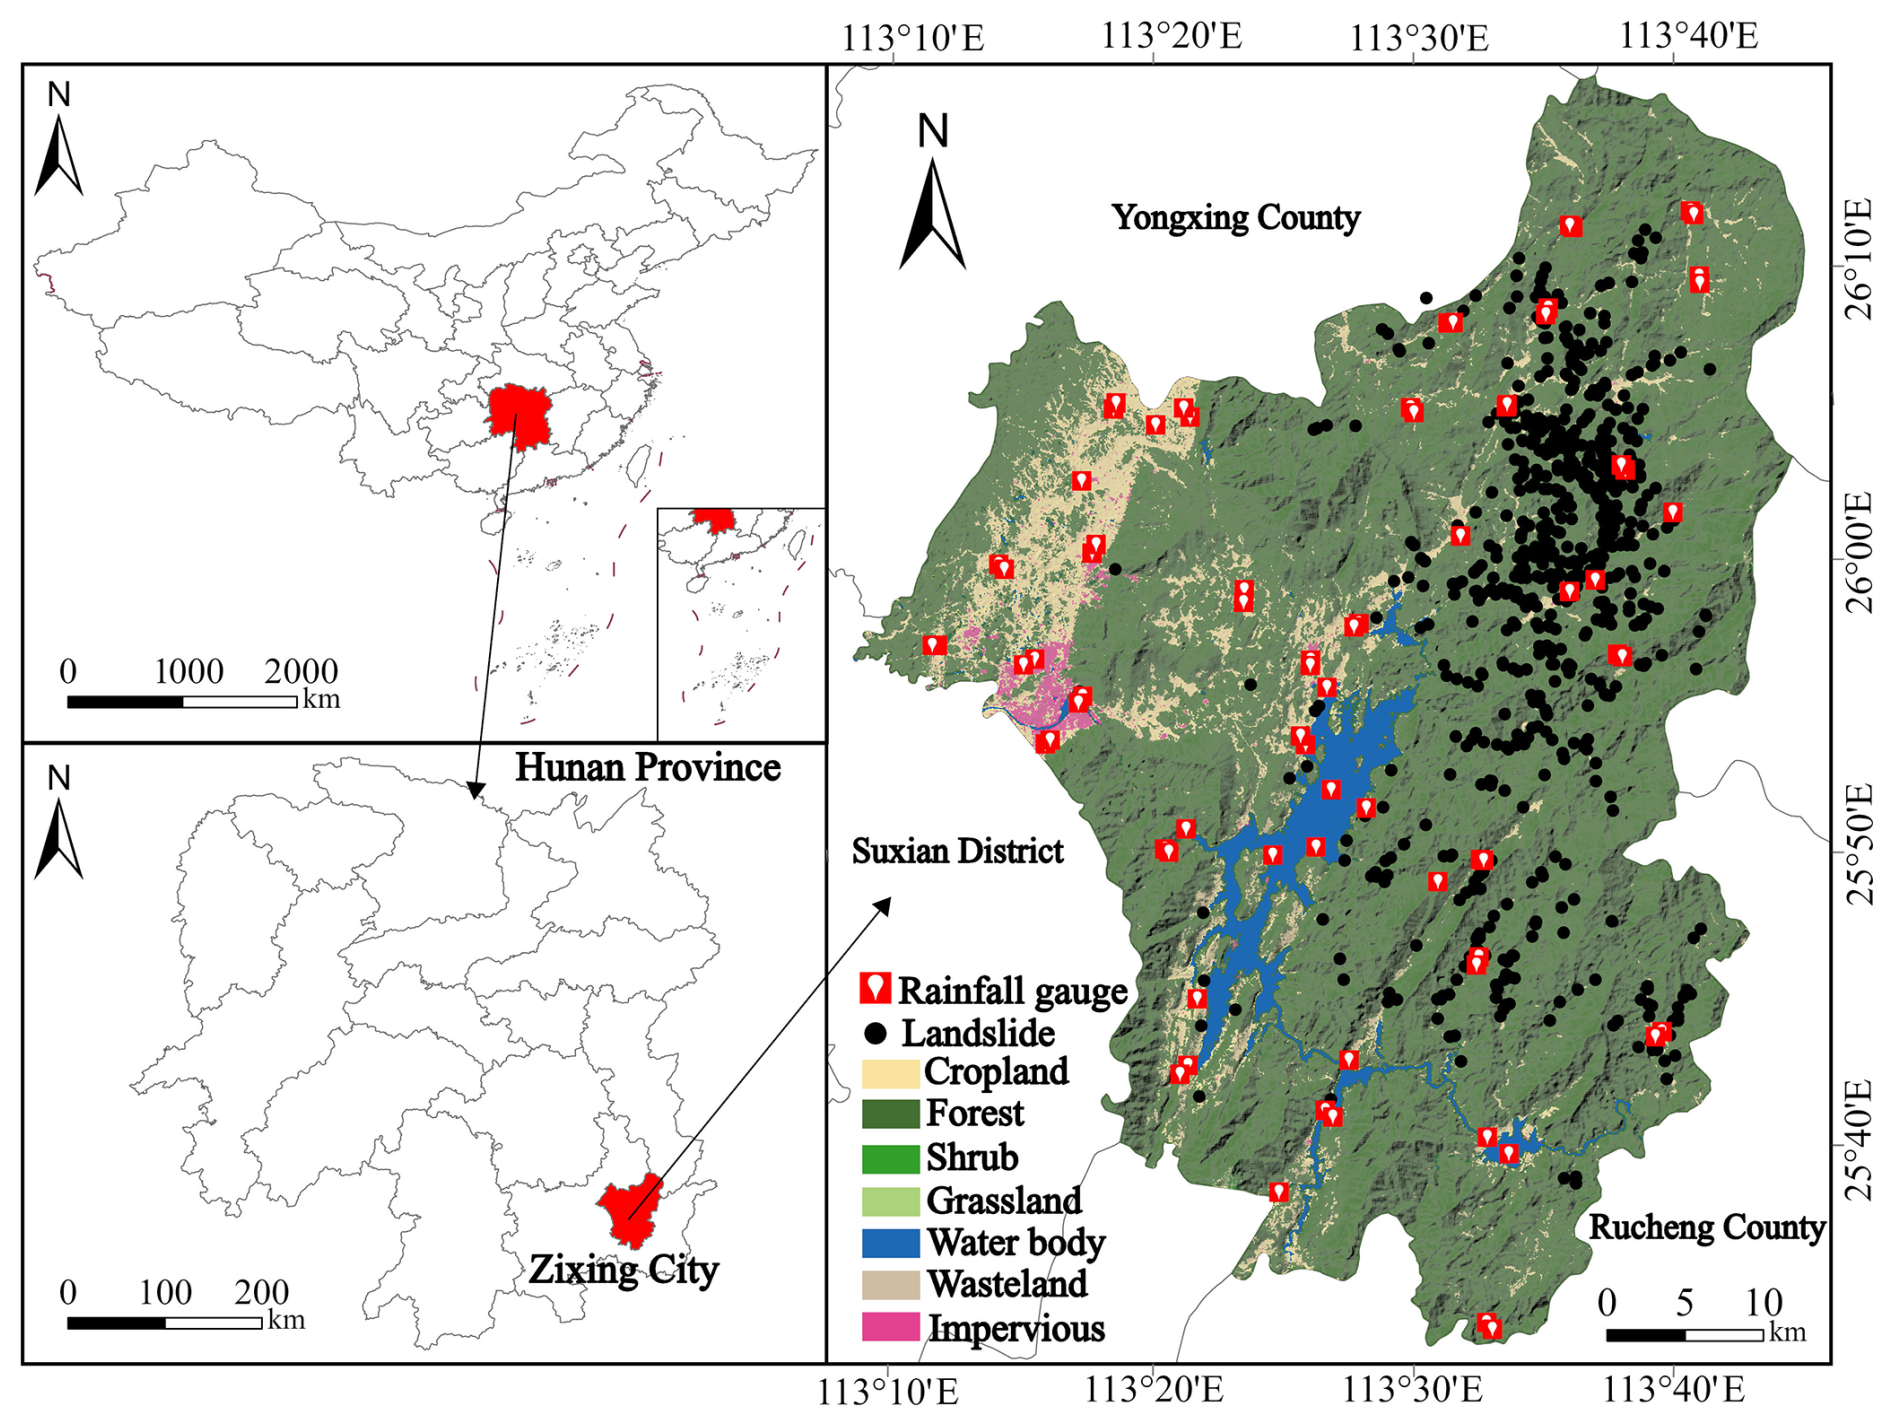
Figure 1Geographical distribution of the study area, landslides and rainfall gauges.
The climate of Zixing is subtropical monsoon, with annual precipitation averaging 1550 mm, 70 % of which occurs from April to September. Typhoons significantly contribute to rainfall, inducing rapid pore-pressure increases in shallow aquifers (3–8 m depth). These climatic and geological conditions make Zixing particularly vulnerable to landslides, providing a valuable context for this study. The extensive landslide dataset triggered by Typhoon Gaemi in July 2024 (>700 events) serves as a critical resource for model calibration and validation.
2.2 Data collection and preprocessing
2.2.1 Compilation of landslide catalogue
A comprehensive inventory of 705 landslide events triggered by Typhoon Gaemi on 27 July 2024, was compiled from the Hunan Center for Natural Resources Affairs. The landslide locations were verified through field inspections and high-resolution satellite imagery to ensure spatial accuracy and completeness of the dataset.
2.2.2 Landslide conditioning factors and data sources
Based on extensive literature reviews and the geoenvironmental characteristics of the study area, twelve conditioning factors were selected for landslide susceptibility analysis: elevation, slope gradient, slope orientation, curvature, topographic wetness index (TWI), stream power index (SPI), normalized difference vegetation index (NDVI), distances to roads, rivers, and faults, and lithology (Fig. 2).
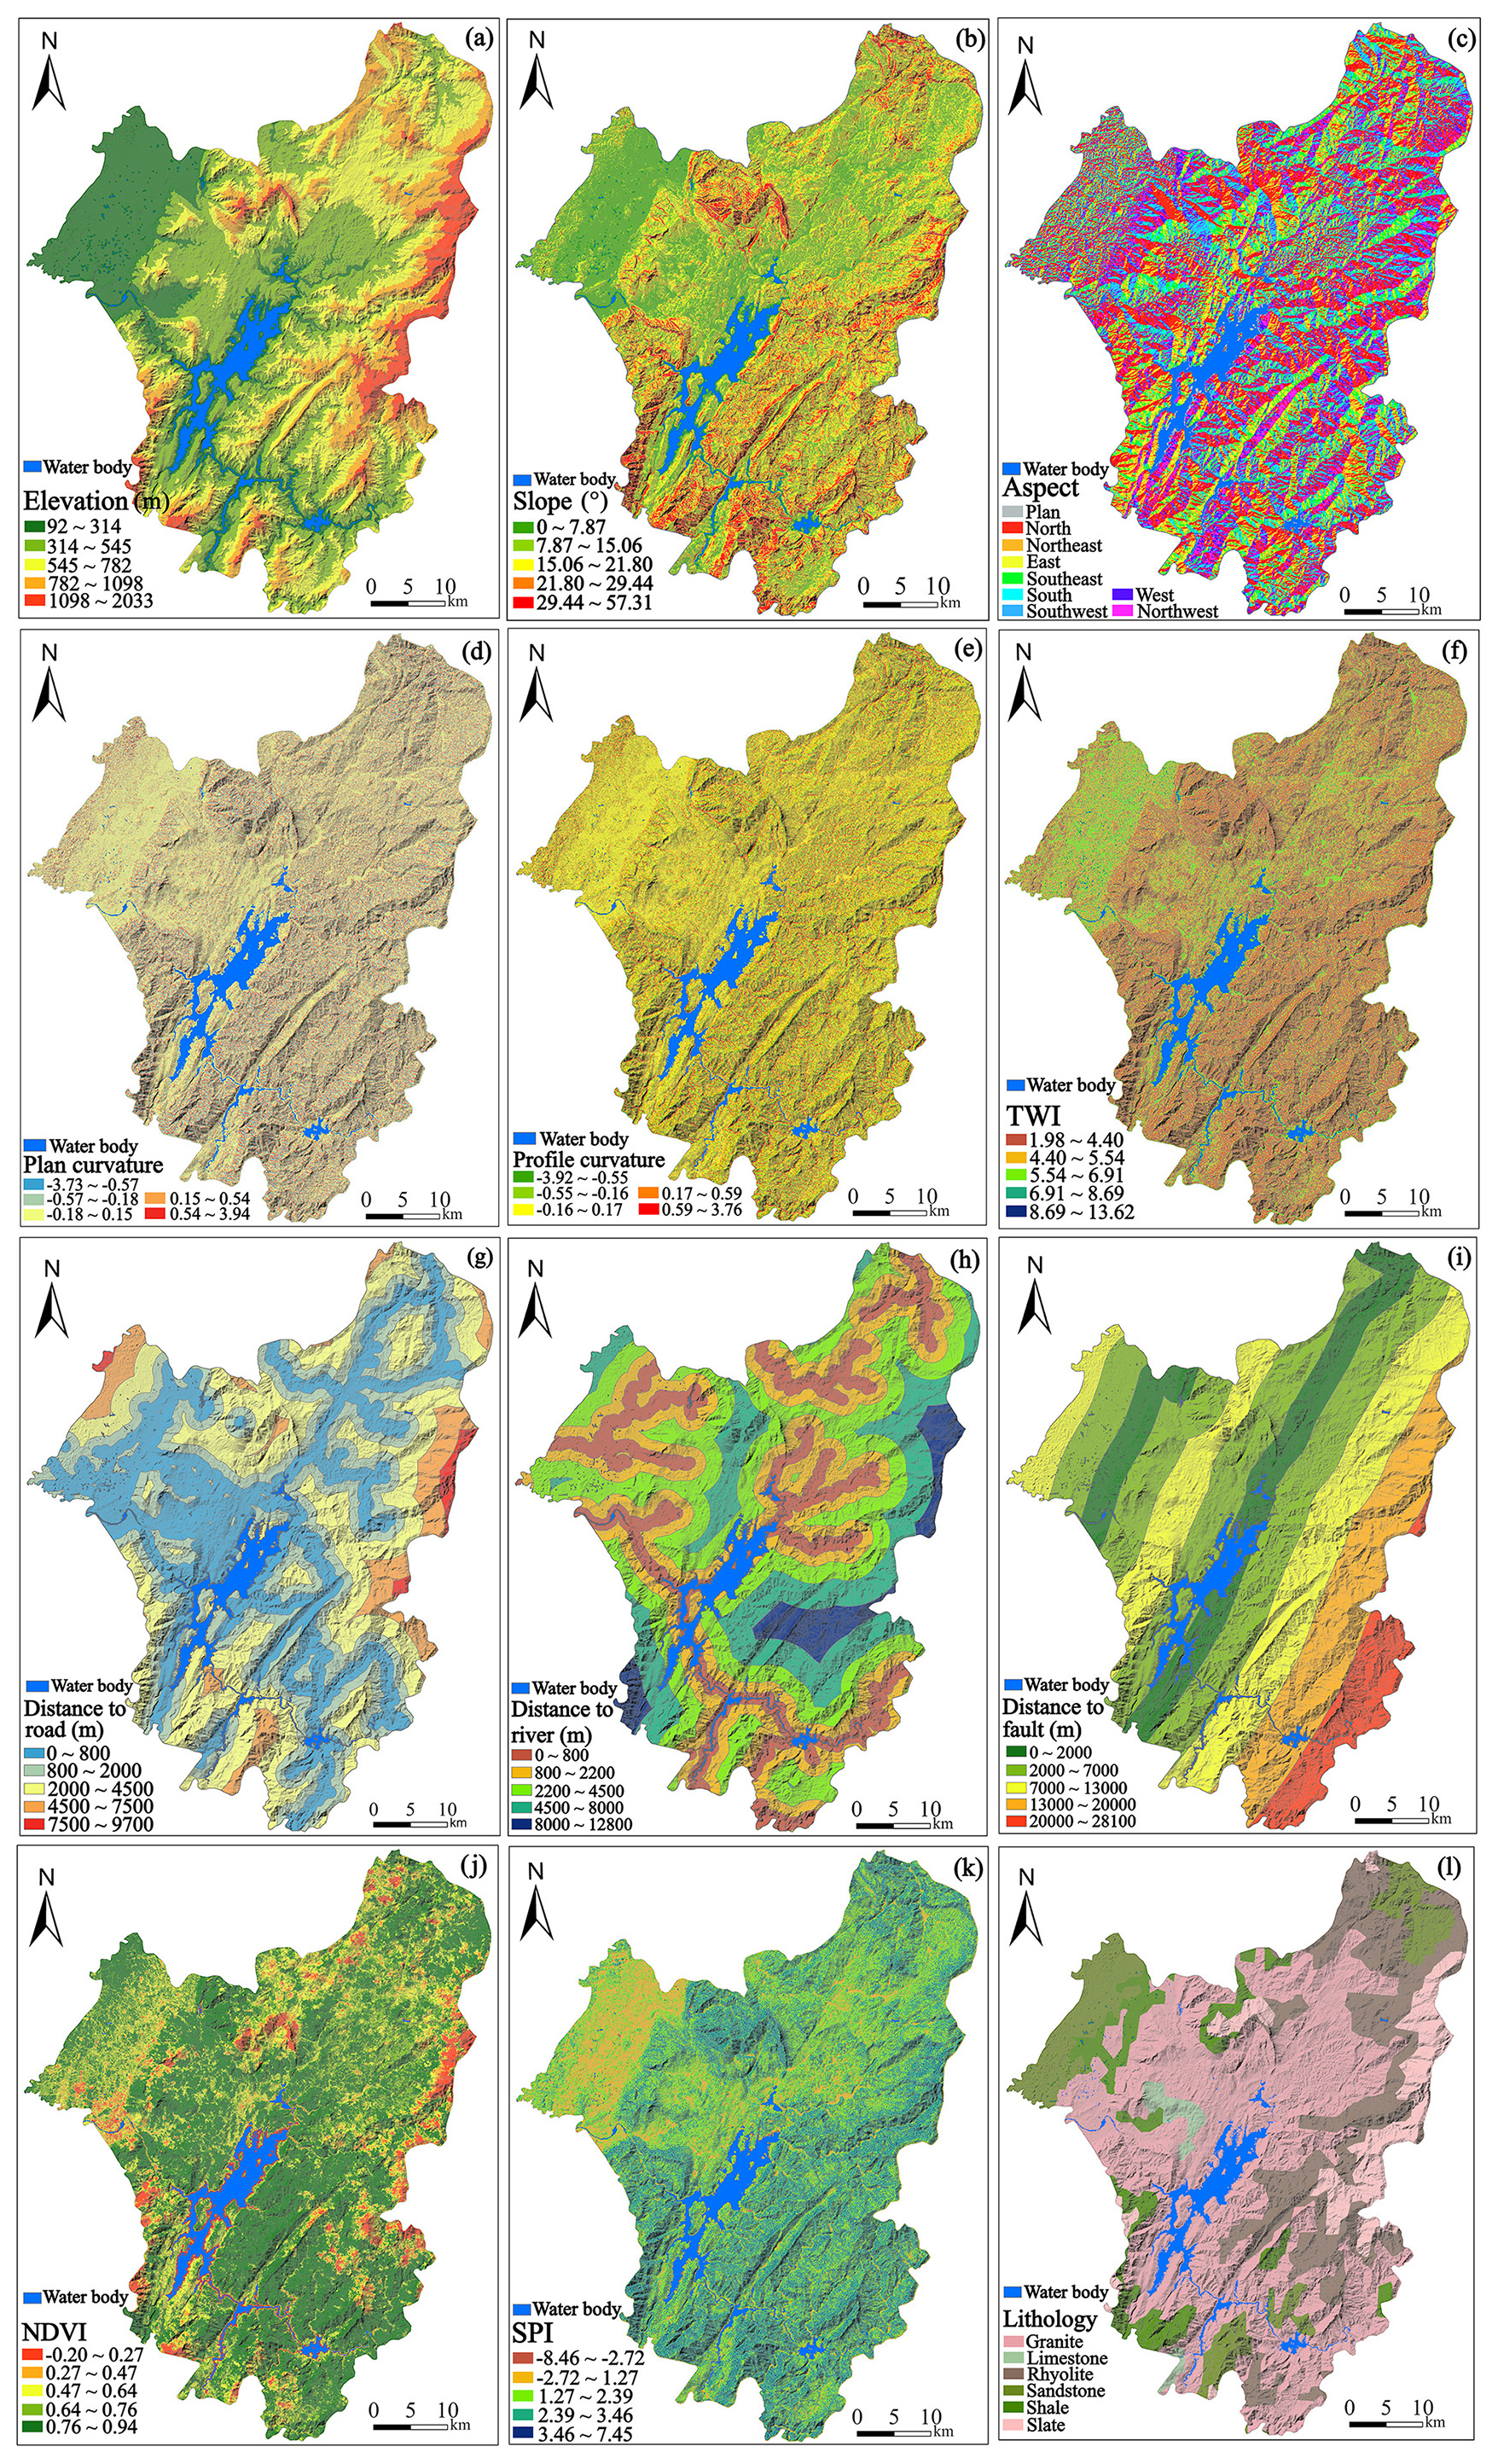
Figure 2Landslide-related conditioning factors.
Topographic factors (elevation, slope gradient, slope orientation, TWI, SPI, and curvature) were extracted from a 30 m digital elevation model (DEM) obtained from the Geospatial Data Cloud (https://www.gscloud.cn, last access: 20 October 2023). Environmental factors including NDVI and proximity variables (distances to roads, rivers, and fault lines) were derived from 1:50 000-scale cartographic maps and Landsat 8 OLI imagery from the same platform. Geological composition and structural data were acquired from 1:100 000-scale geological maps.
2.2.3 Data preprocessing and spatial standardization
We transformed all conditioning factors into continuous statistical measures using IV, CF, and FR methods and then resampled them to a uniform 60 m resolution. This resolution was selected to balance computational efficiency with scale appropriateness for regional landslide analysis while maintaining compatibility with the available geological map scale (1:100 000).
The study area was divided into 60×60 m grid cells, with landslides smaller than the grid resolution aggregated to the nearest cell centroid. Multiple landslides within a single cell were treated as one event to maintain spatial independence required for machine learning modeling. This preprocessing approach ensures statistical validity by minimizing spatial autocorrelation effects while providing adequate representation of landslide distribution patterns across the study area.
2.2.4 Rainfall data collection and spatial distribution
Rainfall data for the study were obtained from 12 automatic rain gauge stations strategically distributed across Zixing City and its surrounding areas (Fig. 1). These stations, operated by the Hunan Meteorological Administration, provided hourly precipitation records during Typhoon Gaemi (20–30 July 2024) and the preceding antecedent period. The spatial distribution of gauge stations ensured adequate coverage of the study area's topographic and climatic gradients.
To assign rainfall parameters (H1, H12, H24, H72, and D7) to each of the 705 landslide points, we employed the Kriging interpolation to generate spatially continuous rainfall surfaces from discrete gauge measurements. This geostatistical method accounts for spatial autocorrelation in rainfall patterns and provides optimal unbiased estimates by weighting nearby observations based on their spatial proximity and correlation structure.
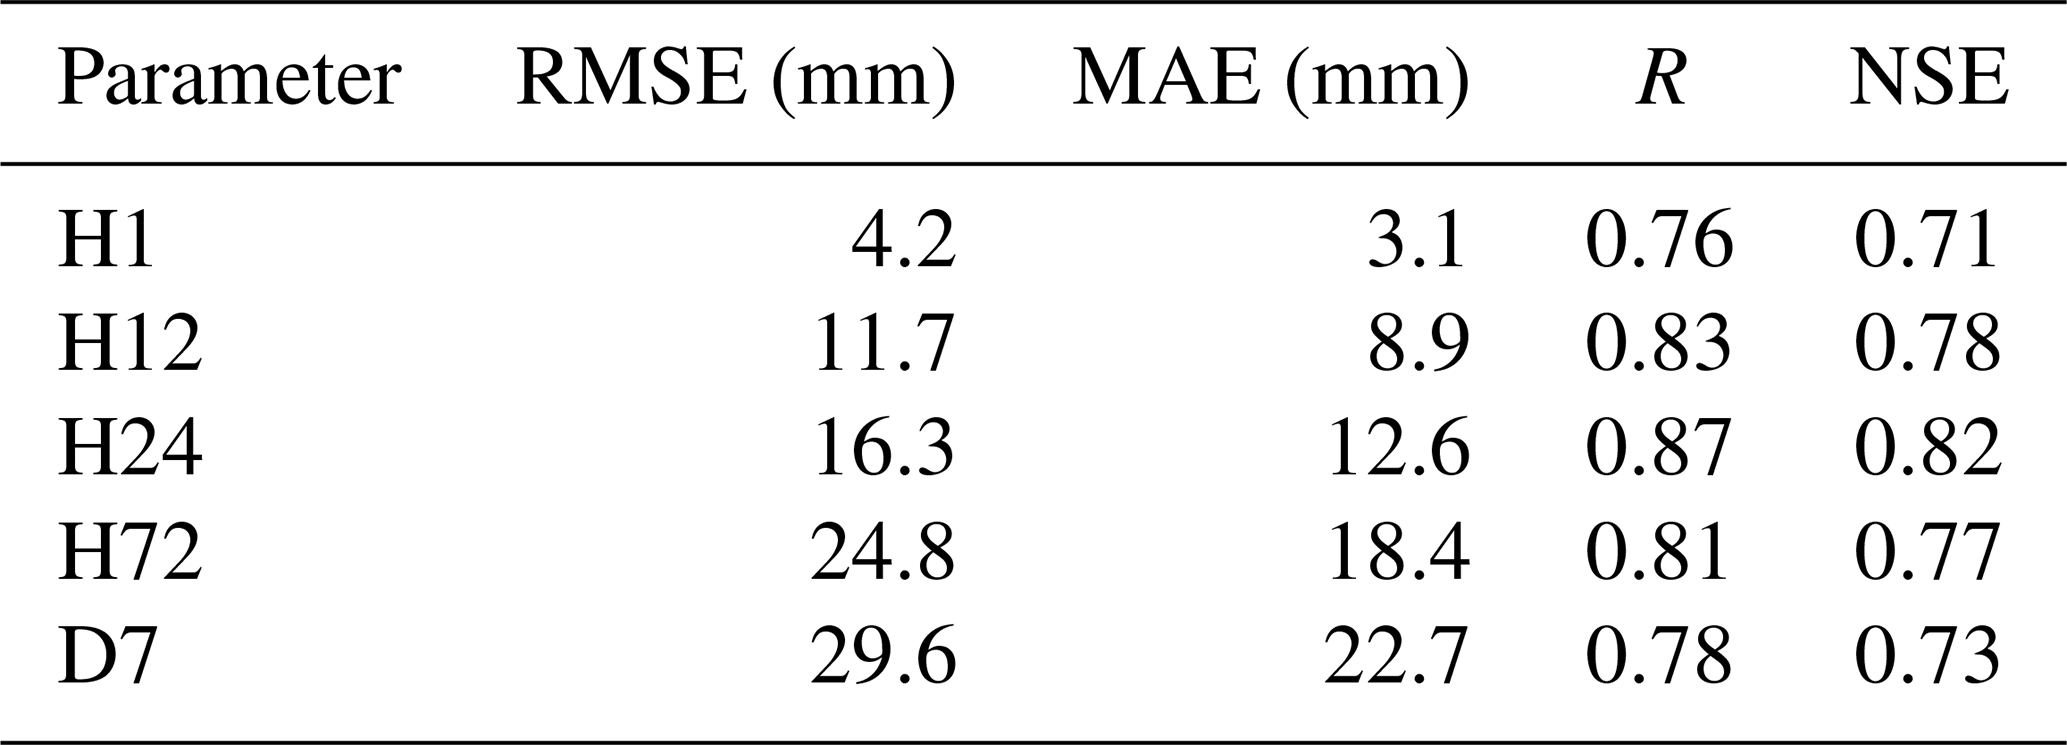
Spherical variogram models were fitted to the rainfall data through iterative optimization, with model selection based on minimum Akaike Information Criterion (AIC) values. The interpolation accuracy was rigorously evaluated through leave-one-out cross-validation, where each gauge station was sequentially removed and its rainfall values predicted using the remaining 11 stations. Four statistical metrics were used to assess performance: Root Mean Square Error (RMSE), Mean Absolute Error (MAE), correlation coefficient (R), and Nash-Sutcliffe Efficiency (NSE).
The validation results demonstrated acceptable interpolation accuracy across all rainfall parameters, with correlation coefficients ranging from 0.76 to 0.87 and Nash-Sutcliffe Efficiency values between 0.71–0.82. Despite some limitations inherent to the sparse gauge network in mountainous terrain, the interpolation performance was deemed sufficient for regional landslide susceptibility analysis, ensuring reasonable spatial representation of precipitation patterns across the study area.
This study proposes an integrated framework for optimizing LSP and typhoon-specific rainfall thresholds within hazard warning systems (Fig. 3). The framework includes the following key components: (1) landslide susceptibility prediction and mapping, utilizing twelve conditioning factors prioritizing typhoon-induced hydrological responses (e.g., TWI, SPI) and 705 landslide records from 27 July 2024, optimized with five buffer distances and evaluated using ROC curves; (2) dynamic rainfall threshold modeling based on typhoon rainfall parameterization, validated and spatially interpolated using Kriging; and (3) the integration of spatial and temporal probabilities to develop a typhoon-specific rainfall-induced landslide warning system, demonstrated through a case study in Zixing City.
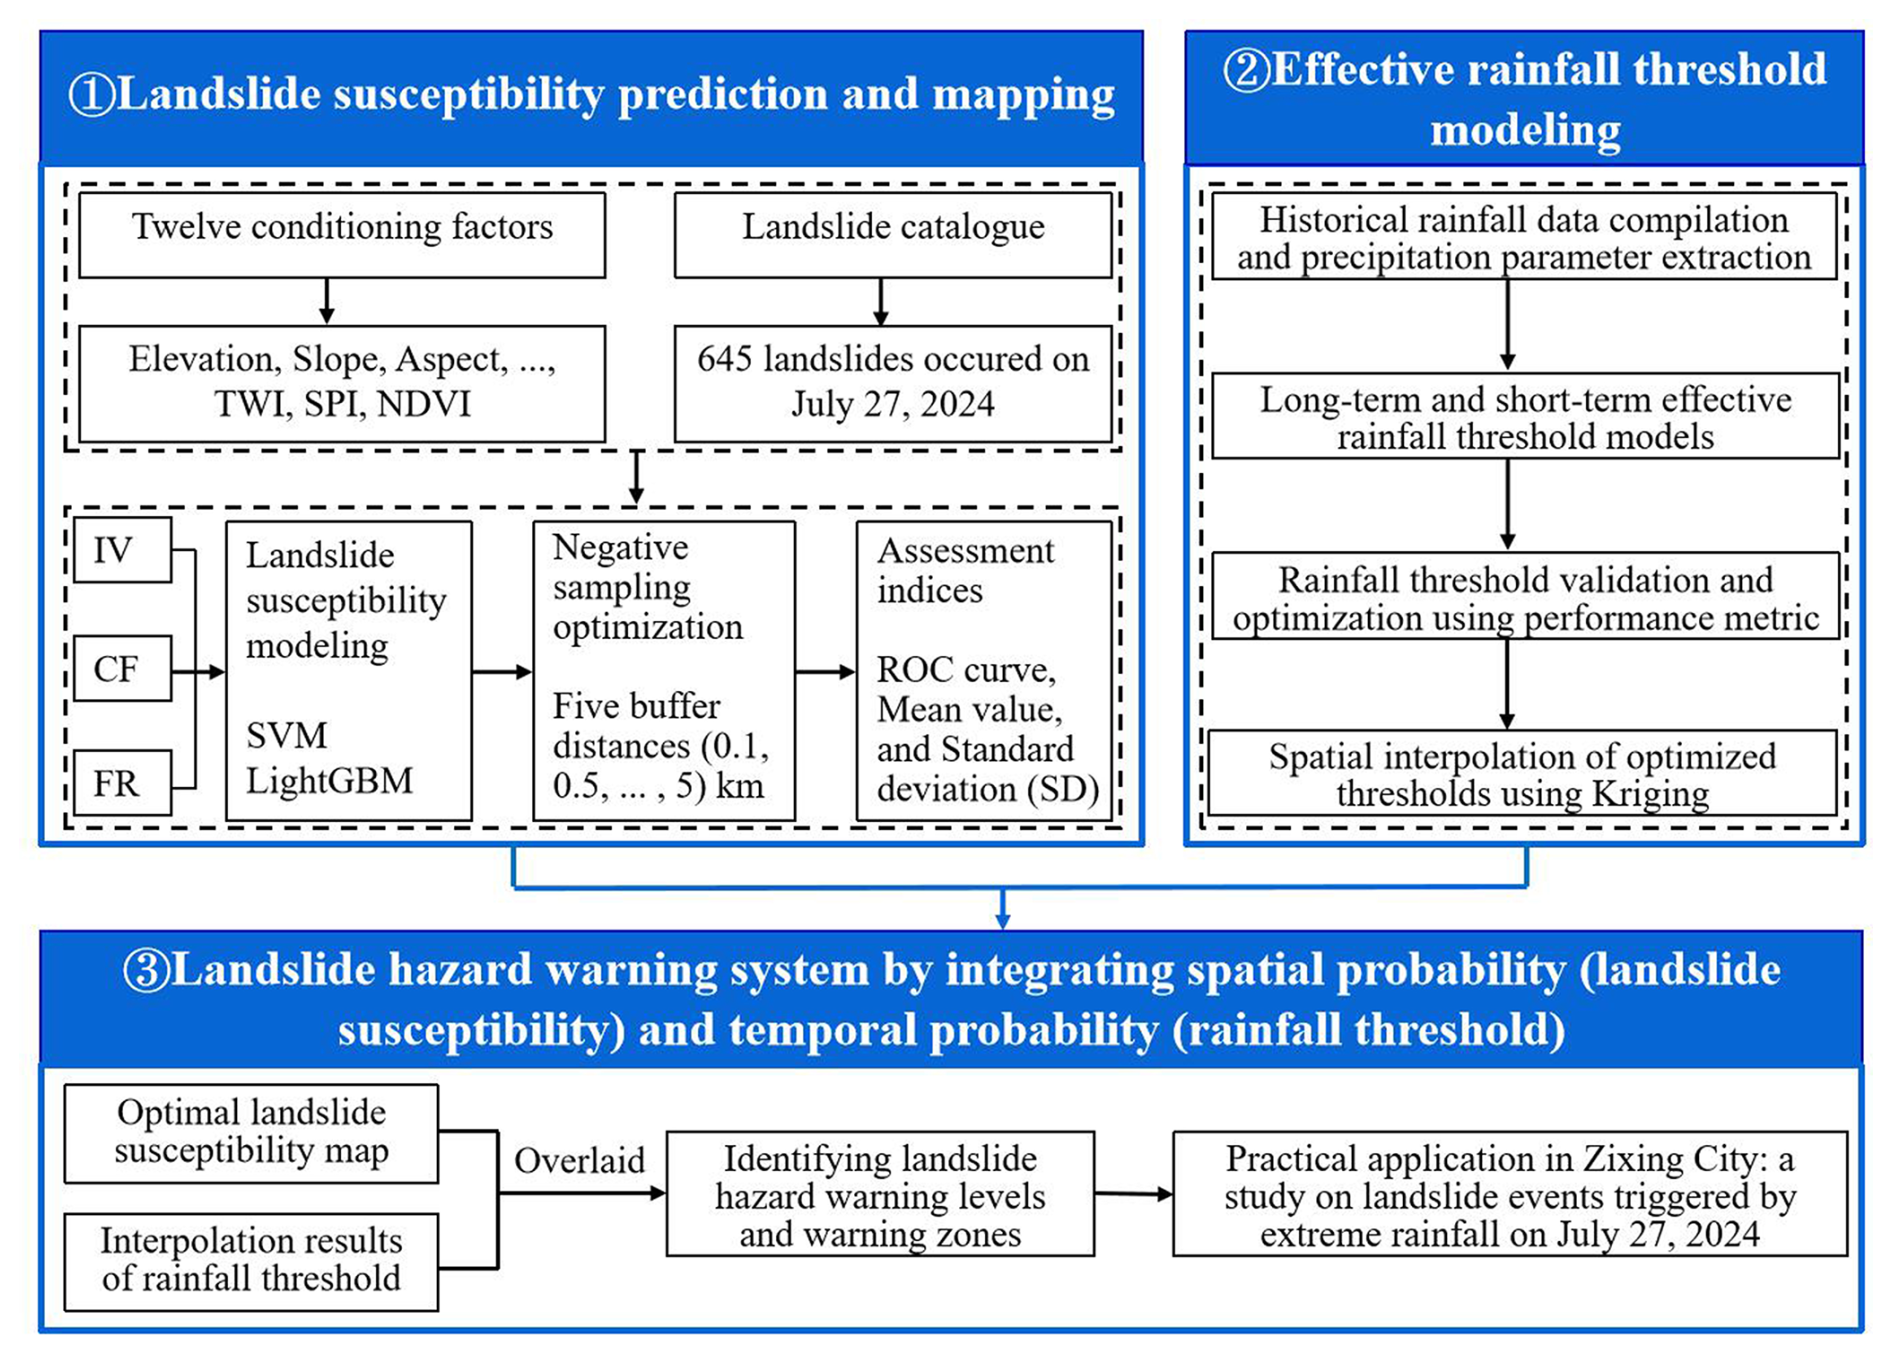
Figure 3Technical framework for developing a typhoon-specific rainfall-induced landslide warning system.
3.1 Landslide susceptibility prediction and mapping
3.1.1 Machine learning models: selection rationale and implementation
We selected SVM and LightGBM to address three key challenges in typhoon-specific rainfall-induced landslide prediction: (1) severe class imbalance (landslides <0.5 % of study area), (2) complex non-linear interactions between rainfall and terrain factors, and (3) computational efficiency for operational early warning.
SVM excels in binary classification with limited samples through structural risk minimization (Kalantar et al., 2018), making it suitable for typhoon-triggered landslide mapping. Its margin-maximization approach handles the class imbalance between stable and landslide areas, while the RBF kernel captures localized failure patterns under concentrated typhoon rainfall. The regularization parameter C prevents overfitting to specific typhoon events, ensuring model transferability. The SVM optimization problem is defined as:
subject to the constraint:
where w is the normal vector to the hyperplane, b is the bias term, ξi are slack variables, ϕ(xi) maps input vectors to a higher-dimensional space,and yi denotes the class label (−1 or 1) for each sample xi. We optimized the RBF kernel parameters using grid-search with 5-fold cross-validation, where and . Across all configurations (three input methods × five buffer distances), optimal values varied as follows: C=5–15 and γ=0.10–0.25, with median values of C=10 and γ=0.15.
LightGBM complements SVM through gradient boosting with sequential error correction, offering distinct advantages for regional-scale landslide mapping. Its histogram-based algorithm enables efficient processing of large spatial datasets (Sun et al., 2023). Additionally, LightGBM automatically captures complex feature interactions. The minimized objective function is expressed as:
where yi is the true label, is the predictive value, λ is a regularization parameter, and θj represents the parameters of the model. We optimized LightGBM hyperparameters through Bayesian optimization. The optimal hyperparameters ranged as: num_leaves=25–35, learning_rate=0.03–0.08, and max_depth=6–10. Early stopping with a 50-round patience window resulted in model convergence at 120–220 trees across different scenarios.
3.1.2 Input variable weighting methods
The IV method, grounded in information theory, assesses how different factors contribute to landslide susceptibility within a study area (Niu et al., 2024). Factors such as distance to roads and lithology were weighted higher in Zixing City due to their interaction with typhoon-induced soil saturation. The IV for each evaluation factor is determined using the formula below:
where IV(Fi, K) is the information value of evaluation factor Fi in relation to landslide event K, Ni refers to the number of landslides, N is the total number of landslides, Si represents the area covered by factor Fi, and S is the total area of the study area.
The CF method is a widely utilized probabilistic technique for assessing the likelihood of landslide occurrences (Zhao et al., 2021). It quantifies the prior probability of a landslide initiation under specific conditions of influential factors, utilizing spatial data from known landslide locations. The expression of CF is as follows:
where CF is the certainty factor indicating the degree of association between an influential factor and potential landslide occurrence. It is derived from two area-proportional measures: PPa, the proportion of landslide points within a specific factor class (number of landslide points in the class / total area of the class); and PPs, the proportion of landslide points across the entire study region (total number of landslide points / total area of the region).
The FR is a prevalent method in statistical analysis that assesses the relative impact of various factors on the incidence of landslides (Panchal and Shrivastava, 2021). An elevated FR value denotes a more significant influence of a factor on the likelihood of landslides. The FR is determined by the following equation:
where FR is the frequency ratio, Ni represents the number of landslides within the area corresponding to the conditioning factor, N is the total number of landslides, Si is the area covered by the conditioning factor and S is the total area of the study region.
3.1.3 Buffer distance optimization and uncertainty assessment for LSP
To generate negative (non-landslide) samples for LSP, areas within buffer distances of d=0.1, 0.5, 1.0, 2.0, and 5.0 km around landslide locations were excluded, with balanced negative samples (n=705) randomly selected from remaining stable areas for each distance. The optimal buffer distance was determined by evaluating SVM and LightGBM model performance using AUC, Precision, Recall, and F1-score metrics.
The selection of buffer distances (0.1–5.0 km) was based on Zixing's geomorphological considerations and practices commonly reported in LSP. This range encompasses multiple spatial scales: slope-scale processes (0.1–0.5 km), catchment-scale features (1.0–2.0 km), and regional-scale geological units (5.0 km). The evaluation ensures optimal spatial representation without a priori assumptions about scale dependencies (Chang et al., 2023).
Prediction uncertainty was assessed using the mean and standard deviation (SD) of predicted landslide susceptibility values. Lower mean and SD values indicate reduced prediction uncertainty and more concentrated susceptibility patterns, suggesting higher model confidence in LSP (Huang et al., 2022), thereby complementing the buffer distance optimization process.
3.2 Effective rainfall threshold modeling
3.2.1 Rainfall parameterization and threshold calculation
Typhoon-induced landslides are generally influenced by a combination of antecedent moisture conditions and immediate precipitation, rather than by isolated rainfall events (Mondini et al., 2023; Tufano et al., 2021). To account for the cumulative impact of multi-day rainfall while incorporating hydrological processes such as evapotranspiration and drainage, we adopted the concept of effective rainfall (Pe), calculated as:
where Pi represents the daily rainfall on the ith day preceding landslide occurrence, n denotes the number of antecedent days considered, and k is the effective rainfall decay coefficient (Segoni et al., 2018a). For hourly rainfall parameterization, Pi is derived as:
where Rij is the hourly rainfall at the jth hour of the ith day.
3.2.2 Long-term and short-term rainfall parameters
Rainfall-triggered landslides are generally triggered by two dominant mechanisms: prolonged low-intensity rainfall and short-duration high-intensity storms. Based on statistical analysis of historical landslide events in Hunan Province (Xiao et al., 2025), a 7 d antecedent period was identified as optimal for characterizing long-term rainfall impacts. Consequently, the 7 d effective rainfall (D7) was selected as the long-term parameter. Short-term rainfall metrics were defined as cumulative precipitation over 1 h (H1), 12 h (H12), 24 h (H24), and 72 h (H72) preceding landslide initiation. These intervals capture distinct rainfall characteristics: H1 reflects extreme short-term intensity for rapid slope failures, H12 and H24 represent sub-daily to daily precipitation critical for intermediate responses, and H72 accounts for multi-day storm sequences.
3.2.3 Rainfall threshold model development
The threshold modeling framework comprises three sequential steps:
-
Parameter calculation: For each landslide sample, short-term rainfall parameters (H1, H12, H24, and H72) and the long-term rainfall parameter (D7) are calculated. The ratios of short-term parameters to the long-term parameter are computed as: , , , and .
-
Threshold setting: Long-to-short-term ratio coefficients (RC1, RC12, RC24, and RC72) are introduced as thresholds to determine the dominant rainfall pattern for each landslide. These thresholds are used to classify landslides into short-term or long-term Typhoon-induced categories.
-
Coefficient optimization: A cyclic trial-and-error method is employed to determine the optimal ratio coefficients (RC1, RC12, RC24, and RC72), maximizing the accuracy and reliability of the model.
3.2.4 Optimal ratio coefficient threshold determination
The process of determining the optimal long-to-short-term ratio coefficient threshold is demonstrated using H12-D7 as an example. The process for the remaining coefficients (H1-D7, H24-D7, and H72-D7) follows a similar approach. A 5-fold cross-validation method is applied, with the following procedure:
-
Rainfall data extraction for landslide locations: For each of the 705 landslide points, R12 and D7 values are extracted from these interpolated surfaces at the exact landslide coordinates, ensuring that each landslide location receives rainfall values derived from the spatially weighted contributions of all nearby gauge stations. R12 and D7 values for each landslide are calculated using Eqs. (7) and (8).
-
Data preparation: The dataset is divided into five equal parts for cross-validation, with each part serving as a test set while the remaining four serve as the training set.
-
Initial threshold setting: An initial threshold for RC12 is set based on the minimum value in the training set.
-
Threshold evaluation: For each fold, the RC12 threshold is compared with the R12 value of samples in the test set. If RC12<R12, the prediction is considered a failure. Prediction accuracy is calculated for each RC12 threshold, adjusting in 0.001 increments until the highest prediction accuracy is achieved.
-
Optimal RC12 threshold determination: The RC12 threshold with the highest prediction accuracy is selected for each fold. The final RC12 threshold is determined by averaging the optimal thresholds from all five folds.
3.2.5 Spatial distribution of optimal threshold
According to the optimal ratio coefficient threshold determined in Sect. 3.2.4 and the long-term and short-term rainfall parameters obtained through interpolation, the threshold spatial distribution for the study area can be derived. Taking H12D7 as an example, the process is as follows:
First, by dividing the H12 values of each landslide point by the optimal ratio coefficient RC12, the corresponding D7 thresholds for each landslide point can be calculated. These D7 thresholds serve as a basis for applying the Kriging interpolation method to obtain the spatial distribution map of the D7 thresholds across the entire study area.
Next, by multiplying the D7 values of each landslide point by the ratio coefficient RC12, the corresponding H12 thresholds for each landslide point can be determined. Subsequently, utilizing these H12 thresholds, the Kriging interpolation method is applied once more to generate the spatial distribution map of the H12 thresholds for the entire study area.
3.3 Typhoon-specific rainfall-induced landslide warning system
In order to effectively prevent typhoon-specific rainfall-induced landslide hazards, constructing a comprehensive landslide warning system is crucial. This system integrates LSP with critical rainfall thresholds, combining spatial probability and temporal probability to predict the risk of landslide occurrence and the timing of potential events.
Construction of the landslide warning system
Using the natural breaks point method, the LSP is categorized into five levels of spatial probability: very low (S1), low (S2), moderate (S3), high (S4), and very high (S5). These levels represent varying degrees of susceptibility to landslides in different regions, forming the basis for assessing landslide risks when combined with rainfall data. Paralleling the LSP categorization, rainfall thresholds are also divided into five levels using the natural breaks point method, representing temporal probability: very low (T1), low (T2), moderate (T3), high (T4), and very high (T5). A lower rainfall threshold indicates a higher likelihood of typhoon-induced landslides, thus signaling a greater risk of landslide events.
The matrix-based integration of LSP results and rainfall thresholds, as presented in Table 2 (Segoni et al., 2015), highlights the correlation between landslide susceptibility and rainfall intensity. As the levels of landslide hazard warnings escalate from the 1st level, indicating no warning, to the 5th level, which signifies the highest alert, the likelihood of landslide occurrences correspondingly increases. Areas categorized in higher hazard zones correspond to regions with a heightened risk of landslides. This hazard warning system provides a spatial framework for risk assessment and early warning, generating hazard zonation maps that can be integrated into operational landslide monitoring and warning protocols. This underscores the importance of implementing more effective geological disaster prevention strategies, as thoroughly discussed in the literature by Huang et al. (2022).
4.1 Statistical analysis of conditioning factors
The statistical analysis reveals distinct patterns of landslide susceptibility across all conditioning factors (Table S1 in the Supplement). Topographic factors demonstrate clear elevation-dependent behavior, with maximum susceptibility occurring at intermediate elevations (545–782 m, FR=1.637, IV=0.389), suggesting optimal conditions where weathering processes and slope instability converge. Slope gradient exhibits peak susceptibility in the moderate range (7.87–15.06°, FR=1.522, IV=0.343), indicating insufficient driving forces at gentler slopes and potential debris removal at steeper gradients. South-facing aspects show enhanced susceptibility (FR=1.299, IV=0.230), likely attributable to intensified weathering from solar radiation and moisture cycles.
Morphological indices reveal significant correlations with landslide occurrence. Profile curvature demonstrates highest susceptibility in convex areas (0.17–0.59, FR=1.480, IV=0.480), where stress concentration promotes slope failure. TWI shows strong positive correlation with wetness, peaking at high values (8.69–13.62, FR=1.799, IV=0.444), confirming the critical role of water accumulation in slope destabilization. SPI indicates maximum susceptibility in moderate stream power ranges (1.27–2.39, FR=1.298, IV=0.229), reflecting optimal erosional conditions.
Proximity factors exhibit contrasting patterns based on infrastructure type. Distance to roads shows strong inverse correlation with landslide occurrence (0–800 m, FR=1.499, IV=0.333), indicating anthropogenic disturbance effects. Conversely, distance to faults reveals a bimodal pattern with peak susceptibility at intermediate distances (7–12 km, FR=1.439, IV=0.305), suggesting regional structural influence rather than localized fault-induced instability. Environmental factors demonstrate vegetation's protective role, with moderate NDVI values (0.64–0.76) showing elevated susceptibility (FR=1.854, IV=0.015), representing the transition zone between bare soil vulnerability and established vegetation stability. Lithological analysis reveals pronounced material control, with rhyolite (FR=1.546, IV=0.353) and granite (FR=1.247, IV=0.198) showing enhanced susceptibility due to intensive weathering and joint development, while sedimentary rocks (slate, shale, limestone, sandstone) exhibit strong resistance (FR<0.21) owing to their structural integrity and lower weathering susceptibility.
4.2 Landslide susceptibility modeling in Zixing City
Prior to model development, multicollinearity analysis was conducted using variance inflation factor (VIF) to ensure statistical reliability of the conditioning factors. The analysis revealed method-specific multicollinearity patterns: IV and CF methods showed no significant multicollinearity issues (all VIF<10), while the FR method exhibited multicollinearity in four variables (SPI, Aspect, Plan curvature, and Distance to rivers with VIF>10), which were subsequently excluded from FR-based modeling (Table S2). Following this preprocessing, landslide susceptibility prediction was performed using SVM and LightGBM models with the three distinct weighting methods (IV, CF, and FR). Susceptibility levels were categorized into five classes using the natural breaks classification method, with non-landslide samples strategically selected by excluding buffer zones of varying distances (0.1, 0.5, 1.0, 2.0, and 5.0 km) around documented landslide locations to optimize model performance and reduce spatial bias.
4.2.1 IV-based modeling performance
The IV-derived susceptibility maps (Fig. 4) revealed distinct spatial patterns between the two models across varying buffer distances. At smaller scales, the SVM model demonstrated more detailed classification, with a higher degree of overlap between high susceptibility areas and actual landslide locations. The LightGBM model's classification was smoother, with a lower degree of overlap between high susceptibility areas and actual landslide locations. Notably, this performance discrepancy diminished progressively with increasing buffer distances.
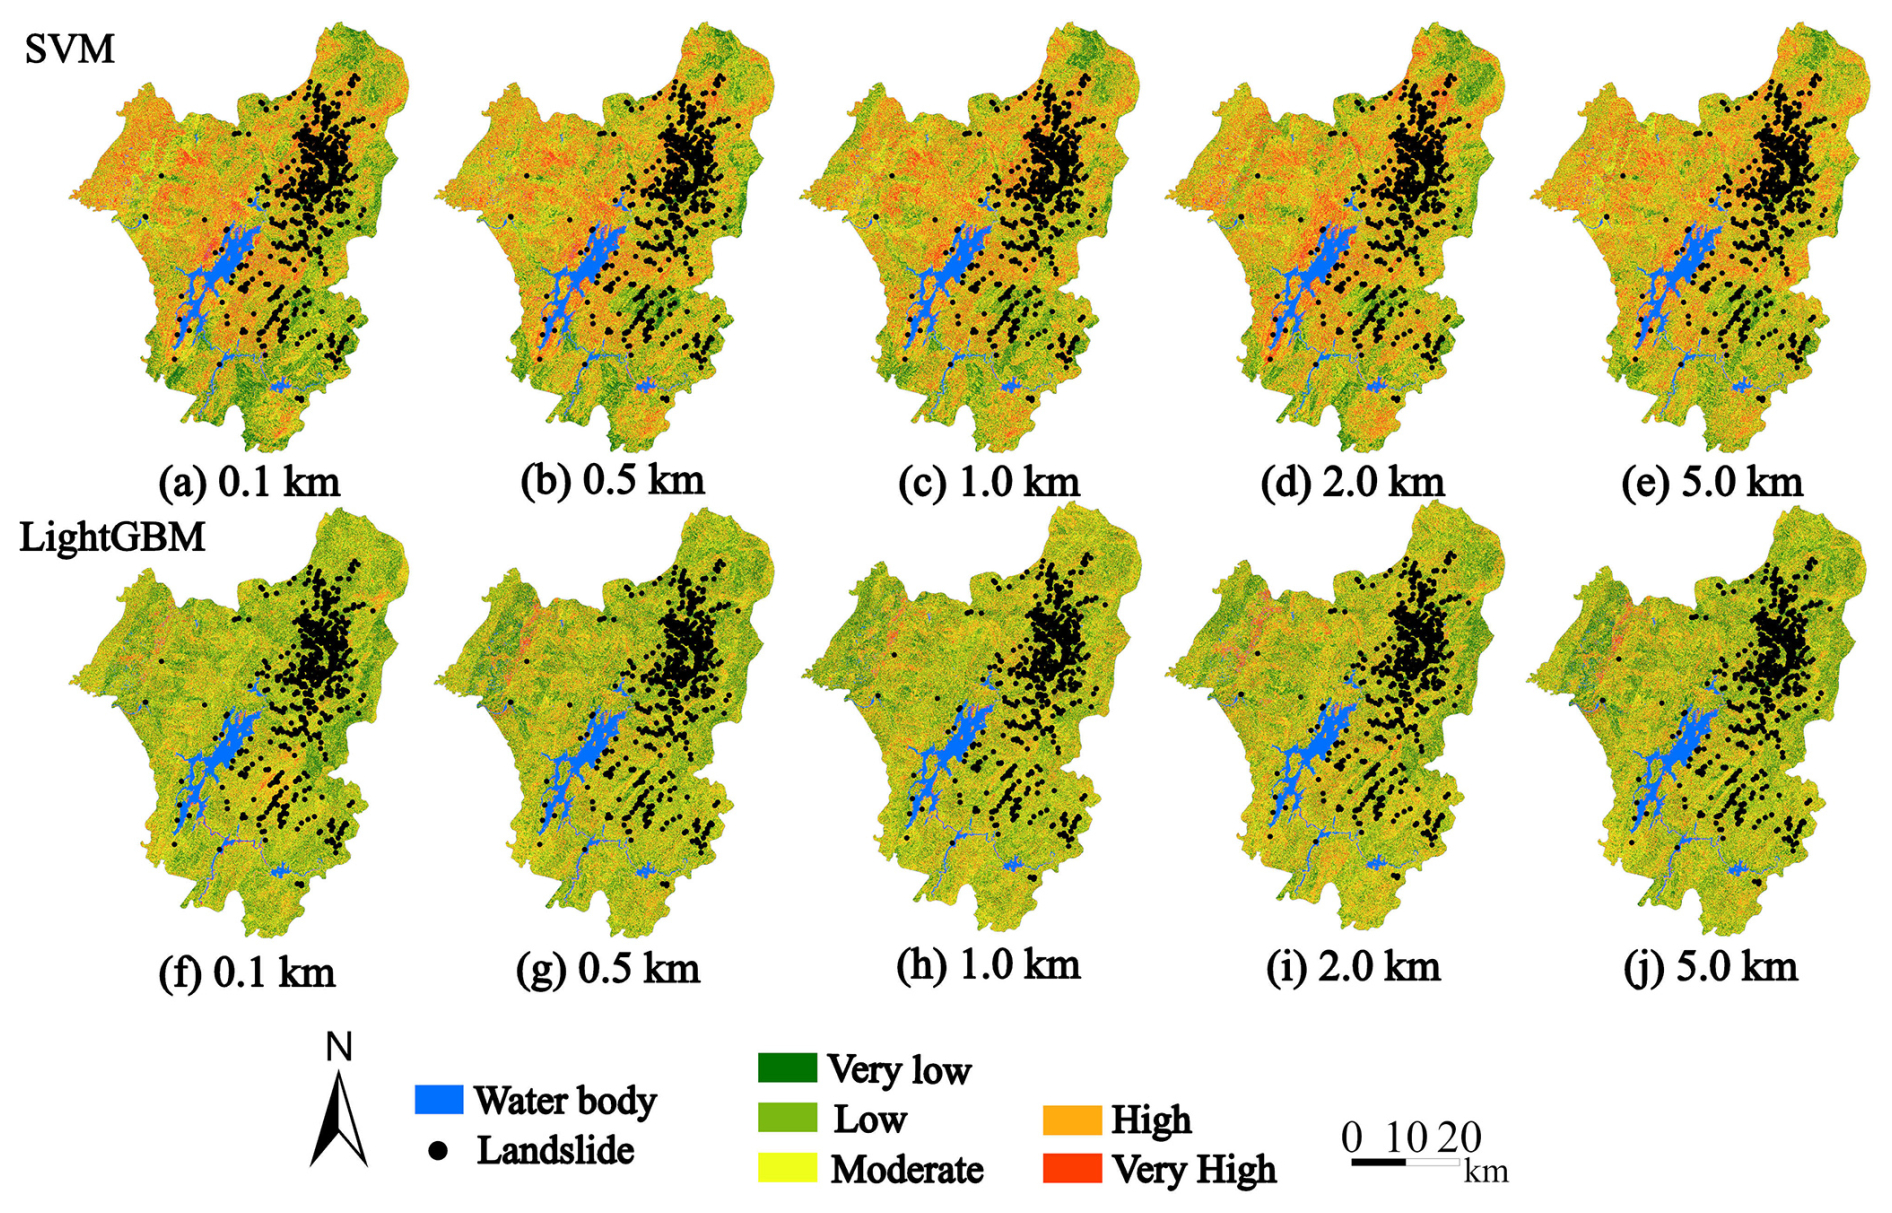
Figure 4Landslide susceptibility map based on SVM and LightGBM models using the IV input.
4.2.2 CF-based modeling performance
In CF-based modeling (Fig. 5), the SVM model's high and very high landslide susceptibility areas at smaller scales were more extensive than in the IV mode, with actual landslide locations more frequently distributed within these high-risk areas. As the scale increased, the high susceptibility areas gradually decreased. The LightGBM model also showed a relatively smooth distribution, with some high susceptibility areas identified at smaller scales gradually integrating as the scale increased, following a similar trend to the SVM model.
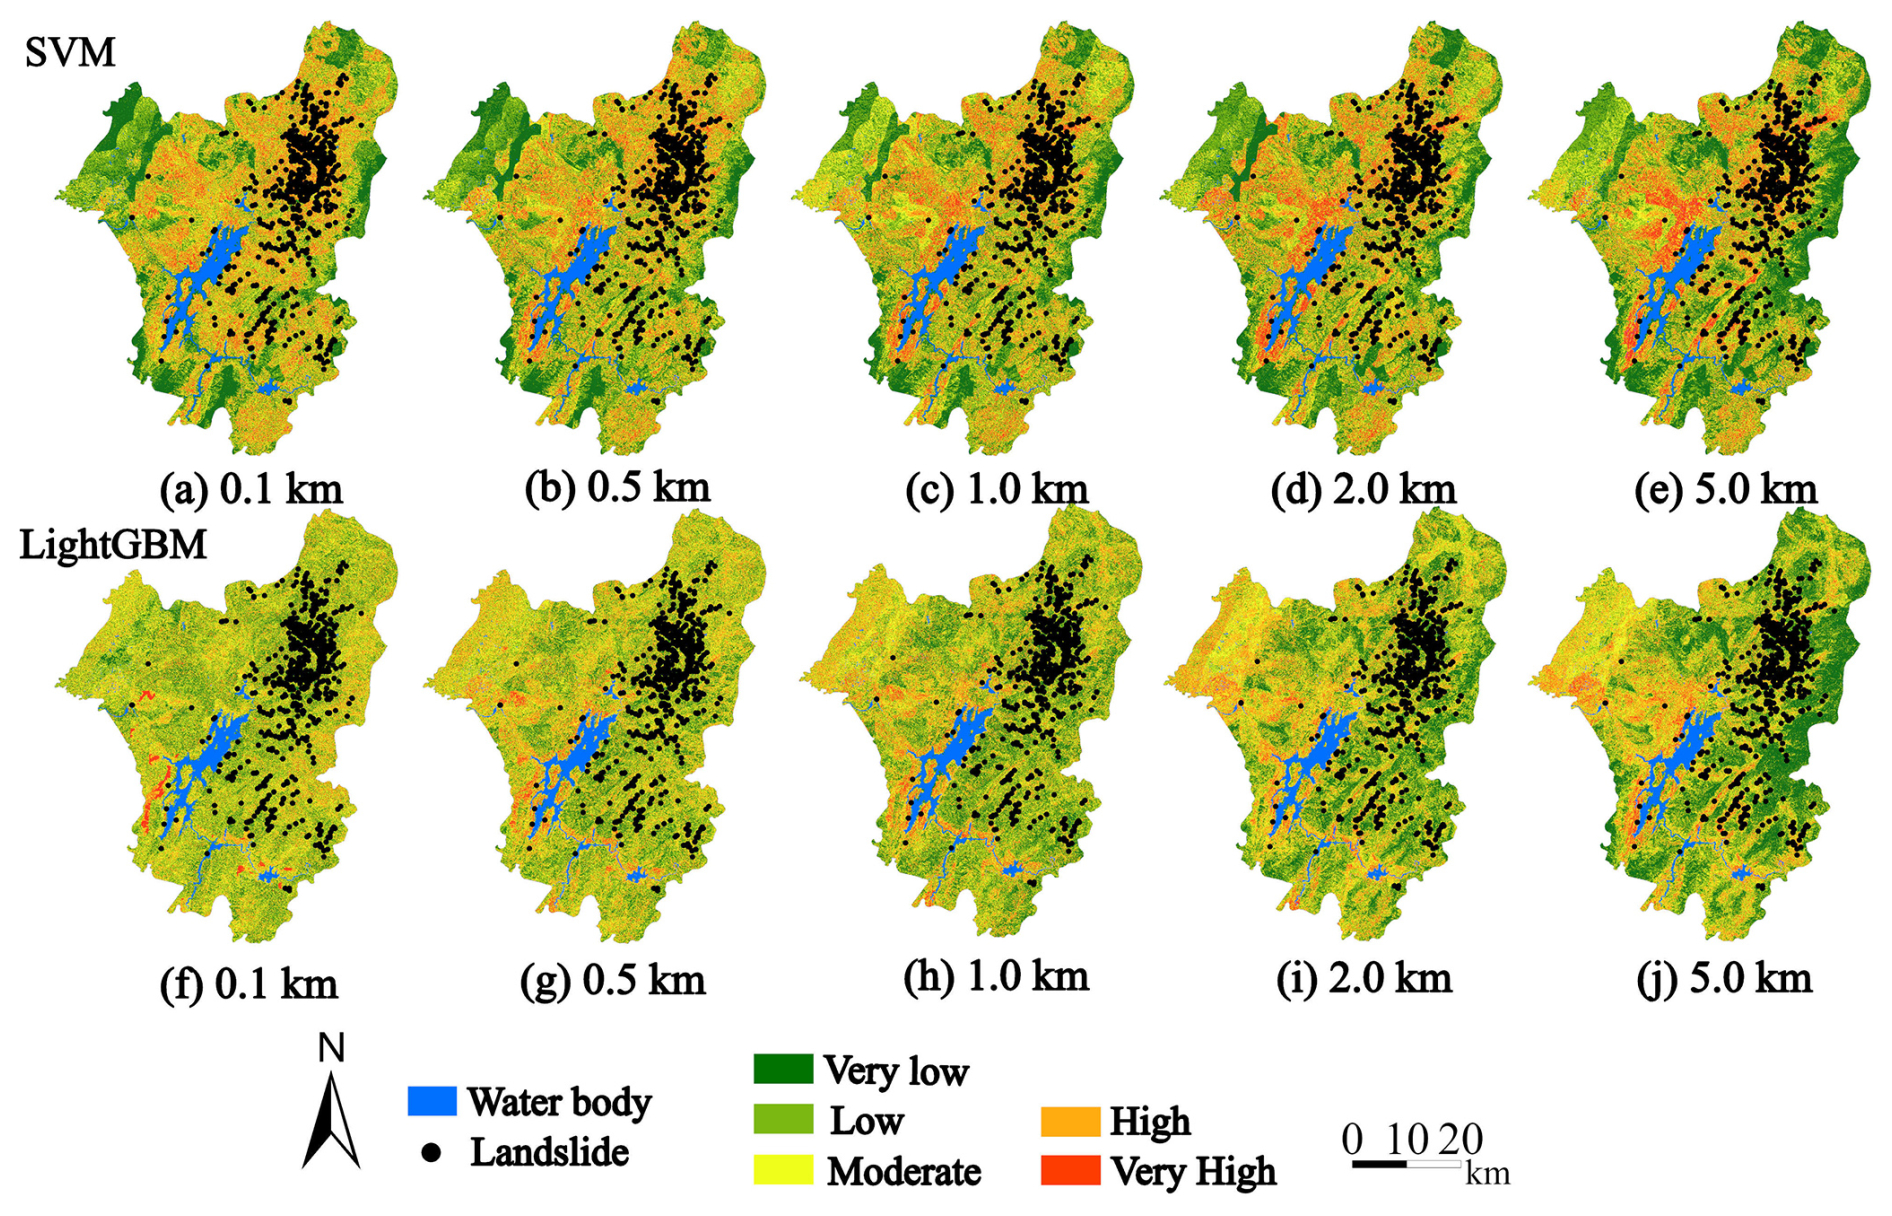
Figure 5Landslide susceptibility map based on SVM and LightGBM models using the CF input.
4.2.3 FR-based modeling performance
Regarding the FR input (Fig. 6), the SVM model identified a significant number of high and very high landslide susceptibility areas at smaller scales compared to the IV and CF inputs, which closely matched the actual locations of landslides. As the buffer scale expanded, these high-risk areas generally diminished and the distribution became smoother. Conversely, the LightGBM model delivered more uniform results, offering broader moderate-risk distributions, with a small number of high susceptibility areas that did not align with the actual landslide locations. As the scale increased, the high susceptibility areas identified by the LightGBM model gradually diminished, showing greater consistency with the SVM model results at the higher scale.
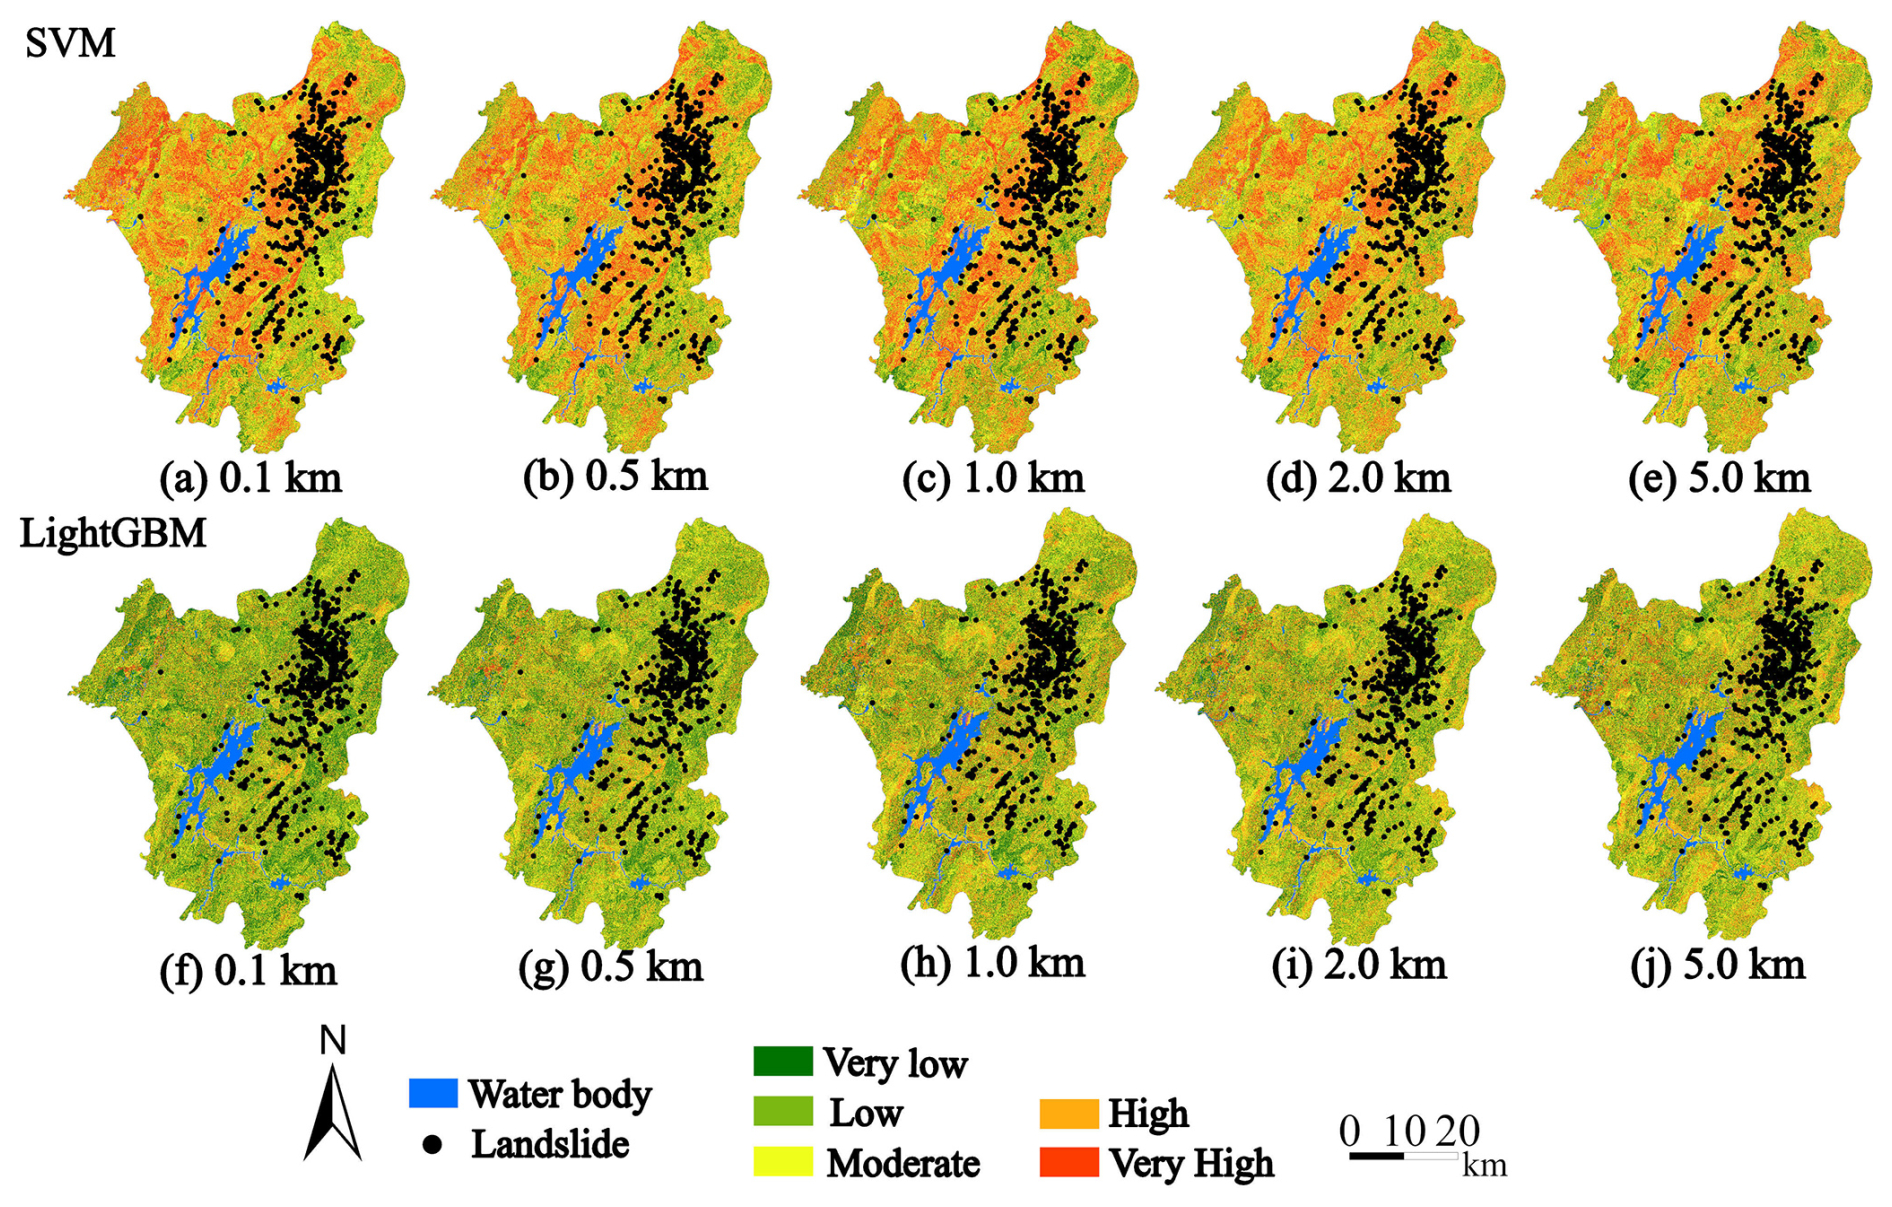
Figure 6Landslide susceptibility map based on SVM and LightGBM models using the FR input.
4.3 Uncertainty analysis of LSP results
4.3.1 LSP accuracy evaluation and comparative performance
Table S2 demonstrates contrasting performance characteristics between the two machine learning approaches across different spatial scales and input configurations. LightGBM consistently achieved high AUC values (0.915–0.921) and maintained stable F1-scores (0.838–0.850) across all buffer distances and input methods, indicating robust generalization capability. In contrast, SVM exhibited pronounced sensitivity to parameter combinations, with performance varying significantly across different buffer distances (F1-scores ranging from 0.681 to 0.859) and input methods, particularly showing notable degradation with FR input at extreme spatial scales (0.1 and 5.0 km).
Two configurations emerged as comprehensively superior: SVM with FR input at 0.5 and 2.0 km buffer distances, both achieving F1-scores of 0.859. These optimal configurations not only maintained competitive AUC values (0.914 and 0.913 respectively) but demonstrated superior precision-recall balance compared to corresponding LightGBM configurations (F1-scores: 0.854 and 0.856). The high recall values (0.845 and 0.851) coupled with robust precision (0.873 and 0.867) indicate enhanced sensitivity to landslide-prone areas while minimizing false positive predictions. This bimodal performance pattern suggests that intermediate buffer distances effectively capture fault-related geomorphological processes influencing slope stability.
Independent validation on the test set confirmed the robustness of these optimal configurations, with SVM-FR models at 0.5 and 2.0 km buffer distances achieving F1-scores of 0.847 and 0.852 respectively, representing minimal performance degradation from training results. The consistent AUC values (0.909 and 0.908) on the test set further validate the models' discriminative capability and indicate absence of overfitting, confirming the reliability of these configurations for practical landslide susceptibility assessment applications.
4.3.2 LSP distribution characteristics across conditions
In addition to the performance metrics, the distribution characteristics of landslide susceptibility predictions revealed fundamental differences between the models (Figs. S1–S3 in the Supplement). LightGBM generated smoother, more symmetrical distributions with lower mean susceptibility values (0.196–0.320) and smaller standard deviations (0.099–0.187), indicating stable and uniform predictions. In contrast, SVM exhibited greater variability, with irregular distributions, higher mean values (0.303–0.515), and larger standard deviations (0.112–0.214). Notably, SVM's mean susceptibility under FR input rose sharply (0.446–0.515), while LightGBM maintained lower means despite moderately broader deviations (0.160–0.187).
Therefore, SVM is preferable for FR-based modeling at 0.5 and 2.0 km buffers, where spatial precision is prioritized over prediction uniformity. The SVM model achieved its highest accuracy at the 0.5 km buffer, classifying 86.4 % of recorded landslides in high and very high susceptibility zones (Fig. 6b). At the 2.0 km buffer (Fig. 6d), it still correctly classified 82.1 % of landslides in these zones. As a result, Fig. 6b is selected as the final landslide susceptibility map.
5.1 Critical rainfall thresholds for landslides in Zixing City
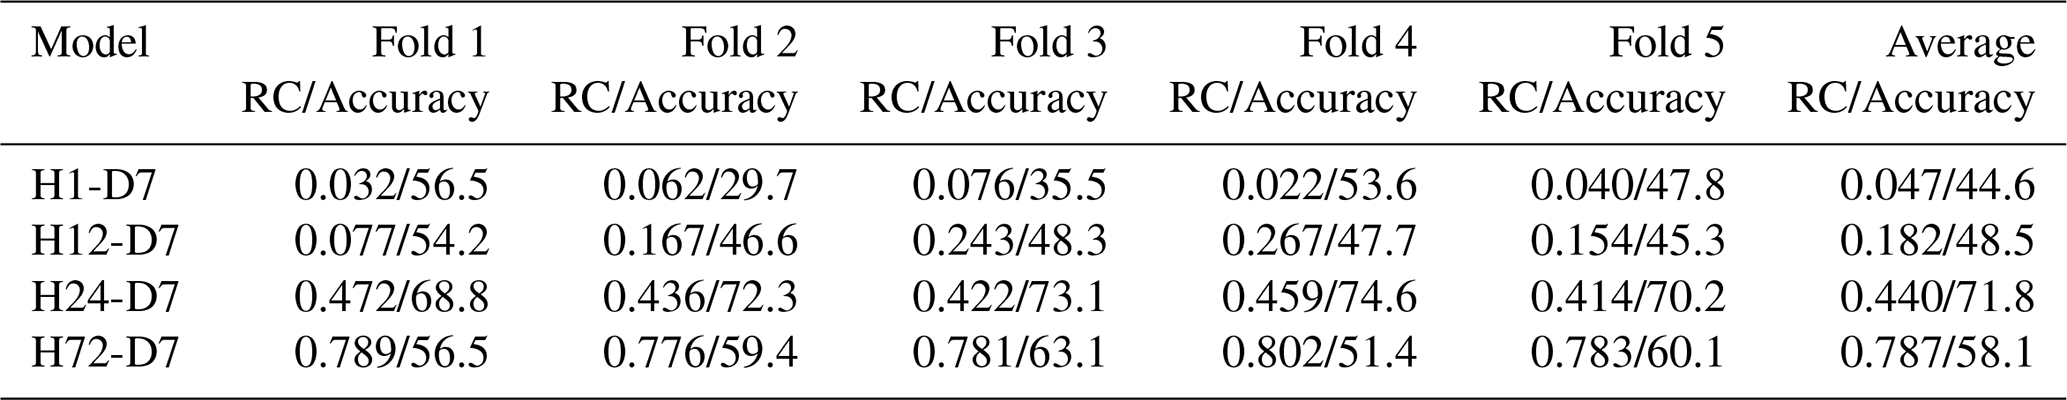
We evaluated four rainfall threshold models (H1-D7, H12-D7, H24-D7, and H72-D7) through 5-fold cross-validation, with their optimal ratio coefficient (RC) thresholds and prediction accuracies summarized in Table 3. The H24-D7 model, coupling 24 h rainfall during landfall with 7 d antecedent moisture, achieved the highest accuracy (71.8 %) by effectively capturing both cumulative saturation and abrupt triggering by typhoon rainfall bursts. Notably, the H24-D7 model exhibited stable performance across all folds, with accuracy ranging narrowly between 68.8 % (Fold 1) and 74.6 % (Fold 4), reflecting robust generalizability.
In contrast, the H1-D7 and H12-D7 models displayed marked instability: H1-D7 accuracy fluctuated between 29.7 % (Fold 2) and 56.5 % (Fold 1), while H12-D7 thresholds (RC12: 0.077–0.267) corresponded to accuracies of 45.3 %–48.3 %. The H72-D7 model showed moderate performance variability (accuracy: 51.4 %–63.1 %) despite consistently high RC72 thresholds (>0.78).
These results highlight the critical role of temporal rainfall parameter selection. The superior performance of the H24-D7 model (24 h short-term rainfall and 7 d antecedent rainfall) suggests that a 24 h duration optimally captures both immediate landslide triggers and cumulative hydrological effects, balancing sensitivity and stability. Shorter (H1H12) or longer (H72) durations either overemphasize transient rainfall spikes or dilute critical triggering signals.
5.2 Spatio-temporal distribution of rainfall thresholds
Figure 7 illustrates the spatial distribution of rainfall-triggered landslide thresholds derived from four models (RC1, RC12, RC24, and RC72) across multiple temporal scales (1 h, 12 h, 24 h, 72 h, and 7 d) within the study area.
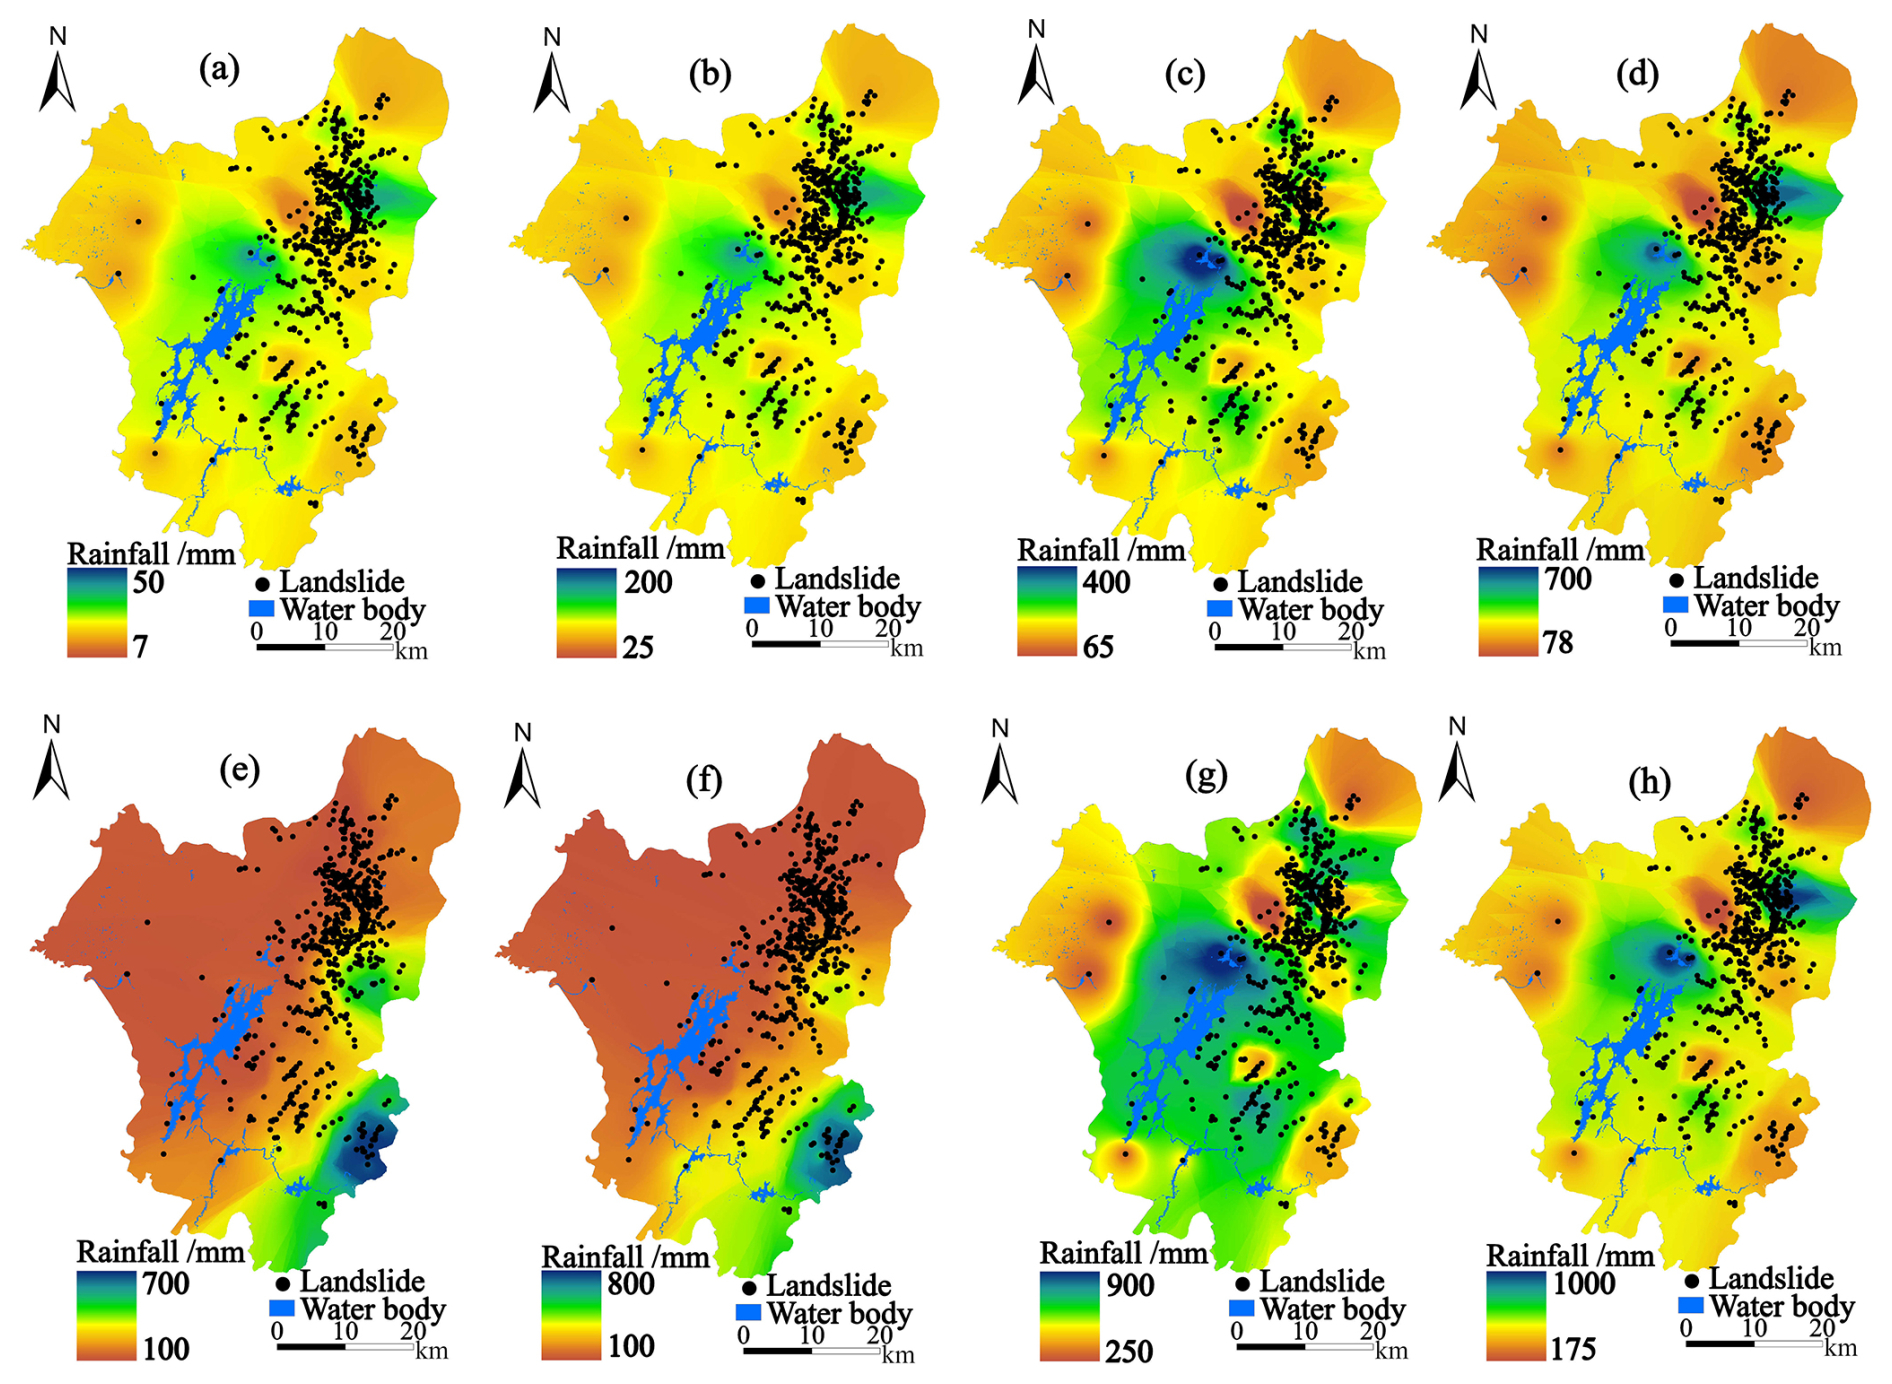
Figure 7Distribution of typhoon rainfall thresholds under various optimal RC ratios: (a) 1 h RC1-based, (b) 12 h RC12-based, (c) 24 h RC24-based, (d) 72 h RC72-based, (e) 7 d RC1-based, (f) 7 d RC12-based, (g) 7 d RC24-based, and (h) 7 d RC72-based.
5.2.1 Short-term predictions (1 to 12 h scales)
At the 1 h scale (Fig. 7a), the RC1 model generated thresholds ranging from 7 to 50 mm, with 65.2 % of landslides occurring in moderate threshold zones (20–30 mm). This indicates the model's effectiveness in detecting slope failures under short-duration rainfall. In contrast, the RC12 model on the 12 h scale (Fig. 7b) showed a wider threshold range (25–200 mm), with 62.9 % of landslides in mid-to-high threshold regions (80–130 mm). This mismatch suggests that the 12 h cumulative data may underestimate rainfall impacts in specific topographic settings.
5.2.2 Mid-term predictions (24 to 72 h scales)
The RC24 model at the 24 h scale (Fig. 7c) displayed a threshold range of 65–400 mm, with 87.1 % of landslides occurring within moderate thresholds (100–250 mm) and 12.3 % in higher thresholds (>250 mm). This indicates a more accurate capture of rainfall intensity effects. At the 72 h scale (Fig. 7d), the RC72 model produced thresholds between 78–700 mm, with 59.2 % of landslides in mid-to-high threshold regions (200–500 mm). Although the RC72 model demonstrated reasonable sensitivity to prolonged rainfall, its upper threshold (700 mm) may result in conservative risk predictions for some geological settings.
5.2.3 Long-term predictions (7 d scale)
At the 7 d scale, significant differences emerge across models in terms of predicted rainfall thresholds and landslide points. The RC1 model (Fig. 7e) shows a threshold range of 100–700 mm, with landslide points predominantly concentrated in the lower rainfall ranges. While these low-threshold landslides may indicate localized risks, the model's conservative threshold distribution fails to effectively capture landslides triggered by higher rainfall amounts, potentially overlooking more significant events.
The RC12 model (Fig. 7f), with a threshold range of 100–800 mm, also shows a concentration of landslide points in the lower rainfall ranges. Despite a wider threshold range, the similarity to the RC1 model suggests that RC12 may also underutilize its capacity to predict higher typhoon-induced landslides, leading to under-prediction in areas experiencing moderate to heavy precipitation.
In contrast, the RC24 model (Fig. 7g) exhibits a balanced threshold range (250–900 mm) and effectively identifies landslide points in both moderate and high rainfall categories. This balance enables RC24 to capture the full spectrum of typhoon-induced landslides, accurately identifying risks across different rainfall intensities.
The RC72 model (Fig. 7h) shows a concentration of landslide points in the higher rainfall range (175–1000 mm). While it predicts landslides accurately under heavy rainfall conditions, the model may overestimate risks in some regions and neglect potential landslides associated with lower rainfall thresholds.
Based on the above analysis, the RC24 model is the optimal choice, which aligns with the findings in Sect. 5.1. Its effectiveness is evident as it demonstrates superior stability and accuracy in both the 24 h and 7 d timescales.The RC24 model's balanced threshold range allows it to accurately assess landslide risks across varying rainfall intensities. This makes it the most reliable choice for practical landslide hazard warning applications.
5.3 Landslide hazard warning system for Zixing City
Based on the optimal LSP results (Fig. 6b) and the validated RC24 rainfall threshold model, a spatially explicit landslide hazard warning system was established for Zixing City. The integration of spatial probability (LSP) and temporal probability (rainfall thresholds) followed the matrix classification outlined in Table 2.
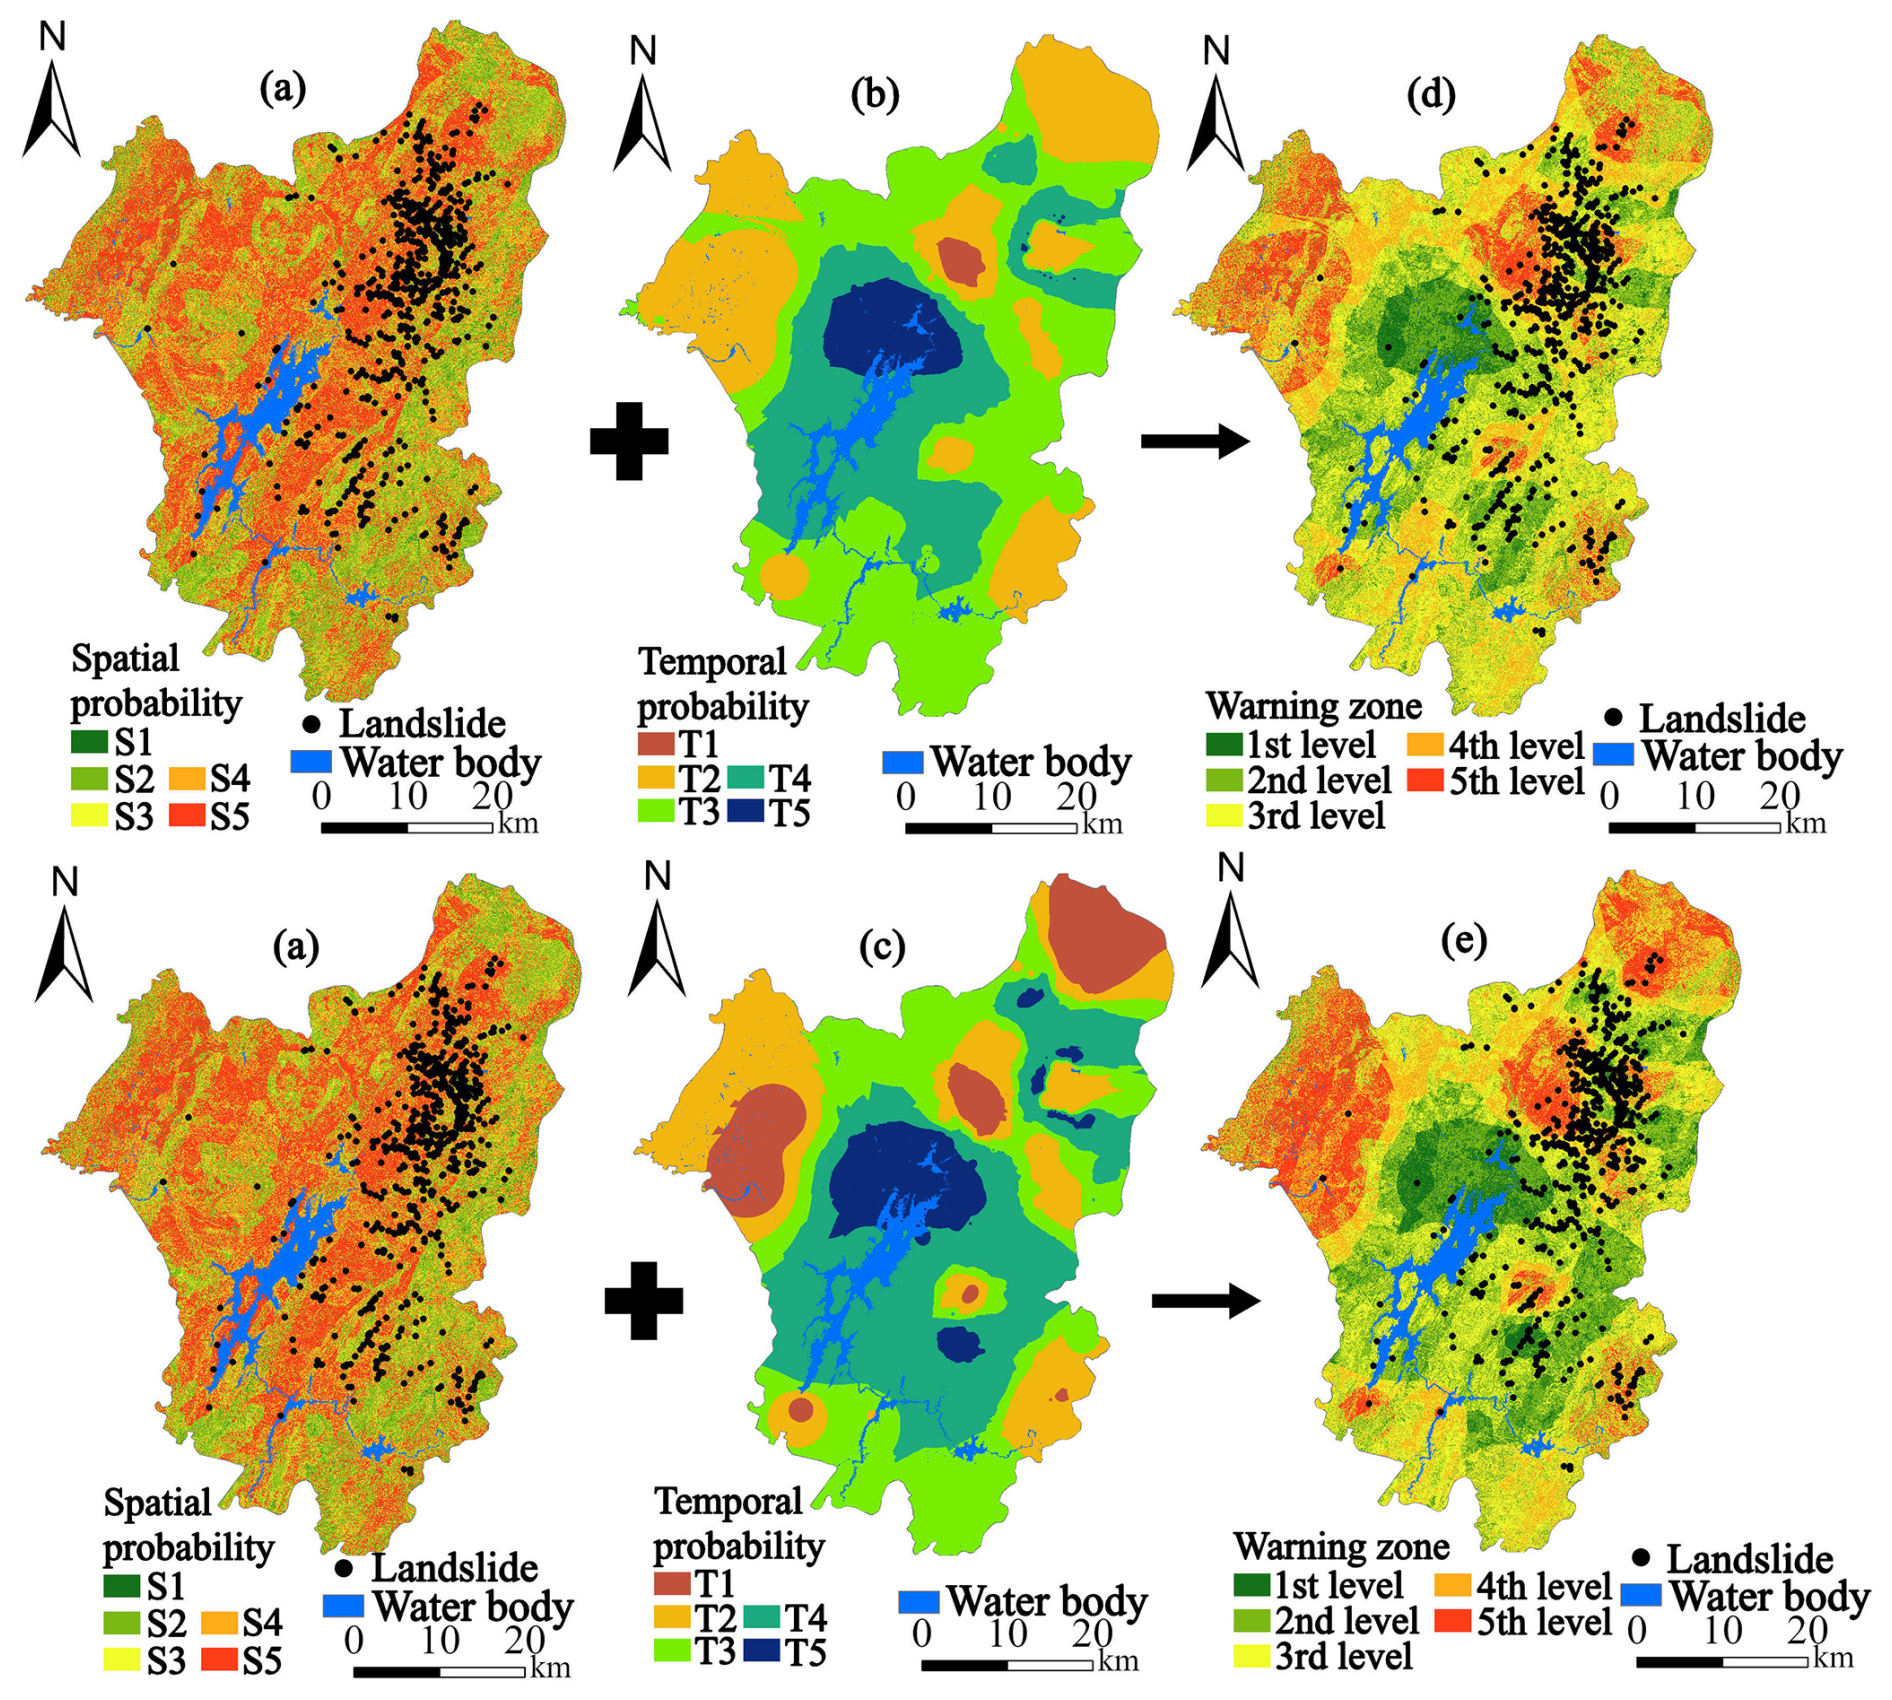
Figure 8Landslide warning zones generated by overlaying spatial and temporal probability maps: (a) optimal spatial probability, (b) 24 h RC24-based rainfall threshold, (c) 7 d RC24-based rainfall threshold, (d) overlay of (a) and (b), and (e) overlay of (a) and (c).
Five susceptibility levels in the LSP map (Fig. 6b) were replaced with five spatial probabilities (S1–S5) (Fig. 8a), respectively. Simultaneously, the spatially interpolated 24 h rainfall thresholds (H24) (Fig. 8b) and 7 d effective rainfall thresholds (D7) (Fig. 8c) derived from the RC24 model were classified into five temporal probability levels (T1–T5) using the natural breaks method. Spatial overlay analysis was performed to combine the susceptibility levels (S1–S5) with the rainfall threshold levels (T1–T5), generating two hazard warning zone maps: H24-based (Fig. 8d) and D7-based (Fig. 8e).
Quantitative assessment of both warning systems reveals distinct performance characteristics. The 24 h threshold system (Fig. 8d) demonstrates superior predictive efficiency, with 71.4 % of historical landslides occurring within high to very high warning zones (Levels 3–5) while covering only 34.2 % of the total area, resulting in an efficiency ratio of 2.09 and a risk density of 49.0 landslides per 1000 high-risk grid cells. The spatial distribution shows concentrated high-risk areas primarily in the central region, characterized by steep slopes (>21.80°), weathered granite lithology, and road proximity (0–800 m). This focused distribution indicates effective identification of areas most sensitive to short-term intense rainfall triggers.
The 7 d threshold system (Fig. 8e) exhibits broader spatial coverage, with high-risk zones encompassing 42.7 % of the study area and capturing 68.7 % of historical landslides, yielding a lower efficiency ratio of 1.61 and risk density of 37.8 landslides per 1000 grid cells. This system effectively identifies extended vulnerable areas in northern and eastern regions, reflecting cumulative rainfall effects on slope stability. The expanded coverage captures zones where prolonged antecedent moisture interacts with moderate-to-high susceptibility conditions.
Statistical validation confirms the complementary nature of both systems. The 24 h system achieves higher spatial efficiency (efficiency ratio 2.09 vs. 1.61) and landslide concentration (risk density 49.0 vs. 37.8), making it optimal for immediate typhoon response and targeted emergency resource allocation. Conversely, the 7 d system provides comprehensive coverage for prolonged rainfall scenarios, essential for early warning during extended typhoon events despite its broader spatial distribution and lower concentration efficiency. The combined application of both systems enables dynamic hazard assessment, addressing both rapid-onset failures during typhoon landfall and delayed failures following sustained precipitation.
6.1 Model selection strategy and optimization of LSP
Our comparative analysis of SVM and LightGBM across different input methods (IV, CF, FR) and buffer distances shows distinct performance patterns crucial for model selection in typhoon-induced LSP. SVM exhibited marked sensitivity to configuration parameters, with F1-scores varying from 0.681 to 0.859 depending on buffer distance and input method. LightGBM maintained more stable performance (F1-scores: 0.838–0.850) across all configurations. These differences reflect fundamental algorithmic characteristics: SVM's kernel-based approach effectively captures localized patterns when properly tuned, while LightGBM's ensemble structure delivers consistent results across varying data conditions.
SVM's superior performance at 0.5–2.0 km buffer distances with FR weighting builds on findings by Kalantar et al. (2018) and Bogaard and Greco (2018). This buffer range appears effective for capturing the spatial patterns of typhoon-induced failures in our study area. FR weighting's effectiveness supports Reichenbach et al. (2018) and Yan et al. (2019), who found that frequency-based methods excel at quantifying terrain-landslide relationships. In typhoon conditions, FR effectively weights critical factors including road proximity and weathered granite lithology.
These performance patterns justify our dual-model approach. SVM, though requiring careful calibration, enables precise delineation of high-risk zones essential for emergency response, with SVM-FR at 0.5 km achieving peak accuracy (F1=0.859). LightGBM's robustness suits operational contexts requiring consistent predictions under variable conditions. Our results suggest that effective model selection depends on matching algorithmic strengths to specific application requirements rather than identifying a universally superior algorithm.
6.2 Rainfall threshold modeling and typhoon-specific mechanisms
The H24-D7 model achieved 71.8 % accuracy, outperforming alternative temporal windows (Table 3). The optimal RC24 value of 0.440 (with inter-fold variation of 0.414–0.472) indicates that landslides typically occur when 24 h rainfall constitutes approximately 44 % of the preceding 7 d accumulation. This pattern is consistent with the multi-temporal triggering framework proposed by Nolasco-Javier and Kumar (2018) for typhoon contexts, where both antecedent saturation and short-term intensity contribute to slope failure. However, the specific hydrological mechanisms underlying this ratio require verification through in-situ soil moisture monitoring. The H1-D7 and H12-D7 models showed lower and more variable accuracy (44.6 % and 48.5 % respectively), suggesting that shorter accumulation periods may inadequately represent the cumulative soil saturation process relevant to this region's geological conditions (Kirschbaum and Stanley, 2018).
Spatial patterns in rainfall thresholds reveal systematic variations across the study area. Southeastern regions exhibit elevated H24 thresholds exceeding 250 mm (Fig. 7c), while northern areas show reduced thresholds of 100–150 mm. These spatial variations align with findings by Lee et al. (2018) and Cho et al. (2022) regarding topographic controls on typhoon-induced landslides, though the specific mechanisms require further investigation with detailed meteorological analysis. The spatially distributed thresholds derived through Kriging interpolation (Table 1) provide location-specific values that improve upon uniform regional thresholds typically employed in operational systems (Segoni et al., 2018b).
Table 1Kriging interpolation accuracy assessment for rainfall parameters.
The consistent performance across the five validation folds (68.8 %–74.6 % accuracy) demonstrates the model's stability when applied to different spatial subsets of the landslide inventory. This suggests the H24-D7 relationship captures generalizable rainfall-slope response patterns rather than site-specific anomalies, though validation with independent typhoon events would further confirm model robustness.
6.3 Integration of susceptibility and rainfall thresholds for landslide warning
The integrated warning system combines static susceptibility surfaces with spatially continuous rainfall thresholds following the matrix framework in Table 2. The H24-based system (Fig. 8d) captured 71.4 % of historical landslides within high to very high warning zones (Levels 3–5) covering 34.2 % of the study area, yielding an efficiency ratio of 2.09. The D7-based system (Fig. 8e) identified 68.7 % of landslides across 42.7 % of the area (efficiency ratio: 1.61). These focused distributions contrast with the broader spatial coverage typically required by uniform regional thresholds (Guzzetti et al., 2020; Nocentini et al., 2024), though direct comparative validation would be needed to quantify the performance gain.
Table 2Classification of landslide hazard warning zones by integrating landslide susceptibility levels (S1–S5) with rainfall threshold levels (T1–T5).
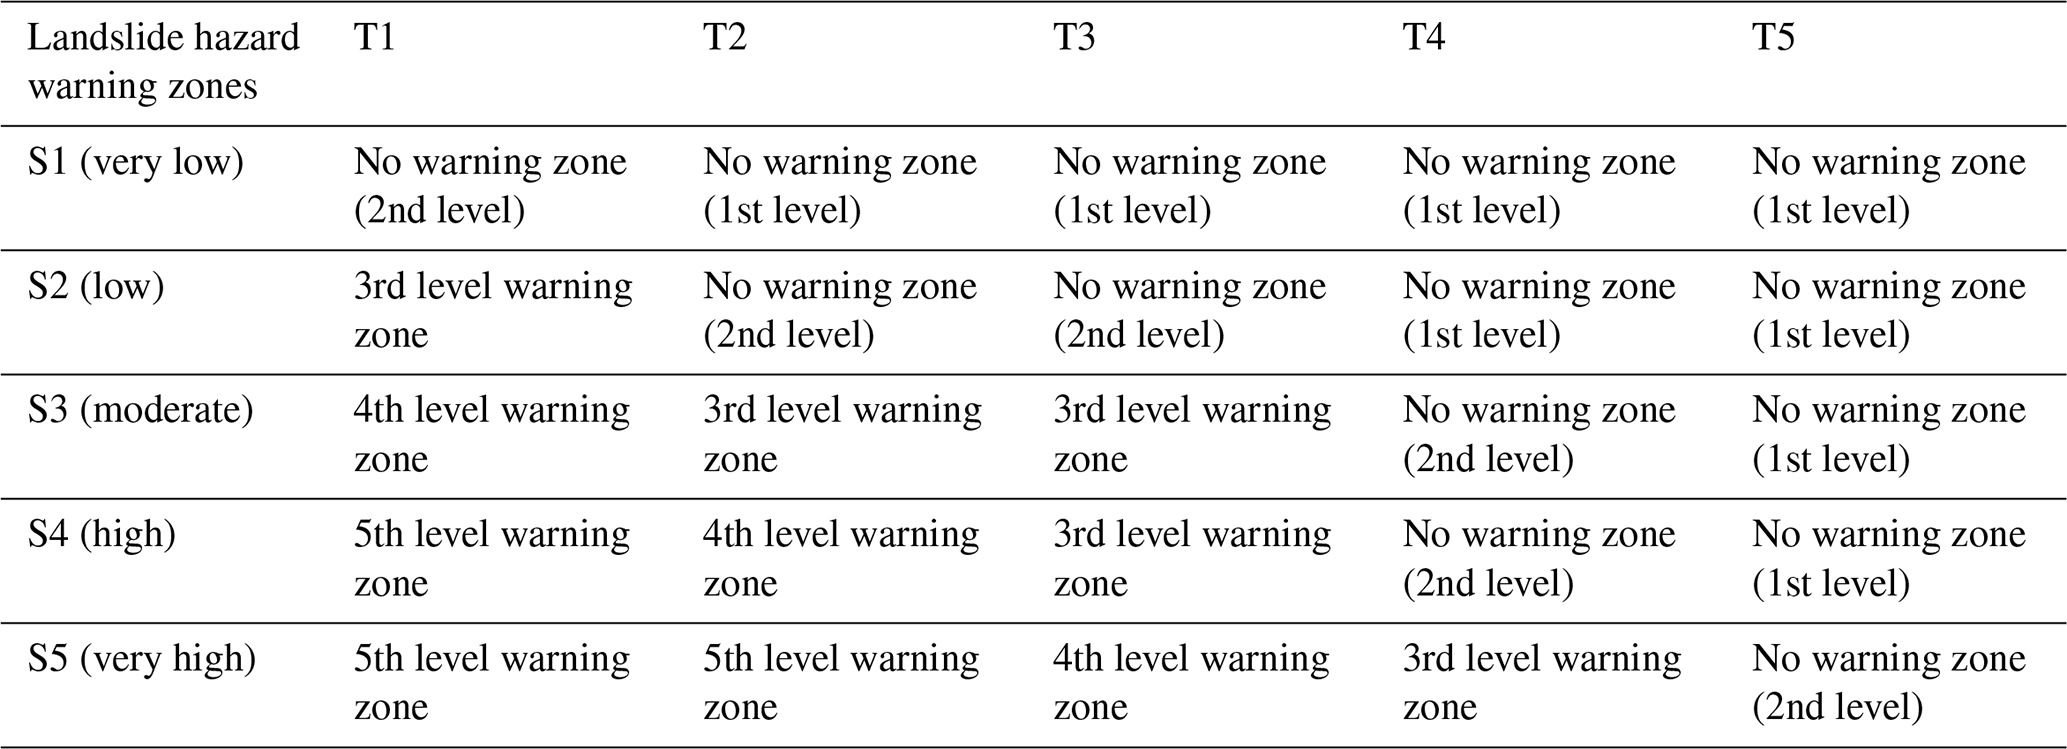
Table 3Optimal RC values and prediction accuracies (%) for each model across 5-fold cross validation.
The dual-threshold configuration provides complementary perspectives suited to different phases of typhoon evolution, with D7 reflecting cumulative moisture conditions and H24 capturing immediate triggering rainfall. This combination addresses the compound rainfall mechanisms documented in typhoon-affected regions (Gariano et al., 2015; Nolasco-Javier and Kumar, 2018), though the optimal application strategy for operational warning would require integration with real-time meteorological forecasting systems.
Spatially continuous thresholds (Fig. 8b and c) address terrain-induced variability more effectively than point-based approaches. The Kriging interpolation method provides threshold estimates across the entire study area, accounting for spatial autocorrelation in rainfall patterns (Table 1). However, threshold accuracy depends on rain gauge density and may decline in areas distant from monitoring stations, as indicated by the interpolation validation metrics (R: 0.76–0.87, NSE: 0.71–0.82). The framework advances beyond existing point-based threshold systems (Segoni et al., 2018b; Guzzetti et al., 2020) by providing spatially explicit hazard assessment, though regional adaptation of threshold parameters would be necessary for application in different geological settings.
The modular design allows the framework to be adapted for operational landslide early warning, though practical implementation would require integration with meteorological monitoring infrastructure, standardized protocols for warning dissemination, and post-event validation procedures to maintain system reliability. These operational considerations extend beyond the methodological scope of this study but represent important directions for future development of typhoon-specific landslide warning systems.
6.4 Limitations and future research directions
Despite promising advancements, this study has limitations owing to the complexity of typhoon-induced landslides. First, the model's validation relies solely on landslides from Typhoon Gaemi. While this single event provided a comprehensive dataset, validating against multiple, varied typhoons is crucial for model robustness. Typhoons differ significantly in intensity, rainfall patterns, forward speed, and seasonality, all of which can influence threshold parameters. For instance, a slow-moving typhoon with higher cumulative rainfall and lower peak intensity could alter the optimal H24-D7 ratios. Future research should incorporate landslide inventories from typhoons with contrasting characteristics to assess threshold transferability and develop adaptive parameterization. The framework's modular design readily facilitates this by allowing recalibration of the RC24 coefficient for different typhoon types.
Second, the current study primarily addresses rainfall-induced landslides, overlooking other potential contributing factors. Future work should explore integrating multiple triggering mechanisms, including earthquakes, human-induced slope modifications, and typhoon rainfall, for a more comprehensive hazard assessment.
Third, the study doesn't explicitly address the potential impacts of climate change on typhoon rainfall and landslide occurrence. As climate change alters typhoon frequency, intensity, and tracks, future studies should incorporate climate projections specific to typhoon-prone regions. This will enable the development of forward-looking landslide warning systems that can adapt to the evolving threats posed by typhoon-specific rainfall.
Fourth, while this study demonstrates the effectiveness of ML approaches, further refinement is possible. Future research should explore advanced deep learning techniques and ensemble methods to better capture the complex, non-linear relationships between typhoon-related variables (e.g., rainfall intensity, duration, antecedent moisture) and slope stability. These advanced methods may offer improved predictive accuracy, more robust uncertainty quantification, and ultimately, more reliable hazard warnings.
Finally, climate projections for Southeast China show a 15 %–25 % increase in peak typhoon rainfall by 2080 (RCP8.5), which could alter the H24–D7 landslide thresholds from this study. Higher atmospheric moisture may lower D7 thresholds, while greater rainfall intensity could require new H24 parameters. Shifting typhoon tracks and seasonality might also change which areas are vulnerable. Future work must use downscaled climate data to create non-stationary thresholds, ensuring the long-term reliability of warning systems in the region.
This study establishes a novel integrated framework combining optimized LSP with typhoon-specific rainfall threshold modeling for comprehensive hazard assessment in mountainous regions. Through systematic analysis of 705 landslides triggered by Typhoon Gaemi in Zixing City, several key insights emerge:
-
Buffer distance optimization proves critical for typhoon-induced landslide modeling, with SVM-FR combinations at 0.5–2.0 km distances achieving superior performance (F1-score: 0.859) compared to conventional approaches. This spatial scale effectively captures typhoon-induced moisture infiltration patterns that differ fundamentally from other triggering mechanisms.
-
The H24-D7 threshold model demonstrates exceptional stability (71.8 % accuracy across 5-fold validation), successfully characterizing the dual-phase failure mechanism unique to typhoons: prolonged antecedent saturation coupled with intense precipitation bursts during typhoon passage.
-
Spatially distributed rainfall thresholds reveal significant heterogeneity, reflecting complex interactions between typhoon structure and local topography that contradict uniform regional threshold assumptions in existing operational systems.
-
The integrated warning system achieves operational efficiency through dual-threshold configuration: H24 thresholds provide immediate response capability during typhoon landfall, while D7 thresholds enable early detection of vulnerable areas approaching saturation conditions.
-
This framework addresses three critical gaps in current landslide prediction: systematic buffer optimization for imbalanced datasets, effective integration of variable weighting with machine learning algorithms, and development of typhoon-specific spatially explicit thresholds.
The source code and data will be made available on request.
The supplement related to this article is available online at https://doi.org/10.5194/nhess-26-611-2026-supplement.
Weifeng Xiao: Writing-review and editing, Validation, Conceptualization. Guangchong Yao: Visualization, Validation, Data curation. Zhenghui Xiao: Writing-review and editing, Formal analysis. Ge Liu: Correspondence, Funding acquisition. Luguang Luo: Visualization, Validation, Investigation, Data curation. Yunjiang Cao: Visualization, Formal analysis, Data curation. Wei Yin: Validation, Investigation.
The contact author has declared that none of the authors has any competing interests.
Publisher's note: Copernicus Publications remains neutral with regard to jurisdictional claims made in the text, published maps, institutional affiliations, or any other geographical representation in this paper. The authors bear the ultimate responsibility for providing appropriate place names. Views expressed in the text are those of the authors and do not necessarily reflect the views of the publisher.
We sincerely acknowledge the Hunan Center of Natural Resources Affairs for providing the rainfall and landslide data related to Typhoon Gaemi.
This research has been supported by the National Key Research and Development Program of China (grant nos. 2024YFD1501100 and 2024YFD1500602), the Research Project on Natural Resources of Hunan Provincial Department of Natural Resources (grant no. HBZ20240112), the Key Research Project on High-Efficiency and Green Agricultural Pro-duction Technologies in Jilin Province (grant no. 20230202040NC) and the Youth Innovation Promotion Association of Chinese Academy of Chinese Academy of Sciences, China (grant no. 2022228).
This paper was edited by Bayes Ahmed and reviewed by two anonymous referees.
Achu, A. L., Aju, C. D., Pham, Q. B., Reghunath, R., and Anh, D. T.: Landslide susceptibility modeling using hybrid bivariate statistical-based machine-learning method in a highland segment of Southern Western Ghats, India, Environ. Earth Sci., 81, 361, https://doi.org/10.1007/s12665-022-10464-z, 2022.
Banfi, F. and De Michele, C.: Temporal clustering of precipitation driving landslides over the Italian Territory, Earths Future, 12, e2023EF003885, https://doi.org/10.1029/2023EF003885, 2024.
Bogaard, T. and Greco, R.: Invited perspectives: Hydrological perspectives on precipitation intensity-duration thresholds for landslide initiation: proposing hydro-meteorological thresholds, Nat. Hazards Earth Syst. Sci., 18, 31–39, https://doi.org/10.5194/nhess-18-31-2018, 2018.
Calvello, M. and Piciullo, L.: Assessing the performance of regional landslide early warning models: the EDuMaP method, Nat. Hazards Earth Syst. Sci., 16, 103–122, https://doi.org/10.5194/nhess-16-103-2016, 2016.
Chang, Z. L., Huang, J. S., Huang, F. M., Bhuyan, K., Meena, S. R., and Catani, F.: Uncertainty analysis of non-landslide sample selection in landslide susceptibility prediction using slope unit-based machine learning models, Gondwana Res., 117, 307–320, https://doi.org/10.1016/j.gr.2023.02.007, 2023.
Cho, W., Park, J., Moon, J., Cha, D. H., Moon, Y. M., Kim, H. S., Noh, K. J., and Park, S. H.: Effects of topography and sea surface temperature anomalies on heavy rainfall induced by Typhoon Chaba in 2016, Geosci. Lett., 9, 29, https://doi.org/10.1186/s40562-022-00230-1, 2022.
Chung, C.-C. and Li, Z.-Y.: Rapid landslide risk zoning toward multi-slope units of the Neikuihui tribe for preliminary disaster management, Nat. Hazards Earth Syst. Sci., 22, 1777–1794, https://doi.org/10.5194/nhess-22-1777-2022, 2022.
Ciurleo, M., Cascini, L., and Calvello, M.: A comparison of statistical and deterministic methods for shallow landslide susceptibility zoning in clayey soils, Eng. Geol., 223, 71–81, https://doi.org/10.1016/j.enggeo.2017.04.023, 2017.
Dou, H. Q., He, J. B., Huang, S. Y., Jian, W. B., and Guo, C. X.: Influences of non-landslide sample selection strategies on landslide susceptibility mapping by machine learning, Geomat. Nat. Haz. Risk, 14, 1–15, https://doi.org/10.1080/19475705.2023.2285719, 2023.
Fan, W., Wei, Y. N., and Deng, L. S.: Failure modes and mechanisms of shallow debris landslides using an artificial rainfall model experiment on Qin-ba Mountain, Int. J. Geomech., 18, 04017157, https://doi.org/10.1061/(ASCE)GM.1943-5622.0001068, 2018.
Froude, M. J. and Petley, D. N.: Global fatal landslide occurrence from 2004 to 2016, Nat. Hazards Earth Syst. Sci., 18, 2161–2181, https://doi.org/10.5194/nhess-18-2161-2018, 2018.
Gariano, S. L. and Guzzetti, F.: Landslides in a changing climate, Earth-Sci. Rev., 162, 227–252, https://doi.org/10.1016/j.earscirev.2016.08.011, 2016.
Gariano, S. L., Brunetti, M. T., Iovine, G., Melillo, M., Peruccacci, S., Terranova, O., Vennari, C., and Guzzetti, F.: Calibration and validation of rainfall thresholds for shallow landslide forecasting in Sicily, southern Italy, Geomorphology, 228, 653–665, https://doi.org/10.1016/j.geomorph.2014.10.019, 2015.
Guo, W. X., Ye, J., Liu, C. B., Lv, Y. J., Zeng, Q. Y., and Huang, X.: An approach for predicting landslide susceptibility and evaluating predisposing factors, Int. J. Appl. Earth Obs., 135, 104217, https://doi.org/10.1016/j.jag.2024.104217, 2024.
Guzzetti, F.: Invited perspectives: Landslide populations – can they be predicted?, Nat. Hazards Earth Syst. Sci., 21, 1467–1471, https://doi.org/10.5194/nhess-21-1467-2021, 2021.
Guzzetti, F., Gariano, S. L., Peruccacci, S., Brunetti, M. T., Marchesini, I., Rossi, M., and Melillo, M.: Geographical landslide early warning systems, Earth-Sci. Rev., 200, 102973, https://doi.org/10.1016/j.earscirev.2019.102973, 2020.
Huang, F., Chen, J., Liu, W., Huang, J., Hong, H., and Chen, W.: Regional rainfall-induced landslide hazard warning based on landslide susceptibility mapping and a critical rainfall threshold, Geomorphology, 408, 108236, https://doi.org/10.1016/j.geomorph.2022.108236, 2022.
Huang, Y. and Zhao, L.: Review on landslide susceptibility mapping using support vector machines, Catena, 165, 520–529, https://doi.org/10.1016/j.catena.2018.03.003, 2018.
Kalantar, B., Pradhan, B., Naghibi, S. A., Motevalli, A., and Mansor, S.: Assessment of the effects of training data selection on the landslide susceptibility mapping: A comparison between support vector machine (SVM), logistic regression (LR), and artificial neural networks (ANN), Geomat. Nat. Haz. Risk, 9, 49–69, https://doi.org/10.1080/19475705.2017.1407368, 2018.
Kenanoglu, M. B., Ahmadi-Adli, M., Toker, N. K., and Huvaj, N.: Effect of unsaturated soil properties on the intensity-duration threshold for rainfall triggered landslides, Tek. Dergi, 30, 9009–9027, https://doi.org/10.18400/tekderg.414884, 2019.
Kirschbaum, D. and Stanley, T.: Satellite-Based Assessment of Rainfall-Triggered Landslide Hazard for Situational Awareness, Earths Future, 6, 505–523, https://doi.org/10.1002/2017EF000715, 2018.
Lee, J. T., Ko, K. Y., Lee, D. I., You, C. H., and Liou, Y. C.: Enhancement of orographic precipitation in Jeju Island during the passage of Typhoon Khanun (2012), Atmos. Res., 201, 58–71, https://doi.org/10.1016/j.atmosres.2017.10.013, 2018.
Li, Y. L., Lin, Y. L., and Wang, Y. Q.: A numerical study on the formation and maintenance of a long-lived rainband in Typhoon Longwang (2005), J. Geophys. Res. Atmos., 124, 10401–10426, https://doi.org/10.1029/2019JD030600, 2019.
Lombardo, L. and Mai, P. M.: Presenting logistic regression-based landslide susceptibility results, Eng. Geol., 244, 14–24, https://doi.org/10.1016/j.enggeo.2018.07.019, 2018.
Ma, H., Wang, F. W., Fu, Z. J., Feng, Y. Q., You, Q., and Li, S.: Characterizing the clustered landslides triggered by extreme rainfall during the 2024 typhoon Gaemi in Zixing City, Hunan Province, China, Landslides, 22, 2311–2329, https://doi.org/10.1007/s10346-025-02510-1, 2025.
Merghadi, A., Yunus, A. P., Dou, J., Whiteley, J., ThaiPham, B., Bui, D. T., Avtar, R., and Abderrahmane, B.: Machine learning methods for landslide susceptibility studies: A comparative overview of algorithm performance, Earth-Sci. Rev., 207, 103225, https://doi.org/10.1016/j.earscirev.2020.103225, 2020.
Mirus, B. B., Becker, R. E., Baum, R. L., and Smith, J. B.: Integrating real-time subsurface hydrologic monitoring with empirical rainfall thresholds to improve landslide early warning, Landslides, 15, 1909–1919, https://doi.org/10.1007/s10346-018-0995-z, 2018.
Mondini, A. C., Guzzetti, F., and Melillo, M.: Deep learning forecast of rainfall-induced shallow landslides, Nat. Commun., 14, https://doi.org/10.1038/s41467-023-38135-y, 2023.
Niu, H. T., Shao, S. J., Gao, J. Q., and Jing, H.: Research on GIS-based information value model for landslide geological hazards prediction in soil–rock contact zone in southern Shaanxi, Phys. Chem. Earth, 133, 103515, https://doi.org/10.1016/j.pce.2023.103515, 2024.
Nocentini, N., Medici, C., Barbadori, F., Gatto, A., Franceschini, R., del Soldato, M., Rosi, A., and Segoni, S.: Optimization of rainfall thresholds for landslide early warning through false alarm reduction and a multi-source validation, Landslides, 21, 557–571, https://doi.org/10.1007/s10346-023-02176-7, 2024.
Nolasco-Javier, D. and Kumar, L.: Deriving the rainfall threshold for shallow landslide early warning during tropical cyclones: a case study in northern Philippines, Nat. Hazards, 90, 921–941, https://doi.org/10.1007/s11069-017-3081-2, 2018.
Panchal, S. and Shrivastava, A. K.: A comparative study of frequency ratio, Shannon's entropy and analytic hierarchy process (AHP) models for landslide susceptibility assessment, ISPRS Int. J. Geo-Inf., 10, 603, https://doi.org/10.3390/ijgi10090603, 2021.
Piciullo, L., Gariano, S. L., Melillo, M., Brunetti, M. T., Peruccacci, S., Guzzetti, F., and Calvello, M.: Definition and performance of a threshold-based regional early warning model for rainfall-induced landslides, Landslides, 14, 995–1008, https://doi.org/10.1007/s10346-016-0750-2, 2017.
Piciullo, L., Calvello, M., and Cepeda, J. M.: Territorial early warning systems for rainfall-induced landslides, Earth-Sci. Rev., 179, 228–247, https://doi.org/10.1016/j.earscirev.2018.02.013, 2018.
Regmi, N. R., Walter, J. I., Jiang, J. L., Orban, A. M., and Hayman, N. W.: Spatial patterns of landslides in a modest topography of the Ozark and Ouachita Mountains, USA, Catena, 245, 108344, https://doi.org/10.1016/j.catena.2024.108344, 2024.
Reichenbach, P., Rossi, M., Malamud, B. D., Mihir, M., and Guzzetti, F.: A review of statistically-based landslide susceptibility models, Earth-Sci. Rev., 180, 60–91, https://doi.org/10.1016/j.earscirev.2018.03.001, 2018.
San, B. T.: An evaluation of SVM using polygon-based random sampling in landslide susceptibility mapping: The Candir catchment area (western Antalya, Turkey), Int. J. Appl. Earth Obs., 26, 399–412, https://doi.org/10.1016/j.jag.2013.09.010, 2014.
Segoni, S., Lagomarsino, D., Fanti, R., Moretti, S., and Casagli, N.: Integration of rainfall thresholds and susceptibility maps in the Emilia Romagna (Italy) regional-scale landslide warning system, Landslides, 12, 773–785, https://doi.org/10.1007/s10346-014-0502-0, 2015.
Segoni, S., Piciullo, L., and Gariano, S. L.: A review of the recent literature on rainfall thresholds for landslide occurrence, Landslides, 15, 1483–1501, https://doi.org/10.1007/s10346-018-0966-4, 2018a.
Segoni, S., Rosi, A., Lagomarsino, D., Fanti, R., and Casagli, N.: Brief communication: Using averaged soil moisture estimates to improve the performances of a regional-scale landslide early warning system, Nat. Hazards Earth Syst. Sci., 18, 807–812, https://doi.org/10.5194/nhess-18-807-2018, 2018b.
Steger, S., Brenning, A., Bell, R., and Glade, T.: The propagation of inventory-based positional errors into statistical landslide susceptibility models, Nat. Hazards Earth Syst. Sci., 16, 2729–2745, https://doi.org/10.5194/nhess-16-2729-2016, 2016.
Sun, D. L., Wu, X. Q., Wen, H. J., and Gu, Q. Y.: A LightGBM-based landslide susceptibility model considering the uncertainty of non-landslide samples, Geomat. Nat. Haz. Risk, 14, 2213807, https://doi.org/10.1080/19475705.2023.2213807, 2023.
Thiene, M., Shaw, W. D., and Scarpa, R.: Perceived risks of mountain landslides in Italy: Stated choices for subjective risk reductions, Landslides, 14, 1077–1089, https://doi.org/10.1007/s10346-016-0741-3, 2017.
Tufano, R., Formetta, G., Calcaterra, D., and De Vita, P.: Hydrological control of soil thickness spatial variability on the initiation of rainfall-induced shallow landslides using a three-dimensional model, Landslides, 18, 3367–3380, https://doi.org/10.1007/s10346-021-01681-x, 2021.
Xiao, W. F., Zhou, Z. Y., Ren, B. Z., and Deng, X. P.: Integrating spatial clustering and multi-source geospatial data for comprehensive geological hazard modeling in Hunan Province, Sci. Rep., 15, 1982, https://doi.org/10.1038/s41598-024-84825-y, 2025.
Yan, F., Zhang, Q. W., Ye, S., and Ren, B.: A novel hybrid approach for landslide susceptibility mapping integrating analytical hierarchy process and normalized frequency ratio methods with the cloud model, Geomorphology, 327, 170–187, https://doi.org/10.1016/j.geomorph.2018.10.024, 2019.
Yang, C., Liu, L. L., Huang, F. M., Huang, L., and Wang, X. M.: Machine learning-based landslide susceptibility assessment with optimized ratio of landslide to non-landslide samples, Gondwana Res., 123, 198–216, https://doi.org/10.1016/j.gr.2022.05.012, 2023.
Yang, K. H., Uzuoka, R., Thuo, J. N., Lin, G. L., and Nakai, Y.: Coupled hydro-mechanical analysis of two unstable unsaturated slopes subject to rainfall infiltration, Eng. Geol., 216, 13–30, https://doi.org/10.1016/j.enggeo.2016.11.006, 2017.
Zêzere, J. L., Pereira, S., Melo, R., Oliveira, S. C., and Garcia, R. A. C.: Mapping landslide susceptibility using data-driven methods, Sci. Total Environ., 589, 250–267, https://doi.org/10.1016/j.scitotenv.2017.02.188, 2017.
Zhao, Z., Liu, Z. Y., and Xu, C.: Slope unit-based landslide susceptibility mapping using certainty factor, support vector machine, random forest, CF-SVM and CF-RF models, Front. Earth Sci., 9, 589630, https://doi.org/10.3389/feart.2021.589630, 2021.
Zou, Y., Wei, Z. F., Zhan, Q. M., and Zhou, H. J.: An extreme storm over the Nanling Mountains during Typhoon Bilis and the roles of terrain, Nat. Hazards, 116, 795–815, https://doi.org/10.1007/s11069-022-05699-9, 2023.
- Abstract
- Introduction
- Study area and data sources
- Methodologies
- Landslide susceptibility prediction using machine learning models
- Landslide risk assessment in Zixing City
- Discussion
- Conclusions
- Code and data availability
- Author contributions
- Competing interests
- Disclaimer
- Acknowledgements
- Financial support
- Review statement
- References
- Supplement