
the Creative Commons Attribution 4.0 License.
the Creative Commons Attribution 4.0 License.
 | 03 Nov 2026
Multi-scale dynamics and mesoscale drivers of the catastrophic September 2022 Marche (central Italy) flood
Matteo Berton

Mario Marcello Miglietta
The catastrophic flood that hit the Marche region (central Italy) on 15 September 2022 has been analyzed using high-resolution Weather Research and Forecasting (WRF) model simulations. The convective rainfall event responsible for the flood was favored by the passage of warm, moist air masses that interacted with the central Apennines. The convective cells, triggered by the rough orography of the area, formed quasi-stationary bands that caused high rainfall accumulation in limited areas. The formation of these rainbands was sustained by the interaction between the low-level flow and the local topography, which generated a persistent low-level convergence line extending downwind from Mount Amiata northeastward towards the Apennines. The observed vertical profile upstream of the orography reveals that the instability was initially suppressed by an inversion layer and was released only when the humid air arrived at low levels and eroded the inhibition. Furthermore, the simulations suggest that gravity waves induced by the mountains may have helped to sustain the vertical motion of the impinging air, and highlight the role of upper-level dynamics (passage of a jet streak). The comparison with surface stations shows that the simulation underestimates peak accumulations (160–180 mm simulated vs. over 400 mm observed), delays the event by 1–2 h, and misses the final phase. However, overall the model captures the system's spatial position, orientation, and quasi-stationary evolution associated with orographic anchoring.
Rather than evaluating predictive skill in an operational-like perspective, this study investigates the physical precursors and dynamical mechanisms of the event. Sensitivity experiments reveal a strong dependence on initial and boundary conditions. A comparison of the control run (forced with Global Data Assimilation System (GDAS) analysis/forecasts) with a simulation driven by European Centre for Medium-Range Weather Forecasts (ECMWF) analysis/forecasts shows a strong sensitivity to the low-level dynamics. Although the large-scale upper-level forcing is almost identical, the ECMWF-driven forecast fails to reproduce the correct amount and distribution of rainfall due to a weaker surface pressure gradient, reduced moisture advection, and lower instability at the time of the event. Specifically, the simulation forced with the ECMWF data anticipates the arrival of the moist air mass, determining a timing mismatch between the low-level supply of moist air (and the consequent release of instability) and the upper-level forcing. This lack of synchronization shifts the rainfall away from the observed area.
- Article
(17212 KB) - Full-text XML
-
Supplement
(8445 KB) - BibTeX
- EndNote


The Mediterranean basin is recognized as a primary climate change “hot-spot” and a region highly vulnerable to severe hydrometeorological extremes, including Heavy Precipitation Events (HPEs) and devastating flash floods (Drobinski et al., 2014). Acting as a transition zone between midlatitude and tropical climate regimes, the Mediterranean Sea serves as a reservoir of heat and moisture. When this moist air interacts with the complex and steep orography surrounding the basin, it frequently triggers highly energetic and stationary Mesoscale Convective Systems (MCSs). Recent findings (Khodayar et al., 2021) from the HyMeX program demonstrate that the severity of these events is mostly driven by large-scale atmospheric patterns. Synoptic structures, such as cut-off lows and Mediterranean cyclones, trigger intense air-sea interactions. Through evaporation and surface heat fluxes, the Mediterranean Sea moistens and destabilizes the lower atmosphere, building up potential energy. Low-level winds then transport this marine air toward the coastlines. The complex topography surrounding the basin forces these incoming flows to rise, ultimately triggering intense convective storms.
In this context, the Mediterranean Sea is particularly susceptible to these dynamics due to the proximity of the Alps and Apennines to the warm surrounding sea (Miglietta and Davolio, 2022). A prominent example of this vulnerability is the Marche region, located in central Italy (see Fig. 1). Geographically, the region is bounded by the Adriatic Sea to the east and the central Apennines to the west, whose western slopes approach the Tyrrhenian coast. Its topography is characterized by a series of narrow, steep river valleys oriented perpendicular to both the coastlines and the mountain barrier. When low-level moist atmospheric flows originating from the Mediterranean Sea impinge on the steep Apennine ridge, they undergo orographic lifting and make the region susceptible to severe weather events. Furthermore, the numerous small and medium-sized steep catchments exhibit a rapid hydrological response to heavy precipitation, frequently resulting in sudden flash floods (Lombardi et al., 2021; Bendia et al., 2026).
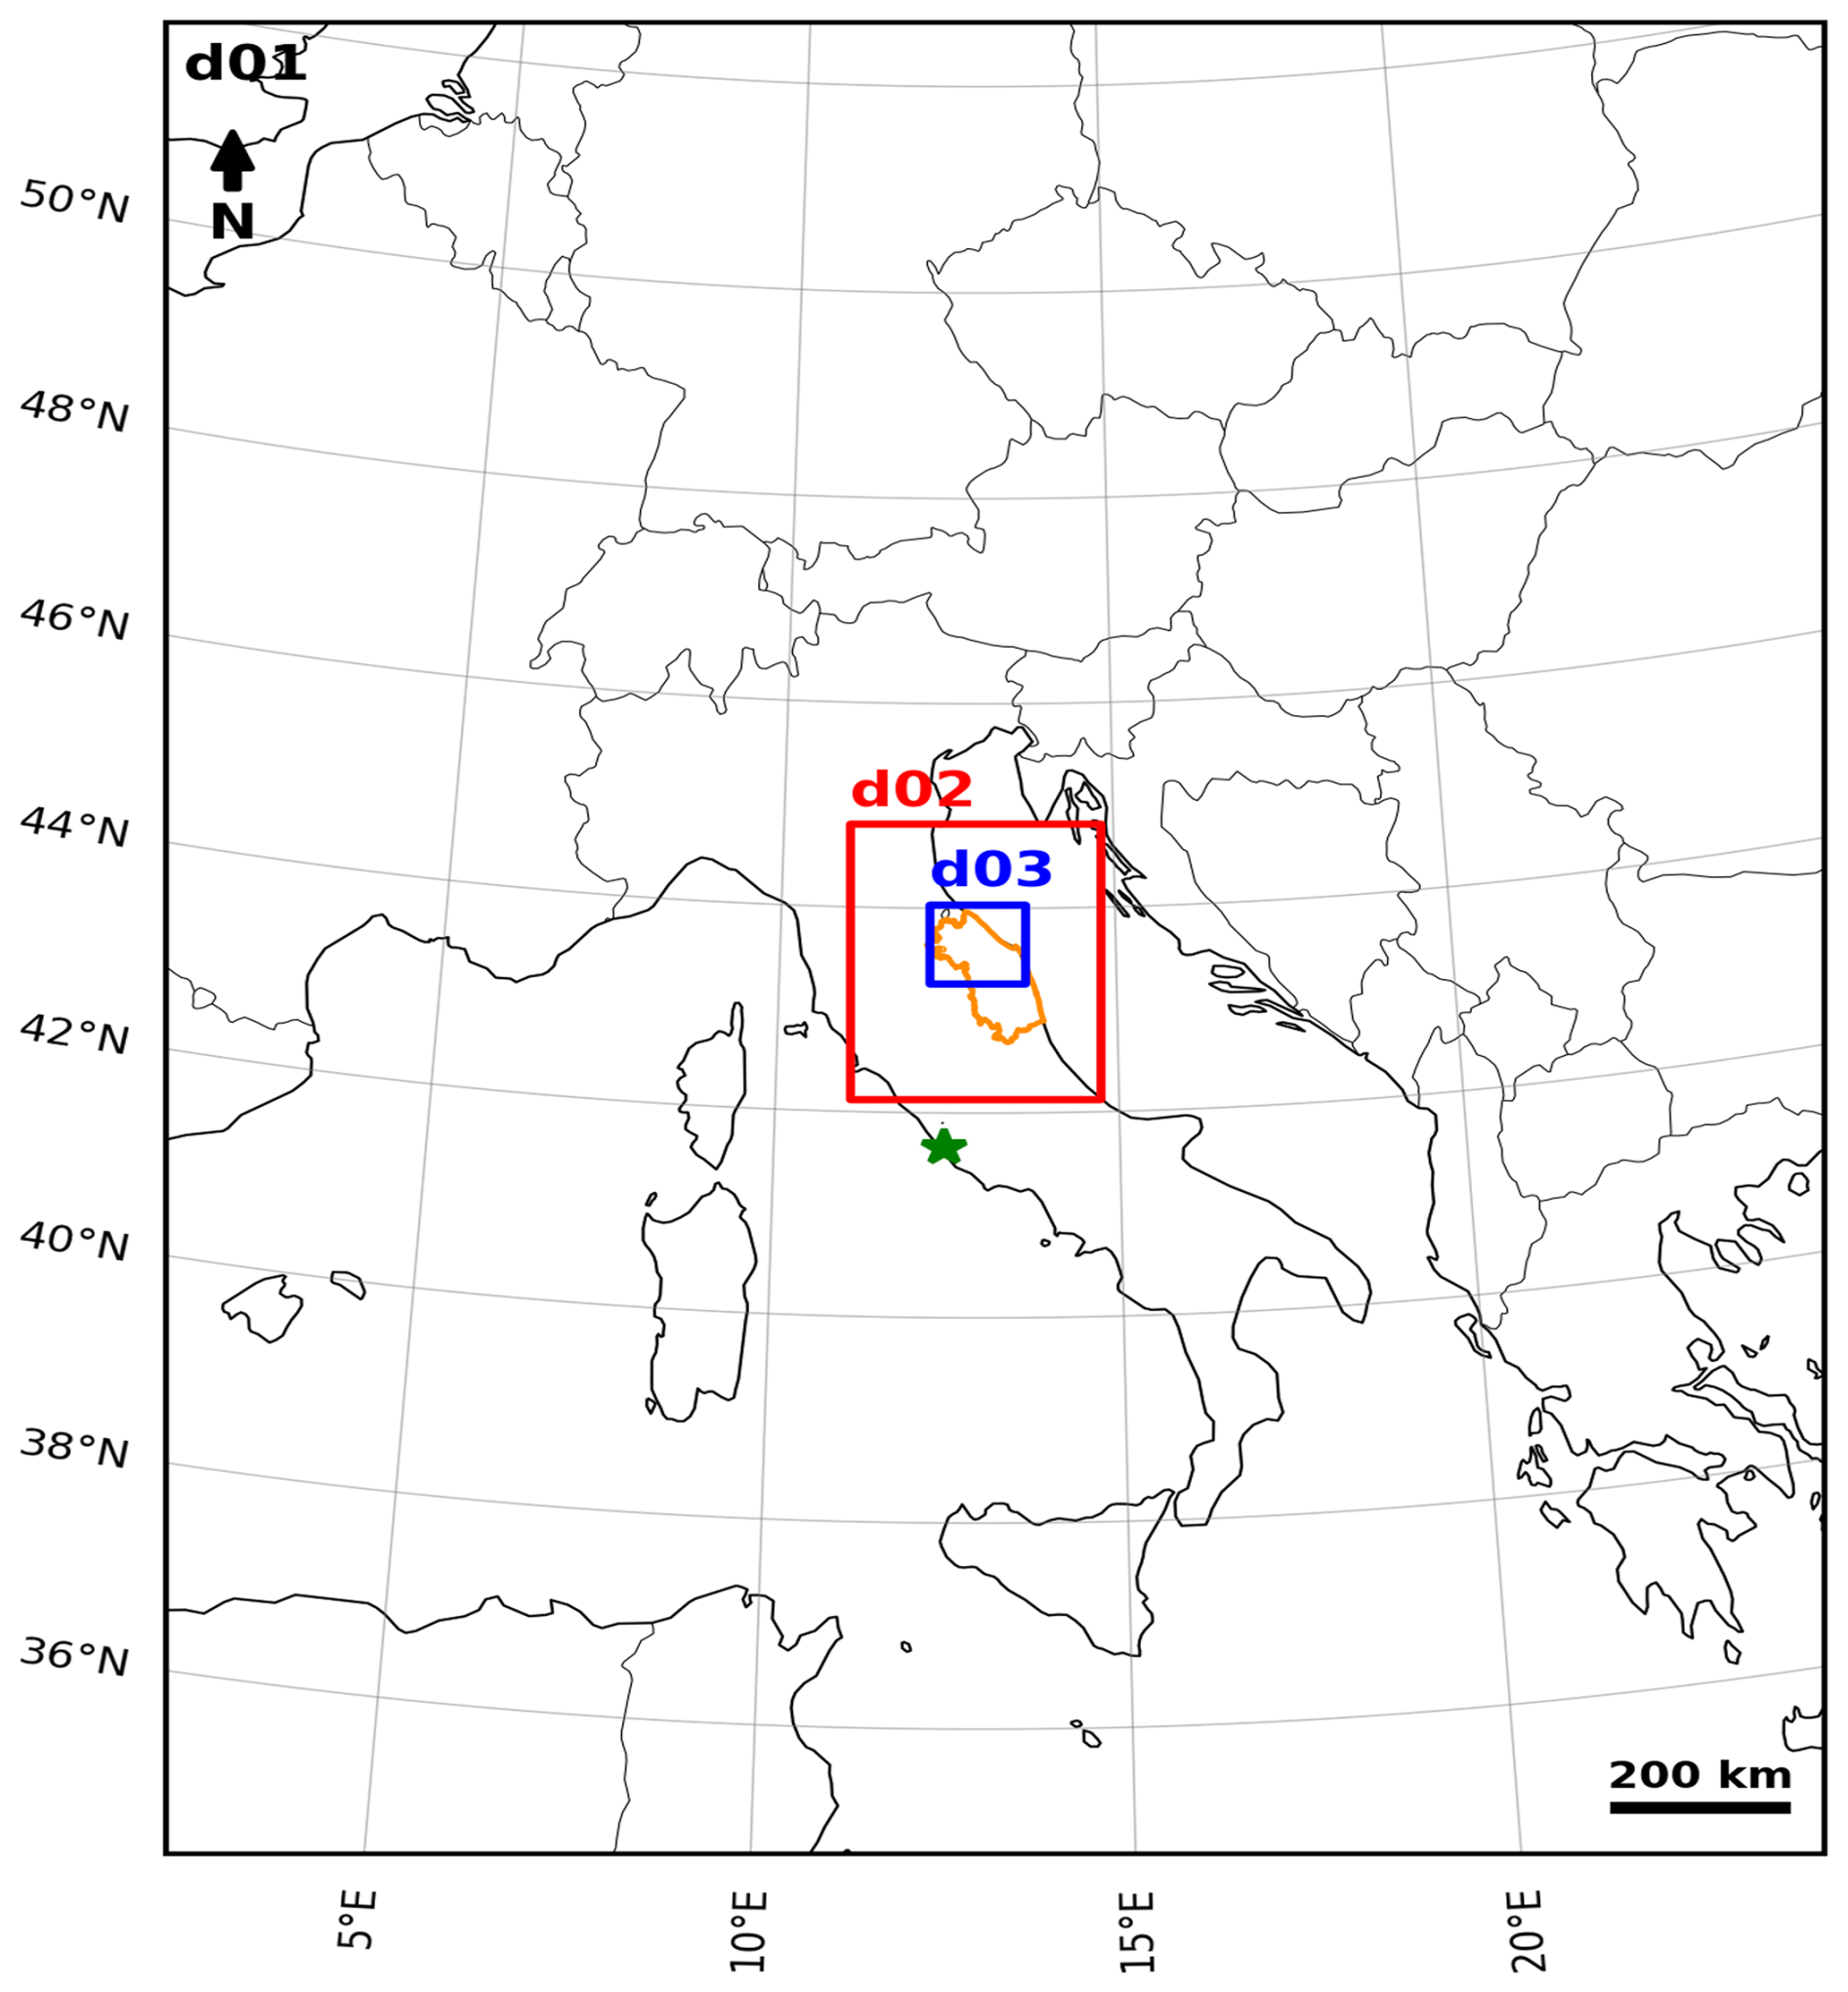
Figure 1Configuration of the WRF model domains. The orange outline indicates the Marche region, while the green star marker indicates the location of the Pratica di Mare station.
A recent example of this kind of dynamics is the flood that struck the Marche region on 15 September 2022. This event was characterized by a quasi-stationary, V-shaped MCS capable of generating extreme precipitation within just a few hours. Previous studies on similar events in Italy highlighted that the stationarity and intensity of such systems are often linked to low-level convergence lines, induced by both the synoptic-scale circulation and the local flow deflection by the terrain (Mastrangelo et al., 2011; Davolio et al., 2009), together with the advection of very moist air over even modest orography (e.g. Miglietta and Regano, 2008).
Compared to previous studies, the present research exploits the higher grid resolution of current numerical weather prediction models to better resolve small-scale terrain features. This improved resolution allows models to explicitly disentangle the meso-gamma scale, which plays a fundamental role in airflow dynamics near complex topography. Consequently, this helps us better reproduce localized, severe orographic precipitation events, which Sawyer (1956) proposed are governed by three core factors: the large-scale synoptic forcing, which dictates the characteristics of the impinging airmass, including wind velocity, stability, and humidity; the terrain interaction at mesoscale, which determines whether the flow goes over or around the orographic obstacle; microphysical processes, which control the efficiency of cloud development and whether moisture falls as precipitation.
The objective of this study is to investigate the atmospheric conditions and multi-scale dynamical mechanisms that drove the September 2022 Marche event using the Weather Research and Forecasting (WRF) model (Skamarock et al., 2019). In this context, the use of high-resolution numerical models becomes essential to improve our understanding of the atmospheric drivers associated with severe hydrogeological impacts in the complex terrain of the Apennines. It is worth noting that the scope of this research extends beyond the numerical reproduction of the rainfall; instead, it aims to better understand the mechanisms triggering this extreme event. Consequently, we focus on the simulation that provided the most accurate representation of the storm's localization and intensity, which has been subsequently used as the baseline for the physical analysis. This high-resolution simulation allows for the explicit representation of convective processes and their interaction with the complex orography, providing a tool for diagnosing and understanding such an extreme meteorological event.
The paper somewhat explores the predictability of localized heavy rainfall events, which is related to a fundamental challenge in numerical weather prediction: the scale-dependency of atmospheric predictability. The ECMWF-EPS (Ensemble Prediction System) initial perturbations are tuned for large-scale synoptic patterns. This presents a critical limitation when predicting localized heavy rainfall: different simulations, which are nearly indistinguishable at larger scales at initial times, may show some differences in mesoscale features, which may dramatically affect the subsequent evolution, since localized convective systems depend heavily on such small-scale dynamics. Therefore, different ensemble members can produce nearly identical synoptic forecasts while generating greatly different local precipitation totals. Zhang et al. (2002) showed that moist convective processes can cause a rapid upscale initial error growth in regions of moist instability so that the small amplitude error at small scales ultimately limits the predictability even at larger scales. Additionally, small changes in topography representation or moisture content can cause massive differences in precipitation amount, location, and structure.
The paper is structured as follows: Sect. 2 introduces the data and the model used for the analysis; Sect. 3 describes the synoptic environment; Sect. 4 presents the observational analysis and the numerical simulations; sensitivity to initial and boundary conditions is shown in Sect. 5, while conclusions are drawn in Sect. 6.
The numerical simulations in this study were performed using the Advanced Research WRF (WRF-ARW) model, version 4.6.1. WRF-ARW is a fully compressible, non-hydrostatic model that employs a hybrid sigma-pressure vertical coordinate system, designed to minimize errors over steep topography.
The WRF model was employed here to reproduce the Marche flood of September 2022, with the objective of understanding the atmospheric drivers and conditions that led to the event. Following a trial-and-error procedure, the configuration explained hereafter, initialized at 00:00 UTC on 15 September 2022 (24 h duration), was identified as optimal, yielding the best compromise in terms of precipitation localization and amount.
The simulation setup includes three one-way nested domains, as shown in Fig. 1.
-
The parent domain (d01) covers a wide area with a horizontal grid spacing of 10 km (200×200 grid points).
-
The intermediate domain (d02) focuses on central Italy with a grid spacing of 2 km (151×151 grid points).
-
The innermost domain (d03) covers in detail the portion of the Marche region affected by the highest precipitation peaks, having a grid spacing of 0.66 km (172×130 grid points).
Vertically, the model atmosphere is discretized into 41 levels, extending from the surface up to a top pressure of 50 hPa. Initial and lateral boundary conditions were derived from the NCEP GDAS/FNL 0.25° Global Tropospheric Analyses and Forecast Grids. Boundary conditions were updated every 3 h using the analysis fields (f00), available every 6 h, as well as the short-term 3 h forecasts (f03) for the intermediate times. This high-frequency update indicates the diagnostic nature of this work, aiming to reconstruct the event dynamics using the setup emerging as the best available in terms of atmospheric boundary forcing.
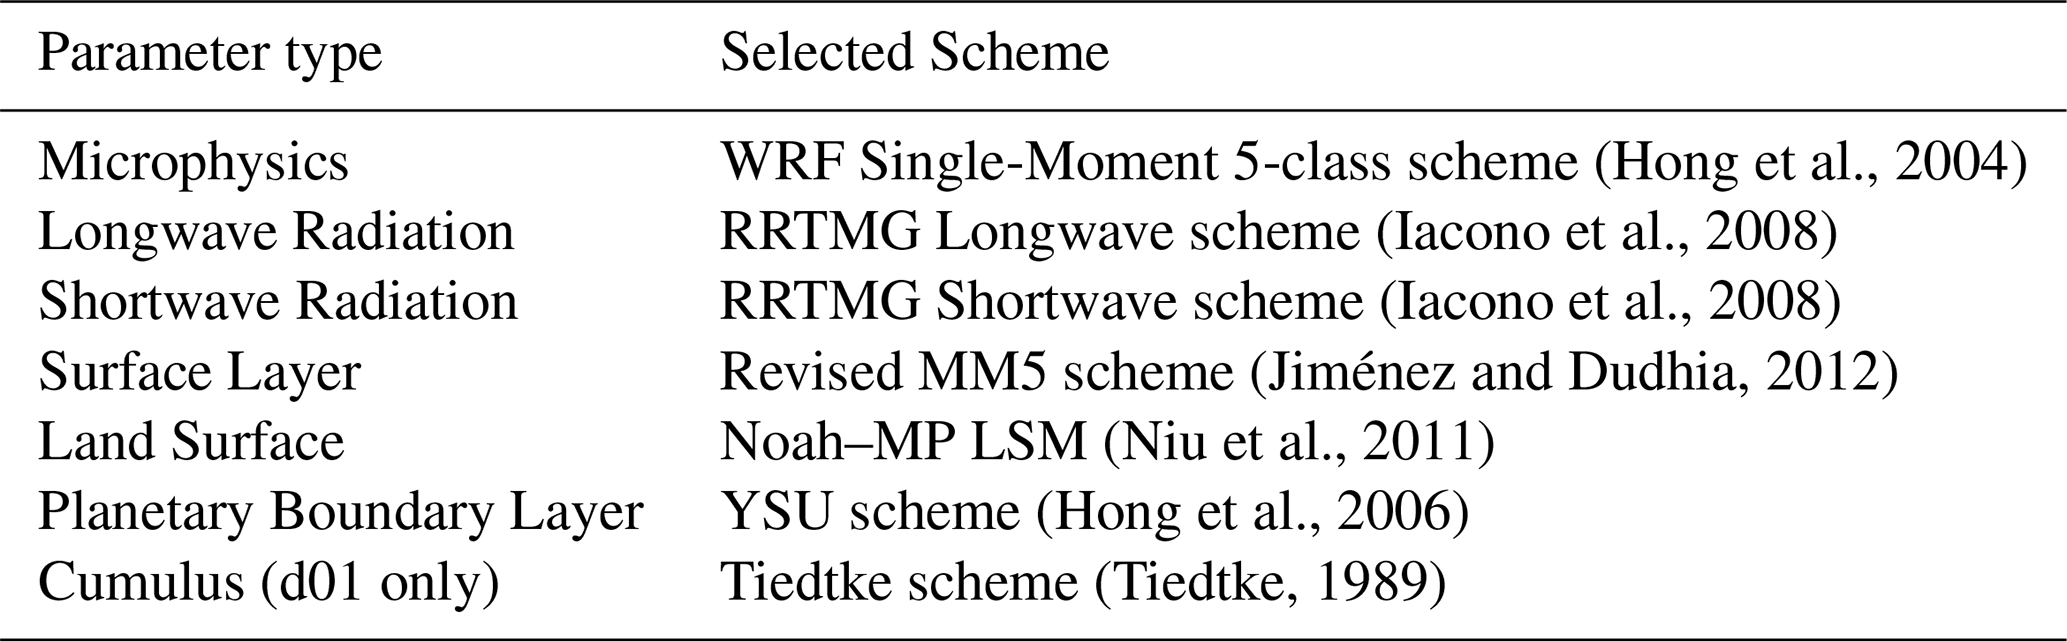
A summary of the parameterization schemes adopted here is provided in Table 1; they have been selected following the configuration used in Tartaglione (2025). A crucial distinction in the setup concerns the cumulus parameterization. For the coarser domain (d01), the Tiedtke scheme (Tiedtke, 1989) was activated to parameterize sub-grid scale convection. Conversely, for the intermediate and innermost domains (d02 and d03), a convection-permitting configuration was adopted.
(Hong et al., 2004)(Iacono et al., 2008)(Iacono et al., 2008)(Jiménez and Dudhia, 2012)(Niu et al., 2011)(Hong et al., 2006)(Tiedtke, 1989)Table 1Summary of WRF physics parameterizations used in the simulation.
The synoptic environment leading to the extreme event of 15 September 2022 was characterized by a combination of atmospheric patterns that facilitated the accumulation of high convective available potential energy and moisture over the central part of the Italian peninsula in the previous days (Torcasio et al., 2023; Tartaglione, 2025).
The thermal structure (Fig. 2d–f) reveals a pronounced temperature gradient moving eastward over the western Mediterranean. The Marche region was positioned at the boundary between a ridge extending from the south, bringing warm air from North Africa on its western side, and a trough on its northwestern side, drawing in colder air from Northern Europe. By 15 September (panels c and f), the synoptic situation over the central Mediterranean evolved from a meridionally elongated pattern into a predominantly zonal flow pattern, with isohypses oriented perpendicular to the Apennine chain (Tartaglione, 2025). The low-level warming and moisture accumulated during the previous days, due to the persistence of the anticyclonic configuration, combined with the advection of moist and cooler mid-level air, increased the potential instability in the area. This evolution is typical of severe convective storms in the Mediterranean region (e.g. Avolio et al., 2020; González-Alemán et al., 2023) and ultimately facilitated the triggering of a stationary V-shaped system.
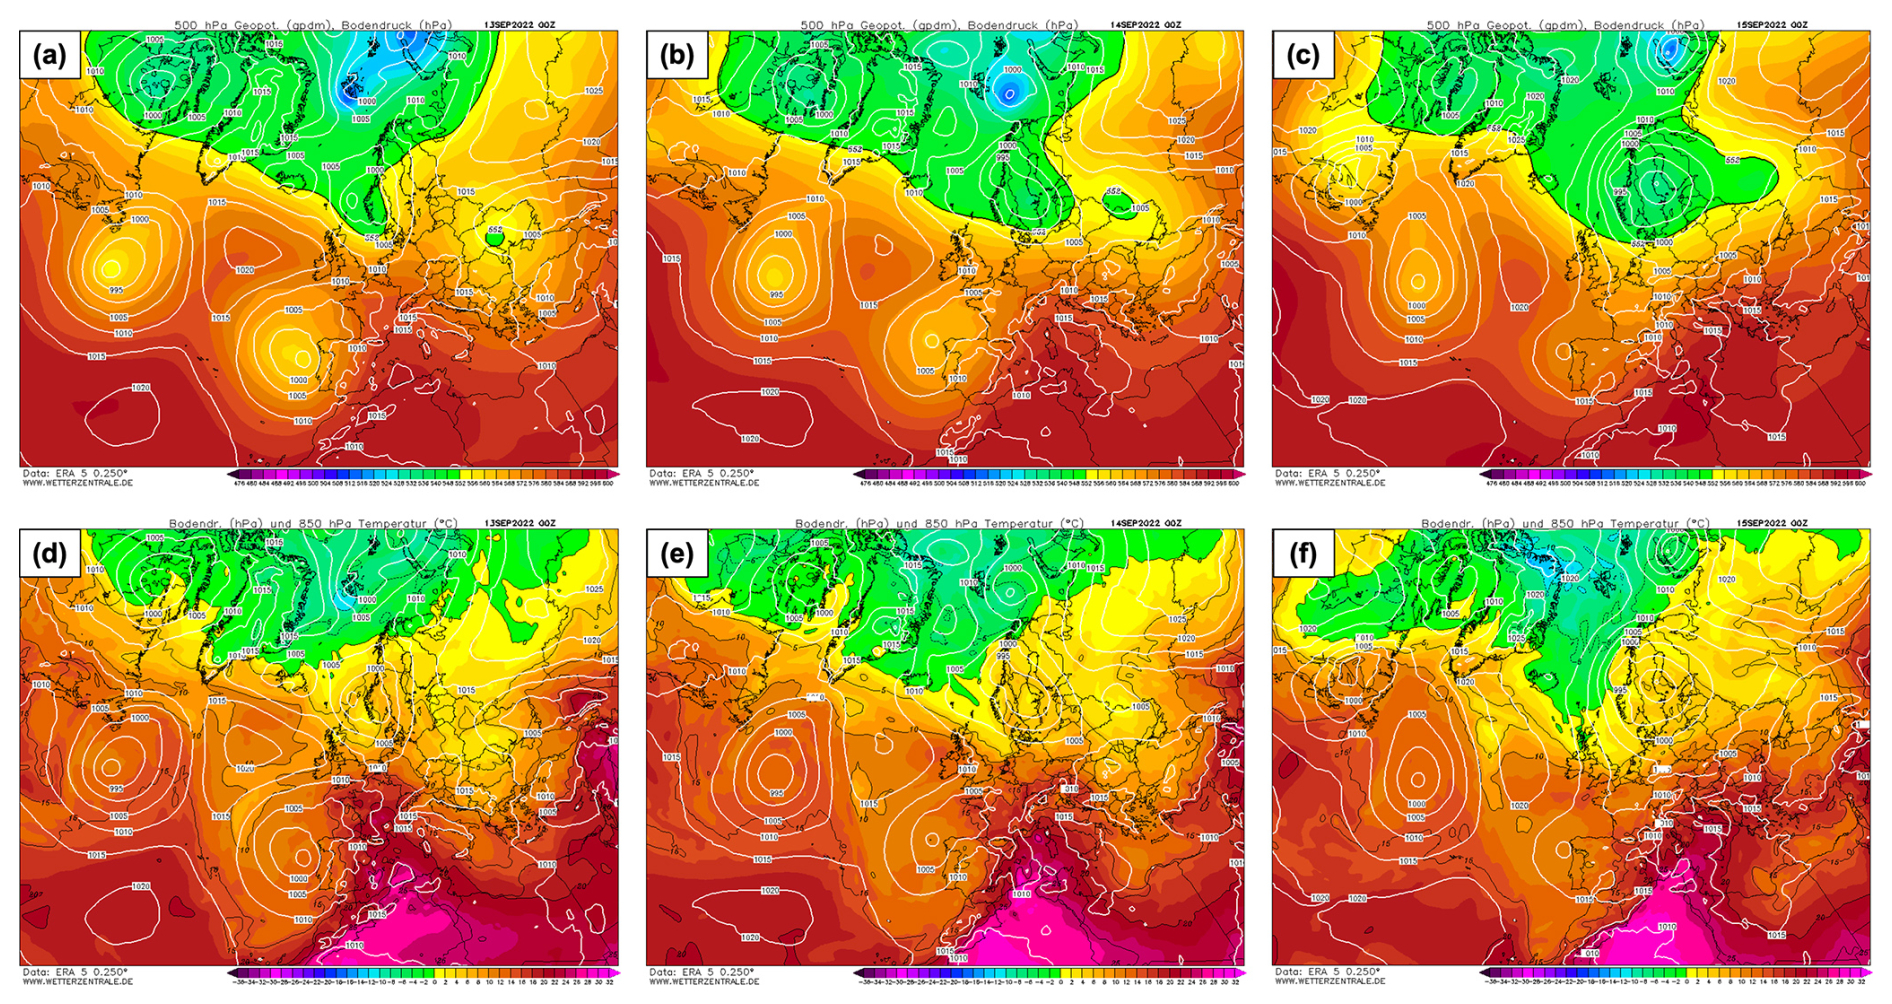
Figure 2Synoptic maps at 00:00 UTC for 13 September (left column: a, d), 14 September (center column: b, e), and 15 September 2022 (right column: c, f). Top row (a–c): 500 hPa geopotential height (gpdam, shading) and sea level pressure (hPa, white lines). Bottom row (d–f): 850 hPa temperature (°C, shading) and mean sea level pressure (hPa, white lines). The maps are based on ERA5 reanalysis data (0.25° resolution). Source: Wetterzentrale (https://www.wetterzentrale.de/, last access: 28 October 2026).
The upper-level dynamics also played a key role in sustaining the convective system. The rapid evolution of the geopotential at 300 hPa on 15 September (see Fig. S1 in the Supplement) reveals that the jet streak reached Northern Italy in the afternoon, placing the Marche region below the right entrance region (right-rear quadrant). This configuration is well known to induce upper-level divergence and low-level convergence (Uccellini and Johnson, 1979), generating vertical lift that provides a favorable dynamic environment for deep convection development.
4.1 Observational Analysis of the Event
The event of 15 September 2022 was characterized by the development of several convective systems that were triggered near the western border of the Marche region (Tartaglione, 2025). These systems organized into “multicell line storms” with a distinct west-to-east orientation. This specific alignment was crucial, as it allowed for continuous and intense rainfall to persist over the same geographical areas, significantly amplifying the flooding severity.
Consequently, the system remained anchored over the Marche Apennines orography for several hours. Remote sensing platforms captured the intensity and the structure of the event: the H-SAF satellite estimation (Fig. 3a) highlights the V-shaped structure of the storm associated with very intense instantaneous precipitation rates, as well as its highly localized character, while the Civil Protection radar network (Fig. 3b and c) shows reflectivity values reaching the “very strong” intensity class over a narrow band persisting for several hours.
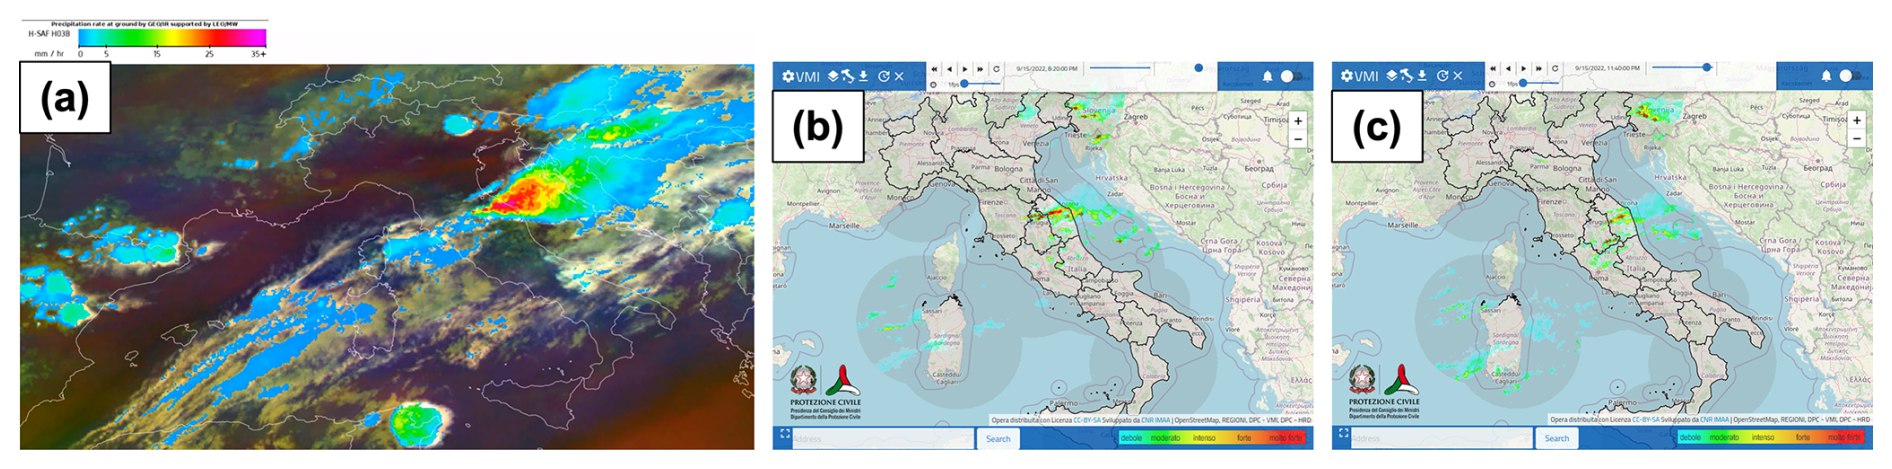
Figure 3(a) Satellite instantaneous precipitation rate estimation derived from the H-SAF (Satellite Application Facility on Support to Operational Hydrology and Water Management) H03B product (© EUMETSAT) on 15 September at 17:30 UTC; (b) and (c) Vertical Maximum Intensity (VMI) radar reflectivity fields provided by the Italian Department of Civil Protection on 15 September at 18:20 and 21:40 UTC, respectively.
The convective character of the event is further evidenced by the lightning activity. High-resolution lightning detection data indicate a high frequency of strokes concentrated along the rainbands. The temporal evolution of the lightning strikes is consistent with the intensification of the radar reflectivity cores (Fig. 4).
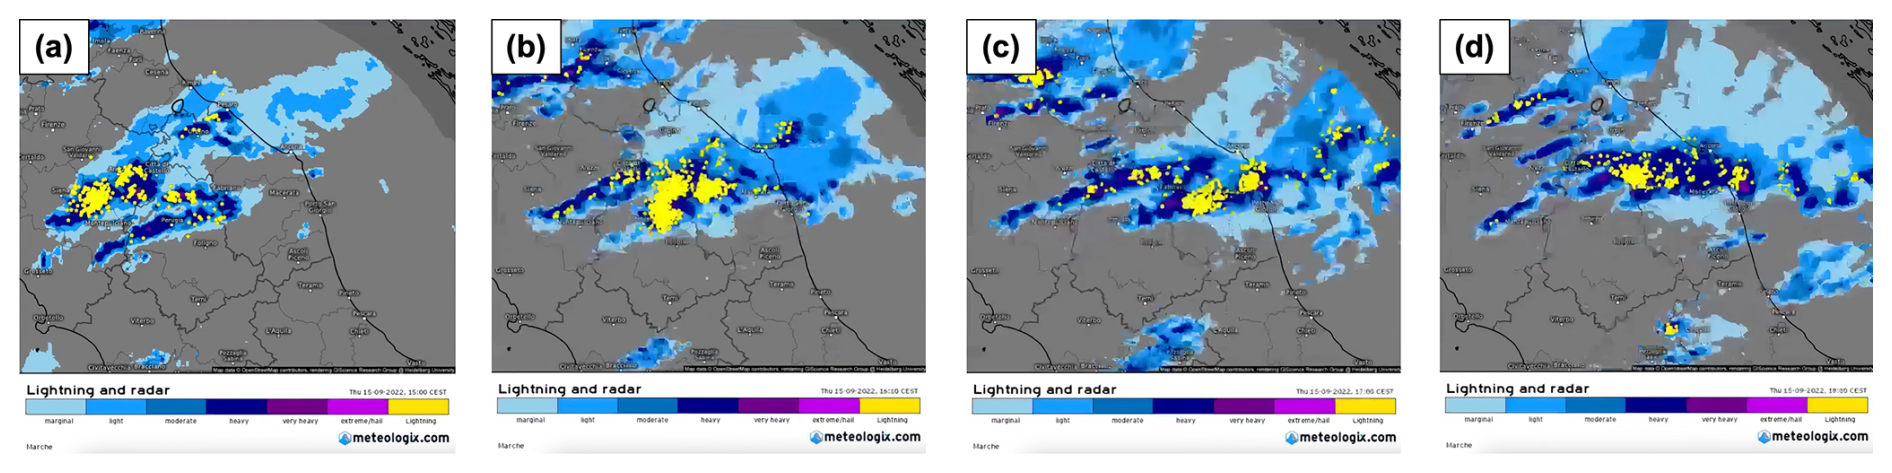
Figure 4Temporal evolution of lightning activity (yellow dots; data from the EUCLID/Siemens BLIDS network) and radar reflectivity (provided by the Italian Department of Civil Protection) over the Marche region on 15 September 2022 at: (a) 13:00 UTC, (b) 14:00 UTC, (c) 15:00 UTC, and (d) 16:00 UTC. Source: https://meteologix.com/it (last access: 28 October 2026). Map data © Google.
The vertical profile, as derived from the radiosoundings launched in Pratica di Mare (WMO ID: 16245; see Fig. 1 for its location), near the Tyrrhenian coast, provides critical insights into the upstream thermodynamic environment preceding the intense rainfall event (Fig. 5). The sequence of profiles from 14 to 15 September 2022 illustrates a transition toward an environment more favorable to the development of intense convection.
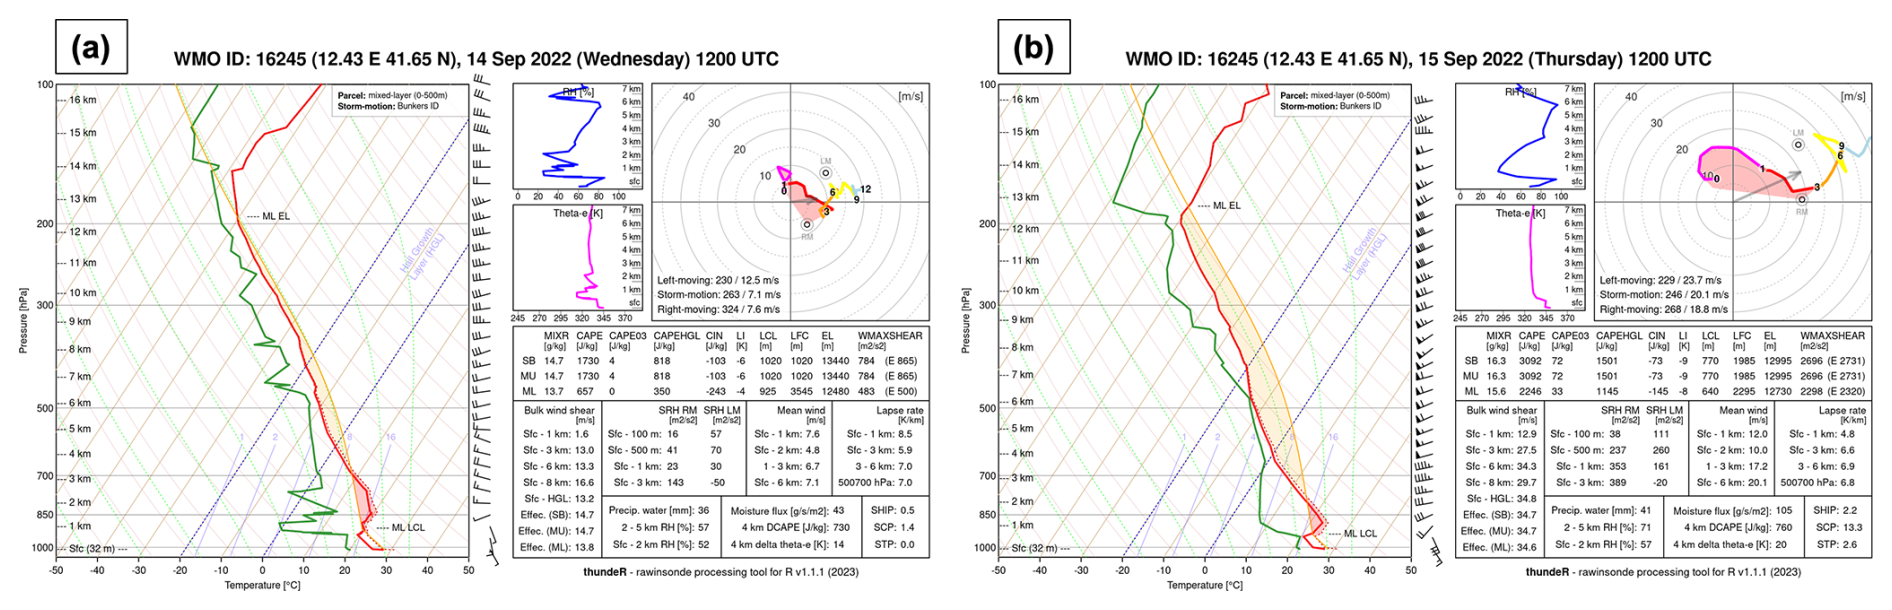
Figure 5Thermodynamic analysis from Pratica di Mare: (a) Skew-T diagram for 14 September at 12:00 UTC; (b) Skew-T diagram for 15 September at 12:00 UTC. Panels (a) and (b) generated using the thundeR R package (Czernecki et al., 2025).
In the days before the event, the region was characterized by high-pressure conditions. Large-scale subsidence associated with the anticyclonic regime induced adiabatic compression of the air mass, resulting in a prominent temperature inversion and the development of dry layers above the boundary layer. This process established a “Loaded Gun” sounding profile, i.e. a configuration originally identified by Fawbush and Miller (1954), featuring high convective potential inhibited by a low-level inversion and dry air.
On 14 September at 12:00 UTC (Fig. 5a), the atmosphere exhibited significant potential instability, with a Most Unstable Convective Available Potential Energy (MUCAPE) of 1730 J kg−1. However, this instability was effectively inhibited by a robust capping inversion, reflected by a Most Unstable Convective Inhibition (MUCIN) value of −103 J kg−1. Despite a remarkable Precipitable Water (PW) content of 36 mm, the “cap” prevented any convective development.
A turning point occurred between 00:00–12:00 UTC on 15 September (Table 2). The synoptic-scale flow induced a strong low-level moisture advection from the south-southwest, which acted as the primary trigger for the event. This moisture inflow is visible in Fig. 5b, as the surface mixing ratio rose from 14.7 to 16.3 g kg−1, and the total column PW increased from 36 to 41 mm. In the lowest layers (up to ≈940 hPa), the dew point profile closely follows the isohygrometric on both days. This behavior indicates a nearly constant mixing ratio with height, suggesting vigorous turbulent mixing within the planetary boundary layer (PBL) that efficiently distributes moisture uniformly throughout the mixed layer. The intrusion of warm, moist air in the lower levels combined with the mid-level cooling increased the instability (), while it reduced the capping inversion ().
Table 2Summary of thermodynamic indices from Pratica di Mare radiosoundings.

These modifications, enhanced in the following hours by an additional moistening of the mid-levels and arrival of cooler air (as shown in the following sections), eroded the capping inversion, while the lifting provided by the Apennine ridge and the low-level convergence – the specific roles of which will be further evaluated and discussed in the simulation results section – pushed the parcels up to the level of free convection (LFC). The evolution of these thermodynamic parameters is summarized in Table 2.
4.2 Simulated Thermodynamic Structure
First, to characterize the evolution of the thermodynamic properties of the air-mass feeding the convective system and validate the simulation, we tested the model's ability to reproduce the vertical structure of the atmosphere. Figure 6 presents the Skew-T diagram derived from the WRF model run at the location of Pratica di Mare at 12:00 UTC, on 15 September. A comparison with the observed sounding discussed in Sect. 4.1 reveals a qualitative agreement in the thermodynamic structure. The model correctly reproduces the “Loaded Gun” signature characterized by a warm, moist boundary layer (dew point temperature ≈20 °C), capped by a stable inversion layer around 950–850 hPa, and surmounted by a drier layer aloft. The quantitative values of the instability indices confirm the potential for severe weather: the simulated MUCAPE is 1731 J kg−1, the MUCIN is −105 J kg−1, and the Lifted Index (LI) is −7, indicating strong instability but also inhibition at the same time. A comparison with the observed sounding () reveals that the model captures the presence of conditions favorable to instability, although it significantly underestimates the value of MUCAPE.
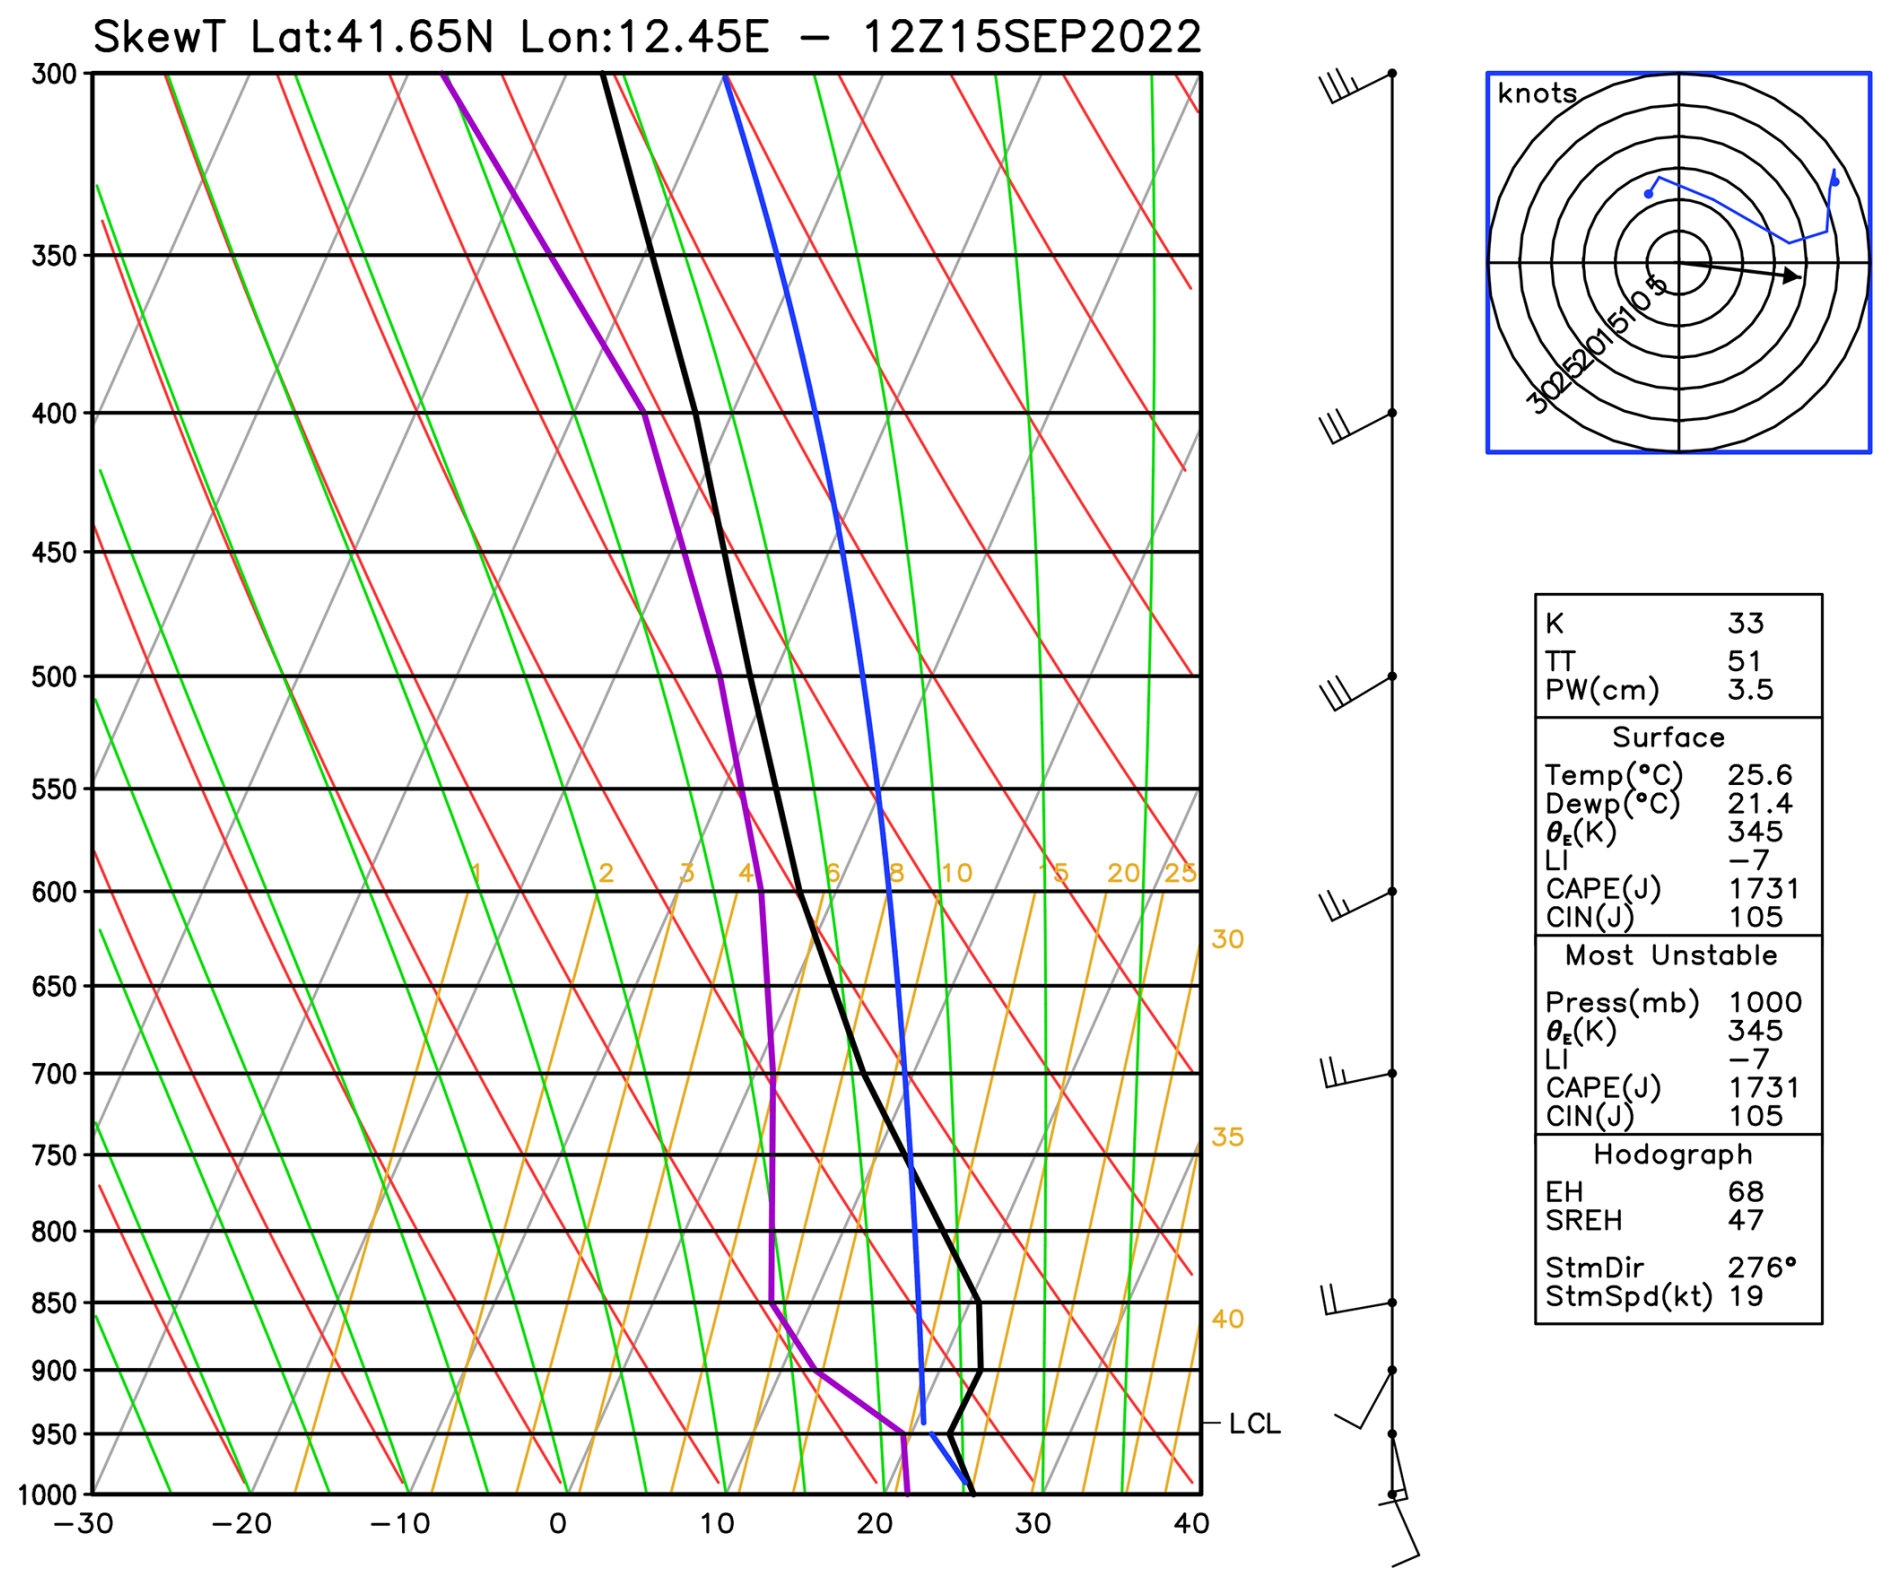
Figure 6WRF simulated sounding at the location of Pratica di Mare at 12:00 UTC on 15 September 2022.
4.3 Physical Mechanisms and Simulation Analysis
The WRF model simulation allows for a detailed analysis of the physical mechanisms initiating and maintaining the stationary convective bands.
4.3.1 Precipitation Analysis
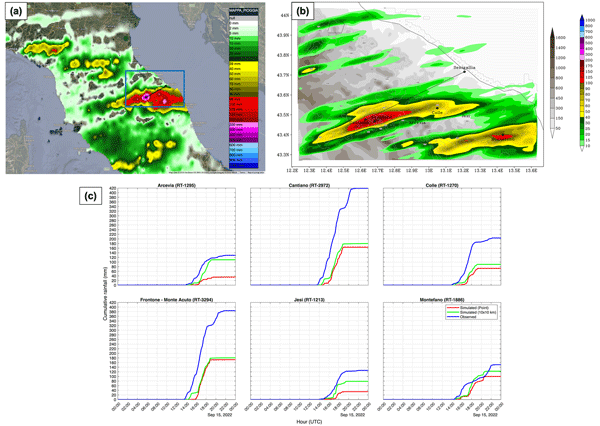
Figure 7 compares the observed 24 h accumulated precipitation (from 00:00 UTC on 15 September to 00:00 UTC on 16 September), retrieved from the Italian Department of Civil Protection (Dewetra platform), with the WRF simulated accumulation.
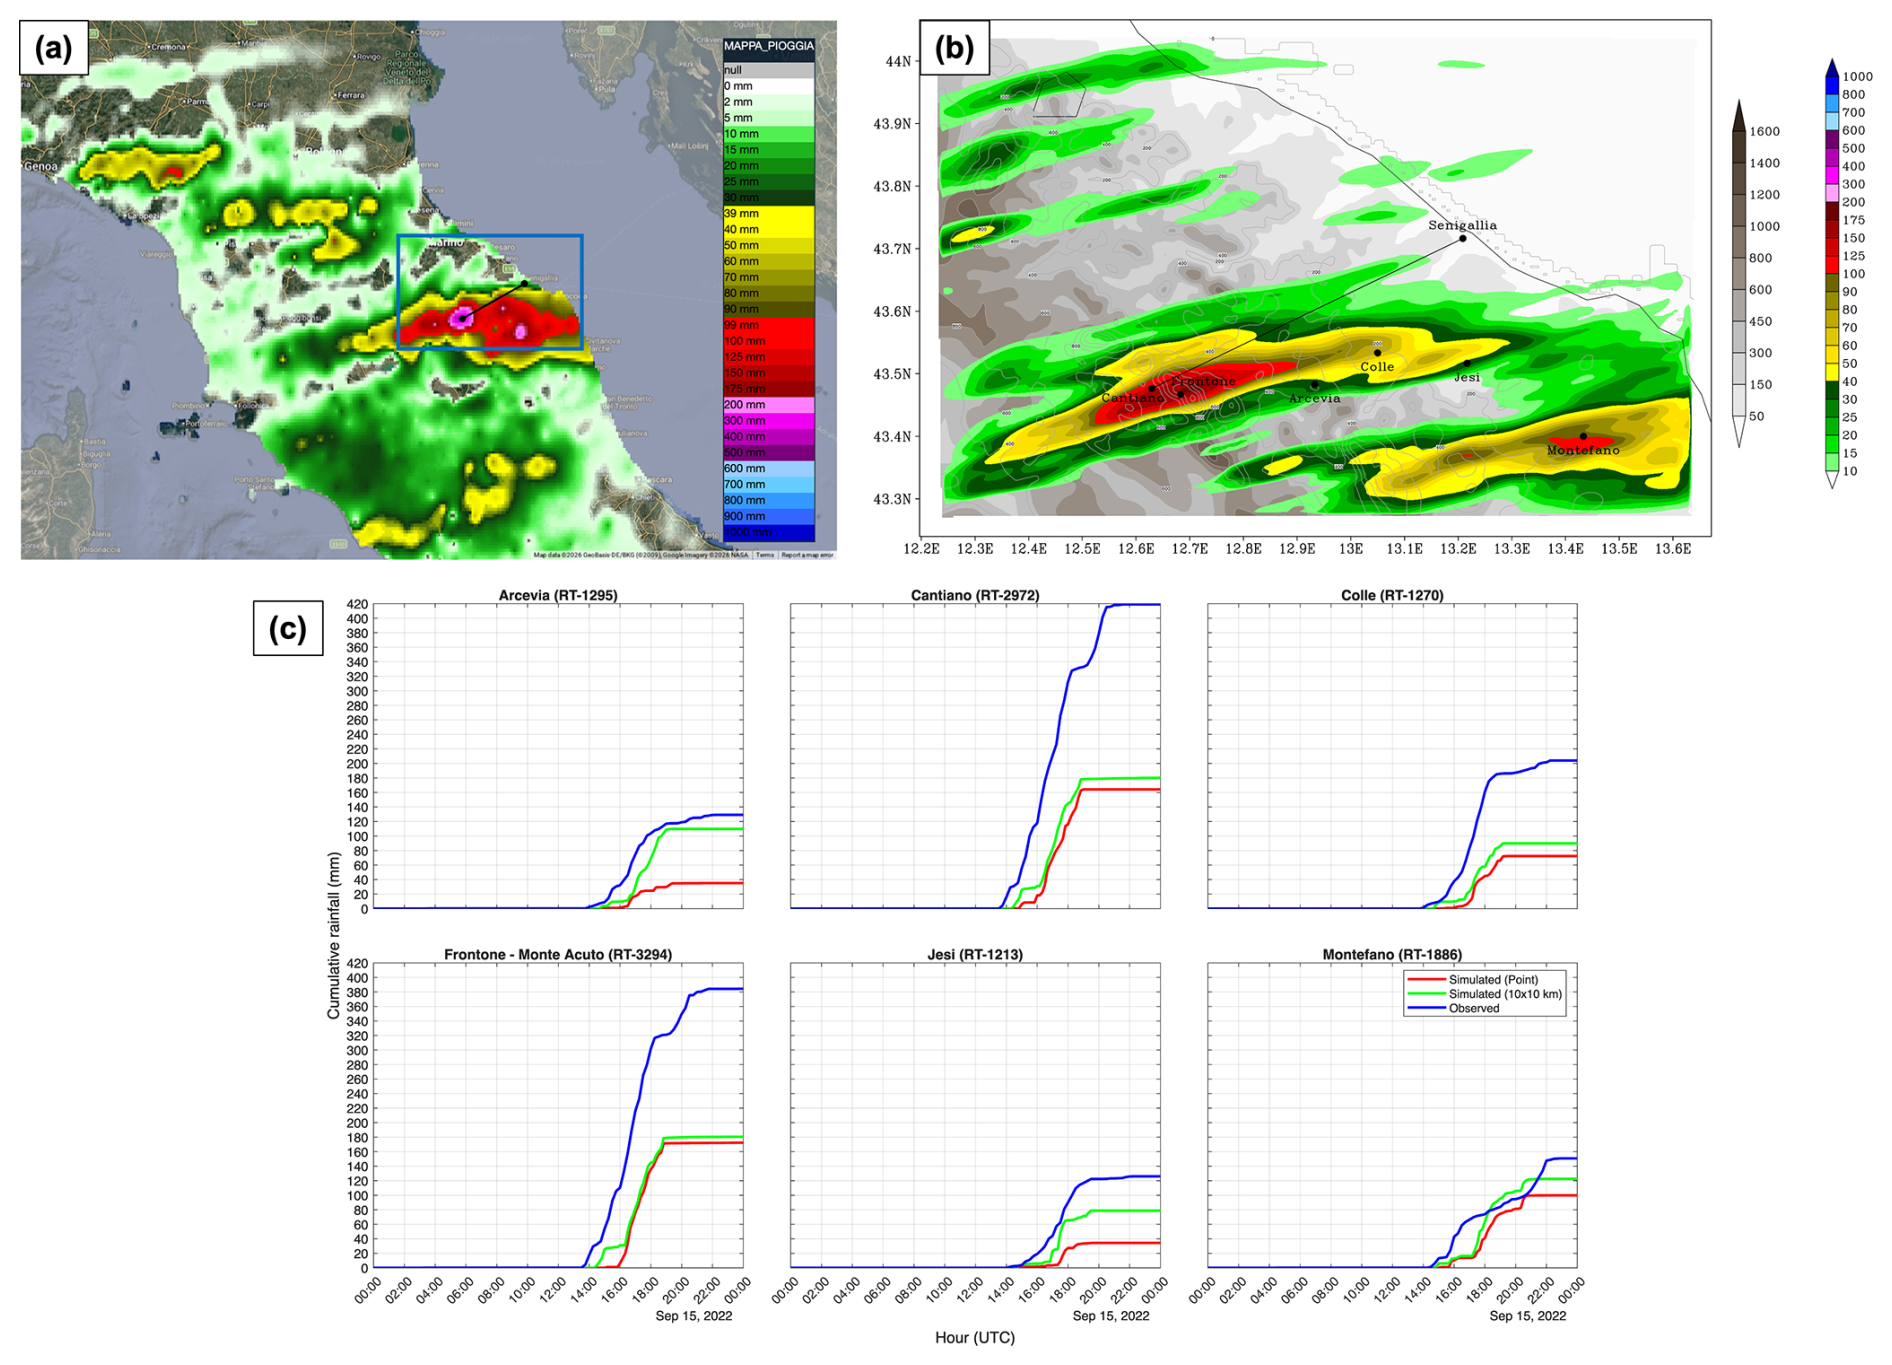
Figure 7Comparison of 24 h accumulated rainfall (mm) ending at 00:00 UTC on 16 September 2022. (a) Isohyet map derived from the Italian Department of Civil Protection; the blue rectangle indicates the d03 domain. (b) 24 h accumulated precipitation simulated by the WRF model over the d03 domain. (c) Observed (blue) and WRF simulated (red: point; green: 10 km×10 km neighborhood) cumulative rainfall profiles at six stations: Arcevia (RT-1295), Cantiano (RT-2972), Colle (RT-1270), Frontone–Monte Acuto (RT-3294), Jesi (RT-1213), and Montefano (RT-1886).
The simulation qualitatively captures the main convective signature: two distinct precipitation bands extending from the hinterland of central Italy to the Adriatic coast. These elongated structures are consistent with the lightning activity and radar reflectivity patterns shown in Fig. 4, as well as with the observational precipitation data derived from the Department of Civil Protection. Indeed, the model correctly identifies the presence of stationary convergence lines (as will be further detailed in Fig. 9) capable of generating persistent precipitation over the same area for several hours.
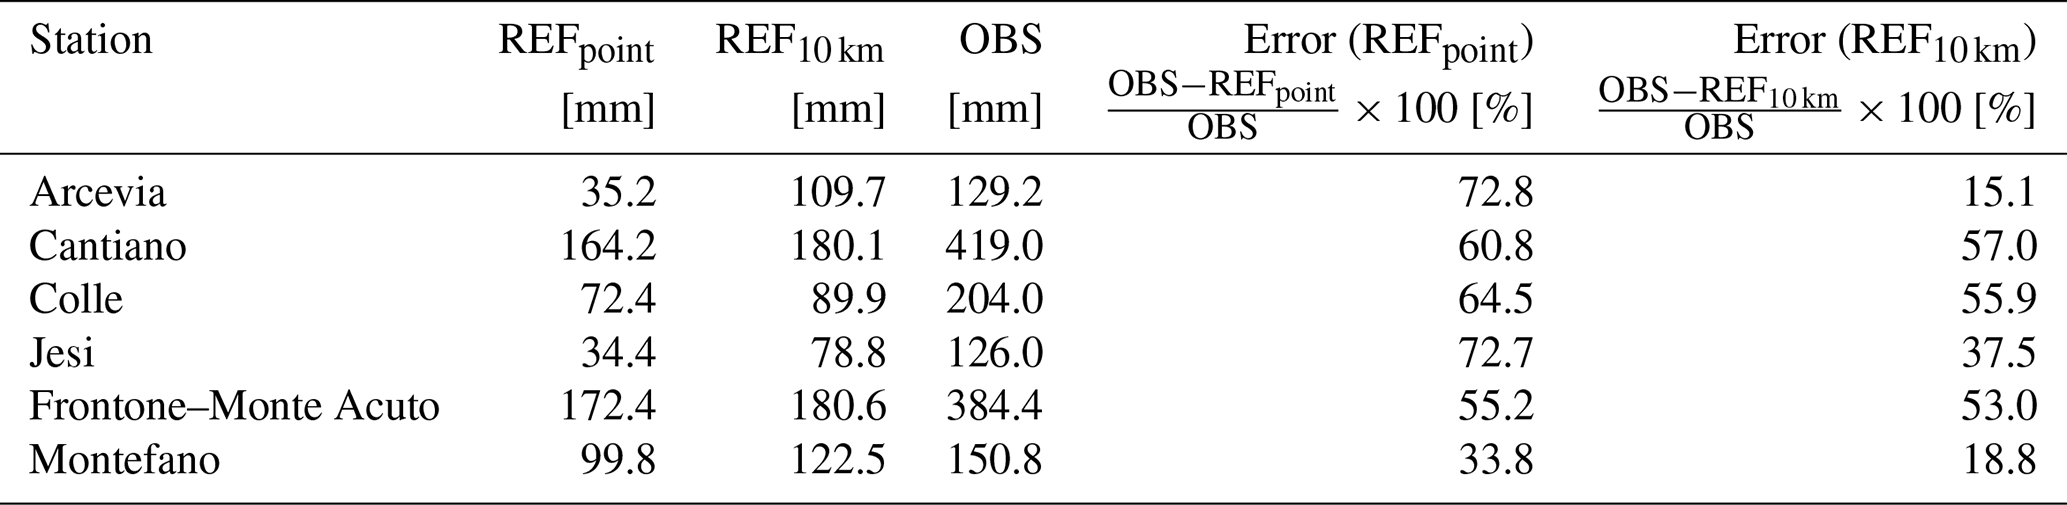
The simulation also reproduces correctly the localization of the precipitation bands. However, the quantitative accumulation is underestimated: while observed peaks were 419 and 384.4 mm in 24 h at Cantiano and Frontone, respectively, the simulated maxima remained near 180 mm.
An analysis of the temporal evolution provides further insight. Figure 7c compares the observed cumulative rainfall with the model output at six specific rain gauge stations: Arcevia, Cantiano, Colle, Frontone–Monte Acuto, Jesi, and Montefano. The validated station observations used for this comparison were retrieved from the Civil Protection Department of the Marche Region (http://app.protezionecivile.marche.it/, last access: 28 October 2026). To account for the difference between the station locations and the model grid point, the simulated precipitation is evaluated using two distinct approaches: a direct point interpolation at the station coordinates, and a neighborhood method that extracts the maximum accumulation at each time step within a 10 km×10 km box centered on the station. Direct point evaluation misses the intensity of the peak rainfall even if the location of the simulated storm is correctly reproduced, being shifted by just a few kilometers. In contrast, the neighborhood approach removes errors due to small spatial offsets and provides a more reliable estimate of the actual storm intensity.
Looking at the temporal evolution, observational data indicate that the main convective phase lasted approximately 6 h, from 14:00 to 20:00 UTC. The model captures this temporal window reasonably well, simulating heavy rainfall between 15:00–19:00 UTC, although the onset of the event is delayed by about 1–2 h across the domain. In terms of intensity, the 10 km×10 km simulation performs well during the initial peak between 16:00–17:00 UTC, reaching maximum hourly rates of 50 mm h−1, which is comparable to the observed 62 mm h−1 at Cantiano. However, after 17:00 UTC, the simulated precipitation rates decay much more rapidly than the observed rainfall, so that the absence of a weaker second precipitation event in the evening is partly responsible for the underestimation of the 24 h total accumulation.
To investigate the physical mechanisms driving this premature convective decay, an analysis of the near-surface thermodynamic fields was conducted. For the 2 m temperature (T2 m) and 2 m relative humidity (RH2 m) analysis, data from 104 stations within domain d02 (which covers the entire Marche region) and 54 stations within domain d03 (covering only the portion of the region directly affected by the rainfall) were utilized. The validated station observations used for this comparison were retrieved from the official platform of the Civil Protection Department of the Marche Region (http://app.protezionecivile.marche.it/, last access: 28 October 2026) and basic quality control procedures were applied to ensure data consistency and filter out anomalies. Figure 8 compares the observed and simulated T2 m and RH2 m spatial maps at 18:00 UTC (panels a and b), alongside their temporal evolution (panels c and d) for selected stations (Arcevia, Cantiano, and Colle).
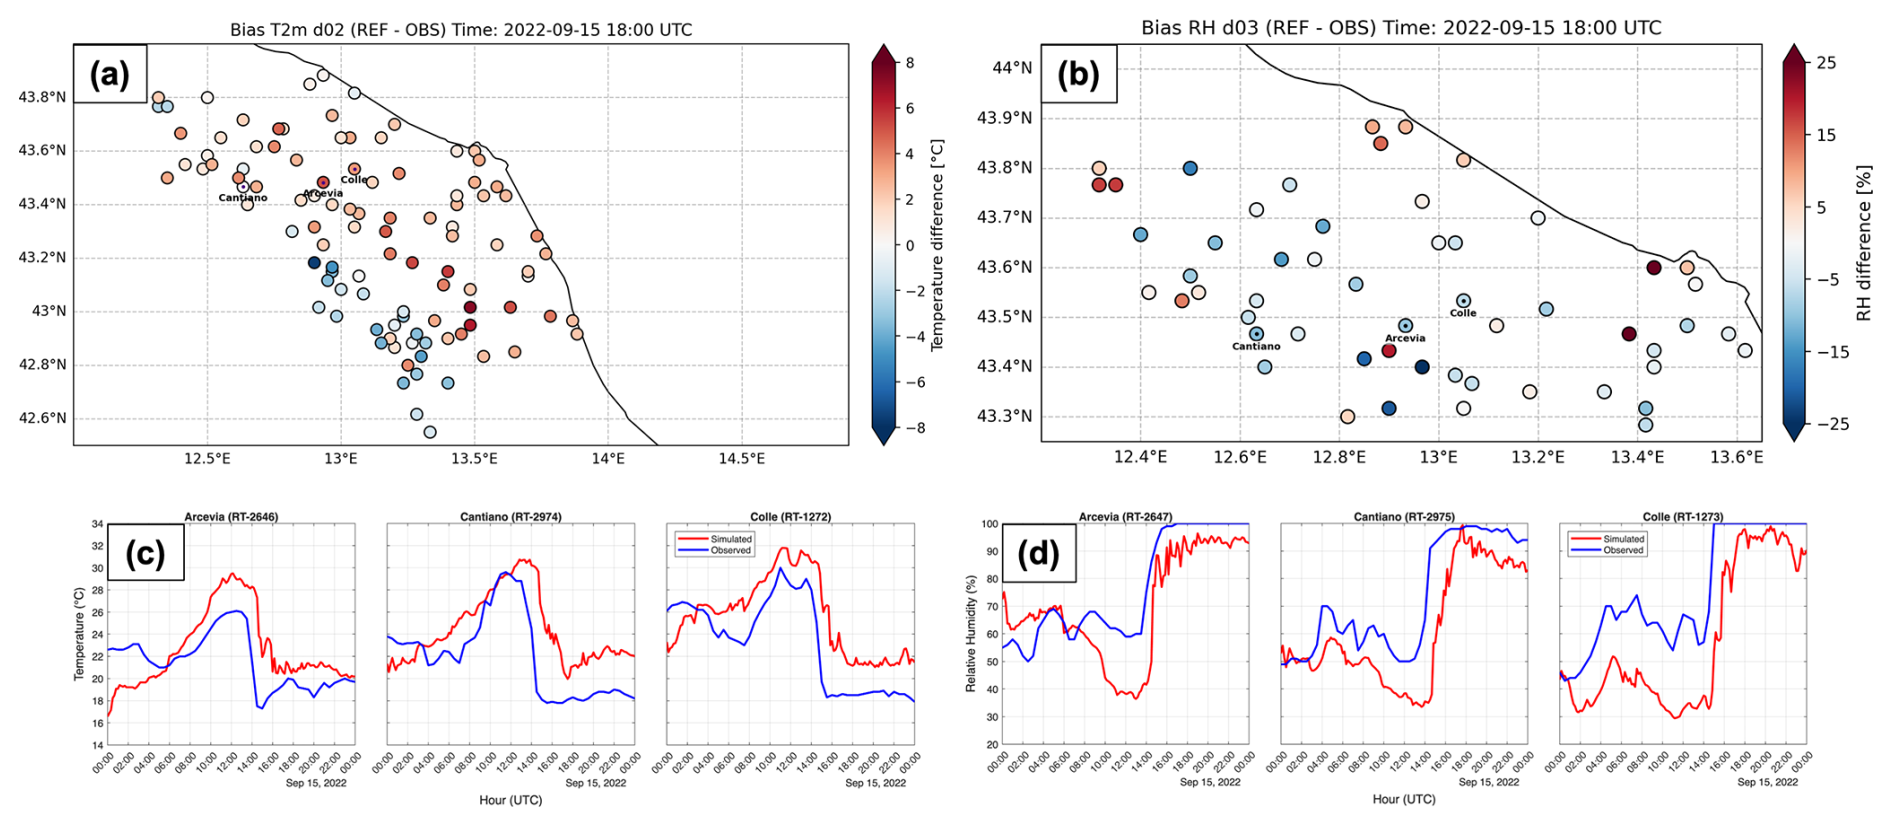
Figure 8Comparison of observed and simulated (REF) near-surface (a) T2 m over a portion of the d02 domain and (b) RH2 m over the d03 domain at 18:00 UTC. Temporal evolution of (c) T2 m and (d) RH2 m comparing observations and model outputs (REF) for the selected stations of Arcevia, Cantiano, and Colle.
The analysis reveals that the rapid decay of precipitation is related to near-surface thermodynamic biases. The simulation exhibits a significantly warmer environment, with temperatures remaining up to 5–6 °C higher than observations during the decay phase.
This warm bias directly affects the near-surface relative humidity over time (Fig. 8d). Due to the higher simulated temperatures, the saturation vapor pressure increases, which in turn reduces the relative humidity (considering that the bias in specific humidity is small). Consequently, the simulated environment fails to maintain saturation. The drop in RH2 m represents a physical transition from a saturated state (necessary to sustain condensation and precipitation) to a sub-saturated environment that inhibits rainfall generation. This underestimation is further illustrated by comparing the 24 h maximum cumulative rainfall in the control simulation (REF) – evaluated both at the station point (REFpoint) and using a 10 km neighborhood maximum (REF10 km) – with rain gauge observations (Table 3).
Table 3Comparison of 24 h maximum cumulative rainfall and corresponding percentage errors between the control simulation evaluated at the nearest grid point (REFpoint), the maximum value within the 10 km neighborhood (REF10 km), and weather station observations (OBS) for selected locations.
In addition to the reference run, sensitivity tests using different forcing datasets (e.g. ERA5, GFS, ECMWF), as detailed in Sect. 5, highlighted marked differences in the spatial distribution and amount of precipitation, emphasizing a strong sensitivity to initial and boundary conditions and the intrinsic low predictability of this case study.
4.3.2 Triggering Mechanism and Thermodynamic Instability
The interaction between the low-level flow and the complex topography is shown in Fig. 9a, where the 10 m wind field shows the effect of the Apennines in deflecting the impinging air. This disturbance produces a convergence line at 950 hPa (Fig. 9b) oriented SW–NE. Its leading edge originates downwind of Mount Amiata (approx. 42.9° N, 11.6° E) and extends northeastward, reaching the Apennine ridge. This convergence line is located just upstream of the main rainband, thus it reasonably contributed to the uplift of the incoming moist air masses up to the LFC.
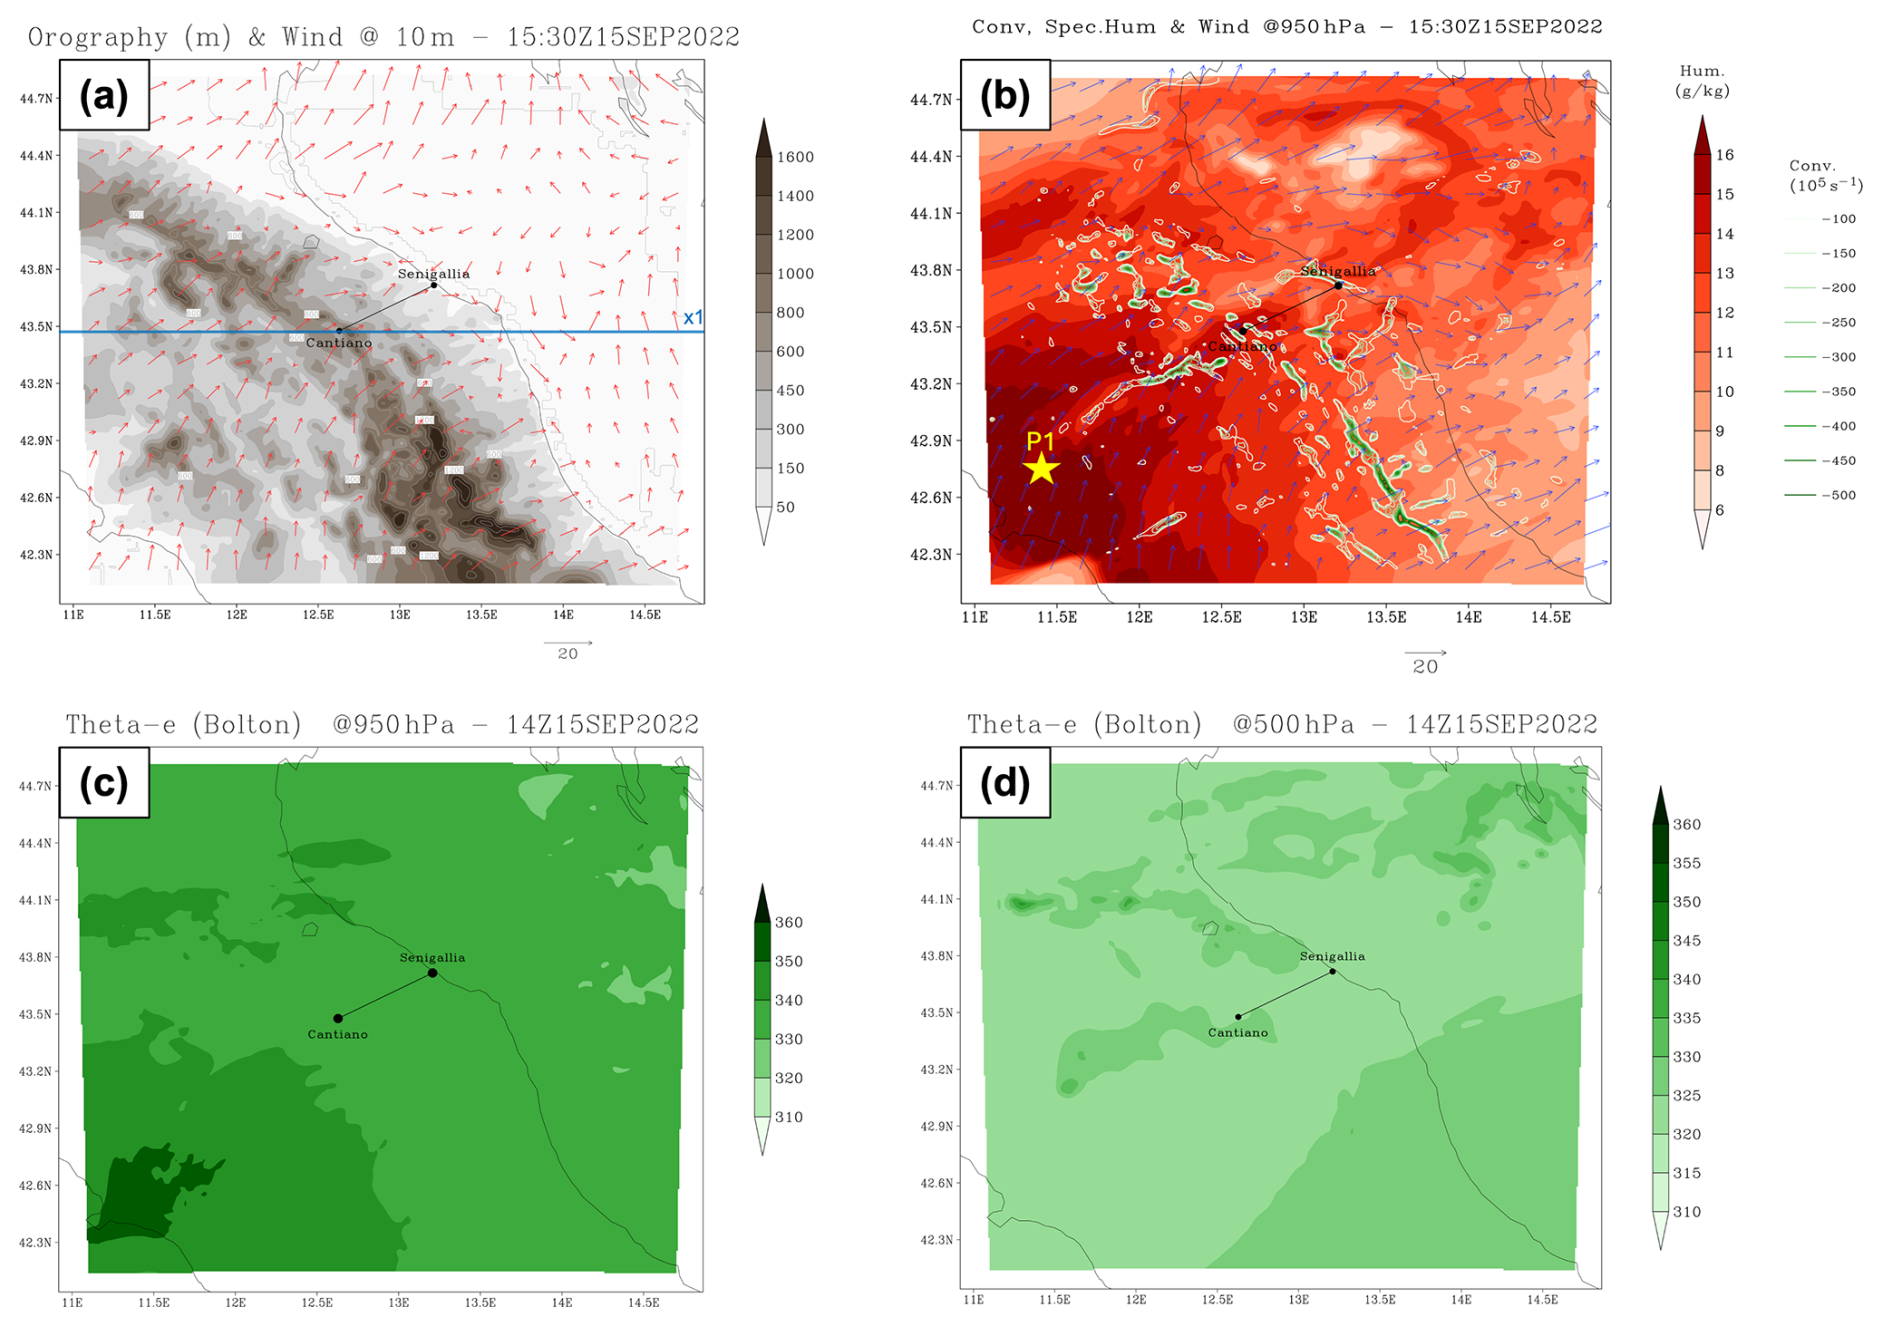
Figure 9Mesoscale analysis over the d02 domain on 15 September 2022. Top row (15:30 UTC): (a) 10 m wind vectors and orography; the blue straight line identifies the location of the cross-section shown in Fig. 10a and b. (b) 950 hPa convergence (green contours), specific humidity (red shaded), and wind vectors. The yellow marker indicates the location selected for the thermodynamic analysis: P1 (42.7° N, 11.4° E), representative of the upstream southerly inflow near Mt. Amiata. Bottom row (14:00 UTC): Equivalent potential temperature (θe), calculated using the approximation by Bolton (1980), at (c) 950 hPa (green shaded) and (d) 500 hPa (green shaded).
The persistence of the pattern for several hours contributed to the continuous regeneration of the system. The latter was also sustained by the rich moisture supply. The specific humidity field at 950 hPa (Fig. 9b) reveals a distinct tongue of moist air (specific humidity >15 g kg−1) advected directly into the precipitation area by the southwesterly flow.
From a thermodynamic perspective, the equivalent potential temperature (θe) maps in Fig. 9c and d clearly illustrate a condition of potential instability (), with the highest values of 950 hPa θe in the southwestern corner of the domain (up to 351 K), just upstream of the rainband, and lower values (of about 315–320 K) at 500 hPa, nearly uniform over the region.
4.3.3 Orographic Forcing and Flow Dynamics
The vertical structure is further detailed in the vertical cross-sections presented in Fig. 10, taken at a fixed latitude of 43.48° N nearly parallel to the convective line. The potential temperature (on 15 September at 15:00 UTC, Fig. 10a) reveals undulations of the isentropic surfaces, associated with the stable (dry) stratification of the lower troposphere in response to the orographic forcing, suggesting the presence of gravity waves triggered by the interaction of the flow with the orography (Fig. 10c). Large values of vertical velocity (w) identify the intense updrafts associated with the convective cells (Fig. 10b). Furthermore, θe values (Fig. 10b) highlight the presence of convective instability, with a core of high-θe air in the lower levels surmounted by lower values above. The orographically induced wave patterns likely contributed to enhancing the vertical lift, allowing low-level air parcels to reach the level of free convection, thus favoring the triggering and persistence of the convective cells just downstream of the crests in the gravity wave patterns.
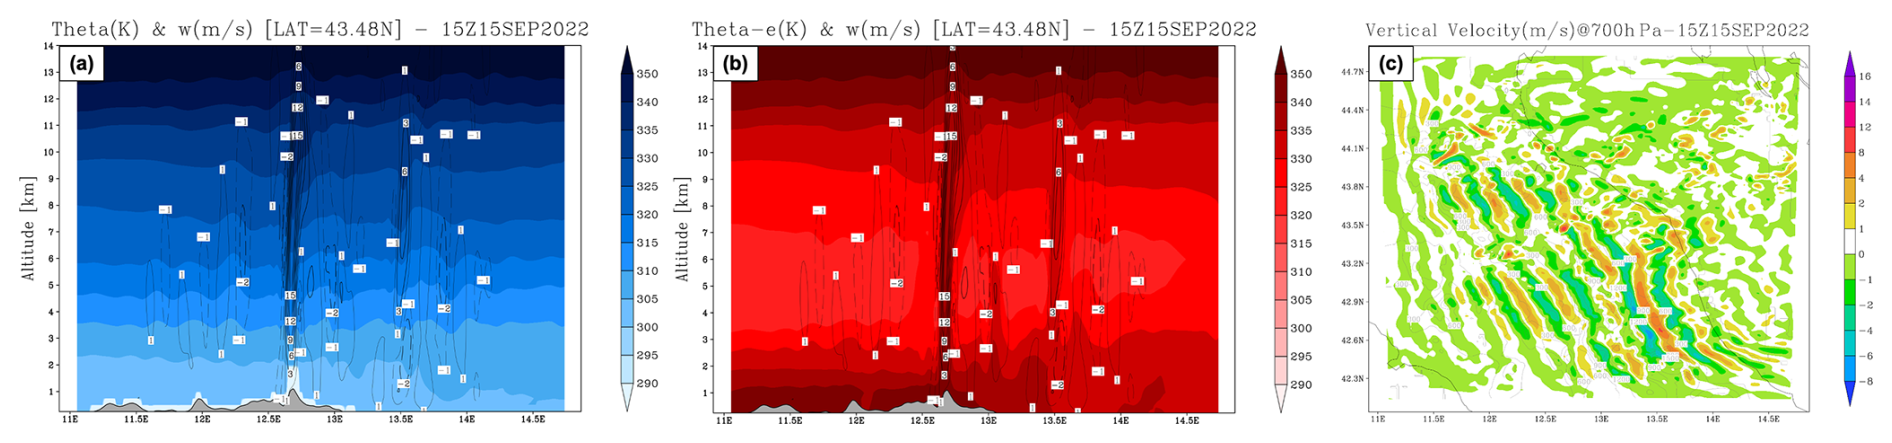
Figure 10Thermodynamic structure and orographic forcing at 15:00 UTC over the d02 domain on 15 September 2022. (a) and (b) Vertical cross-sections along latitude 43.48° N (transect in Fig. 9a) showing (a) θ (K) with vertical velocity w contours (solid for positive, dashed for negative) and (b) θe (K). (c) Vertical velocity (w) field at 700 hPa.
The simulated vertical velocity field at 700 hPa (Fig. 10c) reveals a well-defined pattern of alternating ascending and descending motions, with a characteristic horizontal wavelength estimated at approximately 10–15 km. These features, positioned above and on the leeward side of the main orographic barriers, and perpendicular to the main WSW midlevel flow, are a characteristic signature of intense wind responsible for orographic gravity waves triggered as air parcels are forced upward by the terrain and subsequently oscillate in the presence of (dry) stable conditions.
4.3.4 Sensitivity to Orographic Forcing
To further investigate the specific role of the Apennine orography in sustaining convection, two sensitivity experiments were performed by reducing the orography of central Apennines (setting terrain height to 50 % and 0 %) within the area defined by coordinates 42.0–45.0° N and 10.5–15.0° E. The modifications were applied to the static geography fields across all nested domains prior to model initialization. Results (see Fig. 11a and b) indicate that the precipitation maintains a similar orientation as in the control simulation, but the rainbands are shifted slightly northeastward. Interestingly, the atmospheric response is highly non-linear: while in the 0 % experiment the rainfall intensity is severely reduced, with peak accumulations decreased by approximately 60 %, the 50 % reduction scenario maintains peak accumulations close to the control run (and reduction of the peak by approximately 25 %). An analysis of the low-level fields (see Fig. 11c and d) shows that the reduction or absence of the mountain barrier allows the moist southerly inflow, characterized by high specific humidity, to penetrate further inland and eastward undisturbed. The orography modulates the moisture advection, anticipating by 1 h the moisture maximum over the city of Cantiano in the two simulations with reduced/absent orography. Convection is still triggered by the convergence between this warm, moist flow and the westerly currents; however, the convergence line is shifted northeastward, triggered along the northern edge of the high θe tongue. This result reaffirms that the mesoscale flow dynamics determine the storm's triggering and positioning, whereas the orography is essential for anchoring the system and providing the mechanical lift. While vertical velocity fields suggest mountain wave activity, the terrain mainly acts as a barrier forcing low-level convergence and uplift.
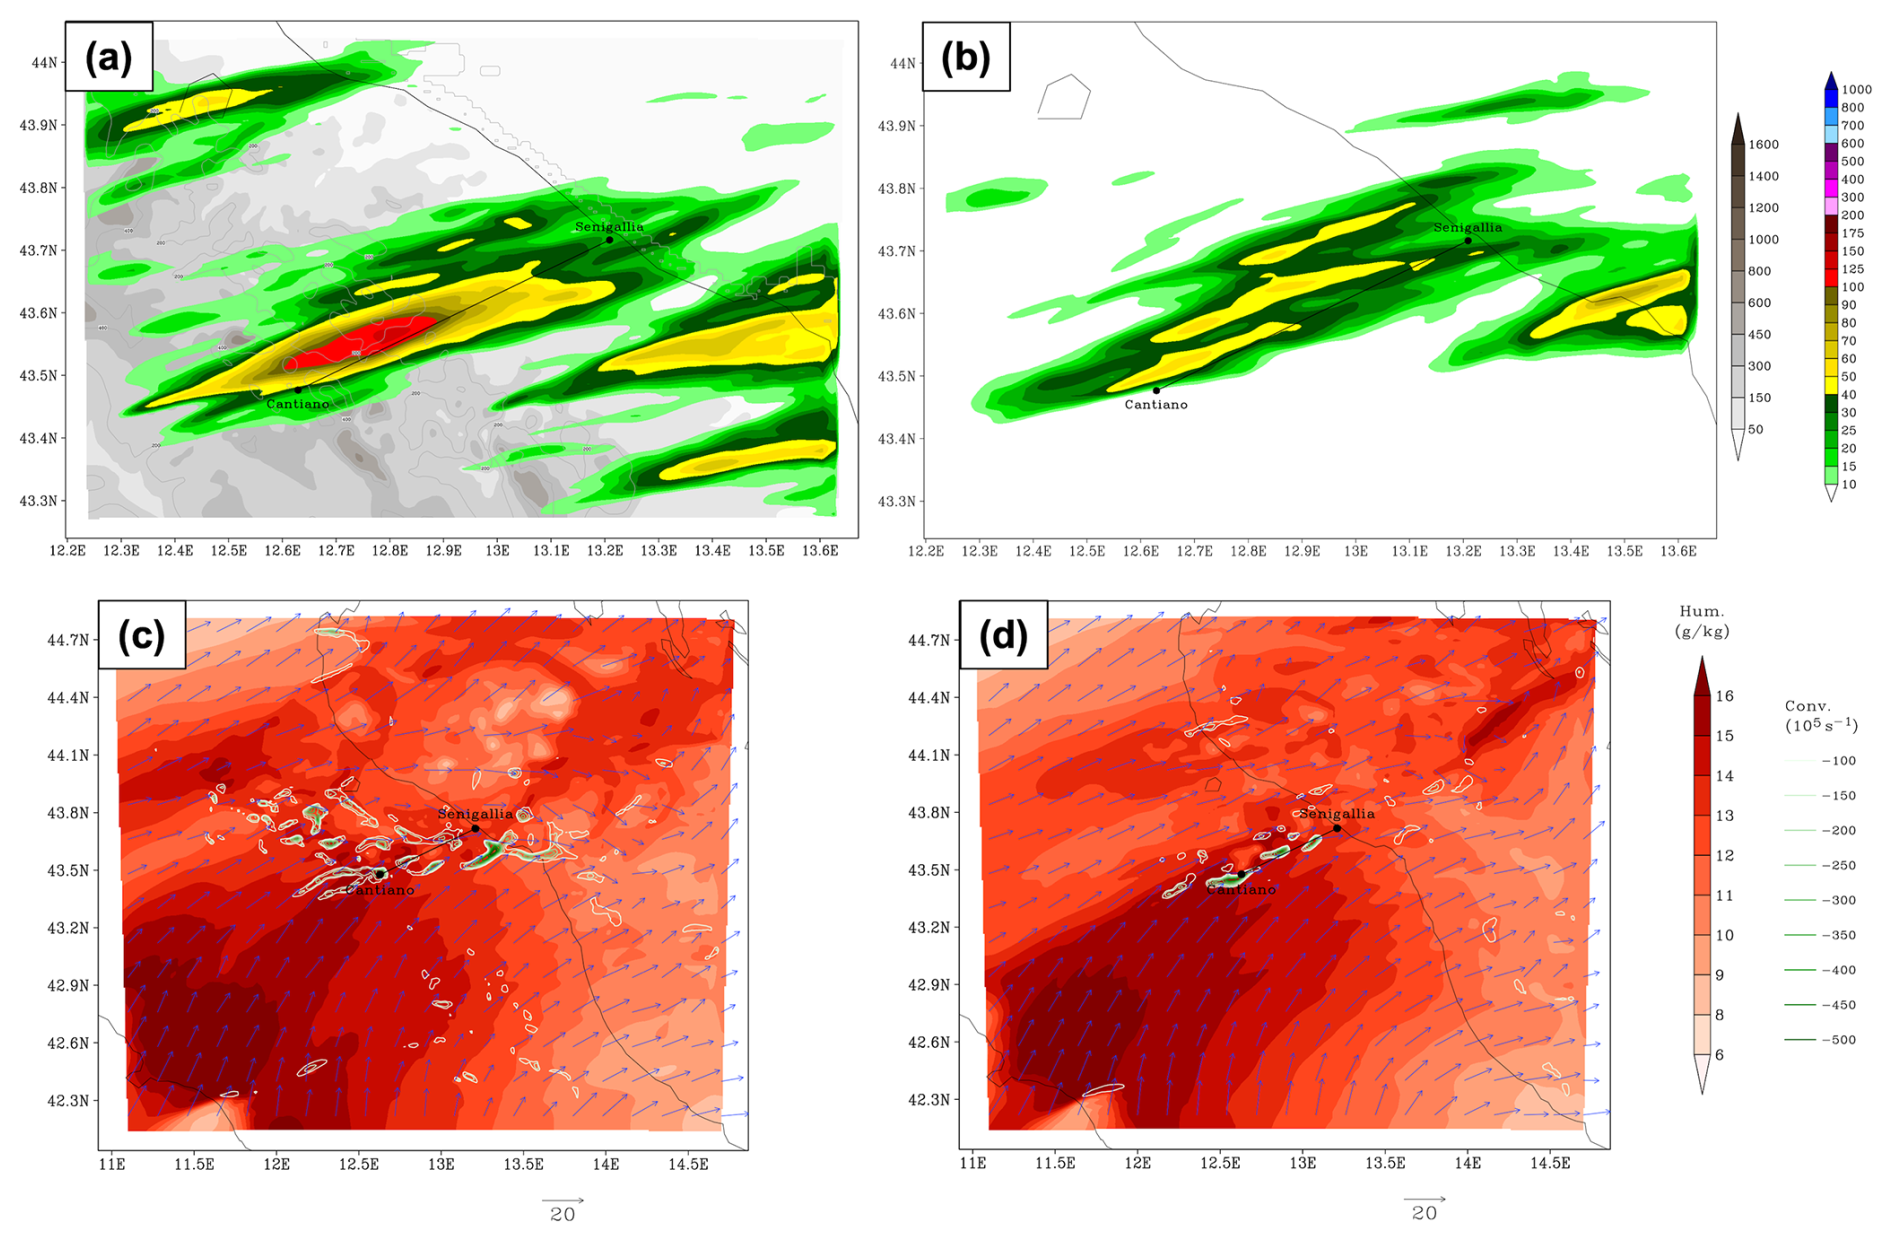
Figure 11Top row: 24 h accumulated precipitation simulated by the WRF model over the d03 domain (ending at 00:00 UTC on 16 September 2022) for the 50 % (a) and 0 % (b) orography tests. Bottom row: low-level convergence (green contours), specific humidity (red shaded) and wind vectors at 950 hPa for the 50 % (c) and 0 % (d) orography tests.
4.3.5 Moisture Flux Analysis
To assess the moisture availability fueling the precipitation, the Integrated Vapor Transport (IVT) and Precipitable Water (PW) were diagnosed. These parameters are relevant for the identification of atmospheric rivers (e.g. Ralph and Dettinger, 2011), which are often observed in correspondence with heavy rain events in the southern Alpine region (Davolio et al., 2020). The magnitude of the IVT vector was calculated by vertically integrating the product of specific humidity (q) and horizontal wind components (u,v) from 1000 to 300 hPa:
Similarly, Precipitable Water (PW) was computed by integrating the specific humidity from the surface to 300 hPa:
Figure 12a illustrates the sustained moisture flux directed towards the Marche region at 15:00 UTC, providing the fuel for heavy precipitation. The highest water vapor transport is concentrated in the area of highest precipitation, stressing the importance of the high humidity content, characterized by PW values exceeding 40–50 mm along the coast and the Apennine foothills (Fig. 12b), in promoting convection, enhancing CAPE and reducing CIN.
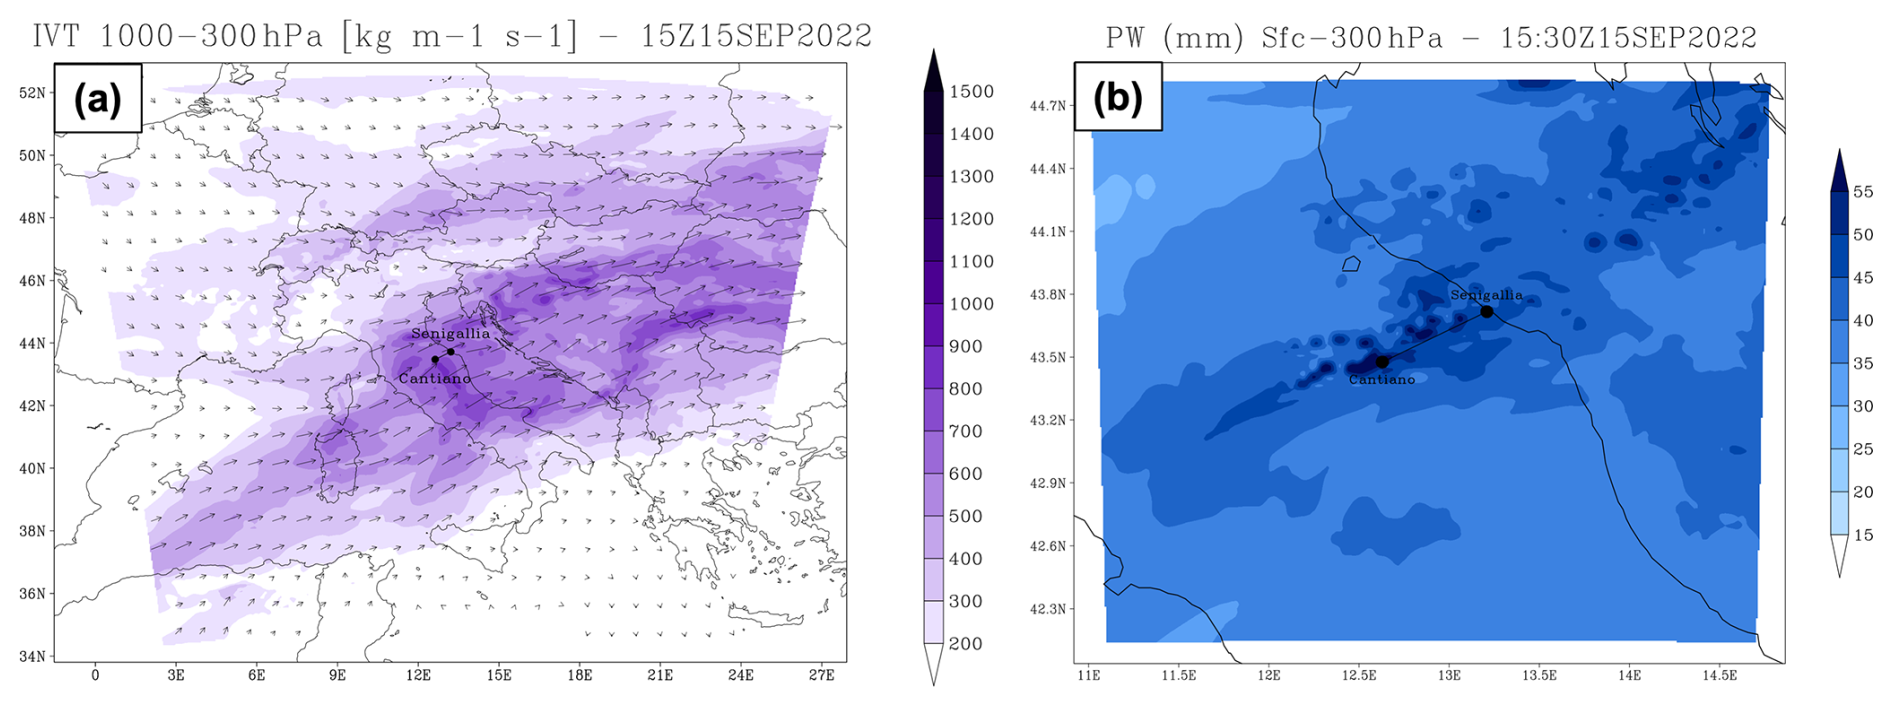
Figure 12Moisture analysis on 15 September 2022: (a) Integrated Vapor Transport (IVT) [] at 15:00 UTC (d01) and (b) Precipitable Water (PW) [mm] at 15:30 UTC (d02).
4.3.6 Thermodynamic Environment and Instability
To further analyze the evolution of the airmass reaching the Apennines, the thermodynamic vertical profiles were analyzed at the location P1 (42.7° N, 11.4° E, see the star marker in Fig. 9b), representative of the upstream flow near Mt. Amiata. At 05:00 UTC (Fig. 13a), the upstream profile exhibits moderate-to-strong instability but this is suppressed by a significant inhibition, similar to the observed sounding in Pratica di Mare at 12:00 UTC (Fig. 5b). By 16:00 UTC, the simulated profile indicates the marked erosion of the thermal inversion mainly due to the arrival of cooler air in the low-to-mid levels (Fig. 13b).
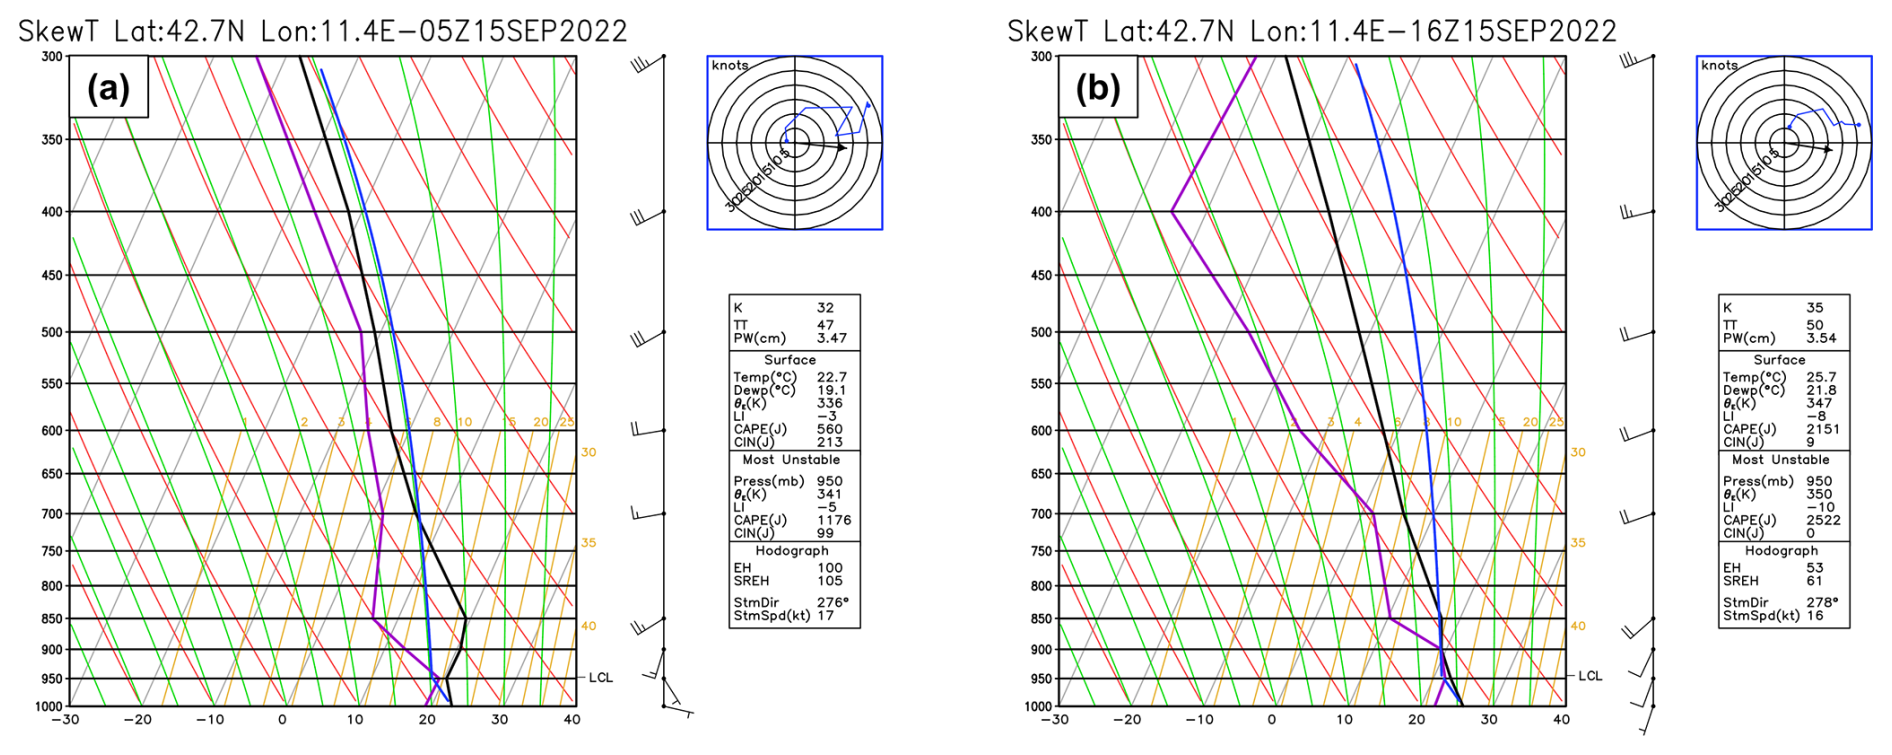
Figure 13Simulated upstream vertical profile at the location P1 (near Mt. Amiata) at (a) 05:00 UTC and (b) 16:00 UTC on 15 September 2022.
The potential for severe convection is confirmed by the values and evolution of the Most Unstable CAPE and CIN fields from 08:00 to 15:30 UTC (Fig. 14). A distinct tongue of highly unstable air, with MUCAPE values exceeding 3000–3500 J kg−1, progressively extends from the Tyrrhenian Sea towards the central Apennines, spatially collocated with the high-θe tongue observed in the low levels. The temporal evolution indicates that these high instability values progressively built up from the morning, while convective inhibition – initially present – was gradually eroded in the afternoon, allowing for the release of the accumulated energy.
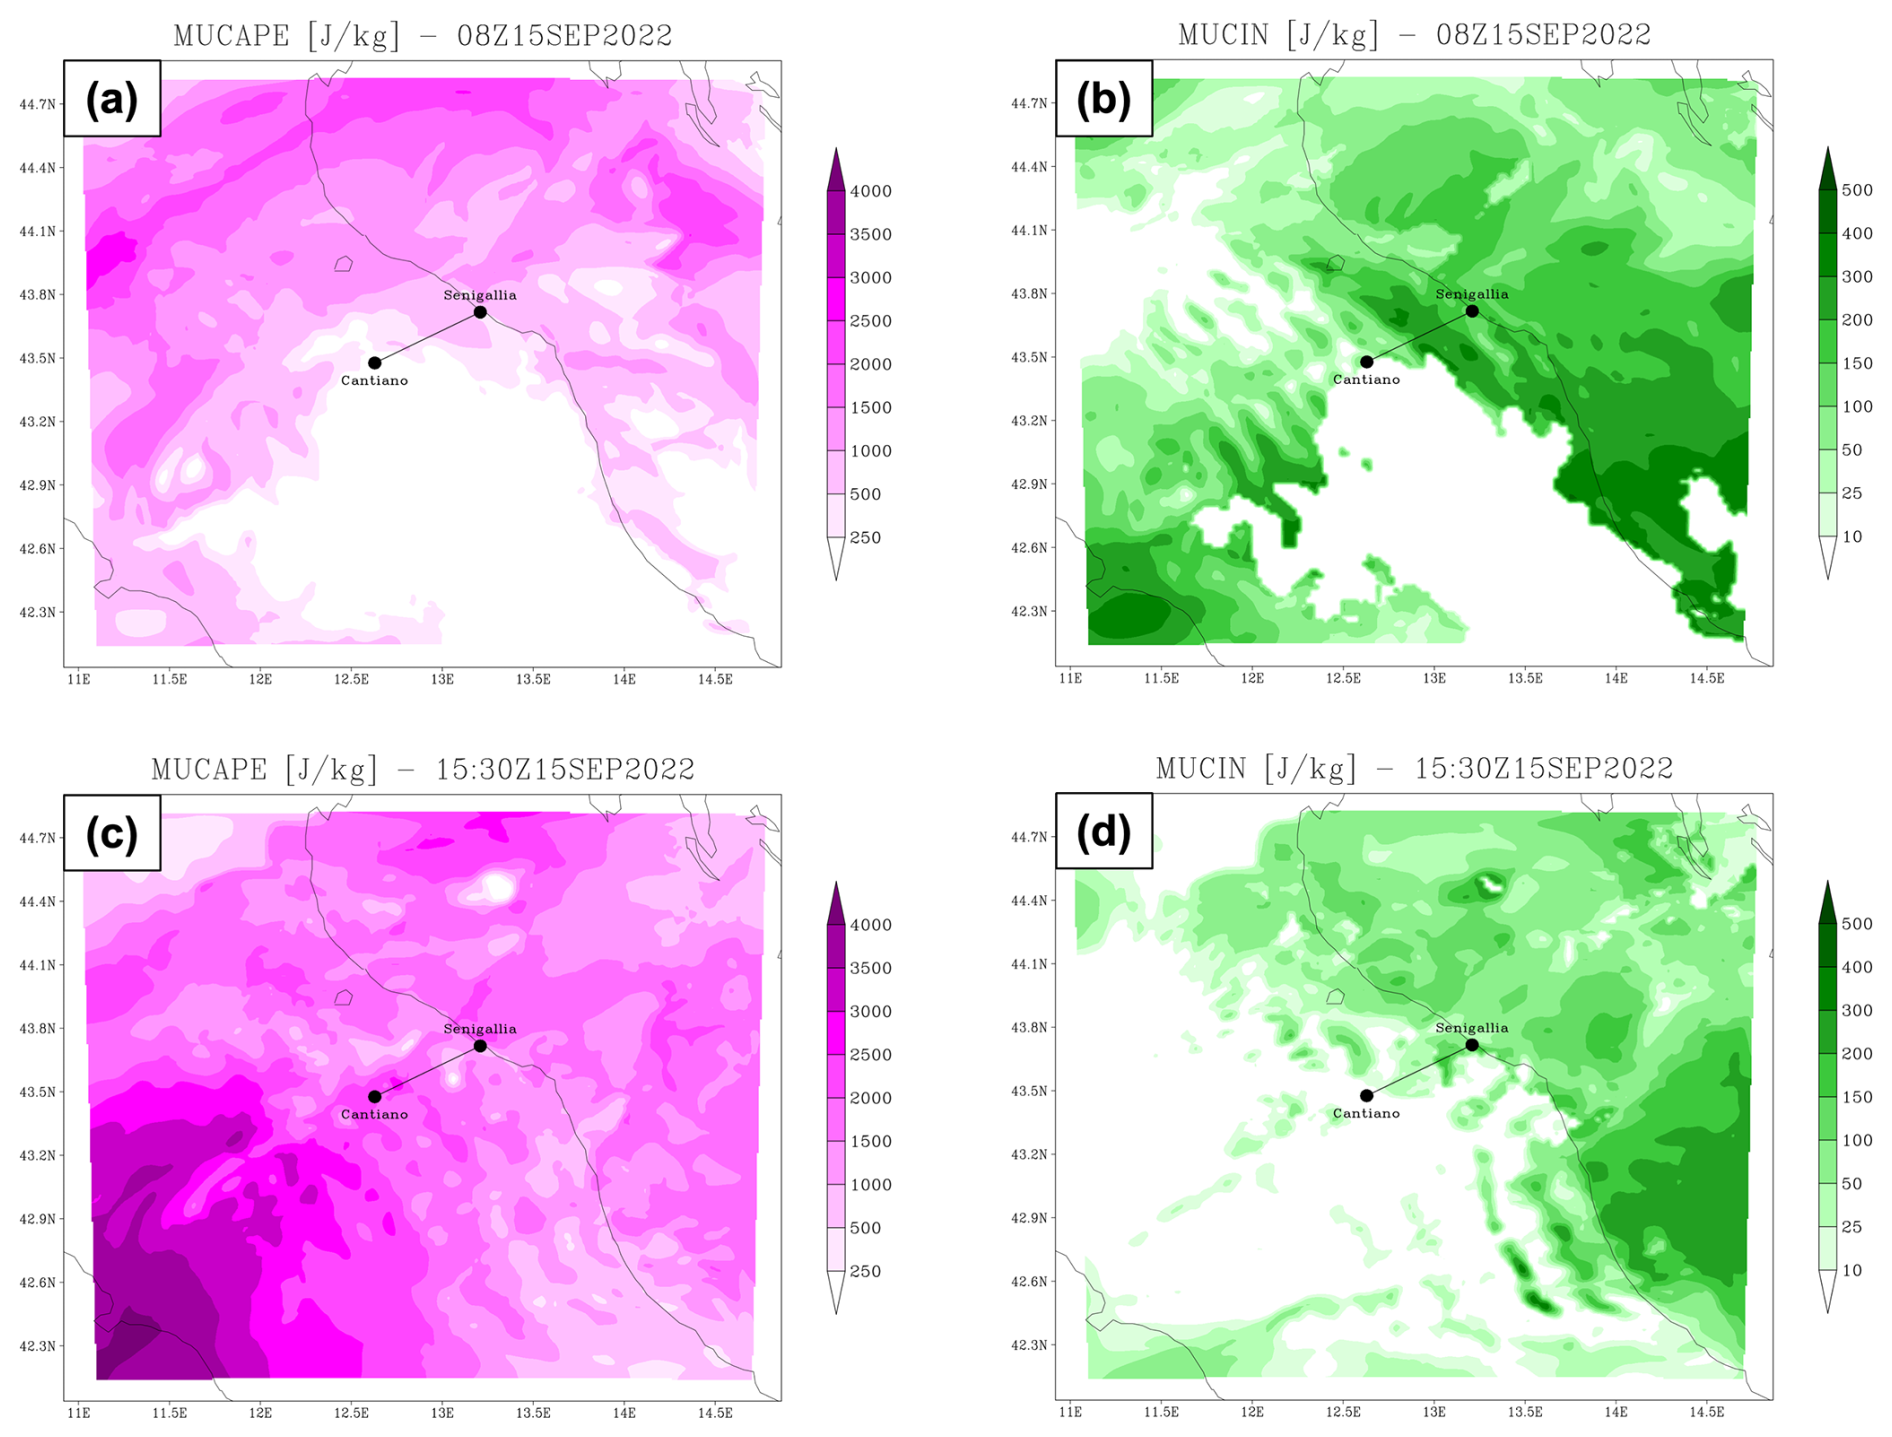
Figure 14MUCAPE and MUCIN over the d02 domain on 15 September 2022. Top row: (a) Most unstable CAPE and (b) CIN at 08:00 UTC. Bottom row: (c) Most unstable CAPE and (d) CIN at 15:30 UTC.
To evaluate the model's sensitivity to initial conditions (I.C.), boundary conditions (B.C.), and physical parameterizations, several sensitivity experiments were performed. The configurations are summarized in Table 4, and the resulting 24 h accumulated precipitation is shown in Fig. 15. Figure 15a represents the “reference simulation” (REF) (initialized at 00:00 UTC, 15 September and forced with NCEP/GDAS analysis and forecast fields as explained in Sect. 2), which is the control run extensively discussed in the previous sections. The authors believe that this sensitivity analysis is relevant to understand the spread in the model outputs at a relatively local scale. Indeed, dramatic differences emerge in terms of precipitation amount and distribution, as shown in Fig. 15.
Table 4Summary of the WRF sensitivity experiments. All simulations share the same domains and grid spacing (10, 2, 0.66 km). ΔtBC indicates the update frequency of the lateral boundary conditions. All simulations share the same physical parameterizations, except for the “Modified physics” experiment (panel d). This specific run employs the Thompson microphysics scheme (Thompson et al., 2008), the Kain–Fritsch cumulus parameterization (Kain, 2004), the Dudhia shortwave and RRTM longwave radiation schemes (Dudhia, 1989; Mlawer et al., 1997), and the Unified Noah Land Surface Model (Tewari et al., 2004).
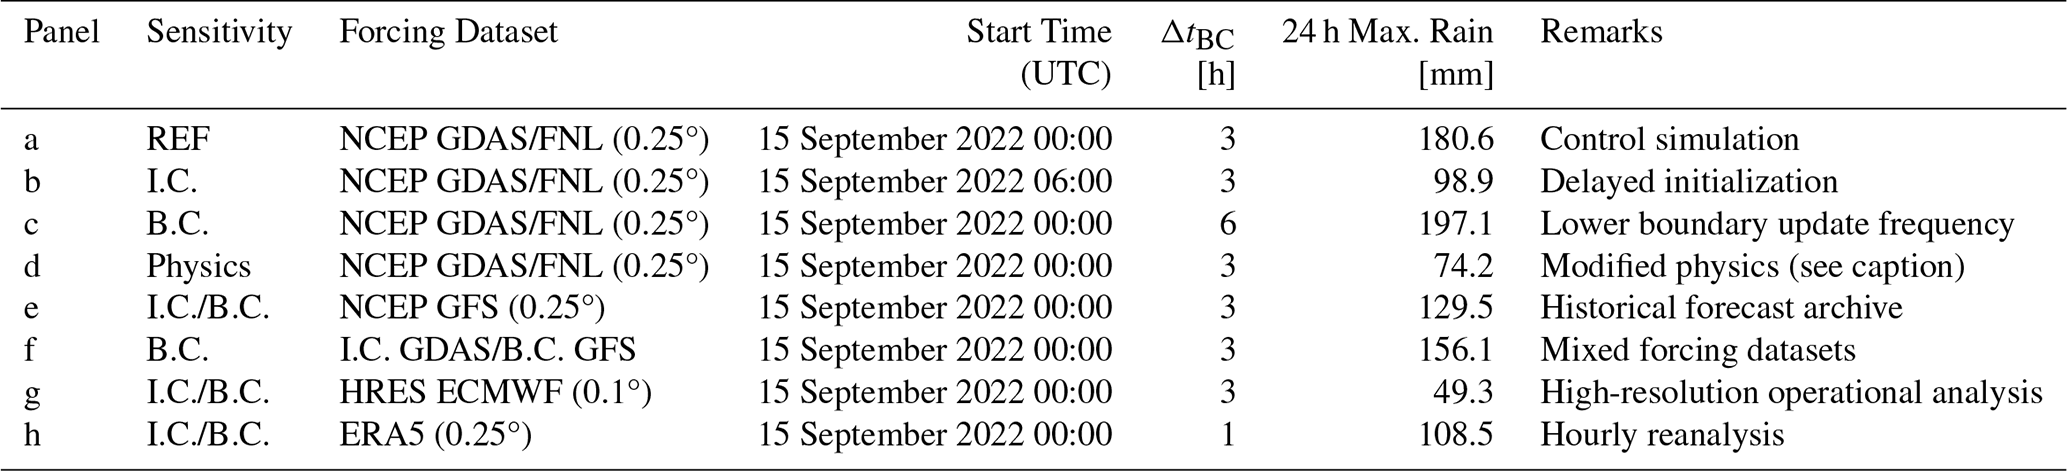
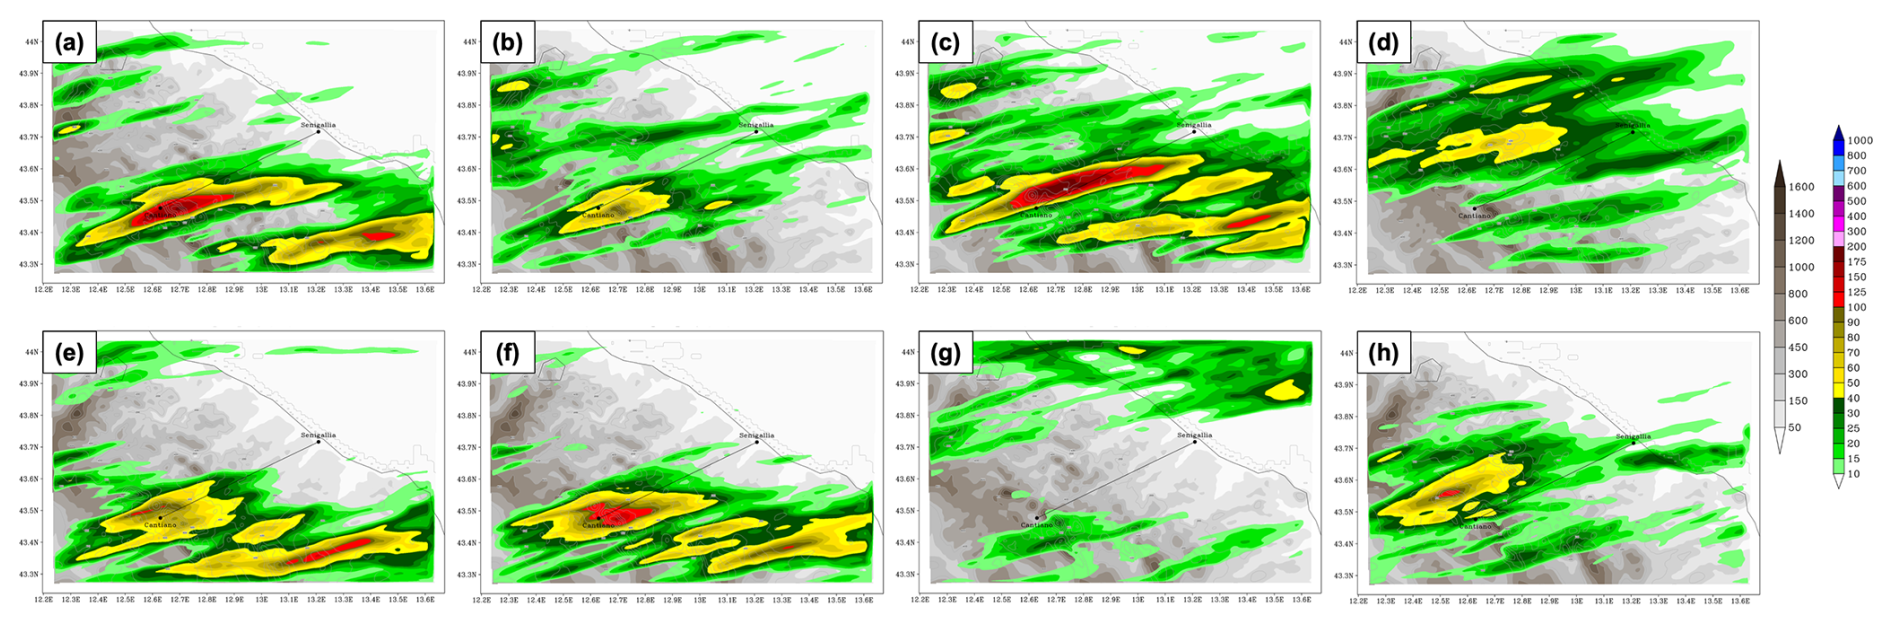
Figure 15Comparison of 24 h accumulated rainfall for the sensitivity experiments over the d03 domain. The panels (a) through (h) correspond to the configurations detailed in Table 4.
A comparison between the REF simulation (Fig. 15a) and the run initialized 6 h later (Fig. 15b) reveals a significant decrease in the accumulated rainfall over Cantiano and the loss of the secondary precipitation band located further south. This result illustrates the key role of the initial conditions in correctly modulating the rainfall in the areas affected by the heavy rainfall event. Conversely, the third run, using boundary conditions updated only every 6 h (Fig. 15c) increases the rainfall intensity and extends the area affected by intense rainfall, but erroneously displaces the precipitation peak north of Cantiano. Overall, these latter changes appear relatively minor, as the high impact of the event is clearly identified in the region, although the location is not perfectly represented. Furthermore, the choice of the parameterization schemes plays a crucial role in the spatial distribution and intensity of the precipitation; as shown in Fig. 15d, changing the model physics package – by simultaneously modifying the cumulus convection, microphysics, radiation, and land surface schemes – significantly alters the precipitation: this sensitivity run shifts the rainfall pattern northward and decreases the rainfall amount compared to the control simulation. These results suggest a significant sensitivity to the initial conditions and the model physics, making a limited area model ensemble approach (including both the sensitivity to initial conditions and model physics) highly recommended to correctly evaluate the possibility of severe events affecting a limited area. This is especially true for this specific event for which most real-time simulations missed the severity of the rainfall.
Using the NCEP GFS historical archive as I.C. and B.C. (Fig. 15e) – thus changing both the initial and boundary conditions with respect to REF – results in a primary precipitation band that is less elongated in the southwest–northeast direction, with lower accumulation peaks compared to the REF simulation; conversely, the southern rainband appears more intense and longer than in REF. To isolate the impact of the initial and boundary conditions alone, an additional simulation was performed using the REF initial conditions (GDAS dataset) but driven by GFS forecast boundary conditions (Fig. 15f). Compared to Fig. 15e (thus exploring the effect of changing the I.C.), this configuration produces a less elongated northern rainband and more concentrated precipitation near Cantiano, while the southern rainband appears weaker. Comparing with Fig. 15a (thus exploring the effect of changing the B.C. with respect to REF), the impact of the boundary condition appears a secondary one, although not negligible.
Finally, Fig. 15g and h demonstrate that driving the model with high-resolution (HRES) ECMWF operational data and ERA5 reanalysis, respectively, fails to accurately reproduce the accumulated precipitation for this case. The ECMWF-driven run completely shifts the precipitation pattern to the north of the Adriatic coast (offshore).
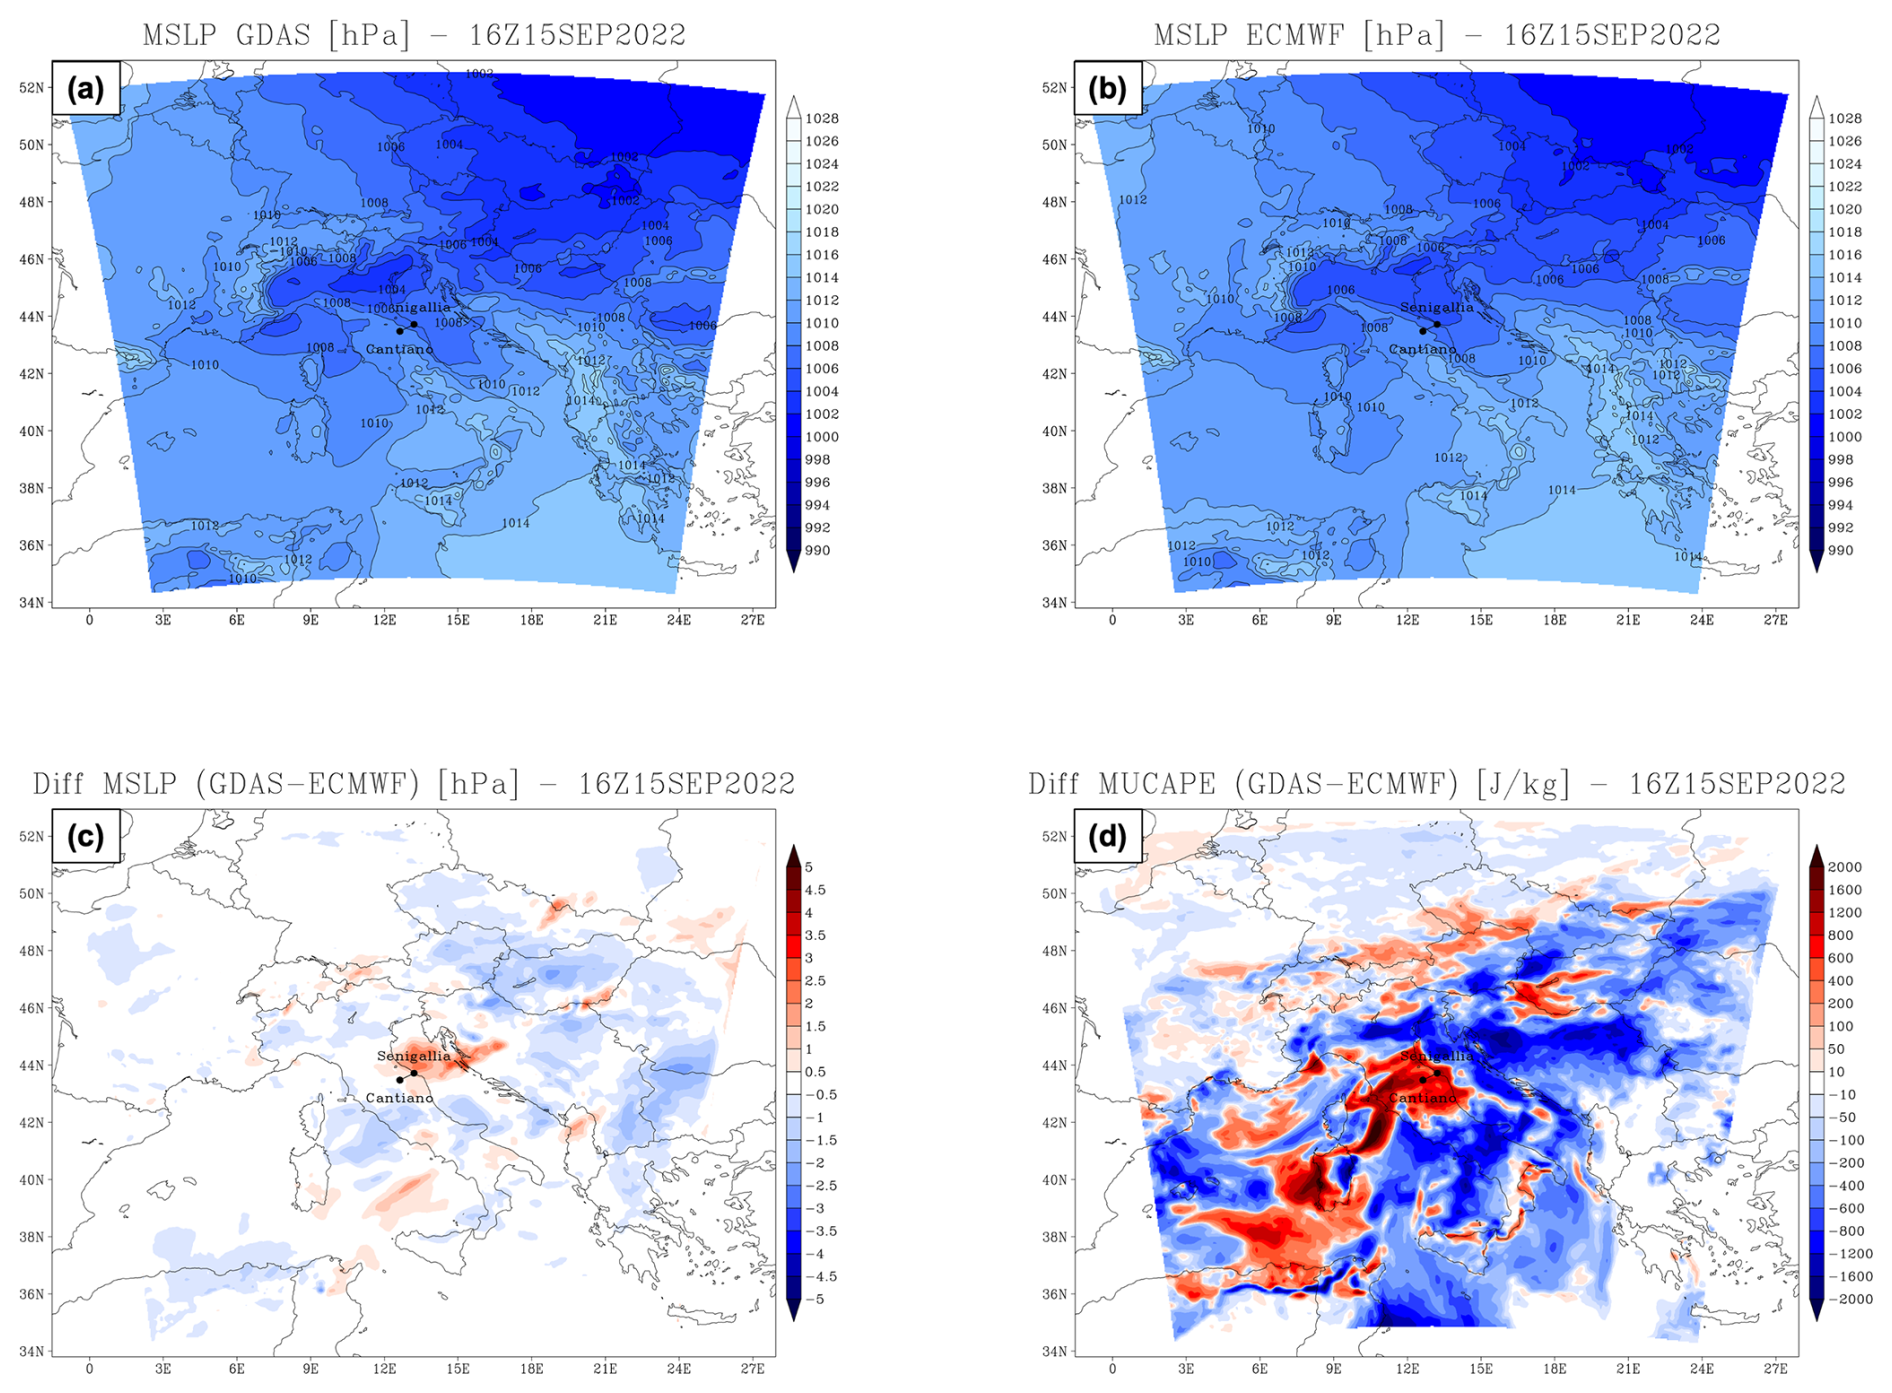
Figure 16Mean Sea Level Pressure (MSLP) [hPa] at 16:00 UTC on 15 September 2022 for (a) the REF simulation and (b) the ECMWF simulation. Differences (REF minus ECMWF) at the same time are shown for (c) MSLP [hPa] and (d) Most Unstable CAPE (MUCAPE) [J kg−1].
To understand this behavior, it is important to clarify the nature of the forcing datasets. The ECMWF initial and boundary conditions were provided as operational data on 20 standard pressure levels, whereas GDAS analyses included additional data and were available on 34 pressure levels. The coarser vertical resolution of the ECMWF fields might limit the accurate representation of the vertical thermodynamic structure, including the boundary layer and upper-troposphere dynamics. In contrast, the ERA5-driven run fails to generate the elongated banded structure, producing a weaker and incorrectly localized peak.
5.1 Identification of the Physical Drivers
To identify the physical factors responsible for the different simulation behavior, a comparative analysis of selected meteorological fields was conducted between the reference simulation (REF) and one of the runs missing the correct localization and intensity of the rainbands (i.e. the ECMWF-driven simulation). By comparing these two very different cases, the changes in the driving physical mechanisms are more pronounced.
The main discrepancies between the two simulations are localized in the lower troposphere. Specifically, in the afternoon the REF simulation exhibits a stronger meridional wind component over the area of interest compared to the ECMWF-driven run. The REF simulation also shows an enhancement in the low-level equivalent potential temperature (θe), Precipitable Water (PW), and Integrated Vapor Transport (IVT) during the afternoon, due to a greater transport of warm and moist air over the Marche region (see Fig. S2 in the Supplement). Conversely, the ECMWF-driven run anticipates the maxima of these fields during the morning, causing a temporal misalignment between the large-scale forcing and the mesoscale triggers.
This discrepancy in the low-level wind pattern is driven by differences in the Mean Sea Level Pressure (MSLP) fields (Fig. 16a–c). Specifically, the REF simulation (Fig. 16a) exhibits a stronger pressure gradient, established between a distinct low-pressure minimum near Venice and higher values over the northern Adriatic coast. This specific configuration drives the southerly flow over central Italy, while the same gradient is less apparent in the ECMWF-driven simulation (Fig. 16b).
These dynamical differences affect the thermodynamic environment. Figure 16d shows the spatial difference in MUCAPE between the REF and ECMWF simulations. The REF run produces higher instability over the central Apennines and the Marche region, while the ECMWF simulation shifts the peaks eastward.
While mid-tropospheric fields (500 hPa geopotential height and 500 hPa θe) are broadly similar in the driving datasets, clear differences appear in the lower troposphere (850 hPa). The initial and boundary fields (Fig. S3 in the Supplement) reveal a timing mismatch in lower-tropospheric moisture and temperature throughout the event. From initialization up to 06:00 UTC, the run driven by ECMWF forcing simulates warmer temperatures (from +1 to +3 °C) and higher relative humidity (from +10 % to +40 %) over central Italy than in REF, alongside lower 850 hPa geopotential height ( to −20 gpm), suggesting an earlier transit of the trough axis compared to REF. Therefore, during the time period when convective initiation starts (12:00–18:00 UTC) the pattern reverses: REF becomes warmer (from +1 to +3 °C) and wetter (from +20 % to +40 % higher relative humidity) directly over the target area. Meanwhile, Sea Surface Temperature (SST) differences remain small (∼0.5–1.0 °C) and play only a secondary role; although REF exhibits slightly higher temperatures in the western Mediterranean and Alboran Sea, these features appear too far from our target domain to fully explain the different simulation outcomes. These results highlight the model sensitivity to the low-level forcing dataset, showing that differences in timing and location of moisture transport relative to the Apennine topography may contribute to significant changes in the simulated rainfall.
The analysis of the flood of 15 September 2022 in the Marche region highlights that the catastrophic event emerged from the simultaneous occurrence of different atmospheric forcings across multiple scales. Through the use of high-resolution WRF model simulations and observational data, this study identifies the key ingredients that caused the initiation and maintenance of the stationary convective system.
At the synoptic scale, the continuous transport of humid air masses from the western Mediterranean acted as the primary fuel, sustaining convection for several hours. While these dynamic factors drove the intensity of the phenomenon, the Apennine topography played the critical role of anchoring the convective system. The analysis reveals a primary convergence line that partially overlapped with the main precipitation band. Other isolated convergence nuclei were present inland and co-located with localized rainfall peaks. This suggests that orographic forcing played a crucial role: the terrain deformed the horizontal wind field, forced the air to converge, and consequently triggered convection through strong vertical uplift. In addition, vertical cross-sections show alternating vertical motion patterns consistent with orographic gravity wave activity, which may have locally modulated the updrafts leeward of the mountain barrier.
The comparison between the model output and the observations offers critical information on the capabilities and limitations of numerical simulations. Although the WRF model suggests a qualitative spatial agreement in reproducing the dynamical chain of events and the geometry of the precipitation band, including its orientation and position, it showed evident limitations in quantifying the exact rainfall accumulation. Nevertheless, the model's ability to correctly identify the structural precursors – such as the capping inversion, the convergence line, and the moisture transport – highlights its utility in representing the essential physical mechanisms driving this extreme convective event.
Sensitivity experiments emphasized the role of initial and boundary conditions, as well as physical parameterizations, in accurately predicting the event. While the reference GDAS-driven simulation and the runs with the same initial conditions but different boundary conditions captured the mesoscale features of the event, the model run forced with ECMWF data resulted in a significant northeastward displacement of the precipitation band. A comparative analysis identified the primary drivers of this discrepancy: despite an almost identical large-scale synoptic forcing in the mid-troposphere, the ECMWF-driven run failed to reproduce the correct low-level mesoscale dynamics for this case. Specifically, an underestimated meridional pressure gradient led to a weaker low-level wind field and altered the moisture transport. Furthermore, the ECMWF initial and boundary conditions showed an early lower-tropospheric (850 hPa) warm and moist bias over central Italy. This induced a temporal mismatch between the thermodynamic instability peak and the dynamic triggers, preventing the system from releasing the accumulated potential energy at the correct location and timing. This demonstrates that the predictability of such extreme Mediterranean storms is constrained by the model's ability to resolve the dynamics of the lower troposphere and their timing in interacting with the local topography as well as with the upper level features. This is particularly relevant in the context of climate change, as the warmer SST in the Mediterranean area is affecting the air-sea interaction, hence the thermodynamics and dynamics of the lower troposphere.
The WRF configuration namelists, static domain files, and plotting scripts are available on Zenodo at https://doi.org/10.5281/zenodo.22808447 (Berton, 2026). The WRF model outputs are available from the corresponding author upon reasonable request. The NCEP GDAS/FNL and GFS forcing datasets are publicly accessible through the NCAR Research Data Archive (https://rda.ucar.edu/, last access: 28 October 2026). The ERA5 reanalysis data were obtained from the Copernicus Climate Data Store (https://cds.climate.copernicus.eu/, last access: 28 October 2026). The ECMWF operational high-resolution (HRES) data were retrieved from the ECMWF Meteorological Archival and Retrieval System (MARS). The validated rain gauge observations were retrieved from the Civil Protection Department of the Marche Region (SIRMIP, http://app.protezionecivile.marche.it/, last access: 28 October 2026).
The supplement related to this article is available online at https://doi.org/10.5194/nhess-26-5541-2026-supplement.
Conceptualization: MMM, EA; Methodology: MMM; Data curation: MB; Formal analysis: MB; Software: MB; Supervision: MMM, EA; Writing (original draft preparation): MB; Writing (review and editing): MB, MMM, EA.
The contact author has declared that none of the authors has any competing interests.
Publisher's note: Copernicus Publications remains neutral with regard to jurisdictional claims made in the text, published maps, institutional affiliations, or any other geographical representation in this paper. The authors bear the ultimate responsibility for providing appropriate place names. Views expressed in the text are those of the authors and do not necessarily reflect the views of the publisher.
The authors gratefully acknowledge the National Research Council of Italy (CNR) for providing the high-performance computing resources and cluster infrastructure necessary to perform the numerical simulations presented in this study. Elenio Avolio and Mario Marcello Miglietta acknowledge financial support from the project “REDUCE METEO HAZARDS (RMH)”, BRiC-2024 call.
This paper was edited by Jean-Baptiste Filippi and reviewed by two anonymous referees.
Avolio, E., Nisi, L., Panziera, L., Peyraud, L., and Miglietta, M. M.: A multi-sensor and modeling analysis of a severe convective storm in Lake Maggiore area (northwestern Italy), Atmos. Res., 242, 105008, https://doi.org/10.1016/j.atmosres.2020.105008, 2020. a
Bendia, F., Farabollini, P., Materazzi, M., and Bufalini, M.: The 15 September 2022 floods in northern Marche (Central Italy): disaster analysis, case studies and mitigation strategies for hydro-geomorphological hazard, Nat. Hazards Earth Syst. Sci., 26, 1119–1140, https://doi.org/10.5194/nhess-26-1119-2026, 2026. a
Berton, M.: Codes and Configurations for: Multi-scale dynamics and mesoscale drivers of the catastrophic September 2022 Marche flood (Version 1), Zenodo [software], https://doi.org/10.5281/zenodo.22808447, 2026. a
Bolton, D.: The computation of equivalent potential temperature, Mon. Weather Rev., 108, 1046–1053, https://doi.org/10.1175/1520-0493(1980)108<1046:TCOEPT>2.0.CO;2, 1980. a
Czernecki, B., Taszarek, M., and Szuster, P.: thundeR: Computation and Visualisation of Atmospheric Convective Parameters, GitHub [code], https://bczernecki.github.io/thundeR/ (last access: 27 October 2026), 2025. a
Davolio, S., Mastrangelo, D., Miglietta, M. M., Drofa, O., Buzzi, A., and Malguzzi, P.: High resolution simulations of a flash flood near Venice, Nat. Hazards Earth Syst. Sci., 9, 1671–1678, https://doi.org/10.5194/nhess-9-1671-2009, 2009. a
Davolio, S., Fera, S. D., Laviola, S., Miglietta, M. M., and Levizzani, V.: Heavy precipitation over Italy from the Mediterranean storm “Vaia” in October 2018: assessing the role of an atmospheric river, Mon. Weather Rev., 148, 3571–3588, https://doi.org/10.1175/MWR-D-20-0021.1, 2020. a
Drobinski, P., Ducrocq, V., Alpert, P., Anagnostou, E., Béranger, K., Borga, M., Braud, I., Chanzy, A., Davolio, S., Delrieu, G., Estournel, C., Boubrahmi, N. F., Font, J., Grubišić, V., Gualdi, S., Homar, V., Ivančan-Picek, B., Kottmeier, C., Kotroni, V., Lagouvardos, K., Lionello, P., Llasat, M. C., Ludwig, W., Lutoff, C., Mariotti, A., Richard, E., Romero, R., Rotunno, R., Roussot, O., Ruin, I., Somot, S., Taupier-Letage, I., Tintore, J., Uijlenhoet, R., and Wernli, H.: HyMeX: A 10-year multidisciplinary program on the Mediterranean water cycle, B. Am. Meteorol. Soc., 95, 1063–1082, https://doi.org/10.1175/BAMS-D-12-00242.1, 2014. a
Dudhia, J.: Numerical study of convection observed during the winter monsoon experiment using a mesoscale two-dimensional model, J. Atmos. Sci., 46, 3077–3107, https://doi.org/10.1175/1520-0469(1989)046<3077:NSOCOD>2.0.CO;2, 1989. a
Fawbush, E. J. and Miller, R. C.: The types of airmasses in which North American tornadoes form, B. Am. Meteorol. Soc., 35, 154–165, https://doi.org/10.1175/1520-0477-35.4.154, 1954. a
González-Alemán, J. J., Insua-Costa, D., Bazile, E., González-Herrero, S., Miglietta, M. M., Groenemeijer, P., and Donat, M. G.: Anthropogenic warming had a crucial role in triggering the historic and destructive Mediterranean derecho in summer 2022, B. Am. Meteorol. Soc., 104, E1526–E1532, https://doi.org/10.1175/BAMS-D-23-0119.1, 2023. a
Hong, S.-Y., Dudhia, J., and Chen, S.-H.: A revised approach to ice microphysical processes for the bulk parameterization of clouds and precipitation, Mon. Weather Rev., 132, 103–120, https://doi.org/10.1175/1520-0493(2004)132<0103:ARATIM>2.0.CO;2, 2004. a
Hong, S.-Y., Noh, Y., and Dudhia, J.: A new vertical diffusion package with an explicit treatment of entrainment processes, Mon. Weather Rev., 134, 2318–2341, https://doi.org/10.1175/MWR3199.1, 2006. a
Iacono, M. J., Delamere, J. S., Mlawer, E. J., Shephard, M. W., Clough, S. A., and Collins, W. D.: Radiative forcing by long-lived greenhouse gases: Calculations with the AER radiative transfer models, J. Geophys. Res.-Atmos., 113, https://doi.org/10.1029/2008JD009944, 2008. a, b
Jiménez, P. A. and Dudhia, J.: Improving the representation of resolved and unresolved topographic effects on surface wind in the WRF model, J. Appl. Meteorol., 51, 300–316, https://doi.org/10.1175/JAMC-D-11-084.1, 2012. a
Kain, J. S.: The Kain–Fritsch convective parameterization: an update, J. Appl. Meteorol., 43, 170–181, https://doi.org/10.1175/1520-0450(2004)043<0170:TKCPAU>2.0.CO;2, 2004. a
Khodayar, S., Davolio, S., Di Girolamo, P., Lebeaupin Brossier, C., Flaounas, E., Fourrie, N., Lee, K.-O., Ricard, D., Vie, B., Bouttier, F., Caldas-Alvarez, A., and Ducrocq, V.: Overview towards improved understanding of the mechanisms leading to heavy precipitation in the western Mediterranean: lessons learned from HyMeX, Atmos. Chem. Phys., 21, 17051–17078, https://doi.org/10.5194/acp-21-17051-2021, 2021. a
Lombardi, A., Colaiuda, V., Verdecchia, M., and Tomassetti, B.: User-oriented hydrological indices for early warning systems with validation using post-event surveys: flood case studies in the Central Apennine District, Hydrol. Earth Syst. Sci., 25, 1969–1992, https://doi.org/10.5194/hess-25-1969-2021, 2021. a
Mastrangelo, D., Horvath, K., Riccio, A., and Miglietta, M. M.: Mechanisms for convection development in a long-lasting heavy precipitation event over southeastern Italy, Atmos. Res., 100, 586–602, https://doi.org/10.1016/j.atmosres.2010.10.010, 2011. a
Miglietta, M. M. and Davolio, S.: Dynamical forcings in heavy precipitation events over Italy: lessons from the HyMeX SOP1 campaign, Hydrol. Earth Syst. Sci., 26, 627–646, https://doi.org/10.5194/hess-26-627-2022, 2022. a
Miglietta, M. M. and Regano, A.: An observational and numerical study of a flash-flood event over south-eastern Italy, Nat. Hazards Earth Syst. Sci., 8, 1417–1430, https://doi.org/10.5194/nhess-8-1417-2008, 2008. a
Mlawer, E. J., Taubman, S. J., Brown, P. D., Iacono, M. J., and Clough, S. A.: Radiative transfer for inhomogeneous atmospheres: RRTM, a validated correlated-k model for the longwave, J. Geophys. Res.-Atmos., 102, 16663–16682, https://doi.org/10.1029/97JD00237, 1997. a
Niu, G.-Y., Yang, Z.-L., Mitchell, K. E., Chen, F., Ek, M. B., Barlage, M., Kumar, A., Manning, K., Niyogi, D., Rosero, E., Tewari, M., and Xia, Y.: The community Noah land surface model with multiparameterization options (Noah-MP): 1. Model description and evaluation with local-scale measurements, J. Geophys. Res.-Atmos., 116, https://doi.org/10.1029/2010JD015139, 2011. a
Ralph, F. M. and Dettinger, M. D.: Storms, floods, and the science of atmospheric rivers, EOS T. Am. Geophys. Un., 92, 265–266, https://doi.org/10.1029/2011EO320001, 2011. a
Sawyer, J. S.: The physical and dynamical problems of orographic rain, Weather, 11, 375–381, https://doi.org/10.1002/j.1477-8696.1956.tb00264.x, 1956. a
Skamarock, W. C., Klemp, J. B., Dudhia, J., Gill, D. O., Liu, Z., Berner, J., Wang, W., Powers, J. G., Duda, M. G., Barker, D. M., and Huang, X.-Y.: A Description of the Advanced Research WRF Model Version 4.1, Tech. Rep. NCAR/TN-556+STR, https://doi.org/10.5065/1dfh-6p97, 2019 a
Tartaglione, N.: Unprecedented flooding in the Marche region (Italy): analyzing the 15 September 2022 event and its unique meteorological conditions, Meteorology, 4, https://doi.org/10.3390/meteorology4010003, 2025. a, b, c, d
Tewari, M., Chen, F., Wang, W., Dudhia, J., LeMone, M. A., Mitchell, K., Ek, M., Gayno, G., Wegiel, J., and Cuenca, R. H.: Implementation and verification of the unified Noah land surface model in the WRF model, in: 20th Conference on Weather Analysis and Forecasting/16th Conference on Numerical Weather Prediction, 84th AMS Annual Meeting, Seattle, WA, USA, 11–15 January 2004, Paper 14.2a, available at: https://ams.confex.com/ams/84Annual/techprogram/paper_69061.htm (last access: 28 October 2026), 2004. a
Thompson, G., Field, P. R., Rasmussen, R. M., and Hall, W. D.: Explicit forecasts of winter precipitation using an improved bulk microphysics scheme. Part II: Implementation of a new snow parameterization, Mon. Weather Rev., 136, 5095–5115, https://doi.org/10.1175/2008MWR2387.1, 2008. a
Tiedtke, M.: A comprehensive mass flux scheme for cumulus parameterization in large-scale models, Mon. Weather Rev., 117, 1779–1800, https://doi.org/10.1175/1520-0493(1989)117<1779:ACMFSF>2.0.CO;2, 1989. a, b
Torcasio, R. C., Papa, M., Frate, F. D., Dietrich, S., Toffah, F. E., and Federico, S.: Study of the intense meteorological event occurred in September 2022 over the Marche region with WRF model: impact of lightning data assimilation on rainfall and lightning prediction, Atmosphere-Basel, 14, https://doi.org/10.3390/atmos14071152, 2023. a
Uccellini, L. W. and Johnson, D. R.: The coupling of upper and lower tropospheric jet streaks and implications for the development of severe convective storms, Mon. Weather Rev., 107, 682–703, https://doi.org/10.1175/1520-0493(1979)107<0682:TCOUAL>2.0.CO;2, 1979. a
Zhang, F., Snyder, C., and Rotunno, R.: Mesoscale predictability of the “Surprise” snowstorm of 24–25 January 2000, Mon. Weather Rev., 130, 1617–1632, https://doi.org/10.1175/1520-0493(2002)130<1617:MPOTSS>2.0.CO;2, 2002. a