
the Creative Commons Attribution 4.0 License.
the Creative Commons Attribution 4.0 License.
 | 22 Oct 2026
Distinguishing run-up height from pressure distribution during avalanche impact on narrow obstacles: mechanisms and semi-empirical prediction from three-dimensional simulations

Johan Gaume
Christophe Ancey
Betty Sovilla
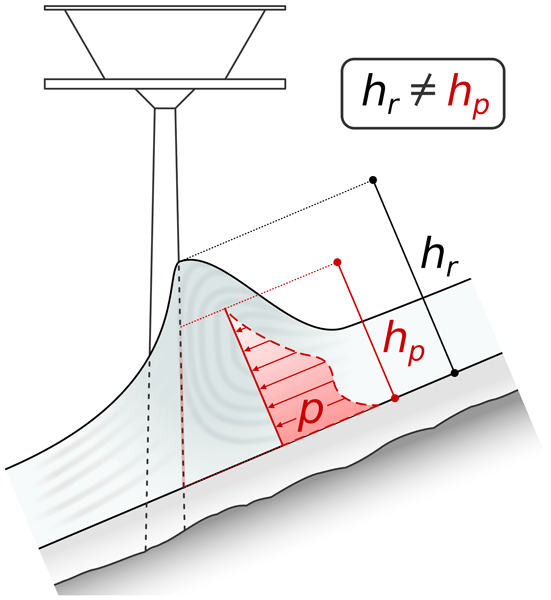
In many avalanche engineering guidelines, run-up height is assumed to define the vertical extent of significant impact pressure of snow avalanches on narrow obstacles, such as cableway masts or transmission towers. Laboratory experiments indicate that this assumption is invalid in fast, inertia-driven regimes; however, the underlying mechanisms remain poorly understood, limiting the physical basis for improving design practice. To clarify these mechanisms and refine engineering formulations, we conduct a comprehensive numerical investigation using a three-dimensional Material Point Method, varying avalanche velocity and rheological parameters. Our results substantiate that run-up height and the vertical extent of significant impact pressure, which we term pressure height, are distinct quantities governed by different mechanisms. Both include a gravity-driven component controlled by avalanche rheology and independent of flow velocity. In fast flows, however, the two quantities diverge: run-up height gains a dominant inertia-driven component that scales with the square of the flow velocity, while avalanche rheology controls energy dissipation. Pressure height, by contrast, remains velocity-independent. This divergence arises from flow deflection at a dead zone near the obstacle base, where momentum is redirected and impact pressure concentrates. Building on these distinctions, we propose separate semi-empirical formulations for run-up height and pressure height. The run-up formulation follows the structure of the most common avalanche engineering guidelines, but replaces simplified avalanche-type classifications with a rheological parametrization. The pressure height relation adopts the same framework, while reflecting its distinct, velocity-independent governing mechanism.
- Article
(7830 KB) - Full-text XML
-
Supplement
(62379 KB) - BibTeX
- EndNote


Gravitational mass movements such as snow avalanches are major natural hazards in mountainous regions, causing loss of life and substantial damage to infrastructure (Techel et al., 2016; Ortner et al., 2023). Assessing their destructive power is a central component of hazard mitigation and requires understanding the physical processes that govern impact. A key process is run-up: the upward rise of material along the upstream face of an obstacle as the flow decelerates and transfers momentum to the structure (Iverson et al., 2016). Run-up height is a central engineering quantity across a broad range of structures. For wide obstacles such as avalanche dams, it determines crest elevation and retention capacity (Jóhannesson et al., 2009). For narrow obstacles such as cableway masts or transmission towers, which are often located in remote and exposed terrain (Vallero et al., 2026), run-up height sets the risk of damage to protruding elements that may be struck by upward-moving material. More consequentially, it is also assumed to define the vertical extent of idealized impact pressure distributions in guidelines across the Alpine countries (Margreth et al., 2015, ÖNORM B 4801 (Austrian Standards International, 2024)). The vertical extent of this load sets the lever arm of the resultant force and therefore the base moment, which typically governs the design of such narrow structures. The wide-narrow distinction, classically defined by an obstacle width of approximately three times the flow height, or 2 m, according to Margreth et al. (2015), has important implications for the mechanical description of the problem. For wide obstacles, the impact problem can be approximated under plane-strain conditions, enabling a quasi-two-dimensional analytical description (e.g., McClung and Mears, 1995; Hákonardóttir, 2003; Mejean et al., 2017; Faug, 2021). For narrow obstacles, however, the flow partially bypasses the structure laterally, making the impact problem inherently three-dimensional (Wu et al., 2023; Lin et al., 2025). This complicates the mechanical description and requires many restrictive assumptions in any analytical treatment (cf. Faug et al., 2010; Bartelt et al., 2018).
In the absence of generally accepted analytical solutions for narrow obstacles, engineering practice often relies on empirical formulations calibrated against observations to predict run-up height (Salm et al., 1990). The most prominent approach is based on the velocity head from Bernoulli's principle
which describes the transformation of kinetic energy to potential energy upon impact. Therein, hv denotes the velocity head expressed as an equivalent height, v is the flow velocity, and g is the gravitational acceleration. This concept was already used by Voellmy (1955) in his pioneering work on snow avalanche dynamics and has since been adopted in snow avalanche engineering guidelines across the Alpine countries (Margreth et al., 2015, ÖNORM B 4801 (Austrian Standards International, 2024), given their widespread application, henceforth referred to as the guidelines). In the guidelines, Eq. (1) is augmented by two empirical factors to account for the influence of obstacle width and energy dissipation (cf. Sect. 4 for the full equation). Avalanche rheology is only crudely reflected in the energy dissipation factor, without an explicit link to measurable material constants. Yet experimental observations show that flow rheology strongly influences the morphology of flow-obstacle interaction (Choi et al., 2015; Armanini et al., 2011), implying that the physical mechanisms governing run-up are poorly represented by this framework and that predictive reliability is limited.
The limitations extend beyond run-up height estimation itself. In laboratory experiments on supercritical granular flows impacting narrow obstacles, Hauksson et al. (2007) showed that the total impact force became independent of obstacle height once it exceeded approximately three flow heights, which is substantially below the corresponding run-up heights. As granular flows are a common modeling idealization for snow avalanches (e.g., Savage and Hutter, 1989; Bartelt et al., 1999), this result suggests that run-up height does not reliably indicate the vertical extent of impact pressure in such avalanche impact configurations, contrary to the assumption in the guidelines. Sovilla et al. (2008b) further demonstrated that the guidelines formulation can produce physically inconsistent force predictions, providing additional evidence that the framework lacks a sound physical basis. For fast, fluidized avalanches (), Margreth et al. (2015) partly acknowledge excessive run-up height estimates: following Jóhannesson et al. (2009), they suggest limiting the run-up height to . ÖNORM B 4801 (Austrian Standards International, 2024) suggests a different adaptation, derived from three-dimensional simulations of a water-like liquid impacting mast-like obstacles (Huber et al., 2021). The two limits deviate markedly from each other. Neither is well founded: no derivation is published for the former, and the latter rests on a fluid idealization that omits avalanche rheology, which strongly influences flow–obstacle interaction (Choi et al., 2015).
Addressing these inconsistencies requires capturing the transient three-dimensional impact process while explicitly accounting for avalanche rheology. Recent numerical studies of snow avalanche impact on narrow obstacles could not resolve run-up formation due to computational constraints imposed by their discrete modeling approach (Kyburz et al., 2020, 2022). Continuum approaches based on the Material Point Method (MPM) are a computationally efficient alternative, capturing both transient run-up dynamics and avalanche rheology, as recently demonstrated for impact pressure analysis (Kohler et al., 2026a). However, run-up formation and its relation to impact pressure distribution remain uninvestigated.
Here, we pursue two main objectives. Our first objective, addressed in Sect. 3, is to clarify the physics of run-up on vertical narrow obstacles. Specifically, we investigate how run-up height depends on bulk rheological parameters and how it relates to the vertical extent of significant impact pressure. Our second objective, addressed in Sect. 4, is to translate these insights into a practical framework. We propose a semi-empirical extension of the velocity head formulation that explicitly incorporates rheological parameters and introduce a new metric to better quantify the vertical extent of significant impact pressure.
Together, these objectives address a gap that has direct consequences for efficient structural design: the assumption that run-up height defines the vertical extent of significant impact pressure on narrow obstacles is not physically justified, and this paper provides both the mechanistic explanation and a practical alternative.
2.1 Numerical framework
2.1.1 The material point method (MPM)
MPM combines the advantages of particle-based and grid-based methods, making it ideal for large-deformation modeling of granular flows (Kamrin et al., 2024). In MPM, a body is discretized into Lagrangian material points (MPs) carrying all state variables, such as deformation or stress states. The MPs move through an Eulerian background grid used to compute spatial derivatives and solve the momentum balance and constitutive equations (Sulsky et al., 1994; Stomakhin et al., 2013). In each time step, quantities are transferred between MPs and grid nodes using mapping functions, and the grid is reset. This prevents mesh distortion issues, typical of methods employing Lagrangian meshes.
We employ the three-dimensional (3D) single-phase MPM framework of Gaume et al. (2018) using quadratic B-Spline mapping functions, which closely follows the explicit symplectic Euler scheme of Stomakhin et al. (2013). Further details can be found in the original publications, the references therein, and our previous work (Kohler et al., 2026a). This framework, together with its constitutive model for snow, has been validated and used extensively in numerical avalanche dynamics (e.g., Li et al., 2021; Védrine et al., 2022).
2.1.2 Constitutive model
The avalanching material is modeled using the large-strain elasto-plastic law for snow of Gaume et al. (2018), built around a cohesive Modified Cam–Clay (cMCC) plasticity model (Roscoe and Burland, 1968). The macroscopic rheology is mainly controlled by three plasticity parameters: the internal friction M, a cohesion parameter β, and the plastic compressibility χ(pc) (Li et al., 2024). The model does not feature a liquid water phase, nor does it account for thermo-mechanical coupling. Effects of temperature and liquid water content are therefore assumed to be encoded in these three parameters and treated as constant at the instant of impact.
M and β can be combined into an effective internal friction (Ritter et al., 2020)
which can be interpreted as a proxy for the material's angle of repose (Metcalf, 1966; Willibald et al., 2020; Eidevåg et al., 2022). M′ is related to the Coulomb friction angle φ′ through (Ortiz and Pandolfi, 2004) (cf. Fig. 1). We use M′ as a primary rheological descriptor throughout this study, as it captures the combined effect of friction and cohesion in a single physically interpretable parameter.
Both M and β appear in the cMCC yield function
expressed in terms of the mean (compressive) stress , and the von Mises equivalent stress , where is the deviatoric part of the Kirchhoff stress tensor τ. The elastic behavior is described through a Saint-Venant–Kirchhoff law. The yield function forms a semi-elliptical curve in p−q space (cf. Kohler et al., 2026a), which is a common assumption for highly porous media such as snow, supported by microstructure-based studies (Ritter et al., 2020; Blatny et al., 2021). The pre-consolidation pressure pc sets the size of the elastic domain: the vertices of the semi-ellipse along the p-axis lie at pc in compression and at in hydrostatic tension, while M controls the vertex in the deviatoric direction and hence the shear strength. For plastic stress states, the plastic strain follows the associative flow rule proposed by Simo and Meschke (1993).
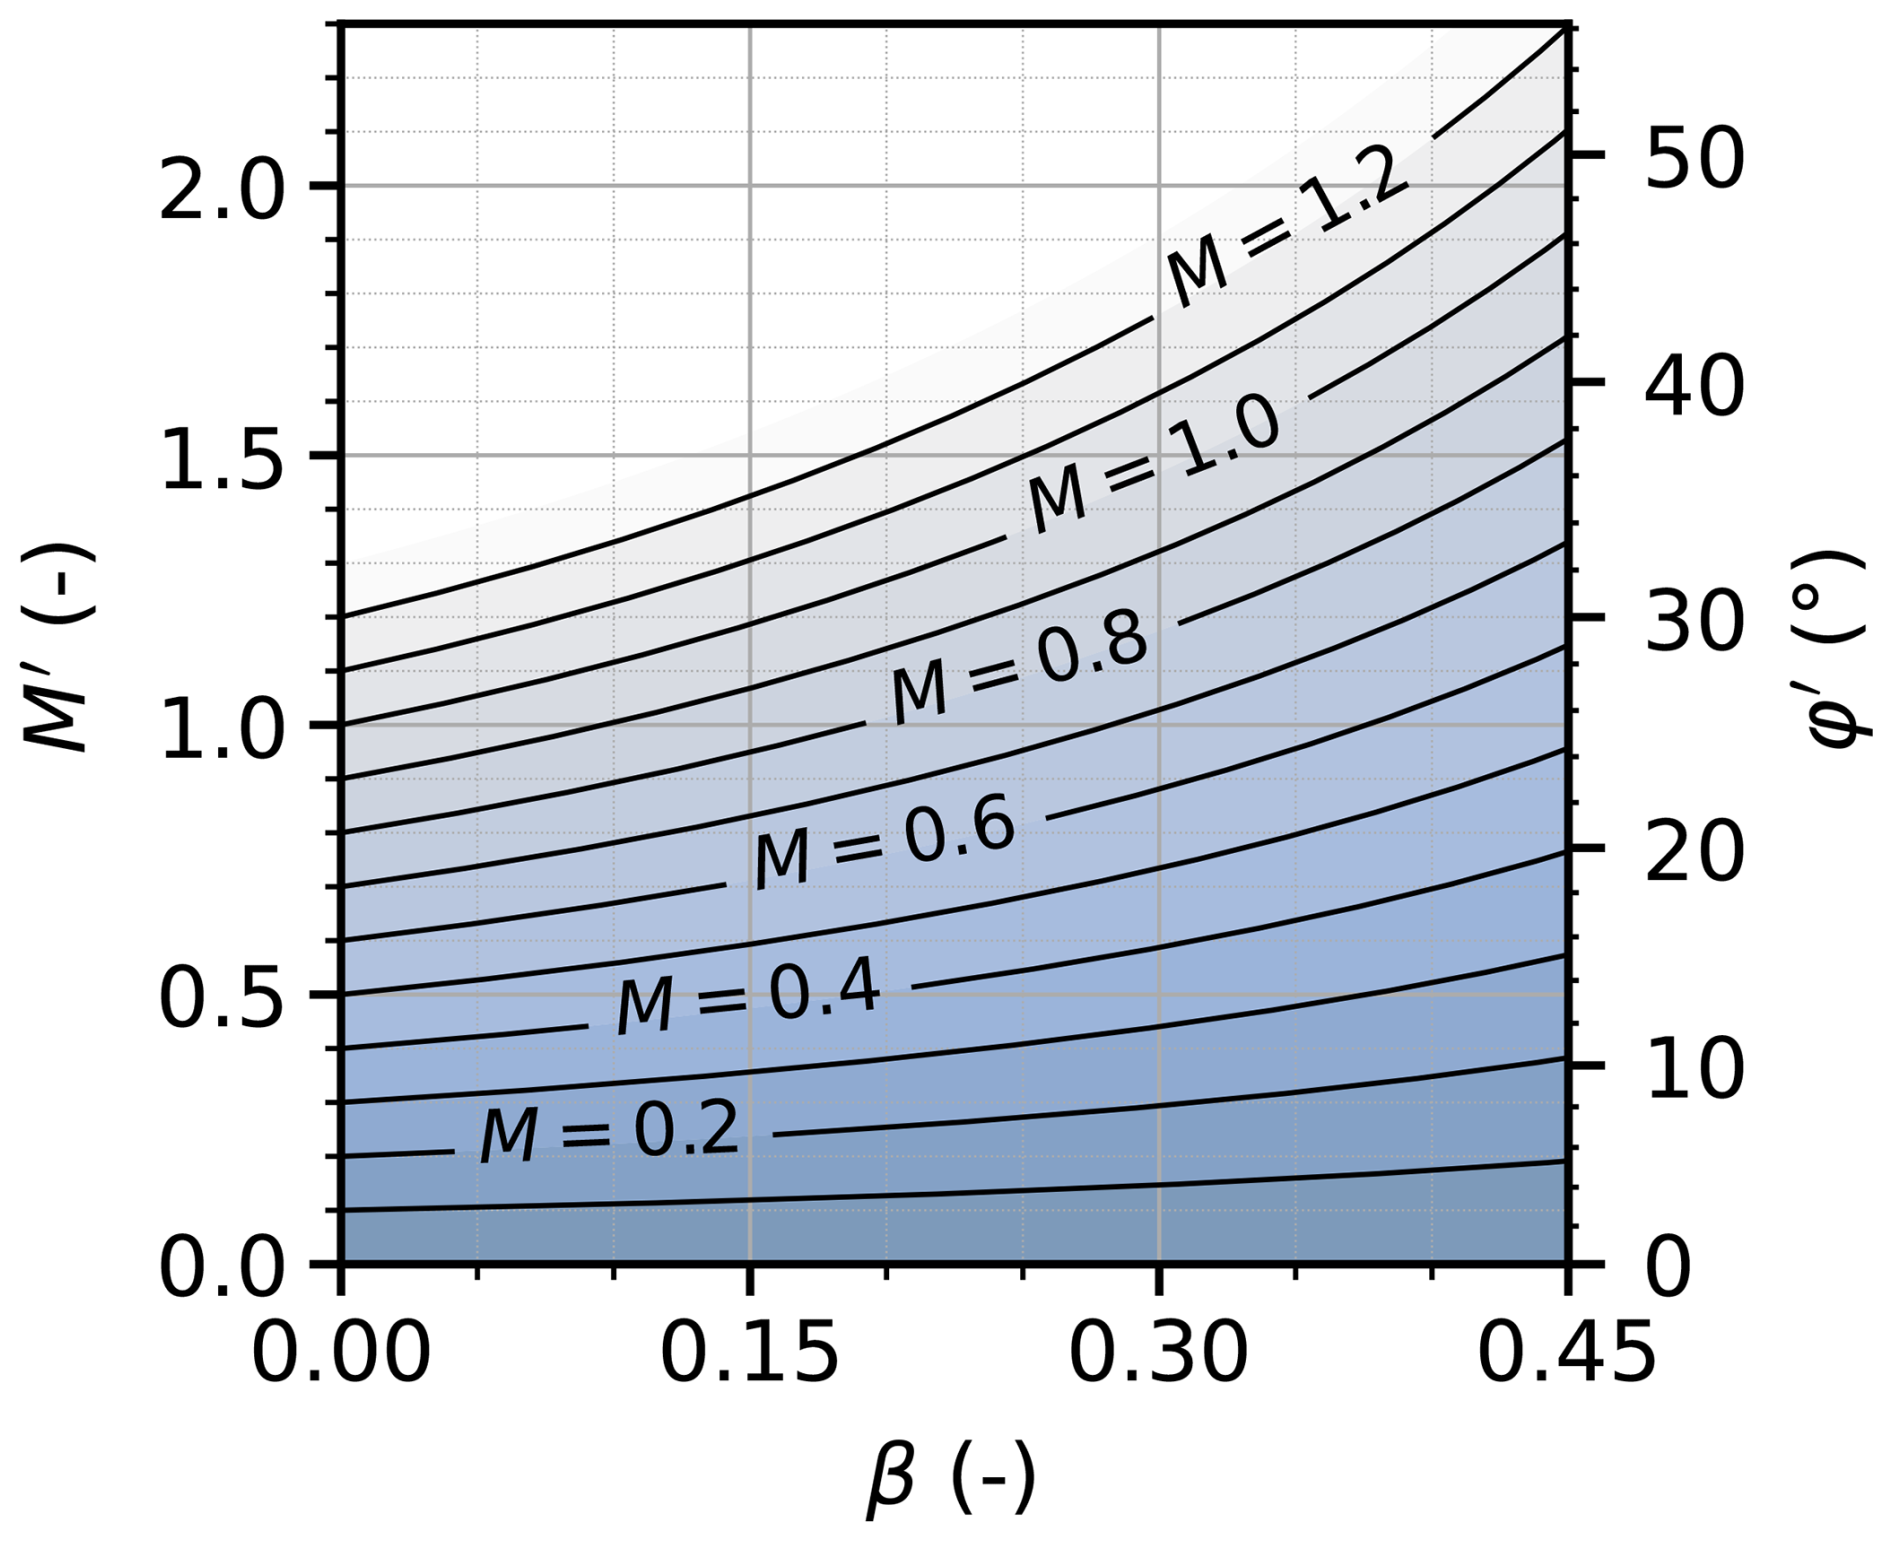
Figure 1Effective internal friction M′ and effective internal friction angle φ′ over β for different values of M, calculated from Eq. (2).
Table 1Fixed and varied material parameters of the avalanche.
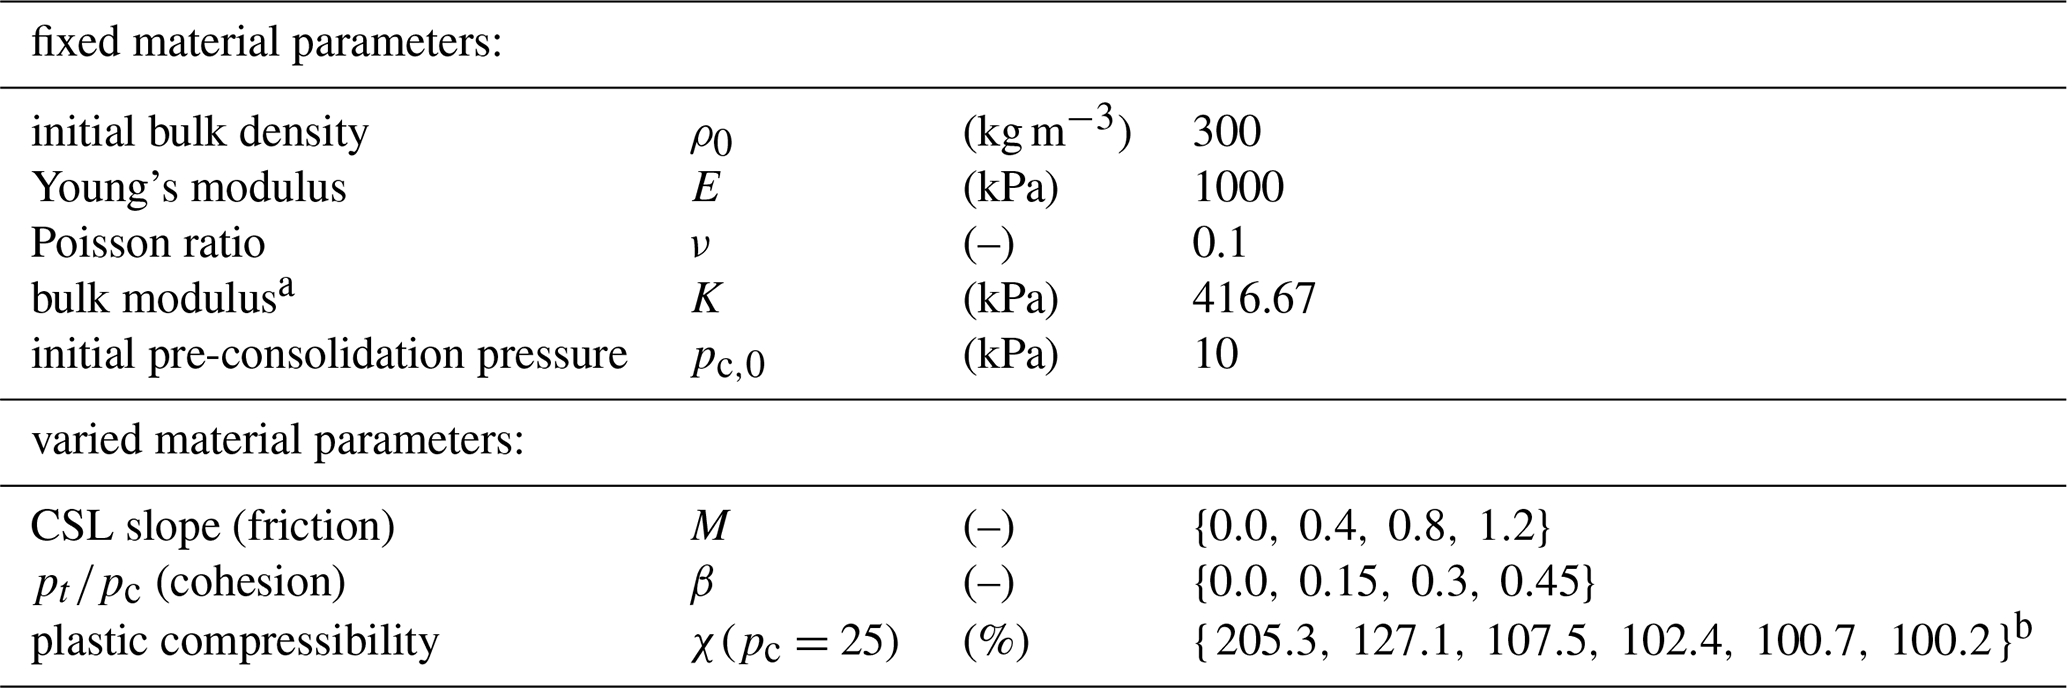
a Follows from E and ν: . b This corresponds to the hardening parameters , and 15, respectively. For snow avalanches at the density used here, the relevant parameter range is (i.e., ). Accordingly, we restrict our semi-empirical model fitting to this range.
When the material gets compacted, pc grows, and the yield surface expands according to the hardening law (Ortiz and Pandolfi, 2004)
where K is the bulk modulus, ξ is a hardening parameter, and is the plastic volumetric Hencky strain, with JP the plastic Jacobian (cf. Kohler et al., 2026a, for further details and definitions). Hardening depends solely on volumetric deformation. Compaction () expands the yield surface, whereas dilation () contracts it and causes softening. The hardening parameter ξ controls the rate of this evolution and therefore principally affects the material's plastic compressibility. To aid physical interpretation, we express compressibility through the parameter χ(pc=25), which can be interpreted as a plastic density-increase factor evaluated at an arbitrarily chosen reference pre-consolidation pressure of pc=25 kPa for a given ξ; the correspondence between ξ and χ(pc=25) is given in Table 1 and its derivation is given in Sect. S1 in the Supplement.
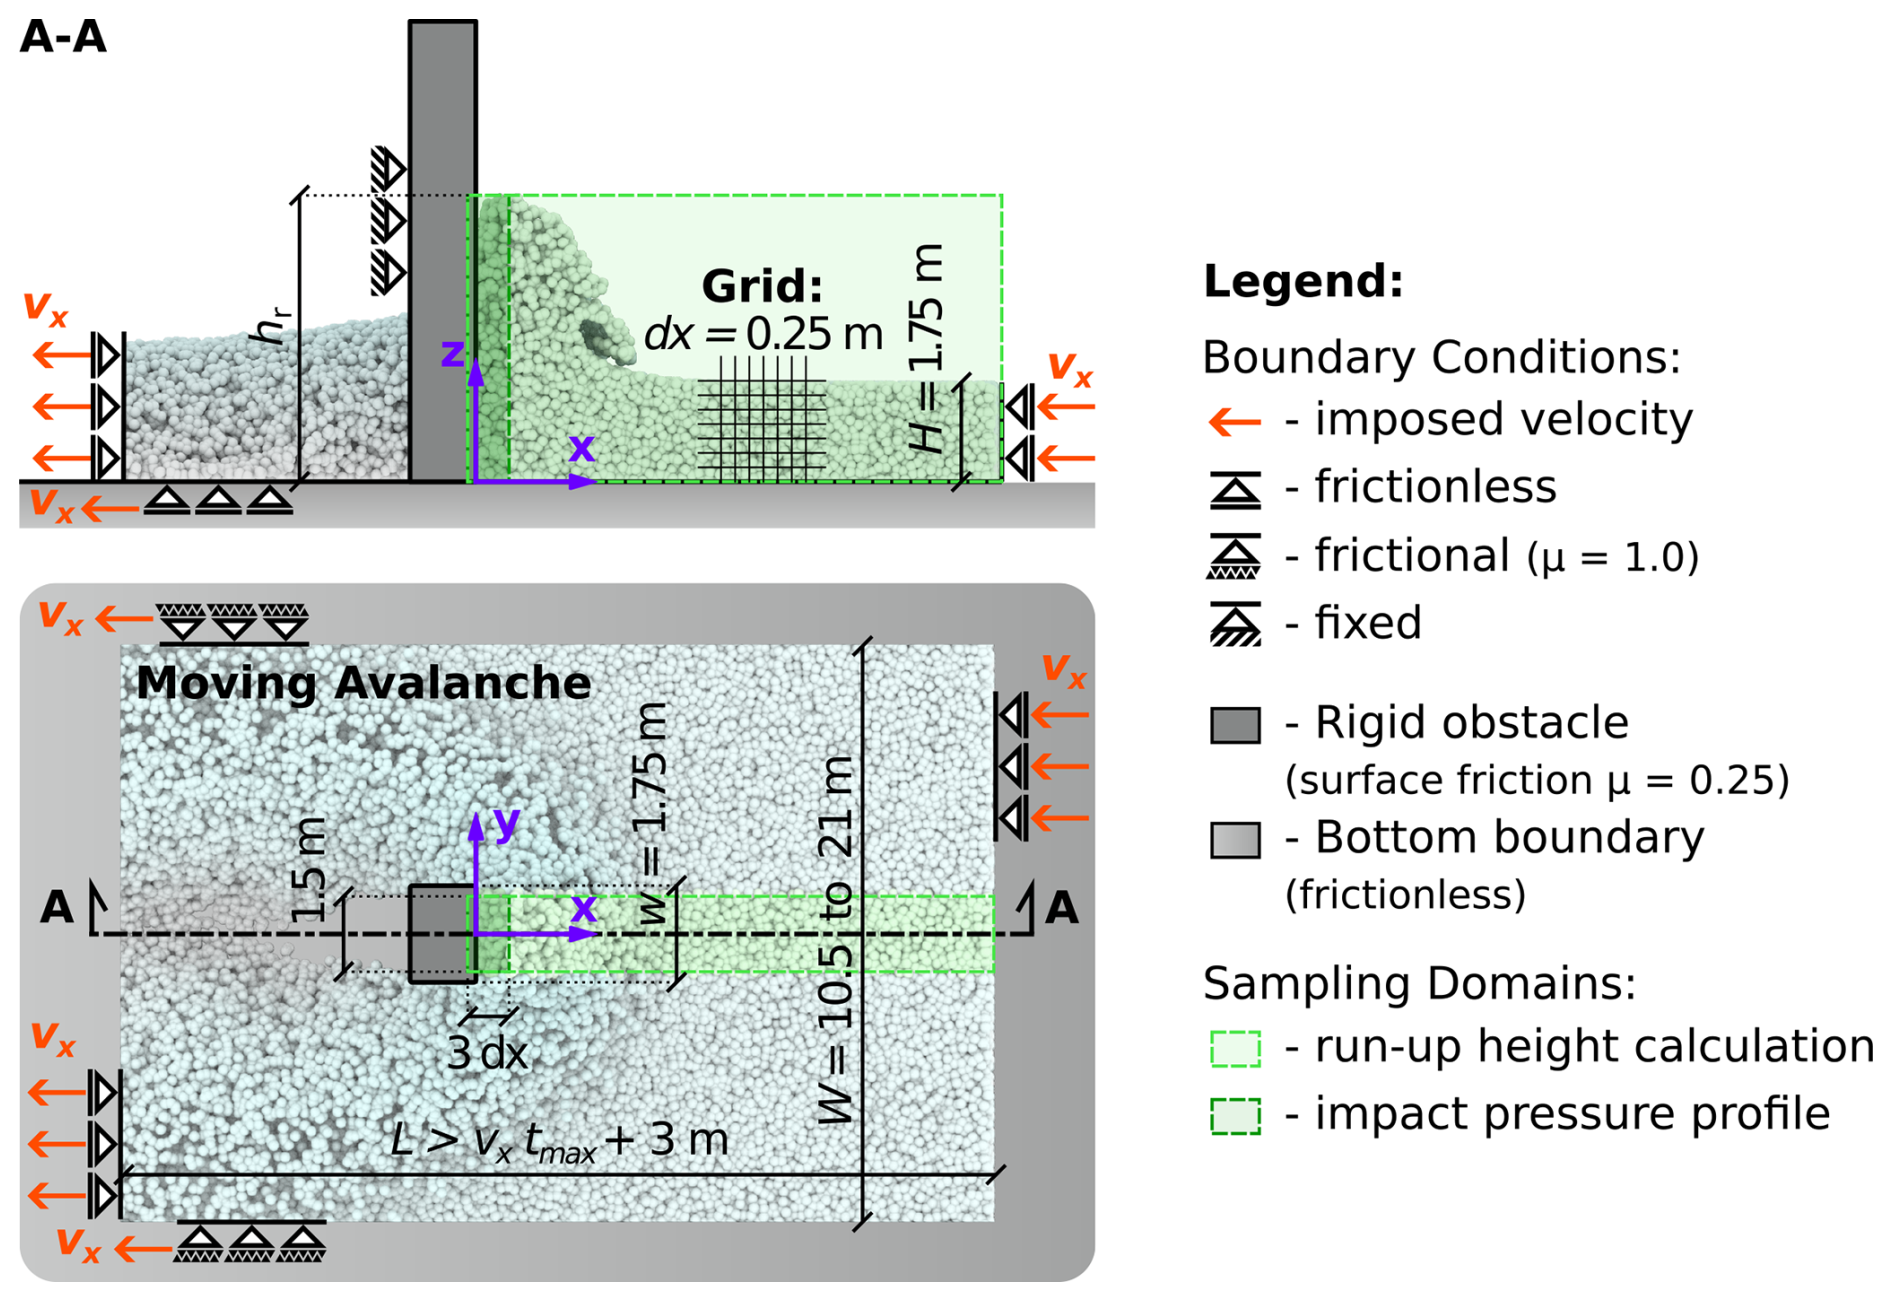
Figure 2Schematic of the numerical setup, illustrating the dimensions and boundary conditions. The upper panel shows a longitudinal section, while the lower panel provides a top-down view. W follows from , with w the obstacle width and ξ the hardening parameter of the avalanching material. This is largely taken from our previous publication (Kohler et al., 2026a).
2.2 Numerical setup
We adopt the conveyor-belt setup of Kohler et al. (2026a), in which the avalanche travels horizontally and impacts a rigid, vertical, rectangular obstacle. The avalanche is driven at a prescribed velocity rather than released from a chute, providing precise control of the flow velocity. The resulting motion resembles a plug flow, which can be seen as an idealization of a sheared avalanche in which we ignore the velocity profile and focus on the average velocity.
The initial flow height H and the obstacle width w are fixed at . We simulate a confined strip of the avalanche rather than the full width to limit computational cost, with the domain width W chosen sufficiently large to minimize sidewall effects (cf. Fig. 2). In Kohler et al. (2026a) we assessed these effects through a sensitivity analysis on the total force and found the required width to depend principally on the compressibility, that is, on the hardening parameter ξ. We adopt the same parametrization here. The computational grid spacing is dx=0.25 m. Flow velocity is maintained by frictional sidewalls, while the bottom boundary is frictionless.
For impact scenarios, flow regimes can be characterized by the Froude number , where v is the flow velocity, g is gravitational acceleration, and H is the flow height. Fr expresses the ratio of inertial to gravitational forces: subcritical flows (Fr<1) are gravity-driven, supercritical flows (Fr>1) are inertia-driven, and the range is sometimes referred to as transitional (Faug, 2015; Kohler et al., 2026a). Real snow avalanches span a wide range, from slow, dense flows below Fr=1 to fast mixed powder snow avalanches beyond Fr=7 (Köhler et al., 2018). The flow velocity ranges in Table 2 are selected to cover typical dense snow avalanche regimes (Köhler et al., 2018; Sovilla et al., 2008a), as the applied numerical method does not represent particle suspension. Rudolf-Miklau et al. (2014) give 30 m s−1 as the lower-bound velocity for powder snow avalanches, a threshold of the same order as the observations of Gubler et al. (1986). This sets the upper limit of our considered velocity to , corresponding to Fr=7 at H=1.75 m. The simulations therefore span typical dense flow velocities up to the margin at which powder snow avalanches begin to be encountered.
The material parameter ranges in Table 1 are selected based on previous MPM snow-modeling studies (e.g., Li et al., 2020, 2021; Kyburz et al., 2024). The elasticity parameters E and ν, the initial pre-consolidation pressure pc,0, and the initial bulk density (, a common estimate in avalanche engineering) are kept fixed. For each Fr, we perform at least 48 simulations, combining 4 values of M and β with at least 3 values of χ(pc=25) (). Additional compressibility levels, , are included for selected M and β combinations. In total, the study comprises 371 simulations.
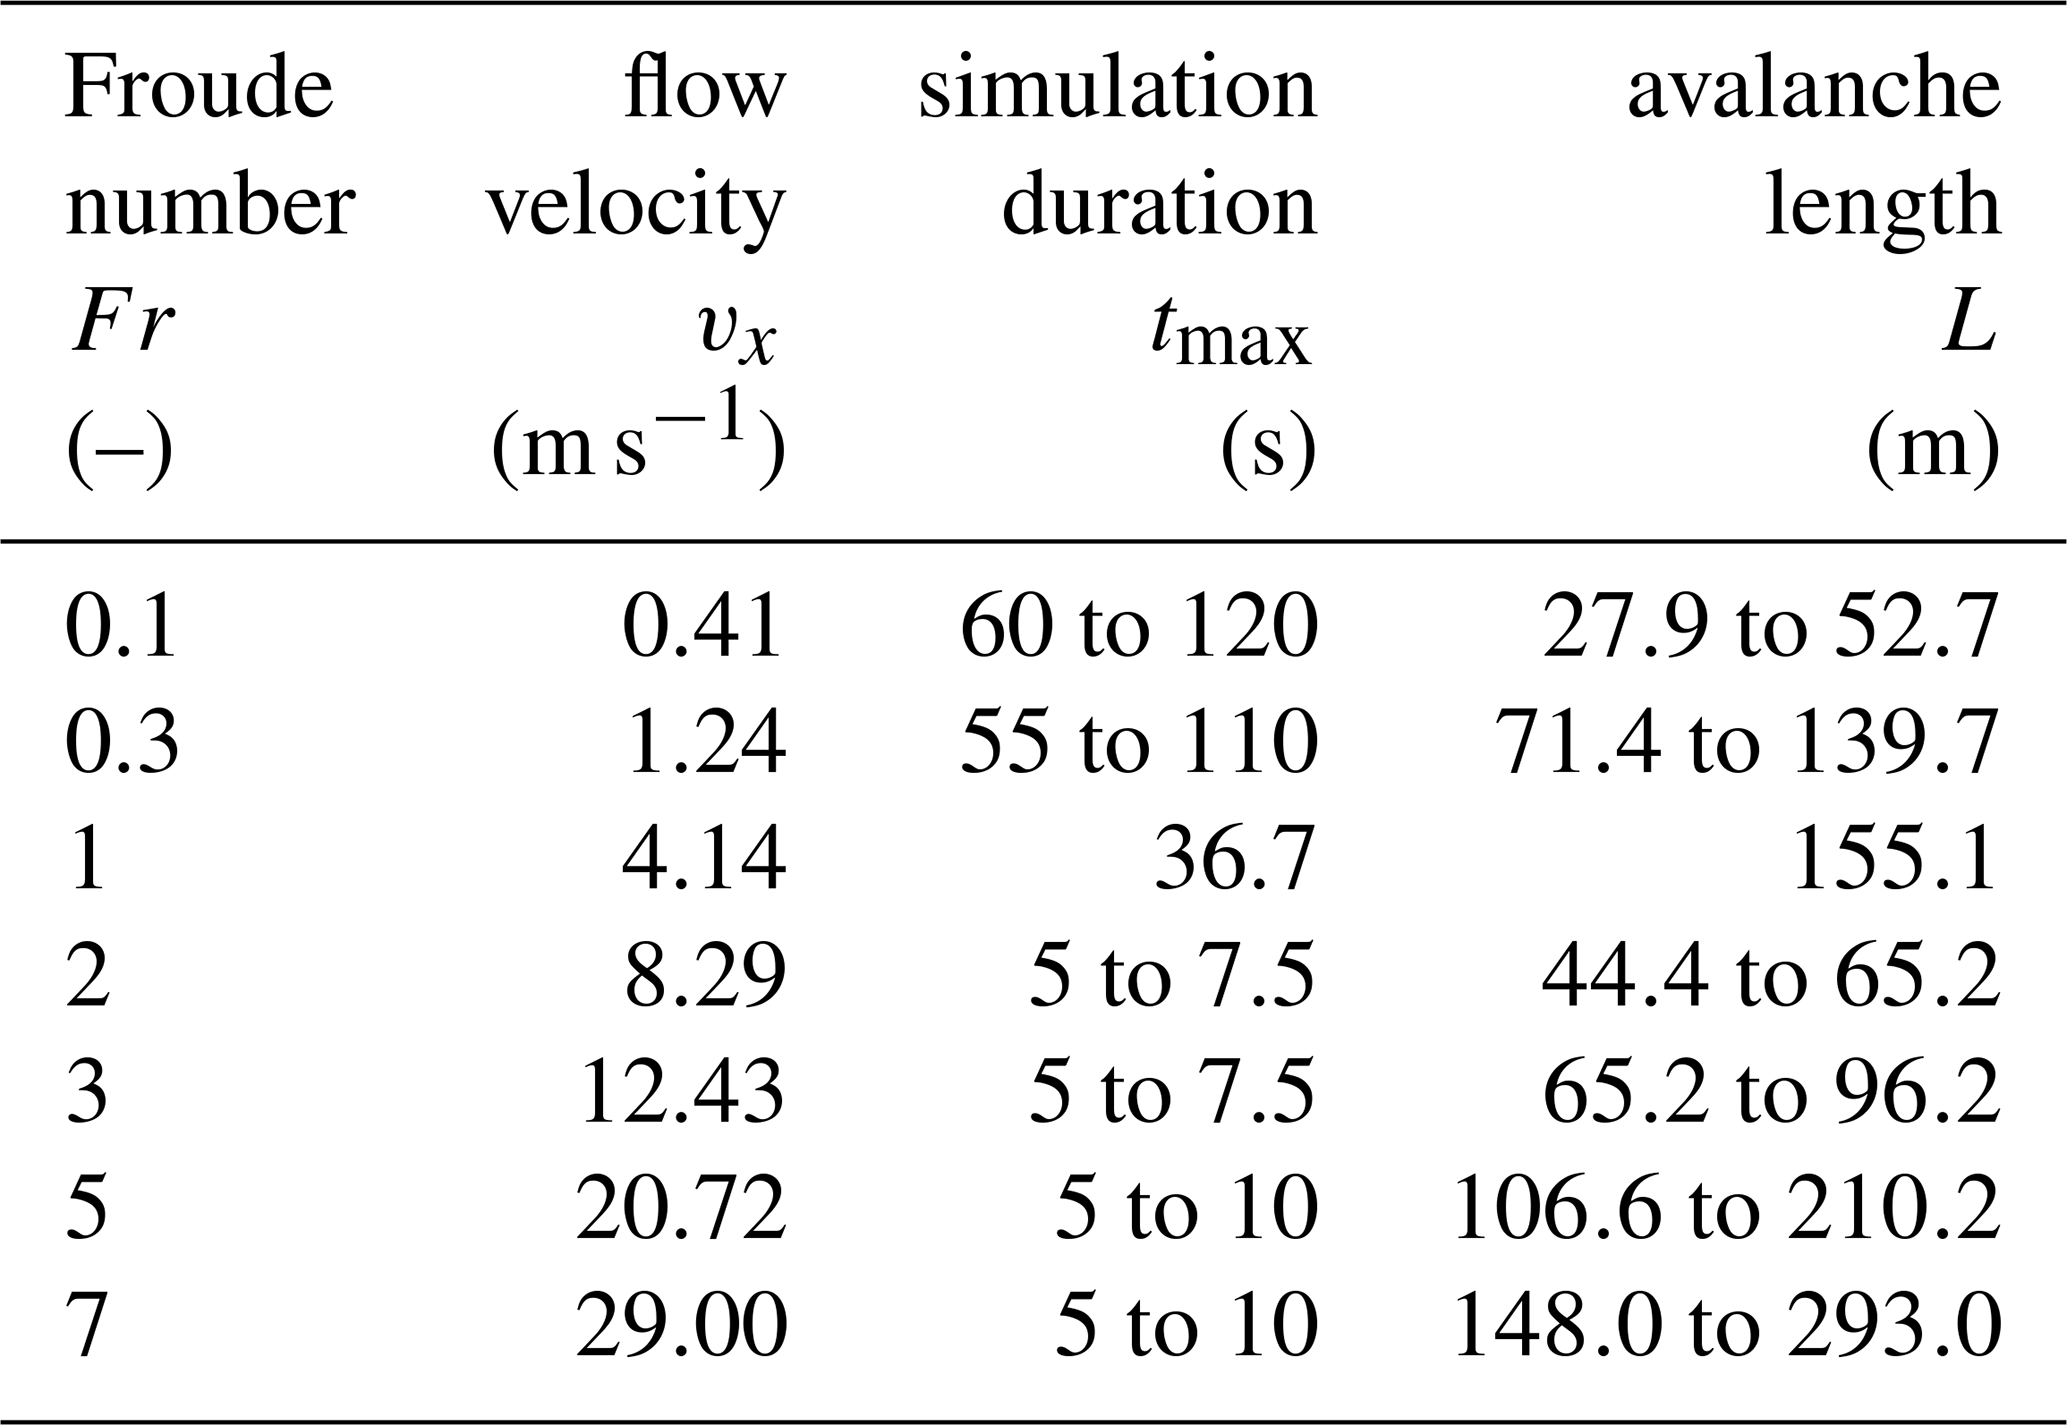
A sensitivity analysis with respect to grid resolution, slope angle, obstacle friction, and obstacle width is provided in Sect. S2. Results are robust with respect to grid resolution and slope angle. Obstacle friction has a measurable influence, with increasing friction leading to reduced run-up heights. The effect of obstacle width is discussed in Sect. 4.3. Section S3 contains simulation renderings showing characteristic flow morphology for every considered Fr and avalanche rheology.
2.3 Postprocessing
In the following, time-averaged values are denoted by an overline (e.g., ), peak values are denoted by a hat (e.g., ), and volume-averaged values by angle brackets (e.g., 〈σxx〉). We commonly normalize run-up and pressure height by the initial flow height H.
We determine run-up height hr in each simulation frame as the maximum vertical position of the MPs within a centered 1.5 m-wide strip upstream of the obstacle (cf. Fig. 2). Steady-state values are computed as the arithmetic mean over a time span, the temporal position of which is determined by a running deviation analysis. The time span is several seconds long and varies depending on the Froude number. Time history plots and the corresponding averaging time-spans are shown in Sect. S4.
Impact pressure profiles are obtained by binning the MPs by their z-position at a resolution of d (cf. coordinate system in Fig. 2). For each bin, we compute the volume-averaged streamwise stress σxx within a domain directly upstream of the obstacle-avalanche interface. The domain extends from −0.5 dx to 2.5 dx in the x-direction, over ±0.75 m in the y-direction, and from 0 to 5H in the z-direction, resulting in 70 bins. The x-extent of 3dx was chosen to cover the compact support of the quadratic B-spline interpolation functions (cf. Sect. S1).
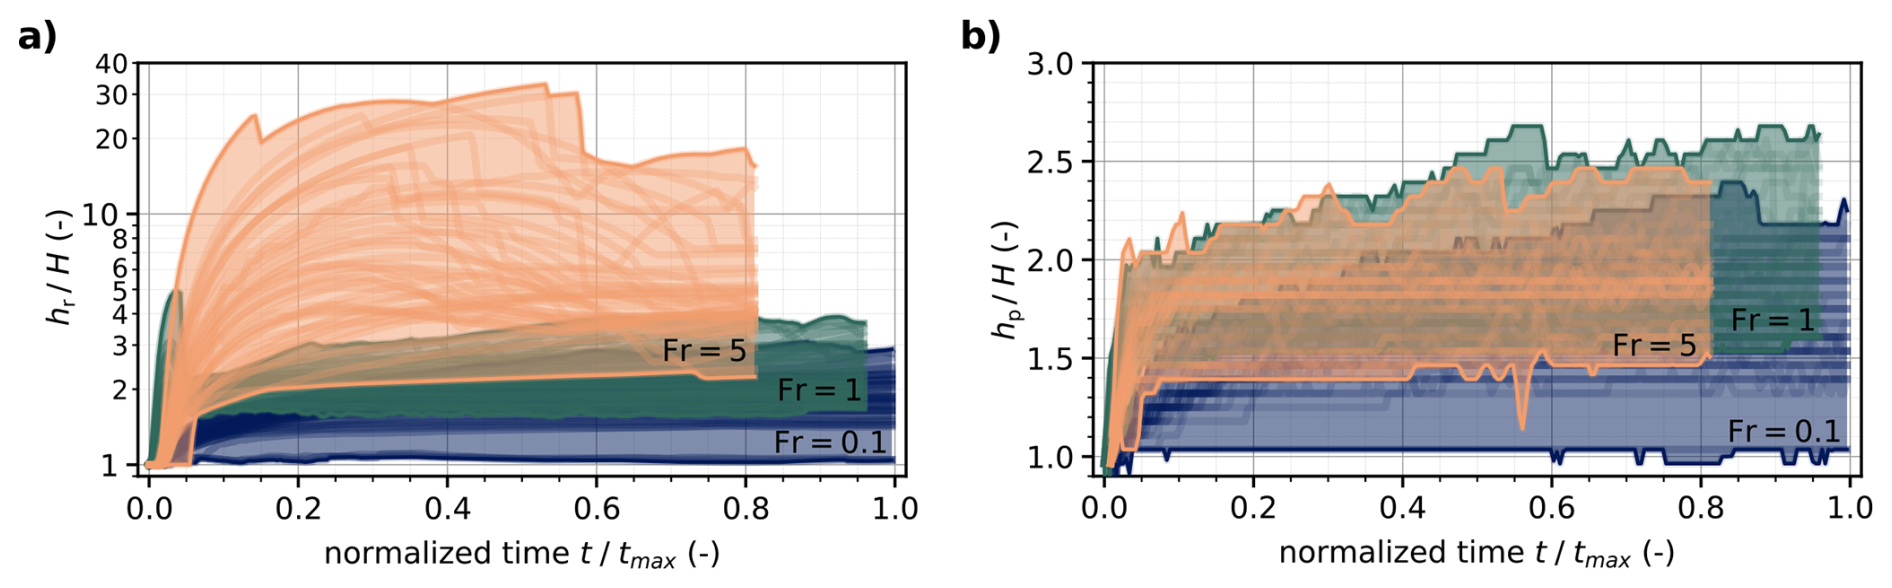
Figure 3Envelopes of run-up height time histories (a) and pressure height (b) encompassing the whole range of varied material parameters (see Table 1) of a characteristic gravity-driven (Fr=0.1 in blue), a transitional (Fr=1 in green), and an inertia-driven regime (Fr=5 in orange). The pronounced drops in the run-up time histories of Fr=5 are sampling artifacts: as the highest ballistically ejected material point leaves the centered run-up height sampling domain (cf. Fig. 2), the reading falls discontinuously to the next-highest point inside it. Curves for Fr=1 and Fr=5 are clipped for better visualization.
3.1 Run-up height and its rheological contributors
Avalanche rheology controls run-up height differently depending on the flow regime. Figure 3a shows the time evolution of run-up height for a gravity-driven (Fr=0.1), a transitional (Fr=1), and an inertia-driven regime (Fr=5). The outermost curves form an envelope that captures the full variation due to these rheological differences. Within each regime, only the bulk rheological properties (internal friction, cohesion, and plastic compressibility) vary. Since the material parameter ranges are identical across all cases (cf. Table 1), the spread of curves in each regime directly illustrates the effect of avalanche rheology on run-up height. Panel (b) in Fig. 3 is discussed at a later stage (Sect. 3.3). It presents a conceptually similar analysis to panel (a), but for a distinct quantity. We apply the same subfigure presentation in Figs. 3, 4, 7, and 10.
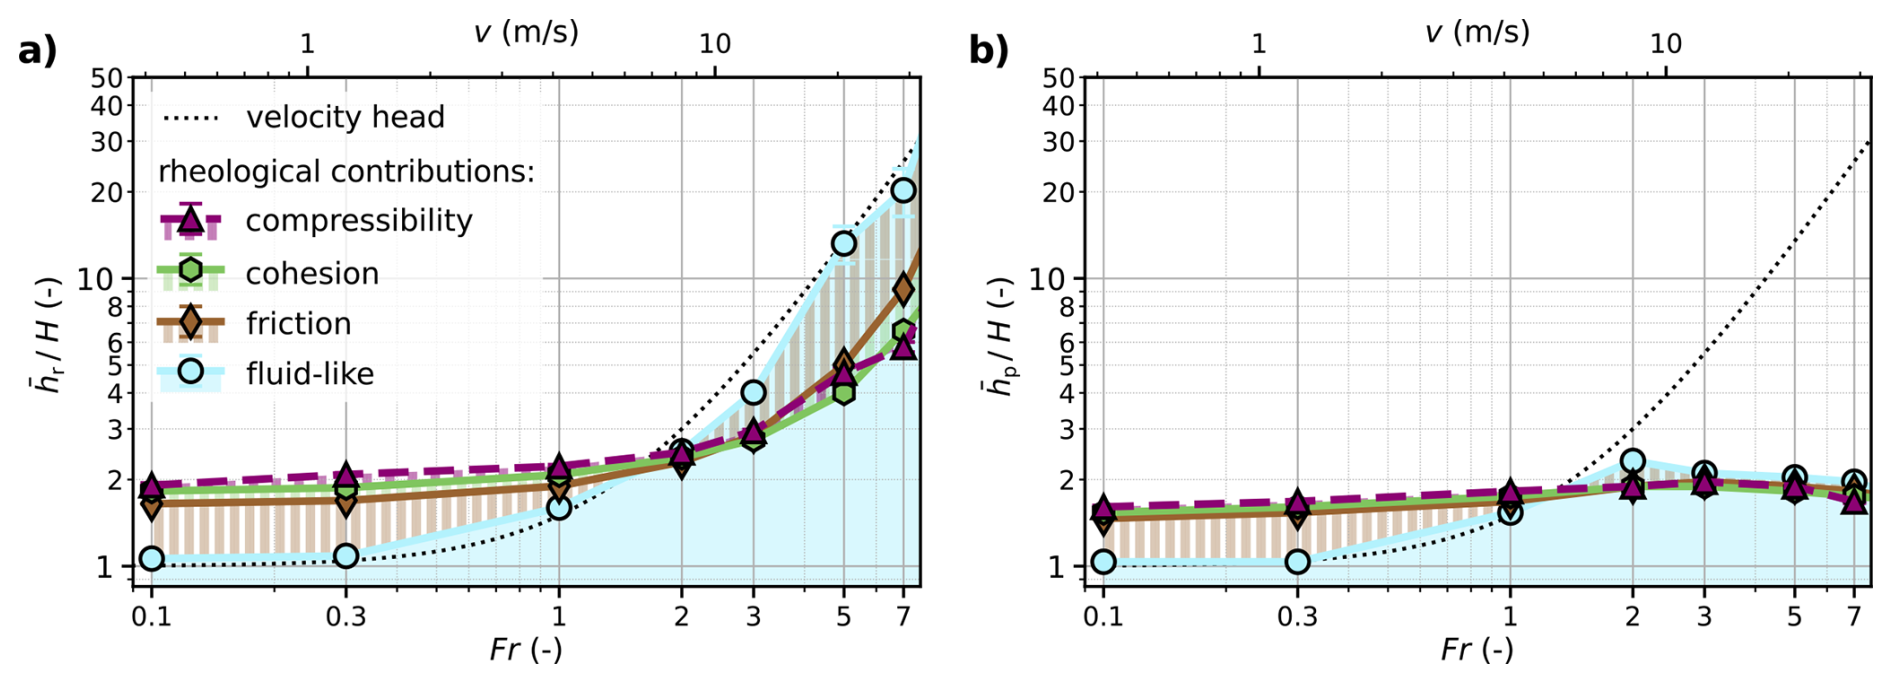
Figure 4Run-up height (a) and pressure height (b) contributions from inviscid, fluid-like behavior, friction, cohesion, and plastic compressibility for Fr=0.1 to 7. Starting with the simulation of inviscid, fluid-like flows (M=0.0, β=0.0, ), we progressively modify the corresponding material parameters to incorporate frictional, cohesive-frictional, and finally compressible cohesive-frictional behavior. The final material properties are M=0.8, β=0.3, . The velocity head (augmented by the addition of the flow height) is shown for reference.
Curves of the gravity-driven case (Fr=0.1) evolve smoothly toward a steady state, whereas curves of the transitional (Fr=1) and inertia-driven cases (Fr=5) exhibit initial peaks followed by the transition to steady conditions. These peaks originate from the rapid upward ejection of material at first contact with the obstacle. Because this idealized scenario assumes a uniformly deep flow with a vertical front, peak amplitudes may be sensitive to modeling simplifications; we therefore focus on steady-state run-up heights, which are more robust. Ratios of peak to mean steady-state run-up heights for all simulated cases are documented in Sect. S5.
In the steady state, rheological variation has the strongest influence in the inertia-driven regime (Fr=5): the corresponding envelope spans run-up heights from about 2 to over 30 times the initial flow height (i.e., a factor of approximately 15). At lower Fr the spreads are considerably smaller: a factor of about 3 for the gravity-driven case (Fr=0.1) and a factor of 2.5 for the transitional case (Fr=1). This contrasts with impact pressure buildup, where inertial effects outweigh rheology-related contributions in inertia-driven flows (Kyburz et al., 2020; Kohler et al., 2026a).
Analysis of the rheological-variation envelopes, however, does not isolate the contribution of individual rheological properties. In Fig. 4a, we achieve this through a virtual rheological decomposition, progressively introducing friction, cohesion, and plastic compressibility starting from an inviscid, fluid-like baseline, presented as stacked curves (similar to Kohler et al., 2026a; Kyburz et al., 2020).
The inviscid, fluid-like curve closely follows the velocity head augmented by the flow height, confirming that formulations based on Bernoulli's principle offer a reasonable first-order description of run-up on narrow obstacles. Introducing granular rheology has a twofold effect on run-up height. At low Fr, friction and cohesion increase run-up through quasi-static pile-up, in which stronger internal resistance supports a higher material accumulation at the obstacle (cf. Gravish et al., 2010); at high Fr, friction and cohesion increase energy dissipation during the conversion from kinetic to potential energy, thereby reducing run-up height. Plastic compressibility has a minor influence compared to friction and cohesion. Decomposition plots for other rheological parameters, confirming the representativeness of the selected ones, are provided in Sect. S6.

Figure 5Longitudinal sections of two simulated avalanches (left) and the corresponding impact pressure profiles (right), highlighting the difference between run-up and pressure height. Material-Point colors indicate stream-wise stress σxx. Panel (a) shows a gravity-driven case (Fr=0.1), and panel (b) an inertia-driven case (Fr=5); both share identical avalanche rheology (M=0.8, β=0.3, ).
3.2 Impact pressure distribution and the concept of pressure height
In engineering practice, run-up height is commonly assumed to define the vertical extent of idealized impact pressure distributions on narrow obstacles. Our simulations show that this conflates two distinct quantities. Figure 5 compares two exemplary time-averaged profiles of impact pressure for identical rheological properties but contrasting flow regimes: gravity-driven and inertia-driven.
In the gravity-driven case (Fig. 5a, Fr=0.1), significant pressure acts over a large fraction of the run-up height. In the inertia-driven case (Fig. 5b, Fr=5), the pressure distribution is confined to a much smaller height compared to the run-up height. To precisely quantify the vertical extent of significant impact pressure, we introduce the pressure height hp. We define hp as the height above the gliding surface (z=0) at which the smoothed impact pressure profile σxx(z) falls below 5 % of the depth-averaged impact pressure within the flow height, 〈σxx〉H. Profiles are smoothed using a second-order Savitzky-Golay filter with a 13-bin window (corresponding to a window height of ≈1.5 m). Impact pressure profiles for other rheological parameters, confirming the representativeness of the selected ones, are provided in Sect. S7.
Figure 6 generalizes this finding across the full parameter space. At low Froude numbers, pressure height and run-up height remain of comparable magnitude. Above Fr≈2, however, the two quantities diverge: while run-up continues to increase with Fr, pressure height saturates at approximately 1.5 to 2.5H. This saturation is consistent with the laboratory observations of Hauksson et al. (2007) discussed in the introduction.
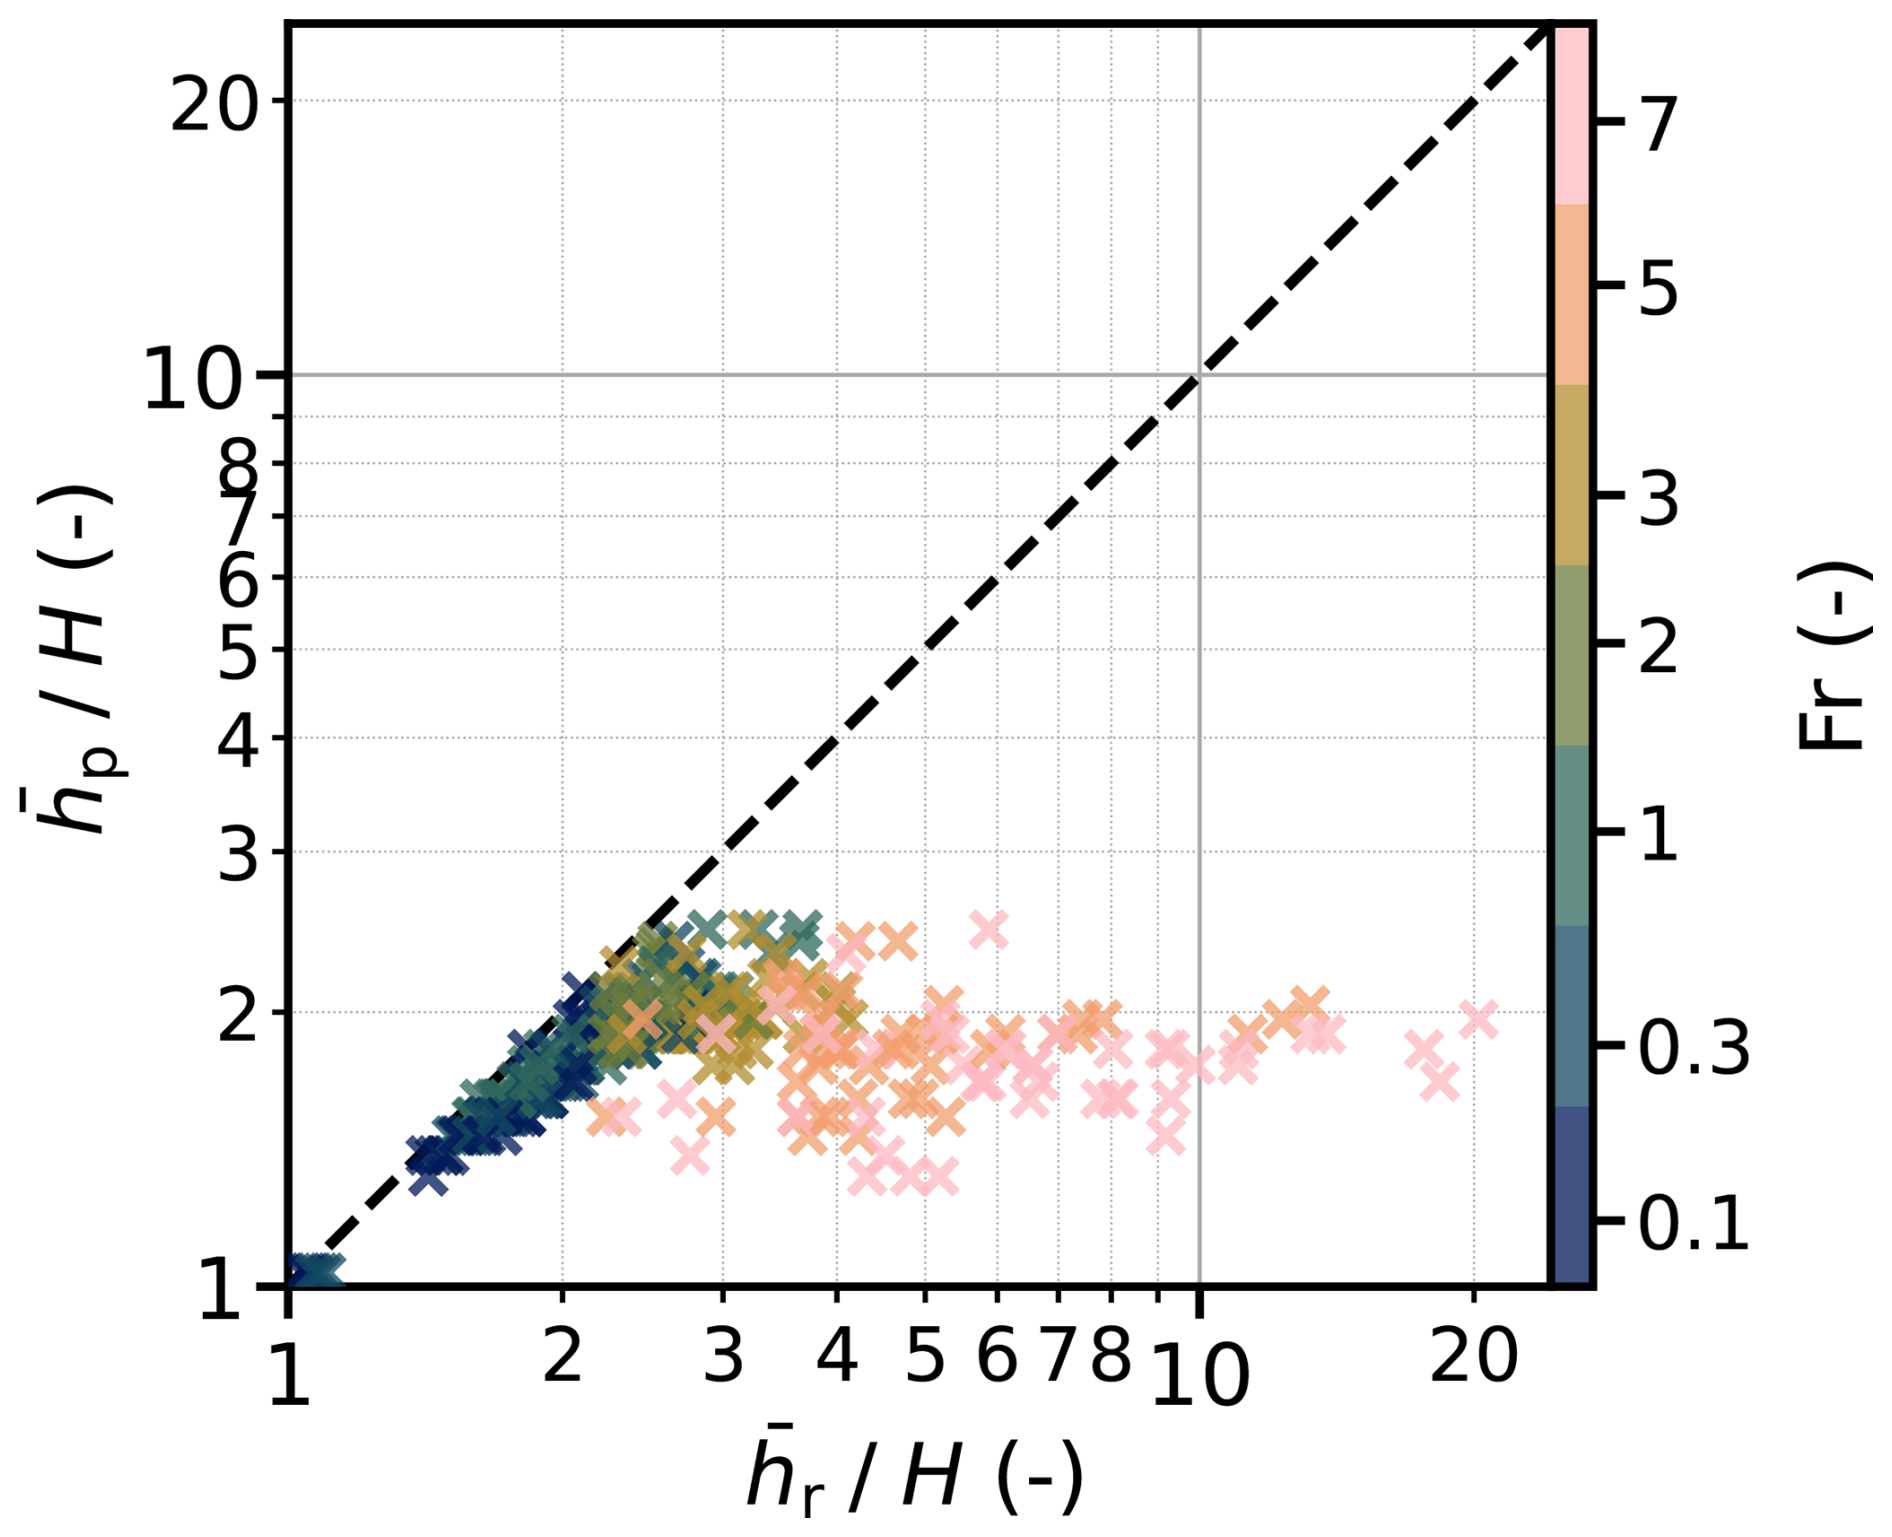
Figure 6Pressure height over run-up height for the displayed Fr-range and the entire material parameter space constituted of M′ and χ(pc=25).
Another observation from Fig. 5 is that both flow regimes show increasing pressure toward the obstacle base. This is noteworthy in the inertia-driven case, where a uniform velocity profile would suggest an approximately uniform pressure distribution, given the proportionality between impact pressure and velocity in this regime (Kyburz et al., 2020). We attribute this to material deflection at a dead zone, creating a local pressure concentration that grows toward the base. This is consistent with flume experiments on inertia-driven flows reporting profiles of similar shape during the initial jet-formation stage of impact (Armanini et al., 2011).
3.3 Pressure height and its rheological contributors
In direct analogy to Sect. 3.1, we examine how flow regime and avalanche rheology control pressure height, first through pressure height time series, then through isolation of rheological contributions for mean steady-state values, and finally by identifying the governing mechanisms.
The pressure height time series in Fig. 3b show that avalanche rheology has a more uniform influence on pressure height across all flow regimes than it does on run-up height. In steady state, the envelopes remain of similar magnitude across Froude numbers, merely showing a baseline shift from Fr=0.1 to the higher Froude numbers (Fr=1 and Fr=5). Unlike run-up, none of the curves exhibits pronounced transient peaks, regardless of flow regime or avalanche rheology (cf. Sect. S5).
Applying the same virtual rheological decomposition as in Sect. 3.1 to obtain stacked hp(Fr) curves, we find that up to Fr≈2, pressure height behaves similarly to run-up height (cf. Fig. 4b). The inviscid, fluid-like curve provides a baseline contribution, onto which frictional, cohesive, and plastic-compressibility effects add in a stacked manner. The influence of plastic compressibility is again minor compared to friction and cohesion. As for run-up height, we interpret this response as a quasi-static pile-up of material pushing against the obstacle. Beyond Fr≈2, however, pressure height saturates with Fr, indicating a fundamental change in the governing mechanisms.
For the inviscid, fluid-like case, lateral fluxes, inherent to the 3D nature of the present impact configuration, inhibit the formation of a persistent hydraulic jump, causing the pressure height to saturate. Under supercritical conditions, the incoming flow forms a vertical jet upon collision with the obstacle. For sufficiently wide obstacles, continued material accumulation ahead of the obstacle transforms the jet into a hydraulic jump (Armanini et al., 2011; Wu et al., 2023) that pushes statically against the obstacle, making pressure height equal to run-up height. For narrow obstacles, however, lateral fluxes inhibit this jump. The interaction remains deflection-driven, with particles deflected upward, losing streamwise velocity. Once that velocity approaches zero, momentum transfer to the obstacle diminishes while material continues to rise. Pressure height, therefore, saturates while run-up does not.
For granular rheologies, Fig. 4b shows that pressure height becomes nearly independent of velocity, pointing to another mechanism. We attribute this to dead-zone formation, a classical feature of granular impact that develops largely independently of flow velocity (Gray et al., 2003). At narrow, blunt obstacles, dead zones adopt wedge-shaped geometries (Tregaskis et al., 2022; Thibert et al., 2008), creating an internal interface between moving and static material where flow deflection occurs, and impact pressures concentrate. The formation, shape, and persistence of the dead zone are controlled by granular rheology rather than velocity, which explains the observed velocity independence of pressure height. We further expect this mechanism to depend strongly on obstacle geometry, particularly the relative width , as wider obstacles reduce lateral fluxes and sustain larger dead zones.
Together, these findings indicate that dead-zone formation and associated flow deflection govern pressure height on narrow obstacles, producing a behavior fundamentally different from run-up. Treating the two quantities as equivalent lacks physical justification, particularly in inertia-driven regimes.
These physical distinctions motivate separate semi-empirical expressions for run-up and pressure height, each reflecting its governing mechanism. We stay in line with the guideline formulation by adopting the velocity head together with a dissipation factor λ as the basis of the inertia-driven contribution, and by keeping a width-correction factor . We depart from it in two respects: we propose an additive decomposition in which a quasi-static term is added to the inertia-driven contribution, and we replace the dichotomy between dry, loose snow avalanches and dense snow avalanches with a continuous rheology-dependent parametrization. Rather than reproducing the full complexity of the 3D simulations, we aim to retain the dominant trends in a form suitable for engineering use.
The guideline formulation for run-up height goes back to Salm et al. (1990), who formalized the velocity head from Bernoulli's principle, Eq. (1), by introducing an empirical energy dissipation factor λ and a width-correction factor , yielding the expression
The dissipation factor λ depends on avalanche type, and accounts for the obstacle width w relative to the incoming flow height H. The guidelines consistently prescribe λ=1.5 for dry, loose snow avalanches and λ=2 to 3 for dense snow avalanches. The width-correction factor is given in tabular form and is well approximated by
4.1 Semi-empirical modeling of run-up and pressure height
Both run-up and pressure height arise from the superposition of a gravity-driven pile-up and an inertia-driven contribution, motivating the additive decomposition
where the index distinguishes between run-up (r) and pressure height (p). The linear regressions of Huber et al. (2021), adopted in ÖNORM B 4801 (Austrian Standards International, 2024), also yield a velocity-independent offset, further supporting an additive decomposition of run-up height.
We model the gravity-driven pile-up process identically for both quantities using the linear model
The factor ζi quantifies the quasi-static pile-up process due to internal resistance. We model this effect solely through the effective internal friction M′; plastic compressibility is omitted for simplicity. The fitting parameter ki controls the proportionality between M′ and ζi for run-up and pressure height, respectively. For inviscid, fluid-like material behavior (), Eq. (8) reduces to (i.e., ζi=0), consistent with experimental observations that subcritical water flows produce negligible run-up (Choi et al., 2015).
For the inertia-driven term, both run-up and pressure height follow the velocity head at low to moderate Fr. Run-up continues to scale with the velocity head at high Fr, whereas pressure height saturates beyond a characteristic Froude number (cf. Sect. 3.2). We capture this saturation by limiting the velocity head to a height threshold
computed from the fitted Froude number at saturation Frsat. Here we use Eq. (1) and . The inertia-driven contributions are then written as
In direct analogy to Eq. (5), the factors λi represent energy dissipation factors. We model these factors as increasing exponentially with the effective internal friction M′, with the rate controlled by the parameter κi. The exponential form empirically matches the trends presented in Sect. S8, and ensures λi=1 for , corresponding to the inviscid, fluid-like limit, while smoothly introducing friction-dependent dissipation for . This replaces the avalanche-type classifications of Salm et al. (1990) with a continuous rheology-based parametrization.
Table 3Regression coefficients for the run-up height and pressure height equation.
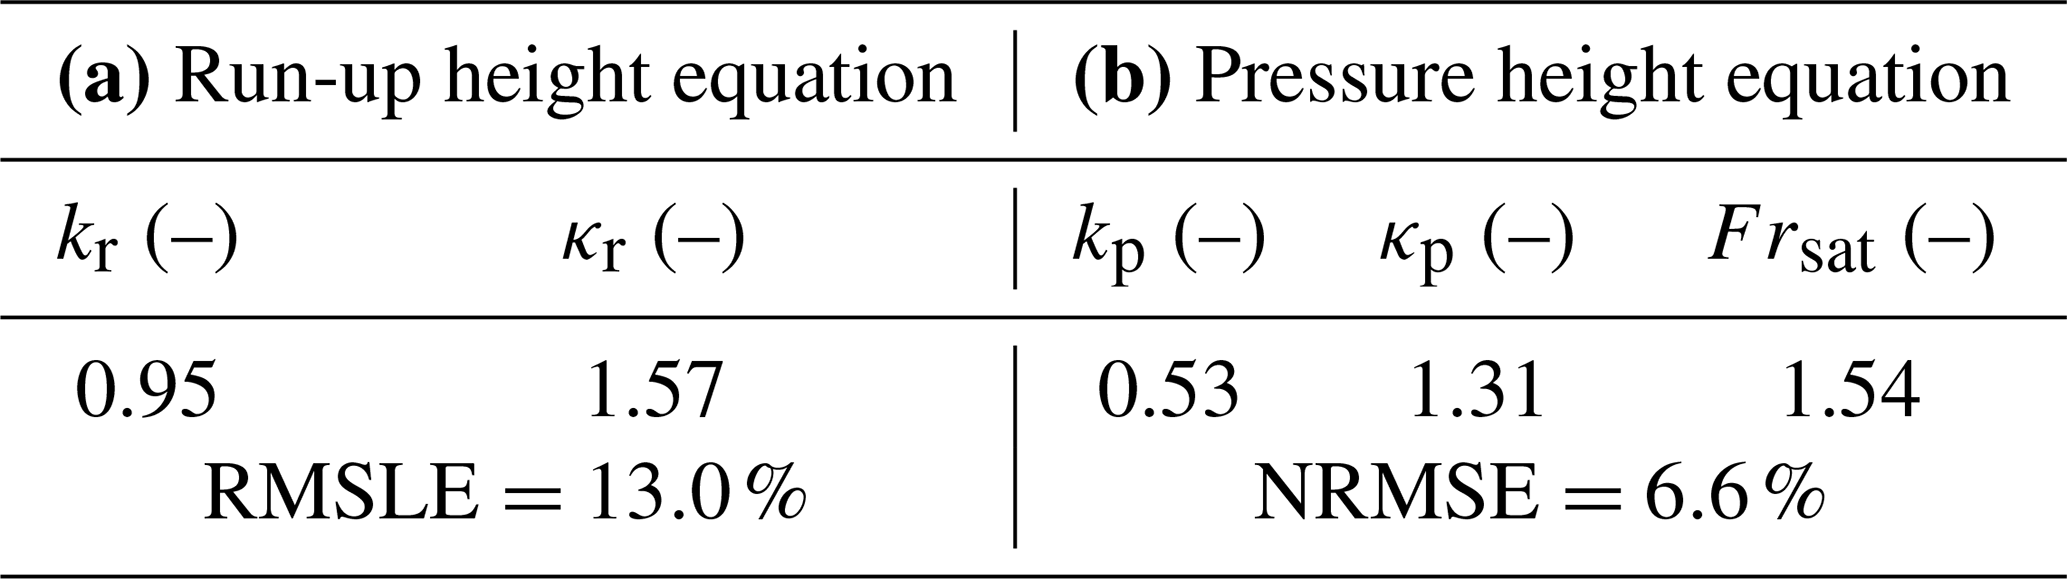
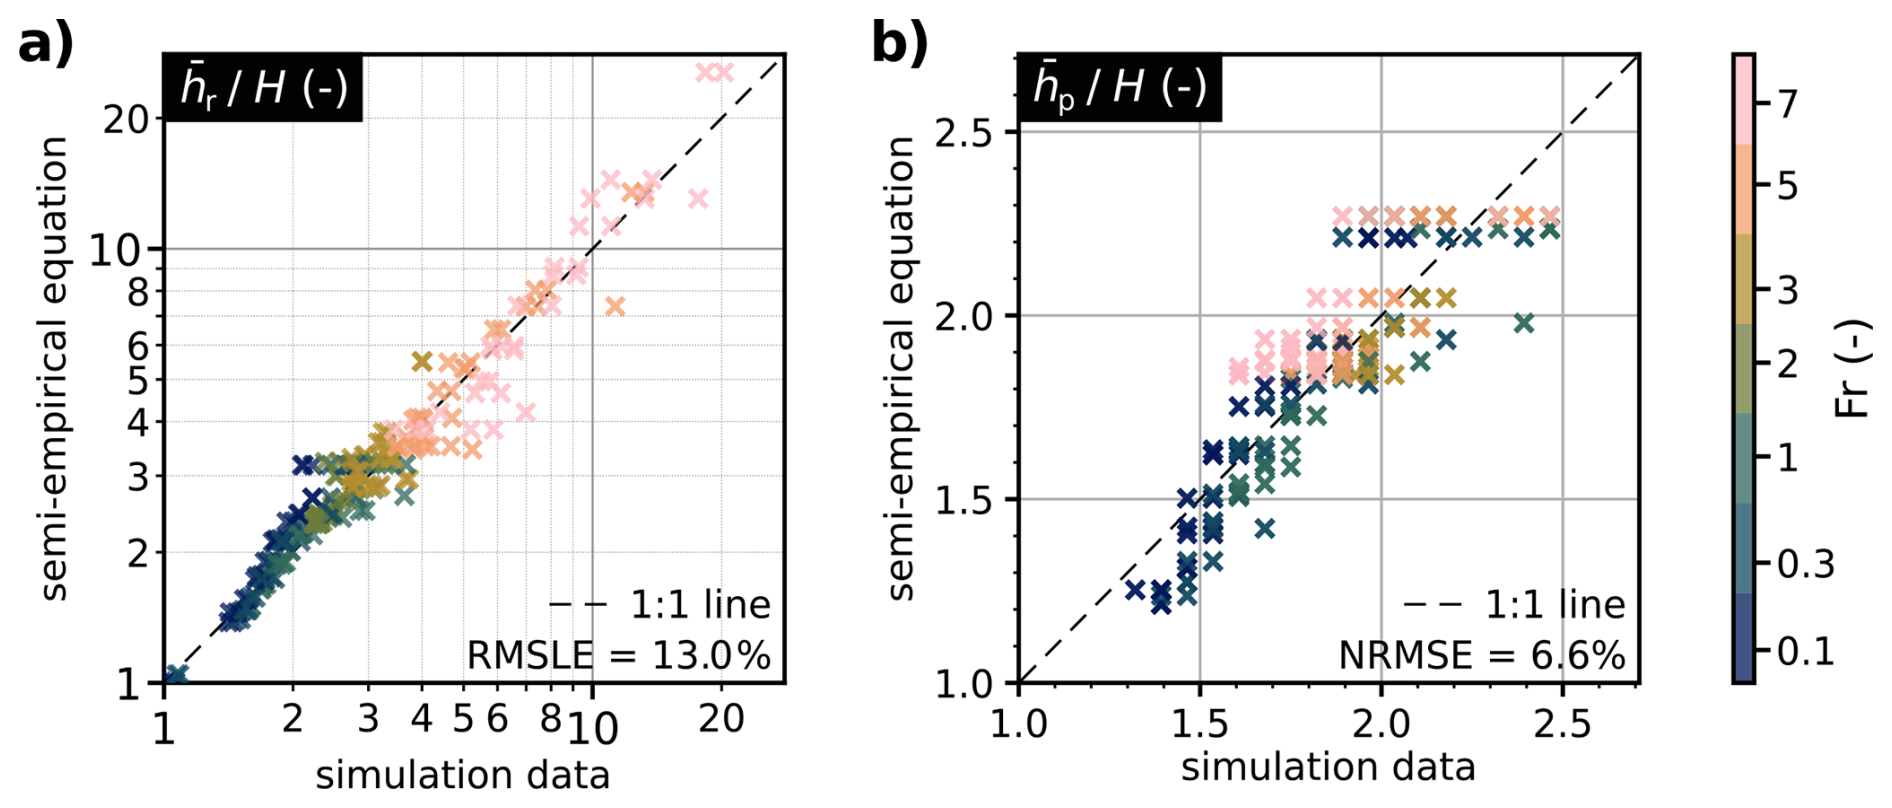
Figure 7Semi-empirical equation for run-up height (a) and pressure height (b) vs. simulation results for the displayed Fr-range, spanning all simulated M′ and χ(pc=25) values except .
We determine the regression parameters using the scipy.optimize.curve_fit routine (Virtanen et al., 2020). The four-parameter dataset comprises the effective internal friction M′, the plastic compressibility χ(pc=25), the flow velocity v, and the steady-state run-up or pressure height , spanning the parameter ranges stated in Tables 1 and 2, except for . Details on the derivation of the regression parameters and further performance metrics are reported in Sect. S8. We assess the run-up model using the root mean square logarithmic error (RMSLE), given the quadratic velocity dependence of run-up height, and the pressure height model using the normalized root mean square error (NRMSE). Figure 7 visualizes overall model performance.
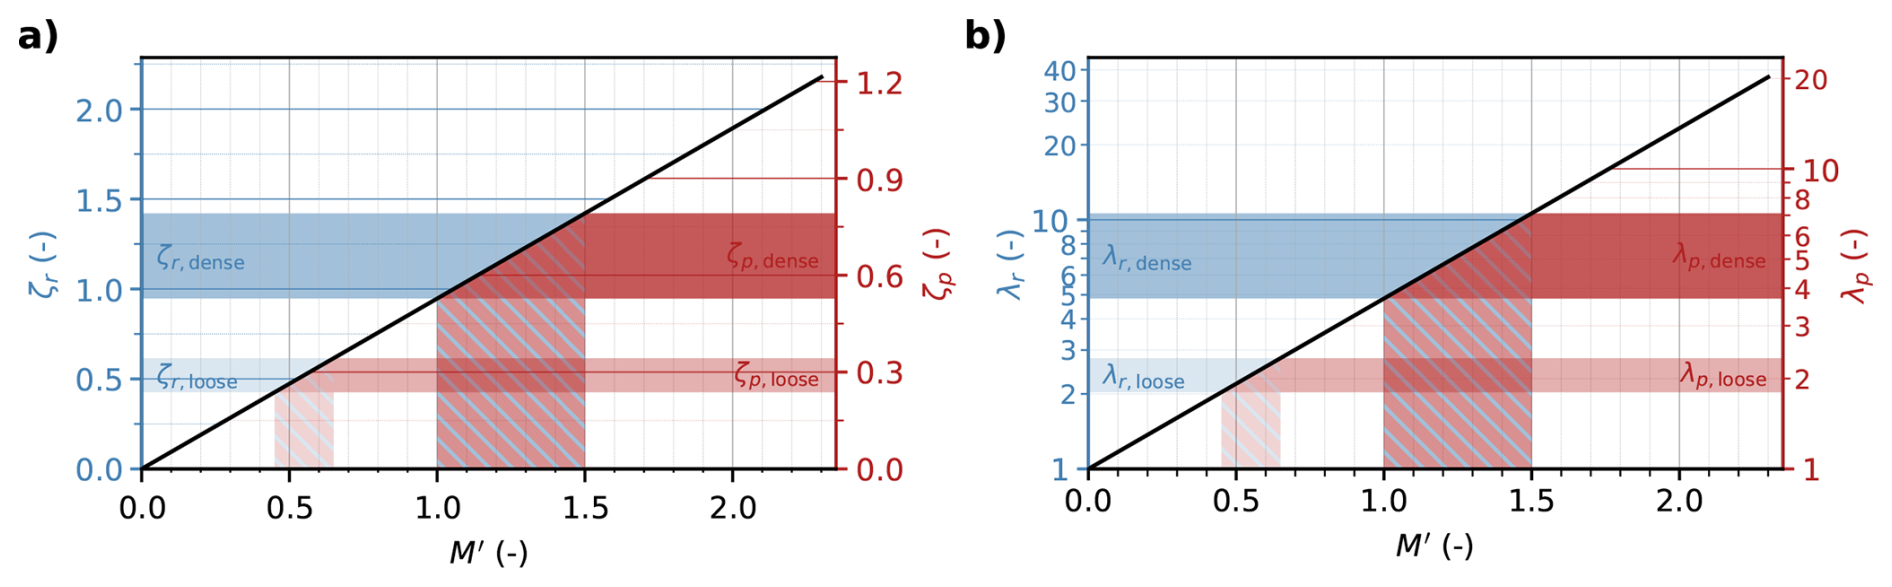
Figure 8Quasi-static magnification factors ζr and ζp (a), and dissipation factors λr and λp (b) for run-up and pressure height, respectively, over the effective internal friction M′. The hatched areas mark the recommended value range for M′ to match the run-up height of loose and dense snow avalanches from the guidelines. Note the different ordinate scalings.
Both equations perform best for low to moderate plastic compressibilities. The run-up height equation shows slightly improved accuracy for intermediate effective internal friction (); the accuracy of the pressure height equation shows no systematic dependence on M′. Across the full dataset, 92.9 % of simulated data points are predicted within ±25 % by the run-up height equation; the pressure height equation captures 100 % of the data within the same tolerance band. These values are drawn from a more detailed evaluation of the model performance, included in Sect. S8.
The resulting ζi(M′) and λi(M′) curves are shown in Fig. 8, with left ordinates giving the run-up height coefficients ζr and λr and right ordinates giving the pressure height coefficients ζp and λp.
4.2 Identification of rheological parameters
The introduction of the dissipation factor λ in Eq. (5) and its value range are mostly grounded in engineering judgment. Nevertheless, decades of application suggest that the formulation gives a reasonable first-order description of run-up height for the prescribed λ values. We exploit this by identifying the values of M′ for which our simulated run-up curves best match the guideline predictions (Eq. 5), effectively translating λ into the physically meaningful parameter space of M′. This further allows established engineering knowledge for run-up estimation to be transferred to the pressure-height formulation proposed here.
To this end, we compare simulated –Fr curves for all considered avalanche rheologies against those computed from the guidelines, restricting the analysis to the inertia-driven regime (), since Eq. (5) lacks a contribution from quasi-static pile-up. We quantify deviations between the simulated and guideline curves using the RMSLE as a function of M′.
The resulting RMSLE–M′ curves are shown in Fig. 9 for both dry, loose snow avalanches and dense snow avalanches. In both cases, distinct minima indicate clear correspondences between the suggested values for the dissipation factor λ and physically meaningful ranges of M′ within our numerical framework. The correspondence is consistent for both nearly incompressible and moderately compressible configurations. For dry, loose snow avalanches (λ=1.5), the best agreement occurs for . Dense snow avalanches (λ=3) correspond to higher friction levels, with . These parameter ranges are marked in Fig. 8.
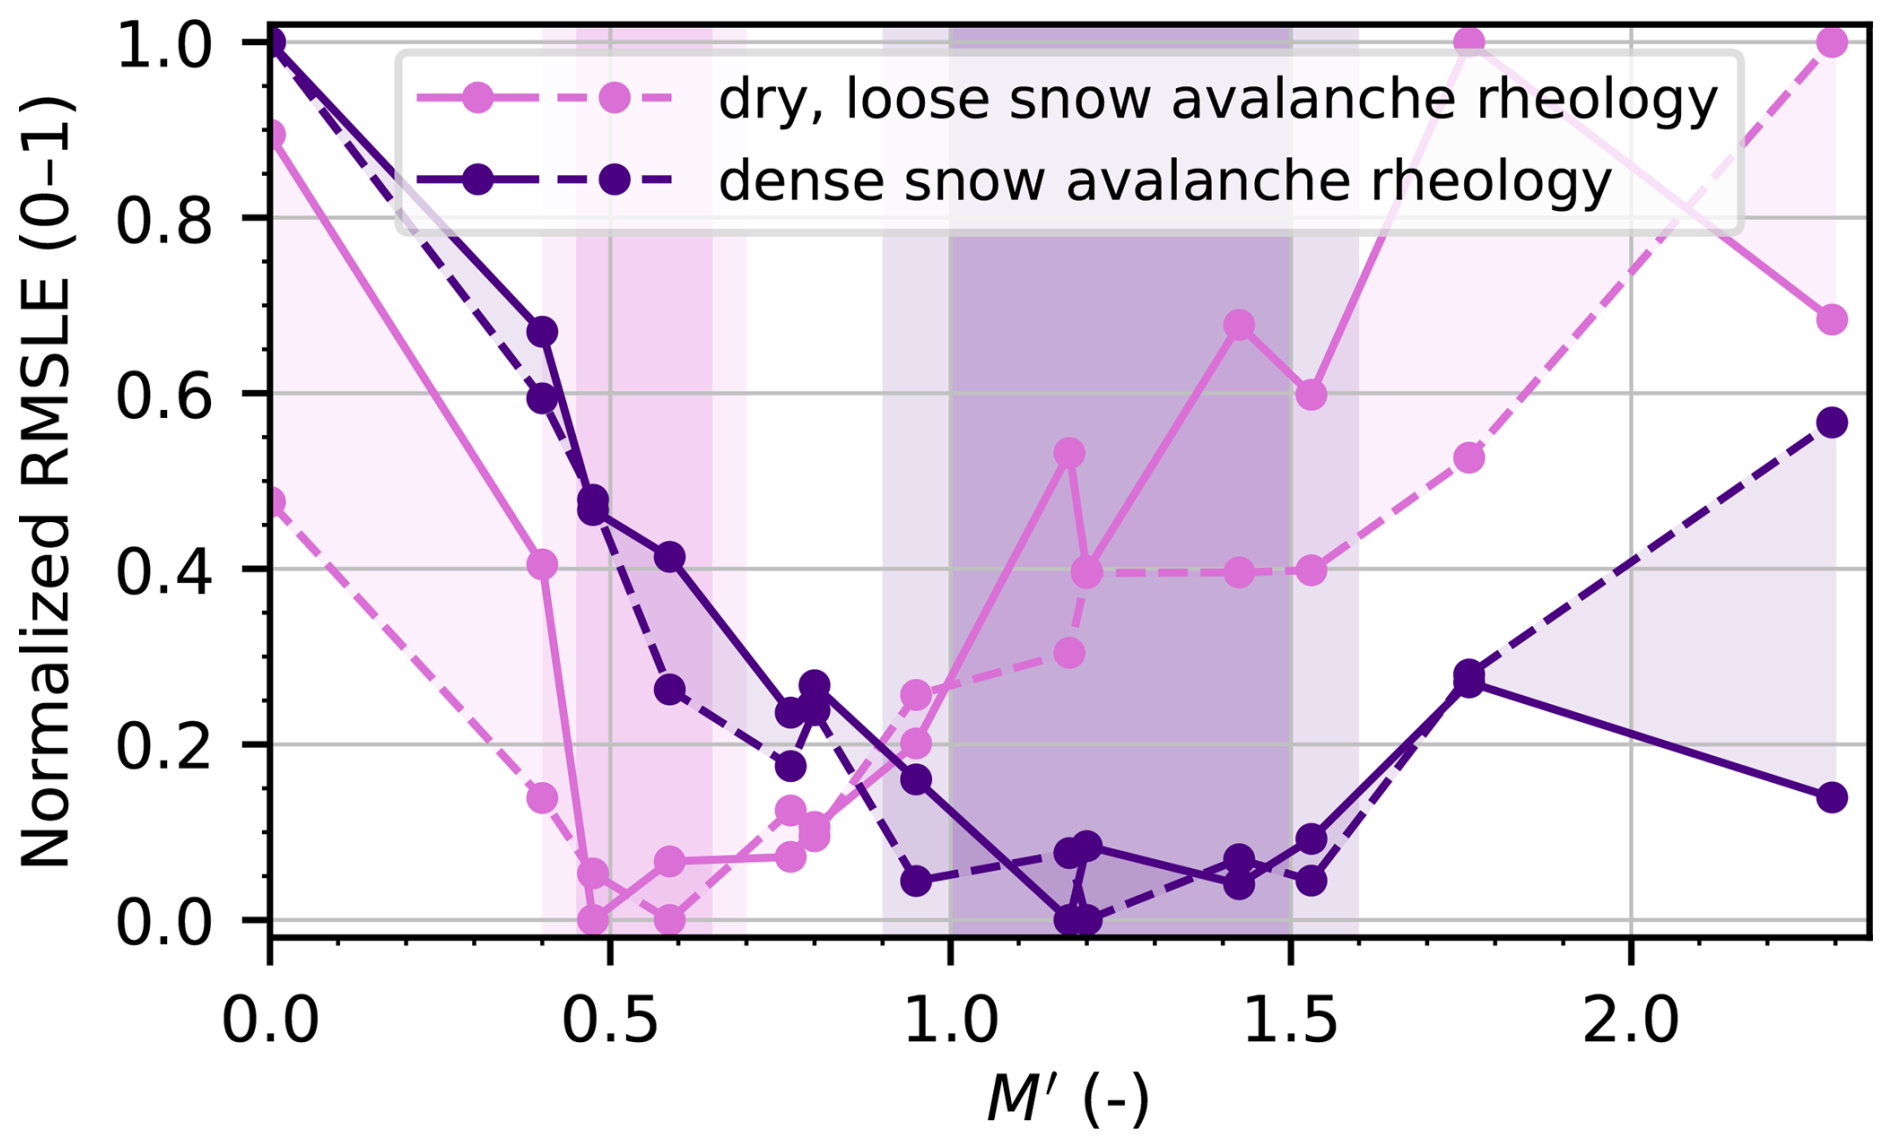
Figure 9Deviation between simulated run-up height and the run-up height predicted by the guidelines (Eq. 5) for dry, loose and dense avalanche rheology (using λ=1.5 and 3, respectively), plotted against the effective internal friction M′. The deviation is quantified using the RMSLE for each M′, evaluated only for the inertia-driven regime (). The resulting RMSLE – M′ curves are normalized to 0–1 to enable direct qualitative comparison. Continuous lines correspond to a nearly incompressible configuration (), whereas dashed lines represent a moderately compressible configuration (). Each avalanche rheology reveals a clear correspondence between the recommended values of the empirical dissipation factor λ and a range of M′ of the MPM model.
4.3 Influence of relative obstacle width
The width-correction factor reduces predicted run-up height for obstacles that are narrow relative to the flow height. We assess its validity within our numerical framework and test whether obstacle width affects run-up and pressure height similarly, using the rheological parameter ranges identified in Sect. 4.2 for dry, loose snow avalanches and dense snow avalanches.
For dry, loose snow avalanches, we use M=0.5 and β=0.15 (resulting in ) with , corresponding to moderate plastic compaction potential. For dense snow avalanches, we use M=0.9 and β=0.3 (resulting in ) with , corresponding to small plastic compaction potential. In both cases, we vary the relative obstacle width over . To sufficiently resolve narrow obstacles, we reduce the grid spacing to dx=0.125 m. A sensitivity analysis confirms robustness with respect to grid resolution (cf. Sect. S2). Similar to the width-correction factor in Eq. (5), we compute for each Fr
which can be interpreted as a width-correction factor for run-up (i=r) and pressure height (i=p), relative to the reference case . Note that this definition differs from that in the guidelines, where the reference case corresponds to . We therefore rescale Eq. (6) such that it satisfies at .

Figure 10Width-correction factors for run-up height (i=r, left column) and for pressure height (i=p, right column) plotted over the normalized obstacle width . The upper row (a.1, b.1) corresponds to dry, loose snow avalanche rheology (, M=0.5, β=0.15; ), and the lower row (a.2, b.2) corresponds to dense snow avalanche rheology (, M=0.9, β=0.3; ), following Sect. 4.2.
Run-up height is only weakly sensitive to obstacle width across both avalanche types, with slightly more pronounced dependence for dense snow rheology (cf. Fig. 10a.1 and a.2). Overall, the width correction proposed in the guidelines overestimates run-up height for and underestimates it for .
Pressure height is more sensitive to obstacle width, particularly in inertia-driven regimes (Fr=3 and Fr=5), where the numerical results closely follow the equation proposed in the guidelines (cf. Fig. 10b.1 and b.2). In gravity-driven (Fr=0.1) and transitional (Fr=1) regimes, the width dependence is substantially weaker. As for run-up height, the width correction proposed in the guidelines underestimates pressure height for .
For obstacles wider than the flow height (), the guidelines width correction is adequate: conservative for run-up height and accurate for pressure height. For narrower obstacles (), however, the simulations do not support the degree of reduction permitted by the guidelines. This is particularly relevant for slender structures such as cableway masts and transmission towers, where is common.
This study examined the run-up and impact pressure distribution of snow avalanches impacting narrow obstacles, with two aims: clarifying the underlying physical mechanisms and improving their representation in avalanche engineering guidelines. We addressed both through a comprehensive three-dimensional numerical study using MPM, systematically varying avalanche velocity and rheology.
Avalanche run-up on narrow obstacles can be quantified reasonably well by formulations based on the velocity head from Bernoulli's principle, provided that (i) a rheology-dependent gravity-driven term is included and (ii) energy dissipation is quantified through rheological properties. Friction and cohesion increase quasi-static pile-up in gravity-driven regimes but act dissipatively at higher Froude numbers, reducing inertia-driven run-up. Building on these trends, we proposed semi-empirical extensions of the velocity-head formulation used in the guidelines, continuously parameterized through the effective internal friction. Within this framework, the empirical avalanche-type dependent dissipation factors prescribed in the guidelines map systematically to distinct ranges of effective internal friction in our constitutive model. These are for dry, loose snow avalanches and for dense snow avalanches.
A central finding is that run-up height is not a reliable indicator of the vertical extent of significant impact pressure, particularly in inertia-driven regimes. While run-up may reach several flow heights, significant impact pressure remains confined to a much smaller extent, typically a few flow heights. We introduced pressure height as a distinct measure of this effective load height. Unlike run-up, pressure height is primarily controlled by flow deflection at a dead zone near the obstacle base. This process is governed by avalanche rheology rather than flow velocity. Even for inviscid, fluid-like rheology, pressure height saturates at a characteristic Froude number, marking the onset of supercritical conditions. For practical application of these findings, assuming a maximum pressure height of approximately three flow heights provides a conservative approximation, consistent with the experimental observations of Hauksson et al. (2007).
Width effects are most pronounced for pressure height in inertia-driven regimes and negligible in gravity-driven regimes. The width-correction factor adopted in the guidelines is adequate for obstacles wider than the flow height. For narrower obstacles, the configuration typical of cableway masts and transmission towers, our results do not support the magnitude of reduction prescribed by the guidelines for either run-up or pressure height, and we recommend limiting to a minimum of 0.7 for . Referenced to , as in Fig. 10, this corresponds to holding at unity.
In Appendix A, we apply the proposed pressure height formulation to the avalanche impact calculation example of Jóhannesson et al. (2009, Sect. E.2) and compare the resulting base shear and base moment with the load models of Jóhannesson et al. (2009) and those from the Swiss guidelines (Margreth et al., 2015). The proposed approach does not systematically raise or lower the design actions, but redistributes them: in fast conditions, at , it gives base actions up to 28 % below the two references. In slow conditions, at , however, it exceeds the base actions calculated following the Swiss guidelines by 15 % to 25 %, because the pressure height features a velocity-independent contribution.
This study builds on several simplifying assumptions that limit its scope. The analysis is restricted to plug flow velocity profiles, whereas many avalanche flow regimes exhibit pronounced shear (Köhler et al., 2018). Only dense, granular snow avalanches are considered; effects related to powder snow avalanches are beyond the scope of this work. The constitutive model has neither thermo-mechanical coupling nor a liquid water phase, so temperature and liquid water content enter only through their effect on the bulk rheological parameters. The study is further confined to steady conditions, yet temporal variability in flow height, velocity, or density is a principal source of uncertainty in avalanche impact (Jóhannesson et al., 2009).
Taken together, these assumptions delimit the conditions under which we have the highest confidence in the proposed formulations:
-
dense, cohesive-frictional flow at approximately steady conditions (cf. Sect. S8),
-
plug-like velocity profiles, at velocities up to about 30 m s−1,
-
obstacles with rectangular cross sections and relative widths of ,
-
approximately constant temperature and liquid water content at the instant of impact.
The raised limitations point directly to the most pressing directions for future work. Extending the framework to sheared or unsteady inflow conditions would remove the two most restrictive assumptions. A dedicated geometrical parametric study, varying obstacle width, flow height, and cross-sectional shape independently, could clarify the role of flow height and test the universality of Froude number scaling. Such a study, extending and building on the analysis of Huber et al. (2021), would also provide the empirical basis needed to derive shape-dependent correction factors for run-up, similar to the drag coefficients used for impact pressure estimation (Jóhannesson et al., 2009). Transient peak run-up and the vertical loading on protruding structural elements also offer promising ground for numerical and experimental investigation.
The proposed formulations, despite being grounded in systematic rheological analysis, remain semi-empirical; a closed analytical treatment appears difficult to achieve for spatial impact problems. Semi-empirical approaches supplemented by three-dimensional simulations, however, offer a pragmatic path toward more general methods.
Jóhannesson et al. (2009, Sect. E.2), henceforth referred to as the EC handbook, presents a worked calculation example of an avalanche impacting a circular mast (Table A1, original scenario). A front velocity of 30 m s−1 places this design avalanche between a fast dry, loose snow avalanche and a mixed powder snow avalanche (PSA) (Rudolf-Miklau et al., 2014). The EC handbook therefore compares its mixed PSA load model with the dense flow load model of the Swiss guidelines (Margreth et al., 2015), which is defensible for a scenario situated between the two regimes. We also apply our proposed pressure height concept to this example, noting that this article mainly concerns dense flows and that the original example scenario thus sits at the margin of its applicability. We nevertheless evaluate the original scenario first, because it is a published and familiar reference case.
We subsequently present a second calculation in which we reduce the front velocity of the design avalanche to 10 m s−1, placing the scenario in the dense regime our approach mainly addresses (Table A1, modified scenario). The EC handbook gives no load model for purely dense avalanche impact but refers to the Swiss guidelines; we therefore compare our approach to the Swiss guidelines alone in this second scenario.
For comparability between the approaches, and to remain consistent with the EC handbook, we apply the same dynamic pressure within the dense flow depth in all approaches in both scenarios; they differ only in how they distribute the load above and below it. We note, however, that especially in the slower modified scenario, an impact pressure estimate accounting for gravitational pressure may be more appropriate (e.g., Kyburz et al., 2022). In both scenarios, the rheological parameter of our approach and the dissipation factor of the Swiss guidelines are chosen consistently with the correspondence established in Sect. 4.2.
A1 Original scenario
The Swiss guidelines distribute the dynamic avalanche pressure uniformly over the flow depth and let it decrease linearly to zero over the run-up height, , with λ=1.5 and for (following our continuous approximation, Eq. 6). We adopt the dissipation factor λ recommended for dry, loose avalanches (Margreth et al., 2015), whereas the EC handbook applies λ=2.5 in this example. Since the run-up height is measured from the flow surface, the load would extend to 21.1 m above the ground. For fluidized avalanches () the Swiss guidelines (Margreth et al., 2015) propose limiting the run-up height to , referring explicitly to the rules of the EC handbook. Applying this limit, , the load extends to only 6.5 m above the ground.
The mixed PSA load model of the EC handbook also holds the dynamic pressure constant over the dense flow depth. It adopts a drag coefficient of CD=1.5 within the dense flow and in the snow cover, whereas CD=1 is prescribed for the fluidized layer and the powder part above the dense flow. Below the dense flow, the model accounts for stress transmission through the snow cover and assumes a linear decrease to zero at ground level. Above the dense flow, the dynamic pressure decreases linearly over the assumed thickness of the fluidized layer, , but not to zero: it drops to the pressure assumed for a fluidized layer, with . The powder cloud extends above the fluidized layer, and its thickness grows with the distance traveled along the avalanche track, . Over this thickness, qfl decreases following a power law to zero at the top of the powder cloud, 14.6 m above the ground (Eq. 12.31 in the EC handbook); we adopt an exponent of one, hence a linear decrease. The jump in the load profile at the flow surface in Fig. A1 arises from the change in CD between the dense and the fluidized layer.
Like the reference method from the Swiss guidelines, used in the original example from the EC handbook, our approach does not account for loading caused by a fluidized layer or a powder part and mainly concerns dense avalanche impact. Instead of the run-up height, we use the pressure height as a dedicated load distribution parameter (cf. Table 3 for the following). For the present dry, loose flow, we assume , which corresponds to (Fig. 1). The gravity-driven (i.e., velocity-independent) part of the pressure height then follows as
For the inertia-driven part, we first compute the saturation height for the given flow height
from which the inertia-driven pressure height follows as
The obstacle width relative to the flow depth enters through
that is, through the same width function as in Margreth et al. (2015), normalized to its value at and capped there. Consequently, we set for every obstacle narrower than the flow is deep, as in the present example with . Expressed against the reference width of the guidelines (), this cap corresponds to the recommended minimum of stated in Sect. 5, since . The pressure height then follows as
measured from the base of the flow, so that the load extends to 5.2 m above the ground.
Figure A1 shows the resulting load distributions together with the base shear V and the base moment M they integrate to. The Swiss guidelines, with the run-up height limited to , give V=1063 kN and M=3569 kN m. The EC handbook gives a comparable base moment, M=3574 kN m, but a 12 % larger base shear, V=1195 kN. This is mainly due to the force transmitted through the snow cover (228 kN) and the powder part (41 kN), which overcompensate the smaller load applied in the fluidization zone (319 kN compared to the 456 kN within the run-up height of the Swiss guidelines). Our approach gives the smallest reaction forces, V=866 kN and M=2570 kN m, corresponding to −19 % and −28 % relative to the Swiss guidelines, and to −28 % in both quantities relative to the EC handbook. The difference is larger for the base moment than for the base shear, because all three approaches share the load within the flow depth and differ only in its distribution above and below, which shifts the points of application of the corresponding force resultants.
A2 Modified scenario
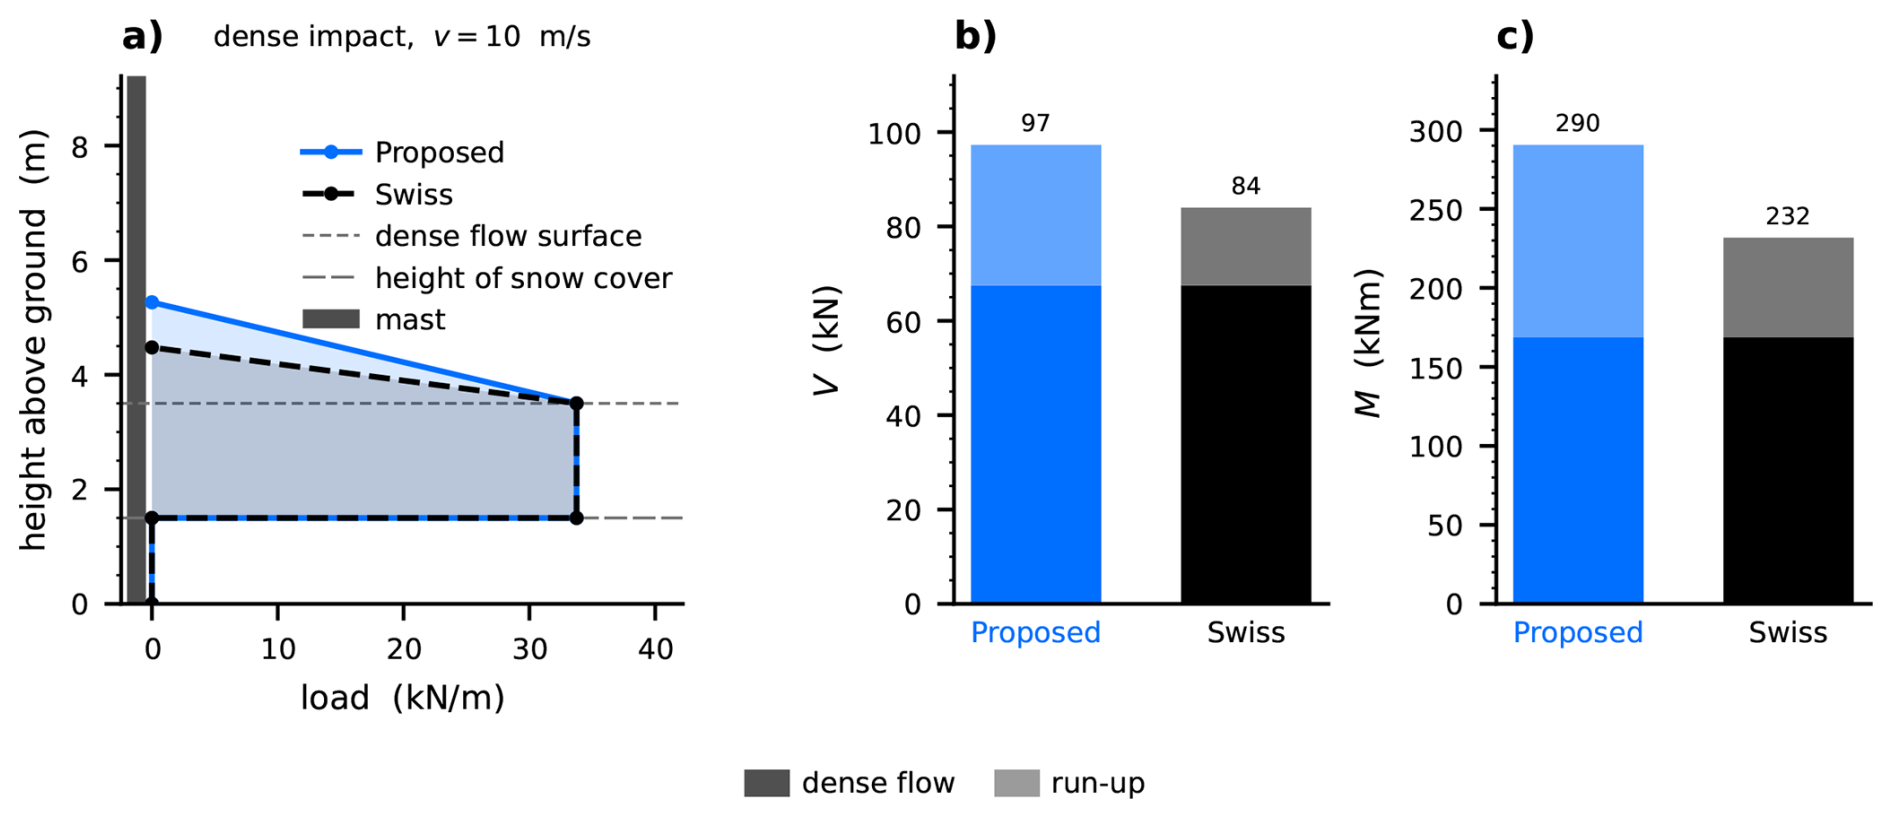
We now consider a dense flow impacting the same mast at a front velocity of , leaving all other parameters of Table A1 unchanged. At this velocity, the run-up height is no longer limited to according to the Swiss guidelines, but is evaluated at its full value, , using λ=3, the value recommended for dense avalanches (Margreth et al., 2015). Correspondingly, we set () in our approach, from which the pressure height amounts to hp=3.8 m, measured from the bottom of the flow depth.
Figure A2 shows that the ranking of the two approaches reverses in this regime. The Swiss guidelines now give the smaller reaction forces, V=84 kN and M=232 kN m, because their load distribution proxy, the run-up height, scales purely with v2 and has become small. Our approach gives V=97 kN and M=290 kN m, that is, 15 % and 25 % above the base reactions computed from the Swiss guidelines. At this velocity, the pressure height is dominated by its gravity-driven part, which scales with M′ and the flow height rather than with velocity.
Both scenarios shown here are single points of an approximate velocity range empirically representative of the given avalanche regime. To increase the generality of the findings, we repeat each regime comparison over its typical velocity range (Rudolf-Miklau et al., 2014), holding the remaining inputs at the values of Table A1. The two sweeps are given in Sect. S9 and support the reading above.
In summary, the main advantage of the proposed approach is not that it lowers or raises the design actions relative to the guidelines. Rather, it lies in the fact that the pressure height physically better reflects the loading of a dense avalanche on a narrow obstacle: it combines an inertia-driven part, which saturates under supercritical conditions (beyond Frsat≈1.5), with a gravity-driven part, which scales with the flow depth and persists at low velocities. Concepts of the EC handbook can be combined with this framework, in particular the stress transmission through the snow cover, which we consider physically justified and which contributes 228 kN to the base shear in the original scenario. For such extensions, one may also revisit the constant load shape assumed within the flow depth and consider a more bottom-heavy distribution, as discussed in Sect. 3.2. Since this study did not address effects of flow fluidization, whether the pressure height concept carries over to the impact of mixed powder snow avalanches remains to be resolved.
Table A1Example scenario: avalanche impact on a circular mast (taken from Jóhannesson et al., 2009).
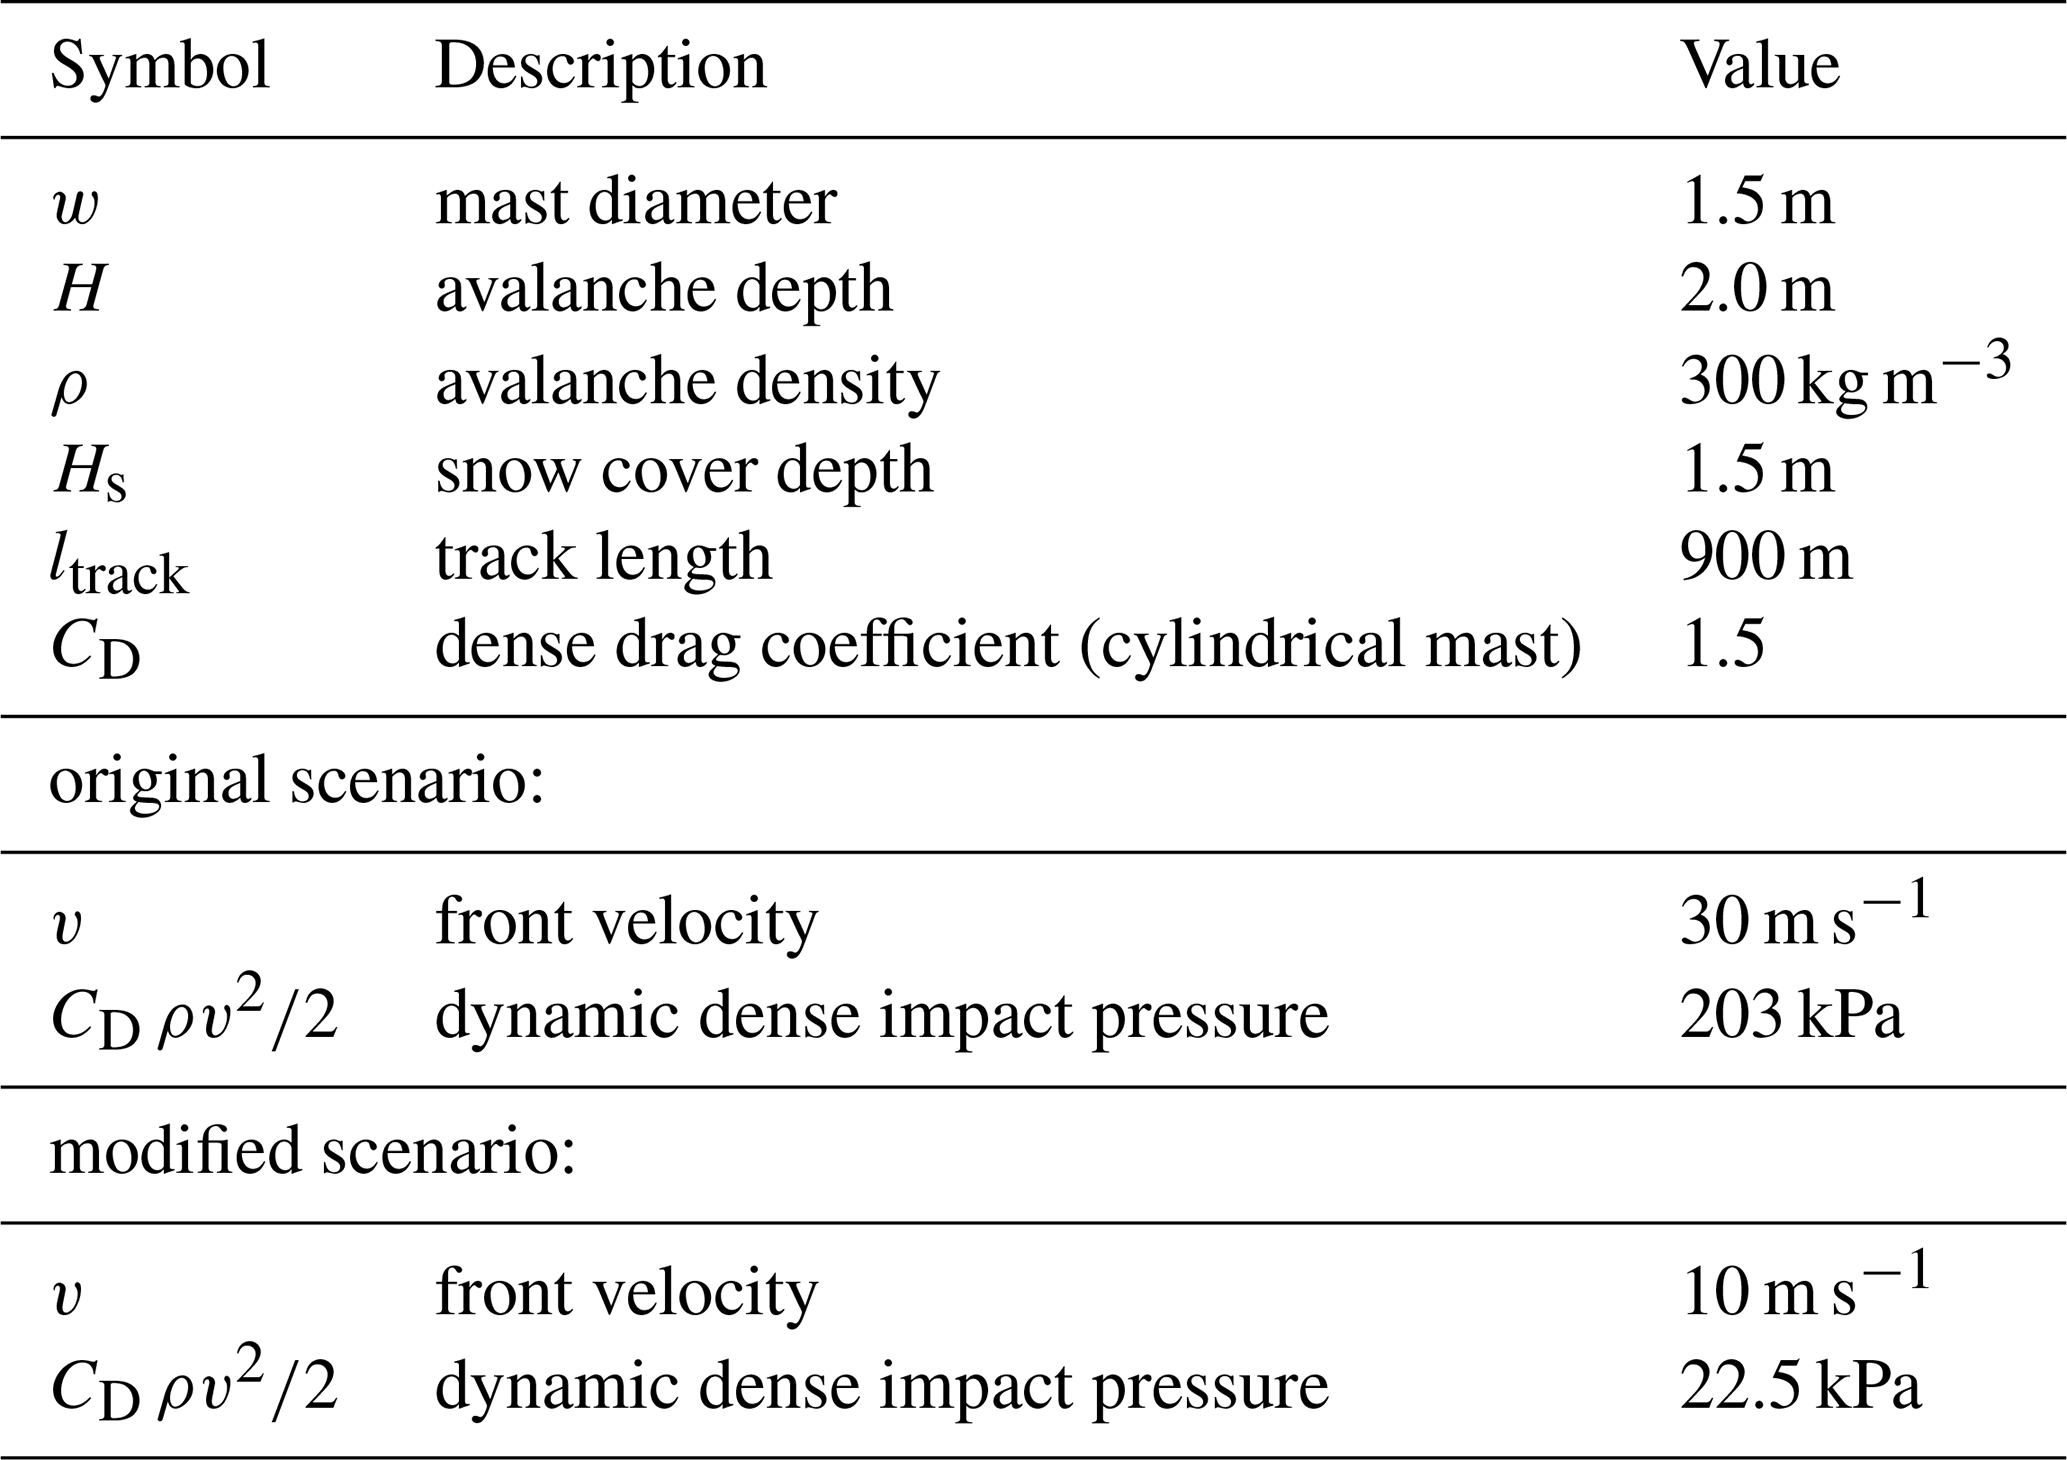

Figure A1Line-load distributions over height (a) and the base shear (b) and base moment (c) they integrate to, for the mast of the EC handbook example at . The bars are split into the parts of the load they integrate; all three approaches share the dense flow contribution and differ in what they add around it. The EC handbook is the only approach that considers loads from the snow cover, a fluidized layer and a powder part, and that changes CD at the flow surface, hence the jump in its profile.
The main raw time-series data, a postprocessing script reproducing the key figures, and the regression of the equations are publicly available in a Zenodo repository https://doi.org/10.5281/zenodo.18847594 (Kohler et al., 2026b).
The supplement related to this article is available online at https://doi.org/10.5194/nhess-26-5167-2026-supplement.
Michael J. Kohler: Writing – original draft, Visualization, Validation, Methodology, Investigation, Formal analysis, Data curation, Conceptualization. Johan Gaume: Writing – review & editing, Validation, Supervision, Software, Methodology, Investigation, Conceptualization. Christophe Ancey: Writing – review & editing, Supervision. Betty Sovilla: Writing – review & editing, Supervision, Resources, Project administration, Methodology, Investigation, Funding acquisition, Conceptualization.
The contact author has declared that none of the authors has any competing interests.
Publisher's note: Copernicus Publications remains neutral with regard to jurisdictional claims made in the text, published maps, institutional affiliations, or any other geographical representation in this paper. The authors bear the ultimate responsibility for providing appropriate place names. Views expressed in the text are those of the authors and do not necessarily reflect the views of the publisher.
During the preparation of this manuscript, the authors used large language models (ChatGPT and Claude) and DeepL to assist with improving language and readability. All content generated or modified using these tools was carefully reviewed and edited by the authors, who take full responsibility for the final manuscript. No AI tools were used for the interpretation of the results or for drawing scientific conclusions.
This research has been supported by the Schweizerischer Nationalfonds zur Förderung der Wissenschaftlichen Forschung (grant no. 207323).
This paper was edited by Erich Peitzsch and reviewed by two anonymous referees.
Armanini, A., Larcher, M., and Odorizzi, M.: Dynamic Impact of a Debris Flow Front against a Vertical Wall, Italian Journal of Engineering Geology and Environment, 1041–1049, https://doi.org/10.4408/IJEGE.2011-03.B-113, 2011. a, b, c
Austrian Standards International: ÖNORM B 4801, https://www.austrian-standards.at/de/shop/onorm-b-4801-2024-10-01~p3815092 (last access: 30 September 2026), 2024. a, b, c, d
Bartelt, P., Salm, B., and Gruber, U.: Calculating Dense-Snow Avalanche Runout Using a Voellmy-fluid Model with Active/Passive Longitudinal Straining, J. Glaciol., 45, 242–254, https://doi.org/10.3189/S002214300000174X, 1999. a
Bartelt, P., Caviezel, A., Degonda, S., and Buser, O.: Avalanche Impact Pressures on Structures with Upstream Pile-Up/Accumulation Zones of Compacted Snow, Nat. Hazards Earth Syst. Sci. Discuss. [preprint], https://doi.org/10.5194/nhess-2018-154, 2018. a
Blatny, L., Löwe, H., Wang, S., and Gaume, J.: Computational Micromechanics of Porous Brittle Solids, Comput. Geotech., 140, 104284, https://doi.org/10.1016/j.compgeo.2021.104284, 2021. a
Choi, C. E., Au-Yeung, S. C. H., Ng, C. W. W., and Song, D.: Flume Investigation of Landslide Granular Debris and Water Runup Mechanisms, Geotech. Lett., 5, 28–32, https://doi.org/10.1680/geolett.14.00080, 2015. a, b, c
Eidevåg, T., Thomson, E. S., Kallin, D., Casselgren, J., and Rasmuson, A.: Angle of Repose of Snow: An Experimental Study on Cohesive Properties, Cold Reg. Sci. Technol., 194, 103470, https://doi.org/10.1016/j.coldregions.2021.103470, 2022. a
Faug, T.: Macroscopic Force Experienced by Extended Objects in Granular Flows over a Very Broad Froude-number Range, Eur. Phys. J. E, 38, 34, https://doi.org/10.1140/epje/i2015-15034-3, 2015. a
Faug, T.: Impact Force of Granular Flows on Walls Normal to the Bottom: Slow versus Fast Impact Dynamics, Can. Geotech. J., 58, 114–124, https://doi.org/10.1139/cgj-2019-0399, 2021. a
Faug, T., Chanut, B., Beguin, R., Naaim, M., Thibert, E., and Baroudi, D.: A Simple Analytical Model for Pressure on Obstacles Induced by Snow Avalanches, Ann. Glaciol., 51, 1–8, https://doi.org/10.3189/172756410791386481, 2010. a
Gaume, J., Gast, T., Teran, J., van Herwijnen, A., and Jiang, C.: Dynamic Anticrack Propagation in Snow, Nat. Commun., 9, 3047, https://doi.org/10.1038/s41467-018-05181-w, 2018. a, b
Gravish, N., Umbanhowar, P. B., and Goldman, D. I.: Force and Flow Transition in Plowed Granular Media, Phys. Rev. Lett., 105, 128301, https://doi.org/10.1103/PhysRevLett.105.128301, 2010. a
Gray, J. M. N. T., Tai, Y.-C., and Noelle, S.: Shock Waves, Dead Zones and Particle-Free Regions in Rapid Granular Free-Surface Flows, J. Fluid Mech., 491, 161–181, https://doi.org/10.1017/S0022112003005317, 2003. a
Gubler, H., Hiller, M., Klausegger, G., and Suter, U.: Messungen an Fliesslawinen. Zwischenbericht 1986, Tech. Rep. 41, Eidg. Institut f. Schnee- und Lawinenforschung, CH-7260 Weissfluhjoch/Davos, https://dora.lib4ri.ch/wsl/dload/wsl:27867/PDF/Gubler-1986-Messungen_an_Fliesslawinen._Zwischenbericht_1986-(published_version).pdf (last access: 30/09/2026), 1986. a
Hákonardóttir, K. M.: A Laboratory Study of the Interaction between Supercritical, Shallow Flows and Dams, Greinargerð/Veðurstofa Íslands, Veðurstofa Íslands, https://www.vedur.is/gogn/snjoflod/varnarvirki/03038.pdf (last access: 30 September 2026), 2003. a
Hauksson, S., Pagliardi, M., Barbolini, M., and Jóhannesson, T.: Laboratory Measurements of Impact Forces of Supercritical Granular Flow against Mast-like Obstacles, Cold Reg. Sci. Technol., 49, 54–63, https://doi.org/10.1016/j.coldregions.2007.01.007, 2007. a, b, c
Huber, A., Gems, B., Oesterle, F., and Granig, M.: 3D-numerische Modellierung Der An- Und Umströmung von Seilbahnmasten Durch Fließprozesse Mit Flow-3D, WLV Journal, 85, 271–272, https://www.wlv-austria.at/journal/journal-archiv/56-2021-heft-187 (last access: 30 September 2026), 2021. a, b, c
Iverson, R. M., George, D. L., and Logan, M.: Debris Flow Runup on Vertical Barriers and Adverse Slopes, J. Geophys. Res.-Earth, 121, 2333–2357, https://doi.org/10.1002/2016JF003933, 2016. a
Jóhannesson, T., Gauer, P., Issler, D., and Lied, K., eds.: The Design of Avalanche Protection Dams – Recent Practical and Theoretical Developments, Publications Office of the European Union, Brussels, ISBN 978-92-79-08885-8, https://doi.org/10.2777/12871, 2009. a, b, c, d, e, f, g, h
Kamrin, K., Hill, K. M., Goldman, D. I., and Andrade, J. E.: Advances in Modeling Dense Granular Media, Annu. Rev. Fluid Mech., 56, 215–240, https://doi.org/10.1146/annurev-fluid-121021-022045, 2024. a
Kohler, M. J., Gaume, J., Ancey, C., and Sovilla, B.: 3D Numerical Modeling of Compressible and Cohesive Granular Flow Impact on Narrow Obstacles, Computational Particle Mechanics, 13, 79–96, https://doi.org/10.1016/j.cpms.2025.11.005, 2026a. a, b, c, d, e, f, g, h, i, j
Kohler, M. J., Gaume, J., Ancey, C., and Sovilla, B.: Dataset Accompanying the Research Article “Distinguishing Run-up Height from Pressure Distribution during Avalanche Impact on Narrow Obstacles: Mechanisms and Semi-Empirical Prediction from Three-Dimensional Simulations”, Zenodo [data set], https://doi.org/10.5281/zenodo.18847594, 2026b. a
Köhler, A., McElwaine, J. N., and Sovilla, B.: GEODAR Data and the Flow Regimes of Snow Avalanches, J. Geophys. Res.-Earth, 123, 1272–1294, https://doi.org/10.1002/2017JF004375, 2018. a, b, c
Kyburz, M. L., Sovilla, B., Gaume, J., and Ancey, C.: Decoupling the Role of Inertia, Friction, and Cohesion in Dense Granular Avalanche Pressure Build-up on Obstacles, J. Geophys. Res.-Earth, 125, e2019JF005192, https://doi.org/10.1029/2019JF005192, 2020. a, b, c, d
Kyburz, M. L., Sovilla, B., Gaume, J., and Ancey, C.: Physics-Based Estimates of Drag Coefficients for the Impact Pressure Calculation of Dense Snow Avalanches, Eng. Struct., 254, 113478, https://doi.org/10.1016/j.engstruct.2021.113478, 2022. a, b
Kyburz, M. L., Sovilla, B., Bühler, Y., and Gaume, J.: Potential and Challenges of Depth-Resolved Three-Dimensional MPM Simulations: A Case Study of the 2019 “Salezer” Snow Avalanche in Davos, Ann. Glaciol., 1–14, https://doi.org/10.1017/aog.2024.14, 2024. a
Li, X., Sovilla, B., Jiang, C., and Gaume, J.: The mechanical origin of snow avalanche dynamics and flow regime transitions, The Cryosphere, 14, 3381–3398, https://doi.org/10.5194/tc-14-3381-2020, 2020. a
Li, X., Sovilla, B., Jiang, C., and Gaume, J.: Three-Dimensional and Real-Scale Modeling of Flow Regimes in Dense Snow Avalanches, Landslides, 18, https://doi.org/10.1007/s10346-021-01692-8, 2021. a, b
Li, X., Sovilla, B., Gray, J. M. N. T., and Gaume, J.: Transient Wave Activity in Snow Avalanches Is Controlled by Entrainment and Topography, Commun. Earth Environ., 5, 1–11, https://doi.org/10.1038/s43247-023-01157-x, 2024. a
Lin, B., Wu, Y., Niu, Z., and Wang, D.: Flow Jump Regimes of Inclined Granular Flow Interacting with Downstream Wall-like Obstacle, Powder Technol., 465, 121342, https://doi.org/10.1016/j.powtec.2025.121342, 2025. a
Margreth, S., Stoffel, L., and Schaer, M.: Berücksichtigung der Lawinen- und Schneedruckgefährdung bei Seilbahnen. Ein Leitfaden für die Praxis, WSL Berichte, https://www.dora.lib4ri.ch/wsl/dload/wsl:9091/PDF/ (last access: 30 September 2026), 2015. a, b, c, d, e, f, g, h, i, j
McClung, D. M. and Mears, A. I.: Dry-Flowing Avalanche Run-up and Run-Out, J. Glaciol., 41, 359–372, https://doi.org/10.3189/S0022143000016233, 1995. a
Mejean, S., Faug, T., and Einav, I.: A General Relation for Standing Normal Jumps in Both Hydraulic and Dry Granular Flows, J. Fluid Mech., 816, 331–351, https://doi.org/10.1017/jfm.2017.82, 2017. a
Metcalf, J. R.: Angle of Repose and Internal Friction, Int. J. Rock Mech. Min., 3, 155–161, https://doi.org/10.1016/0148-9062(66)90005-2, 1966. a
Ortiz, M. and Pandolfi, A.: A Variational Cam-clay Theory of Plasticity, Comput. Meth. Appl. M., 193, 2645–2666, https://doi.org/10.1016/j.cma.2003.08.008, 2004. a, b
Ortner, G., Bründl, M., Kropf, C. M., Röösli, T., Bühler, Y., and Bresch, D. N.: Large-scale risk assessment on snow avalanche hazard in alpine regions, Nat. Hazards Earth Syst. Sci., 23, 2089–2110, https://doi.org/10.5194/nhess-23-2089-2023, 2023. a
Ritter, J., Löwe, H., and Gaume, J.: Microstructural Controls of Anticrack Nucleation in Highly Porous Brittle Solids, Sci. Rep., 10, 12383, https://doi.org/10.1038/s41598-020-67926-2, 2020. a, b
Roscoe, K. H. and Burland, J. B.: On the Generalised Stress-Strain Behaviour of “Wet” Clay, Engineering Plasticity, 535–609, 1968. a
Rudolf-Miklau, F., Sauermoser, S., and Mears, A. I.: The Technical Avalanche Protection Handbook, Wiley, https://doi.org/10.1002/9783433603840, 2014. a, b, c
Salm, B., Burkard, A., and Gubler, H. U.: Berechnung von Fliesslawinen. Eine Anleitung für Praktiker mit Beispielen, Tech. Rep. 47, Eidgenössisches Institut für Schnee- und Lawinenforschung, Weissfluhjoch/Davos, https://www.dora.lib4ri.ch/wsl/item/wsl:26106 (last access: 30 September 2026), 1990. a, b, c
Savage, S. B. and Hutter, K.: The Motion of a Finite Mass of Granular Material down a Rough Incline, J. Fluid Mech., 199, 177–215, https://doi.org/10.1017/S0022112089000340, 1989. a
Simo, J. C. and Meschke, G.: A New Class of Algorithms for Classical Plasticity Extended to Finite Strains. Application to Geomaterials, Comput. Mech., 11, 253–278, https://doi.org/10.1007/BF00371865, 1993. a
Sovilla, B., Schaer, M., Kern, M., and Bartelt, P.: Impact Pressures and Flow Regimes in Dense Snow Avalanches Observed at the Vallée de La Sionne Test Site, J. Geophys. Res.-Earth, 113, https://doi.org/10.1029/2006JF000688, 2008a. a
Sovilla, B., Schaer, M., and Rammer, L.: Measurements and Analysis of Full-Scale Avalanche Impact Pressure at the Vallée de La Sionne Test Site, Cold Reg. Sci. Technol., 51, 122–137, https://doi.org/10.1016/j.coldregions.2007.05.006, 2008b. a
Stomakhin, A., Schroeder, C., Chai, L., Teran, J., and Selle, A.: A Material Point Method for Snow Simulation, ACM T. Graphic., 32, 102:1–102:10, https://doi.org/10.1145/2461912.2461948, 2013. a, b
Sulsky, D., Chen, Z., and Schreyer, H. L.: A Particle Method for History-Dependent Materials, Comput. Meth. Appl. M., 118, 179–196, https://doi.org/10.1016/0045-7825(94)90112-0, 1994. a
Techel, F., Jarry, F., Kronthaler, G., Mitterer, S., Nairz, P., Pavšek, M., Valt, M., and Darms, G.: Avalanche fatalities in the European Alps: long-term trends and statistics, Geogr. Helv., 71, 147–159, https://doi.org/10.5194/gh-71-147-2016, 2016. a
Thibert, E., Baroudi, D., Limam, A., and Berthet-Rambaud, P.: Avalanche Impact Pressure on an Instrumented Structure, Cold Reg. Sci. Technol., 54, 206–215, https://doi.org/10.1016/j.coldregions.2008.01.005, 2008. a
Tregaskis, C., Johnson, C. G., Cui, X., and Gray, J. M. N. T.: Subcritical and Supercritical Granular Flow around an Obstacle on a Rough Inclined Plane, J. Fluid Mech., 933, A25, https://doi.org/10.1017/jfm.2021.1074, 2022. a
Vallero, G., Marchelli, M., and De Biagi, V.: Structural Vulnerability of Power Transmission Line Supports: Development of Fragility Curves for Snow Avalanche Loads, Georisk: Assessment and Management of Risk for Engineered Systems and Geohazards, 0, 1–23, https://doi.org/10.1080/17499518.2026.2616777, 2026. a
Védrine, L., Li, X., and Gaume, J.: Detrainment and braking of snow avalanches interacting with forests, Nat. Hazards Earth Syst. Sci., 22, 1015–1028, https://doi.org/10.5194/nhess-22-1015-2022, 2022. a
Virtanen, P., Gommers, R., Oliphant, T. E., Haberland, M., Reddy, T., Cournapeau, D., Burovski, E., Peterson, P., Weckesser, W., Bright, J., van der Walt, S. J., Brett, M., Wilson, J., Millman, K. J., Mayorov, N., Nelson, A. R. J., Jones, E., Kern, R., Larson, E., Carey, C. J., Polat, İ., Feng, Y., Moore, E. W., VanderPlas, J., Laxalde, D., Perktold, J., Cimrman, R., Henriksen, I., Quintero, E. A., Harris, C. R., Archibald, A. M., Ribeiro, A. H., Pedregosa, F., van Mulbregt, P., and SciPy 1.0 Contributors: SciPy 1.0: Fundamental Algorithms for Scientific Computing in Python, Nat. Methods, 17, 261–272, https://doi.org/10.1038/s41592-019-0686-2, 2020. a
Voellmy, A.: Über die Zerstörungskraft von Lawinen; Zur Dynamik der Lawinen, Schweizerische Bauzeitung, 73, https://doi.org/10.5169/SEALS-61891, 1955. a
Willibald, C., Löwe, H., Theile, T., Dual, J., and Schneebeli, M.: Angle of Repose Experiments with Snow: Role of Grain Shape and Cohesion, J. Glaciol., 66, 658–666, https://doi.org/10.1017/jog.2020.36, 2020. a
Wu, Y., Wang, D., Li, P., and Niu, Z.: Experimental Investigation of Dry Granular Flows down an Inclined Channel against a Wall-like Obstacle of Limited Width, Acta Geotech., 18, 2141–2154, https://doi.org/10.1007/s11440-022-01714-2, 2023. a, b
- Abstract
- Introduction
- Methodology
- Dependence of run-up and impact pressure distribution on flow regime and material rheology
- Semi-empirical estimation of run-up and pressure height in avalanches
- Conclusions
- Appendix A: Calculation example and comparison with guidelines
- Code and data availability
- Author contributions
- Competing interests
- Disclaimer
- Acknowledgements
- Financial support
- Review statement
- References
- Supplement