
the Creative Commons Attribution 4.0 License.
the Creative Commons Attribution 4.0 License.
 | 21 Oct 2026
Seismic analysis of bedload discharge at Tagliamento River during flood events
Mario Valerio Gangemi

Julien Barrière
Alfio Marco Borzì
Andrea Cannata
Flavio Cannavò
Adrien Oth
Stefano Parolai
Matteo Picozzi
Concetto Spampinato
Luca Zini
Giulia Barisione
Francesco Panzera
Understanding river dynamics during flood events is critical for effective hazard mitigation and water resource management, especially as extreme weather events become increasingly frequent. Environmental seismology, which consists in monitoring natural surface processes with seismic instruments, has gained considerable attention over the past two decades. During floods events continuous seismic signals, also called seismic noise in this context, are generated by the turbulent flow and the transported bedload at the riverbed. If recorded at nearby seismic stations (i.e. from the riverbank to a few hundred meters), these seismic data become an important source of information complementing traditional methods (e.g., stream gauge, bedload basket sampler) to improve models and early warning systems. Despite the increasing number of case studies worldwide, the potential of seismic monitoring to capture flood-induced natural river processes in the Alps remains underexplored, particularly regarding the opportunistic use of existing stations from permanent network(s) originally deployed for earthquake monitoring. This study investigates the potential of records from permanent seismic stations relatively far from the river (up to ∼3 km) to assess bedload discharge and river flow dynamics during flood events in one of the rare morphologically preserved alpine rivers, the Tagliamento River in northern Italy. Seismic data from three selected stations at the subwatershed scale (i.e., spaced by about 20 km at maximum) were analysed together with hydrological and meteorological measurements such as water height, rain rate, and wind velocity, hence allowing to identify specific frequency bands for which seismic amplitude timeseries correlate with weather and river components. For particular frequencies, we notably observe a hysteresis behaviour between seismic amplitudes and the rising and falling phases of flood event, suggesting seismic source mechanisms related to turbulent flow and/or the movement of coarse sediments. The study demonstrates that even stations not specifically positioned close to the riverbed can capture valuable information on flood dynamics, thereby providing an early indication of flood propagation. These findings highlight the potential for incorporating seismic monitoring into flood forecasting and river management strategies, contributing to enhanced hazard mitigation efforts in the context of increasingly frequent extreme meteorological events. More specifically, the present study also helps in gaining information about the Tagliamento catchment response and relative seismic signatures during flood events for further investigations in developing early warning systems based on seismic data.
- Article
(14490 KB) - Full-text XML
-
Supplement
(1261 KB) - BibTeX
- EndNote


Climate change greatly impacts extreme environmental events, as global warming brings more intense rainfall caused by atmospheric instability (Gran Castro and Ramos De Robles, 2019; Hirabayashi et al., 2013; Dong et al., 2021). In recent years, the number of severe floods caused by heavy rainfalls and snow melting increased, threatening human lives and infrastructures, and they are suggested to grow during the next decades (Blöschl et al., 2015). During river flood events, water flow changes its behaviour into a much more chaotic system due to the rising discharge, increasing water height and flow velocity, increasing the size and amount of transported sediments (Schick and Lekach, 1981) and becoming an important hazard for the population in urban areas, especially along the riverbanks. According to Douben (2006), these extreme events are generated by heavy rainfall over a long period (about 65 %), like Ciarán and Vaia storms (Volonté and Riboldi, 2024; Chirici et al., 2019), torrential rains (15 %), tropical cyclones (10 %) or monsoon rains (5 %), cumulating high quantities of water into catchments and conveying them to the rivers. Generally, heavy and long-lasting rainfalls are the most common causes of river floods, and for this reason are defined as hazardous events.
The seismic signature of a river during extreme meteorological events is becoming an important topic, as its study could help in understanding its behaviour (e.g., water height variations, flow rates, bedload) and in monitoring these in different environments, like steep mountain catchments (Díaz et al., 2014; Roth et al., 2016; Hsu et al., 2011; Burtin et al., 2008; Abi Nader et al., 2023), or lower gradient streams (Barrière et al., 2015a). Previous studies mainly focusing on vertical seismic records (e.g., Abi Nader et al., 2023; Burtin et al., 2008; Gimbert et al., 2014; Barrière et al., 2015a) have shown
that high-frequency seismic noise (>1 Hz) recorded near rivers is strongly correlated with river dynamics. Increases of the seismic amplitude can reflect more turbulent flow conditions as well as enhanced sediment transport, such as impacts from coarse particles or boulders against the riverbed and banks. These two main river-related processes generate seismic signals with overlapping frequency signatures, which can be difficult to differentiate depending on the station-river distance and the bedload/hydrological properties (Burtin et al., 2008, 2010; Hsu et al., 2011; Schmandt et al., 2013; Gimbert et al., 2014). From a theoretical point of view, Tsai et al. (2012) proposed to model the seismic noise generated by bedload transport idealized as a force normal to the riverbed (saltation mode), thus preferentially generating Rayleigh polarized surface waves. However, Tsai et al. (2012) pointed out that horizontally polarized Love waves can be generated for non-vertical impacts (rolling and sliding), explaining the energetic spectral contribution on radial components. Gimbert et al. (2014) extended this physical framework of Tsai et al. (2012) to model the seismic noise in rivers due to both vertical bedload transport and turbulent flow. They provided the first attempt of separating bedload and flow contributions in vertical seismic amplitude from available datasets in the Trisuli (Nepal) and Colorado (USA) rivers, followed by other attempts of inverting hydrological and bedload parameters from seismic data acquired during well constrained experiments (e.g., Gimbert et al., 2019; Bakker et al., 2020; Luong et al., 2024).
Most of the research so far used seismic data from networks designed specifically for their monitoring, installing sensors very close to the stream/river (e.g., 2 m for Barrière et al., 2015a; 4–6–7 m for Roth et al., 2016; 50 m for Hsu et al., 2011; 400 m for Díaz et al., 2014). In contrast, our study focuses on the characterization of a river's seismic signature at the subwatershed scale (i.e., tens of kilometres, Fig. 1). We chose the Tagliamento river as test site because of its flow and sediment transport features (e.g., coarse sediment, large natural pathway, consistent discharge variations, further discussed in this manuscript), turning it into a well-suited “natural laboratory” allowing to better characterize river conditions during extreme meteorological events. Furthermore, and maybe the most important aspect, the spatial distribution of seismic, hydrological and meteorological stations allows correlating multi-parameter datasets and gaining more accurate information about the analysed event (Smith and Tape, 2019). We performed multiple analyses to evaluate the river's flow behaviour during flood events, exploiting permanent seismic stations installed for earthquake monitoring, operated by Istituto Nazionale di Oceanografia e Geofisica Sperimentale – OGS and located at 0.4, 1.5 and 3 km of distance from the streambed, respectively. The main aim was to recognise a possible relationship between seismic noise and water height (m), rain rate (mm 15 min−1) and wind velocity (km h−1) data during river floods, exploiting level gauges, anemometers and pluviometers in combination with seismic velocimeters along the stream and adjacent main tributaries to describe the phenomena from a seismological point of view.
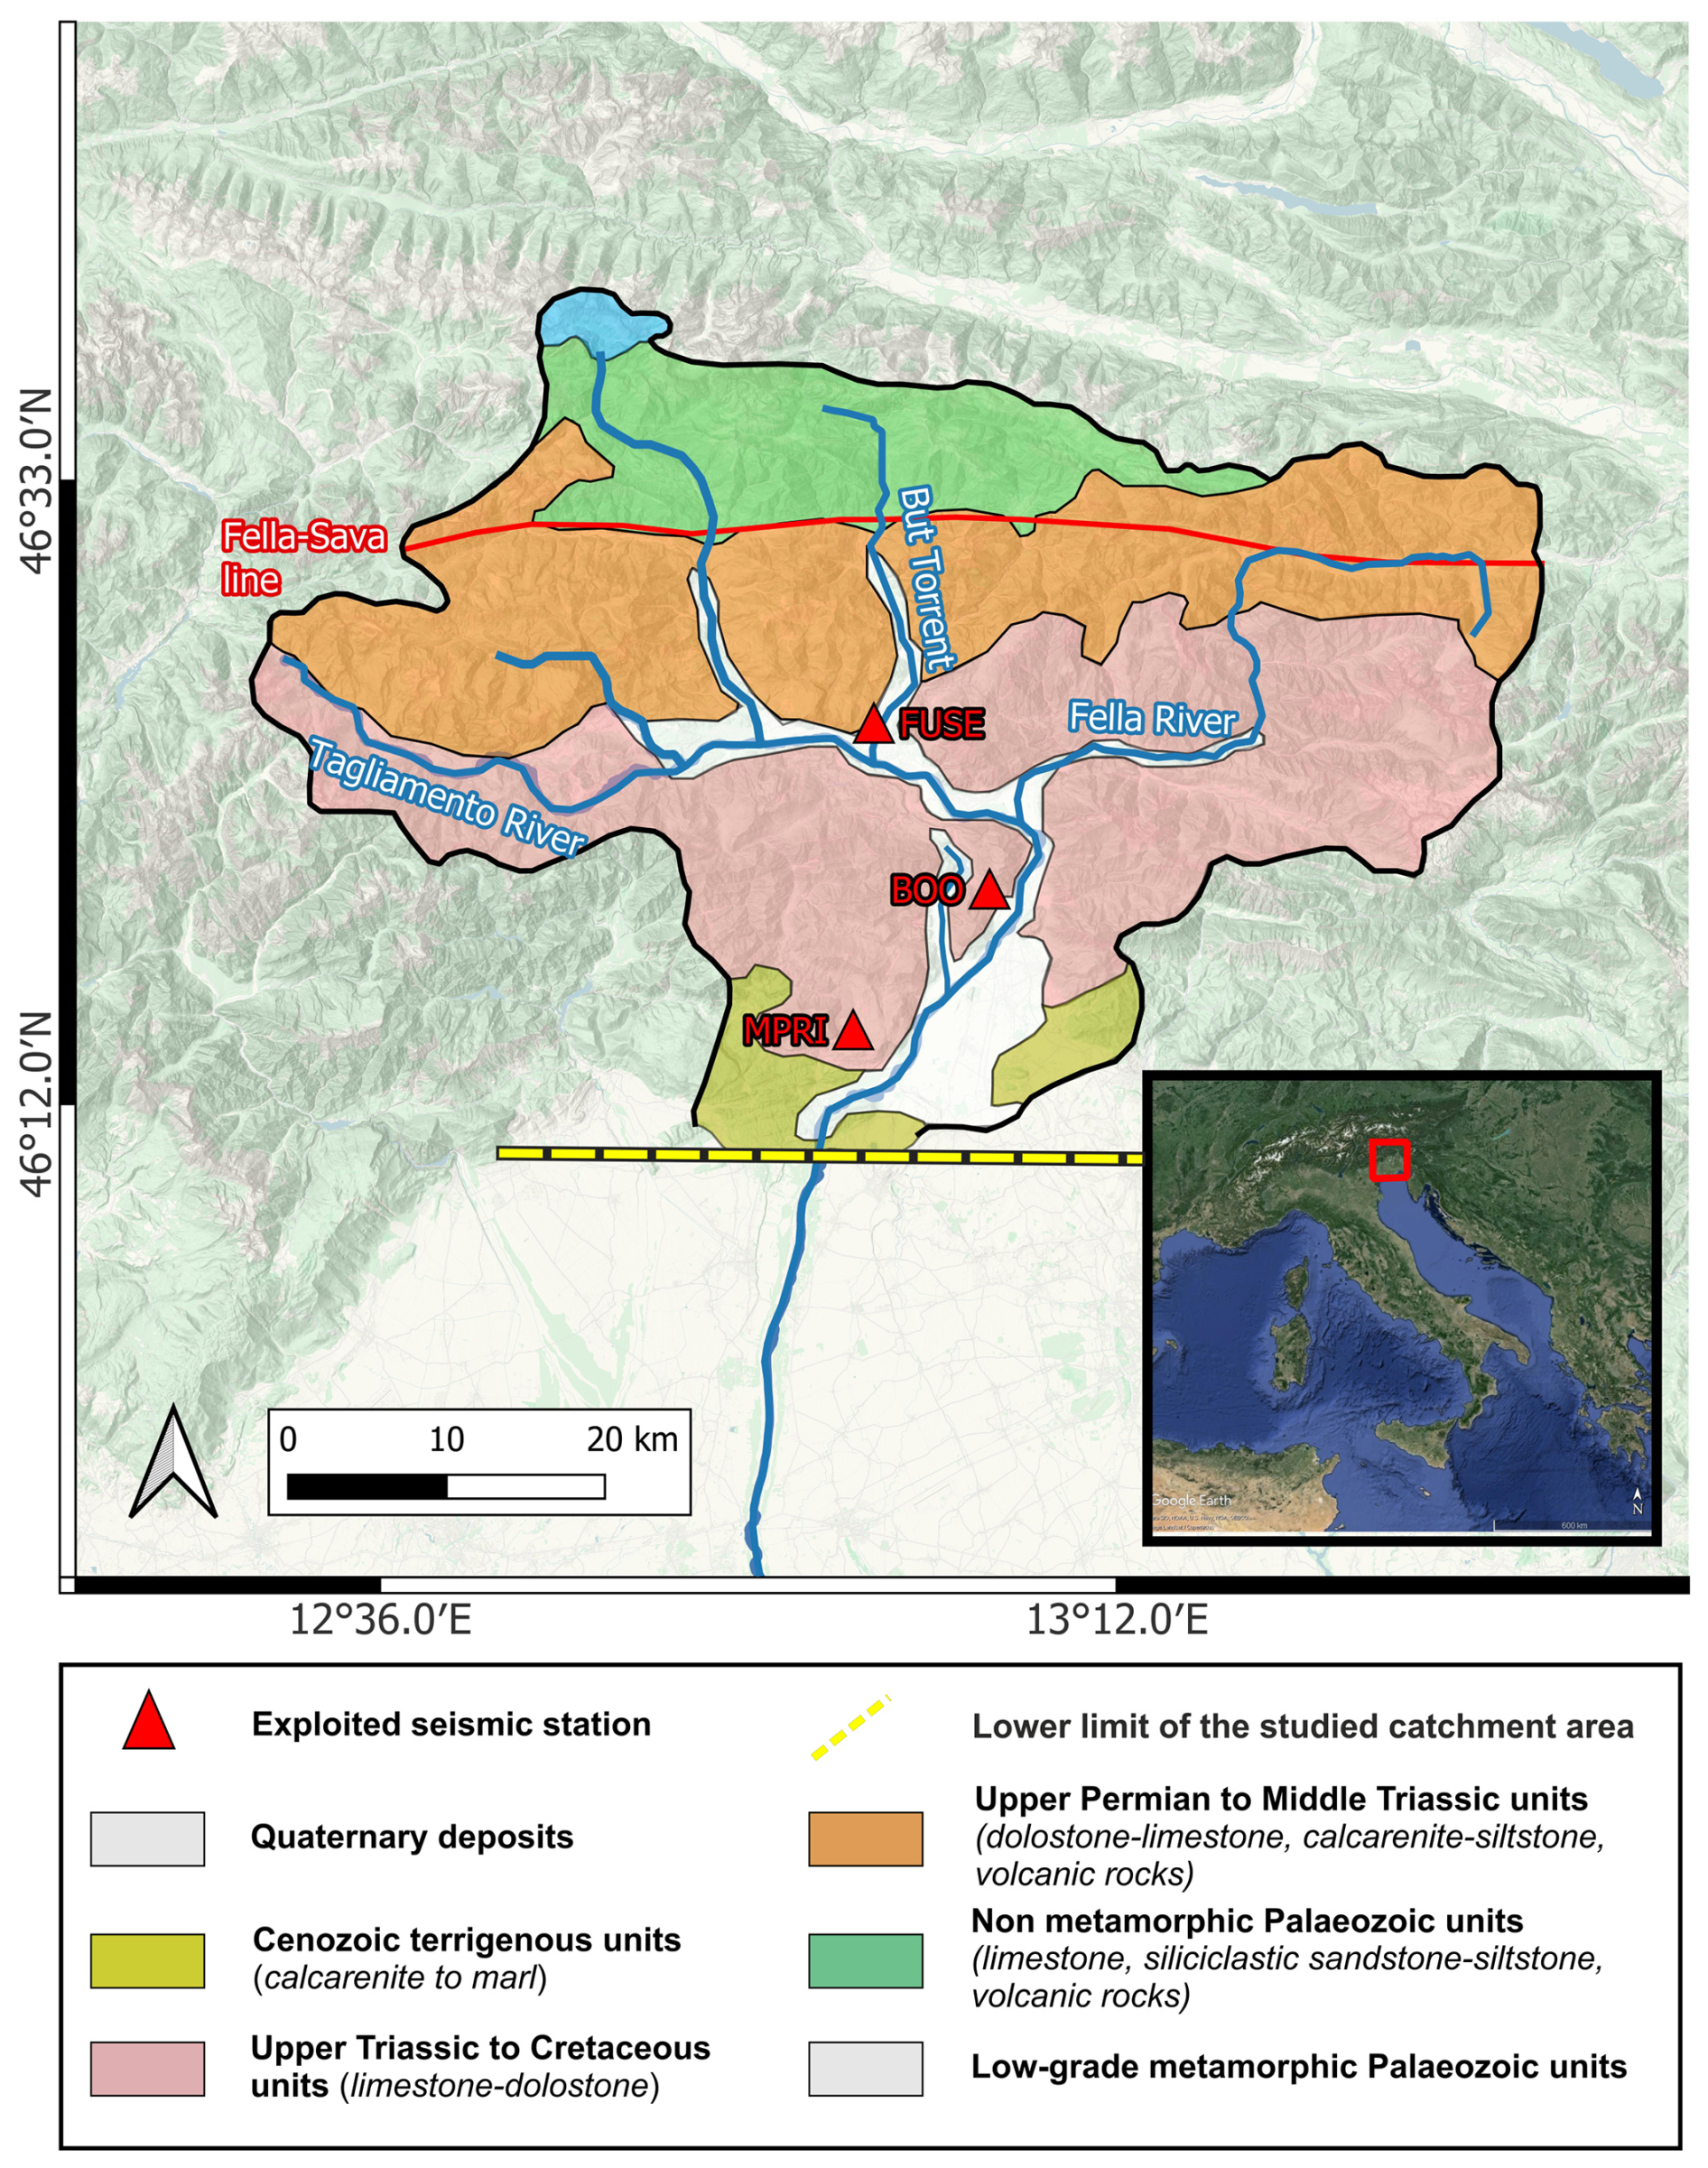
Figure 1Geological setting of the Tagliamento catchment with exploited seismic stations and main tributaries. The red line is the Fella-Sava fault and the yellow dashed line indicates the lower limit of the studied area. The inset shows the Italy satellite map with the location of the study area. The satellite map was uploaded from Google Earth on QGIS (Map data ©2025 Google, SIO, NOAA, U.S. Navy, NGA, GEBCO), the topographic map was uploaded from ESRI | Powered by Esri, while the layer of geological units was drawn on the map by the authors based on Monegato and Stefani (2010) geological map of the catchment.
1.1 Geological and morphological settings
Located in Friuli-Venezia Giulia (north-east of Italy), Tagliamento River originates from the Mauria Mountain at 1195 m above the sea level (Spaliviero, 2003), developing its path through steep mountains in the East direction until merging with its main tributary Fella (section of Venzone). The river then changes its path orientation from E-W to S-SW direction (Fig. 1) before the runoff into the Adriatic Sea, reaching 178 km of stream length and covering a catchment area of about 150 km2, excluding tributaries (Ward et al., 1999). Tagliamento is considered the “last large natural alpine river in Europe” (Müller, 1995; Tockner et al., 2003), thanks to the condition of its pathway, defined as unchanged by anthropogenic factors, especially in the north section of the river, where confluences are many. More specifically, the investigated reach of the upper Tagliamento River extends for approximately 40 km from Tolmezzo (∼ 325 m a.s.l.) to Villuzza (∼ 125 m a.s.l.). The river exhibits a broad gravel-bed morphology, with the channel width increasing downstream from 300–600 m near Tolmezzo to as much as 800–1000 m at Villuzza. Despite an average longitudinal gradient of 0.8 %–1.0 %, the profile is not uniform, and local bedrock-controlled sections, particularly near Venzone, attain slopes of up to 6.5 %–7 % over distances of about 1 km.
Tagliamento River is characterised by a pluvio-nival flow regime, recording its highest discharges in spring for the snowmelt runoff and in autumn during rainy periods. Flood events caused by heavy rain usually occur during the autumn season, and during this period, the discharge mean value increases from a mean of 109 up to 4000 m3 s−1 (Ward et al., 1999).
The northern part of the Tagliamento River flows through the Carnic Alps of Friuli, which geologically are mainly composed of limestones and dolostones (Fig. 1). These lithologies are present both in the drainage basin and the riverbed and, especially the latter, are “the most common outcropping rock type” in the area (Carulli, 2006; Monegato and Stefani,
2010). The area is tectonically active, characterised by thrust and fault structures that influence the tributary stream orientations, especially in the northeastern part of the catchment (Ward et al., 1999). The last strong earthquake in the area occurred in recent years 1976, reporting 6.4 as magnitude Mw (Patricelli et al., 2022). Furthermore, the complexity of the groundwater drainage into the limestone karst makes a hard delineation of the watershed (Tockner et al., 2003). From up to downstream, the northern section of the catchment, as shown in Fig. 1, is composed by Jurassic-Cenozoic limestone and calcareous flysch, while the Friulian plain passes from high permeability fluvioglacial sediments, aged Tertiary and Quaternary to marine deposits sediments in the lower basin, composed of fine sand and clay (Ward et al., 1999). The alpine section of the Tagliamento riverbed is mainly characterized by pebble to boulder size sediments (Monegato and Stefani, 2010), which get moved during major floods.
More specifically, the northern section of the catchment is mainly defined by limestone, dolostone, calcarenite siltstone from the Upper Permian to Cretaceous, transitioning to Cenozoic calcarenite and marl on the lowest part of the Friulian Alps (Monegato and Stefani, 2010). In their work, Monegato and Stefani (2010) focus their studies on the “Tagliamento Conglomerate (TC)”, a succession dominated by pebble to cobble-size conglomerates, with subordinate sandstones, mudstones, and breccias. Also, deltaic calcareous conglomerates known as “Osoppo conglomerates” are situated at the mouth of the Tagliamento valley (Venturini, 1992). The geological setting and previous works analysis suggest the movement of lighter particles like clay and fine sand in suspension during normal flow conditions, while heavier and coarser sediment is carried during flood events with relevant flow rate under a different transport regime, like saltation, rolling and sliding (Kuriqi et al., 2020; Barry et al., 2008; Dade and Friend, 1998). The geological framework of the study area is fundamental to understand what sediments are mobilized during flood events in the Tagliamento River, since the type of the bedload can strongly influence the seismic noise generated during high-discharge transport as demonstrated by Tsai et al. (2012) and Gimbert et al. (2014).
1.1.1 Hydro-meteorological data and analysed floods
In this paper, we have chosen the case of the Storm Ciarán as the main test event for our analyses, which struck the UK, Channel Islands, France and other European countries in late October and early November 2023 (Heidarzadeh et al., 2025). The cyclone caused several issues throughout Europe in urban areas and villages located near rivers and streams, counting 21 deaths, of which 14 were in Italy (The Independent, 2023). Ciarán reached Italy on the 2 November 2023 (Volonté and Riboldi, 2024) and evolved into a flood in many areas of Friuli-Venezia Giulia (FVG) involving Tagliamento River and its tributaries for about 48 h. The maximum value of rain rate was reported by the pluviometers in the area to be greater than 100 mm h−1 (data from bulletin of vigilance of Regional Agency for Environmental Protection of Friuli-Venezia Giulia region (2024). This was the case especially in the northern part, rich with tributaries passing through mountains and watersheds able to convey runoff waters into the Tagliamento River and thus easily increasing its discharge. Regarding the wind velocity data (available at Friuli-Venezia Giulia Meteorological Service website, https://www.meteo.fvg.it/, last access: October 2024), anemometers in the Tagliamento catchment recorded wind bursts over 100 km h−1 as maximum value.
We also look at a different short storm event that occurred on the 18 September 2023 and led to the recording of high quantities of accumulated water in pluviometers without evolving into a relevant river flood. The event is characterized by notable peak values in pluviometer data of Civil Protection of Friuli-Venezia Giulia (2024). These extreme weather conditions, called flash floods, are quite different from the river flood event aforementioned and, as reported from scientific papers like Gaume et al. (2009) or Picozzi et al. (2023), they are the most frequent extreme meteorological events, defined as heavy rainfall in a short period of time and characterised by sudden rise of the rain rate and its then-fast decay back to normal conditions.
We used pluviometric and water height data for the application of a multidisciplinary approach to the studied case to gain insights into the influence of rainfall, wind, and river related components (e.g., water discharge and/or bedload) on the seismic noise wavefield, by analysing their interrelations as further discussed. It is worth noting that all the investigations performed in this study are related to the northern part of the Tagliamento catchment, whose southern limit is indicated as a yellow dashed line in Fig. 1 and commonly known as “Alto Tagliamento”, covering an area of 211 km2 (Ward et al., 1999).
Water height, rain rate and wind velocity data were continuously collected by the stations of Civil Protection of the Friuli Venezia Giulia Region, located along the Tagliamento River and its tributaries. The hydrographic reticule is well-monitored, counting 12 hydrometers installed on the alpine section of the Tagliamento River (Civil Protection FVG, 2024) with a sampling interval of 15 min for the newest data (generally from 2022–2023) and 30 min for older ones (before 2022), and many pluviometers installed in this area.
Furthermore, each station is equipped with multiple sensors (e.g., level gauge, pluviometer, anemometer), but not all of them have all types of sensors, thus in some cases it is necessary to gather data from adjacent stations to have information on all the three considered parameters (water height, rain rate and wind velocity data). All selected seismic, meteorological (pluviometers and anemometers), and level gauge stations are shown in Fig. 2. In order to get the most complete possible idea of the water mass flowing from upstream to the cross section at Venzone, we have also considered the “Moggio Udinese” (C464) level gauge, located on Fella River and 7.5 km distant from Venzone, where it joins the Tagliamento.
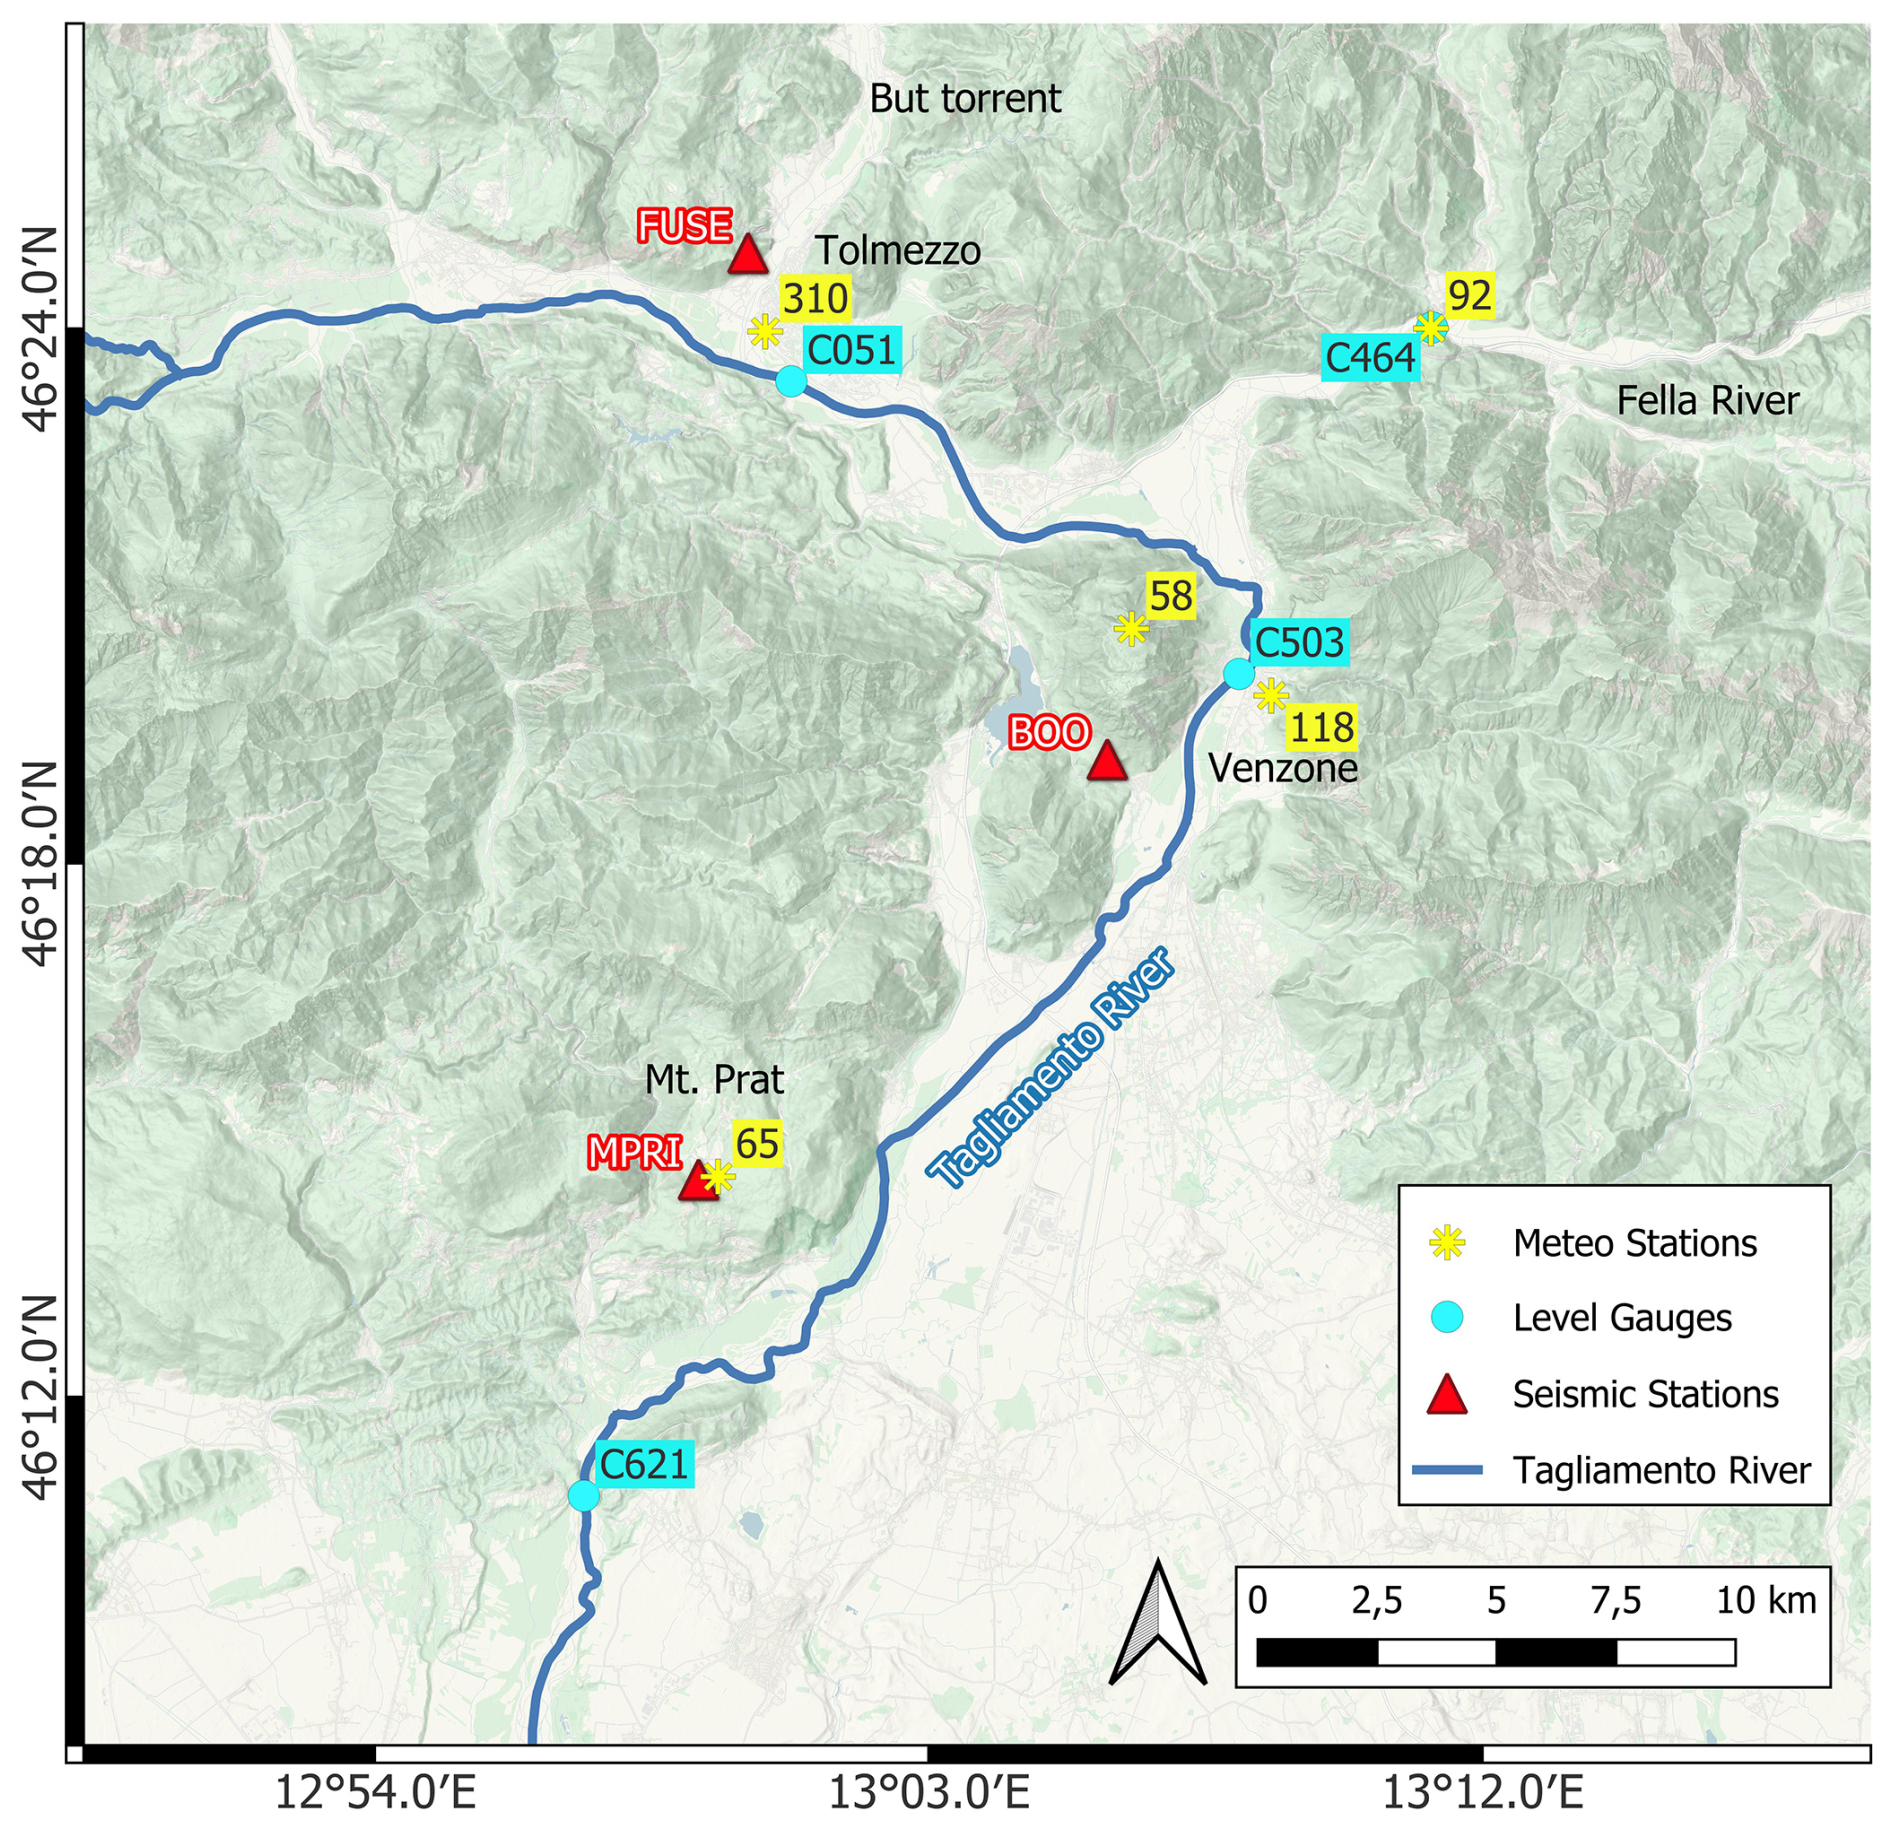
Figure 2Map of “Alto Tagliamento” showing the selected seismic stations closest to the riverbed, pluviometric stations (referred to: 310-Tolmezzo Campo Sportivo, 92-Moggio Udinese, 58-Mt. S. Simeone, 118-Venzone, 65-Mt.Prat) and level gauges (C051-Ponte Avons, C464-Moggio Udinese, C503-Venzone, C621-Villuzza). The topographic map was uploaded from ESRI on QGIS (ESRI | Powered by Esri).
1.1.2 Seismic data and processing
We used the data from three seismic stations installed in the area under study. The chosen seismic stations in Figs. 1 and 2, belonging to the OX network (OGS, 2016), were selected for their time coverage completeness, proximity to the Tagliamento riverbed and level gauges stations (from up to downstream), as shown in Fig. 2:
-
FUSE is situated on the west side of Tolmezzo and the nearest station to the riverbed considering also Tagliamento tributaries (400 m from the But stream), while its distance from the Tagliamento River is about 2 km.
-
BOO is located on the west side of Venzone, at 1.5 km from Tagliamento. Among the installed stations, this is the closest one to the Tagliamento mainstream available on the site.
-
MPRI is situated on Mt. Prat, about 3 km from the river.
FUSE and MPRI stations are equipped with Nanometrics Trillium 40s sensor and Quanterra Q330 datalogger for the broadband channels, while BOO has a Nanometrics Trillium 120s sensor. We selected these broadband velocimeters working with 100 Hz sampling rate (HH channels) to analyse the data, recorded by the three components. Hourly seismic recording data were downloaded from the OGS database (OGS, 2016) in miniseed format, using the EIDA Orfeus website (https://www.orfeus-eu.org/data/eida/, last access: October 2024) and, successively, processed with dedicated Python libraries for seismic data analysis, exploiting mainly ObsPy (Krischer et al., 2015) and other related libraries with useful scientific tools (e.g., Hunter, 2007; SciPy from Virtanen et al., 2020; TwistPy from Sollberger, 2024).
We analysed filtered records between 1 and 40 Hz. The high cut off was set below the Nyquist frequency to overcome aliasing and we discarded all frequencies below 1 Hz because it has been consistently shown that river-related signals have their strongest influence above 1 Hz (Abi Nader et al., 2023; Burtin et al., 2008; Gimbert et al., 2014; Barrière et al., 2015a). Also, since microseismic noise contaminates the low-frequency range (< 1 Hz) (Longuet-Higgins, 1950; Hasselmann, 1963), our analysis was restricted to frequencies higher than 1 Hz to reduce its impact.
We pre-processed the seismic signal using the Python library ObsPy (Krischer et al., 2015, http://www.obspy.org/, last access: September 2025). First, the signal is detrended and corrected for the instrumental response to get ground velocity output (m s−1). Furthermore, all three components (one vertical and two horizontals) were investigated for all the analyses carried out. However, in line with the literature (e.g., Burtin et al., 2010; Díaz et al., 2014; Borzì et al., 2025), we primarily focus on the vertical component recordings, which we assume to be mainly affected by Rayleigh waves generated by river processes (sediment transport and water flow). Horizontal components also contain river-induced surface seismic signals, but they tend to be more affected by wind (Withers et al., 1996; Lott et al., 2017). The next step was to analyse the seismic signals in the frequency domain by calculating the Power Spectral Density (PSD) with a 40 s window length and 50 % overlap to analyse the evolution in time of the spectral features of the signal (e.g., spectrograms) using ObsPy.
Subsequently, meteorological (rain rate and wind velocity) and hydrological (water height) time series were correlated with seismic noise during the flood event through the Spearman correlation coefficient (ρ), which is a non-parametric measure of the strength and direction of a monotonic association between two variables (Hollander et al., 2014). In the following formula
where n is the size of the sample and di is the difference between the ranks of the i-th pair of observations.
In this study, Spearman's correlation coefficient was computed using the “spearmanr” function from the SciPy library (Virtanen et al., 2020), which implements the general definition based on ranked data and correctly accounts for tied ranks. The coefficient ranges from −1 (perfect negative monotonic relationship) to +1 (perfect positive monotonic relationship), with values close to zero indicating weak or no monotonic association. Unlike Pearson's correlation coefficient, it does not rely on assumptions of linearity or normality and is therefore well suited for non-Gaussian data and non-linear but monotonic associations. As a correlation metric we used Spearman's correlation coefficient because it is best suited to non-linear distributions and less sensitive to outliers compared to Pearson's correlation (Hauke and Kossowski, 2011).
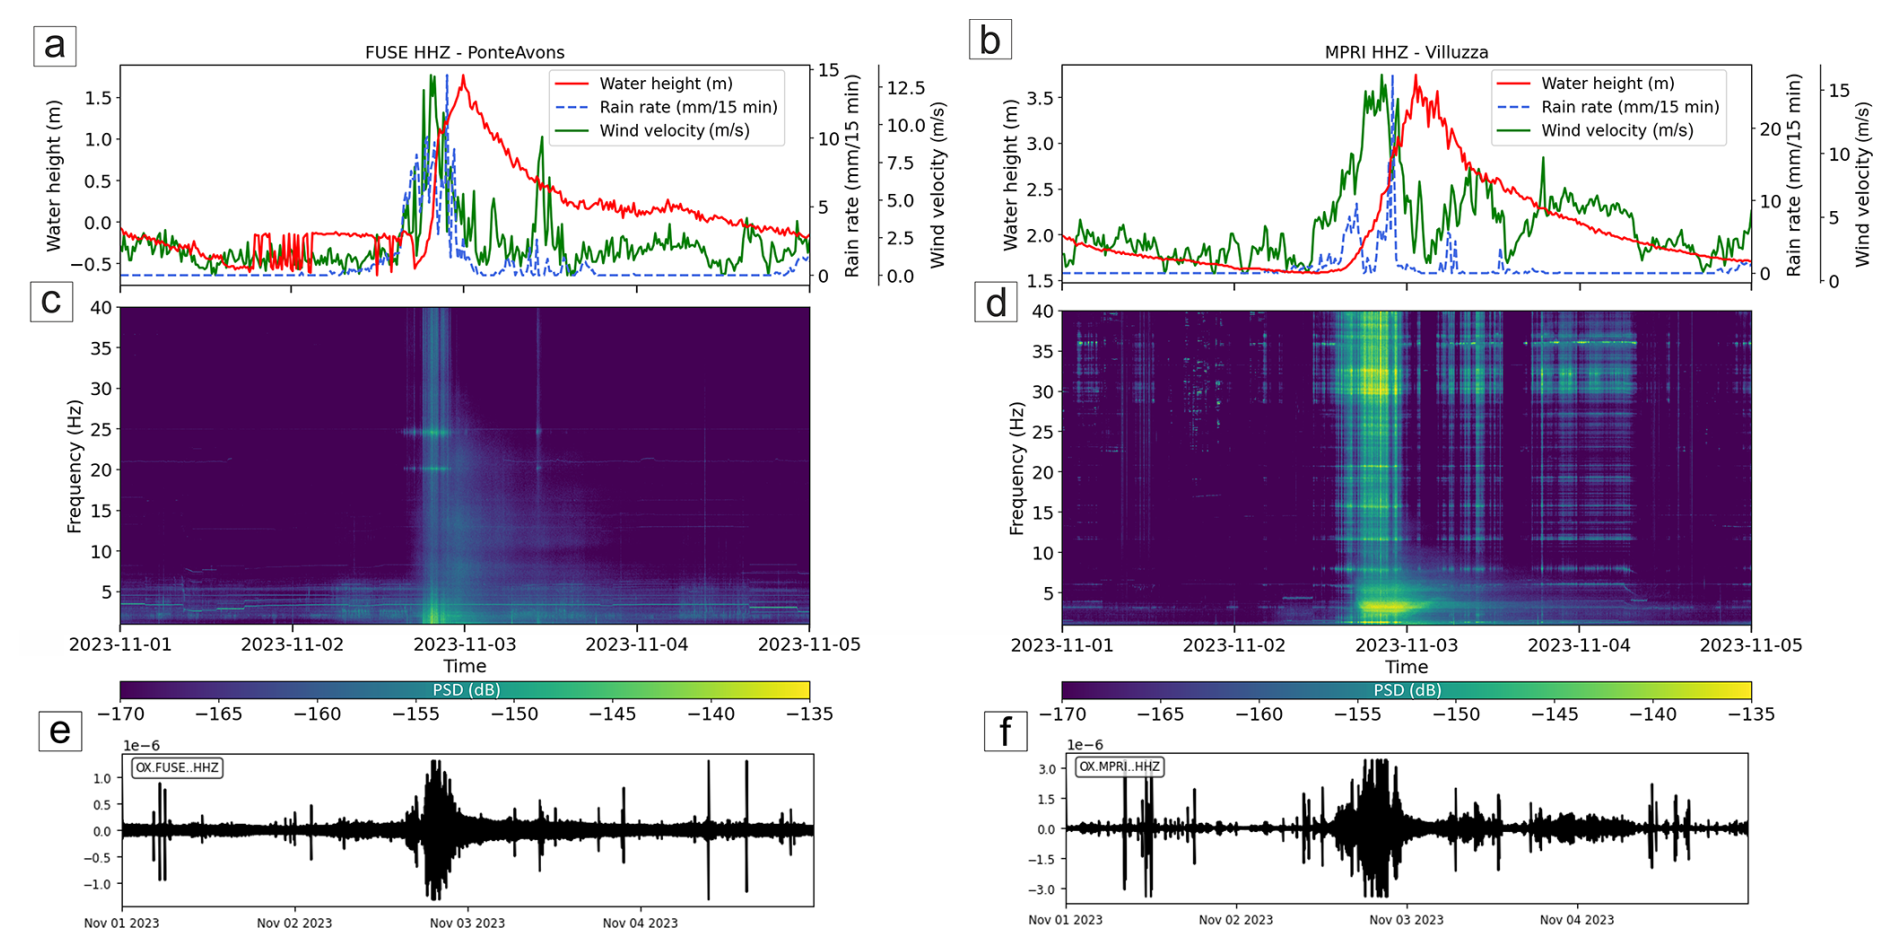
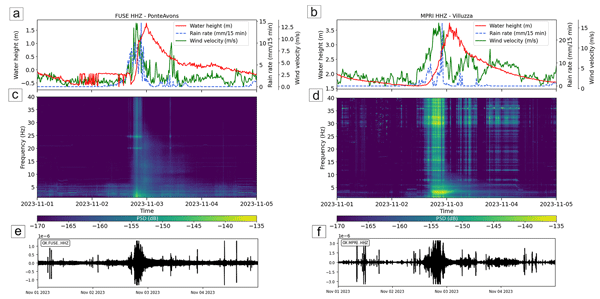
Figure 3Time series of water height (red line), rain rate (blue dashed line) and wind velocity (green dashed line), shown on (a) and (b) plots, are collected with a frequency of a sample every 15 min. Spectrograms of the vertical component of the seismic signal recorded at FUSE (c) and MPRI (d) during the main flood event that occurred in Friuli, in the (c–d) 1–40 Hz frequency band. Seismic waveforms in the 1–40 Hz frequency range are shown for (e) FUSE and (f) MPRI vertical components.
We defined three multi-parameter datasets for jointly analysing seismic data with water height and pluviometers/anemometers data after considering the distance between the instruments and availability constraints (in order the instrument ID for seismometer, level gauge, pluviometer and anemometer, with codes in brackets relating to Fig. 2):
-
MPRI, Villuzza (C621), Mt. Prat (65)
-
BOO, Venzone (C503), Venzone (118), Mt. San Simeone (58)
-
FUSE, Ponte Avons (C051), Tolmezzo (310)
Other stations were discarded for bad matches in terms of distance from Tagliamento (long source-station distance) or missing data for the investigated periods. It is worth noting that for the FUSE seismic station we chose the Ponte Avons (C051) level gauge to include the But torrent contribution to the Tagliamento water height variations. According to Tockner et al. (2003), the mean annual flow rate of the But stream is 16.3 m3 s−1 (compared to 109 m3 s−1 of Tagliamento River, referring to Ward et al., 1999), of which the riverbed width is about 200–300 m of at the very close junction with Tagliamento. Also, for the Venzone section we used 2 meteorological stations, as the instrument 118 is a pluviometer (missing anemometer) and the instrument 58 is an anemometer (distant 2 and 3.8 km respectively from the seismic station BOO, 2 and 1 km from the river, respectively).
Since it is well established that rivers, wind and rain induce seismic noise over a large frequency range (Smith and Tape, 2019), we performed correlation analysis between hydrological-meteorological data and seismic data filtered into different frequency bands. We aim to determine which seismic frequency components best correlate with hydrological meteorological variations and to examine the relative timing between environmental changes and seismic records because the seismic records do not necessarily correspond to an instantaneous response to the variations observed at the distant hydrological-meteorological stations. To do this, we computed the average value of PSD of the seismic signal with a 15 min window (same value of the sample frequency for hydrological and meteorological data) and compared them with the hydrological-meteorological time series by the Spearman correlation coefficient, using a 5 Hz bandwidth sliding by steps of 1 Hz (80 % overlap) from 1 to 40 Hz. For each frequency step, the correlation was calculated over the minimum and maximum lag, shifting the PSD curve (lagged curve) relative to the hydrological-meteorological data time series (further explained in Sect. 2.3, Figs. 5–6) with a step equal to its sample frequency (15 min). The width of the frequency ssub-band was chosen as a compromise between a too narrow sub-band, which could not fully capture the signature from one specific noise source, and a too large sub-band, which may include several processes related to the water height, wind velocity and rain rate fluctuations.
Eventually, to evaluate the directionality of the source during the flood, we performed a polarization analysis of the three component seismic data within the frequency ranges showing the highest Spearman correlation value obtained from the seismic-water height correlation analysis. We applied the polarization algorithm developed by Vidale (1986) to each station to obtain the back azimuth value (θ) ranging between 0 and 180° (with 180° ambiguity) for 15 min window length overlapped by 50 %. Moreover, we computed the degree of polarization, which is a measure of the coherence of the oscillatory motion of the signal. Following Samson (1983), the degree of polarization (DOP) quantifies the fraction of the signal energy that is polarized, with values ranging from 0 (completely unpolarized) to 1 (fully polarized). It is calculated from the eigenvalues of the spectral covariance matrix of the three-component signal, reflecting how linearly or elliptically the motion is organized in space.
2.1 Main flood event: Ciarán Storm on 2–3 November 2023
The Atlantic cyclone Ciarán struck Friuli Venezia-Giulia in the afternoon of the 2 November 2023 (around 5 p.m. UTC) with a recorded rain rate of almost 30 mm 15 min−1 and important rises of the water height detected in the northern part of Tagliamento catchment around Tolmezzo and Venzone first, measuring 2 m of increase from normal conditions in about 3 h. The recorded wind velocity at Tolmezzo, Venzone and Villuzza anemometers (310, 58 and 65 respectively in Fig. 2) stand between 10 and 20 m s−1 (with some sporadic wind bursts overcoming the latest value), which coincide with fresh breeze (force 5) to fresh gale (force 8) of magnitude on the Beaufort scale (Rawson and Tupper, 2001).
On the other hand, the analysed flash flood event that occurred the 18 September 2023 started with a steep increase of the rain rate time series around 6 and 7 p.m. UTC in the Tagliamento catchment, reaching high values (about 20–22 mm 15 min−1) on pluviometers, comparable with those recorded during Ciarán Storm. The strong perturbation lasted for about 2 h in Venzone and 1 h with multiple bursts in Villuzza. Anemometers show wind recordings with values of 2–2.5 in wind velocity (m s−1), coinciding with light breeze (force 2) on the Beaufort scale (Rawson and Tupper, 2001).
The PSD in the spectrogram calculated on the selected seismic stations shows high values during the rising part of the water height curve, as displayed in Fig. 3. It is worth noting that, due to the long distance between the seismic station MPRI and the level gauge Villuzza (C621) of about 6.5 km, with the level gauge installed further downstream (almost 7 km along Tagliamento), the water height time series is shifted back in time to match the correct position in UTC data (this aspect is better discussed further in this manuscript). For MPRI and BOO stations, the amplitude of frequencies above about 5–10 Hz in spectrograms seem to follow mostly wind velocity and rain rate time series, recording maximum dB values between −135 and −145 (Fig. S4 in the Supplement). For frequencies below this range, the spectral amplitudes better follow the water height curve over time, with a more pronounced increase during the rising of the water height instead of its descending phase.
The spectral analysis of the FUSE station recordings shows that the PSD in the first part of the flood tends to follow meteorological parameters over time, such as wind velocity and rain rate. Also, the frequencies between 1 and 30 Hz aligns more closely with the water height curve, displaying a decrease in PSD values during the descending phase after the peak in water height (Figs. 3c–d). This aspect is further explained in Sect. 3.2 and Fig. 6.
Specifically, the FUSE station shows a PSD trend that correlates well with water height data up to approximately 25–30 Hz (Fig. 3c). This aspect, discussed further below, is consistent with the station location, about 2 km from the Tagliamento River and 0.4 km from the But torrent. For the two other stations, PSD variations tend to follow the water height time series at lower frequency around 10 Hz for the BOO station (Fig. S1) and 5 Hz for the MPRI station (Fig. 3b).
Furthermore, in the specific case of FUSE, the PSD in the lowest frequencies shows a peak during the rising phase of the water height. The horizontal components exhibit a similar overall behaviour, with a predominance of high PSD values at higher frequencies (20–30 to 40 Hz), which better follow wind velocity and rain rate time series. Notably, both horizontal components tend to be stronger than the vertical one (see Figs. S2–S4). Even if high seismic PSD here seems to show strong contribution to rain-wind data (Fig. 4a), the data presented in the next sections prove that river component has a clear role in explaining noise during the flood, especially at low frequencies.
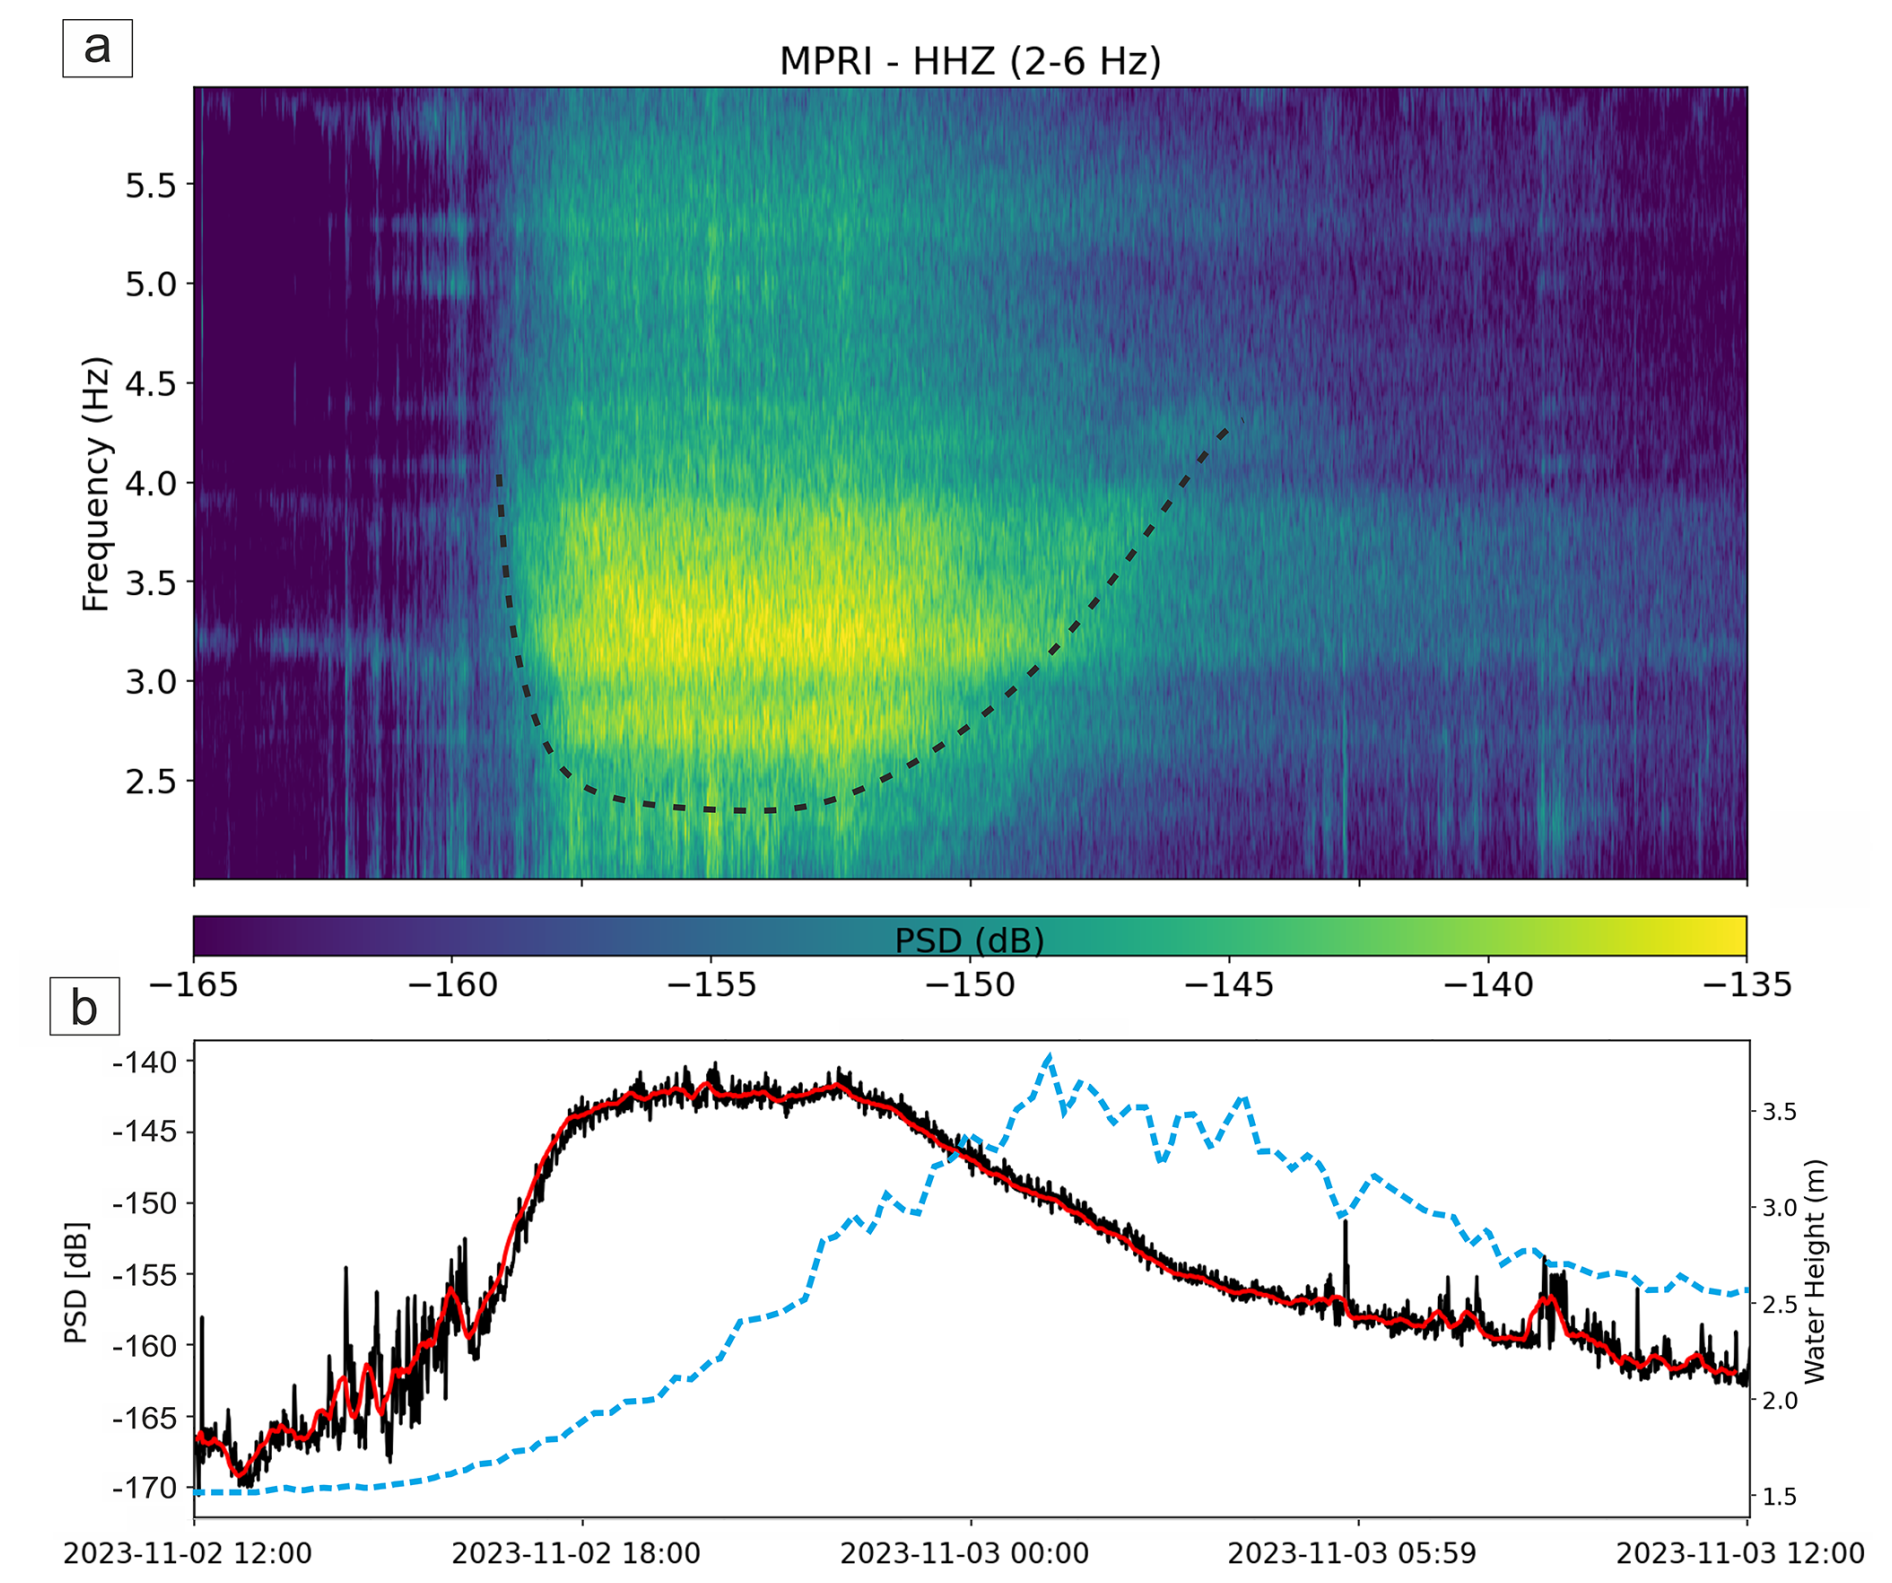
Figure 4(a) Zoom in the 24 h spectrogram of the vertical component at station MPRI between 2 and 6 Hz highlighting the V shape contouring the high PSD values (dashed black line). (b) Average PSD (in dB, black line) calculated from the above spectrogram. The red line corresponds to the median PSD values over a sliding window of 120 s length, while the blue line refers to the water height variation data.
It is worth noting that, although the water height data of Ponte Avons level gauge (related to FUSE) shows a pre-event disturbance at very low river water levels related to big boulders laying on river bed and causing a false perturbation to the sensor (see red line in Fig. 3a), it still could be used to make good quality investigations aimed at determining variations in river component, as demonstrated further in this manuscript.
For low-mid frequencies (approximately 1–30 Hz for FUSE and 1–5 Hz for MPRI), the spectrograms show a particular signature over time, drawing a lenticular/V shape mostly during the rising phase of the water height, with a strong PSD amplitude especially between 2–4 Hz, considering all exploited stations. Despite the distance being very high (almost 3 km from the riverbed), this combined V-shape frequency variation and bell-shape PSD amplitude variation is well visible especially at MPRI station (Fig. 4).
2.2 Multi-parameter correlation analysis for the main event
In Fig. 5 we show the results for the correlation analysis between seismic noise (PSD values) and water height. Left panels of Fig. 5 show the variation of the Spearman coefficient (y axis) with respect to all investigated frequencies (x axis) and lag times (color scale) between lagged versions of PSD curves (for each 15 min step) and the water height curve. Right panels show the variations of the Spearman coefficient with respect to the lag time for the best frequency range (defined as the one giving the highest Spearman coefficient in the left panels).
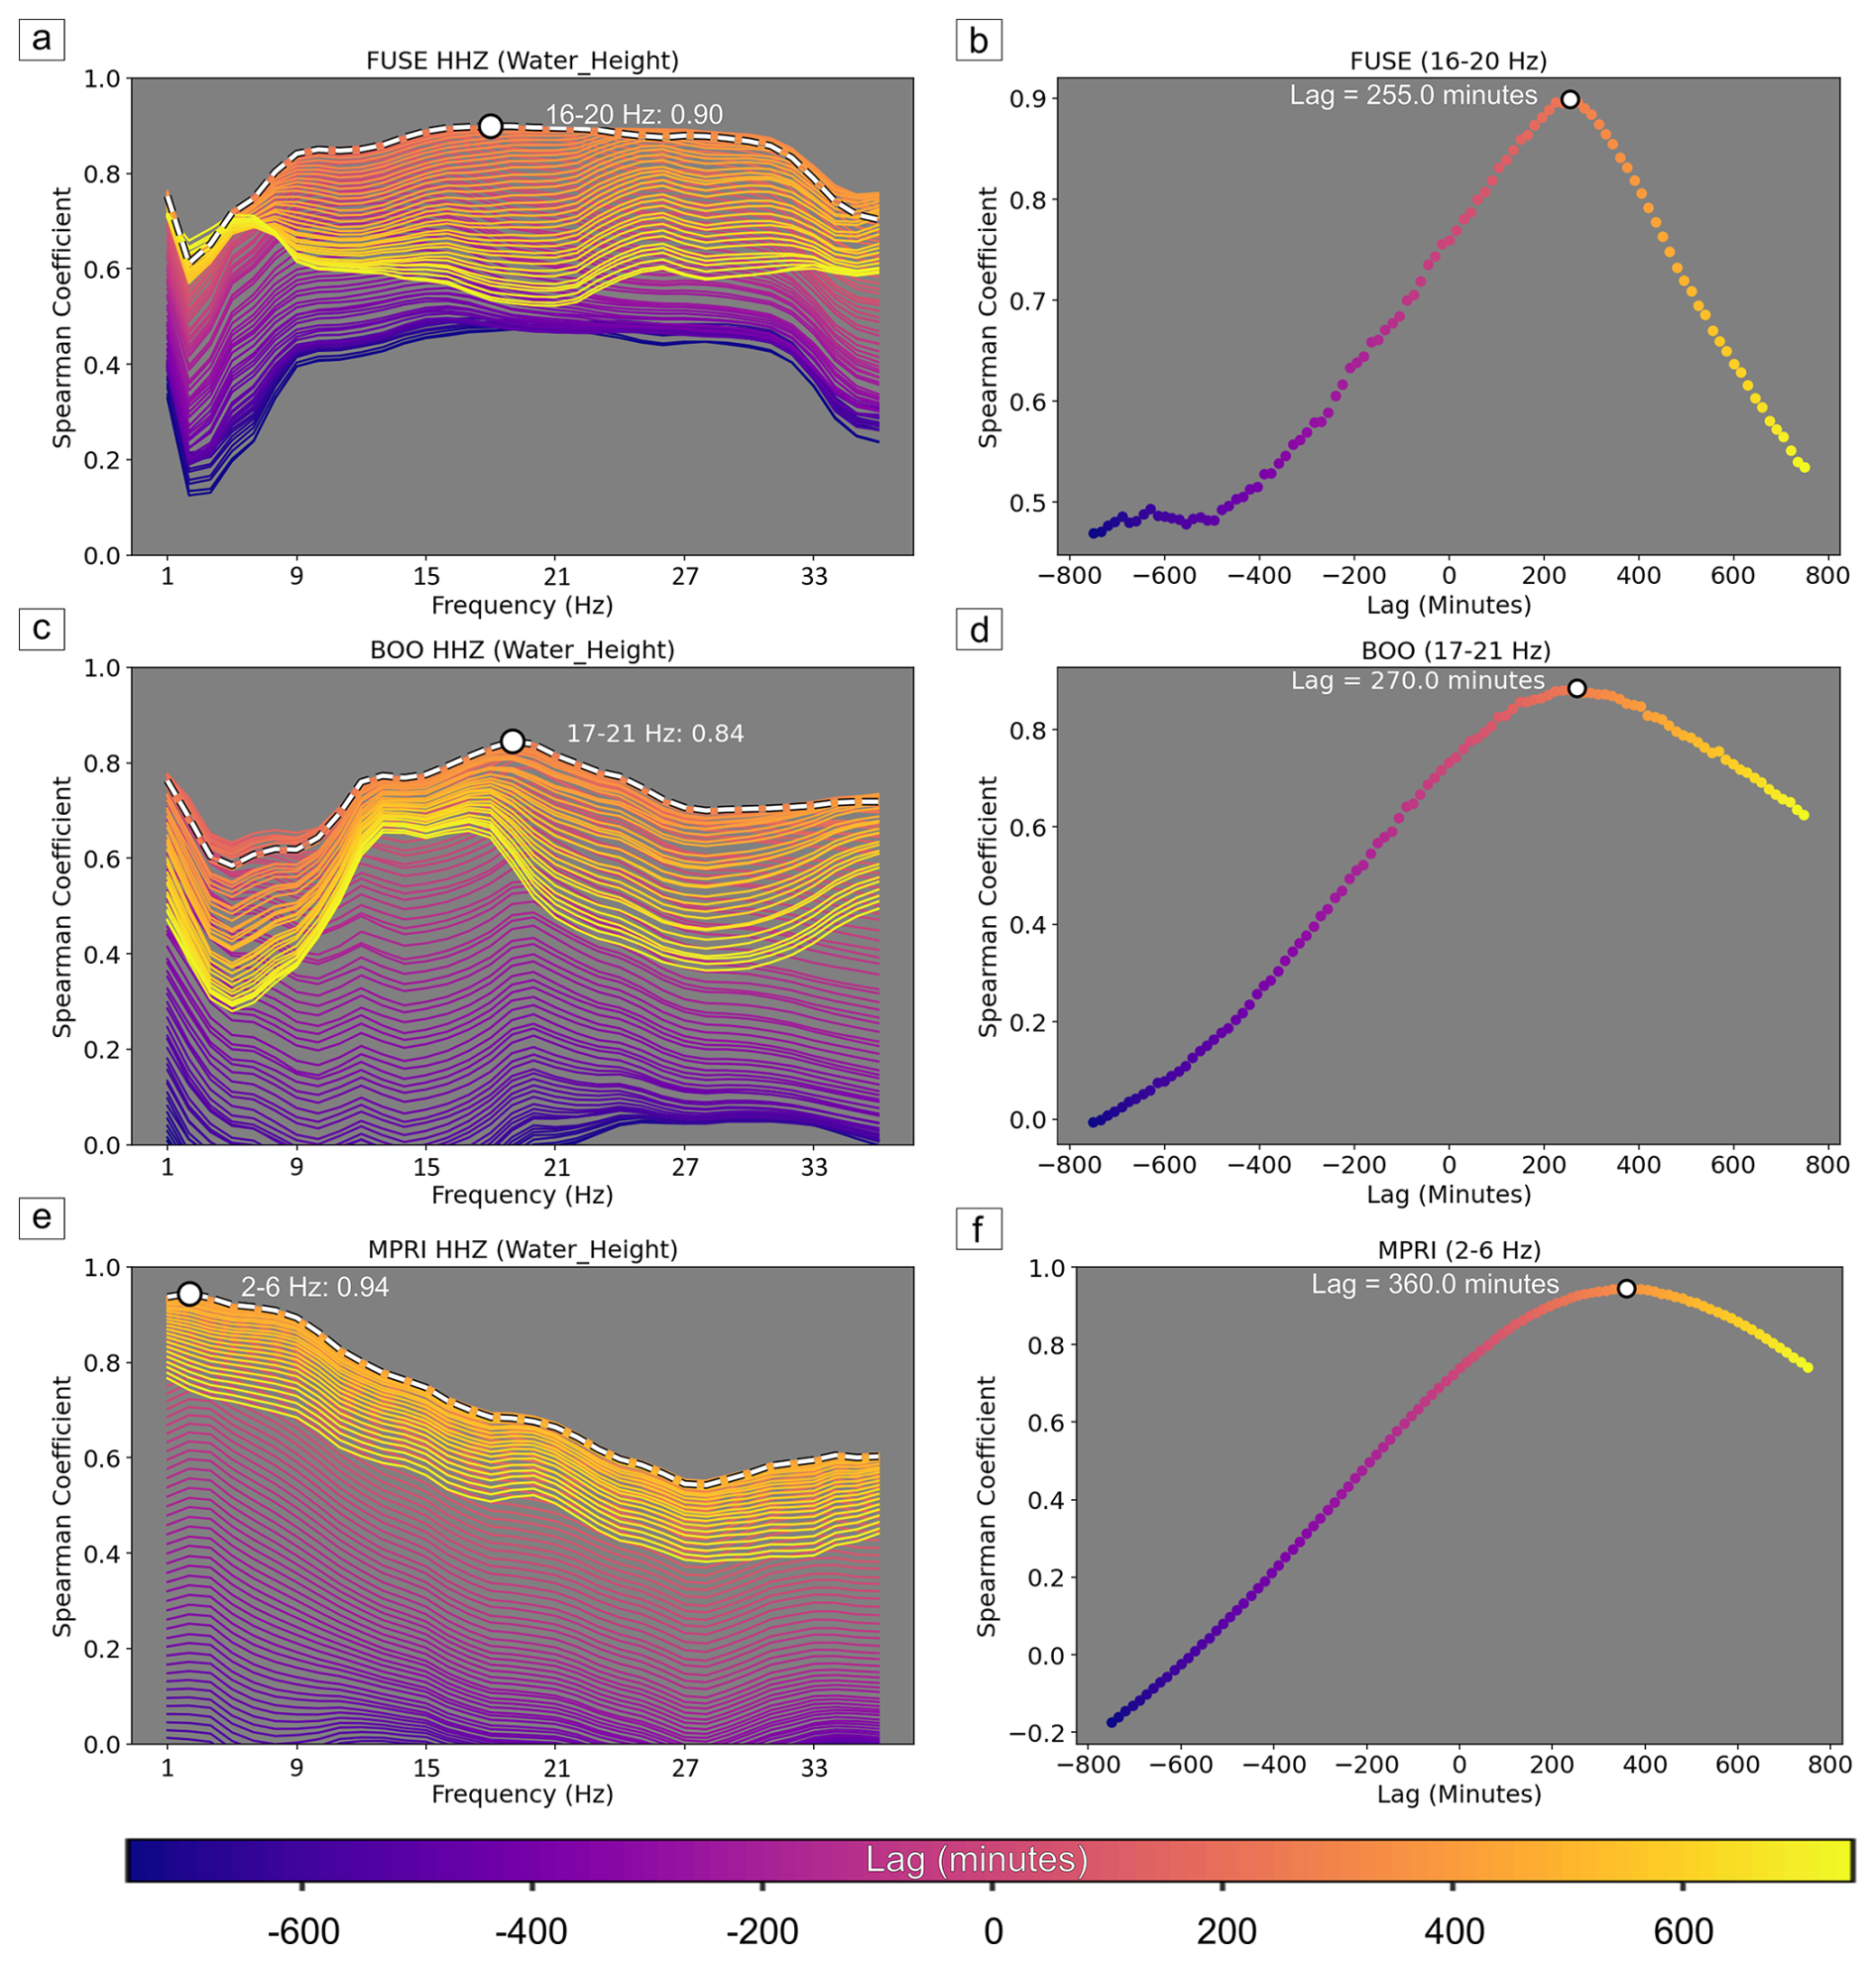
Figure 5Correlation analysis between seismic PSD and water height data of the river flood event that occurred in November 2023. The plots are divided by seismic stations, FUSE (a–b), BOO (c–d), MPRI (e–f). The shift with the highest correlation value is highlighted in white dashed line, while with the colour palette the lag in minutes is shown. Scatter plots for the frequency with the highest correlation value show the corresponding lag (b, d, f). Lags are all positive due to the seismic PSD preceding the water height time series.
The water height component shows a good correlation with low-frequency (2–6 Hz) seismic data for the farthest station with a Spearman coefficient of 0.94 for MPRI. A second peak of high correlation (0.84) is observed at higher frequency (17–21 Hz) for BOO. For FUSE, the closest seismic station to a riverbed, higher correlation coefficients prevail from about 7–11 Hz up to 29–34 Hz, then decreasing for higher frequencies. The reported lags range from 255 to 360 min for the three used stations. The interpretation will be discussed later in Sect. 3.2.
In Fig. 6, the time series of the hydrological component is plotted on top of the sub-band PSD curves corresponding to the highest Spearman coefficient (right panels in Fig. 5). Both original and lagged versions of the PSD curves associated with the highest correlation with the water height are plotted. It is interesting to observe that the shape of the shifted seismic PSDs matches well with the variations of water height, as the rising part of the PSD curve and the width of the PSD peak are now coincident with the water height curve.
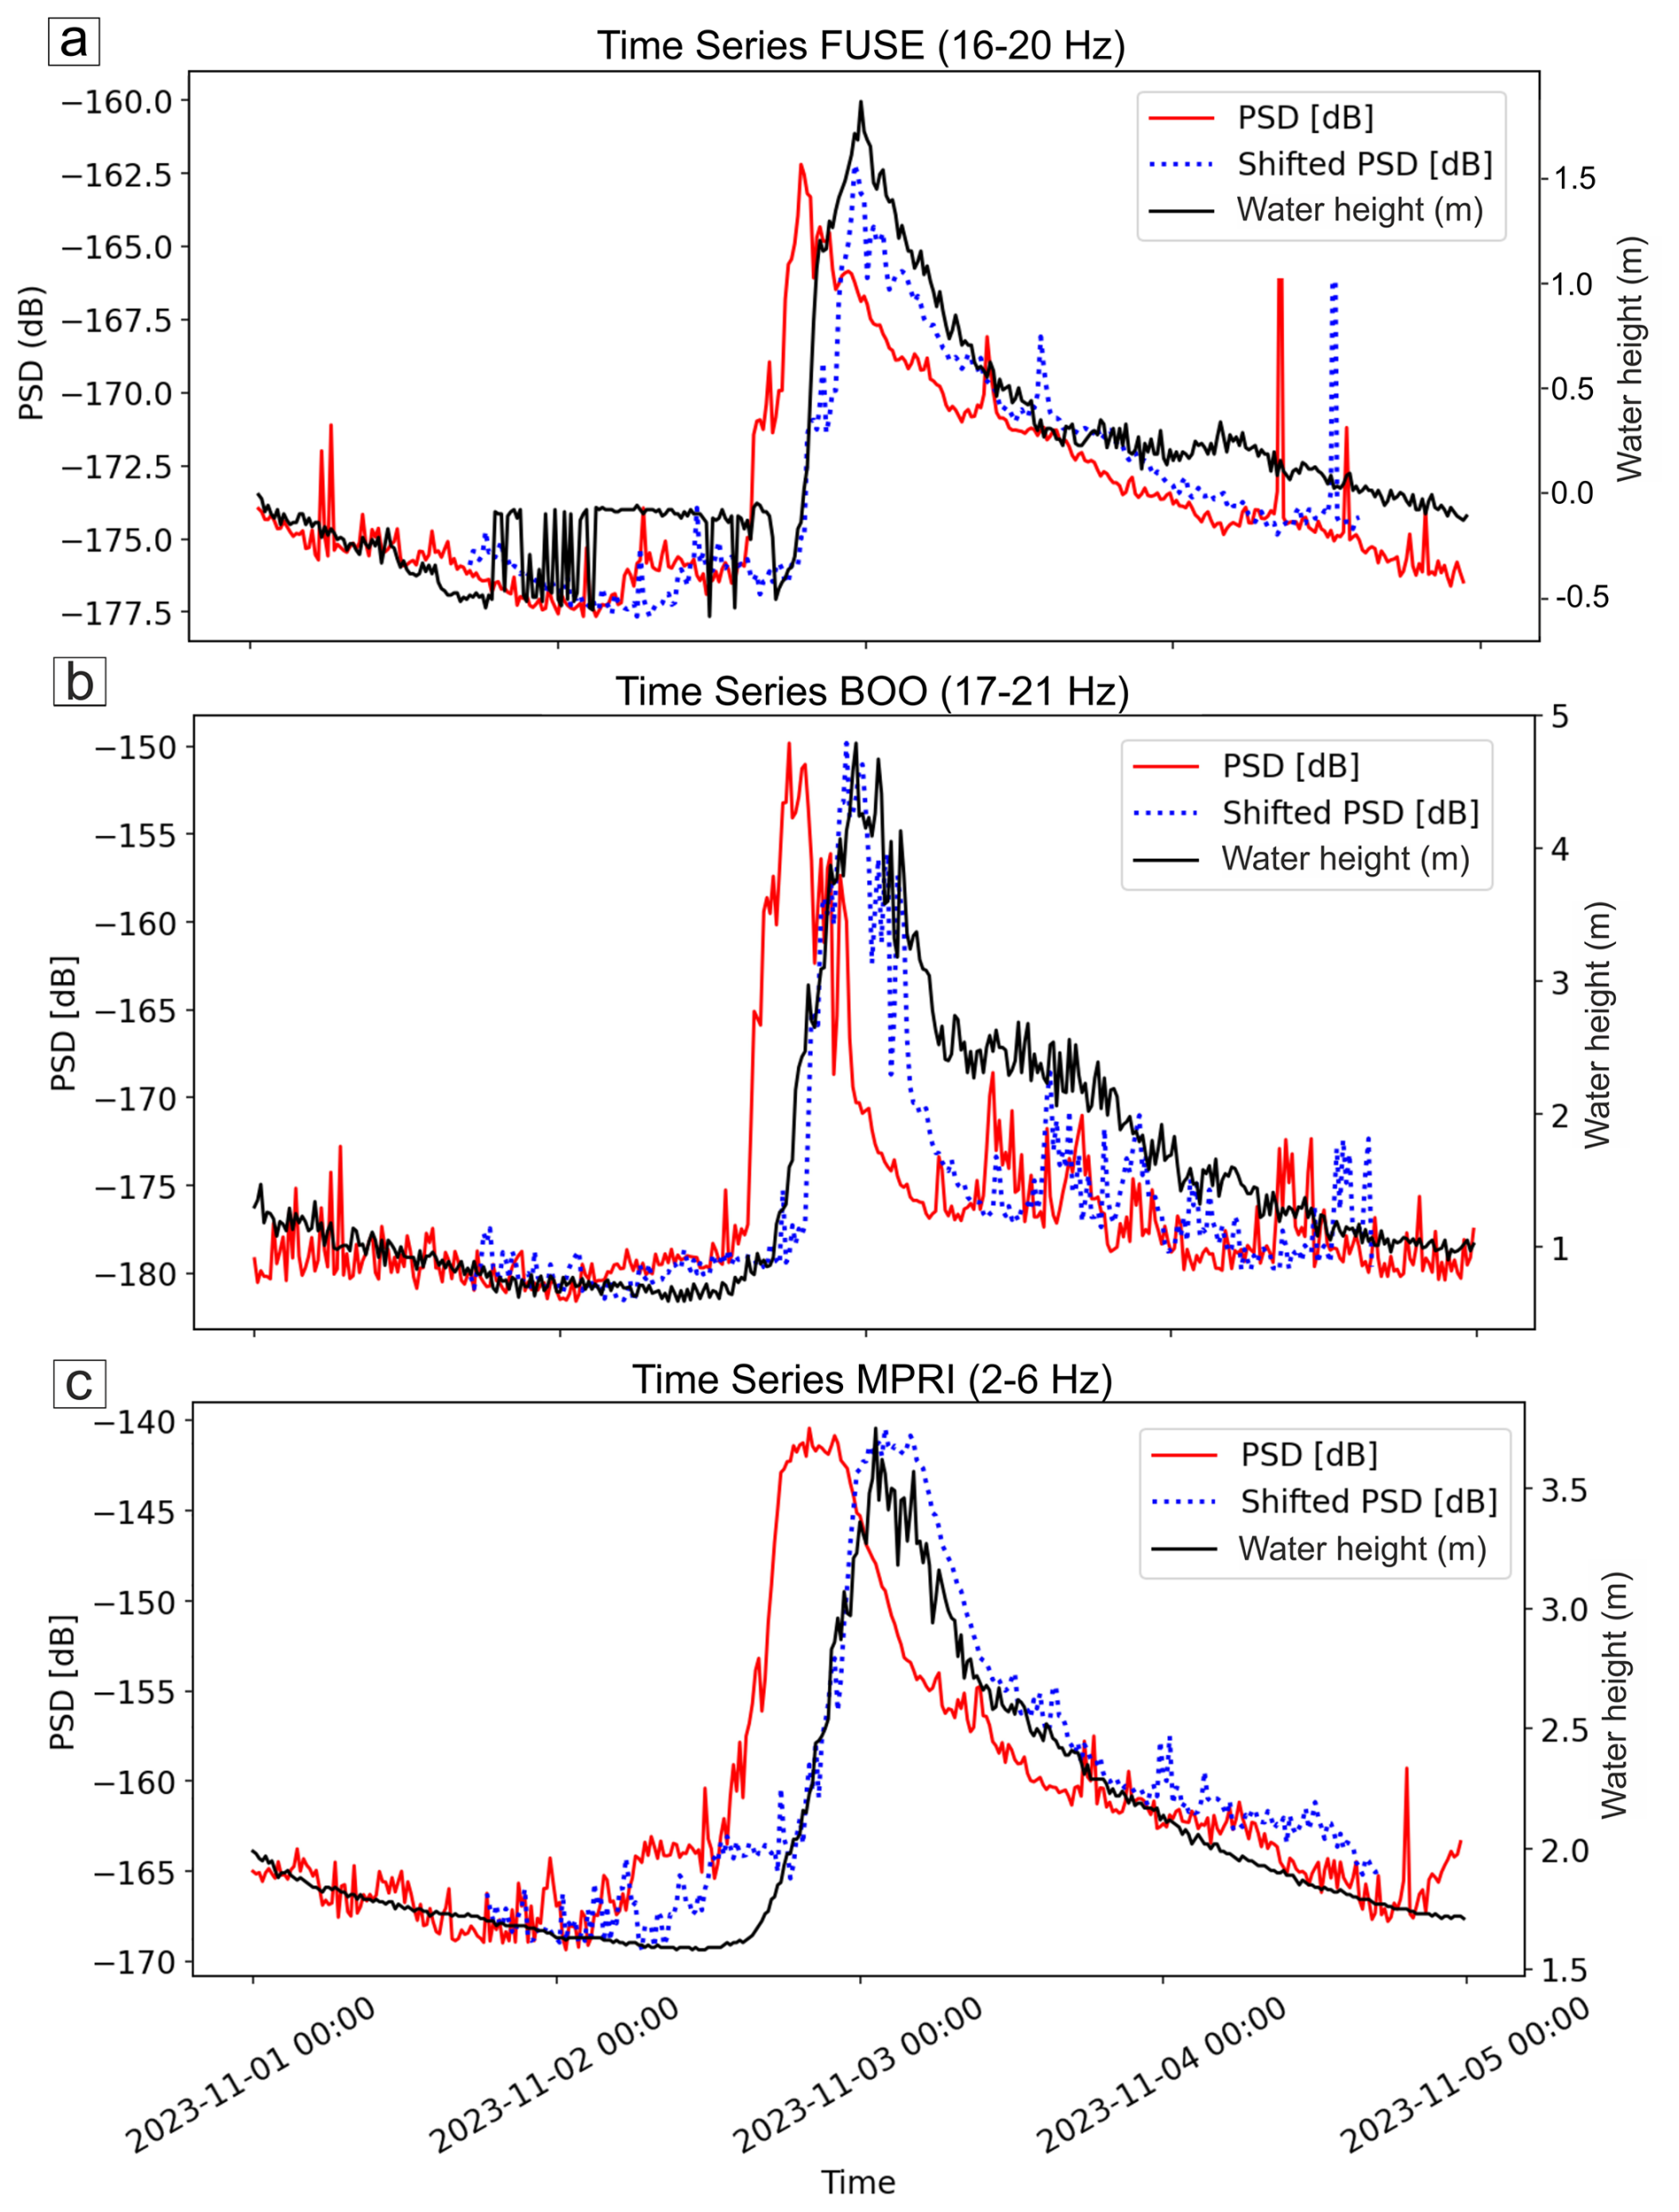
Figure 6Time series for FUSE (a), BOO (b) and MPRI (c) seismic stations showing seismic PSD (dB) of the frequency band with the highest Spearman correlation coefficient value in red line (16–20 Hz for FUSE, 17–21 Hz for BOO and 2–6 Hz for MPRI), water height data in black line and the shifted PSD with best lag correlation in blue dotted line.
While the correlation between seismic PSD and water height appears obvious from the previous analysis (Figs. 5, 6), we also assessed potential correlation between wind velocity and rain rate data with the seismic component during the flood. Because local variations of wind and rain around the seismometer predominantly affect the seismic records above 1 Hz (Smith and Tape, 2019; Bakker et al., 2022; Johnson et al., 2019) we only perform a multi-parameter (water height, wind and rain) correlation analysis with data associated to the seismic station MPRI (Fig. 7), where the pluviometer and the anemometer (65, see Fig. 2) are located less than 400 m away from the seismometer.
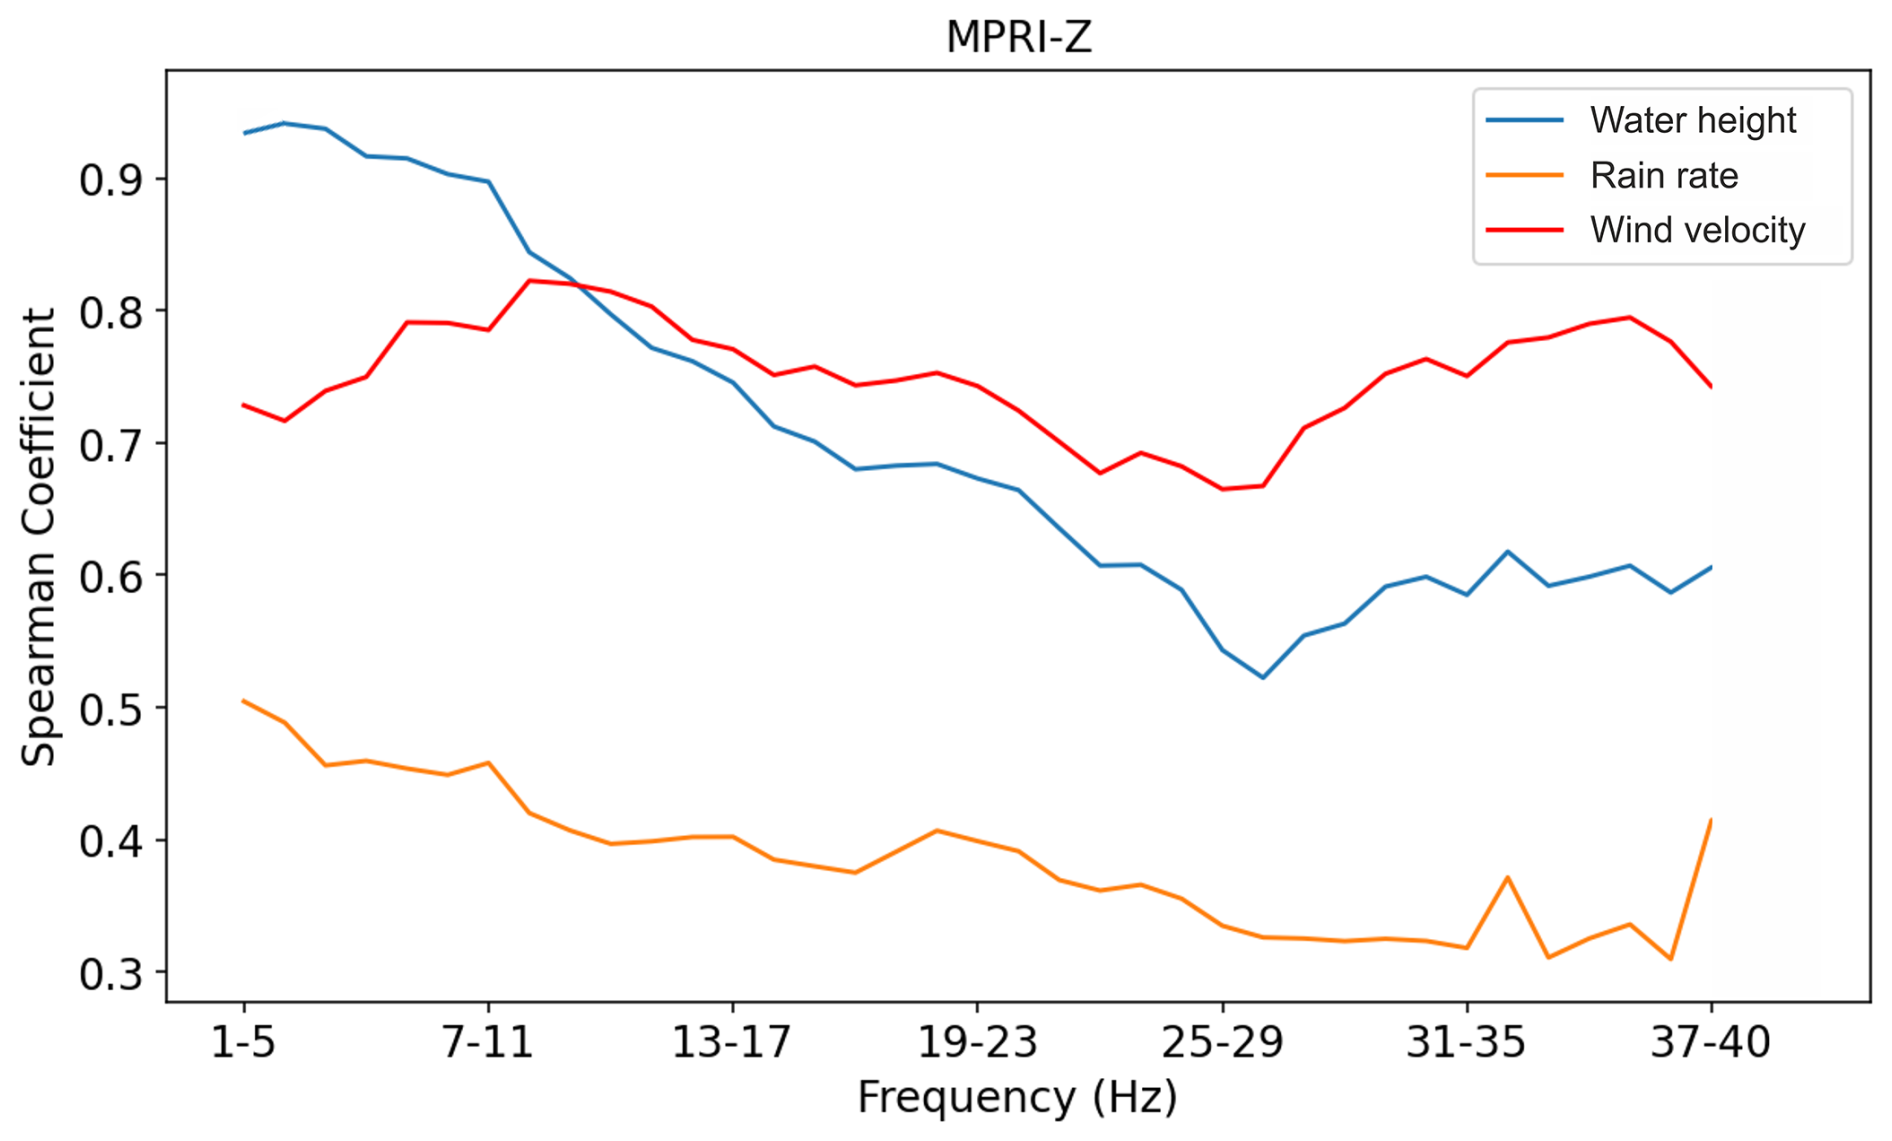
Figure 7Spearman correlations between the water height (in blue), the rain rate (in orange), the wind velocity (in red) data and the seismic PSD [dB] from 1 to 40 Hz for the MPRI seismic station vertical component during November 2023 river flood, processed with a 5 Hz frequency bandwidth and step of 1 Hz. Hydrological and meteorological data are collected by Villuzza level gauge (C621) and Mt.Prat meteorological station (65). The water height curve is the one with the most correlated lag obtained from the Spearman correlation with the seismic data.
The water height curve is related to the PSD curve which correlate best (i.e., filtered between 2 and 6 Hz and lagged by +360 min, see Figs. 5, 6). Rain rate and wind velocity data are compared with the original (zero lag) PSD curve, as they are considered to only reflect local impact producing seismic noise close the seismic station (Smith and Tape, 2019; Bakker et al., 2022; Johnson et al., 2019). As seen previously, the water height presents the highest correlation with seismic data at lower frequencies (above 0.9 and below 6–10 Hz) and decreasing Spearman coefficients with increasing frequencies. The wind component exhibits a rather constant correlation for the whole frequency range with high coefficients between 0.7 and 0.8. Lower values are obtained below 6–10 Hz and from about 20 to 30 Hz. The rain component is characterized by low correlation values fluctuating between 0.3 and 0.5 among all investigated frequency bands.
Furthermore, if the water height data are related with seismic PSD data from the frequency band that shows highest correlation with water height (16–20 Hz for FUSE, 17–21 Hz for BOO and 2–6 Hz for MPRI seismic station, see Figs. 5, 6), a clockwise hysteresis behaviour of the river response to the flood in terms of seismic energy could be appreciated (Fig. 8). We observed an increasing trend in the first phase with a rise in the PSD values and, successively, in water height by the time the flood wave reaches the level gauge. Next, the seismic amplitude reaches its peak and after the maximum water height is registered, both variables decrease again to background values. More specifically, FUSE and BOO reported a more scattered hysteresis than MPRI, with a higher difference between minimum and maximum PSD value reported in BOO rather than in FUSE. This behaviour is well seen also on horizontal components, showing similar hysteresis (Fig. S3).
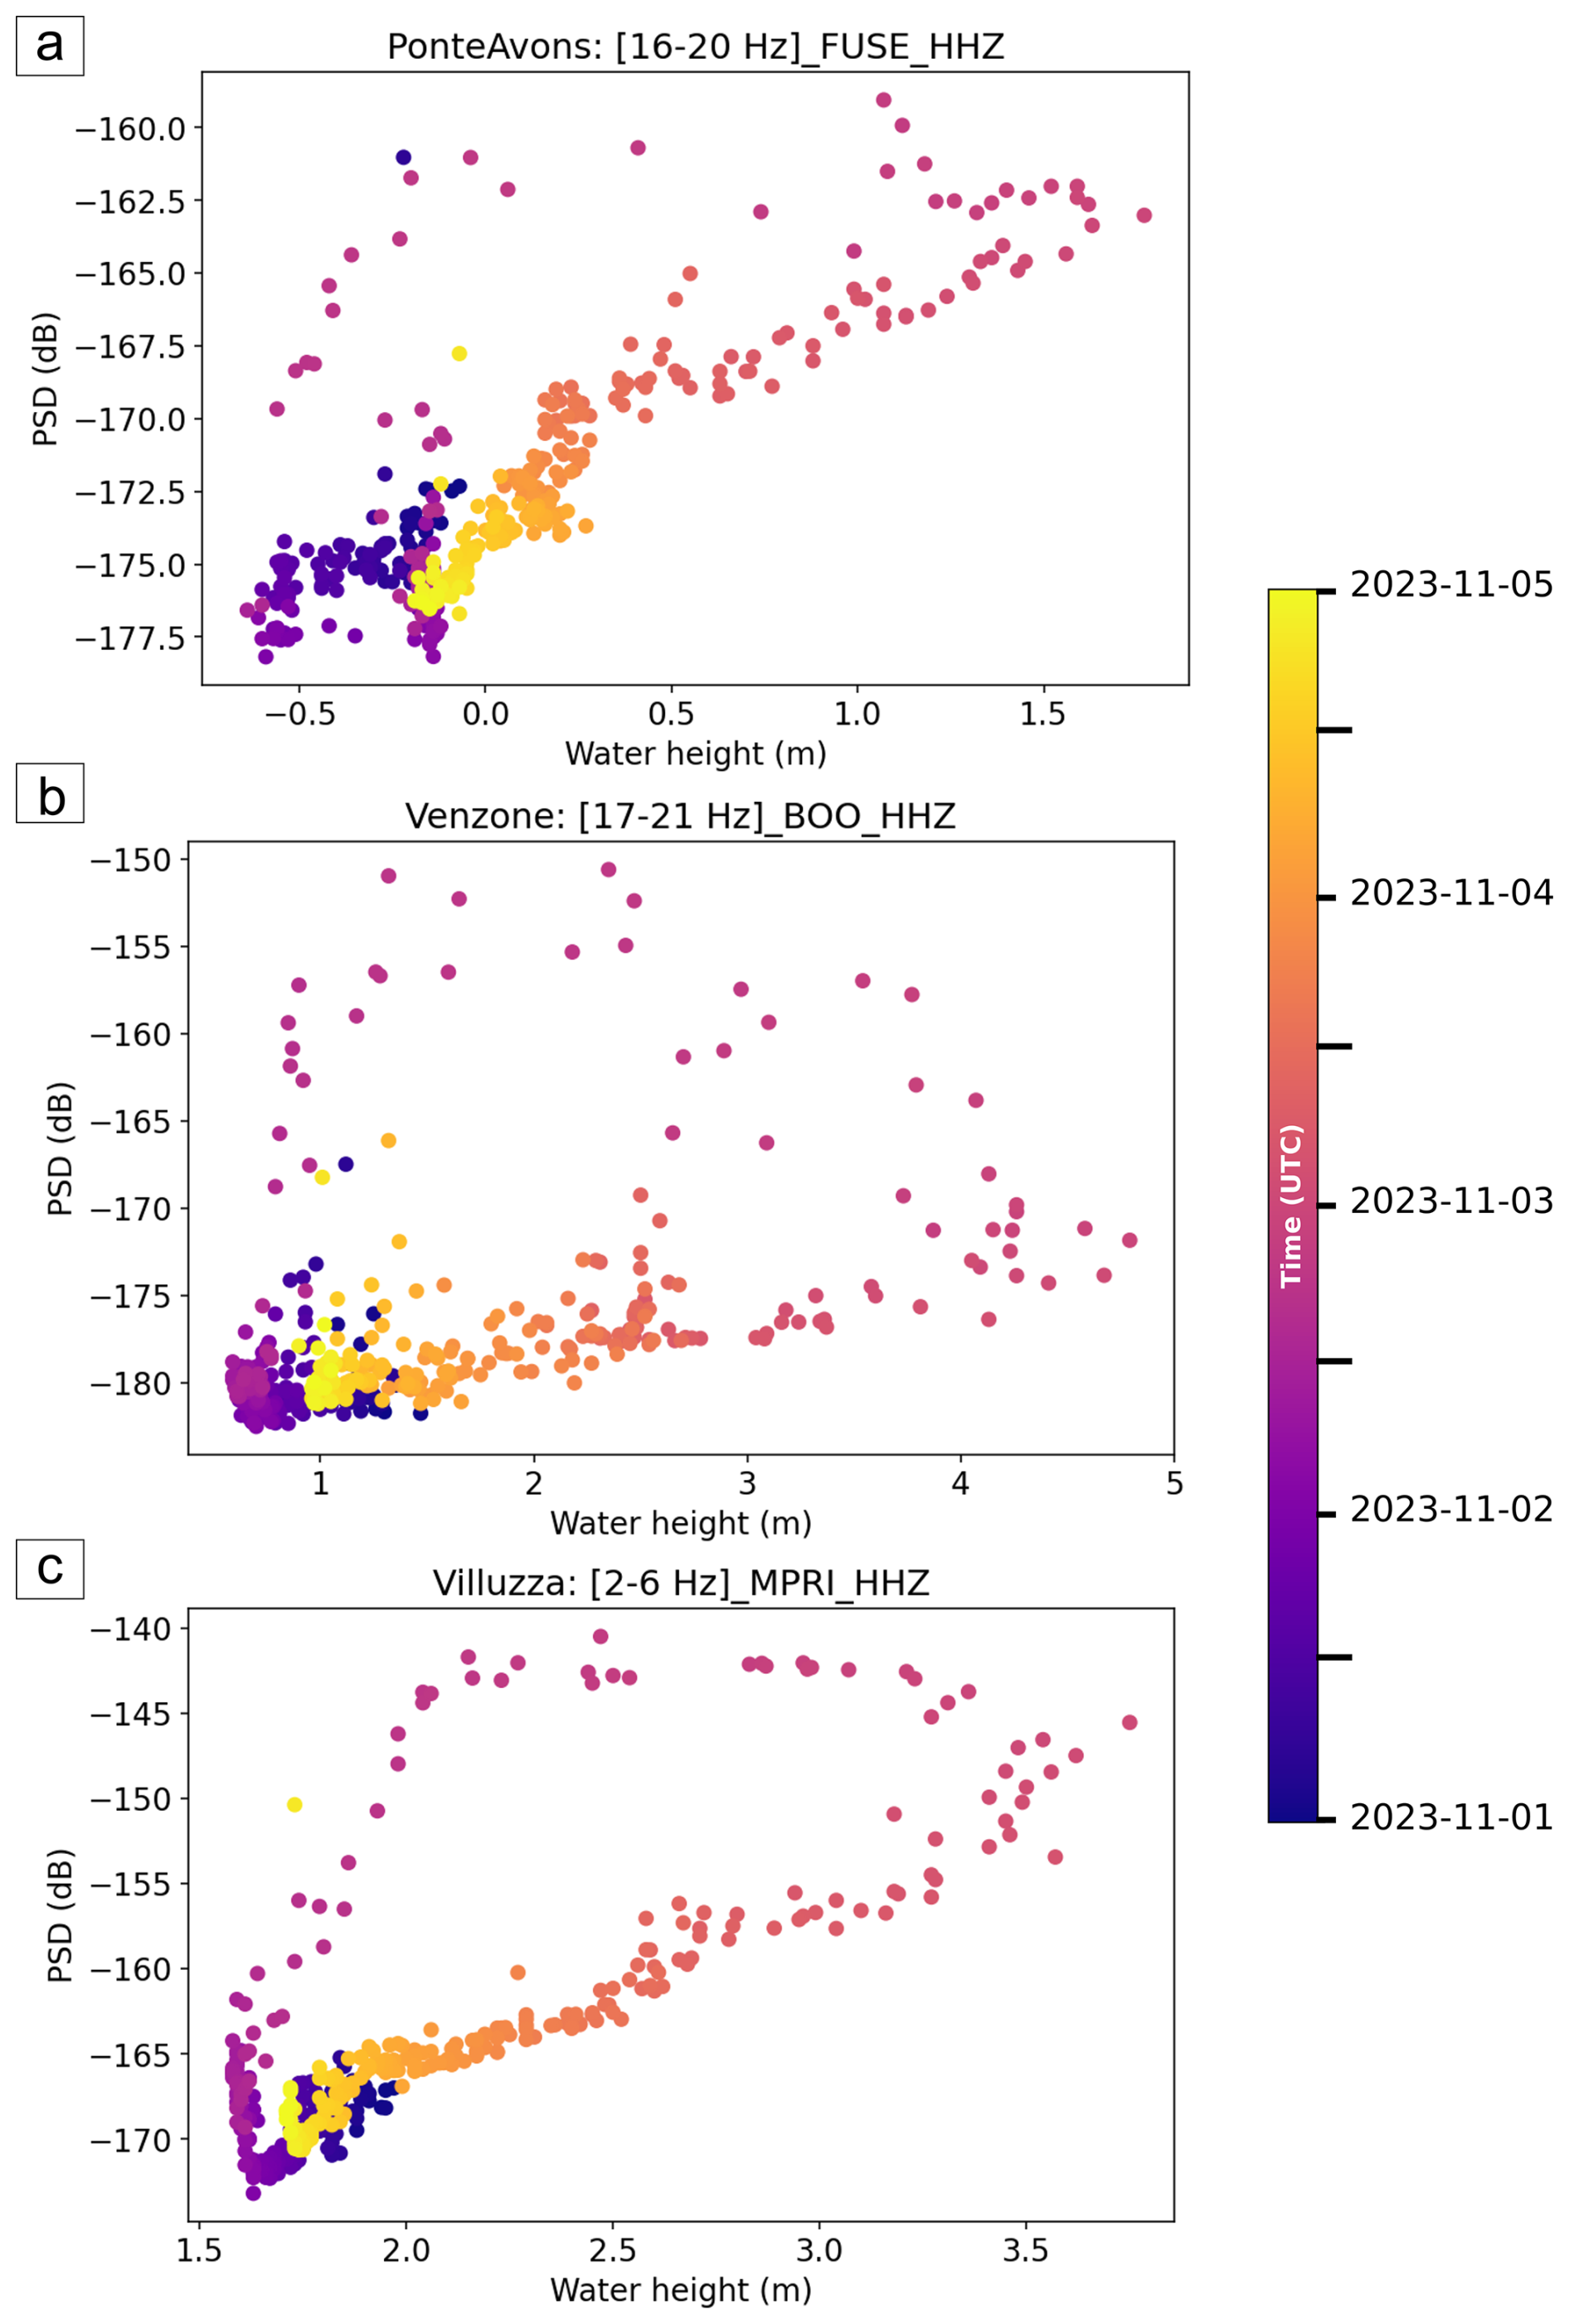
Figure 8PSD related to the water height color-coded with time of occurrence for the FUSE (a), BOO (b) and MPRI (c) stations in 16–20, 17–21, and 2–6 Hz frequency bands respectively during the Ciarán storm flood event.
2.3 Polarization analysis during the main event
The polarization analysis performed on seismic data recorded during flood revealed distinct features. For the three seismic stations used in this work, the analysis has been performed with seismic data related to specific frequency ranges (16–20 Hz for FUSE, 17–21 Hz for BOO, 2–6 Hz for MPRI). As displayed in Fig. 9, the back azimuth generally shows significant variations when PSD values peak, highlighted with bright yellow of the colour palette. In addition, these back-azimuths associated to PSD maxima differ from background noise back-azimuth or from the more dispersed pre- and post-event behaviours. FUSE polarization in the 16–20 Hz range is the best case highlighting this behaviour, as it is characterized by a comparatively low background noise in the most correlated frequency range relative to the other seismic stations (appreciable in Fig. 3c spectrogram) and the back-azimuth variation is distinct and clearly deviates from the background polarization trend. In addition, the Degree of Polarization (DOP) clearly shows an increase during the intensification of the seismic amplitude with values up to 0.5–0.6, which are recommended numbers to interpret results from a polarization analysis as reliable, according to Goodling et al. (2018).
This section discusses the river–seismic coupling observed at the three permanent broadband stations FUSE, BOO and MPRI (0.4, 1.5 and 3 km from the Tagliamento riverbed) during the 2–3 November 2023 Ciarán flood, based on gained spectrograms, Spearman correlations between the 1–40 Hz PSD (15 min windows) and water height time series and their relationship describing the hysteretic behaviour, followed by three-component polarization analysis interpretation.
3.1 Frequency-domain characteristics
The frequency-dependent seismic responses observed in the analyses are likely influenced by the distance between seismic stations and the river. Low-frequency seismic waves experience less energy loss over longer distances (Shearer, 2009), which may explain their higher correlation with hydrological data, especially with big source-station distances. The range of time of highest seismic energy corresponds to the rising water level until the flood peaks, when flow rates are notable and bedload gets moved once shear stress exceeds the sediment transport threshold (Burtin et al., 2008). The PSD thus reaches its maximum during the increasing part of the water height curve, following a hysteretic behaviour (Mao, 2012), also evident in our analyses (Figs. 8–S3).
As highlighted by Withers et al. (1996) and Lott et al. (2017), the stronger signal on horizontal components - also observed here (Fig. S4) – is likely due to increased sensitivity of seismic stations to local environmental noise, particularly wind. The considerable distance between seismometers and the riverbed further amplifies this effect, as river-generated waves are attenuated during propagation (Tsai et al., 2012; Gimbert et al., 2014). Consequently, horizontal components are more affected by meteorological noise (e.g., wind and rain) than the vertical one.
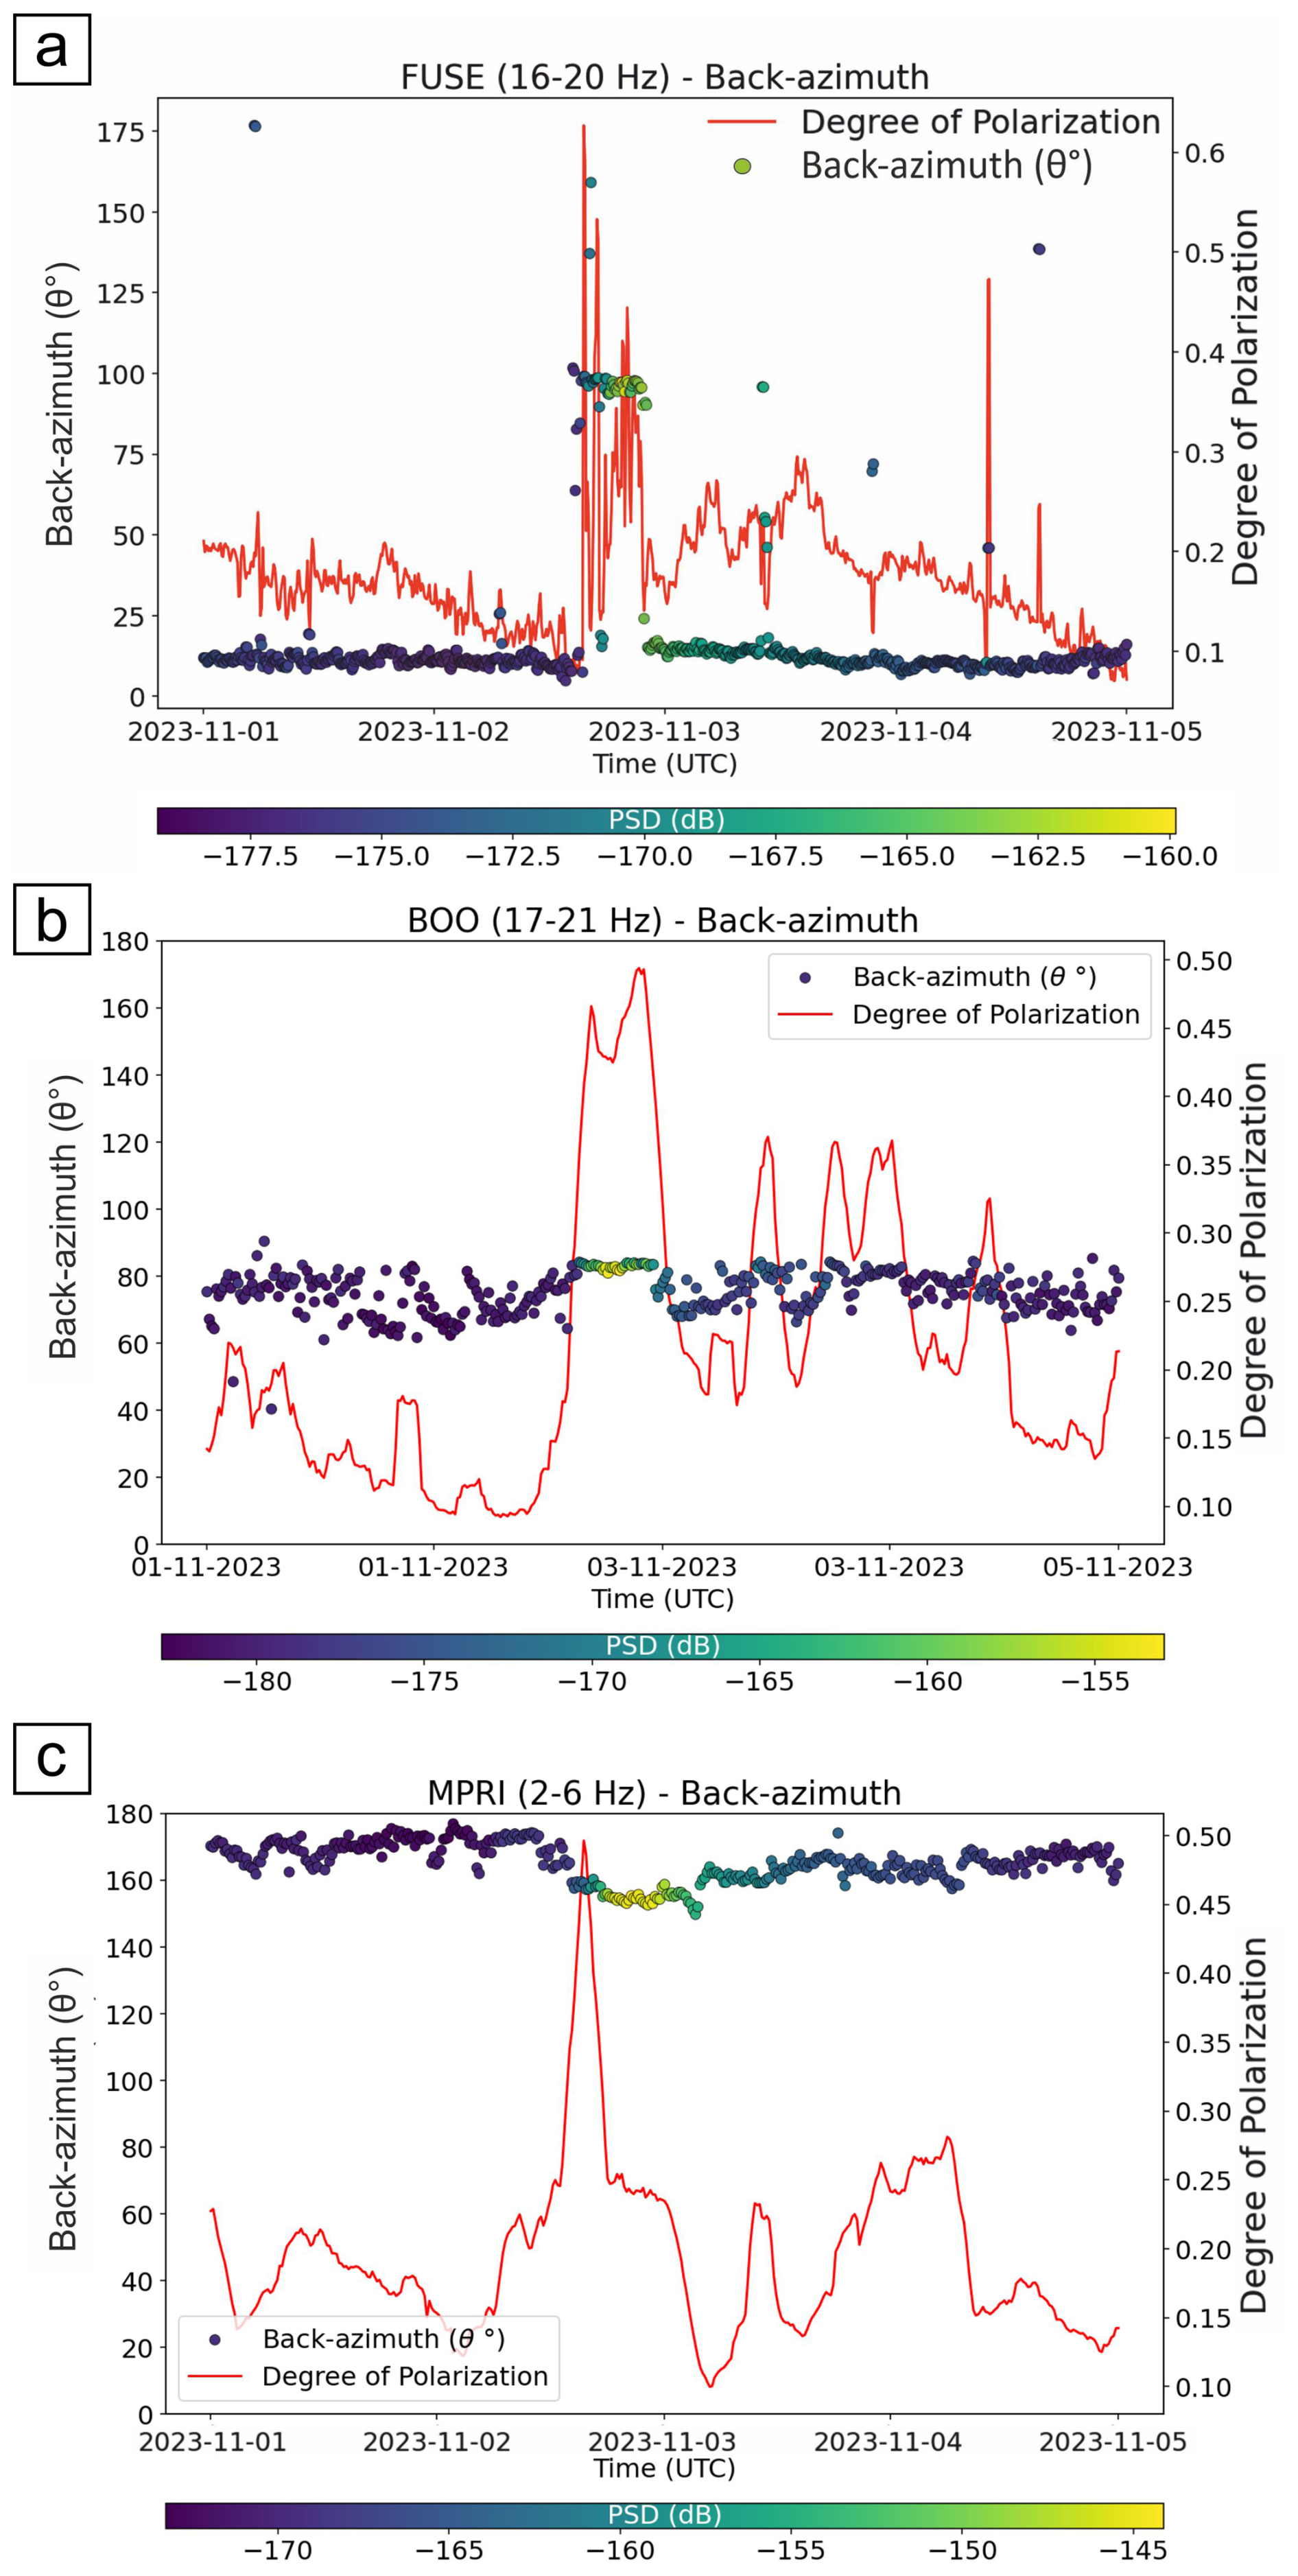
Figure 9Polarization analysis for (a) FUSE, (b) BOO and (c) MPRI seismic stations in frequency ranges with the highest value obtained by Spearman correlation results. The back azimuth value (θ°) over the investigated period is related to the PSD (dB) with a colour palette, underlining the peak of the seismic event during the flood, while in red line the degree of polarization is shown.
V-shape variations of dominant frequencies associated to bell-shape variations of PSD values similar to that observed at MPRI (Fig. 4a) have been reported in other studies (Díaz et al., 2014; Tsai et al., 2012; Roth et al., 2016). These variations may reflect changes in source–receiver distance as the seismic source (water turbulences, bedload transport) migrates downstream with the flood wave (Roth et al., 2016; Tsai et al., 2012). Alternatively, they may relate to selective sediment transport at varying discharge rates (Díaz et al., 2014), where high frequencies correspond to small grain motion and low frequencies to larger sediments. Initially, small particles (e.g., sand and fine-pebble size for the Tagliamento, Monegato and Stefani, 2010) are moved by the stream, and collisions produce seismic waves at higher frequencies in the considered band. As the intensity of the river flow rises, bigger and heavier sediments (e.g., cobble to boulder size limestones and dolostones, Monegato and Stefani, 2010) are transported, recording a lower frequency signature, followed by deposition during the last stage of the flood at decreasing water flow rates. During this latter phase, only lighter particles are moved by the stream, generating a minor seismic contribution from bedload and higher amplitude at higher frequencies, caused by water turbulence, drawing a V-shape signature in the low frequency range (Díaz et al., 2014). Laboratory and field studies (Barrière et al., 2015b; Gimbert et al., 2019; Hunter, 1957; Huang et al., 2007) confirm the inverse relation between seismic frequency and grain size. Thus, the observed 2–6 Hz band at MPRI likely represents a mixed signal of bedload and flow responses modulated by discharge and source distance, with stronger PSD amplitudes downstream (from FUSE to MPRI) due to flood evolution and Fella River contribution. Though our findings are in line with the aforementioned works, attributing the V-shape observed in Fig. 4a exclusively to variations of bedload size, water depth, or distance to the source(s) remains speculative and needs further investigations, supported by field measurements.
3.2 Correlation of Seismic and Hydrometeorological Data
Correlation results (Fig. 5) confirm the contribution of river components during the November 2023 flood and highlight the influence of station–river distance. The FUSE station, closest to the river (400 m), maintains correlation coefficients near 0.9 up to 30 Hz, indicating minimal high frequency attenuation. BOO, located at a distance from the riverbed that is intermediate between the distances of FUSE and MPRI from the riverbed, exhibits narrower correlation peak between 17–21 Hz, while the first high correlation values in the range 1–5 Hz are probably derived from the effects of the wind perturbation acting on the near trees or antenna, which generates low frequency waves from the wiggle of the near objects and maybe beyond our lower investigated threshold of 1 Hz. Also, we do not exclude the contribution of high frequency microseism (near 1 Hz) generated by the strong meteorological perturbation influencing the offshore sections with lowest range of frequency, considered in this work. MPRI shows strongest correlation at 2–6 Hz, where wind dominates higher frequencies (10–40 Hz) and rainfall does not have a relevant contribution along all frequencies, compared to the other two data (Fig. 7).
Time-lag differences among sections (255 for FUSE, 270 for BOO, and 360 min for MPRI) likely represent the lag between the seismic detection of the flood perturbation and the subsequent water-height peak at the corresponding gauge, without considering gauge stations misalignment. Although it is well known that wind and rain generate seismic noise over a broad frequency band (Rindraharisaona et al., 2022), our analysis makes it possible to exclude wind and rain as the primary factors controlling both the shape of the PSD curve and its time lag relative to water height (Fig. 6). The obtained values of Spearman's correlation are indeed higher than 0.9, demonstrating that the shape of PSD curve filtered in specific frequency range reproduce quite well the shape of the water height. This indicates that the seismic noise generated by the river emerges from other storm-related noise sources, such as wind and rainfall.
Furthermore, to rule out the possibility that the large time lags obtained from the correlation analysis are simply due to the relative position of the seismic station with respect to the level gauge, we estimated the flood-wave propagation velocity for this event using the two level gauges at Venzone (C503) and Villuzza (C621). The time lag between the two water-level records was obtained through Spearman's correlation analysis, yielding a delay of 120 min with a Spearman's correlation coefficient of 0.96 (Fig. S6a–b). Given the 25 km distance between the two gauges (Fig. 1), this corresponds to an average flood-wave velocity of approximately 3.3 m s−1.
Using this velocity, we estimated the travel time required for the flood wave to propagate from a point located 9 km upstream of the Villuzza gauge (C621) – approximately the closest point along the river to station MPRI – to the actual gauge location. The resulting delay is about 45 min. This value is much smaller than the 4–6 h time lags obtained from the seismic–hydrological correlation analysis, indicating that the relative position of the seismic station and the level gauge has only a minor effect on the measured delays. These results therefore support the interpretation that the seismic stations detect flood-generated seismic waves originating upstream during the early stage of the storm, several hours before the water-level increase reaches the downstream level gauge.
It is worth noting that the presented values are related to the November 2023 flood event and could variate for other events with different rain intensity and locations in the catchment area.
Rainfall-induced seismic noise affects mostly very high frequencies (generally above 50 Hz) and influences areas within ∼ 25 m of a station (Bakker et al., 2022), while wind acts instantaneously on the sensor and nearby structures, like trees and antennas (Johnson et al., 2019), primarily influencing high frequencies (Roth et al., 2016; Johnson et al., 2019; Rindraharisaona et al., 2022). For MPRI, which is near a meteorological station, correlations with rainfall and wind confirm that river noise dominates low frequencies, while wind becomes dominant above ∼ 20 Hz (Fig. 8).
3.3 Hysteretic behaviour
Hysteresis between seismic amplitude and water height has been widely documented (Burtin et al., 2008; Schmandt et al., 2013; Barrière et al., 2015a; Gonzalez et al., 2023; Abi Nader et al., 2023; Borzì et al., 2025). In this study, hysteresis was observed in the frequency bands identified as river signatures: 16–20 Hz at FUSE, 17–21 Hz at BOO, and 2–6 Hz at MPRI (Fig. 8). Lower frequencies show clearer trends, while higher frequencies are more influenced by non-river noise.
These results indicate that frequencies up to ∼ 40 Hz could include both flow- and bedload-related signals, with the latter diminishing as station–river distance increases (Tsai et al., 2012; Gimbert et al., 2014). Initially, PSD rises while water height remains low, marking the flood's onset and sediment mobilization. As water height peaks, seismic energy reaches its highest values (PSD), representing maximum transport capacity. During recession, decreasing PSD values correspond to sediment deposition and return to background noise levels. The clockwise hysteresis behaviours, with a rapid increase of the PSD relative to the water height and successive slow decay to normal conditions, is wide documented in the known literature (e.g., Burtin et al., 2008 on the Trisuli River; Hsu et al., 2011 on the Cho-Shui River). In our case, the hysteresis is mainly driven by the seismic signals generated by the flood anticipating the increase in the water height gauge in the river, near the station. Also, according to Borzì et al. (2025), the clockwise narrow hysteresis of the Cimia River indicates a main seismic contribution given by the turbulent river flow, as the transported sediments in their case is reported to be fine (e.g., sand and sandstones). While, in our case, the Tagliamento carries coarse bedload (Monegato and Stefani., 2010) and the morphology of the river itself is completely different, with very large riverbed (up to 1 km wide) and big quantity of water transported with turbulence from up to downstream. This leads to increases in seismic PSD amplitudes and, as a conseguence, to a wider hysteresis, emphasizing the difference between the PSD values during the rising of the water height and its descending phase.
Higher-frequency hysteresis widths likely reflect bedload transport (Gimbert et al., 2014), while lower frequencies are dominated by river flow. Seismic energy increases from upstream to downstream (−155 to −145 dB, vertical component), with horizontal components hysteresis about 5 dB higher (Figs. 8, S3). This suggests higher flow rates or greater sediment transport downstream (MPRI), influenced by the Fella River contribution (1290 m3 s−1 registered on Moggio Udinese station C464 during August 2023 flash flood; Borga et al., 2007).
It is also important to highlight that this difference in amplitude between horizontal and vertical components could be also explained in term of site conditions, hydrodynamic forcing or sensor coupling. Although sediment trap data were unavailable and our trend aligns with previous studies (Burtin et al., 2008; Gimbert et al., 2014), this remains a hypothesis.
Despite its 2–3 km distance from the riverbed, MPRI still recorded clear flood-related seismic signatures, consistent with Burtin et al. (2008), who observed river noise up to 15 Hz from stations over 2 km away.
Moreover, the hysteresis analysis further confirms the delayed behaviour between the seismic (PSD) and hydrological (water height) signals. To evaluate the effect of the relative position between the seismic station and the level gauge, we compared the hysteresis obtained using the original Villuzza (C621) water-level record with that obtained after applying the theoretical upstream spatial offset described in Sect. 3.2 (corresponding to a 45 min time shift for station MPRI; Fig. S6c). The two hysteresis loops are very similar over the same frequency range, indicating that accounting for the station–gauge offset produces only minor changes in the seismic–hydrological relationship. This result confirms that the spatial misalignment between seismic stations and level gauges has a negligible influence on the overall time lags calculated using the actual station locations and can therefore be reasonably neglected in the analyses presented in this work.
3.4 Polarization analysis
Polarization analysis shows that PSD peaks coincide with shifts in back azimuth (Fig. 9), indicating river-related sources. FUSE station back azimuths (85–100°) point toward the But torrent (Fig. S5a), under the assumption that, considering its distance from the riverbed, Rayleigh waves are mainly being recorded, consistent with its proximity (∼ 400 m). BOO station polarization at 17–21 Hz points toward the near section of the riverbed (80–85°) where the width of the river begins to increase, suggesting a major seismic contribution during variations in flow characteristics.
At MPRI, back azimuths of 150–160° (Fig. S5c) correspond to a downstream section where flow is most energetic. Similar downstream-oriented polarization was reported by Chmiel et al. (2022) for the Vésubie River during Storm Alex.
The presented results in Fig. 9 show a major difference in back-azimuth for FUSE station, while BOO and MPRI display a less evident transition between background and seismic waves orientation during the flood. This suggests a different impact due to the station-source distance or a similar orientation between background noise (generally more scattered) and flood noise (clearer oriented azimuth). Degree-of-polarization (DOP) trends further support the temporal coincidence between azimuth shifts and seismic energy peaks, helping distinguish river-generated polarization from background noise.
Also, polarization analysis by Borzì et al. (2025) showed that floods recorded by stations within 280 m of a river are mainly characterized by rectilinearity values of 0.4–0.5, consistent with Rayleigh waves. According to Tsai et al. (2012) and Sanchez-Sesma et al. (2011), seismic waves generated by river bedload impacts are predominantly Rayleigh waves. This supports the pronounced V-shape in low-frequency spectrograms (Fig. 4) at the downstream MPRI station, which may primarily receive Rayleigh waves generated by sediment-rich flood fronts (Płaczkowska et al., 2020), also influenced by Fella River inputs.
3.5 Considerations on the flash flood event: 18 September 2023
We examined the flash flood event using the same stations and the same methodology. Considering the 18 September 2023 flash flood event shown in Fig. 10, the rain gauges collected a huge quantity of water (even greater than the main flood event), but the water height values (and so the discharge level) are lower than the aforementioned storm, which was over 2 m, but still important (around 1 m). Therefore, pluviometers collected about 18 and 21 mm 15 min−1, causing a river water rise of 1.2 m on Venzone and Villuzza level gauges. Also, anemometers recorded peak wind velocity around 8–10 km h−1, with hourly sample frequency. We did not consider FUSE station because of big data gaps during this specific event.
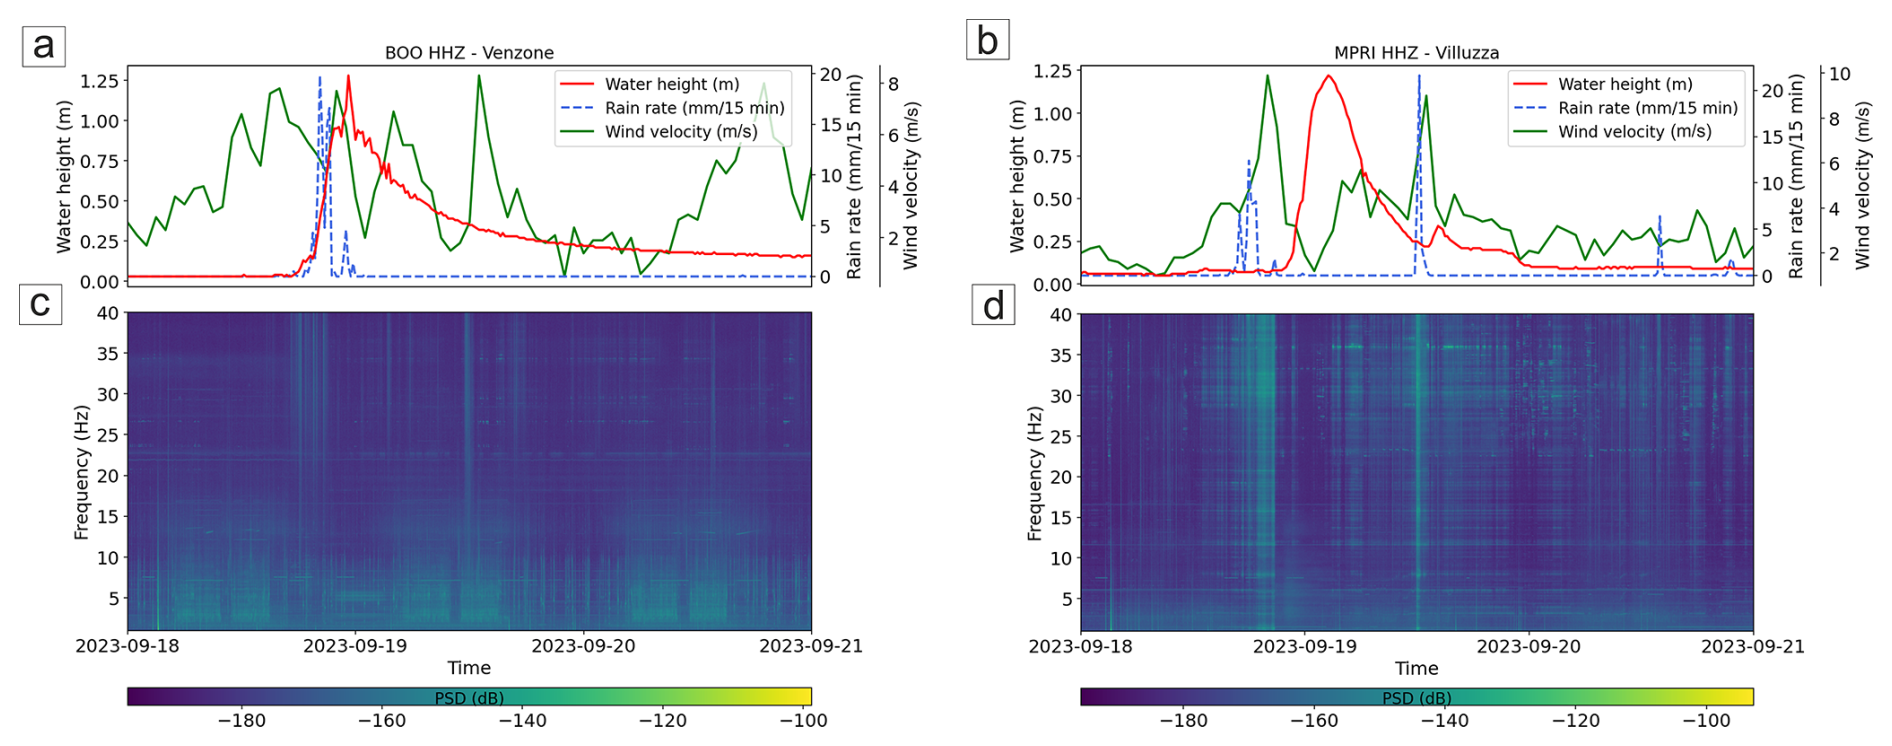
Figure 10Time series of water height (red line), rain rate (blue dashed line) and wind velocity (green dashed line), shown on (a) and (b) plots, are collected with a frequency of a sample every 15 min for Venzone and Villuzza level gauges and meteorological stations during the flash flood occurred on 18 September. Spectrograms of the vertical component of the seismic signal recorded at BOO (c) and MPRI (d) in the 1–40 Hz frequency band.
During the flash flood (Fig. 10), seismic amplitudes in all frequency bands did not follow water height at any station or component. The event, lasting only 1–2 h, was much shorter than the Ciarán storm flood (Fig. 3) and insufficient to generate the high turbulence or flow velocities needed to mobilize significant bedload (Gimbert et al., 2014).
At BOO (Fig. 10a–c), daily anthropogenic noise seems dominate noise at 1–15 Hz, showing no evident relation with hydrological data. MPRI displayed similar behaviour but greater sensitivity to wind and rain, correlating best with wind velocity (Fig. 5b–d). The secondary rain peak at MPRI likely reflects a local rainfall event that did not significantly raise river levels. These results indicate that short flash floods in the Tagliamento catchment typically do not reach discharge rates capable of generating detectable river-induced seismic signals at current station distances (0.4–3 km).
Also, the velocity of the rising part of the water height curve (about 2–3 h) and the peak reached during the flash flood event (1.2 m) suggests that longer events and higher water height values are necessary for the seismic signal to be detected at the considered seismic stations, especially farther ones from the riverbed. Otherwise, only rainfall, wind and anthropogenic noise would be mainly registered.
In summary, seismic observations across the Tagliamento catchment reveal that flood-related seismic noise is strongly controlled by river–station distance, event magnitude, and duration. Low-frequency signatures primarily reflect river dynamics. However, the relative contribution of wind and rain at higher frequencies depends on the river–station distance: at proximal sites (e.g., FUSE), seismic noise is dominated by fluvial activity even at higher frequencies, while at more distant stations (e.g., BOO and MPRI), atmospheric sources, like wind and rain, become increasingly significant. The analysed flash flood did not generate detectable river-induced seismic signals. The duration of the rain peaks and, consequently, the range of time concerning significative variation of the water height in the river, could play a leading role in the quantity of water conveyed into the river in Tagliamento River. Also, intense but localised rainfall (18–21 mm 15 min−1) may have generated the flood wave in catchment sections hydrologically disconnected from the most water turbulence reaches (e.g., narrow section of Venzone or Fella River confluence), reducing the seismic amplitude generated by the river within the sensor's field of view. According to the model proposed by Gimbert et al. (2014), the seismic PSD is dependent on water flow height. This is consistent with our findings, as the flash flood that occurred on 19 September 2023 did not reach the water levels observed during Storm Ciaràn, with maximum stages remaining below 1.5 m compared to approximately 3.5 m at MPRI and 4.5 m at BOO during Storm Ciaràn (Fig. 6). Consequently, the seismic signal generated by the river was likely too weak to be clearly detected at the seismic station. This effect, combined with the localized and short-lived nature of the rainfall event, likely prevented the river-induced seismic contribution from emerging above the background seismic noise. Under these conditions, the recorded seismic noise at BOO was dominated by daily anthropogenic sources (1–15 Hz), while at MPRI it is related primarily to the meteorological forcing (wind and rainfall), overlapping and covering the seismic river source. Therefore, the present seismic network is better suited to monitoring longer and more intense flood events.
In the case of Tagliamento river, during flood events a clear relationship between rising river water height in the level gauges and seismic signal amplitude at stations near the riverbed could be appreciated. The present work was focused on FUSE, BOO and MPRI stations during the November 2023 event called Ciarán Storm, which show good correlations with available level gauge data. From the comparison between PSD and water height it is possible to reconstruct the river flow behaviour (and thus have information about river conditions) drawing a hysteresis trend, especially focusing on specific bands of frequencies, that are most correlated with river water height time series (16–20, 17–21 and 2–6 Hz for FUSE, BOO and MPRI stations, respectively). Frequency contribution is station-dependent, as it is influenced by the intensity of the flood event, site response and seismic station-riverbed distance for propagation effects (Tsai et al., 2012; Gimbert et al., 2014). The correlation analysis shows clearly the relationship between the seismic signal recorded at permanent seismic stations and the incoming river flood from upstream if related to river water height, with maximum correlation coefficient at lower frequencies for seismometers farther from the riverbed (BOO and MPRI), and higher frequencies for the closest one (FUSE). In addition, the seismic frequency bands most affected by the river activity in some cases are not similar to the ones identified by previous studies, underlining the importance of the site conditions, catchment morphology and strength of the flood. As mentioned in Sect. 3.5 (Fig. 10), the used seismic stations do not register any significant variation related to the river flash flood events, so the assessments in this work show how only extreme long lasting rainfall events that evolve in river floods produce a clear river seismic response. It is worth noting that previous works exploited data recorded by stations installed specifically for river studies, while we used only permanent seismic stations installed mainly for earthquake monitoring. Unfortunately, seismic sensors are not as close to the river as the cited works. Still, despite the unfavourable distribution, the performed analyses highlighted a clear association between the investigated variables obtaining observations that could help determine river conditions (e.g., water flow, discharge, bedload) during extreme meteorological events.
Also, station proximity to the riverbed seems to be an important factor in detecting seismic waves generated by a flood perturbation within the river, as can be deduced from FUSE polarization results, which is oriented towards the nearest river channel. On the contrary, the BOO and MPRI seismic signals are likely generated by different sections of the Tagliamento River. These were interpreted as originating either from the turbulent flow at the confluence of the Fella and Tagliamento rivers – if considering a northern azimuth – or from downstream reaches instead, where the flood wave is expected to carry abundant sediments and the water course deviates from its straight path, as also observed by other authors (Chmiel et al., 2022).
The analysis carried out in this paper demonstrates that seismic stations not properly installed for river monitoring could be a supportive choice in studying river dynamics during a flood, even if distant from the riverbed (e.g., MPRI). It is worth to note that, during the analysed flash flood occurred on 19 September 2023, the methodology used for this work was not able to clearly identify the same seismic features generated by the river during the Ciaràn Storm, probably due to different characteristics and behaviours between the two events (e.g., different duration of the flood, maximum water height registered). Furthermore, the findings indicate that river monitoring within the Tagliamento catchment could be significantly enhanced by deploying a permanent seismic network in proximity to the riverbanks and tributary confluences. Such a spatial configuration would optimize seismic monitoring performance, as the source–receiver distance critically affects signal attenuation, resolution, and data reliability.
Eventually, the analyses reported in this study provide a conceptual and methodological foundation for future seismic investigations of large Alpine river systems that preserve their natural morphology and limited anthropogenic influence, particularly in upstream reaches. This study was carried out to obtain preliminary insights toward developing an empirical model of the water height on Tagliamento that fits well during floods and forecasts water height using seismic data, after consistent training and validation phase, exploiting also seismic and hydrological data of other events with machine learning algorithms.
Risk information about Ciaran Storm was found on Bulletin of Vigilance of Civil Protection Friuli-Venezia Giulia for 2–3 November 2023 (https://www.meteo.fvg.it/rischi_meteo.php?ln=, last access: October 2024). The rain and wind data are available on the Civil Protection FVG and ARPA FVG website (https://monitor.protezionecivile.fvg.it/; https://www.meteo.fvg.it/archivio.php?ln=&p=dati, last access: October 2024). The seismic data were downloaded with ObsPy library functions exploiting EIDA Orfeus website database as client (https://www.orfeus-eu.org/data/eida/, last access: September 2024). Codes for gaining data and processing them were written in Python language (https://www.python.org/, last access: May 2025), exploiting Obspy for the seismic analyses (https://doi.org/10.5281/zenodo.11093256, The ObsPy Development Team, 2024).
The supplement related to this article is available online at https://doi.org/10.5194/nhess-26-5133-2026-supplement.
Mario Valerio Gangemi, Andrea Cannata, Francesco Panzera and Alfio Marco Borzì planned the analysis; Mario Valerio Gangemi performed investigations and created codes and figures; Mario Valerio Gangemi, Alfio Marco Borzì, Stefano Parolai, Matteo Picozzi, Luca Zini, Flavio Cannavò, Adrien Oth and Julien Barrière provided resources for this work; Stefano Parolai, Julien Barrière, Adrien Oth, Concetto Spampinato, Andrea Cannata, Francesco Panzera and Giulia Barisione supervised the work; Mario Valerio Gangemi prepared the original draft; Francesco Panzera, Andrea Cannata, Stefano Parolai, Flavio Cannavò, Adrien Oth, Julien Barrière and Alfio Marco Borzì reviewed and edited the paper.
The contact author has declared that none of the authors has any competing interests.
Publisher's note: Copernicus Publications remains neutral with regard to jurisdictional claims made in the text, published maps, institutional affiliations, or any other geographical representation in this paper. The authors bear the ultimate responsibility for providing appropriate place names. Views expressed in the text are those of the authors and do not necessarily reflect the views of the publisher.
We would like to acknowledge the “Protezione Civile della Regione Friuli Venezia Giulia”, in particular Dr. Alberto Deana, for the meteorological and level gauges data availability for the analysed period. Also, we would give a special thanks to Istituto Nazionale di Oceanografia e di Geofisica Sperimentale (OGS) for providing access to its seismic network and data, used in this study. Eventually, we would like to thank the reviewers (Prof. Bernard Twaróg and Anonymous Reviewer) for their valuable comments and suggestions, which helped us improve the quality and clarity of the manuscript, and the NHESS editor Vitaly Muravyev for his professional and useful editorial support.
This work is supported by “River dynamics monItoring via EngineeRing and Seismological techniques – RIVERS” project, financed by University of Catania PIAno di inCEntivi per la RIcerca di Ateneo 2024/2026 (PIACERI), fondi di ateneo – Università di Catania (linea Open Access) and was partially supported by the MODERN project (Advanced SeisMic InterferOmetry MethoDs and TechnologiEs for EngineeRiNg Seismology), which is funded by the Italian Ministry of University and Research (MUR) through the Italian Fund for Applied Sciences (FISA). The project is identified by the code FISA-2022-00764 (CUP J93C24000230001). The authors also received funding from the WAVEGUARD – Enhanced monitoring and disaster response to mitigate impacts of extreme meteo-marine events project, funded by the Interreg Italia-Malta Programme (notice 01/2023; project code C1-2.1-28). The author Mario Valerio Gangemi was fully supported by FAIR project funded by PNRR MUR (PE0000013-FAIR).
This paper was edited by Dung Tran and reviewed by Bernard Twaróg and two anonymous referees.
Abi Nader, A., Albaric, J., Steinmann, M., Hibert, C., Malet, J.-P., Sue, C., Fores, B., Marchand, A., Gros, M., Celle, H., Pohl, B., Stefani, V., and Boetsch A.: Machine learning prediction of groundwater heights from passive seismic wavefield, Geophys. J. Int., 234, 1807–1818, https://doi.org/10.1093/gji/ggad160, 2023.
Bakker, M., Gimbert, F., Geay, T., Misset, C., Zanker, S., and Recking, A.: Field application and validation of a seismic bedload transport model, J. Geophys. Res.-Earth Sur., 125, e2019JF005416, https://doi.org/10.1029/2019JF005416, 2020.
Bakker, M., Legout, C., Gimbert, F., Nord, G., Boudevillain, B., and Freche, G: Seismic modelling and observations of rainfall, J. Hydrol., 610, 127812, https://doi.org/10.1016/j.jhydrol.2022.127812, 2022.
Barrière, J., Oth, A., Hostache, R. and Krein, A.: Bed load transport monitoring using seismic observations in a low-gradient rural gravel bed stream, Geophys. Res. Lett., 42, 2294–2301, https://doi.org/10.1002/2015GL063630, 2015a.
Barrière, J., Krein, A., Oth, A., and Schenkluhn, R.: An advanced signal processing technique for 595 deriving grain size information of bedload transport from impact plate vibration measurements, Earth Surf. Process. Landforms., 40, 913–924, https://doi.org/10.1002/esp.3693, 2015b.
Barry, J. J., Buffington, J. M., Goodwin, P., King, J. G., and Emmett, W. W.: Performance of bed-load transport equations relative to geomorphic significance, J. Hydraul. Eng., 134, 601–615, https://doi.org/10.1061/(ASCE)0733-9429(2008)134:5(601), 2008.
Blöschl, G., Gaál, L., Hall, J., Kiss, A., Komma, J., Nester, T., Parajka, J., Perdigão, R. A. P., Plavcová, L., Rogger, M., Salinas, J. L., and Viglione, A.: Increasing river floods: fiction or reality?, WIREs Water, 2, 329–344, https://doi.org/10.1002/wat2.1079, 2015.
Borga, M., Gaume, E., and Norbiato, D.: Hydrological processes and flash flood generation, in: Proceedings of the Congress-International Association for Hydraulic Research (Vol. 32, No. 1), https://www.iahr.org/library/infor?pid=15270 (last access: June 2025), 2007.
Borzì, A. M., Castiglione, F., Gangemi, M. V., Cannata, A., Cavallaro, L., Foti, E., Musumeci, R. E., and Panzera, F.: Exploring the relationship between seismic noise signals and modeled river flow data: A case study from Sicily, Italy, Engineering Geology, 345, 107872, https://doi.org/10.1016/j.enggeo.2024.107872, 2025.
Burtin, A., Bollinger, L., Vergne, J., Cattin, R., and Nábělek, J. L.: Spectral analysis of seismic noise induced by rivers, J. Geophys. Res., 113, B05301, https://doi.org/10.1029/2007JB005034, 2008.
Burtin, A., Vergne, j., Rivera, L., and Dubernet, P.: Location of river-induced seismic signal from noise correlation functions, Geophys. J. Int., 182, 1161–1173, https://doi.org/10.1111/j.1365-246X.2010.04701.x, 2010.
Carulli, G. B.: Carta Geologica del Friuli Venezia Giulia (scala 1:150.000), S.EL.CA., Firenze, https://www.regione.fvg.it/rafvg/cms/RAFVG/ambiente-territorio/geologia/FOGLIA01/ (last access: May 2025), 2006.
Chirici, G., Giannetti, F., Travaglini, D., Nocentini, S., Francini, S., D'Amico, G., Calvo, E., Fasolini, D., Broll, M., Maistrelli, F., and Marchetti, M.: Stima dei danni della tempesta “Vaia” alle foreste in Italia, Forest, 16, 3–9, https://doi.org/10.3832/efor3070-016, 2019.
Chmiel, M., Godano, M., Piantini, M., Brigode, P., Gimbert, F., Bakker, M., Courboulex, F., Ampuero, J.-P., Rivet, D., Sladen, A., Ambrois, D., and Chapuis, M.: Brief communication: Seismological analysis of flood dynamics and hydrologically triggered earthquake swarms associated with Storm Alex, Nat. Hazards Earth Syst. Sci., 22, 1541–1558, https://doi.org/10.5194/nhess-22-1541-2022, 2022.
Civil Protection FVG: Reti di monitoraggio della PCR, https://monitor.protezionecivile.fvg.it/, last access: October 2024.
Dade, W. B. and Friend, P. F.: Grain-size, sediment-transport regime, and channel slope in alluvial rivers, J. Geol., 106, 661–676, https://doi.org/10.1086/516052, 1998.
Díaz, J., Ruíz, M., Crescentini, L., Amoruso, A., and Gallart, J.: Seismic monitoring of an Alpine mountain river, J. Geophys. Res.-Solid Earth, 119, 3276–3289, https://doi.org/10.1002/2014JB010955 , 2014.
Dong, S., Sun, Y., Li, C., Zhang, X., Min, S. and Kim, Y.: Attribution of Extreme Precipitation with Updated Observations and CMIP6 Simulations, J. Climate, 34, 871–881, https://doi.org/10.1175/JCLI-D-19-1017.1, 2021.
Douben, K. J.: Characteristics of river floods and flooding: A global overview, 1985–2003, Irrig. Drain., 55, 9–21, https://doi.org/10.1002/ird.239, 2006.
Gaume, E., Bain, V., Bernardara, P., Newinger, O., Barbuc, M., Bateman, A., Blakovičová, L., Blöschl, G., Borga, M., Dumitrescu, A., Daliakopoulos, I., Garcia, J., Irimescu, A., Kohnova, S., Koutroulis, A., Marchi, L., Matreata, S., Medina, V., Preciso, E., Sempere-Torres, D., Stancalie, G., Szolgay, J., Tsanis, I., Velasco, D., and Viglione, A.: A compilation of data on European flash floods, J. Hydrol., 367, 70–78, https://doi.org/10.1016/j.jhydrol.2008.12.028, 2009.
Gimbert, F., Tsai, V. C., and Lamb, M. P.: A physical model for seismic noise generation by turbulent flow in rivers, J. Geophys. Res.-Earth Surf., 119, 2209–2238, https://doi.org/10.1002/2014JF003201, 2014.
Gimbert, F., Fuller, B. M., Lamb, M. P., Tsai, V. C., and Johnson, J. P. L.: Particle transport mechanics and induced seismic noise in steep flume experiments with accelerometer-embedded tracers, Earth Surf. Process. Landf., 44, 219–241, https://doi.org/10.1002/esp.4495, 2019.
Gonzalez, A., Fontaine, F. R., Barruol, G., Recking, A., Burtin, A., Join, J.-L., Delcher, E., Michon, L., and Gimbert, F.: Seismic signature of a river flooding in La Réunion Island during the tropical cyclone Dumazile (March 2018), J. Appl. Geophys., 215, 105127, https://doi.org/10.1016/j.jappgeo.2023.105127, 2023.
Goodling, P. J., Lekic, V., and Prestegaard, K.: Seismic signature of turbulence during the 2017 Oroville Dam spillway erosion crisis, Earth Surf. Dynam., 6, 351–367, https://doi.org/10.5194/esurf-6-351-2018, 2018.
Gran Castro, J. A. and Ramos De Robles, S. L.: Climate change and flood risk, Environ. Urban., 31, 75–92, https://doi.org/10.1177/0956247819827850, 2019.
Hasselmann, K.: A statistical analysis of the generation of microseisms, Rev. Geophys., 1, 177–210, https://doi.org/10.1029/RG001i002p00177, 1963.
Hauke, J. and Kossowski, T.: Comparison of Pearson's and Spearman's correlation coefficients on the same sets of data, Quaestiones Geographicae, 30, 87, https://doi.org/10.2478/v10117-011-0021-1, 2011.
Heidarzadeh, M., epić, J., and Iwamoto, T.: Long-duration storm surges due to 2023 successive UK storms Ciarán and Domingos, Ocean Modell., 194, 102487, https://doi.org/10.1016/j.ocemod.2024.102487, 2025.
Hirabayashi, Y., Mahendran, R., Koirala, S., Konoshima, L., Yamazaki, D., Watanabe, S., Kim, H., and Kanae, S.: Global flood risk under climate change, Nat. Clim. Change, 3, 816–821, https://doi.org/10.1038/nclimate1911, 2013.
Hsu, L., Finnegan N. J., and Brodsky E. E.: A seismic signature of river bedload transport during storm events, Geophys. Res. Lett., 38, L13407, https://doi.org/10.1029/2011GL047759, 2011.
Hollander, M., Wolfe, D. A., and Chicken, E.: Nonparametric statistical methods, 3rd edn., Wiley, https://doi.org/10.1002/9781119196037, 2014.
Huang, C. J., Yin, H. Y., Chen, C. Y., Yeh, C. H., and Wang, C. L.: Ground vibrations produced by rock motions and debris flows, J. Geophys. Res.-Earth Surf., 112, F02014, https://doi.org/10.1029/2005JF000437, 2007.
Hunter, J. D.: Matplotlib: A 2D graphics environment, Comput. Sci. Eng., 9, 90–95, https://doi.org/10.1109/MCSE.2007.55, 2007.
Hunter, S. C.: Energy absorbed by elastic waves during impact, J. Mech. Phys. Solids, 5, 162–171, https://doi.org/10.1016/0022-5096(57)90002-9, 1957.
Johnson, C. W., Meng, H., Vernon, F., and Ben-Zion, Y.: Characteristics of ground motion generated by wind interaction with trees, structures, and other surface obstacles, J. Geophys. Res.-Solid Earth, 124, 8519–8539, https://doi.org/10.1029/2018JB017151, 2019.
Krischer, L., Megies, T., Barsch, R., Beyreuther, M., Lecocq, T., Caudron, C., and Wassermann, J.: ObsPy: A bridge for seismology into the scientific Python ecosystem, Comput. Sci. Discover., 8, 014003, https://doi.org/10.1088/1749-4699/8/1/014003, 2015.
Kuriqi, A., Kocileri, G., and Ardiclioglu, M.: Potential of Meyer-Peter and Müller approach for estimation of bed-load sediment transport under different hydraulic regimes, Model. Earth Syst. Environ., 5, 1–9, https://doi.org/10.1007/s40808-019-00665-0, 2020.
Longuet-Higgins, M. S.: A theory of the origin of microseisms, Philos. T. Roy. Soc. London A, 243, 1–35, https://doi.org/10.1098/rsta.1950.0012, 1950.
Lott, F. F., Ritter, J. R. R., Al-qaryouti, M., and Corsmeier, U.: On the analysis of wind-induced noise in seismological recordings, Pure Appl. Geophys., 174, 1453–1470, 2017.
Luong, L., Cadol, D., Bilek, S., McLaughlin, J. M., Laronne, J. B., and Turowski, J. M.: Seismic modeling of bedload transport in a gravel-bed alluvial channel, J. Geophys. Res.-Earth Surf., 129, e2024JF007761, https://doi.org/10.1029/2024JF007761, 2024.
Lyon-Caen, H.: Séisme du Frioul (1976): Modèles de source à l'aide de sismogrammes synthétiques d'ondes de volume, Thèse Diplome de Docteur de 3ème cycle, Universitè Paris VII, 1980.
Mao, L.: The effect of hydrographs on bed load transport and bed sediment spatial arrangement, J. Geophys. Res.-Earth Surf., 117, F03024, https://doi.org/10.1029/2012JF002428, 2012.
Monegato, G. and Stefani, C.: Stratigraphy and evolution of a long-lived fluvial system in the southeastern Alps (NE Italy): The Tagliamento Conglomerate, Aust. J. Earth Sci., 103, 33–49, 2010.
Müller, N.: River dynamics and floodplain vegetation and their alterations due to human impact, Archiv für Hydrobiologie Supplement, 101, 477–512, 1995.
OGS: Istituto Nazionale di Oceanografia e di Geofisica Sperimentale. North-East Italy Seismic Network (Data set), FDSN, https://doi.org/10.7914/SN/OX, 2016.
Patricelli, G., Poli, M. E., and Cheloni, D.: Structural Complexity and Seismogenesis: The Role of the Transpressive Structures in the 1976 Friuli Earthquakes (Eastern Southern Alps, NE Italy), Geosciences, 12, 227, https://doi.org/10.3390/geosciences12060227, 2022.
Picozzi, M., Coviello, V., Palo, M., and Adirosi, E.: Seismic signature of an extreme hydrometeorological event, Eng. Geol., 345, 107872, https://doi.org/10.21203/rs.3.rs-3236969/v1, 2023.
Płaczkowska, E., Krzemie, K., Gorczyca, E., Bojarczuk, A., and elazny, M.: Disturbances in coarse bedload transport in a high-mountain stream channel system (Western Tatras, Poland), Geomorphology, 371, 107428, https://doi.org/10.1016/j.geomorph.2020.107428, 2020.
Rawson, K. J. and Tupper, E. C.: Basic ship theory (5th ed., Ch. 9, pp. 302–364), Butterworth-Heinemann, https://doi.org/10.1007/978-3-642-19674-4, 2001.
Rindraharisaona, E. J., Réchou, A., Fontaine, F. R., Barruol, G., Stamenoff, P., Boudevillain, B., Rigaud-Louise, F., and Delcher, E.: Seismic signature of rain and wind inferred from seismic data, Earth Space Sci., 9, e2022EA002328, https://doi.org/10.1029/2022EA002328, 2022.
Roth, D. L., Brodsky, E. E., Finnegan, N. J., Rickenmann, D., Turowski, J. M., and Badoux, A.: Bed load sediment transport inferred from seismic signals near a river, J. Geophys. Res.-Earth Surf., 121, 725–747, https://doi.org/10.1002/2015JF003782, 2016.
Samson, J. C.: The reduction of sample-bias in polarization estimators for multichannel geophysical data with anisotropic noise, Geophys. J. Int., 75, 289–308, https://doi.org/10.1111/j.1365-246X.1983.tb01927.x, 1983.
Sanchez-Sesma, F. J., Weaver, R. L., Kawase, H., Matsushima, S., Luzon, F., and Campillo, M.: Energy partitions among elastic waves for dynamic surface loads in a semi-infinite solid, B. Seismol. Soc. Am., 101, 1704–1709, 2011.
Schick, A. P. and Lekach, J.: High bedload transport rates in relation to stream power: Wadi Mikeimin, Sinai, Catena, 8, 43–47, https://doi.org/10.1016/S0341-8162(81)80003-3, 1981.
Schmandt, B., Aster, R. C., Scherler, D., Tsai, V. C., and Karlstrom, K.: Multiple fluvial processes detected by riverside seismic and infrasound monitoring of a controlled flood in the Grand Canyon, Geophys. Res. Lett., 40, 4858–4863, https://doi.org/10.1002/grl.50953, 2013.
Shearer, P. M.: Introduction to Seismology, 2nd edn., Cambridge University Press, https://doi.org/10.1017/CBO9780511841552, 2009.
Smith, K. and Tape, C.: Seismic noise in central Alaska and influences from rivers, wind, and sedimentary basins, J. Geophys. Res.-Solid Earth, 124, 11678–11704, https://doi.org/10.1029/2019JB017695, 2019.
Sollberger, D.: TwistPy: Toolbox for wavefield inertial sensing techniques (Version 2024), Zenodo, https://doi.org/10.5281/zenodo.8124030, 2024.
Spaliviero, M.: Historic fluvial development of the Alpine-foreland Tagliamento River, Italy, and consequences for floodplain management, Geomorphology, 52, 317–333, https://doi.org/10.1016/S0169-555X(02)00264-7, 2003.
The Independent: South of England and Channel Islands bear brunt of Storm Ciaran, https://www.independent.co.uk/news/uk/environment-agency (last access: April 2025), 2 November 2023.
The ObsPy Development Team: ObsPy 1.4.1 (Version 1.4.1), Zenodo [computer software], https://doi.org/10.5281/zenodo.11093256, 2024.
Tockner, K., Ward, J. V., Arscott, D. B., Edwards, P. J., Kollmann, J., Gurnell, A. M., Petts, G. E., and Maiolini, B.: The Tagliamento River: A model ecosystem of European importance, Aquat. Sci., 65, 239–253, https://doi.org/10.1007/s00027-003-0699-9, 2003.
Tsai, V. C., Minchew, B., Lamb, M. P., and Ampuero, J.-P.: A physical model for seismic noise generation from sediment transport in rivers, Geophys. Res. Lett., 39, L02404, https://doi.org/10.1029/2011GL050255, 2012.
Venturini, C.: Il conglomerato di Osoppo. Gortania: Atti del Museo Friulano di Storia Naturale, 13, 31–49, 1992.
Vidale, J. E.: Complex polarization analysis of particle motion, B. Seismol. Soc. Am., 76, 1393–1405, https://earthweb.ess.washington.edu/vidale/John_Vidale/Pubs_83-99_files/1986_Vidale.pdf (last access: October 2024), 1986.
Virtanen, P., Gommers, R., Oliphant, T. E., Haberland, M., Reddy, T., Cournapeau, D., Burovski, E., Peterson, P., Weckesser, W., Bright, J., van der Walt, S. J., Brett, M., Wilson, J., Millman, K. J., Mayorov, N., Nelson, A. R. J., Jones, E., Kern, R., Larson, E., Carey, C. J., Polat, ., Feng, Y., Moore, E. W., VanderPlas, J., Laxalde, D., Perktold, J., Cimrman, R., Henriksen, I., Quintero, E. A., Harris, C. R., Archibald, A. M., Ribeiro, A. H., Pedregosa, F., van Mulbregt, P., and SciPy 1.0 Contributors: SciPy 1.0: Fundamental Algorithms for Scientific Computing in Python, Nat. Methods, 17, 261–272, https://doi.org/10.1038/s41592-019-0686-2, 2020.
Volonté, A. and Riboldi, J.: The origins of Storm Ciarán: From diabatic Rossby wave to warm-seclusion cyclone with a sting jet, Weather, 79, 390–396, https://doi.org/10.1002/wea.7632, 2024.
Ward, J. V., Tockner, K., Edwards, P. J., Kollmann, J., Bretschko, G., Gurnell, A. M., Petts, G. E., and Rossaro, B. A: reference river system for the Alps: The “Fiume Tagliamento”, Regul. Rivers, 15, 63–75, https://doi.org/10.1002/(SICI)1099-1646(199901/06)15:1/3<63::AID-RRR538>3.0.CO;2-F, 1999.
Withers, M. M., Aster, R. C., Young, C. J., and Chael, E. P.: High-frequency analysis of seismic background noise as a function of wind speed and shallow depth, B. Seismol. Soc. Am., 86, 1507–1515, 1996.