
the Creative Commons Attribution 4.0 License.
the Creative Commons Attribution 4.0 License.
 | 13 Oct 2026
Multiscalar and nonlinear controls of drought impacts in Spain revealed by media-reported data

Fernando Domínguez-Castro
Santiago Beguería
Javier Vela-Tambo
Amar Halifa-Marín
Maria Adell-Michavila
Alex Crespillo
Borja Latorre
Magí Franquesa
Sergio M. Vicente-Serrano
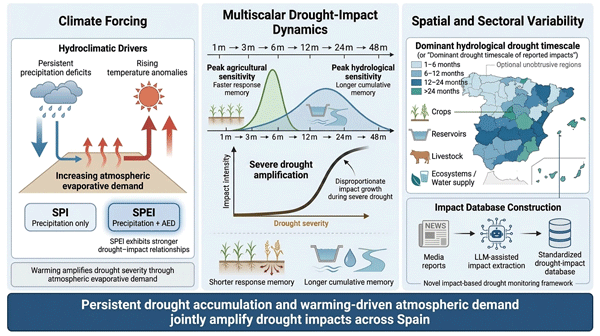
This study assesses the multiscalar and nonlinear relationships between drought severity, characterized by the Standardized Precipitation Index (SPI) and the Standardized Precipitation Evapotranspiration Index (SPEI), and media-reported hydrological and agricultural impacts across Spain during 1976–2023. Drought indices were derived from a high-resolution gridded climate dataset (1.1 km), while impact data were obtained from standardized monthly frequencies of drought-related newspaper articles at the provincial scale. Results demonstrate robust temporal coherence between drought conditions and impacts, with major drought episodes associated with anomalies exceeding +1 to +2 standard deviations. Drought–impact relationships strengthen markedly with accumulation timescale, reaching maximum correlations at 12–30 months (–0.8), while short timescales (1–3 months) show weak associations (). Hydrological impacts are primarily associated with accumulated medium- and long-term moisture deficits (12–48 months), whereas agricultural impacts are associated with shorter accumulation timescales (3–12 months). However, for both sectors, dominant accumulation timescales lengthen as drought severity increases. Sensitivity analyses reveal pronounced nonlinear responses, with the frequency of media reports on impacts increasing disproportionately during severe drought conditions with a peak at 12–36 months. The consistently stronger association of SPEI relative to SPI, especially for agricultural impacts, suggests a dominant contribution of atmospheric evaporative demand. Our results indicate that the frequency of media reports on impacts is associated with accumulated moisture deficits and temperature-dependent processes across timescales and provide a framework for improved impact-based drought monitoring in a warming climate.
- Article
(5284 KB) - Full-text XML
-
Supplement
(1453 KB) - BibTeX
- EndNote


Drought is a complex and cyclical natural hazard that can lead to severe impacts on ecosystems, water resources, agriculture and economies (Vicente-Serrano, 2016; Slette et al., 2019; United Nations Office for Disaster Risk Reduction, 2019; El Kenawy et al., 2026). Unlike rapidly developing hazards, drought evolves gradually over months to years and thus detection and assessment of drought impacts are more difficult (Vicente-Serrano, 2016). Climate change has led to severe droughts and their consequences for the world's population (Spinoni et al., 2021; Runde et al., 2022; Wang and Sun, 2023). Increased temperature and atmospheric evaporative demand have been reported to be linked with increased frequency, severity and duration of droughts in Southern Europe (Vicente-Serrano et al., 2014; Stagge et al., 2017).
To monitor and characterize drought severity, researchers use drought indices, which provide objective measures across meteorological, agricultural, and hydrological domains (Keyantash, 2021). The relationship between most drought indices and their actual impacts can be nonlinear, even though they are highly correlated (Bachmair et al., 2015; Kchouk et al., 2022). The magnitude and nature of drought impacts are largely influenced by local environmental and socioeconomic conditions (Kamali et al., 2019; Wijitkosum, 2025). These impacts are diverse, including hydrological impacts such as reduced river flows, reservoir depletion, and groundwater decline, as well as agricultural impacts such as crop failure, livestock losses, and food insecurity (Vicente-Serrano et al., 2021; Walker et al., 2024).
Hydrological impacts are primarily controlled by accumulated precipitation deficits, driven by mechanisms including soil moisture depletion, reduced groundwater recharge and reduced reservoir storage (Melo et al., 2016; Alvarez-Garreton et al., 2021; Liu et al., 2024). Thus, hydrological impacts are largely the cumulative effects of a prolonged deficit of moisture. Hydrological systems primarily respond to medium- and long-term drought conditions and therefore exhibit delayed yet persistent responses (Van Loon et al., 2024). Agricultural impacts are more closely associated with short- to medium-term droughts because soil moisture and atmospheric water demand respond rapidly during the growing season (Kimm et al., 2020; Rigden et al., 2020). These sectoral differences highlight the importance of the drought accumulation timescale for the link between climate anomalies and impacts. Warm conditions can intensify water stress through increased atmospheric evaporative demand, leading to larger differences between precipitation-based and temperature-sensitive drought indicators (Vicente-Serrano et al., 2014; Tomas-Burguera et al., 2020; Ji et al., 2026). Similar drought conditions do not necessarily produce similar impacts depending on regional vulnerability, adaptive capacity and land and water management protocols (Welsh et al., 2013; Engström et al., 2020; Van Schmidt et al., 2023). Together, these controls introduce nonlinear behaviour into drought-impact relationships and may induce disproportionate effects in the event of severe or extended droughts.
Media coverage plays an important role in shaping the societal interpretation of drought impacts. Newspaper articles provide information on the timing, location, and sectoral manifestation of drought impacts (Bachmair et al., 2016; Murphy et al., 2017; Wang et al., 2020; O'Connor et al., 2023; Jobbová et al., 2024), which allows us to understand physical conditions and social responses. They are often used for reconstruction of past droughts and interpretation of human behaviour in relation to climate change (Brázdil et al., 2018; Nash et al., 2019). Drought indices in Europe and the Mediterranean are highly correlated with reported impacts (e.g., in agriculture and water supply systems) (e.g., Stahl et al., 2016; Blauhut et al., 2016; Shyrokaya et al., 2024). Such media reports have been key to documenting regional drought dynamics and public perceptions in Spain (Llasat et al., 2009; Ruiz Sinoga and León Gross, 2013; Serrano-Acebedo et al., 2026).
Recent advances in natural language processing and machine learning have enabled the development of long-term multi-sectoral datasets (Dayrell et al., 2022) for systematic extraction of drought impact information from a large text corpus. However, substantial uncertainty remains regarding how drought–impact relationships vary across accumulation timescales, the role of atmospheric evaporative demand in shaping those relationships, and how impact-reporting sensitivity changes with increasing drought severity. These gaps are particularly relevant for Spain, a region with amplified hydroclimatic gradients, high interannual variability and high sensitivity to both precipitation deficits and drought intensification driven by temperature (Domínguez-Castro et al., 2019; Vicente-Serrano et al., 2020; Noguera et al., 2021). Despite extensive use of drought indices, the spatial organization of drought impacts and the dominant timescales controlling hydrological and agricultural responses remain poorly constrained. Addressing these challenges is critical for improving impact-based drought monitoring and early warning systems, which increasingly require information on when, where, and how impacts occur. Spain provides an ideal case study due to its climatic heterogeneity and recurrent exposure to drought.
The aim of this study is to quantify the multiscalar relationship between drought severity (SPI and SPEI) and media-reported hydrological and agricultural impacts across Spain (1976–2023). Specifically, we (1) assess the temporal coherence and timescale dependence of drought–impact relationships, (2) evaluate the role of atmospheric evaporative demand (SPEI vs. SPI) and the nonlinear sensitivity of impact reporting to drought severity, and (3) identify the dominant timescales and spatial patterns associated with impact-reporting responses across sectors. The results provide new insights into the temporal, nonlinear, and spatial dynamics of drought-impact reporting and contribute to advancing impact-based drought monitoring under changing climatic conditions.
2.1 Drought impact data
Drought impact information was extracted from El País, the general-interest newspaper with the largest circulation in Spain. All articles published from its foundation on 11 May 1976 to 31 December 2023 were analysed. Articles were initially pre-filtered for drought relevance using a supervised classifier based on a fine-tuned Longformer model within the SeqIA framework (López-Otal et al., 2025). This binary classifier identified 15 102 drought-relevant news articles over the study period.
Drought impact extraction from these articles was conducted using a schema-guided Generative Information Extraction (GenIE) approach implemented within the CienaLLM framework (https://github.com/lcsc/ciena_llm/, last access: 4 February 2025). This method enables the extraction of structured information from unstructured text by prompting a large language model (LLM) to generate outputs (e.g., in JSON format) based on a predefined schema specifying the target information.
The first schema incorporated the four most common drought-impact categories in Spain: crops (e.g., reduction in yield of crops, crop failure, planting delays), livestock (e.g., reduced productivity, feed shortage, increased mortality), hydrological resources (e.g., reduced river discharge, reservoir depletion, decline in groundwater level) and energy (e.g., reductions in hydropower generation). We did the extraction locally using the gemma2:9b model, aiming to balance computational cost and extraction performance. The extraction resulted in 6852 articles reporting crop-related impacts and 1268 articles reporting livestock-related impacts. These were eventually combined into one category of agricultural impacts comprising 7009 articles. Hydrological resources (6408 articles) and energy (1106 articles) were merged into a broader category of hydrological impacts. These aggregations were introduced to reduce data sparsity and support consistent province-by-timescale comparisons at a broad sectoral level. They represent operational groupings rather than an assumption that all constituent impacts share identical mechanisms or response timescales. The resulting sector-level patterns should therefore be interpreted as broad reporting signals.
Temporal attribution was based on the publication date of each article. Specifically, an article contributed to the calendar month in which it was published; temporal expressions within the article text were not used to back-date an impact to an inferred occurrence month. The monthly series (1976–2023) therefore represent the timing of media reporting, which may differ from the timing of impact onset because of delays between impact occurrence, recognition, and publication.
Repeated coverage was intentionally retained at the article level. No event-level de-duplication was applied across consecutive articles or months, so multiple reports of an ongoing condition (for example, persistently low reservoir levels) contribute multiple observations. Consequently, the resulting monthly series quantify reporting intensity or societal salience rather than the number of unique drought-impact events.
Province extraction was performed separately from impact extraction to identify the Spanish provinces referenced in drought-related articles and affected by drought. Because impact labels and province labels were extracted independently, the workflow did not establish sentence-level one-to-one links between a particular impact and a particular province when an article contained multiple impacts and multiple locations. Such articles can therefore contribute to more than one province–sector combination, and province-level results should be interpreted as spatial patterns of drought-related reporting rather than perfectly resolved geocoded impact events. The province names were standardized by mapping the different model outputs to the official names, reconciling spelling differences between co-official languages, and manually assigning frequently mentioned municipalities or geographical features to their corresponding provinces. The final dataset is a monthly count of articles referring to each impact category (agriculture and hydrology) in each province. Monthly impact-reporting frequencies were quantified as the number of drought-related articles published for each province and impact category. Article publication month was used for temporal attribution, and repeated reporting of persistent impacts was retained; consequently, the response variable represents reporting intensity and societal visibility rather than a count of unique impact events or a direct measure of physical damage magnitude. The extraction was multi-label rather than mutually exclusive. Therefore, a single article could contribute to more than one impact category when it reported multiple drought consequences, such as crop losses together with reservoir depletion or water-use restrictions. The agricultural and hydrological series should therefore be interpreted as sector-specific monthly reporting frequencies, not as disjoint sets of articles. To assess the possible influence of co-reporting, we quantified the article-level overlap between the two broad sectors and considered this overlap when interpreting the relationship between agricultural- and hydrological-impact reporting series.
2.2 Drought quantification
To compute drought indices, this study used a high-resolution gridded drought-index dataset developed by Vicente-Serrano et al. (2017a) with SPI and SPEI information for the whole of Spain at a resolution of 1.1 km. SPI and SPEI, which are based on precipitation and on the difference between precipitation and atmospheric evaporative demand, respectively, have been widely used in agricultural, ecological and socioeconomic studies (e.g., Bachmair et al., 2015; Barker et al., 2016; El Kenawy et al., 2016, 2026; Peña-Gallardo et al., 2019; Vicente-Serrano et al., 2010). The monthly SPI and SPEI series were computed for the 48 provinces, including 47 mainland provinces and the Balearic Islands, for the spatially consistent analysis, along with overall national SPI and SPEI series. The SPI and SPEI were computed for accumulation periods from 1 to 48 months. While SPI is useful for its simplicity and availability of data (McKee et al., 1993), it does not take into account atmospheric demand and may underestimate the intensity of drought during warm periods, which is considered by the SPEI (Tomas-Burguera et al., 2020). The joint use of SPI and SPEI therefore offers a complete characterization of the drought severity and variability over Spain for the analysed period (1976–2023), useful for both climatological assessments and impact attribution.
2.3 Relating drought to impact data
To allow a robust comparison of the temporal dynamics of drought indices (SPI and SPEI) and the count of media reports on drought impacts, we standardized the time series of the monthly count of drought-related news across the provinces of Spain for the period 1976–2023. The dataset includes information on hydrological and agricultural drought impacts reported in newspapers. Because the raw data have a substantial number of zeros in months with no identified impact reporting, a statistical transformation was needed to normalize the distribution of the data and to make it comparable to standardized drought indices. We applied the method proposed by Vicente-Serrano et al. (2025), which applies a non-parametric empirical standardization technique for non-climatic impact indicators (e.g., media-based records) that may not satisfy normality or distribution assumptions. Specifically, it deals with important issues of discrete and zero-inflated time series and provides a flexible yet rigorous framework to convert monthly reporting counts into standardized values. This approach preserves the ordinal structure of the original series while accommodating repeated values and months without drought reports. This yields a standardized reporting index directly comparable to SPI and SPEI, with negative values indicating below-average reporting counts (i.e., little or no reported drought activity) and positive values indicating above-average reporting counts, with increasing magnitude indicating increasing reporting counts or visibility of drought conditions. This transformation placed all provincial time series on a common scale (mean = 0, standard deviation = 1), facilitating comparison among provinces and with SPI/SPEI. However, standardization does not remove possible long-term changes in newspaper production, editorial priorities, digital publication practices, or drought newsworthiness. These sources of non-climatic temporal variation are therefore treated as limitations of the media-derived record rather than assumed to have been eliminated by standardization. The analysis was contemporaneous: impact reporting in month t was compared with SPI or SPEI whose accumulation period ended in the same month t. Thus, the analysis evaluates climatic accumulation windows associated with reporting rather than explicit temporal lags between drought conditions and subsequent impacts or reporting.
2.4 Spatial regionalization of drought-impact reporting data
To reduce dimensionality and identify dominant spatiotemporal patterns in drought-related impact reporting, we applied Principal Component Analysis (PCA) to the standardized monthly drought-impact reporting time series. PCA was conducted separately for hydrological- and agricultural-impact reporting. In each sector-specific analysis, the input matrix consisted of monthly observations from 1976–2023 as rows (n=572) and Spanish provinces as columns (n=48). Therefore, the covariance matrix represented covariation among provincial impact-reporting time series within a given sector. SPI and SPEI were analysed subsequently in the drought–reporting correlation and sensitivity analyses. The PCA was used only to identify the dominant spatial modes of impact-reporting variability and the provinces contributing most strongly to those modes. Spatial patterns were used to visualize the loadings to recognize regions with similar behaviour of drought-impact reporting. We examined the temporal evolution (scores) of each principal component to illustrate the dominant temporal mode of variability among provinces.
2.5 Drought–reporting sensitivity coefficient
To quantify how media reporting varies with drought magnitude, we calculated a drought–reporting sensitivity coefficient (β) from a log–log relationship between drought magnitude and monthly media-reporting counts. This coefficient provides a scale-independent measure of the elasticity of reporting intensity with respect to drought magnitude across sectors, provinces, drought-severity classes, and accumulation timescales.
For the sensitivity analysis, only months with dry index values (SPI or SPEI < 0) were retained, and the drought index was sign-reversed so that larger positive values represent greater drought magnitude ( or −SPEIt). This means that the magnitude of drought was represented by the absolute value of the drought index (López-Moreno et al., 2013; Barker et al., 2016; Conradt et al., 2023). Unlike the standardized impact series used for the temporal comparison, correlation analysis, and PCA, the response variable in the log–log regression was the unstandardized monthly article count for the corresponding province and sector. Thus, It denotes the number of media reports in month t. Because ln(0) is undefined, months with It=0 were excluded from this specific regression step; months with positive article counts were transformed as ln(It), and drought magnitude was transformed as ln(Dt).
To complement this conditional log–log analysis and explicitly account for zero-report months, we also modelled the occurrence of drought-impact reporting using all dry months (SPI < 0 or SPEI < 0), including months with zero reports (i.e., no identified impact article). For each province, drought index, and accumulation timescale, reporting occurrence was represented as a binary response (; ) and related to positive drought magnitude ( or −SPEIt) using logistic regression. The coefficient γ, its 95 % confidence interval, and the corresponding odds ratio exp(γ) were used to quantify the change in the probability of any reporting with increasing drought magnitude. This occurrence model complements, rather than replaces, the log–log elasticity coefficient β, which quantifies reporting intensity conditional on positive reporting.
To examine whether the reporting–drought association changes across drought severity, monthly observations were stratified by the sign-reversed drought index into normal dry conditions (), mild (), moderate (), severe (), and extreme (Dt>1.65) drought, together with a category containing all dry conditions (Dt>0) (Agnew, 2000). Regressions were fitted separately within each class. This stratification is intended to reveal broad changes in reporting sensitivity across severity ranges, but the width of the predictor range and the number of observations differ among classes. In particular, severe and extreme classes are likely to include relatively few observations, so isolated class-specific slopes may be unstable. As such, the number of observations supporting each regression, as well as the resulting sample-size distributions, was quantified across provinces, accumulation timescales, drought indicators, sectors, and severity classes.
To evaluate the statistical precision of the severity-specific sensitivity estimates, we complemented the sample-size assessment with direct uncertainty diagnostics for β. For each province–index–timescale regression, we calculated the standard error and 95 % confidence interval of β. Across provinces, uncertainty was summarized using the interprovincial distribution of β, the percentage of regressions whose 95 % confidence intervals excluded zero, and the median 95 % confidence-interval width. These diagnostics distinguish the amount of sample support from the precision with which the regression slope is estimated. Overall, for each province, the ordinary least squares (OLS) estimator for β was computed as follows:
where It represents the monthly media-reporting count in month t, and Dt is the sign-reversed drought index in month t. Under the log–log formulation, the coefficient β quantifies the relative response of reporting frequency to changes in drought magnitude, indicating the proportional change in reporting intensity associated with a proportional change in drought magnitude (e.g., a 1 % increase in drought magnitude is associated with an approximate β % change in reporting intensity). This statistic provides a dimensionless measure of drought-reporting sensitivity. As a result, comparisons can be made across sectors (hydrological vs. agricultural), provinces, and timescales (1–48 months). This enables a multiscalar assessment of drought–reporting relationships. Moreover, this framework enables the identification of the timescales, as well as provinces, at which drought conditions show the strongest association with reporting. For each sector, sensitivity coefficients were first estimated at the provincial level and then aggregated to the national scale by computing the arithmetic mean across provinces.
Importantly, prior to inferential interpretation of the correlation and regression analyses, temporal autocorrelation was evaluated for the drought-index and impact-reporting series. Serial dependence was assessed using the autocorrelation function (ACF), and autocorrelation of the regression residuals was additionally examined to verify that temporal dependence did not materially invalidate the statistical inference from the fitted models. To evaluate the role of atmospheric evaporative demand in drought severity and subsequent impact reporting, sensitivity coefficients were calculated independently using SPI and SPEI. Differences between SPI- and SPEI-based coefficients (i.e., SPI–SPEI) were used to assess the contribution of temperature-driven processes to drought-reporting responses. Negative differences between sensitivity coefficients (i.e., SPEI > SPI) indicate a stronger influence of atmospheric evaporative demand, whereas positive values (i.e., SPI > SPEI) suggest precipitation-dominated responses.
Regional patterns of reporting response were determined by analysing the spatial distribution of drought-reporting sensitivity at the province level. In addition, the dominant accumulation timescale was defined as the timescale for which the sensitivity coefficient was the maximum in the range 1–48 months for each province and drought severity class. All drought indices were aligned with media reporting in the same month; therefore, the identified accumulation timescale represents the climatic integration window most strongly associated with reporting at time t, rather than drought-event duration or an explicit impact-response lag. In cases where multiple timescales exhibited similar values, the smallest timescale among the maxima was selected to ensure consistency.
Throughout this section, the terms hydrological and agricultural impacts are used as shorthand for the corresponding media-derived impact-reporting series. Accordingly, reported sensitivities, spatial patterns, and dominant timescales refer to variation in the frequency and intensity of reporting on these impacts, rather than direct changes in physical impact magnitude or the number of unique impact events.
3.1 Drought impact reporting tracks climate variability across timescales
Figure 1 depicts the temporal evolution of standardized drought indices (SPI-12 and SPEI-12) and media-reported drought impacts in Spain from 1976 to 2023. Hydrological reporting closely tracks multi-year drought variability, with major peaks in drought-impact reporting occurring in the early 1980s, mid-1990s, early 2000s and early 2010s associated with significant positive anomalies. In contrast, wet periods are associated with negative anomalies (), indicating a decrease in or absence of impact reporting. Although both sectors exhibit coherent variability, important sectoral differences emerge. Negative SPEI anomalies have become more frequent than SPI anomalies in recent decades (after 2000) and are more consistent with variability in reporting. However, some inconsistencies are observed, such as the finding that the effects of mild-to-moderate drought conditions (−0.5 to −1) are not always significant, indicating nonlinear and context-dependent responses. The strong relationship between agricultural- and hydrological-impact reporting series (r=0.89, Fig. 1c) should be interpreted with caution because the impact categories are not mutually exclusive at the article level. Some articles report multiple drought consequences simultaneously and therefore contribute to both sectoral series. Accordingly, Fig. 1c reflects both genuine temporal co-occurrence of sectoral impacts during major drought episodes and partial co-reporting within the same media articles. We therefore interpret this relationship as coherent cross-sector drought reporting and impact co-occurrence, rather than as fully independent evidence of causal propagation between sectors.
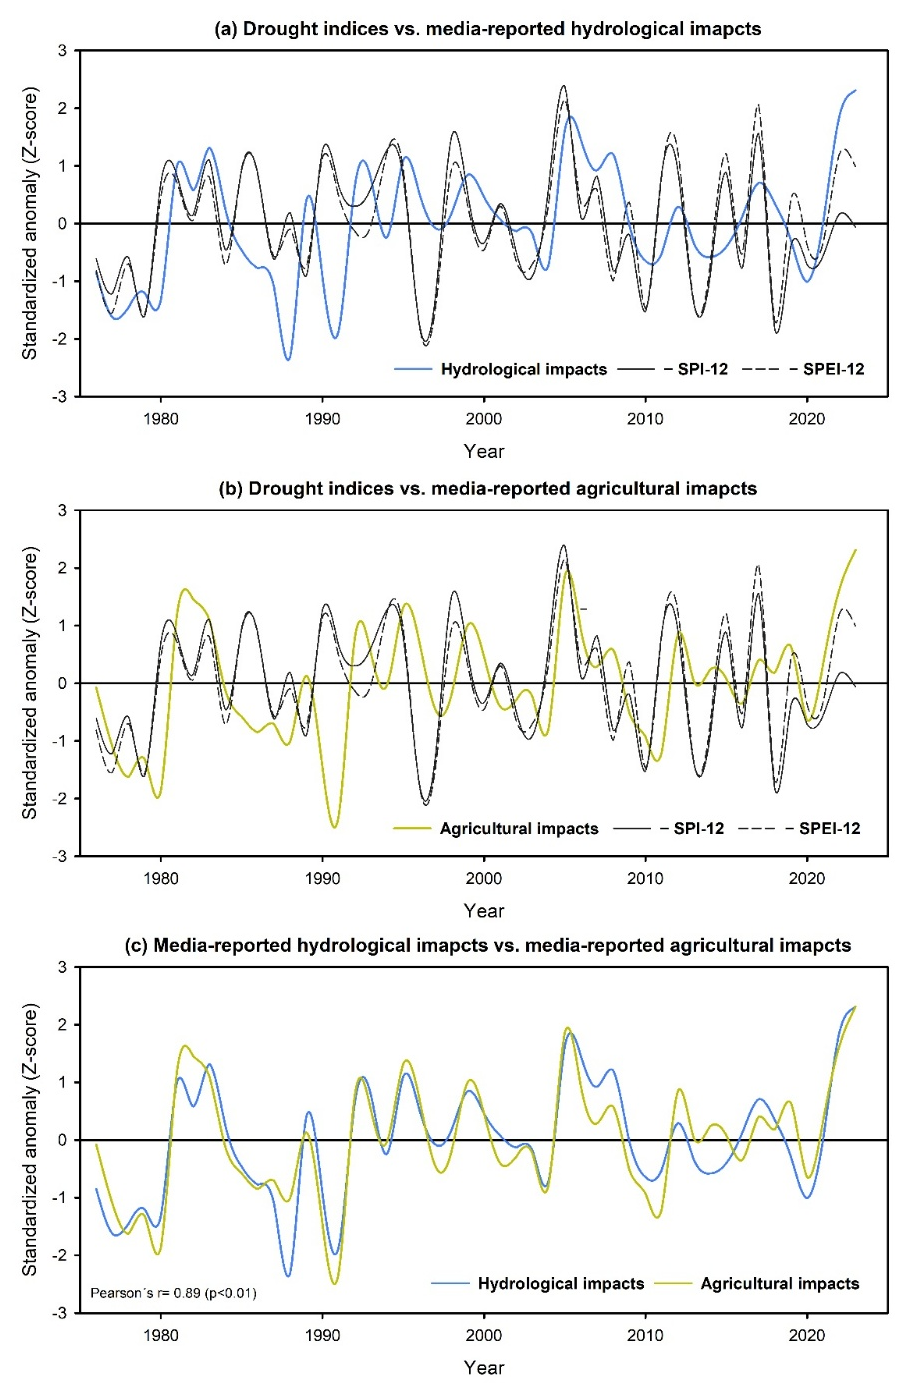
Figure 1Temporal evolution of standardized drought indices and media-reported drought impacts in Spain over the period 1976–2023. (a) Hydrological-impact reporting and (b) agricultural-impact reporting are compared with SPI-12 and SPEI-12, while (c) illustrates the relationship between hydrological-impact reporting and agricultural-impact reporting. All series are expressed as standardized anomalies (Z-scores). In panels (a) and (b), drought indices were sign-reversed (multiplied by −1) to facilitate direct comparisons with drought-impact reporting (i.e., drought severity ↑, impact reporting ↑).
The relationship between drought indices and impact reporting across accumulation timescales (1–48 months) over Spain is summarized in Fig. 2. Consistent negative correlations indicate that drier conditions correspond to increased impact reporting. Correlations increase significantly with increasing timescale, reaching maximum values at 12–30 months for both sectors (–0.8), while short timescales (1–3 months) indicate weak and inconsistent relationships (). These relationships are further modulated by seasonal variability, with higher correlations during summer and early autumn when water demand and agricultural sensitivity peak. Hydrological-impact reporting has the highest correlations at longer timescales (12–32 months), whereas agricultural-impact reporting responds mainly over a slightly broader range, especially in late spring and early summer. SPEI has slightly stronger correlations than SPI across most conditions and especially for agriculture. The results indicate that impact-reporting frequency is more strongly associated with persistent moisture deficits than with short-term anomalies.
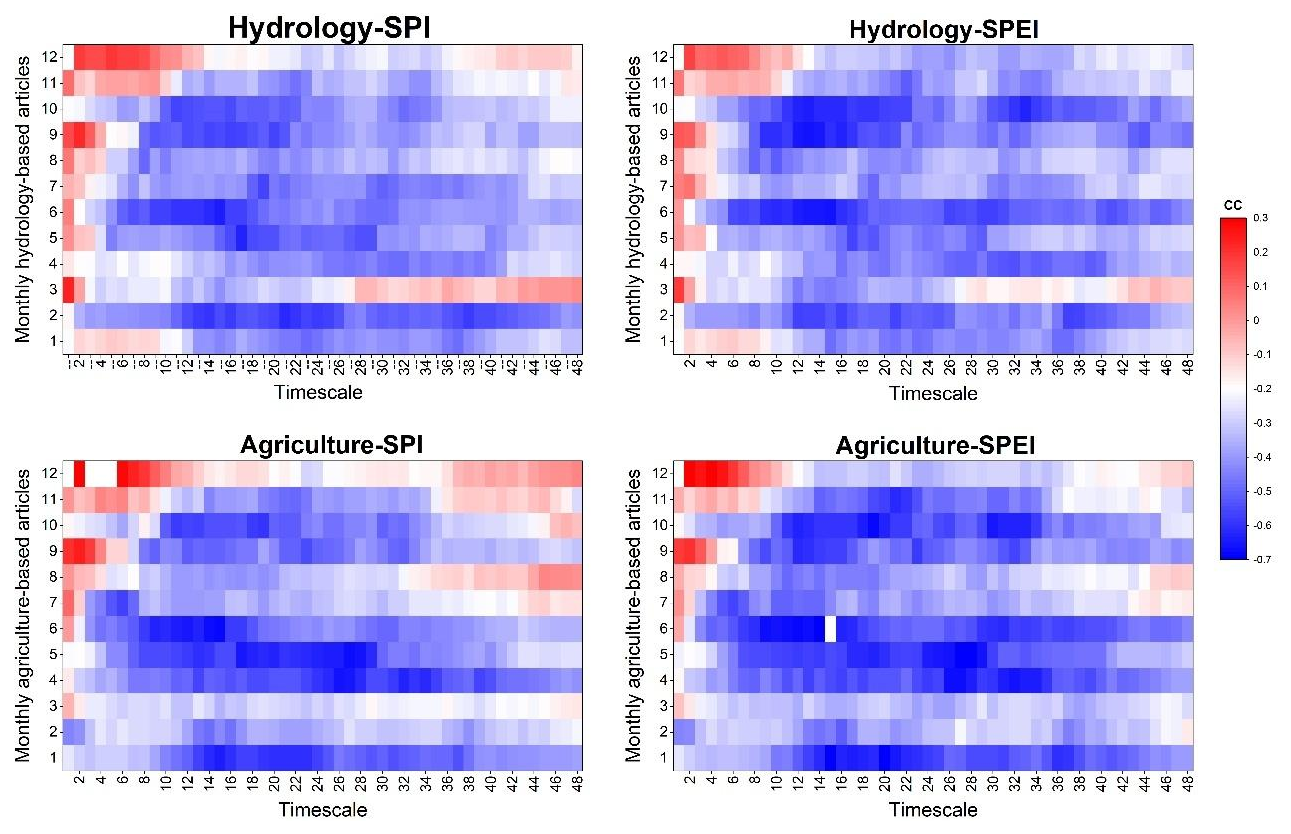
Figure 2Correlation matrix (Pearson coefficient; CC) between standardized monthly frequencies of newspaper reports on drought impacts and drought indices (SPI and SPEI) computed at accumulation timescales from 1 to 48 months. Absolute values of CC exceeding 0.28 are statistically significant at p<0.05.
3.2 Mechanisms and nonlinear sensitivity of drought–reporting relationships
Figure 3 illustrates the drought–reporting sensitivity coefficient of media-reporting frequency to drought severity across accumulation timescales. Reporting sensitivity varies markedly with timescale and drought intensity, and the strongest response coefficient is found at 12–24 months. The sensitivity coefficient values are consistently larger for SPEI compared to SPI, especially for hydrological-impact reporting, indicating that temperature-driven processes are associated with stronger reporting responses. While the sensitivity coefficient for hydrological-impact reporting indicates smoother, more gradual increases, agricultural reporting displays higher and more variable sensitivity, which may reflect more rapid changes in agricultural-impact reporting in response to soil moisture deficits. At short timescales (1–3 months), the sensitivity coefficient is low, confirming the limited role of short-term anomalies. These findings highlight the nonlinear response of the frequency of media reports on impacts to drought severity and the dominant role of sustained moisture deficits.
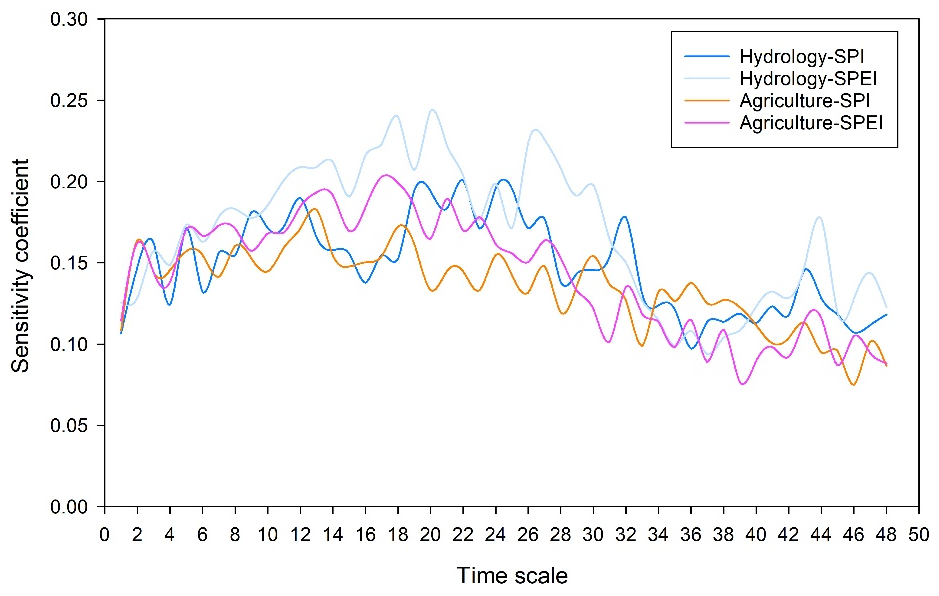
Figure 3Drought–reporting sensitivity coefficient response curves linking drought indices (SPI and SPEI) with media-reporting frequencies for hydrological- and agricultural-impact reporting across accumulation timescales from 1 to 48 months. Lines represent mean drought–reporting sensitivity coefficient values averaged across Spanish provinces for each sector–index combination.
Because stratification by drought-severity class reduces both sample size and predictor range, we evaluated the support and statistical precision of the sensitivity estimates using complementary diagnostics (Figs. S1–S4 in the Supplement). Sample sizes decline from normal and moderate toward severe and extreme drought, particularly at the longest accumulation periods, although severe and extreme regressions retain observations across the full 1–48-month range and median sample sizes generally remain around or above 10 observations across most timescales (Supplement Figs. S1–S3). However, sample size alone does not ensure precise slope estimation. Direct uncertainty diagnostics show substantial interprovincial variability in β, a generally modest proportion of province-level regressions whose 95 % confidence intervals exclude zero, and broader confidence intervals under severe and extreme drought conditions (Supplement Fig. S4). These results indicate that the broad timescale-dependent response is more robust at the aggregated national scale than for individual province–timescale coefficients, which should therefore be interpreted cautiously.
To further evaluate the sensitivity-analysis assumptions, we complemented the conditional log–log analysis with a zero-inclusive occurrence model that retains months with no reported impacts (Supplement Fig. S5). This analysis separates the probability that reporting occurs at all from the reporting intensity conditional on positive reporting, represented by β. The zero-inclusive results show that greater drought magnitude is generally associated with higher odds of reporting, while the strength of this occurrence response varies across accumulation timescales. The strongest and most spatially coherent occurrence responses are generally concentrated at short-to-intermediate timescales, particularly for SPEI, with a substantial proportion of province-level logistic coefficients showing 95 % confidence intervals that exclude zero over these ranges.
Results suggest that reporting sensitivity is dependent on accumulation timescale (Fig. 4), with the highest sensitivity at 12–36 months. Differences between SPEI- and SPI-based responses are negligible at short timescales (1–3 months), but increase with increasing timescales, with consistently stronger responses from SPEI, particularly for moderate to severe droughts. Results reveal some sectoral differences. Specifically, for hydrological-impact reporting, negative differences emerge primarily at medium-to-long timescales (12–36 months). In contrast, agricultural-impact reporting shows earlier divergence, with amplified negative differences already at short-to-intermediate timescales (6–24 months), indicating higher sensitivity to atmospheric demand.
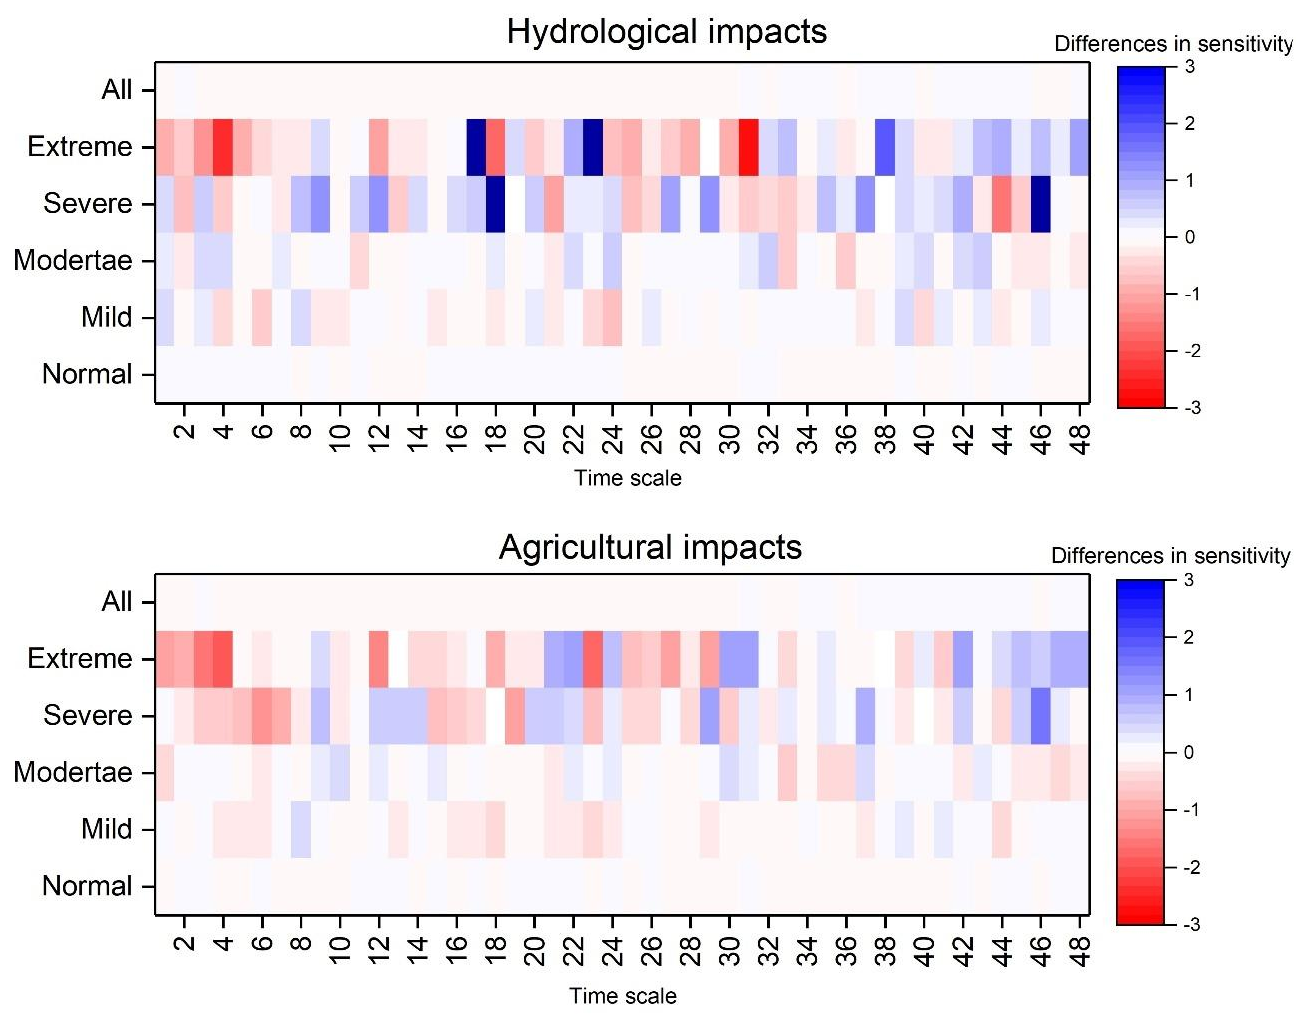
Figure 4Differences in national-scale mean drought-reporting responses between SPI and SPEI across accumulation timescales (1–48 months). Differences between SPI and SPEI responses indicate the contribution of temperature-driven evaporative demand across drought severity classes.
Figure 5 reveals clear spatial heterogeneity in drought-reporting sensitivity. SPEI-dominated responses prevail over large areas, especially at longer timescales (12–36 months), indicating that atmospheric evaporative demand is associated with stronger drought-reporting responses. This association is especially evident for agricultural-impact reporting, whereas hydrological-impact reporting exhibits greater spatial coherence at longer accumulation periods. At shorter timescales (3–6 months), differences are weaker and more fragmented, consistent with a greater role of precipitation variability. Collectively, these results indicate a transition from precipitation-dominated to increasingly temperature-influenced drought-reporting responses at longer accumulation timescales.
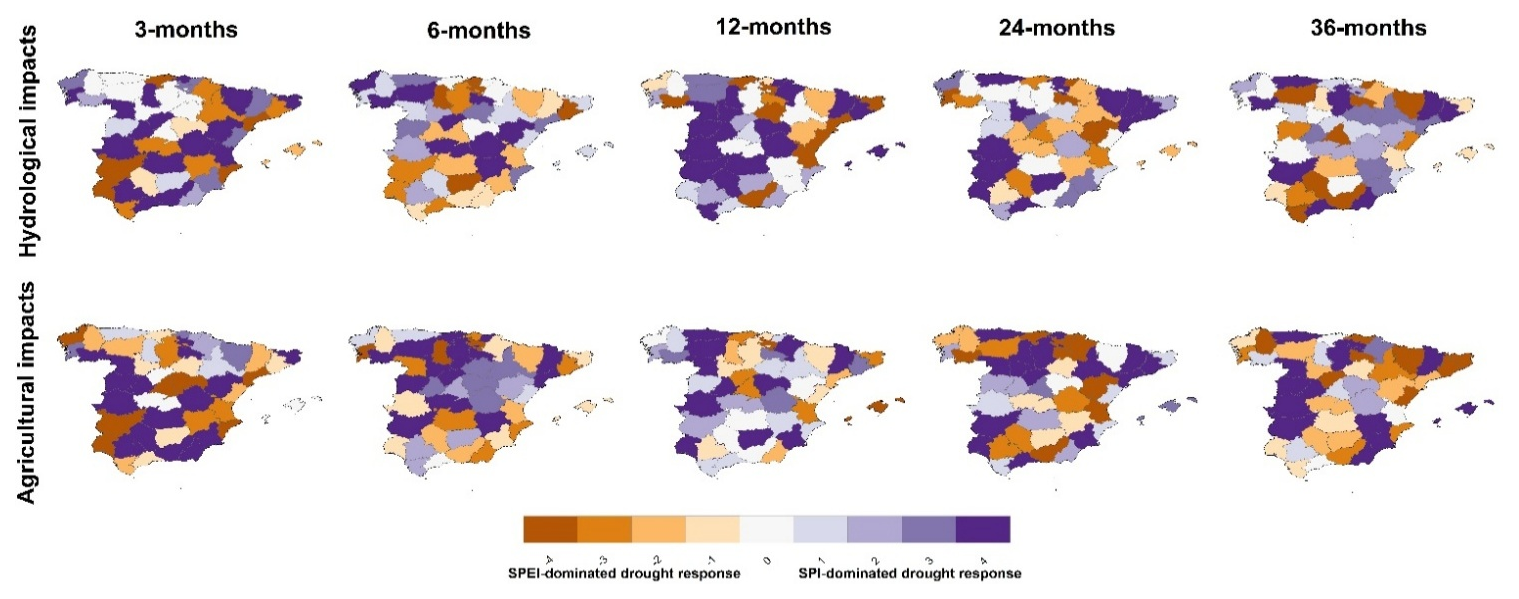
Figure 5Spatial differences in drought-reporting sensitivity between SPI and SPEI across Spain at multiple accumulation timescales. The relative dominance of SPEI-driven versus SPI-driven drought reporting responses for hydrological-impact reporting (top row) and agricultural-impact reporting (bottom row) is presented at 3-, 6-, 12-, 24-, and 36-month timescales.
The leading spatial modes of drought-impact reporting obtained from principal component analysis are illustrated in Fig. 6. The first principal component (PC1) embodies a prevailing national mode in the two sectors with positive loadings indicating coherent large-scale variability of drought-impact reporting. The strongest hydrological-impact reporting loadings occur in northwestern and central Spain, while agricultural-impact reporting is more prominent in western and southwestern regions. These spatial patterns are consistent with differences in basin-scale water-storage responses and sensitivity to soil-moisture deficits. PC2 demonstrates a clear east–west contrast, with the Mediterranean and southern regions having stronger loadings and the interior and north having weaker or opposite patterns; this contrast is more sharply defined for hydrological-impact reporting. PC3–PC5 are higher-order components that represent more localized variation. Hydrological-impact reporting shows more structured regional differences, whereas agricultural-impact reporting is more spatially heterogeneous. Overall, hydrological-impact reporting is more spatially coherent, whereas agricultural-impact reporting is more locally modulated.
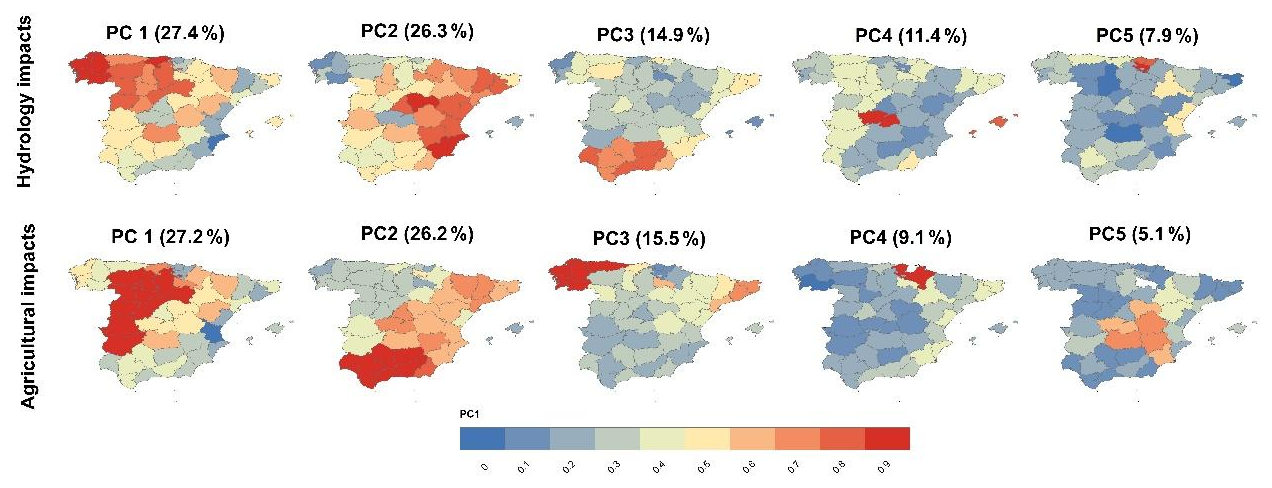
Figure 6Spatial loadings of the principal components (PCs) derived from standardized monthly hydrological (upper row) and agricultural (lower row) drought-impact reporting time series across Spanish provinces (1976–2023). Numbers in parentheses indicate the percentage of total variance explained by each principal component.
The drought-reporting sensitivity coefficient was assessed under different drought-severity classes for the different PCs in both hydrological- and agricultural-impact reporting (Fig. 7). As illustrated, for hydrological-impact reporting, sensitivity increases with both drought severity and accumulation period, peaking during severe and extreme droughts at 12–36 months. SPEI consistently exhibits larger drought-reporting sensitivity coefficients than SPI, especially under extreme conditions, suggesting an increased sensitivity to atmospheric evaporative demand. At the regional scale, PC1, the dominant large-scale signal over northwestern and central Spain, exhibits increasing sensitivity with timescale and drought severity, reaching its maximum at 12–36 months, which is consistent with the integrative behaviour of large river basins and storage systems. PC2, which is related to the Mediterranean and southern regions, is more sensitive to severe and extreme drought, especially at longer timescales, indicating stronger reporting sensitivity to prolonged moisture deficits in these regions. In contrast, higher-order components (PC3–PC5), which represent more localized variability, have more irregular and spatially restricted responses, with sensitivity peaks differing by timescale.
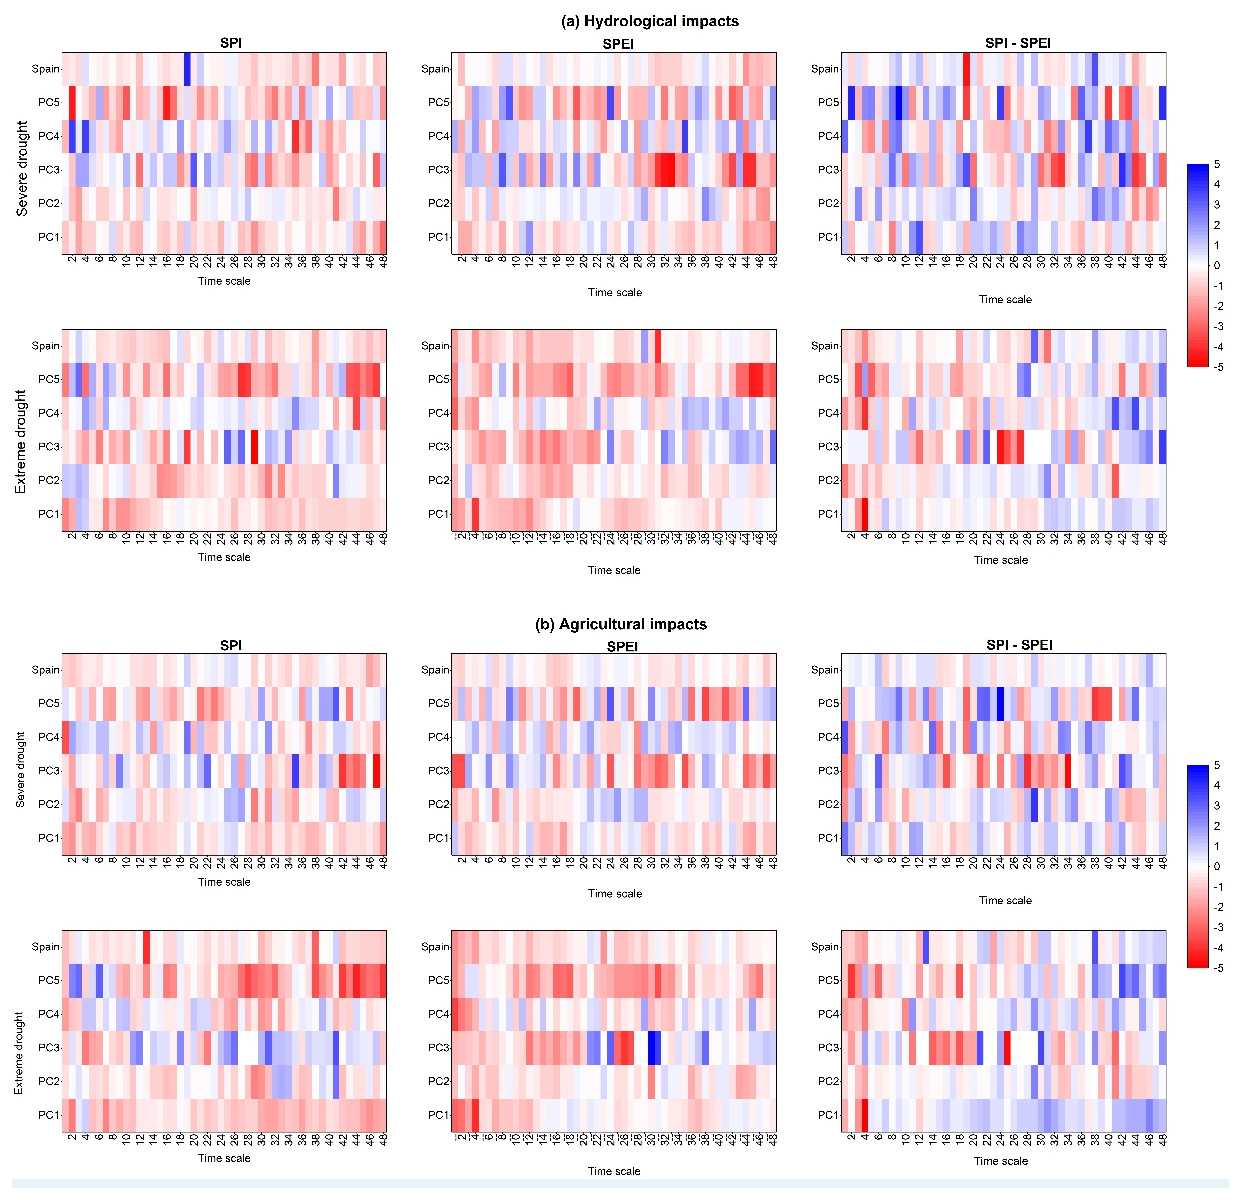
Figure 7Drought–reporting sensitivity coefficient between drought indices (SPI and SPEI) and (a) hydrological- and (b) agricultural-impact reporting across accumulation timescales (1–48 months) under severe and extreme drought classes. Panels show coefficient patterns for severe and extreme drought conditions derived for the main principal components (PC1–PC5), as well as Spain. Warmer colours indicate stronger responsiveness of impact reporting to drought severity. Differences between SPI and SPEI highlight the influence of temperature-driven evaporative demand under extreme drought conditions.
Agricultural reporting shows higher sensitivity, with the peak drought-reporting sensitivity coefficient occurring at short-to-medium timescales (6–24 months) (Fig. 7). As with hydrological-impact reporting responses, the drought-reporting sensitivity coefficient sharply increases from moderate to extreme drought conditions, consistent with stronger reporting responses under severe conditions. SPEI reveals stronger responses than SPI across all severity classes, again highlighting the importance of temperature-driven stress. For agricultural-impact reporting (Fig. 7), there are also marked subregional differences. The first principal component (PC1, west and southwest) exhibits rapid increases in sensitivity at short-to-intermediate timescales (6–24 months). PC2 and PC3, linked to eastern and northern areas, are characterized by greater variability and earlier sensitivity peaks. Higher-order components (PC4–PC5) show localized and variable responses, with steep increases under extreme drought conditions, suggesting possible local modulation by soil properties, irrigation practices, and crop type. These results demonstrate that SPEI yields higher sensitivity than SPI for all PCs and the differences tend to increase for severe and extreme drought. However, this effect tends to be more spatially structured in hydrological-impact reporting and more fragmented in agricultural-impact reporting.
3.3 Dominant drought accumulation timescales associated with impact reporting
Figure 8 synthesizes the dominant accumulation timescales associated with maximum reporting sensitivity. Specifically, the spatial distribution of the dominant drought accumulation timescale associated with maximum drought–reporting sensitivity across Spanish provinces for hydrological- and agricultural-impact reporting is presented for different drought-severity classes (normal, mild, moderate, severe, extreme, and all dry conditions). A clear sectoral contrast emerges. Hydrological-impact reporting is predominantly associated with medium-to-long-term timescales (12–48 months), with widespread dominance of 12–24 months under moderate conditions and a shift toward longer timescales (24–48 months) under severe and extreme drought. In contrast, agricultural-impact reporting is mainly associated with short-to-intermediate timescales (3–12 months), particularly under normal to moderate drought, consistent with stronger associations at shorter accumulation timescales and agricultural sensitivity to soil-moisture deficits (Fig. 8). Under extreme conditions, however, agricultural-impact reporting shows a partial shift toward longer timescales, although these remain shorter than those associated with hydrological-impact reporting. Hydrological reporting patterns are spatially more homogeneous, whereas agricultural reporting shows greater regional variability, pointing to stronger local modulation. SPEI generally exhibits longer dominant timescales than SPI in both sectors, especially under severe and extreme drought, indicating stronger SPEI-based associations at longer accumulation timescales. This effect is more pronounced for agricultural-impact reporting, particularly under severe and extreme drought, where SPEI is associated with a shift toward longer dominant accumulation timescales.
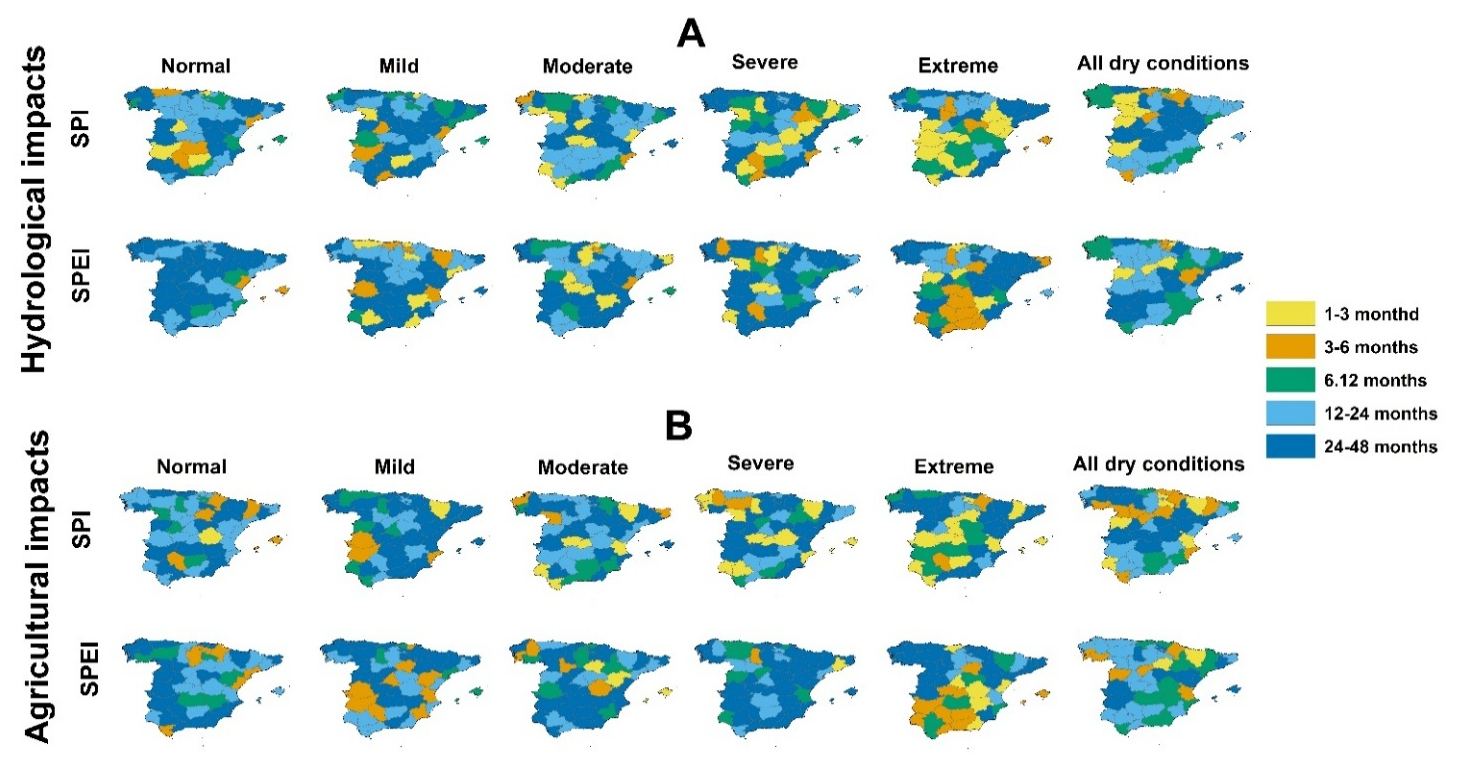
Figure 8Spatial distribution of the dominant drought accumulation timescale corresponding to the maximum reporting-sensitivity coefficient between drought indices (SPI and SPEI) and (a) hydrological- and (b) agricultural-impact reporting across Spanish provinces. Each panel corresponds to a drought-severity class (normal, mild, moderate, severe, extreme, and all dry conditions). Colours represent the timescale at which drought conditions show the strongest association with impact reporting, ranging from meteorological drought (1–3 months) to long-term water-storage deficits (24–48 months).
These patterns are summarized in Fig. 9, which indicates the percentage of Spanish provinces associated with the dominant drought accumulation timescale obtained from the maximum drought–reporting sensitivity coefficient between drought indices (SPI and SPEI) and impact reporting for the hydrological and agricultural sectors. Figure 9 shows that most provinces fall within the 12–48-month range for agricultural- and hydrological-impact reporting. However, agricultural reporting shows a higher concentration within the 1–6-month range. Short-lived anomalies show limited associations with hydrological-impact reporting, as short timescales (1–6 months) contribute little to the hydrological reporting response. With increasing drought severity, both sectors show a shift toward longer dominant timescales, but this shift is more pronounced for agricultural-impact reporting. SPEI shifts the distribution toward longer dominant timescales than SPI in both sectors, especially in the severe and extreme drought categories. This difference remains limited under mild drought conditions but increases substantially during severe and extreme droughts, indicating stronger SPEI-based associations at longer accumulation timescales. The effect is particularly striking for agricultural-impact reporting, where SPEI enhances the role of seasonal-to-long-term timescales (6–48 months) while diminishing the contribution of short-term scales (1–6 months).
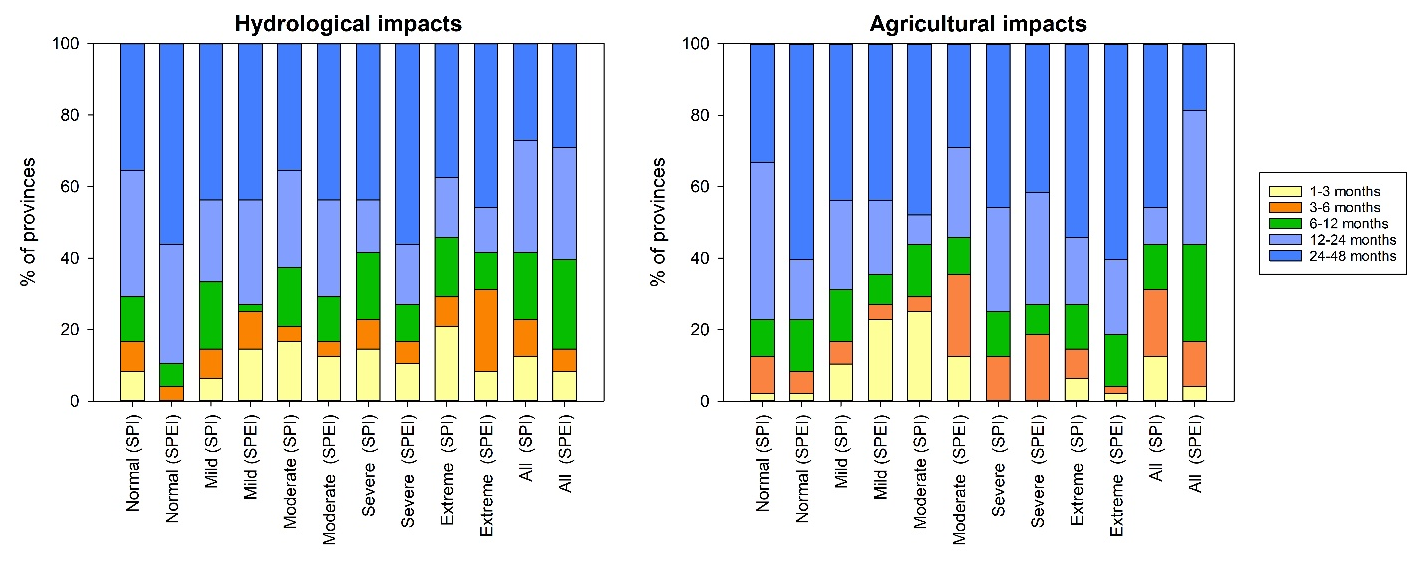
Figure 9Percentage of Spanish provinces associated with the dominant drought accumulation timescale derived from the maximum reporting sensitivity between drought indices (SPI and SPEI) and impact reporting. Stacked bars show the distribution of provinces across five drought timescale categories, meteorological (1–3 months), agricultural (3–6 months), seasonal (6–12 months), hydrological (12–24 months), and long-term storage (24–48 months), for different drought severity classes (normal, mild, moderate, severe, extreme, and all dry conditions). Results are shown separately for hydrological-impact reporting (left) and agricultural-impact reporting (right).
For hydrological-impact reporting, SPEI further supports the dominance of long storage timescales (24–48 months), reflecting cumulative water deficits. These results indicate that SPEI shifts the dominant associations toward longer accumulation timescales. Collectively, these results demonstrate a systematic shift from shorter to longer dominant accumulation timescales with increasing drought severity and highlight contrasting temporal sensitivities of hydrological- and agricultural-impact reporting.
This study provides a comprehensive assessment of the links between drought severity and impact reporting across Spain through the combination of multiscalar drought indices (SPI and SPEI) based on a high-resolution gridded climate dataset and standardized media-reported hydrological and agricultural impacts for the period 1976–2023. This study reveals the temporal, nonlinear, and spatial dynamics of drought-impact reporting through a scale-independent measure of reporting response, providing new insights into drought–reporting relationships across accumulation timescales and sectors.
The multiscale analysis reveals weaker associations with short-term anomalies, whereas medium- and long-term accumulation periods show stronger associations with both hydrological and agricultural reporting. This pattern aligns with growing evidence that the impacts of drought are a function of the accumulation and duration of moisture deficits (e.g., Van Loon and Laaha, 2015; Peña-Gallardo et al., 2019; Orth et al., 2020). For example, Peña-Gallardo et al. (2019) observed stronger relationships between meteorological and hydrological droughts at larger timescales in U.S. basins. Aryal et al. (2024) also demonstrated an increase in the duration of propagation of droughts with the accumulation period, which implies an increase in system memory. These findings are consistent with earlier studies that have identified drought duration and persistence as important impact drivers (Orth et al., 2020; Alvarez-Garreton et al., 2021; Tonetto et al., 2024). Our results in Spain also suggest that hydrological reporting is more strongly associated with longer accumulation periods, whereas agricultural reporting shows stronger associations with intermediate accumulation periods, consistent with their differing dependence on accumulated water deficits, soil moisture, and seasonal variability. The analysis indicates that isolated precipitation deficits are less strongly associated with impact reporting than persistent deficits. Importantly, although newspaper reports often describe drought consequences when they become observable or socially salient, the temporal delay between physical impact occurrence and publication was not quantified in this study. For many reported impacts, this delay may be relatively short compared with the multi-month climatic accumulation windows examined here; however, drought impacts are often gradual and persistent, and some reports may describe conditions that began earlier. We therefore use publication month as the timing of reporting rather than as an exact estimate of impact onset. Accordingly, any temporal offset between climatic conditions and the media record may reflect a combination of physical drought-impact response time, recognition of the impact, and reporting delay.
The study demonstrates that SPEI is more strongly associated with media-reported impacts than SPI, consistent with an important role of atmospheric evaporative demand in the determination of drought–reporting relationships. This contrast becomes more evident during prolonged and severe droughts. This suggests that temperature-driven processes are magnifying the effect of precipitation deficits, especially in the case of prolonged drought. This finding is in agreement with other global (Woodhouse et al., 2016; Ogunrinde et al., 2026), Mediterranean (Dong et al., 2019; Avanzi et al., 2020) and Spanish research (Noguera et al., 2021). Atmospheric evaporative demand is particularly important for agriculture because increased atmospheric demand intensifies plant water stress and induces a large moisture loss from soil (Rigden et al., 2020; Qing et al., 2023). Hydrological systems respond more gradually and cumulatively, leading to long-term reductions in groundwater recharge and water storage. The higher atmospheric demand can enhance agricultural and ecological droughts (Vicente-Serrano et al., 2022). Terrestrial water storage is strongly controlled by imbalances between water supply and atmospheric demand (Chang et al., 2020). The consistently stronger performance of SPEI relative to SPI further suggests that future droughts will increasingly reflect the combined effects of precipitation deficits and enhanced atmospheric evaporative demand associated with regional warming. This finding is particularly important in the Mediterranean basin, identified as a climate-change hotspot where temperatures are projected to rise faster than the global average, accompanied by increased drought severity and reduced water availability (Lionello and Scarascia, 2018).
Our findings further demonstrate a marked nonlinear drought–reporting relationship, with reporting sensitivity increasing disproportionately under severe and extreme drought. Nonlinear responses have been well documented for many regions and systems (Lobell et al., 2014; Chen et al., 2022; Wu et al., 2025; Liu et al., 2025). These findings suggest a threshold-like increase in reporting sensitivity; however, this should not be interpreted as direct evidence that physical impact magnitude increases at the same rate. Hydrological systems respond more slowly but exhibit stronger cumulative sensitivity, possibly related to the buffering effects of groundwater storage and reservoir regulation. However, studies in Spain indicate that these buffering mechanisms are insufficient to offset severe drought impacts. Previous studies have indicated that streamflow and water storage are highly sensitive to climate variability in Spanish basins (Berghuijs et al., 2016) and that reservoir regulation continues to alter but not offset the frequency and severity of droughts (Vicente-Serrano et al., 2014, 2017b). Moreover, more reliance on water storage and transfers increases vulnerability (Lorenzo-Lacruz et al., 2013) and risks of drought are high despite better management (Vargas and Paneque, 2019). On the other hand, agricultural systems exhibit stronger and more variable increases in exposure with a limited ability to buffer this shift. These findings highlight the nonlinear amplification of the frequency of media reports on impacts and underscore the need to incorporate nonlinear dynamics into drought risk assessments.
The supplementary robustness analyses qualify the interpretation of the drought-reporting sensitivity coefficient (Supplement Figs. S4–S5). Although coherent timescale-dependent patterns remain evident after aggregation across provinces, individual province-level β estimates are not uniformly well constrained, particularly under severe and extreme drought where severity stratification narrows the predictor range and confidence intervals broaden. The principal multiscalar patterns should therefore be interpreted more strongly at the aggregate sectoral scale than as precise estimates for individual province–timescale combinations. The zero-inclusive analysis further shows that drought reporting comprises two related but distinct components: the initiation of reporting and the subsequent intensity of reporting once it occurs. Greater drought magnitude is generally associated with higher odds of any reporting, with the most spatially coherent occurrence responses concentrated at short-to-intermediate timescales, particularly for SPEI. Consequently, conditioning the log–log analysis on positive counts may omit part of the reporting response where drought primarily affects whether reporting is initiated, and comparisons among sectors, provinces, and timescales should consider both occurrence and conditional intensity.
A further source of uncertainty in the province-level spatial analysis concerns the independent extraction of impact categories and geographic references. In articles mentioning several provinces and several impact types, the available workflow cannot determine whether every reported impact applies to every referenced province. Because the final analytical dataset retains monthly province–sector counts rather than article-level provenance, the frequency of such combinations cannot be quantified retrospectively, nor can the analysis be restricted to single-province articles. This limitation is particularly relevant to the interpretation of fine-scale spatial contrasts. Accordingly, province-level coefficients and maps should be viewed as patterns of the geographic and sectoral framing of drought in media reporting, rather than as precisely geocoded inventories of physical impacts. Aggregated national and broad regional patterns are less dependent on exact within-article attribution, whereas interpretation of individual provinces warrants greater caution.
We report a dominant large-scale signal of drought-impact reporting, but with substantial spatial heterogeneity in sensitivity and dominant timescales. The first principal component indicates that a large part of the variability of impact reporting is associated with coherent climatic forcing over the whole of Spain. Several processes could plausibly contribute to the observed geography. Large-scale atmospheric circulation structures drought variability across Spain. Previous studies have linked drought variability in Spain to large-scale atmospheric circulation patterns (Vicente-Serrano and López-Moreno, 2006; Russo et al., 2015; Bakke et al., 2023; Noguera et al., 2024). However, basin storage, groundwater exchange, irrigation dependence, crop composition, water-allocation rules, and adaptive capacity can alter how the same climatic deficit is experienced and reported. Numerous studies demonstrate that local hydroclimatic conditions, water management practices and socioeconomic factors modulate drought responses, with regional differences in sensitivity and dominant timescales (Iglesias et al., 2010; Grau-Satorras et al., 2016; Urquijo and De Stefano, 2016; Li et al., 2024; Junquera et al., 2025). In addition, province-specific reporting intensity and the geographic focus of a national newspaper may contribute to apparent spatial contrasts. The spatial heterogeneity therefore likely combines hydroclimatic, management, exposure, and reporting effects and should not be attributed to climate alone. Crucially, this spatial variability further demonstrates that drought impacts cannot be fully understood without considering both large-scale climatic forcing and local environmental conditions.
Dominant timescales are identified to offer further insight into the temporal organization of drought-impact reporting. Hydrological reporting is predominantly associated with medium-to-long-term accumulation timescales, while agricultural reporting is more linked to short- to medium-term accumulation timescales. Both sectors exhibit a shift toward longer dominant timescales with increasing drought severity, indicating stronger associations with longer climatic accumulation windows. This change is particularly evident in hydrological systems, but it also emerges in agricultural systems under severe conditions, where agricultural reporting also becomes associated with longer accumulation timescales. Altieri et al. (2025) reported similar results indicating that even resilient agricultural systems can collapse under prolonged water stress. The limited contribution of short-term timescales further supports the conclusion that media-reported impacts are more strongly associated with persistent, rather than transient, anomalies.
These findings are relevant for drought detection and the development of early warning systems. Impact dynamics are strongly controlled by drought accumulation timescales; hence multiscale monitoring strategies are required to achieve a complete picture of the evolution of drought. A number of studies have underscored the need to choose suitable drought timescales given by sector-specific responses to assess their severity (Vicente-Serrano et al., 2021). The relatively greater impact of atmospheric evaporative demand indicates the requirement for integrated temperature-sensitive indicators like the SPEI in operational monitoring networks. Although news articles are written for purposes other than systematically documenting drought impacts, they provide a credible, though not exhaustive, record of drought's effects at specific places and times (Dow, 2010). In contrast to SPI and SPEI, which quantify meteorological moisture deficits and atmospheric evaporative demand, media-reported impact data document how drought was observed, narrated, and experienced through effects on people, livelihoods, ecosystems, water resources, agriculture, and socioeconomic systems. In this study, these records are therefore treated not as direct physical measurements of drought damage or as a comprehensive inventory of all impacts, but as a best-available proxy for the societal visibility, timing, location, and sectoral framing of drought events. Persistent conditions could generate repeated reports because no event-level de-duplication was applied. Thus, high reporting frequencies may partly reflect sustained media attention to the same ongoing drought consequence rather than a larger number of independent physical impact events. Because news coverage is shaped by editorial priorities, institutional context, public attention, event novelty, perceived severity, and uneven spatial coverage, low reporting frequencies should not necessarily be interpreted as the absence of drought impacts. Rather, media-derived impact data identify when and where drought became socially salient, problematic, or publicly visible, making them useful for relating climate-based drought indicators to observed societal consequences. Recent research has demonstrated that media-based datasets can record drought effects at relatively high spatiotemporal resolution (Madruga de Brito et al., 2020; Wang et al., 2025), although they entail reporting biases and changes in media practices (Stahl et al., 2016; Serrano-Acebedo et al., 2026; Pita Costa et al., 2024).
The findings support the growing view that drought impacts in Spain emerge from the coupled interaction of climatic variability, hydrogeological structure, land management, and anthropogenic water use (Junquera et al., 2025; Sánchez and Cantos, 2025). Recent basin-scale analyses have shown that hydrological deficits across the Iberian Peninsula are strongly conditioned by groundwater exchange, irrigation pressure, permeability, and reservoir regulation, producing substantial spatial heterogeneity in effective water availability (e.g., Segura-Méndez et al., 2026). Within this context, the spatial variability of drought–reporting sensitivity coefficients identified in this study likely reflects not only differences in meteorological drought severity but also the varying capacity of socio-hydrological systems to buffer, amplify, or redistribute drought stress. These factors provide plausible physical and management contexts for the regional differences observed here, but the media-based analysis cannot separate their individual contributions from differences in exposure or reporting. Accordingly, spatial variation in sensitivity coefficient (β) can be interpreted as variation in the drought–reporting relationship rather than as a direct map of physical vulnerability.
This study advances understanding of drought-impact relationships by providing a comprehensive multiscalar and nonlinear framework that links climatic drivers to societal responses under changing environmental conditions. The combination of climate indices and impact data provides a good basis for further improvement of the assessment, attribution and prediction of drought impacts, thus facilitating more effective risk management and adaptation efforts in drought-prone regions.
This work provides a detailed assessment of the multiscale and nonlinear relationships between drought severity and media-reported hydrological and agricultural impacts in Spain during 1976–2023. We explored relationships between standardized drought indices (SPI and SPEI) and impact-reporting data from newspaper records. The results indicate that the frequency of media reports on impacts is more strongly associated with persistent moisture deficits than with short-term climatic variability. The most robust drought–reporting relationships are identified at medium-to-long accumulation timescales, reflecting the integration of moisture deficits over longer climatic windows. These results indicate that the widespread impact reporting in Spain is more strongly associated with persistent drought conditions than with isolated precipitation deficits.
The results also suggest a clear sectoral differentiation in dominant accumulation timescales. Hydrological reporting is mainly associated with longer accumulation timescales, following the integrative nature of water storage systems, whereas agricultural reporting shows stronger associations with short- to medium-term accumulation timescales, reflecting the dependence of agricultural systems on soil moisture and seasonal water availability. Despite these differences, both sectors exhibit a systematic increase in dominant timescales with increasing drought severity, suggesting that longer deficits are increasingly associated with reporting dynamics across both sectors.
A major finding of this study is the strong association of atmospheric evaporative demand with drought-impact reporting. The consistently stronger relationships obtained with SPEI, compared to SPI, underline the importance of temperature-driven processes, especially for moderate to extreme drought conditions and at longer accumulation timescales. The results highlight the increasing role of warming in drought dynamics and suggest that precipitation-based indices alone may underestimate drought severity and related impacts in a changing climate. The analysis also indicates that reporting sensitivity to drought severity is largely nonlinear, increasing disproportionately for severe and extreme conditions. This behaviour reflects a threshold-like increase in reporting sensitivity and should not be interpreted as a direct measure of physical damage thresholds.
Complementary uncertainty and zero-inclusive analyses further show that these sensitivity patterns are more robust at the aggregated national scale than for individual province–timescale regressions, and that increasing drought magnitude affects both the probability that reporting occurs and the intensity of reporting conditional on its occurrence. This distinction strengthens the interpretation of the nonlinear drought–reporting response while emphasizing appropriate caution in the use of isolated local β estimates.
Spatial analysis indicates a dominant large-scale drought signal and substantial regional variability in reporting response. Although a large proportion of reporting variability is associated with coherent climatic forcing over large areas of Spain, regional differences in sensitivity and dominant timescales suggest the importance of local hydroclimatic conditions, water management and socioeconomic factors. These results highlight the importance of accounting for both regional characteristics and large-scale drivers in the assessment of drought impacts.
This study contributes to the understanding of drought-impact relationships by assembling a unified framework of multiscalar drought metrics, nonlinear sensitivity analysis and impact-based observations. The results have important implications for drought monitoring and early warning systems, underscoring the importance of multiscalar approaches and the inclusion of temperature-sensitive indices such as SPEI. The inclusion of media-reported impacts provides useful insight into how drought manifests in society, beyond the traditional climate-based indicators. This framework supports improved assessment, attribution, and prediction of drought impacts in the context of ongoing climate change and ultimately supports more effective risk management and adaptation strategies.
The drought-impact data used in this study were derived from copyrighted newspaper content from El País. Owing to licensing and data-sharing restrictions associated with the source material, the underlying article-level dataset and derived data containing information extracted from these articles cannot be made publicly available. Access to the original newspaper content is governed by the terms and conditions of the data provider. The drought-index data used in the analysis are described and cited in Sect. 2.2. The R code used for data processing, statistical analyses, and figure generation is available from the corresponding author upon reasonable request.
All statistical analyses were performed in R version 4.5.2 (R Core Team, 2025). Data preparation, filtering, grouping, and aggregation were carried out using the dplyr and tidyr packages. The empirical standardization of the monthly drought-impact reporting series was implemented following https://doi.org/10.1002/joc.8906 (Vicente-Serrano et al., 2025) using custom R routines. Principal component analysis (PCA) was performed using functions from the stats package, separately for the standardized impact-reporting series. Pearson correlation coefficients between drought indices and standardized impact-reporting frequencies were also calculated using stats. Drought–reporting sensitivity coefficients were estimated using ordinary least-squares log–log regression with lm(). Temporal dependence in the drought-index, impact-reporting, and regression-residual series was evaluated using the autocorrelation function (acf()) implemented in stats. Province-level spatial data were handled using the sf package.
The supplement related to this article is available online at https://doi.org/10.5194/nhess-26-4977-2026-supplement.
A.M.E. and S.M.V. were responsible for the conceptualization and development of the research idea. A.M.E., F.D.C., and A.H. developed the methodology, carried out the analysis and visualization, and wrote the original draft of the manuscript. S.B., J.V.T., A.C., M.A., B.T., and M.F. assisted in data collection, contributed to manuscript editing and literature enhancement, and contributed to project administration and coordination. A.M.E., S.M.V., and F.D.C. contributed to draft writing. All authors contributed to the manuscript by reviewing and editing the original draft.
The contact author has declared that none of the authors has any competing interests.
Publisher's note: Copernicus Publications remains neutral with regard to jurisdictional claims made in the text, published maps, institutional affiliations, or any other geographical representation in this paper. The authors bear the ultimate responsibility for providing appropriate place names. Views expressed in the text are those of the authors and do not necessarily reflect the views of the publisher.
The article processing charges for this open-access publication were covered in part by the CSIC Open Access Publication Support Initiative through its Unit of Information Resources for Research (URICI). This work has been partially supported by the research project PID2022-137244OB-I00, financed by the Spanish Ministry of Science.
This paper was edited by Matthias Schlögl and reviewed by two anonymous referees.
Agnew, C. T.: Using the SPI to Identify Drought, Drought Network News (1994–2001), 1, https://digitalcommons.unl.edu/droughtnetnews/1 (last access: 26 March 2025), 2000.
Altieri, M. A., Nicholls, C. I., Montalba, R., Vieli, L., and Vazquez, L. L.: Agroecology and the limits to resilience: extending the adaptation capacity of agroecosystems to drought, Frontiers in Agronomy, 7, https://doi.org/10.3389/fagro.2025.1534370, 2025.
Alvarez-Garreton, C., Boisier, J. P., Garreaud, R., Seibert, J., and Vis, M.: Progressive water deficits during multiyear droughts in basins with long hydrological memory in Chile, Hydrol. Earth Syst. Sci., 25, 429–446, https://doi.org/10.5194/hess-25-429-2021, 2021.
Aryal, S. K., Zheng, H., Zhang, Y., and Faiz, M. A.: Drought Propagation and Recovery Behaviors Across 407 Australian Catchments, Earth's Future, 12, e2023EF004190, https://doi.org/10.1029/2023EF004190, 2024.
Avanzi, F., Rungee, J., Maurer, T., Bales, R., Ma, Q., Glaser, S., and Conklin, M.: Climate elasticity of evapotranspiration shifts the water balance of Mediterranean climates during multi-year droughts, Hydrol. Earth Syst. Sci., 24, 4317–4337, https://doi.org/10.5194/hess-24-4317-2020, 2020.
Bachmair, S., Kohn, I., and Stahl, K.: Exploring the link between drought indicators and impacts, Nat. Hazards Earth Syst. Sci., 15, 1381–1397, https://doi.org/10.5194/nhess-15-1381-2015, 2015.
Bachmair, S., Svensson, C., Hannaford, J., Barker, L. J., and Stahl, K.: A quantitative analysis to objectively appraise drought indicators and model drought impacts, Hydrol. Earth Syst. Sci., 20, 2589–2609, https://doi.org/10.5194/hess-20-2589-2016, 2016.
Bakke, S. J., Ionita, M., and Tallaksen, L. M.: Recent European drying and its link to prevailing large-scale atmospheric patterns, Sci. Rep., 13, 21921, https://doi.org/10.1038/s41598-023-48861-4, 2023.
Barker, L. J., Hannaford, J., Chiverton, A., and Svensson, C.: From meteorological to hydrological drought using standardised indicators, Hydrol. Earth Syst. Sci., 20, 2483–2505, https://doi.org/10.5194/hess-20-2483-2016, 2016.
Berghuijs, W. R., Hartmann, A., and Woods, R. A.: Streamflow sensitivity to water storage changes across Europe, Geophys. Res. Lett., 43, 1980–1987, 2016.
Blauhut, V., Stahl, K., Stagge, J. H., Tallaksen, L. M., De Stefano, L., and Vogt, J.: Estimating drought risk across Europe from reported drought impacts, drought indices, and vulnerability factors, Hydrol. Earth Syst. Sci., 20, 2779–2800, https://doi.org/10.5194/hess-20-2779-2016, 2016.
Brázdil, R., Kiss, A., Luterbacher, J., Nash, D. J., and Řezníčková, L.: Documentary data and the study of past droughts: a global state of the art, Clim. Past, 14, 1915–1960, https://doi.org/10.5194/cp-14-1915-2018, 2018.
Chang, L. L., Yuan, R., Gupta, H. V., Winter, C. L., and Niu, G. Y.: Why Is the Terrestrial Water Storage in Dryland Regions Declining? A Perspective Based on Gravity Recovery and Climate Experiment Satellite Observations and Noah Land Surface Model With Multiparameterization Schemes Model Simulations, Water Resour. Res., 56, e2020WR027102, https://doi.org/10.1029/2020WR027102, 2020.
Chen, Q., Timmermans, J., Wen, W., and van Bodegom, P. M.: A multi-metric assessment of drought vulnerability across different vegetation types using high resolution remote sensing, Sci. Total Environ., 832, 154970, https://doi.org/10.1016/j.scitotenv.2022.154970, 2022.
Conradt, T., Engelhardt, H., Menz, C., Vicente-Serrano, S. M., Alvarez Farizo, B., Peña-Angulo, D., Domínguez-Castro, F., Eklundh, L., Jin, H., Boincean, B., Murphy, C., and López-Moreno, J. I.: Cross-sectoral impacts of the 2018–2019 Central European drought and climate resilience in the German part of the Elbe River basin, Reg. Environ. Change, 23, 32, https://doi.org/10.1007/s10113-023-02032-3, 2023.
Dayrell, C., Svensson, C., Hannaford, J., McEnery, T., Barker, L. J., Baker, H., and Tanguy, M.: Representation of Drought Events in the United Kingdom: Contrasting 200 years of News Texts and Rainfall Records, Frontiers in Environmental Science, 10, 760147, https://doi.org/10.3389/fenvs.2022.760147, 2022.
Domínguez-Castro, F., Vicente-Serrano, S. M., Tomás-Burguera, M., Peña-Gallardo, M., Beguería, S., El Kenawy, A., Luna, Y., and Morata, A.: High spatial resolution climatology of drought events for Spain: 1961–2014, Int. J. Climatol., 39, 5046–5062, 2019.
Dong, C., MacDonald, G., Okin, G. S., and Gillespie, T. W.: Quantifying Drought Sensitivity of Mediterranean Climate Vegetation to Recent Warming: A Case Study in Southern California, Remote Sens., 11, 2902, https://doi.org/10.3390/rs11242902, 2019.
Dow, K.: News coverage of drought impacts and vulnerability in the US Carolinas, 1998–2007, Nat. Hazards, 54, 497–518, 2010.
El Kenawy, A., McCabe, M., Vicente-Serrano, S., López-Moreno, J., and Robaa, S.: Changes in the frequency and severity of hydrological droughts over Ethiopia from 1960 to 2013, Cuadernos de Investigación Geográfica, 42, 145–166, 2016.
El Kenawy, A., Al-Awadhi, T., Abdullah, M., Ostermann, F. O., and Abulibdeh, A.: A Multidecadal Assessment of Drought Intensification in the Middle East and North Africa: The Role of Global Warming and Rainfall Deficit, Earth Systems and Environment, 10, 343–362, 2026.
Engström, J., Jafarzadegan, K., and Moradkhani, H.: Drought Vulnerability in the United States: An Integrated Assessment, Water, 12, 2033, https://doi.org/10.3390/w12072033, 2020.
Grau-Satorras, M., Otero, I., Gómez-Baggethun, E., and Reyes-García, V.: Long-term community responses to droughts in the early modern period: the case study of Terrassa, Spain, Ecol. Soc., 21, 33, https://doi.org/10.5751/ES-08232-210233, 2016.
Iglesias, A., Quiroga, S., and Schlickenrieder, J.: Climate change and agricultural adaptation: assessing management uncertainty for four crop types in Spain, Clim. Res., 44, 83–94, 2010.
Ji, J., Miao, C., Hu, J., Su, J., Chen, S., Wang, Y., Kong, Y., Bai, X., and Wang, Y.: Transition in Global Basins from Precipitation-Dominated to Evaporative Demand-Dominated Meteorological Drought: Past Patterns and Future Projections, Earth's Future, 14, e2025EF007492, https://doi.org/10.1029/2025EF007492, 2026.
Jobbová, E., Crampsie, A., Murphy, C., Ludlow, F., McLeman, R., Horvath, C., Seifert, N., Myslinski, T., and Sente, L.: The Irish drought impacts database: A 287-year database of drought impacts derived from newspaper archives, Geosci. Data J., 11, 1007–1023, 2024.
Junquera, V., Hormaza, J. I., Rubenstein, D. I., Levin, S. A., Vadillo Perez, I., and Gavilan, P. J.: Severe water crisis in southern Spain under expanding irrigated agriculture: A multidimensional drought analysis, P. Natl. Acad. Sci. USA, 122, e2508055122, https://doi.org/10.1073/pnas.2508055122, 2025.
Kamali, B., Abbaspour, K. C., Wehrli, B., and Yang, H.: A Quantitative Analysis of Socio-Economic Determinants Influencing Crop Drought Vulnerability in Sub-Saharan Africa, Sustainability, 11, 6135, https://doi.org/10.3390/su11216135, 2019.
Kchouk, S., Melsen, L. A., Walker, D. W., and van Oel, P. R.: A geography of drought indices: mismatch between indicators of drought and its impacts on water and food securities, Nat. Hazards Earth Syst. Sci., 22, 323–344, https://doi.org/10.5194/nhess-22-323-2022, 2022.
Keyantash, J.: Indices for Meteorological and Hydrological Drought, in: Hydrological Aspects of Climate Change, edited by: Pandey, A., Kumar, S., and Kumar, A., Springer, Singapore, 215–235, https://doi.org/10.1007/978-981-16-0394-5_11, 2021.
Kimm, H., Guan, K., Gentine, P., Wu, J., Bernacchi, C. J., Sulman, B. N., Griffis, T. J., and Lin, C.: Redefining droughts for the U.S. Corn Belt: The dominant role of atmospheric vapor pressure deficit over soil moisture in regulating stomatal behavior of Maize and Soybean, Agr. Forest Meteorol., 287, 107930, https://doi.org/10.1016/j.agrformet.2020.107930, 2020.
Li, Y., Huang, Y., Li, Y., Zhang, H., Fan, J., Deng, Q., and Wang, X.: Spatiotemporal heterogeneity in meteorological and hydrological drought patterns and propagations influenced by climatic variability, LULC change, and human regulations, Sci. Rep., 14, 5965, https://doi.org/10.1038/s41598-024-56526-z, 2024.
Lionello, P. and Scarascia, L.: The relation between climate change in the Mediterranean region and global warming, Reg. Environ. Change, 18, 1481–1493, 2018.
Liu, Q., Liang, L., Sun, T., Wang, X., Yan, D., and Li, C.: Hydrological response of drought impacts across catchments worldwide, Sci. Total Environ., 931, 172912, https://doi.org/10.1016/j.scitotenv.2024.172912, 2024.
Liu, X., Wang, Q., Zhu, X., and Zhang, Y.: Nonlinear response and driving mechanisms of ecological restoration project effectiveness to drought, Ecol. Indic., 170, 113055, https://doi.org/10.1016/j.ecolind.2024.113055, 2025.
Llasat, M. C., Llasat-Botija, M., Barnolas, M., López, L., and Altava-Ortiz, V.: An analysis of the evolution of hydrometeorological extremes in newspapers: the case of Catalonia, 1982–2006, Nat. Hazards Earth Syst. Sci., 9, 1201–1212, https://doi.org/10.5194/nhess-9-1201-2009, 2009.
Lobell, D. B., Roberts, M. J., Schlenker, W., Braun, N., Little, B. B., Rejesus, R. M., and Hammer, G. L.: Greater sensitivity to drought accompanies maize yield increase in the US Midwest, Science, 344, 516–519, 2014.
López-Moreno, J. I., Vicente-Serrano, S. M., Zabalza, J., Beguería, S., Lorenzo-Lacruz, J., Azorin-Molina, C., and Morán-Tejeda, E.: Hydrological response to climate variability at different time scales: a study in the Ebro basin, J. Hydrol., 477, 175–188, 2013.
López-Otal, M., Domínguez-Castro, F., Latorre, B., Vela-Tambo, J., and Gracia, J.: SeqIA: A Python framework for extracting drought impacts from news archives, Environ. Modell. Softw., 187, 106382, https://doi.org/10.1016/j.envsoft.2025.106382, 2025.
Lorenzo-Lacruz, J., Morán-Tejeda, E., Vicente-Serrano, S. M., and López-Moreno, J. I.: Streamflow droughts in the Iberian Peninsula between 1945 and 2005: spatial and temporal patterns, Hydrol. Earth Syst. Sci., 17, 119–134, https://doi.org/10.5194/hess-17-119-2013, 2013.
Madruga de Brito, M., Kuhlicke, C., and Marx, A.: Near-real-time drought impact assessment: a text mining approach on the 2018/19 drought in Germany, Environ. Res. Lett., 15, 1040a9, https://doi.org/10.1088/1748-9326/aba4ca, 2020.
United Nations Office for Disaster Risk Reduction (UNDRR): Global Assessment Report on Disaster Risk Reduction 2019, United Nations, https://doi.org/10.18356/f4ae4888-en, 2019.
McKee, T. B., Doesken, N. J., and Kleist, J.: The relationship of drought frequency and duration to time scales, in: Proceedings of the Eighth Conference on Applied Climatology, American Meteorological Society, Anaheim, CA, 179–184, 1993.
Melo, D. D. C. D., Scanlon, B. R., Zhang, Z., Wendland, E., and Yin, L.: Reservoir storage and hydrologic responses to droughts in the Paraná River basin, south-eastern Brazil, Hydrol. Earth Syst. Sci., 20, 4673–4688, https://doi.org/10.5194/hess-20-4673-2016, 2016.
Murphy, C., Noone, S., Duffy, C., Broderick, C., Matthews, T., and Wilby, R. L.: Irish droughts in newspaper archives: rediscovering forgotten hazards?, Weather, 72, 151–155, 2017.
Nash, D. J., Klein, J., Endfield, G. H., Pribyl, K., Adamson, G. C. D., and Grab, S. W.: Narratives of nineteenth century drought in southern Africa in different historical source types, Climatic Change, 152, 467–485, 2019.
Noguera, I., Domínguez-Castro, F., and Vicente-Serrano, S. M.: Flash Drought Response to Precipitation and Atmospheric Evaporative Demand in Spain, Atmosphere, 12, 165, https://doi.org/10.3390/atmos12020165, 2021.
Noguera, I., Domínguez-Castro, F., Vicente-Serrano, S. M., García-Herrera, R., Garrido-Pérez, J. M., Trigo, R. M., and Sousa, P. M.: Unravelling the atmospheric dynamics involved in flash drought development over Spain, Int. J. Climatol., 44, 4478–4494, 2024.
O'Connor, P., Murphy, C., Matthews, T., and Wilby, R. L.: Relating drought indices to impacts reported in newspaper articles, Int. J. Climatol., 43, 1796–1816, 2023.
Ogunrinde, A. T., Adigun, P., Xue, X., Dairaku, K., Shah, S. A., and Adawa, I. S.: Probabilistic quantification of global drought risk amplification from temperature-enhanced evapotranspiration under climate change, Geosci. Front., 17, 102235, https://doi.org/10.1016/j.gsf.2025.102235, 2026.
Orth, R., Destouni, G., Jung, M., and Reichstein, M.: Large-scale biospheric drought response intensifies linearly with drought duration in arid regions, Biogeosciences, 17, 2647–2656, 2020.
Peña-Gallardo, M., Vicente-Serrano, S. M., Quiring, S., Svoboda, M., Hannaford, J., Tomas-Burguera, M., Martín-Hernández, N., Domínguez-Castro, F., and El Kenawy, A.: Response of crop yield to different time-scales of drought in the United States: Spatio-temporal patterns and climatic and environmental drivers, Agr. Forest Meteorol., 264, 40–55, 2019.
Pita Costa, J., Rei, L., Bezak, N., Mikoš, M., Massri, M. B., Novalija, I., and Leban, G.: Towards improved knowledge about water-related extremes based on news media information captured using artificial intelligence, Int. J. Disast. Risk Re., 100, 104172, https://doi.org/10.1016/j.ijdrr.2023.104172, 2024.
Qing, Y., Wang, S., Yang, Z.-L., Gentine, P., Zhang, B., and Alexander, J.: Accelerated soil drying linked to increasing evaporative demand in wet regions, npj Climate and Atmospheric Science, 6, 205, https://doi.org/10.1038/s41612-023-00531-y, 2023.
R Core Team: R: A Language and Environment for Statistical Computing, R Foundation for Statistical Computing, https://www.r-project.org/ (last access: 27 June 2026), 2025.
Rigden, A. J., Mueller, N. D., Holbrook, N. M., Pillai, N., and Huybers, P.: Combined influence of soil moisture and atmospheric evaporative demand is important for accurately predicting US maize yields, Nat. Food, 1, 127–133, https://doi.org/10.1038/s43016-020-0028-7, 2020.
Ruiz Sinoga, J. D. and León Gross, T.: Droughts and their social perception in the mass media (southern Spain), Int. J. Climatol., 33, 709–724, 2013.
Runde, I., Zobel, Z., and Schwalm, C.: Human and natural resource exposure to extreme drought at 1.0 °C–4.0 °C warming levels, Environ. Res. Lett., 17, 064005, https://doi.org/10.1088/1748-9326/ac681a, 2022.
Russo, A. C., Gouveia, C. M., Trigo, R. M., Liberato, M. L. R., and DaCamara, C. C.: The influence of circulation weather patterns at different spatial scales on drought variability in the Iberian Peninsula, Frontiers in Environmental Science, 3, 1, https://doi.org/10.3389/fenvs.2015.00001, 2015.
Sánchez, D. E. and Cantos, J. O.: One Country, Several Droughts: Characterisation, Evolution, and Trends in Meteorological Droughts in Spain Within the Context of Climate Change, Climate, 13, 202, https://doi.org/10.3390/cli13100202, 2025.
Segura-Méndez, F. J., Jimeno-Sáez, P., Castellanos-Osorio, G., Pérez-Sánchez, J., and Senent-Aparicio, J.: What Drives Water Availability in Spain? Spatial Patterns, Climatic Uncertainty, and Key Influencing Factors, Hydrol. Process., 40, e70530, https://doi.org/10.1002/hyp.70530, 2026.
Serrano-Acebedo, P., Limones, N., and Langa-Nuño, C.: Local news as a tool to understand media communication of historical droughts. A case study in Sevilla, Spain, Journal of Environmental Studies and Sciences, 16, 677–700, https://doi.org/10.1007/s13412-025-01073-w, 2026.
Shyrokaya, A., Messori, G., Pechlivanidis, I., Pappenberger, F., Cloke, H. L., and Di Baldassarre, G.: Significant relationships between drought indicators and impacts for the 2018–2019 drought in Germany, Environ. Res. Lett., 19, 014037, https://doi.org/10.1088/1748-9326/ad10d9, 2024.
Slette, I. J., Post, A. K., Awad, M., Even, T., Punzalan, A., Williams, S., Smith, M. D., and Knapp, A. K.: How ecologists define drought, and why we should do better, Glob. Change Biol., 25, 3193–3200, 2019.
Spinoni, J., Barbosa, P., Bucchignani, E., Cassano, J., Cavazos, T., Cescatti, A., Christensen, J. H., Christensen, O. B., Coppola, E., Evans, J. P., Forzieri, G., Geyer, B., Giorgi, F., Jacob, D., Katzfey, J., Koenigk, T., Laprise, R., Lennard, C. J., Kurnaz, M. L., Li, D., Llopart, M., McCormick, N., Naumann, G., Nikulin, G., Ozturk, T., Panitz, H. J., da Rocha, R. P., Solman, S. A., Syktus, J., Tangang, F., Teichmann, C., Vautard, R., Vogt, J. V., Winger, K., Zittis, G., and Dosio, A.: Global exposure of population and land-use to meteorological droughts under different warming levels and SSPs: A CORDEX-based study, Int. J. Climatol., 41, 6825–6853, 2021.
Stagge, J. H., Kingston, D. G., Tallaksen, L. M., and Hannah, D. M.: Observed drought indices show increasing divergence across Europe, Sci. Rep., 7, 14045, https://doi.org/10.1038/s41598-017-14283-2, 2017.
Stahl, K., Kohn, I., Blauhut, V., Urquijo, J., De Stefano, L., Acácio, V., Dias, S., Stagge, J. H., Tallaksen, L. M., Kampragou, E., Van Loon, A. F., Barker, L. J., Melsen, L. A., Bifulco, C., Musolino, D., de Carli, A., Massarutto, A., Assimacopoulos, D., and Van Lanen, H. A. J.: Impacts of European drought events: insights from an international database of text-based reports, Nat. Hazards Earth Syst. Sci., 16, 801–819, https://doi.org/10.5194/nhess-16-801-2016, 2016.
Tomas-Burguera, M., Vicente-Serrano, S. M., Peña-Angulo, D., Domínguez-Castro, F., Noguera, I., and El Kenawy, A.: Global Characterization of the Varying Responses of the Standardized Precipitation Evapotranspiration Index to Atmospheric Evaporative Demand, J. Geophys. Res.-Atmos., 125, e2020JD033017, https://doi.org/10.1029/2020JD033017, 2020.
Tonetto, J. L., Pique, J. M., Fochezatto, A., and Rapetti, C.: Economic Impact of Droughts in Southern Brazil, a Duration Analysis, Climate, 12, 186, https://doi.org/10.3390/cli12110186, 2024.
Urquijo, J. and De Stefano, L.: Perception of Drought and Local Responses by Farmers: A Perspective from the Jucar River Basin, Spain, Water Resour. Manag., 30, 577–591, https://doi.org/10.1007/s11269-015-1178-5, 2016.
Van Loon, A. F. and Laaha, G.: Hydrological drought severity explained by climate and catchment characteristics, J. Hydrol., 526, 3–14, 2015.
Van Loon, A. F., Kchouk, S., Matanó, A., Tootoonchi, F., Alvarez-Garreton, C., Hassaballah, K. E. A., Wu, M., Wens, M. L. K., Shyrokaya, A., Ridolfi, E., Biella, R., Nagavciuc, V., Barendrecht, M. H., Bastos, A., Cavalcante, L., de Vries, F. T., Garcia, M., Mård, J., Streefkerk, I. N., Teutschbein, C., Tootoonchi, R., Weesie, R., Aich, V., Boisier, J. P., Di Baldassarre, G., Du, Y., Galleguillos, M., Garreaud, R., Ionita, M., Khatami, S., Koehler, J. K. L., Luce, C. H., Maskey, S., Mendoza, H. D., Mwangi, M. N., Pechlivanidis, I. G., Ribeiro Neto, G. G., Roy, T., Stefanski, R., Trambauer, P., Koebele, E. A., Vico, G., and Werner, M.: Review article: Drought as a continuum – memory effects in interlinked hydrological, ecological, and social systems, Nat. Hazards Earth Syst. Sci., 24, 3173–3205, https://doi.org/10.5194/nhess-24-3173-2024, 2024.
Van Schmidt, N., Wilson, T., Flint, L., and Langridge, R.: Trade-offs in adapting to changes in climate, land use, and water availability in California, Ecol. Soc., 28, 9, https://doi.org/10.5751/ES-14261-280409, 2023.
Vargas, J. and Paneque, P.: Challenges for the Integration of Water Resource and Drought-Risk Management in Spain, Sustainability, 11, 308, https://doi.org/10.3390/su11020308, 2019.
Vicente-Serrano, S. M.: Foreword: Drought complexity and assessment under climate change conditions, Cuadernos de Investigación Geográfica, 42, 7–11, 2016.
Vicente-Serrano, S. M. and López-Moreno, J. I.: The influence of atmospheric circulation at different spatial scales on winter drought variability through a semi-arid climatic gradient in Northeast Spain, Int. J. Climatol., 26, 1427–1453, 2006.
Vicente-Serrano, S. M., Beguería, S., and López-Moreno, J. I.: A multiscalar drought index sensitive to global warming: The Standardized Precipitation Evapotranspiration Index, J. Climate, 23, 1696–1718, https://doi.org/10.1175/2009JCLI2909.1, 2010.
Vicente-Serrano, S. M., Lopez-Moreno, J.-I., Beguería, S., Lorenzo-Lacruz, J., Sanchez-Lorenzo, A., García-Ruiz, J. M., Azorin-Molina, C., Morán-Tejeda, E., Revuelto, J., Trigo, R., Coelho, F., and Espejo, F.: Evidence of increasing drought severity caused by temperature rise in southern Europe, Environ. Res. Lett., 9, 044001, https://doi.org/10.1088/1748-9326/9/4/044001, 2014.
Vicente-Serrano, S. M., Tomas-Burguera, M., Beguería, S., Reig, F., Latorre, B., Peña-Gallardo, M., Luna, M. Y., Morata, A., and González-Hidalgo, J. C.: A High-Resolution Dataset of Drought Indices for Spain, Data, 2, 22, 2017a.
Vicente-Serrano, S. M., Zabalza-Martínez, J., Borràs, G., López-Moreno, J. I., Pla, E., Pascual, D., Savé, R., Biel, C., Funes, I., Azorin-Molina, C., Sanchez-Lorenzo, A., Martín-Hernández, N., Peña-Gallardo, M., Alonso-González, E., Tomas-Burguera, M., and El Kenawy, A.: Extreme hydrological events and the influence of reservoirs in a highly regulated river basin of northeastern Spain, Journal of Hydrology: Regional Studies, 12, 13–32, https://doi.org/10.1016/j.ejrh.2017.01.004, 2017b.
Vicente-Serrano, S. M., McVicar, T. R., Miralles, D. G., Yang, Y., and Tomas-Burguera, M.: Unraveling the influence of atmospheric evaporative demand on drought and its response to climate change, WIREs Climate Change, 11, e632, https://doi.org/10.1002/wcc.632, 2020.
Vicente-Serrano, S. M., Pena-Angulo, D., Murphy, C., Lopez-Moreno, J. I., Tomas-Burguera, M., Dominguez-Castro, F., Tian, F., Eklundh, L., Cai, Z., Alvarez-Farizo, B., Noguera, I., Camarero, J. J., Sanchez-Salguero, R., Gazol, A., Grainger, S., Conradt, T., Boincean, B., and El Kenawy, A.: The complex multi-sectoral impacts of drought: Evidence from a mountainous basin in the Central Spanish Pyrenees, Sci. Total Environ., 769, 144702, https://doi.org/10.1016/j.scitotenv.2020.144702, 2021.
Vicente-Serrano, S. M., Pena-Angulo, D., Begueria, S., Dominguez-Castro, F., Tomas-Burguera, M., Noguera, I., Gimeno-Sotelo, L., and El Kenawy, A.: Global drought trends and future projections, Philos. T. R. Soc. A, 380, 20210285, https://doi.org/10.1098/rsta.2021.0285, 2022.
Vicente-Serrano, S. M., Reig, F., Beguería, S., El-Kenawy, A., Domínguez-Castro, F., Franquesa, M., Gimeno-Sotelo, L., Adell-Michavilla, M., Halifa-Marín, A., Noguera, I., Andres-Martin, M., Azorin-Molina, C., Crespillo, A., and Pérez-Pajuelo, D.: An Optimal and Flexible Approach for Drought Quantification Based on Standardised Indices, Int. J. Climatol., 45, e8906, https://doi.org/10.1002/joc.8906, 2025.
Walker, D. W., Oliveira, J. L., Cavalcante, L., Kchouk, S., Ribeiro Neto, G., Melsen, L. A., Fernandes, F. B. P., Mitroi, V., Gondim, R. S., Martins, E. S. P. R., and van Oel, P. R.: It's not all about drought: What “drought impacts” monitoring can reveal, Int. J. Disast. Risk Re., 103, 104338, https://doi.org/10.1016/j.ijdrr.2024.104338, 2024.
Wang, J., Castelletti, A., Madruga De Brito, M., and Pernici, B.: Drought perceived impacts via text mining of social media, Environmental Research: Water, 1, 045007, https://doi.org/10.1088/3033-4942/ae2e37, 2025.
Wang, T. and Sun, F.: Socioeconomic exposure to drought under climate warming and globalization: The importance of vegetation-CO2 feedback, Int. J. Climatol., 43, 5778–5796, 2023.
Wang, Y., Lv, J., Hannaford, J., Wang, Y., Sun, H., Barker, L. J., Ma, M., Su, Z., and Eastman, M.: Linking drought indices to impacts to support drought risk assessment in Liaoning province, China, Nat. Hazards Earth Syst. Sci., 20, 889–906, https://doi.org/10.5194/nhess-20-889-2020, 2020.
Welsh, L. W., Endter-Wada, J., Downard, R., and Kettenring, K. M.: Developing Adaptive Capacity to Droughts: the Rationality of Locality, Ecol. Soc., 18, 7, https://doi.org/10.5751/ES-05484-180207, 2013.
Wijitkosum, S.: Integrated spatial analysis of drought risk factors using agglomerative hierarchical clustering and correlation, Environmental Advances, 21, 100646, https://doi.org/10.1016/j.envadv.2025.100646, 2025.
Woodhouse, C. A., Pederson, G. T., Morino, K., McAfee, S. A., and McCabe, G. J.: Increasing influence of air temperature on upper Colorado River streamflow, Geophys. Res. Lett., 43, 2174–2181, 2016.
Wu, J., Yang, Y., Yin, G., Zhao, J., Ding, T., and Zhao, W.: Greening Nonlinearly Intensifies Drought Impacts on Grasslands of the Qinghai-Tibet Plateau, Glob. Change Biol., 31, e70532, https://doi.org/10.1111/gcb.70532, 2025.