
the Creative Commons Attribution 4.0 License.
the Creative Commons Attribution 4.0 License.
 | 02 Oct 2026
A quantitative methodology for analysing physical damage and recovery dynamics from concurrent and consecutive hazards: forensic insights from Puerto Rico
Alessandro Borre

Daria Ottonelli
Eva Trasforini
Tatiana Ghizzoni
Roberto Rudari
Giacomo Zoppi
Giorgio Boni
Silvia De Angeli
Space and time play a crucial role in multi-hazard impact assessment. When two or more natural hazards occur simultaneously or in sequence at the same location, the physical integrity of assets and infrastructures can be compromised, and the resulting damage can be greater than that generated by individual hazards occurring in isolation. Despite widespread conceptual recognition of these interactions, the literature lacks quantitative, standardised methods for the systematic analysis of multi-hazard impacts. This study presents a quantitative methodology for evaluating multi-hazard physical damage to the built environment, translating qualitative impact dynamics into a transparent and reproducible analytical framework, implemented as modular Python code. The approach covers both concurrent and consecutive hazards by modelling: (i) the increased damage resulting from the combined impact of two or more concurrent hazards that overlap in space and time, and (ii) the effects of cumulative damage on asset vulnerability and the recovery dynamics in the case of consecutive hazards that overlap in space. Using the Python implementation, a model behaviour analysis is conducted to systematically explore how variations in inter-event time intervals, vulnerability interactions, and recovery trajectories affect cumulative physical damage. The methodology is applied to a real multi-hazard sequence in Puerto Rico, including the concurrent wind and flood impacts of Hurricane Maria and the consecutive seismic impacts of the 2019–2020 earthquake sequence. The reconstruction of past damage dynamics highlights that ignoring residual hurricane damage would significantly underestimate the subsequent earthquake losses, and that damage accumulation is path-dependent, strongly influenced by event timing and recovery processes. By providing a generalised, transparent, and reproducible quantitative structure, this study offers a tool for forensic analysis of past multi-hazard events, systematic exploration of damage drivers, and scenario-based assessment of alternative hazard and recovery conditions, supporting both post-disaster learning and planning-oriented applications.
- Article
(4632 KB) - Full-text XML
- BibTeX
- EndNote


In recent years, increasing attention from the scientific community and international frameworks has been drawn to multi-(hazard)-risk assessment and management (Ward et al., 2022). There has been a growing acknowledgement that natural hazard events may occur simultaneously, in cascade, or cumulatively over time, and can interplay with societal factors such as exposure and vulnerability, to generate complex multi-risk disaster scenarios (de Ruiter et al., 2020; de Ruiter and van Loon, 2022). These compound events, such as heavy rainfall and extreme wind from the same convective storm (e.g., Tilloy et al., 2022), cascading events such as earthquakes triggering tsunamis (e.g., Mimura et al., 2011), or even consecutive independent events, can generate an impact that is different from that of individual hazards occurring in isolation (Gill and Malamud, 2014). Moreover, in an increasingly interconnected world, natural hazards' impacts cascade across geographical and sectoral boundaries, leading to considerable challenges for disaster risk managers, including emergency management agencies, asset managers, and operators of critical infrastructures and lifelines (Hochrainer-Stigler et al., 2023; Pasino et al., 2021). Although more complex, approaches that account for multiple hazards and their interconnections better capture the real risk many areas of the world are exposed to and can support the definition of effective disaster risk reduction (Kappes et al., 2012).
In contrast to single-hazard risks, the multi-risk assessment poses a series of challenges at each step of the risk or impact assessment, from the hazard modelling to the vulnerability characterisation, until the final risk or impact assessment (Kappes et al., 2012; De Angeli et al., 2022). Although significant improvements have been made in developing approaches that can identify and quantify interrelationships between hazards (Tilloy et al., 2019), as well as understanding their spatial and temporal overlap dynamics (Claassen et al., 2023), the quantification of impacts arising from multiple hazards and the development of generalised models for assessing multi-hazard physical damage remain a partially unexplored domain (Gentile et al., 2022). Several conceptual frameworks offer qualitative descriptions of multi-hazard impact interactions, as well as schematic representations of their temporal dynamics in the form of graphs and conceptual schemes, such as those proposed by de Ruiter et al. (2020), De Angeli et al. (2022), and Wenzel et al. (2026). These frameworks also identify key factors that can influence the magnitude of impacts, such as spatial overlap, the time window between successive events, and the recovery dynamics of the impacted elements, among others. Specifically, in the case of consecutive events, the impacts of an earlier event are likely to change the vulnerability at the time of the next event (de Ruiter and van Loon, 2022). In addition, recovery of vulnerability to pre-disaster conditions after the event ended plays a key role. Societies and systems that recover quickly from disasters become less vulnerable to the next event than societies that follow a slower recovery path (Di Baldassarre et al., 2018).
Nevertheless, there remains a lack of studies that attempt to translate these considerations into a quantitative formulation and move towards their quantification. The majority of available multi-hazard physical impact quantitative models are seismic-related models, i.e., models where at least one of the two considered hazards is an earthquake, and focus on specific critical infrastructures, such as bridges (Gentile et al., 2022). Furthermore, modelling of the recovery process remains a significant challenge (Mohammadi et al., 2024). Most of the damage models currently used do not address the temporal dimension of post-disaster loss and recovery or treat it in a simplistic fashion (Miles and Chang, 2006; Sarker and Lester, 2019). Very little research has been conducted on how recovery proceeds over time (e.g., Cimellaro et al., 2010; Loos et al., 2023), or on the social and economic factors that affect the recovery process (e.g., Miles et al., 2019; Koliou et al., 2020; Hariri-Ardebili et al., 2022). Consequently, a deeper understanding of how these factors affect cumulative multi-hazard impacts is still lacking.
This paper aims to bridge this gap by providing a structured quantitative methodology that translates conceptual representations of multi-hazard damage dynamics into an explicit and reproducible analytical structure. To this end, compound and consecutive impact dynamics described graphically and schematically by de Ruiter et al. (2020) and De Angeli et al. (2022) are reformulated into a compact mathematical expression and implemented as a modular Python code. This formulation enables explicit representation of inter-event time intervals, state-dependent vulnerability interactions, and recovery trajectories within a unified structure. Using this implementation, a model behaviour analysis is conducted to systematically investigate how these key parameters influence compound and cumulative physical damage in a multi-hazard context. Although such mechanisms are widely acknowledged qualitatively in the literature, they are rarely modelled in quantitative terms within a single coherent framework.
The primary contribution of this work, therefore, lies in offering a reproducible analytical template that supports systematic exploration of multi-hazard damage interactions and facilitates structured post-disaster interpretation and learning. This post-disaster detailed reconstruction of damage dynamics is referred to in the following as a “forensic” approach. Beyond reconstructing past events, the proposed methodology can also support anticipatory and scenario-based analyses, enabling exploration of how cumulative multi-hazard damage may evolve under alternative assumptions, such as different recovery pathways or inter-event intervals.
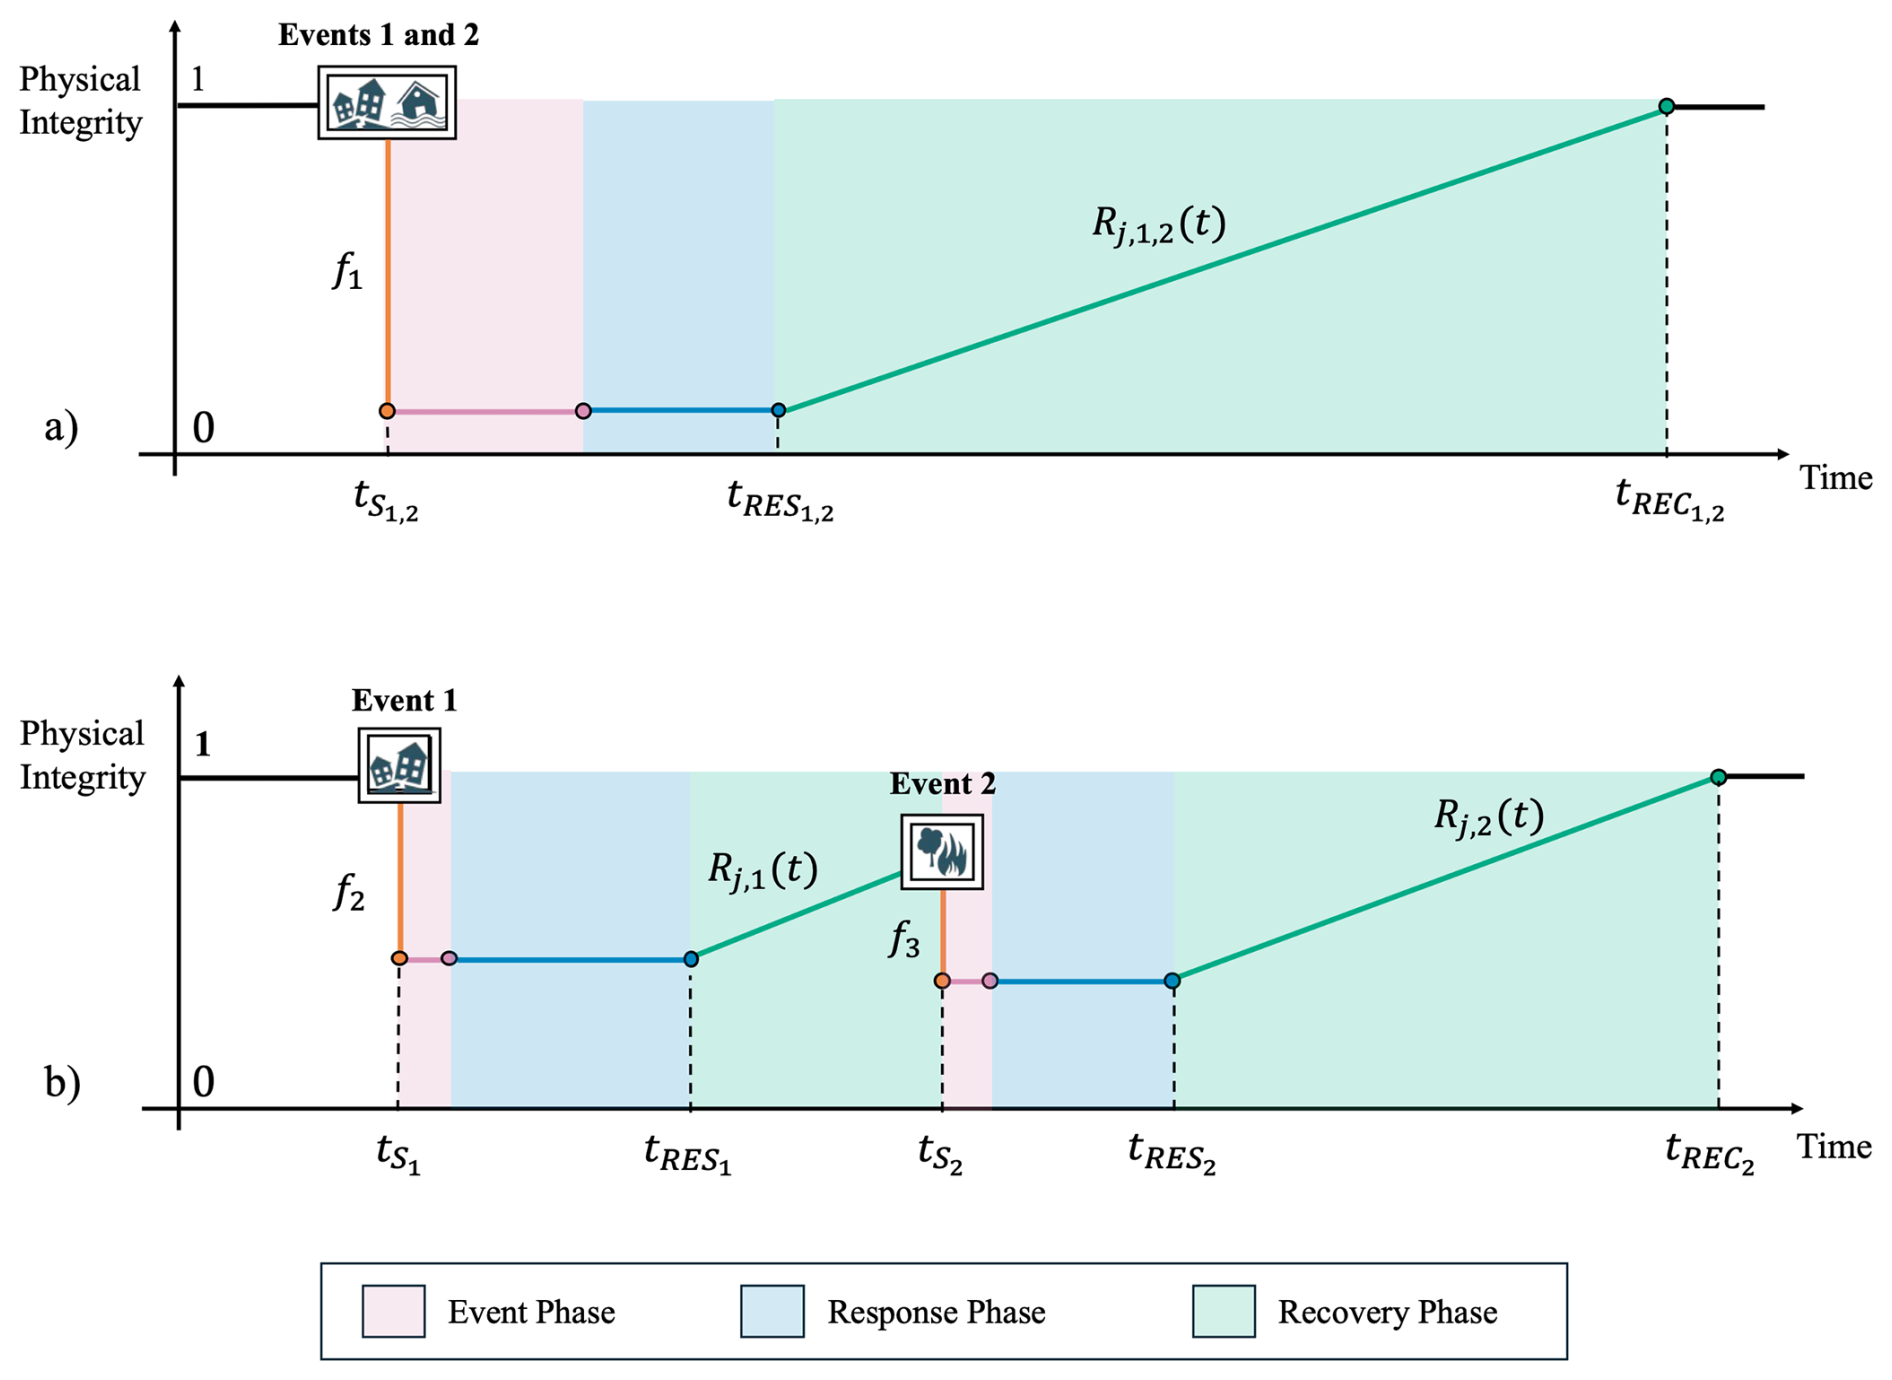
Figure 1Variation of physical integrity over time for concurrent and consecutive multi-hazard impact dynamics. (a) The impacts are concurrent. The second event in temporal order affects the asset during the response phase of the previous one. The second impact and the preceding one are considered simultaneous. The loss of physical integrity is the amplified combination of the two stressors. Details in Sect. 2.1. (b) The impacts are consecutive. The second event in temporal order affects the asset during the long-term recovery phase of the previous one. Details in Sect. 2.2.
The proposed approach is then applied to a real multi-hazard sequence in Puerto Rico from a forensic perspective. In this application, the multi-hazard damage model is used to reconstruct and interpret the evolution of direct physical damage following Hurricane Maria and the subsequent seismic sequence, illustrating how residual vulnerability and incomplete recovery shape cumulative impacts. The case study, therefore, serves as a demonstration of how the proposed quantitative structure can support post-disaster analysis and learning in complex multi-hazard contexts.
This paper is organised as follows. Section 2 presents the structured quantitative methodology for analysing multi-hazard damage dynamics, beginning with the mathematical formulation of the damage model and followed by the analysis of model behaviour. Section 3 illustrates the forensic application of the approach to a real-world case study in Puerto Rico, addressing the concurrent wind and flood impacts of Hurricane Maria and the consecutive impacts of the 2019–2020 seismic sequence. Finally, Sect. 4 discusses limitations and future developments, and Sect. 5 summarises the main conclusions.
Based on the works by de Ruiter et al. (2020) and De Angeli et al. (2022), two main multi-hazard impact dynamics can be identified: (i) concurrent impacts, generated by hazards which either completely or partially overlap in space and time; (ii) consecutive impacts, generated when spatially overlapping hazards occur close enough in time that the assets do not have sufficient time to completely recover before the onset of the second hazard. These two dynamics are qualitatively depicted in Fig. 1, using physical integrity as an impact variable. The physical integrity yj(t) of an asset j is related to its physical damage dj(t) by the relationship:
yj(t)=1 indicates no impact on the element's physical integrity and yj(t)=0 represents complete destruction.
Concurrent impacts result from two hazard events that overlap in space and time, either completely or partially. The second event occurs simultaneously with the first or during its response phase, so recovery has not yet begun when the second event occurs. Real-world examples include the 2018 events in Indonesia, where a 7.5 magnitude earthquake in Sulawesi triggered a tsunami, causing extensive coastal damage (Sabah and Sil, 2023; Naik et al., 2023; Opabola et al., 2023). Another example, which does not involve causal relationships between events, is the 2013 earthquake in the Philippines, followed by a typhoon before recovery from the earthquake had begun (Lagmay and Eco, 2014; Lagmay et al., 2015). In such scenarios, the impacts of both events combine and affect the asset. The primary challenge is to quantitatively assess the overall amplification of physical damage caused by the superimposition of multiple loads (De Angeli et al., 2022).
Consecutive impacts occur when hazard events that spatially overlap occur close enough in time that assets do not have sufficient time to completely recover before the onset of the second hazard. Real-world examples include the sequence of earthquakes and floods in Nepal in 2015. An earthquake with a magnitude of 8.0 struck Nepal in April 2015, causing significant structural and non-structural damage. The region was then hit by heavy rains and floods in 2017 (Gautam and Dong, 2018). Recovery and reconstruction documents (He et al., 2018; Liu et al., 2021) show that the floods affected structures and areas still recovering from the previous earthquake. Another example is Hurricane Irma and Maria, which devastated Puerto Rico in 2017, followed by an earthquake in the same area two years later. This case is analysed in detail in Sect. 3. The main challenge with consecutive impacts is to estimate residual damage based on the asset's recovery dynamics and to understand how the residual damage influences vulnerability to the subsequent hazard (De Angeli et al., 2022).
To enable the quantitative investigation of compound and consecutive impacts, the dynamics graphically described in Fig. 1 are translated into a compact and easily implementable mathematical formulation, as presented in Appendix A. This generalised piecewise defined function allows the estimation of relative damage over time to an asset or infrastructure j exposed to n natural hazards. The behaviour of the function is controlled by the parameters Θ and μ, defined by Eqs. (A5) and (A6) in Appendix A. Depending on the values assumed by the parameters, the formulation represents different multi-hazard impact dynamics:
-
If Θ=0, the function models concurrent impacts, i.e., damage caused by hazards that overlap in space and time, either fully or partially.
-
If Θ=1 and μ=0, it models consecutive impacts, where spatially overlapping hazards occur close enough in time that the asset has insufficient time to fully recover before the second hazard occurs.
If Θ=1 and μ=1, the impacts are treated as independent, allowing the function to perform a series of single-hazard damage assessments without incorporating any multi-hazard interactions. The detailed formulation of the two multi-hazard impact dynamics, concurrent and consecutive, is presented in Sect. 2.1 and 2.2, respectively. The formulation for independent impacts is provided in Appendix A1.
The generalised formulation is implemented in Python to enable reproducible and modular multi-hazard damage assessments. The implementation follows directly the mathematical structure described in Appendix A, where event classification (concurrent, consecutive, independent) is determined dynamically through the parameters Θ and μ, and damage evolution is computed at the asset level across discrete time steps. Within the tool, recovery functions Rj,i(t) are explicitly defined as time-dependent functions (linear, exponential, logistic, or user-defined), allowing different durations and restoration trajectories depending on asset type and contextual assumptions. After each hazard event, the state of the asset is updated by storing residual damage, which subsequently modifies the vulnerability function applied to the next event in the case of consecutive impacts. This ensures consistency between recovery progression and state-dependent fragility adaptation.
The framework is modular in structure: hazard inputs, exposure data, fragility curves, and recovery assumptions are treated as interchangeable components. This design allows users to test alternative recovery trajectories, introduce modified fragility parameters, or simulate different event sequences without altering the core computational logic. While the present study applies the implementation for model behaviour analysis and forensic validation in Puerto Rico, the structure supports broader scenario-based applications and integration with external hazard workflows. Full implementation details and data access are provided in section “Code and data availability” in the backmatter.
2.1 Concurrent impact dynamics
Direct physical damage over time t to an asset or infrastructure j caused by two concurrent impacts, as graphically represented in Fig. 1a can be calculated according to Eq. (2).
with
According to Eq. (2), at any time t between the start of the first hazard event and the end of the response phase of the multi-hazard event , asset j experiences a level of damage equal to f1. After the response phase of the multi-hazard event concludes (i.e., for ), the asset begins to recover from the concurrent impacts according to the recovery function , until .
Equation (3) represents the damage model used to quantify the effects of two concurrent hazards, referred to as the “concurrent damage model.” This model assesses the combined impact of both hazards on asset performance. In the literature, concurrent damages are typically evaluated using bivariate vulnerability or fragility functions. Accordingly, the model is expressed as , where the resulting damage depends on the maximum intensity of each hazard event, h1,max and h2,max. Gentile et al. (2022) classifies this approach as a “vector-valued fragility model.” Bivariate vulnerability functions have been applied in single-hazard scenarios, such as assessing flood damage considering both flow velocity and duration (Elmer et al., 2010; Nofal and van de Lindt, 2020; Ming et al., 2015), and in multi-hazard contexts, such as hurricanes, where structural impacts are evaluated by combining the effects of coastal surges and wind forces (Do et al., 2020; Nofal et al., 2021). However, there are instances where concurrent damages are calculated using “state-dependent fragility models” (Gentile et al., 2022), where the fragility of an asset to a secondary hazard is conditional on its damage state after the primary hazard. This approach is applied, for example, to assess the impacts of an earthquake-tsunami combination, where the fragility curve for the post-shock tsunami depends on the earthquake-induced damage (Xu et al., 2021; Gómez Zapata et al., 2023).
2.2 Consecutive impact dynamics
Direct physical damage over time t to an asset or infrastructure j caused by two consecutive impacts is calculated according to Eq. (4).
with
According to Eq. (4), at time , due to the impact of the first hazard event, the asset j experiences a level of damage equal to f2. Equation (5) represents a single hazard damage model (e.g., a depth-damage curve for floods or a fragility curve for earthquakes), as a function of the maximum intensity of the hazard events h1,max. After the response phase of the first event is complete (that is, for ), the asset begins to recover from the impacts of a single danger according to the recovery function Rj,1(t). At time , the asset is still recovering from the previous hazard event when it is impacted by a second event. The damage caused by this consecutive event is expressed as . This expression accounts for the sum of the residual damage at time , denoted by , and the additional damage from the second event, which is calculated as the percentage damage caused by the second event, represented by f3, applied to the remaining undamaged portion of the asset, i.e., . This approach prevents the double-counting of damage. After the response phase of the second event concludes (i.e., for ), the asset begins to recover from the consecutive impacts according to the recovery function Rj,2(t), until . This evolution of damage over time, as described in Eq. (4), is graphically represented in Fig. 1b.
Equation (6) represents the damage model used to quantify the effects of two consecutive impacts, known as the “consecutive damage model”. This model is based on a “state-dependent fragility model” (Gentile et al., 2022), denoted as . It defines the fragility or vulnerability of an asset to a secondary hazard, conditional on the asset's residual damage state due to incomplete recovery. The resulting damage is a function of the maximum intensity of the second hazard h2,max and the residual damage to the asset calculated at according to the recovery function of the asset. State-dependent fragility models are relatively scarce in the literature and are mainly developed within the seismic field to assess the effects of a primary event followed by aftershocks on an already weakened asset (Li et al., 2014; Aljawhari et al., 2021). Another application in the seismic domain involves evaluating the worsening condition of assets, often bridges, due to factors like time and corrosion. In this scenario, the primary seismic event impacts an asset in a deteriorated state, resulting in increased damage (Otárola et al., 2022).
2.3 Model behaviour under consecutive multi-hazard impact dynamics
To investigate the internal mechanics of the proposed formulation under consecutive multi-hazard dynamics, a model behaviour analysis is conducted via a structured parameter influence assessment. The objective is to examine how the mechanisms embedded in Eq. (4) generate additional cumulative damage relative to the independent baseline configuration. Therefore, the analysis isolates the endogenous amplification effects arising from the interaction between residual damage, recovery progression, and state-dependent vulnerability.
The investigation focuses on consecutive interactions because their cumulative effects emerge over time as each hazard occurs sequentially. In consecutive events, residual damage and evolving vulnerability modify the response to subsequent loading, producing additional loss amplification through the damage-state update term in Eq. (4) and the state-dependent vulnerability function in Eq. (6). In contrast, concurrent impacts are captured directly by the bivariate damage function in Eq. (2), which defines the combined effect of simultaneous hazards at a single time step. Since concurrent effects are already structurally integrated into the formulation, the analysis concentrates on consecutive interactions to isolate and quantify the unique mechanisms driving cumulative damage across sequential events.
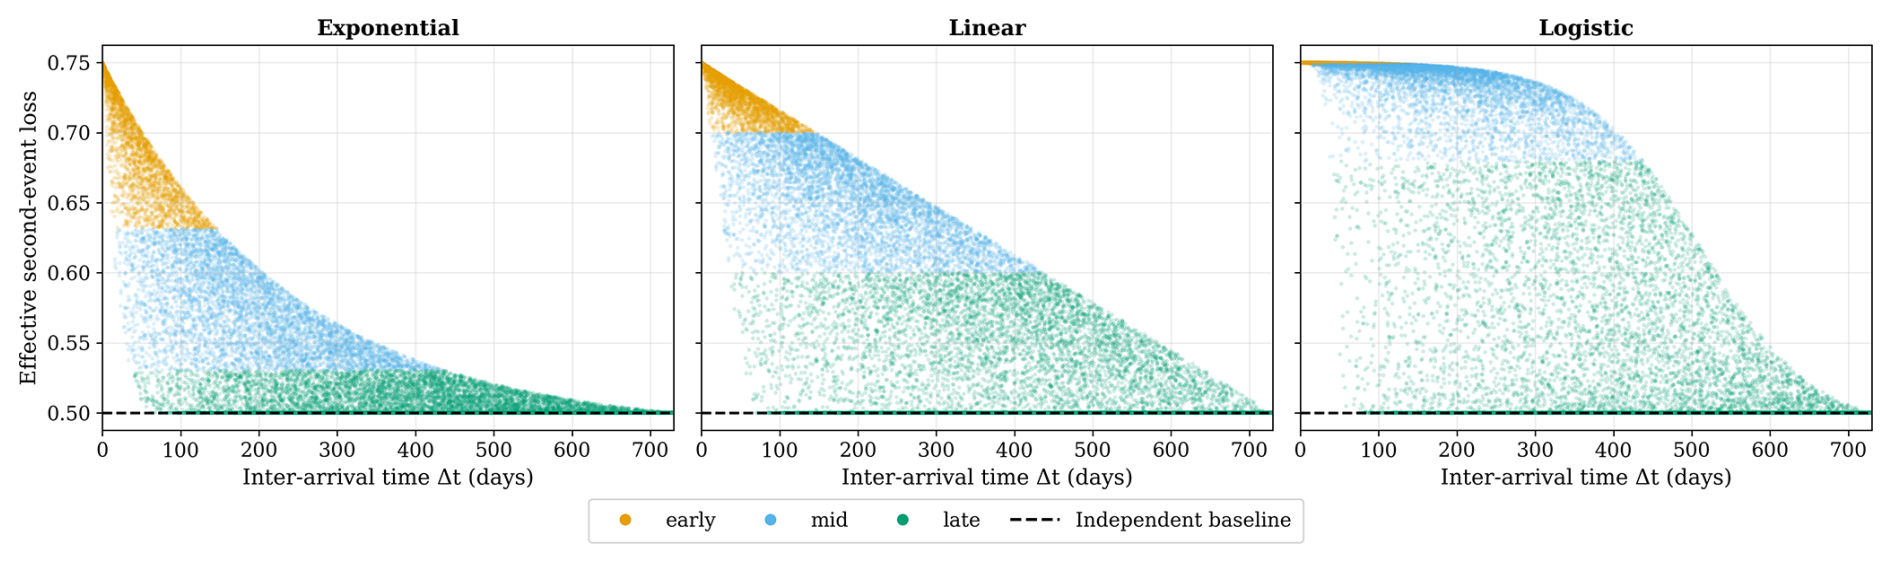
Figure 2Additional cumulative loss as a function of inter-arrival time (Δt) under exponential, linear, and logistic recovery assumptions. The dashed line represents the independent baseline.
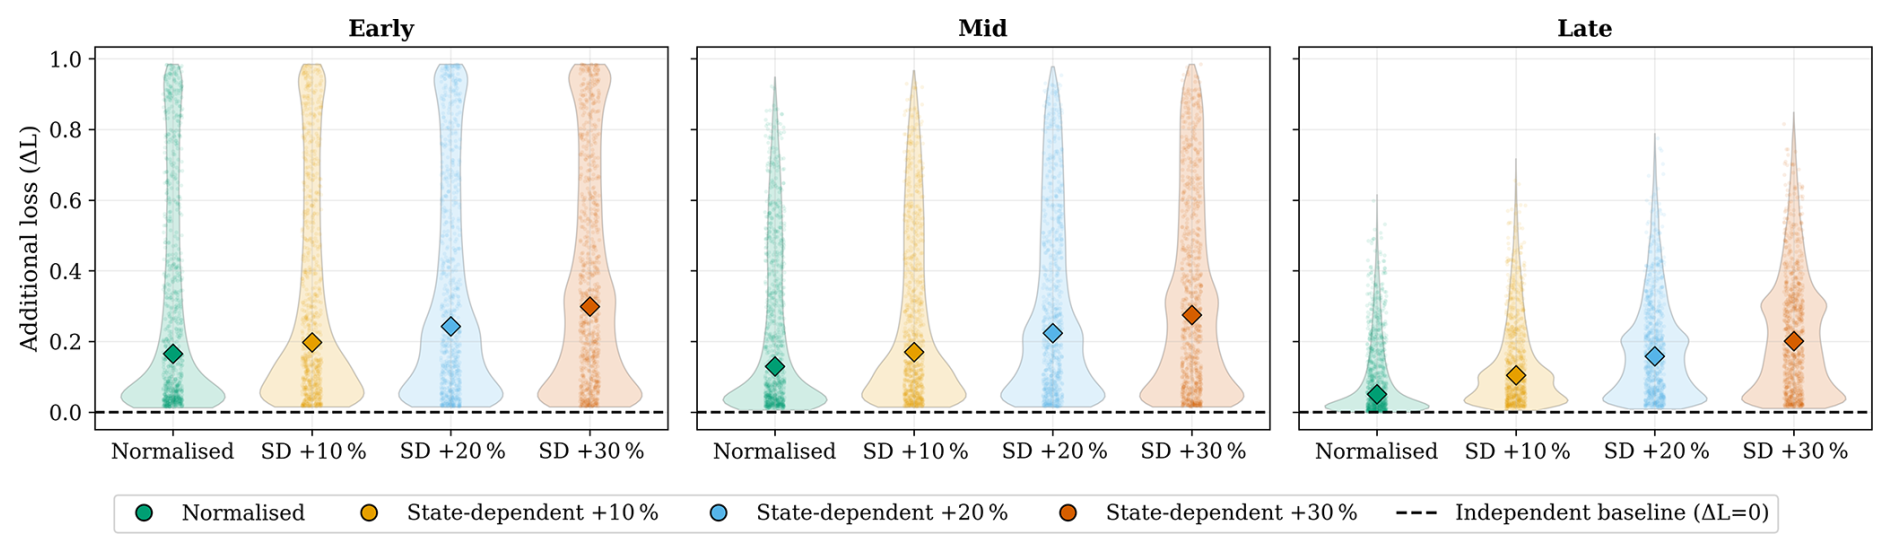
Figure 3Distribution of additional cumulative loss (ΔL) under increasing state-dependent vulnerability modification. The dashed line indicates the independent baseline (ΔL=0).
Three parameters are examined, consistent with the conceptual drivers identified by de Ruiter et al. (2020) and De Angeli et al. (2022):
- i.
the inter-event time interval (Δt);
- ii.
the recovery trajectory Rj,1(t);
- iii.
state-dependent modifications of the second-event vulnerability function.
Figure 2 reports additional cumulative loss as a function of Δt under three alternative recovery trajectories: exponential, linear, and logistic. These functional forms, commonly adopted in resilience modelling (Cimellaro et al., 2010; Loos et al., 2023), represent distinct temporal distributions of restoration capacity and therefore different persistence patterns of residual damage.
When the second event occurs during the early recovery phase, cumulative damage substantially exceeds the independent baseline. As Δt increases, additional cumulative loss decreases and asymptotically converges toward independent behaviour. However, both the rate and magnitude of convergence are governed by the functional form of Rj,1(t). Under exponential recovery, rapid early restoration reduces residual damage quickly, limiting amplification. Linear recovery produces intermediate behaviour. Logistic recovery, characterised by delayed early restoration and accelerated later recovery, prolongs vulnerability persistence and sustains elevated amplification over a wider Δt range.
These results show that recovery trajectory assumptions are structurally influential within Eq. (4). The assumed recovery trajectory directly determines how long residual damage persists and, therefore, how likely the second event is to interact with a weakened system. Assuming instantaneous or implicitly complete recovery collapses this mechanism and systematically biases cumulative loss toward additive behaviour.
The second test isolates the contribution of state-dependent vulnerability (Eq. A3). The vulnerability function of the second event is progressively shifted (+10 %, +20 %, +30 %) to represent increasing fragility due to incomplete recovery. Although state-dependent fragility formulations have been explored primarily in seismic contexts (Gentile et al., 2022; Gómez Zapata et al., 2023), they are rarely embedded within a general multi-hazard quantitative structure.
Figure 3 shows that state-dependent vulnerability modification generates convex, non-linear amplification of cumulative damage. Even moderate fragility shifts (+10 %) produce measurable increases in additional loss, while larger shifts (+30 %) substantially increase both median outcomes and upper-tail behaviour. Crucially, amplification does not arise solely from residual damage magnitude, but from the alteration of the fragility profile itself. Through Eq. (A3), incomplete recovery modifies the system's response function, changing the probability structure of damage exceedance. In this sense, consecutive multi-hazard interaction is not merely additive accumulation but a structural reconfiguration of vulnerability between events. The recovery trajectory should not be interpreted as an abstract modelling parameter. Empirical evidence shows that recovery dynamics reflect governance effectiveness, institutional capacity, infrastructure robustness, and socioeconomic conditions (Miles et al., 2019; Koliou et al., 2020; Hariri-Ardebili et al., 2022). At the macro scale, such dimensions can be synthesised through composite recovery capacity indicators, such as the Recovery Gap Index (RGI) (Borre et al., 2025). Lower recovery capacity implies prolonged vulnerability persistence, increasing the likelihood that subsequent hazards interact with residual damage and trigger multiplicative effects.
Overall, the parameter influence analysis shows that cumulative loss in consecutive multi-hazard scenarios depends primarily on three factors: the time interval between events, the speed and shape of recovery, and possible modifications of vulnerability due to residual damage. When the second event occurs after substantial recovery has taken place, total damage remains close to the sum of the two independent events. In contrast, when recovery is incomplete and vulnerability is increased, the second event acts on a weakened system, producing higher cumulative losses than those obtained under independent modelling assumptions. The proposed formulation makes these mechanisms explicit by linking inter-event timing, recovery progression, and vulnerability modification within a single damage function. Rather than assuming that assets fully recover between events, the model allows vulnerability to evolve over time and directly influence subsequent damage estimates. In Sect. 3, this modelling framework is applied to the Puerto Rico disaster sequence, where incomplete recovery and evolving fragility conditions significantly influenced cumulative impacts.
Puerto Rico offers a highly relevant and well-documented case of consecutive multi-hazard interaction, having experienced a sequence of major disasters within a relatively short time window. The impacts of Hurricanes Irma and Maria in 2017 were followed by the 2019–2020 seismic sequence, creating a configuration in which the second hazard occurred during an incomplete recovery phase from the first.
The objective of this section is to apply the proposed quantitative multi-hazard damage formulation to a real disaster sequence to assess its explanatory capacity under empirical conditions. Adopting a forensic perspective, the analysis evaluates whether explicitly modelling residual damage and recovery trajectory, as formalised in Sect. 2.2 and analysed in Sect. 2.3, improves consistency between simulated and officially reported losses. In contrast to independent hazard modelling approaches, the proposed multi-hazard damage model allows vulnerability to evolve dynamically between events through the recovery trajectory Rj,1(t) and state-dependent vulnerability modification. The Puerto Rico sequence provides an empirical setting in which these mechanisms can be evaluated against observed damage outcomes.

Figure 4Representation of Puerto Rico's 2017–2020 disaster sequence. Images, from left to right: (i) Flooded area in Carolina, Puerto Rico, following Hurricane Maria's impact on the island, 29 September 2017. Photo by Sgt. Jose Ahiram Diaz-Ramos. Online image, Flickr. (ii) Severe earthquake damage to a gazebo in a public park in Guánica, Puerto Rico, 11 February 2020. Photo by Liz Roll/FEMA. Online image, NARA & DVIDS Public Domain Archive.
In September 2017, Puerto Rico was struck by Hurricanes Irma and Maria, causing extensive structural damage and infrastructure disruption (Boyle et al., 2022; Cangialosi et al., 2018; Pasch et al., 2023; Fischbach et al., 2020). Hurricane Maria alone resulted in nearly USD 90 billion in damage (FEMA, 2018a; Kishore et al., 2018). Reconstruction progressed unevenly, and by the end of 2019, significant portions of the building stock had not yet been fully restored (GAO, 2024). In January 2020, a magnitude 6.4 earthquake struck the island as part of a broader seismic sequence (Vičič et al., 2021), affecting regions that were still recovering from hurricane-induced damage. This temporal configuration makes Puerto Rico a particularly suitable case for examining the role of residual damage and incomplete recovery in shaping cumulative loss. Figure 4 illustrates the sequence and overlap of the two major types of hazards that affected Puerto Rico during the 2017–2020 period.
Puerto Rico is a densely inhabited island, characterised by a higher concentration of buildings in the San Juan metropolitan area, adjacent northern municipalities, and in the southern region around Ponce. These areas not only host a large share of the residential, commercial, and public infrastructure but also represent key nodes in the island's economic and logistical networks. The multi-hazard damage assessment performed applying our framework focuses on damages to the built-up area, using as input a portfolio of buildings provided by FEMA (2021a). This portfolio was compiled as part of a recent data inventory conducted on the island after Hurricane Maria, and includes the following categories, along with their corresponding estimated replacement values:
-
Residential: ∼ 1.5 × 10⁶ buildings; estimated replacement value ∼ USD 300 billion.
-
Commercial: ∼ 6 × 10³ buildings; estimated value ∼ USD 12 billion.
-
Industrial: ∼ 1 × 10³ buildings; estimated value ∼ USD 2 billion.
-
Educational: ∼ 1.2 × 10³ buildings; estimated value ∼ USD 3 billion.
The analysis is carried out in two phases. In the first phase, the impacts of Hurricane Maria are modelled by implementing a compound damage model (Sect. 2.1) that integrates wind and flood impacts. The central objective of the case study is to assess the damage dynamics associated with the subsequent seismic sequence and its interaction with a partially recovered built environment. Accordingly, the compound damage assessment from the hurricane impact simulation primarily serves to define the post-event damage and recovery status that constitute the input for the consecutive damage model applied to the earthquake phase. The fragility curves used for this phase are those provided by FEMA for the specific context of Puerto Rico (FEMA, 2021b). In the second phase, the consecutive damage model (Sect. 2.2) is applied to simulate the seismic impacts on structures already weakened by hurricane damage. Here, standard fragility curves provided by FEMA are modified ad hoc to capture the changed vulnerability of assets previously affected by the hurricane and still exhibiting residual damage.
Input data includes:
-
Structural parameters: material, type, number of stories, code compliance.
-
Hazard inputs: wind speed, flood depth, spectral acceleration.
-
Vulnerability functions: Hazus-based curves, modified to reflect state dependency.
-
Economic indicators: repair cost per unit area, downtime, and replacement costs.
The results are expressed in terms of physical loss (i.e., reduction in structural integrity) and economic cost.
3.1 Compound hurricane impacts: wind and flood interaction
The 2017 landfall of Hurricane Maria provides a real configuration of concurrent multi-hazard interaction, in which wind and flood hazards overlapped spatially and temporally across Puerto Rico. In this setting, damage amplification arises from the simultaneous action of multiple stressors acting on the same asset during the emergency phase, as formalised in Eq. (2).
Within the proposed damage model, compound hurricane damage is represented through a multi-parameter vulnerability formulation that accounts for the joint influence of peak wind intensity and flood depth under overlapping conditions. In practice, the concurrent formulation integrates standard Hazus wind fragility curves and flood depth-damage functions within the unified structure of Eq. (2). Hazus does not provide an explicit bivariate fragility surface for combined wind–flood loading. Instead, wind- and flood-induced damages are evaluated consistently using the respective Hazus vulnerability components, while their interaction is represented through the concurrent damage operator, which accounts for their temporal and spatial superposition. This approach ensures methodological consistency with the standard Hazus framework while preserving the multi-hazard interaction logic embedded in the proposed formulation.
Vulnerability functions are derived from the FEMA Hazus-MH methodology (FEMA, 2022b). Wind fragility curves are parametrized according to structural typology, construction material, roof anchorage, number of storeys, and code compliance level. Flood damage is represented through depth-damage functions calibrated for different occupancy classes. From a physical standpoint, wind and flood mechanisms are structurally interdependent. High wind speeds induce roof uplift, envelope breach, and cladding failure, increasing structural susceptibility to water ingress. Subsequent or simultaneous inundation accelerates the deterioration of load-bearing and non-structural components. Post-event assessments indicate that buildings exposed to overlapping wind and flood loading experienced repair costs 30 %–40 % higher than buildings exposed to a single hazard (FEMA, 2018b). Field observations further show that flood depths exceeding 1.5 m resulted in near-complete failure of unreinforced masonry structures, particularly where prior wind damage had reduced lateral resistance.
The modelled compound loss for Hurricane Maria is approximately USD 90 billion, consistent with official economic assessments (NOAA National Hurricane Center, 2018). The agreement with reported losses does not result from post-event parameter fitting, but from the direct application of observed hazard intensities and standardised Hazus vulnerability functions within the concurrent formulation. In this phase of the Puerto Rico sequence, vulnerability parameters are not modified between hazards; amplification derives from hazard superposition under overlapping conditions rather than from recovery-mediated fragility evolution. The subsequent seismic sequence, in contrast, introduces a fundamentally different mechanism, where damage persistence and state-dependent vulnerability shifts govern cumulative impacts.
3.2 The recovery process and subsequent seismic impacts
The earthquake sequence that began in late 2019 and culminated in the magnitude 6.4 event on 7 January 2020 struck Puerto Rico at a time when many regions were still in the process of recovering from Hurricane Maria. This temporal overlap between the recovery phase and the occurrence of a new hazard event represents a critical scenario within multi-hazard damage assessment, where pre-existing damage and delayed reconstruction substantially influence the vulnerability landscape.
To spatially contextualise this interaction, Fig. 5 integrates three key spatial data sets: the track of Hurricane Maria (September 2017), the distribution of buildings still damaged as of November 2018 (based on Hazus post-event assessments), and the contours of the peak ground acceleration (PGA) from the January 2020 earthquake. The post-hurricane assessment identified nearly 138 000 buildings in Puerto Rico that had not yet been fully repaired more than a year after the hurricane.
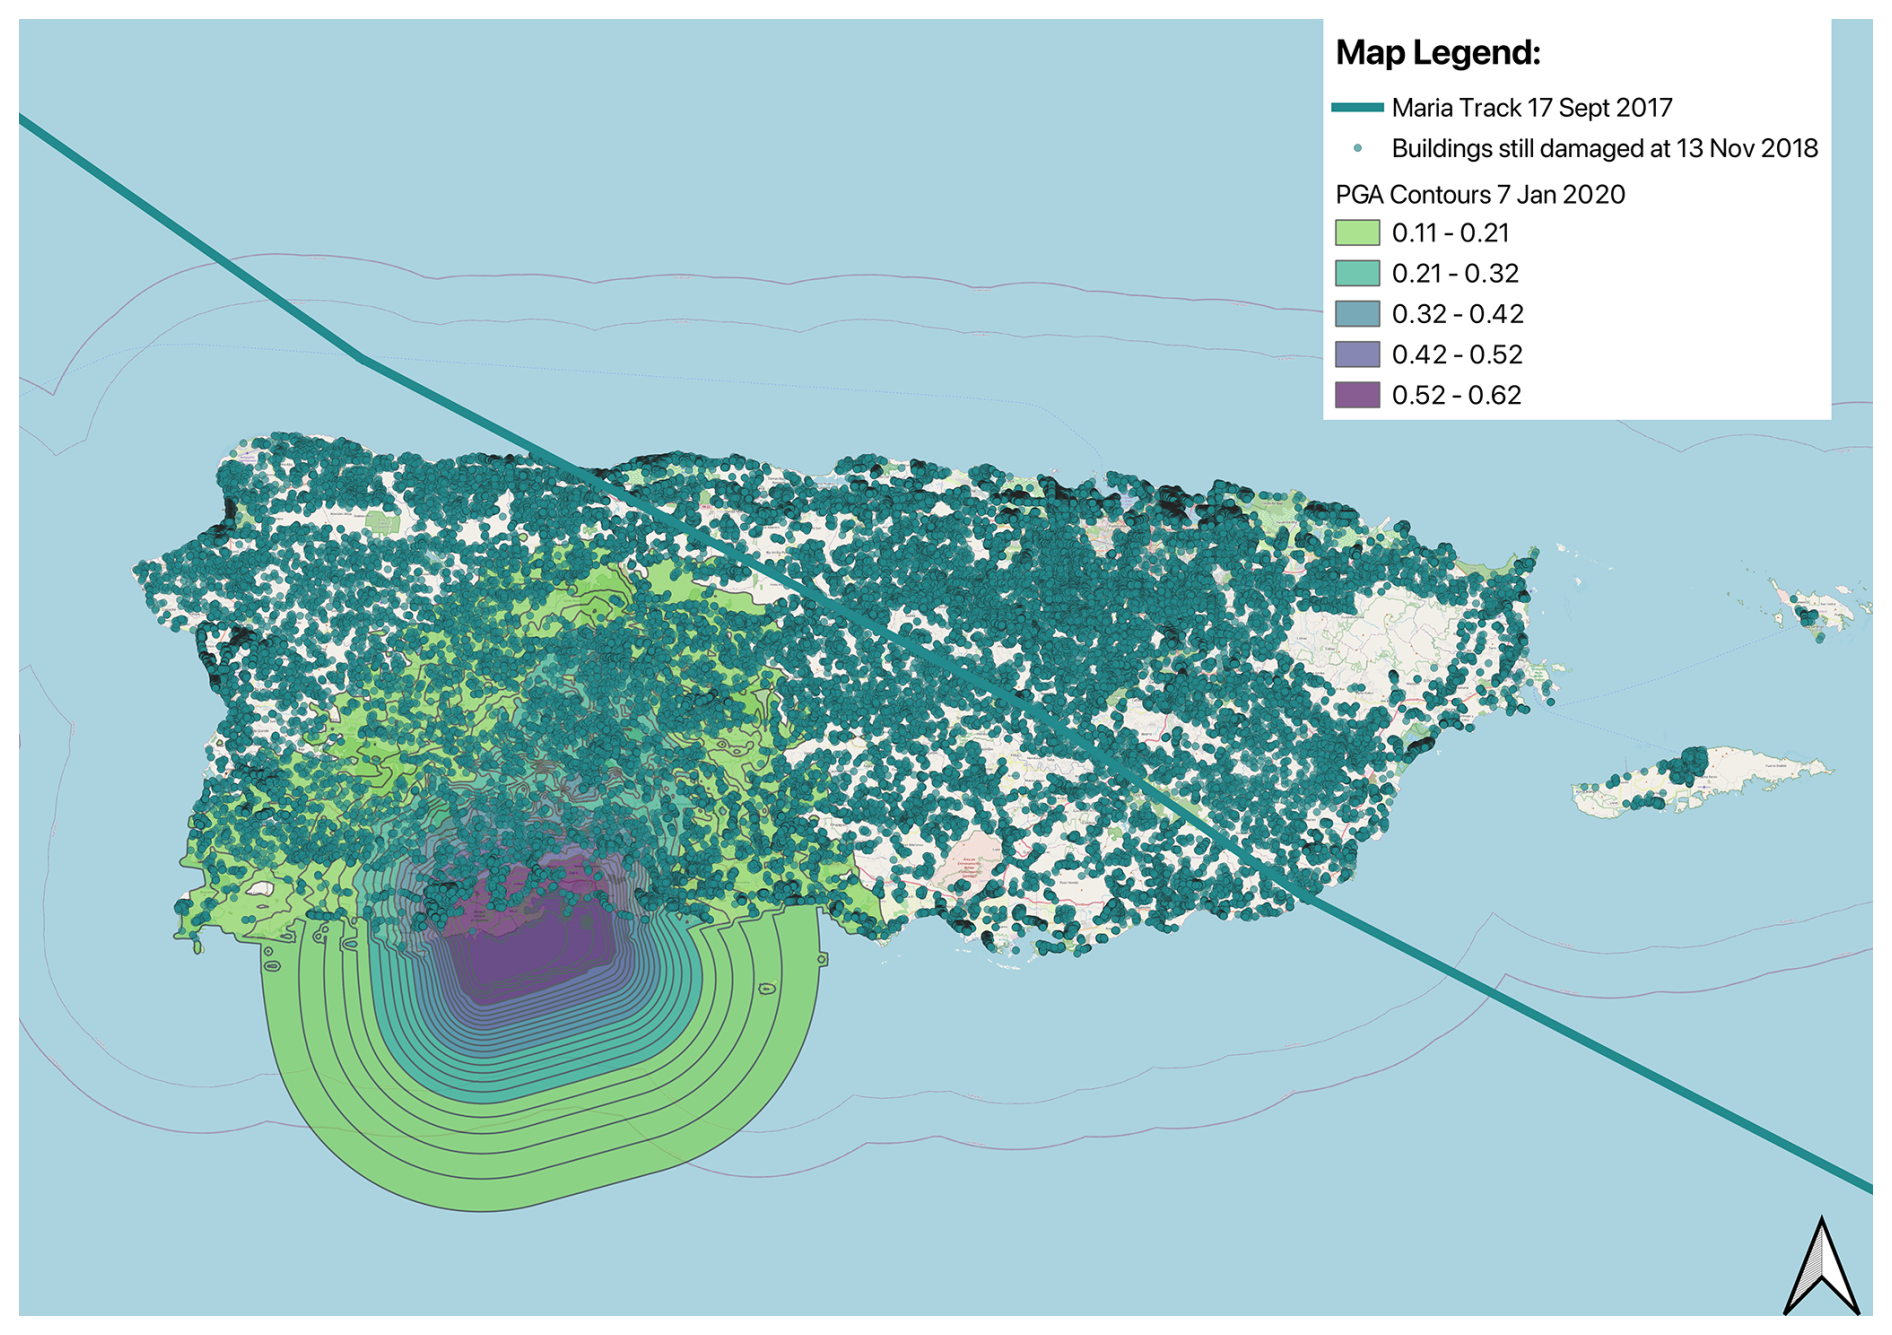
Figure 5Map showing the track of Hurricane Maria (September 2017), the spatial distribution of buildings with remaining hurricane damage (as of November 2018), and PGA [g] contours from the January 2020 earthquake. The map was produced using the FEMA Hazus simulation software.
As illustrated in Fig. 5, many of the damaged buildings were concentrated in coastal and southern municipalities, including regions such as Ponce and Guayanilla, which later experienced the highest levels of ground shaking during the earthquake (PGA > 0.5 g). These areas faced dual exposure, first to high winds and flooding from Hurricane Maria and later to seismic loading from the 2020 event. Residual structural weaknesses, whether due to incomplete reconstruction or substandard repairs, likely increased the risk of damage and collapse.
To model the seismic impacts on the buildings still damaged by the hurricane, a consecutive damage model (Sect. 2.2) is applied. Standard fragility curves provided by FEMA (FEMA, 2022a) are transformed into state-dependent curves to properly account for residual damage. The approach introduces parametric adjustments to account for pre-existing damage conditions. Specifically, the median values of both structural and non-structural fragility curves are shifted according to hypothetical levels of residual damage. Given the absence of building-level recovery data, a homogeneous distribution of residual damage is assumed throughout the building portfolio.
In the absence of spatially explicit residual damage data, a predefined range of vulnerability modifications (5 %–30 %) was considered. This range provides an exploratory basis for investigating how different levels of residual vulnerability influence cumulative damage estimates. An empirical calibration against reported losses from the Puerto Rico case study identified a 15 % vulnerability modification as the value most consistent with the observed losses. This value falls within the proposed range, which is intended for future ex ante applications to account for a broader spectrum of plausible residual damage conditions. The lower bound of 5 % captures a limited but non-negligible residual effect, while the upper bound of 30 % allows more substantial effects to be explored. Although the modifications were applied uniformly, their impact is particularly pronounced in areas with high PGA values, where even small increases in vulnerability result in disproportionately large increases in expected losses.
Figure 6 illustrates the conceptual effect of residual damage on fragility curves. As residual damage increases, the curves change to the left, reflecting a greater susceptibility to damage at lower levels of seismic demand.
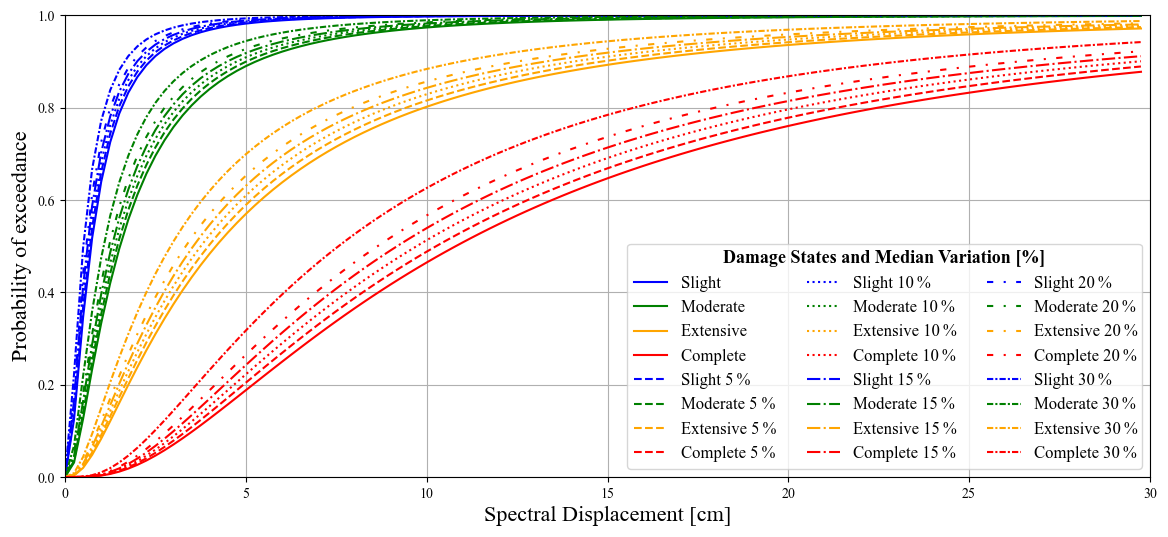
Figure 6State-dependent fragility curves reflecting changes in structural vulnerability due to residual damage.
Simulated damage probabilities are translated into direct economic losses using the Hazus-MH damage-to-loss methodology. For each building class and damage state, Hazus defines empirically derived loss ratios representing expected repair costs as a percentage of total replacement value. These ratios are based on historical US claims data and post-disaster reconstruction evidence, and differentiate between structural and non-structural components. In this study, replacement values are taken directly from the FEMA building inventory for Puerto Rico, ensuring internal consistency between exposure, vulnerability, and economic conversion assumptions. Total portfolio loss is obtained by multiplying damage state exceedance probabilities by the corresponding loss ratios and aggregating across building typologies.
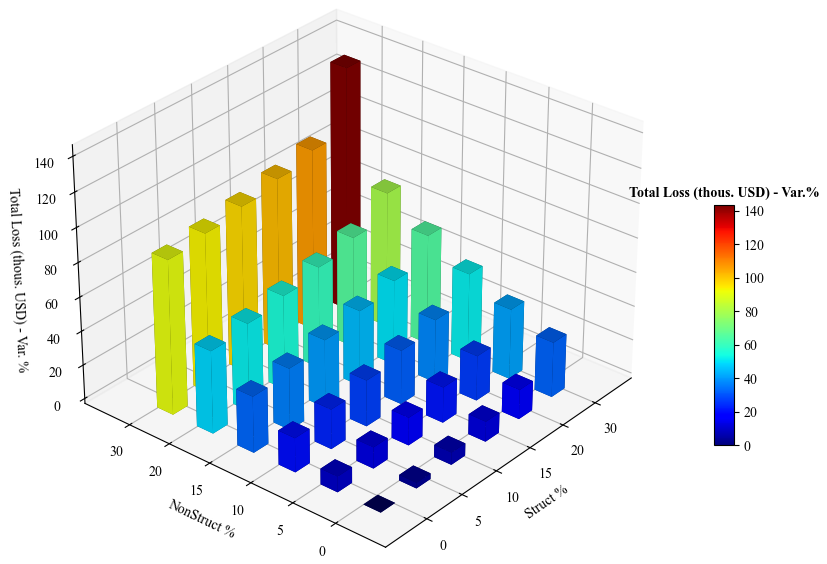
Figure 7Relative (%) change in total simulated losses compared to the single-hazard case for increasing structural and non-structural vulnerability modifications.
Based on the vulnerability modification range defined above, structural and non-structural fragility medians were progressively shifted, representing increasing levels of residual vulnerability. For each modification level, seismic damage was recomputed and converted into economic loss, allowing systematic evaluation of how cumulative impacts vary under different recovery assumptions. The results show that total loss increases more than proportionally as fragility medians are shifted toward lower capacity. Even modest modifications produce noticeable increases in simulated loss, while larger shifts lead to disproportionately higher damage estimates. The complete numerical matrix of results is reported in Appendix B, while Fig. 7 illustrates how total loss varies across structural and non-structural modification levels.
Official damage estimates for the 2019–2020 seismic sequence amount to approximately USD 1 700 000 in 2020 prices (Government of Puerto Rico, 2020). All monetary values reported in this section are expressed in 2020 USD, so that simulated losses are directly comparable with the official estimate. When the earthquake is modelled as an independent single-hazard event – thus assuming full recovery of building vulnerability after Hurricane Maria – the simulated loss equals USD 1 205 525. This configuration underestimates the official figure by approximately 29 %. The discrepancy indicates that assuming complete restoration of structural capacity before the earthquake is not consistent with the observed loss pattern. When state-dependent vulnerability is introduced by shifting the median of both structural and non-structural fragility curves by 15 %, the simulated total loss increases to USD 1 742 296, closely matching the official estimate. This modification represents a plausible level of residual vulnerability at the time of the seismic sequence and falls within the systematic range explored (5 %–30 %).
The difference between the two modelling configurations directly reflects the mechanism described in Eq. (4). In the independent configuration, the recovery function implies full restoration before the second event, and the earthquake acts on an undamaged system. In the state-dependent configuration, residual damage from the hurricane shifts the fragility curves toward lower capacity, increasing damage probabilities under the observed PGA levels. The improved agreement with reported losses does not result from ex-post parameter fitting, but from the structural effect of incorporating incomplete recovery within the vulnerability formulation. The 15 % modification lies within the predefined exploration range and represents one plausible residual capacity scenario rather than a calibrated value. The Puerto Rico application illustrates, within the explored modelling framework, that accounting for residual damage persistence improves the representation of cumulative impacts in consecutive multi-hazard sequences, as neglecting recovery processes may lead to lower damage estimates.
(Government of Puerto Rico, 2020)Table 1Comparison between official and modelled seismic losses (2020 USD).

This study translates key concepts frequently discussed qualitatively in the multi-hazard risk literature by translating them into a structured quantitative methodology, implemented as an open-source Python code. The results demonstrate that these concepts are not only theoretically relevant but can quantitatively affect damage estimates when explicitly represented. While the mathematical formulation builds on existing single-hazard models, its novelty lies in its capacity to integrate multiple elements that, when addressed quantitatively, are usually treated separately (such as multi-hazard vulnerability models and recovery dynamics), and in its practical and easy-to-use application through the development of a dedicated Python code.
The methodology accounts for damage mechanisms arising from both concurrent and consecutive hazards, including the combined effects of simultaneous hazards and the influence of residual damage and recovery in successive events. By adopting a hazard-independent formulation, the model can be applied to any combination of sudden-onset hazard typologies. Furthermore, it allows for the seamless integration of existing multi-hazard damage models, including vector-valued or state-dependent fragility models (Gentile et al., 2022).
The model behaviour analysis (Sect. 2.3) identifies inter-event time intervals, vulnerability interactions, and recovery trajectories (shape and duration) as key drivers of multi-hazard direct physical damage. Additional cumulative loss is highest when subsequent events occur during early recovery, and its magnitude strongly depends on the assumed recovery trajectory. Slower or prolonged recovery phases sustain vulnerability and increase compound losses. Even moderate vulnerability modification levels generate non-linear increases in cumulative damage, indicating that incomplete recovery alters the fragility profile of assets rather than simply adding residual damage. Overall, the model effectively captures the path-dependent nature of multi-hazard impacts, showing how damage accumulation may evolve from additive to multiplicative behaviour as a function of the interplay between event timing and evolving system conditions.
The forensic application to Puerto Rico (Sect. 3) provides a real-world setting in which both concurrent (wind–flood interactions during Hurricane Maria) and consecutive (hurricane–earthquake sequence of 2019–2020) damage mechanisms were observed. After estimating hurricane-induced losses, the model simulates the additional impact of the subsequent seismic sequence on a portfolio of buildings. Central to this application is the development of ad hoc seismic state-dependent fragility curves, systematically explored within a predefined modification range to reflect the residual damage conditions caused by the hurricane. Rather than applying standard fragility functions, the approach adjusts fragility parameters for both structural and non-structural components according to the conditional post-event damage state, thereby embedding incomplete recovery directly into the vulnerability representation. This forensic reconstruction allows damage accumulation mechanisms to be explicitly quantified. Multi-hazard impacts are evaluated in both physical and economic terms, enabling comparison with official earthquake loss estimates (Table 1). The closer agreement between modelled and reported losses demonstrates that incorporating temporally dynamic vulnerability substantially improves cumulative impact estimation. The results show that, within the explored modelling framework, cumulative damage estimates are strongly influenced by event order, timing, and recovery dynamics, resulting in path-dependent behaviour.
Notably, quantitative forensic analyses of multi-hazard events do more than retrospectively explain observed losses, as they can provide a pathway for extrapolating and refining multi-hazard impact models. By reconstructing impact sequences and explicitly quantifying how vulnerability evolves between events, such approaches can enable, for example, the derivation and calibration of state-dependent vulnerability functions that capture inter-event interactions, as those derived for the Puerto Rico building portfolio.
Beyond retrospective investigation, the quantitative methodology implemented here has potential for anticipatory and planning-oriented applications. By systematically varying key parameters, such as recovery trajectories, inter-event time intervals, or vulnerability interactions, the model allows exploration of how cumulative damage may develop under alternative scenarios. Such scenario-based and “what-if” analyses can inform preventive planning and mitigation strategy assessment. However, the reliability of these forward-looking applications depends on the availability of empirically grounded parameterisations and robust calibration of vulnerability and recovery functions. Without calibration, results remain illustrative rather than fully predictive, but they still provide a comparison of alternative scenarios, structured information on how total damage responds to variations in key parameters, supporting post-disaster analysis and scenario comparison.
4.1 Assumptions and limitations
The quantitative methodology presented for multi-hazard damage dynamics and its forensic application in Puerto Rico is subject to assumptions and limitations that define the scope of validity of the results.
Focus on sudden-onset hazards. The multi-hazard damage formulation proposed in this study primarily targets sudden-onset hazards, characterised by short-duration events such as hurricanes and earthquakes, where the event phase is brief compared to the subsequent response and recovery phases. This assumption is particularly relevant for the Puerto Rico case study, where Hurricane Maria and the 2019–2020 earthquake sequence are treated as discrete events with well-defined temporal boundaries. However, this focus excludes slow-onset hazards such as droughts, sea-level rise, or subsidence, which evolve over extended periods and may blur the distinctions between the event, response, and recovery phases (Terzi et al., 2022). Although this limitation does not diminish the applicability of the framework to sudden-onset events, it underscores the need for ad-hoc modelling approaches for long-duration slow-onset hazards.
Direct physical impacts only. The quantitative implementation focuses exclusively on direct physical damage to the built environment and does not capture indirect effects such as business interruptions, supply chain disruptions, or social impacts. In Puerto Rico, the prolonged loss of electricity and water after Hurricane Maria led to widespread socioeconomic challenges, including health crises, migration, and economic decline in key sectors such as agriculture and tourism (Fischbach et al., 2020; Stimpson et al., 2025). These indirect effects, while significant, fall outside the scope of the presented quantitative investigation.
Assumptions about the recovery process. In the Python code, and as a consequence, in the model behaviour analysis presented, the recovery process is modelled as a series of linear or exponential functions representing slow, medium, or fast recovery speeds. This approximation facilitates analysis but oversimplifies the inherently non-linear nature of recovery, which is influenced by a multitude of factors. In Puerto Rico, for example, bureaucratic inefficiencies, delayed federal funding, and inequitable distribution of resources significantly delayed recovery efforts in certain regions (U.S. House Committee on Natural Resources, 2020). Moreover, the proposed multi-hazard damage formulation assumes uniform recovery rates across structural and non-structural components, which may not reflect reality. Non-structural elements, such as utilities and interior finishes, often recover faster than structural systems, leading to mismatches in the actual recovery trajectory (FEMA, 2018b).
Simplification of temporal dynamics. In the proposed multi-hazard damage formulation, it is assumed that physical integrity is lost immediately at the onset of the event, and no further degradation occurs during the response phase. While this assumption is practical for mathematical modelling, it does not capture cases where damage continues to accumulate after the hazard peaks, such as when flooding persists or secondary hazards occur. In addition, physical integrity is assumed to remain constant during the response phase, despite minor fluctuations that may occur due to emergency repairs or further deterioration. Although these simplifications do not introduce significant bias, they limit the ability to model more complex temporal dynamics observed in real-world scenarios.
Generalized spatial resolution. The forensic analysis in Puerto Rico adopts a portfolio-based approach, grouping buildings into categories based on general characteristics such as structural type, construction material, and occupancy use. While this approach is suitable for regional-scale assessments, it does not capture localised variations in vulnerability or hazard exposure. Topography, proximity to fault lines, and floodplain dynamics are known to shape the spatial distribution of damage (Orlacchio et al., 2024; FEMA, 2021a), and these factors are expected to have influenced the pattern observed in Puerto Rico. These localised effects were approximated rather than explicitly modelled, potentially reducing the precision of damage estimates.
Economic impact modelling limitations. The economic losses in the Puerto Rico case study were estimated using standard unit repair costs, downtime estimates, and sector-specific multipliers. Although these methods provide a useful approximation, they do not account for broader macroeconomic effects, such as long-term population decline, loss of workforce productivity, or disruptions in international trade. For example, the loss of agricultural infrastructure during Hurricane Maria had cascading effects on food security and export revenues, which are not explicitly captured in this study (Fischbach et al., 2020).
Uncertainty in state-dependent fragility curves. Adjustment of fragility curves to reflect residual damage is based on proportional modifications to the median curve values. Although this method effectively accounts for cumulative damage, it assumes uniform vulnerability changes across all buildings within a category. In reality, building-specific factors such as construction quality, maintenance history, and localised damage patterns may lead to significant variability in vulnerability (Nofal and van de Lindt, 2020). This limitation highlights the need for more granular data to refine the state-dependent fragility model.
In conclusion, while the proposed approach provides a reproducible analytical template that supports systematic exploration of multi-hazard damage interactions and facilitates forensic analyses, its assumptions and limitations must be carefully considered, specifically when interpreting the results of the Puerto Rico case study. Addressing these limitations in future developments, such as incorporating more sophisticated recovery models, indirect impacts, and higher spatial resolution, will improve the accuracy and applicability of the approach, allowing more comprehensive assessments of compound and consecutive multi-hazard impact scenarios.
4.2 Future developments
Building on the current limitations of the proposed methodology, several promising avenues for improvement can be identified. These advances would not only improve the accuracy and applicability of the approach but also broaden its potential for integration into various fields of disaster risk reduction and management. Key directions for future developments are discussed below.
Better understanding and modelling recovery dynamics. The dynamics of the recovery process are central to the assessment of residual damage and the interactions between consecutive hazard impacts. Specifically, the timing of the response phase (tRES) determines whether the hazard impacts are classified as concurrent or consecutive, while the timing and shape of the recovery phase (tREC and Rj(t)) significantly influence the residual damage for subsequent events. The response phase, while critical for civil protection and disaster preparedness, has received limited attention in the scientific literature, often being conflated with the recovery phase. However, its proper evaluation is essential to improve disaster safety plans and understand its cascading effects on recovery (Italian Republic, 2018; IFRC, 2021; Toyoda et al., 2021). More attention has been paid to recovery dynamics, particularly in the context of seismic resilience. Recovery dynamics are highly variable, often following linear, exponential, or logistic patterns depending on socio-economic, political, and governance factors. The pioneering work of Miles and Chang introduced one of the first models of recovery behaviour after an earthquake, proposing recovery trajectories of the community (Miles and Chang, 2006). Based on this, Cimellaro et al. (2010) developed an advanced method for the quantification of resilience by integrating recovery and preparedness metrics. Recent studies have highlighted the importance of recovery models in post-disaster decision-making (Marasco et al., 2022; Fountain and Cradock-Henry, 2020; Loos et al., 2023), underscoring the need for reliable recovery functions. However, challenges remain in quantifying recovery due to the complexity of the influencing factors, including governance, technology, economic conditions, and social cohesion. Emerging methodologies, such as Agent-Based Models (ABMs), offer promising avenues to simulate recovery processes by integrating interactions between individuals, institutions, and resources. These models complement traditional approaches like community surveys and questionnaires, which are invaluable for understanding local recovery dynamics and identifying barriers to resilience (Opabola et al., 2023).
Providing more reliable multi-hazard damage models. Improving multi-hazard damage models is essential for capturing the cumulative effects of consecutive hazards. Future research should focus on integrating damage-state-dependent functions that dynamically modify vulnerability and fragility curves based on residual damage from prior events. For example, scenarios involving hurricanes followed by earthquakes, as demonstrated in the Puerto Rico case study, require models capable of adapting to changes in structural and non-structural vulnerabilities caused by sequential impacts.
Evaluating dynamic exposure over time. In the current implementation, exposure is assumed to remain constant and is not explicitly modelled within the framework. However, exposure is inherently dynamic, evolving over time due to maintenance, retrofitting, and functional changes in assets. Hazard impacts can reduce exposure through physical damage, but exposure may increase following recovery processes or new construction. Future developments should aim to model these variations over time, capturing the cyclical nature of exposure changes in response to hazards and human interventions (Gomez-Cunya et al., 2022).
Incorporating indirect impacts through functionality modelling. The presented approach currently focuses on direct physical damage but does not explicitly address indirect impacts, such as loss of functionality, economic disruption, or cascading failures in interconnected systems. Future iterations could incorporate functionality as a key metric, using physical integrity as a proxy to estimate functionality (Miles et al., 2019). This approach would enable assessments of broader systemic impacts, including business interruptions and supply chain disruptions.
Adapting the formulation to slow-onset hazard dynamics. The multi-hazard damage assessment formulation is tailored to sudden-onset hazard dynamics, where event durations are short relative to the response and recovery phases. However, slow-onset hazards such as droughts, coastal erosion, and subsidence require a fundamentally different modelling approach. Extending the framework to account for these dynamics would improve its applicability to a wider range of hazard scenarios (Terzi et al., 2022).
Advancing the model toward predictive multi-hazard applications. While the present approach demonstrates its value in forensic reconstruction and model behaviour analysis, its extension toward predictive multi-hazard risk assessment represents a crucial direction for future research. At present, vulnerability transitions and recovery trajectories are parameterised using stylised assumptions that are suitable for exploratory analysis but may not be sufficiently robust for forward-looking risk forecasting. To enable predictive applications, future developments should focus on: (i) empirical calibration of state-dependent fragility transitions across hazard combinations, (ii) development of transferable parameter sets that can be applied in data-scarce regions, and (iii) integration with probabilistic hazard occurrence models to simulate realistic multi-hazard event sequences. In particular, coupling the current damage accumulation formulation with stochastic event generation models would allow simulation of long-term compound risk under different climate or seismic scenarios. Such integration would transform the model from a post-event analytical tool into a prospective decision-support instrument capable of evaluating mitigation strategies and recovery policy alternatives under uncertainty. However, achieving this transition requires a stronger empirical foundation. Without these developments, predictive outputs may remain highly sensitive to modelling assumptions, limiting their reliability for operational risk management.
This paper provides a structured quantitative methodology for assessing direct physical damage to exposed assets subjected to multiple natural hazards that can overlap or occur sequentially over time. Specifically, it translates previously conceptual representations of multi-hazard impact dynamics into an explicit and reproducible analytical structure, implemented as a modular Python code. Unlike existing models that focus on specific asset-hazard combinations, the proposed formulation is designed to be broadly applicable to multiple hazards, capturing the complexities of concurrent, consecutive, and independent hazard interactions. A key contribution of this work is the incorporation of recovery dynamics and state-dependent vulnerability interactions into the damage assessment process. The modular Python implementation ensures flexibility, enabling users to customise hazard parameters, vulnerability functions, and recovery processes and apply the methodology to their specific case study. It can support structured forensic reconstruction of past multi-hazard events, such as the Puerto Rico sequence, as well as forward-looking scenario-based analyses under alternative assumptions of hazard timing, vulnerability evolution, and recovery pathways.
A structured model behaviour analysis was conducted through the Python code to systematically investigate how inter-event timing, vulnerability interactions, and recovery trajectories influence compound and cumulative physical damage. While such mechanisms are widely acknowledged qualitatively in the literature, they are rarely examined quantitatively within a single coherent and reproducible analytical structure. The model experiments highlight that, under the explored parameter configurations, neglecting recovery dynamics or state-dependent vulnerability adjustments can lead to substantial underestimation of multi-hazard damage. The model behaviour analysis also illustrates the potential of the approach for scenario-based planning, as it enables systematic exploration of alternative assumptions on hazard timing, recovery pathways, and vulnerability evolution, supporting anticipatory multi-hazard risk assessment.
The proposed approach is then applied to a real multi-hazard sequence in Puerto Rico from a forensic perspective. In this application, the Python-based quantitative structure is used to reconstruct and interpret the evolution of direct physical damage following Hurricane Maria and the subsequent seismic sequence. By incorporating state-dependent fragility curves to adjust asset vulnerability based on residual damage, the model reproduces damage patterns consistent with reported loss estimates, highlighting the importance of explicitly accounting for hazard interactions and recovery dynamics to capture multi-hazard losses better. Importantly, the forensic application also enabled the derivation of state-dependent damage curves from observed cumulative impacts, demonstrating that post-disaster analysis can inform vulnerability models that explicitly account for residual damage and incomplete recovery.
Despite its contributions, the methodology has limitations, particularly in assuming uniform recovery rates and focusing solely on direct physical impacts while neglecting broader indirect socio-economic consequences. Future developments will address these challenges by refining recovery modelling, incorporating dynamic exposure changes, and expanding the applicability of the framework to slow-onset hazards. In addition, integrating functionally-based assessments and indirect economic losses will enhance its comprehensiveness.
The continuous piecewise-defined function presented in Table A1 provides the relative damage over time dj(t) to an asset or infrastructure j caused by n natural hazard events. The events are ordered according to their starting time , and considered two by two.
The functions f1 to f4 appearing in Table A1 are defined as:
and the parameters reported in Sect. A2.
Table A1Generalised damage formulation across time intervals for asset j.
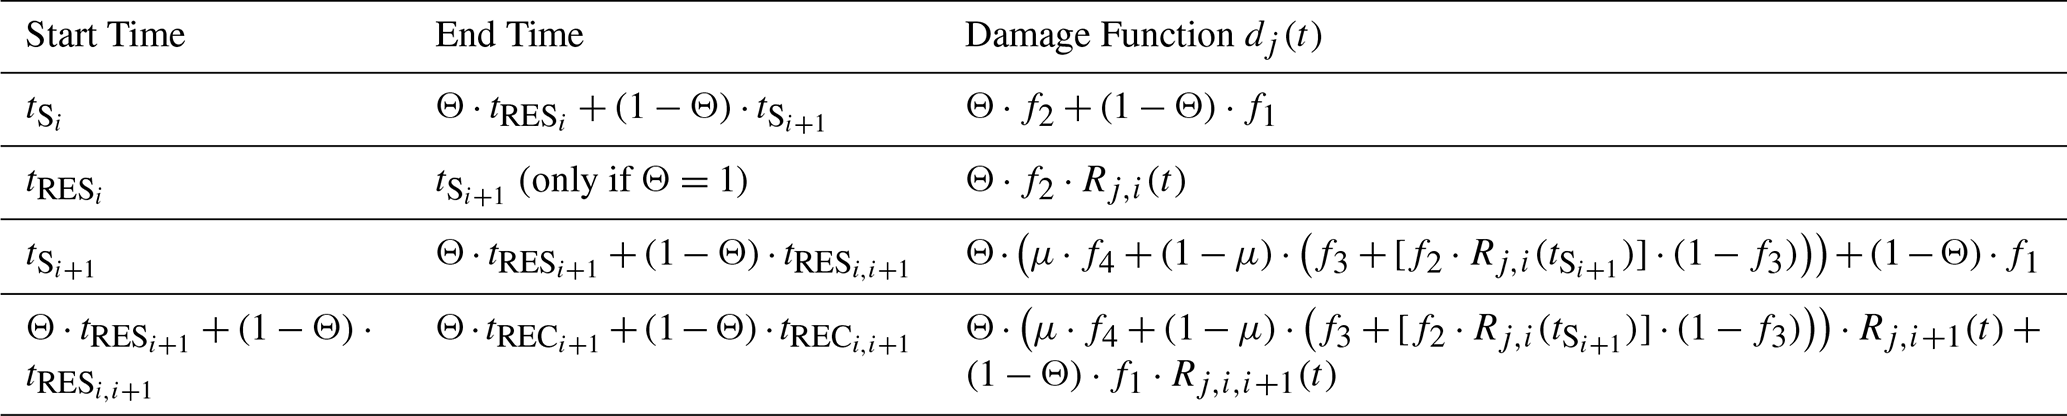
The type of impact interaction is governed by the parameters Θ and μ, which allow the model to represent different dynamics (concurrent, consecutive, or independent) within a single, consistent framework. These parameters are formally defined using Heaviside step functions as follows:
The parameters classify the type of multi-hazard impact as follows:
-
Θ=0: Impacts are classified as concurrent. The formulation in Table A1 simplifies to Eq. (2) in the main text.
-
: Impacts are classified as consecutive. The formulation in Table A1 simplifies to Eq. (4) in the main text.
-
: Impacts are classified as independent. The formulation simplifies to Eq. (A7) reported in this appendix.
A1 Independent impacts
In the case of two consecutive hazards where the second hazard event occurs after the end of recovery of the first one, the impacts can be considered independent. In such a case, the evolution of the damage over time can be seen as a series of single-hazard dynamics.
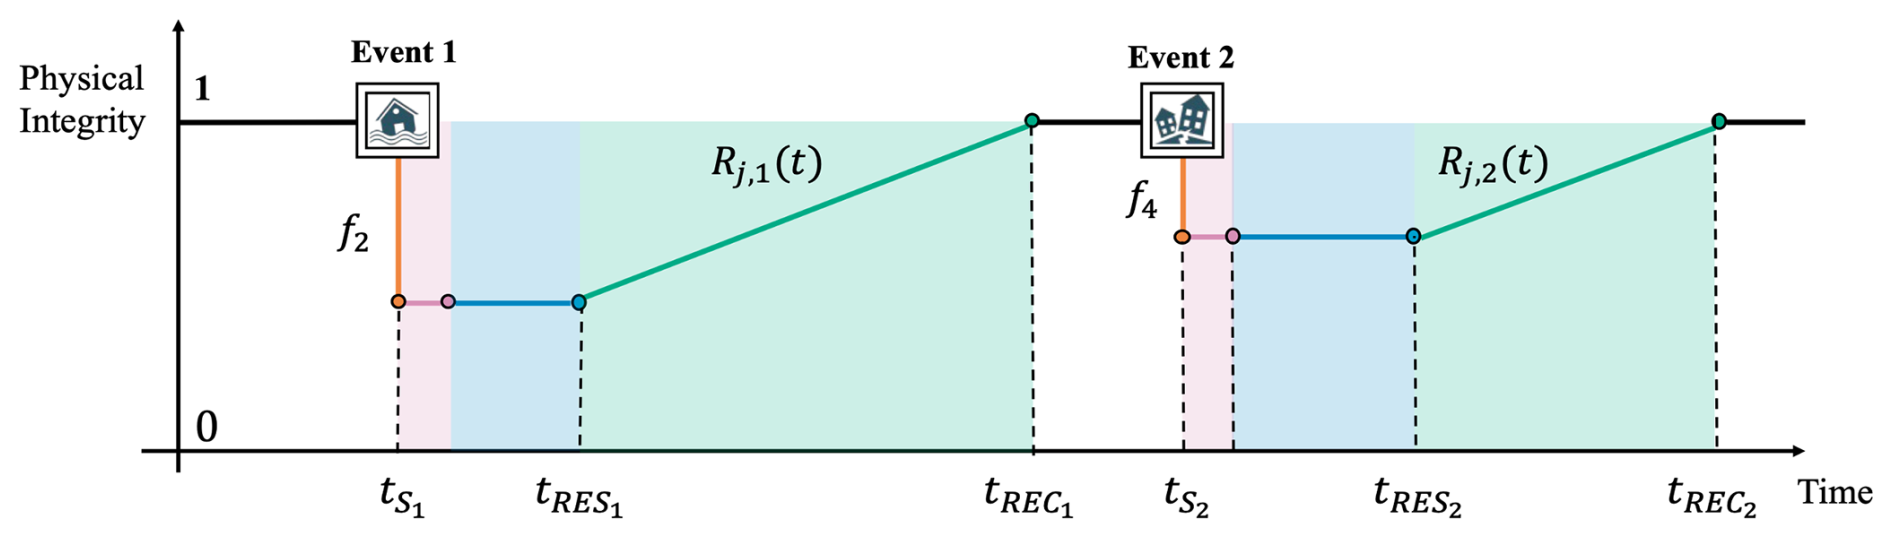
Figure A1Variation of physical integrity over time in the case of two independent impacts. The second event in temporal order affects the asset when it has already completed the recovery phase of the previous one.
Direct physical damage over time t to an asset or infrastructure j caused by concurrent impacts can therefore be simply calculated according to Eq. (A7).
with
According to Eq. (A7), at time , the first hazard event causes the asset j to sustain damage quantified as f2. Once the response phase of the first event concludes (i.e., for ), the asset begins to recover from the damage using the recovery function Rj,1(t). By , the asset has fully recovered, resulting in a residual damage level of zero, which remains unchanged until a second hazard occurs at .
At , the second hazard affects the asset, causing damage quantified as f4. Similarly, once the response phase of this second event is completed (i.e., for ), the asset begins to recover according to the recovery function Rj,2(t). By , the asset again reaches a residual damage level of zero. Equations (A8) and (A9) describe single-hazard damage models as functions of the maximum intensities of hazard events, h1,max and h2,max, respectively. It is assumed here that the damages from both events occur entirely at the onset of each event. This evolution of damage in time, as described in Eq. (A7), is graphically represented in Fig. A1.
Although it may seem that the impacts in this scenario could be assessed by treating the two events as independent single hazards, the situation is more complex. In an ideal analytical scenario, the system's vulnerability may have either decreased or increased after reconstruction following the first event. Some studies suggest that both structural and non-structural attributes can improve in response to previous events, as seen in the “build back better” theory (Kennedy et al., 2008; Neeraj et al., 2021). Consequently, a second event with similar characteristics could cause more or less damage, depending on how the recovery and reconstruction process unfolded after the initial response phase. Given this scenario, it becomes crucial for risk assessment and management to update the system's vulnerability and exposure after the recovery process to accurately calculate the risks posed by consecutive hazards.
A2 Description of symbols used in the multi-hazard damage formulation
| Symbol | Description |
| Starting time of hazard event i | |
| Ending time of hazard event i | |
| End of the response phase from hazard event i | |
| End of the response phase from the overlapping events i and i+1 | |
| End of the recovery phase from hazard event i | |
| End of the recovery phase from overlapping events i and i+1 | |
| Single-impact damage model for asset j under hazard event i | |
| Concurrent impact damage model: vulnerability function quantifying damage caused by compound impacts from overlapping events i and i+1 | |
| Consecutive impact damage model: vulnerability function quantifying damage caused by event i, conditional on residual damage d | |
| hi,max | Maximum magnitude reached by hazard event i |
| Rj,i | Recovery rate of asset j from the damage caused by hazard event i |
| Recovery rate of asset j from the damage caused by overlapping events i and i+1 |
Table B1Total simulated seismic losses (2020 USD) under different combinations of structural and non-structural vulnerability modification levels.

This appendix reports the complete numerical matrix of simulated seismic losses for different combinations of structural and non-structural vulnerability modification levels applied in the Puerto Rico case study (Sect. 3.2).
The baseline fragility curves are derived from FEMA Hazus (FEMA, 2022a). State-dependent vulnerability modification is introduced by progressively reducing the median parameters of the fragility functions between 0 % and 30 % for both structural and non-structural components. For each combination, seismic damage probabilities are computed and converted into economic loss using the Hazus damage-to-loss ratios described in Sect. 3.2.
Loss values are expressed in 2020 USD and represent aggregated portfolio losses across all building classes included in the FEMA inventory for Puerto Rico.
The matrix shows that loss increases more than proportionally when both structural and non-structural vulnerability modifications are combined.
The code used in this study is available at https://doi.org/10.5281/zenodo.22773741 (Borre and De Angeli, 2026).
A.B.: conceptualization, formal analysis, methodology, investigation, visualization, writing – original draft preparation, D.O.: conceptualization, formal analysis, methodology, writing – review and editing, E.T.: conceptualization, writing – review and editing, T.G.: conceptualization, writing – review and editing, R.R.: conceptualization, G.Z.: methodology, G.B.: conceptualization, writing – review and editing, S.D.A.: conceptualization, formal analysis, methodology, investigation, visualization, writing – original draft preparation.
The contact author has declared that none of the authors has any competing interests.
Publisher's note: Copernicus Publications remains neutral with regard to jurisdictional claims made in the text, published maps, institutional affiliations, or any other geographical representation in this paper. The authors bear the ultimate responsibility for providing appropriate place names. Views expressed in the text are those of the authors and do not necessarily reflect the views of the publisher.
This article is part of the special issue “Methodological innovations for the analysis and management of compound risk and multi-risk, including climate-related and geophysical hazards (NHESS/ESD/ESSD/GC/HESS inter-journal SI)”. It is not associated with a conference.
We thank Dr. Lorenzo Campo for his support in drafting a preliminary mathematical formulation for multi-hazard risks, which served as the foundation for the development of this work. We also thank Prof. Bruce D. Malamud for his insightful suggestions during an inspiring conversation at EGU24. The authors gratefully acknowledge the financial support of the Italian Civil Protection.
The activities carried out by Alessandro Borre, Daria Ottonelli, Eva Trasforini, Tatiana Ghizzoni and Roberto Rudari have been supported by the Italian Civil Protection under the agreement “Convenzione '24–'26 per lo sviluppo della conoscenza, delle metodologie, delle tecnologie e dell'alta formazione utile alla realizzazione di sistemi nazionali di monitoraggio, prevenzione e sorveglianza, nonché per l'attuazione dell'organizzazione della funzione di supporto tecnico-scientifico nell'ambito del Servizio Nazionale di Protezione Civile” (grant no. B57F23000130001).
This paper was edited by Antonia Sebastian and reviewed by two anonymous referees.
Aljawhari, K., Gentile, R., Freddi, F., and Galasso, C.: Effects of ground-motion sequences on fragility and vulnerability of case-study reinforced concrete frames, B. Earthq. Eng., 19, 6329–6359, https://doi.org/10.1007/s10518-020-01006-8, 2021. a
Borre, A. and De Angeli, S.: Multi-Hazard Impact Assessment Framework, Zenodo [code], https://doi.org/10.5281/zenodo.22773741, 2026. a
Borre, A., Ghizzoni, T., Trasforini, E., Ottonelli, D., Rudari, R., and Ferraris, L.: Developing the Recovery Gap Index: A Comprehensive Tool for Assessing National Disaster Recovery Capacities, Sustainability, 17, 1044, https://doi.org/10.3390/su17031044, 2025. a
Boyle, E., Inanlouganji, A., Carvalhaes, T., Jevtić, P., Pedrielli, G., and Reddy, T. A.: Social vulnerability and power loss mitigation: A case study of Puerto Rico, Int. J. Disast. Risk Re., 82, 103357, https://doi.org/10.1016/j.ijdrr.2022.103357, 2022. a
Cangialosi, J. P., Latto, A. S., and Berg, R.: Tropical Cyclone Report: Hurricane Irma (AL112017), 30 August–12 September 2017, Tech. rep., National Hurricane Center, National Oceanic and Atmospheric Administration, Miami, FL, https://www.nhc.noaa.gov/data/tcr/AL112017_Irma.pdf (last access: 8 September 2026), 2018. a
Cimellaro, G. P., Reinhorn, A. M., and Bruneau, M.: Framework for Analytical Quantification of Disaster Resilience, Eng. Struct., 32, 3639–3649, https://doi.org/10.1016/j.engstruct.2010.08.008, 2010. a, b, c
Claassen, J. N., Ward, P. J., Daniell, J., Koks, E. E., Tiggeloven, T., and de Ruiter, M. C.: A new method to compile global multi-hazard event sets, Sci. Rep., 13, 13808, https://doi.org/10.1038/s41598-023-40400-5, 2023. a
De Angeli, S., Malamud, B. D., Rossi, L., Taylor, F. E., Trasforini, E., and Rudari, R.: A multi-hazard framework for spatial-temporal impact analysis, Int. J. Disast. Risk Re., 73, 102829, https://doi.org/10.1016/j.ijdrr.2022.102829, 2022. a, b, c, d, e, f, g
de Ruiter, M. C. and van Loon, A. F.: The challenges of dynamic vulnerability and how to assess it, iScience, 25, 104720, https://doi.org/10.1016/j.isci.2022.104720, 2022. a, b
de Ruiter, M. C., Couasnon, A., van den Homberg, M. J. C., Daniell, J. E., Gill, J. C., and Ward, P. J.: Why We Can No Longer Ignore Consecutive Disasters, Earths Future, 8, e2019EF001425, https://doi.org/10.1029/2019EF001425, 2020. a, b, c, d, e
Di Baldassarre, G., Kreibich, H., Vorogushyn, S., Aerts, J., Arnbjerg-Nielsen, K., Barendrecht, M., Bates, P., Borga, M., Botzen, W., Bubeck, P., De Marchi, B., Llasat, C., Mazzoleni, M., Molinari, D., Mondino, E., Mård, J., Petrucci, O., Scolobig, A., Viglione, A., and Ward, P. J.: Hess Opinions: An interdisciplinary research agenda to explore the unintended consequences of structural flood protection, Hydrol. Earth Syst. Sci., 22, 5629–5637, https://doi.org/10.5194/hess-22-5629-2018, 2018. a
Do, T. Q., van de Lindt, J. W., and Cox, D. T.: Hurricane Surge-Wave Building Fragility Methodology for Use in Damage, Loss, and Resilience Analysis, J. Struct. Eng., 146, 04019177, https://doi.org/10.1061/(ASCE)ST.1943-541X.0002472, 2020. a
Elmer, F., Thieken, A. H., Pech, I., and Kreibich, H.: Influence of flood frequency on residential building losses, Nat. Hazards Earth Syst. Sci., 10, 2145–2159, https://doi.org/10.5194/nhess-10-2145-2010, 2010. a
FEMA: 2017 Hurricane Season FEMA After-Action Report, Tech. rep., Federal Emergency Management Agency, https://www.fema.gov/sites/default/files/2020-08/fema_hurricane-season-after-action-report_2017.pdf (last access: 8 September 2026), 2018a. a
FEMA: Mitigation Assessment Team Report: Hurricanes Irma and Maria in Puerto Rico – Building Performance Observations, Recommendations, and Technical Guidance, Tech. Rep. FEMA P-2020, Federal Emergency Management Agency, https://www.fema.gov/sites/default/files/2020-07/mat-report_hurricane-irma-maria-puerto-rico_2.pdf (last access: 8 September 2026), 2018b. a, b
FEMA: Hazus Inventory Technical Manual: Hazus 4.2 Service Pack 3, Tech. rep., Federal Emergency Management Agency, https://www.fema.gov/sites/default/files/documents/fema_hazus-inventory-technical-manual-4.2.3.pdf (last access: 8 September 2026), 2021a. a, b
FEMA: Hazus Hurricane Wind for Puerto Rico and the U.S. Virgin Islands, Tech. rep., Federal Emergency Management Agency, https://www.fema.gov/sites/default/files/documents/fema_hazus-hurricane-wind-puerto-rico-u.s.-virgin-islands.pdf (last access: 8 September 2026), 2021b. a
FEMA: Hazus Earthquake Model Technical Manual: Hazus 5.1, Tech. rep., Federal Emergency Management Agency, https://www.fema.gov/sites/default/files/documents/fema_hazus-earthquake-model-technical-manual-5-1.pdf (last access: 8 September 2026), 2022a. a, b
FEMA: Hazus Hurricane Model Technical Manual: Hazus 5.1, Tech. rep., Federal Emergency Management Agency, https://www.fema.gov/sites/default/files/documents/fema_hazus-hurricane-model-technical-manual-5-1.pdf (last access: 8 September 2026), 2022b. a
Fischbach, J. R., May, L. W., Whipkey, K., Shelton, S. R., Vaughan, C. A., Tierney, D., Leuschner, K. J., Meredith, L. S., and Peterson, H. J.: After Hurricane Maria: Predisaster Conditions, Hurricane Damage, and Recovery Needs in Puerto Rico, RAND Corporation, Santa Monica, CA, https://doi.org/10.7249/RR2595, 2020. a, b, c
Fountain, J. and Cradock-Henry, N. A.: Recovery, Risk and Resilience: Post-Disaster Tourism Experiences in Kaikōura, New Zealand, Tourism Management Perspectives, 35, 100695, https://doi.org/10.1016/j.tmp.2020.100695, 2020. a
GAO: Puerto Rico Disasters: Progress Made, but the Recovery Continues to Face Challenges, Tech. Rep. GAO-24-105557, U.S. Government Accountability Office, https://www.gao.gov/products/gao-24-105557 (last access: 8 September 2026, 2024. a
Gautam, D. and Dong, Y.: Multi-hazard vulnerability of structures and lifelines due to the 2015 Gorkha earthquake and 2017 central Nepal flash flood, Journal of Building Engineering, 17, 196–201, https://doi.org/10.1016/j.jobe.2018.02.016, 2018. a
Gentile, R., Cremen, G., Galasso, C., Jenkins, L. T., Manandhar, V., Menteşe, E. Y., Guragain, R., and McCloskey, J.: Scoring, selecting, and developing physical impact models for multi-hazard risk assessment, Int. J. Disast. Risk Re., 82, 103365, https://doi.org/10.1016/j.ijdrr.2022.103365, 2022. a, b, c, d, e, f, g
Gill, J. C. and Malamud, B. D.: Reviewing and visualizing the interactions of natural hazards, Rev. Geophys., 52, 680–722, https://doi.org/10.1002/2013RG000445, 2014. a
Gomez-Cunya, L.-A., Tilt, J., Tullos, D., and Babbar-Sebens, M.: Perceived Risk and Preferences of Response and Recovery Actions of Individuals Living in a Floodplain Community, Int. J. Disast. Risk Re., 67, 102645, https://doi.org/10.1016/j.ijdrr.2021.102645, 2022. a
Gómez Zapata, J. C., Pittore, M., Brinckmann, N., Lizarazo-Marriaga, J., Medina, S., Tarque, N., and Cotton, F.: Scenario-based multi-risk assessment from existing single-hazard vulnerability models. An application to consecutive earthquakes and tsunamis in Lima, Peru, Nat. Hazards Earth Syst. Sci., 23, 2203–2228, https://doi.org/10.5194/nhess-23-2203-2023, 2023. a, b
Government of Puerto Rico: Central Office for Recovery, Reconstruction and Resiliency (COR3) Transparency Portal, Government of Puerto Rico, https://recovery.pr.gov/en/financial-analysis/financial-summary, (last access: 2 November 2023), 2020. a, b
Hariri-Ardebili, M. A., Sattar, S., Johnson, K., Clavin, C., Fung, J., and Ceferino, L.: A Perspective towards Multi-Hazard Resilient Systems: Natural Hazards and Pandemics, Sustainability, 14, https://doi.org/10.3390/su14084508, 2022. a, b
He, L., Aitchison, J. C., Hussey, K., Wei, Y., and Lo, A.: Accumulation of vulnerabilities in the aftermath of the 2015 Nepal earthquake: Household displacement, livelihood changes and recovery challenges, Int. J. Disast. Risk Re., 31, 68–75, https://doi.org/10.1016/j.ijdrr.2018.04.017, 2018. a
Hochrainer-Stigler, S., Šakić Trogrlić, R., Reiter, K., Ward, P. J., de Ruiter, M. C., Duncan, M. J., Torresan, S., Ciurean, R., Mysiak, J., Stuparu, D., and Gottardo, S.: Toward a framework for systemic multi-hazard and multi-risk assessment and management, iScience, 26, 106736, https://doi.org/10.1016/j.isci.2023.106736, 2023. a
IFRC: Literature Review on Law and Disaster Recovery and Reconstruction, https://www.ifrc.org/document/literature-review-law-and-disaster-recovery-and-reconstruction (last access: 8 September 2026), 2021. a
Italian Republic: Decreto Legislativo 2 gennaio 2018, n. 1: Codice della protezione civile, gazzetta Ufficiale della Repubblica Italiana, Serie Generale n. 17, 22 January 2018, https://www.protezionecivile.gov.it/it/normativa/decreto-legislativo-n-1-del-2-gennaio-2018–codice-della-protezione-civile/ (last access: 8 September 2026), 2018. a
Kappes, M. S., Keiler, M., von Elverfeldt, K., and Glade, T.: Challenges of analyzing multi-hazard risk: a review, Nat. Hazards, 64, 1925–1958, https://doi.org/10.1007/s11069-012-0294-2, 2012. a, b
Kennedy, J., Ashmore, J., Babister, E., and Kelman, I.: The Meaning of `Build Back Better': Evidence From Post-Tsunami Aceh and Sri Lanka, J. Conting. Crisis Man., 16, 24–36, https://doi.org/10.1111/j.1468-5973.2008.00529.x, 2008. a
Kishore, N., Marqués, D., Mahmud, A., Kiang, M. V., Rodriguez, I., Fuller, A., and Leaning, J.: Mortality in Puerto Rico after Hurricane Maria, New Engl. J. Med., 379, 162–170, https://doi.org/10.1056/NEJMsa1803972, 2018. a
Koliou, M., van de Lindt, J. W., McAllister, T. P., Ellingwood, B. R., Dillard, M., and Cutler, H.: State of the research in community resilience: progress and challenges, Sustainable and Resilient Infrastructure, 5, 131–151, https://doi.org/10.1080/23789689.2017.1418547, 2020. a, b
Lagmay, A. M. F. and Eco, R.: Brief Communication: On the source characteristics and impacts of the magnitude 7.2 Bohol earthquake, Philippines, Nat. Hazards Earth Syst. Sci., 14, 2795–2801, https://doi.org/10.5194/nhess-14-2795-2014, 2014. a
Lagmay, A. M. F., Agaton, R. P., Bahala, M. A. C., Briones, J. B. L. T., Cabacaba, K. M. C., Caro, C. V. C., Dasallas, L. L., Gonzalo, L. A. L., Ladiero, C. N., Lapidez, J. P., Mungcal, M. T. F., Puno, J. V. R., Ramos, M. M. A. C., Santiago, J., Suarez, J. K., and Tablazon, J. P.: Devastating storm surges of Typhoon Haiyan, Int. J. Disast. Risk Re., 11, 1–12, https://doi.org/10.1016/j.ijdrr.2014.10.006, 2015. a
Li, Y., Song, R., and Lindt, J. W. V. D.: Collapse Fragility of Steel Structures Subjected to Earthquake Mainshock-Aftershock Sequences, J. Struct. Eng., 140, 04014095, https://doi.org/10.1061/(ASCE)ST.1943-541X.0001019, 2014. a
Liu, C., Fang, D., and Zhao, L.: Reflection on earthquake damage of buildings in 2015 Nepal earthquake and seismic measures for post-earthquake reconstruction, Structures, 30, 647–658, https://doi.org/10.1016/j.istruc.2020.12.089, 2021. a
Loos, S., Lallemant, D., Khan, F., McCaughey, J. W., Banick, R., Budhathoki, N., and Baker, J. W.: A Data-Driven Approach to Rapidly Estimate Recovery Potential to Go Beyond Building Damage After Disasters, Commun. Earth Environ., 4, 40, https://doi.org/10.1038/s43247-023-00699-4, 2023. a, b, c
Marasco, S., Kammouh, O., and Cimellaro, G. P.: Disaster Resilience Quantification of Communities: A Risk-Based Approach, Int. J. Disast. Risk Re., 70, 102778, https://doi.org/10.1016/j.ijdrr.2021.102778, 2022. a
Miles, S. and Chang, S.: Modeling Community Recovery from Earthquakes, Earthq. Spectra, 22, https://doi.org/10.1193/1.2192847, 2006. a, b
Miles, S. B., Burton, H. V., and Kang, H.: Community of Practice for Modeling Disaster Recovery, Nat. Hazards Rev., 20, 04018023, https://doi.org/10.1061/(ASCE)NH.1527-6996.0000313, 2019. a, b, c
Mimura, N., Yasuhara, K., Kawagoe, S., Yokoki, H., and Kazama, S.: Damage from the Great East Japan Earthquake and Tsunami – A quick report, Mitig. Adapt. Strat. Gl., 16, 803–818, https://doi.org/10.1007/s11027-011-9297-7, 2011. a
Ming, X., Xu, W., Li, Y., Du, J., Liu, B., and Shi, P.: Quantitative multi-hazard risk assessment with vulnerability surface and hazard joint return period, Stoch. Env. Res. Risk A., 29, 35–44, https://doi.org/10.1007/s00477-014-0935-y, 2015. a
Mohammadi, S., De Angeli, S., Boni, G., Pirlone, F., and Cattari, S.: Review article: Current approaches and critical issues in multi-risk recovery planning of urban areas exposed to natural hazards, Nat. Hazards Earth Syst. Sci., 24, 79–107, https://doi.org/10.5194/nhess-24-79-2024, 2024. a
Naik, S. P., Mohanty, A., Sotiris, V., Mittal, H., Porfido, S., Michetti, A. M., Gwon, O., Park, K., Jaya, A., Paulik, R., Li, C., Mikami, T., and Kim, Y.-S.: 28th September 2018 Mw 7.5 Sulawesi Supershear Earthquake, Indonesia: Ground effects and macroseismic intensity estimation using ESI-2007 scale, Eng. Geol., 317, 107054, https://doi.org/10.1016/j.enggeo.2023.107054, 2023. a
Neeraj, S., Mannakkara, S., and Wilkinson, S.: Build back better concepts for resilient recovery: a case study of India's 2018 flood recovery, International Journal of Disaster Resilience in the Built Environment, 12, 280–294, https://doi.org/10.1108/IJDRBE-05-2020-0044, 2021. a
NOAA National Hurricane Center: Costliest U.S. Tropical Cyclones Tables Updated, Tech. rep., National Oceanic and Atmospheric Administration, Miami, FL, https://www.nhc.noaa.gov/news/UpdatedCostliest.pdf (last access: 8 September 2026), 2018. a
Nofal, O. M. and van de Lindt, J. W.: Probabilistic Flood Loss Assessment at the Community Scale: Case Study of 2016 Flooding in Lumberton, North Carolina, ASCE-ASME Journal of Risk and Uncertainty in Engineering Systems, Part A: Civil Engineering, 6, 05020001, https://doi.org/10.1061/AJRUA6.0001060, 2020. a, b
Nofal, O. M., van de Lindt, J. W., Do, T. Q., Yan, G., Hamideh, S., Cox, D. T., and Dietrich, J. C.: Methodology for Regional Multihazard Hurricane Damage and Risk Assessment, J. Struct. Eng., 147, 04021185, https://doi.org/10.1061/(ASCE)ST.1943-541X.0003144, 2021. a
Opabola, E. A., Galasso, C., Rossetto, T., Meilianda, E., Idris, Y., and Nurdin, S.: Investing in Disaster Preparedness and Effective Recovery of School Physical Infrastructure, Int. J. Disast. Risk Re., 90, 103623, https://doi.org/10.1016/j.ijdrr.2023.103623, 2023. a, b
Orlacchio, M., Baltzopoulos, G., and Iervolino, I.: Simplified state-dependent seismic fragility assessment, Earthq. Eng. Struct. D., 53, 2099–2121, https://doi.org/10.1002/eqe.4105, 2024. a
Otárola, K., Fayaz, J., and Galasso, C.: Fragility and vulnerability analysis of deteriorating ordinary bridges using simulated ground-motion sequences, Earthq. Eng. Struct. D., 51, 3215–3240, https://doi.org/10.1002/eqe.3720, 2022. a
Pasch, R. J., Penny, A. B., and Berg, R.: National Hurricane center tropical cyclone report: Hurricane Maria (AL152017): 16–30 September 2017, National Center Tropical Cyclone Report, online, https://www.nhc.noaa.gov/data/tcr/AL152017_Maria.pdf (last access: 2 September 2024), 2023. a
Pasino, A., De Angeli, S., Battista, U., Ottonello, D., and Clematis, A.: A review of single and multi-hazard risk assessment approaches for critical infrastructures protection, International Journal of Safety and Security Engineering, 11, 305–318, 2021. a
Sabah, N. and Sil, A.: A comprehensive report on the 28th September 2018 Indonesian Tsunami along with its causes, Natural Hazards Research, 3, 474-486, https://doi.org/10.1016/j.nhres.2023.06.003, 2023. a
Sarker, P. and Lester, H. D.: Post-Disaster Recovery Associations of Power Systems Dependent Critical Infrastructures, Infrastructures, 4, https://doi.org/10.3390/infrastructures4020030, 2019. a
Stimpson, J. P., Mercado, D. L., Rivera-González, A. C., Purtle, J., and Ortega, A. N.: A regional analysis of healthcare utilization trends during consecutive disasters in Puerto Rico using private claims data, Scientific Reports, 15, 5249, https://doi.org/10.1038/s41598-025-89983-1, 2025. a
Terzi, S., De Angeli, S., Miozzo, D., Massucchielli, L. S., Szarzynski, J., Carturan, F., and Boni, G.: Learning from the COVID-19 pandemic in Italy to advance multi-hazard disaster risk management, Progress in Disaster Science, 16, 100268, https://doi.org/10.1016/j.pdisas.2022.100268, 2022. a, b
Tilloy, A., Malamud, B. D., Winter, H., and Joly-Laugel, A.: A review of quantification methodologies for multi-hazard interrelationships, Earth-Sci. Rev., 196, 102881, https://doi.org/10.1016/j.earscirev.2019.102881, 2019. a
Tilloy, A., Malamud, B. D., and Joly-Laugel, A.: A methodology for the spatiotemporal identification of compound hazards: wind and precipitation extremes in Great Britain (1979–2019), Earth Syst. Dynam., 13, 993–1020, https://doi.org/10.5194/esd-13-993-2022, 2022. a
Toyoda, T., Wang, J., and Kaneko, Y.: Build Back Better: Challenges of Asian Disaster Recovery, Springer Nature, https://doi.org/10.1007/978-981-16-5979-9, 2021. a
U.S. House Committee on Natural Resources: Report on Puerto Rico's Earthquakes, Tech. rep., U.S. Government Publishing Office, https://www.govinfo.gov/app/details/GOVPUB-Y4_R31_3-PURL-gpo134260 (last access: 8 September 2026), 2020. a
Vičič, B., Momeni, S., Borghi, A., Lomax, A., and Aoudia, A.: The 2019–2020 Southwest Puerto Rico Earthquake Sequence: Seismicity and Faulting, Seismol. Res. Lett., 93, https://doi.org/10.1785/0220210113, 2021. a
Ward, P. J., Daniell, J., Duncan, M., Dunne, A., Hananel, C., Hochrainer-Stigler, S., Tijssen, A., Torresan, S., Ciurean, R., Gill, J. C., Sillmann, J., Couasnon, A., Koks, E., Padrón-Fumero, N., Tatman, S., Tronstad Lund, M., Adesiyun, A., Aerts, J. C. J. H., Alabaster, A., Bulder, B., Campillo Torres, C., Critto, A., Hernández-Martín, R., Machado, M., Mysiak, J., Orth, R., Palomino Antolín, I., Petrescu, E.-C., Reichstein, M., Tiggeloven, T., Van Loon, A. F., Vuong Pham, H., and de Ruiter, M. C.: Invited perspectives: A research agenda towards disaster risk management pathways in multi-(hazard-)risk assessment, Nat. Hazards Earth Syst. Sci., 22, 1487–1497, https://doi.org/10.5194/nhess-22-1487-2022, 2022. a
Wenzel, T., van Westen, C., Sunil, M., Pantaleoni Reluy, N., Marr, P., Glade, T., and Bell, R.: Towards a practical multi-hazard interrelation classification: implications for assessing their impacts, Nat. Hazards, 122, 82, https://doi.org/10.1007/s11069-025-07901-0, 2026. a
Xu, J.-G., Wu, G., Feng, D.-C., and Fan, J.-J.: Probabilistic multi-hazard fragility analysis of RC bridges under earthquake-tsunami sequential events, Eng. Struct., 238, 112250, https://doi.org/10.1016/j.engstruct.2021.112250, 2021. a
- Abstract
- Introduction
- From qualitative frameworks to quantitative multi-hazard dynamics
- Forensic multi-hazard damage analysis in Puerto Rico
- Discussion
- Conclusions
- Appendix A: Multi-hazard damage formulation
- Appendix B: Numerical results for state-dependent vulnerability modification
- Code and data availability
- Author contributions
- Competing interests
- Disclaimer
- Special issue statement
- Acknowledgements
- Financial support
- Review statement
- References
- Abstract
- Introduction
- From qualitative frameworks to quantitative multi-hazard dynamics
- Forensic multi-hazard damage analysis in Puerto Rico
- Discussion
- Conclusions
- Appendix A: Multi-hazard damage formulation
- Appendix B: Numerical results for state-dependent vulnerability modification
- Code and data availability
- Author contributions
- Competing interests
- Disclaimer
- Special issue statement
- Acknowledgements
- Financial support
- Review statement
- References