
the Creative Commons Attribution 4.0 License.
the Creative Commons Attribution 4.0 License.
 | 02 Oct 2026
Seasonal influence on post-fire debris flow likelihood after the 2020 Lake Fire

Adit Ghosh
Brandon T. Page
Greg Jesmok
Denise V. Berg
Marlene Lopez
Deepshikha Upadhyay
David J. Stone
Scott C. Hauswirth
Eric O. Lindsey
Louis A. Scuderi
The increasing severity of wildfires in Western North America is widely hypothesized to lead to an increase in the likelihood of post-fire debris flows (PFDF), specifically those triggered by high-intensity rain. PFDF likelihoods are highest in the first year and tend to decrease over time. However, it is not well understood how seasonal variation affects PFDF initiation in the years following a fire. Here, we investigated how different physical parameters influence seasonal PFDF likelihood, informed by four years of field and satellite observations from the 2020 Lake Fire in Southern California. We found that unsaturated hydraulic conductivity was an order of magnitude greater during the dry season than during the wet season, significantly reducing the PFDF likelihood. Our simulations show that vegetation cover has less of an impact on PFDF likelihood than hydraulic conductivity or grain size. This study helps clarify the relative importance of hydraulic conductivity, grain size, and vegetation on PFDF as these parameters vary seasonally and evolve over four years after the fire. Our results suggest that seasonal variation plays a major role in determining PFDF likelihood and therefore, climatic and seasonal patterns need to be considered in future field and modeling studies.
- Article
(16080 KB) - Full-text XML
-
Supplement
(7002 KB) - BibTeX
- EndNote


Wildfires have increased in size and severity in recent years, especially in the western United States (Abatzoglou and Williams, 2016; Singleton et al., 2019). Wildfires significantly alter the landscape by increasing overland flow, which ultimately produces runoff-generated post-fire debris flows (PFDF) in steep basins when the infiltration rate capacity is overwhelmed by rainfall intensity (Kean et al., 2011, 2016). PFDF likelihood generally increases in areas with high-intensity fires where vegetation canopy interception is significantly reduced, topsoil hydrophobicity is increased (Granged et al., 2011; Nyman et al., 2014; Robichaud et al., 2016), and hydraulic roughness is reduced (e.g., Stoof et al., 2015; Hoch et al., 2021).
Runoff-generated debris flows are considered water-dominated flows that can include a wide range of sediment sizes (Kean et al., 2019), with initiation points varying significantly between watersheds (DeGraff et al., 2015; McGuire et al., 2017). The rainfall intensity-duration (ID) threshold defines the rainfall needed over a set duration that leads to the triggering of PFDF (Staley et al., 2013, 2017). Rainfall ID threshold is lowest in the first year for runoff-generated debris flows, regardless of the rainfall regional regimes (DeGraff et al., 2015; Hoch et al., 2021; McGuire et al., 2021). While the rainfall ID threshold increases over time, runoff-generated debris flows can still be triggered up to 10 years after a fire, especially in extreme precipitation events (DeGraff et al., 2015; Graber et al., 2023).
Estimating an accurate rainfall ID threshold for a large area can be challenging using generalized parameters, but we can attribute several parameters such as soil infiltration capacity, median grain size, and canopy interception that contribute to the yearly changes of PFDF likelihood in the southwestern United States (Ebel and Martin, 2017; Tillery and Rengers, 2020; McGuire et al., 2021; Hoch et al., 2021; Gorr et al., 2023). Additionally, recent studies have shown that seasonal variations in the first two years post-fire can alter the rainfall ID threshold (Gorr et al., 2023; Martinez et al., 2025) and that post-fire debris flows can still occur 3 years after the fire (Ridgway et al., 2026). However, it remains unclear how seasonal variations beyond the first two years may influence the PFDF likelihood.
In this study, we investigate how seasonal variation influences post-fire debris flow (PFDF) likelihood four years after the 2020 Lake Fire, drawing on information from five high burn severity basins. Specifically, we use data collected from three field surveys, conducted at 3 months (December 2020), 45 months (April 2024), and 50 months (September 2024) after the fire, along with high-resolution, high-repeat satellite imagery and field measurements to estimate how seasonal changes affect PFDF likelihood immediately after the fire and four years after the fire. Our study aims to (1) evaluate long-term changes in post-fire debris flow likelihood in high-burn-severity areas over the four years following a fire, (2) assess the relative importance of vegetation cover, hydraulic conductivity, and grain size in controlling the rainfall intensity-duration (ID) threshold over the long term, and (3) assess the significance of seasonal variation relative to long-term post-fire recovery. We find that the rainfall ID threshold remains highly sensitive to seasonal changes in soil hydraulic conductivity even several years after the fire. This study improves our understanding of how seasonality, climatic patterns, and post-fire recovery interact to drive PFDF dynamics.
The 2020 Lake Fire was the second-largest fire of the year in Los Angeles County, with an estimated burned area of ∼125.4 km2 (U.S. Geological Survey Landslide Hazards Program, 2021). US Burned Area Emergency Response (BAER) reports that the area of unburned and very low burn severity was ∼7 % (8.8 km2), low burn severity was ∼21 % (26.7 km2), moderate burn severity was ∼53 % (67.5 km2), and high burn severity was ∼18 % (23.1 km2) (USDA Forest Service, 2020) (Fig. 1). We selected five northwest-facing (Basin A–E), moderate-to-high burn severity basins with a high likelihood of debris flow (80 %–100 %) at a peak 15 min rainfall intensity of 24 mm h−1 (USGS Landslide Hazards Program, 2021) (Fig. 1). The basins are in the southern region of the burned perimeter, along Lake Hughes Road, with a mean slope of 34°, and a similar Late Cretaceous lithology of quartz diorite (Valencia et al., 2022). The fire burned within a largely unpopulated portion of the Angeles National Forest, with the overall land cover in the five basins exhibiting a mix of shrubs, deciduous forest, evergreen forest, and mixed forest, including bigcone Douglas fir (Pseudotsuga macrocarpa), oak, and gray pine (Fig. 3) (Yang et al., 2018).
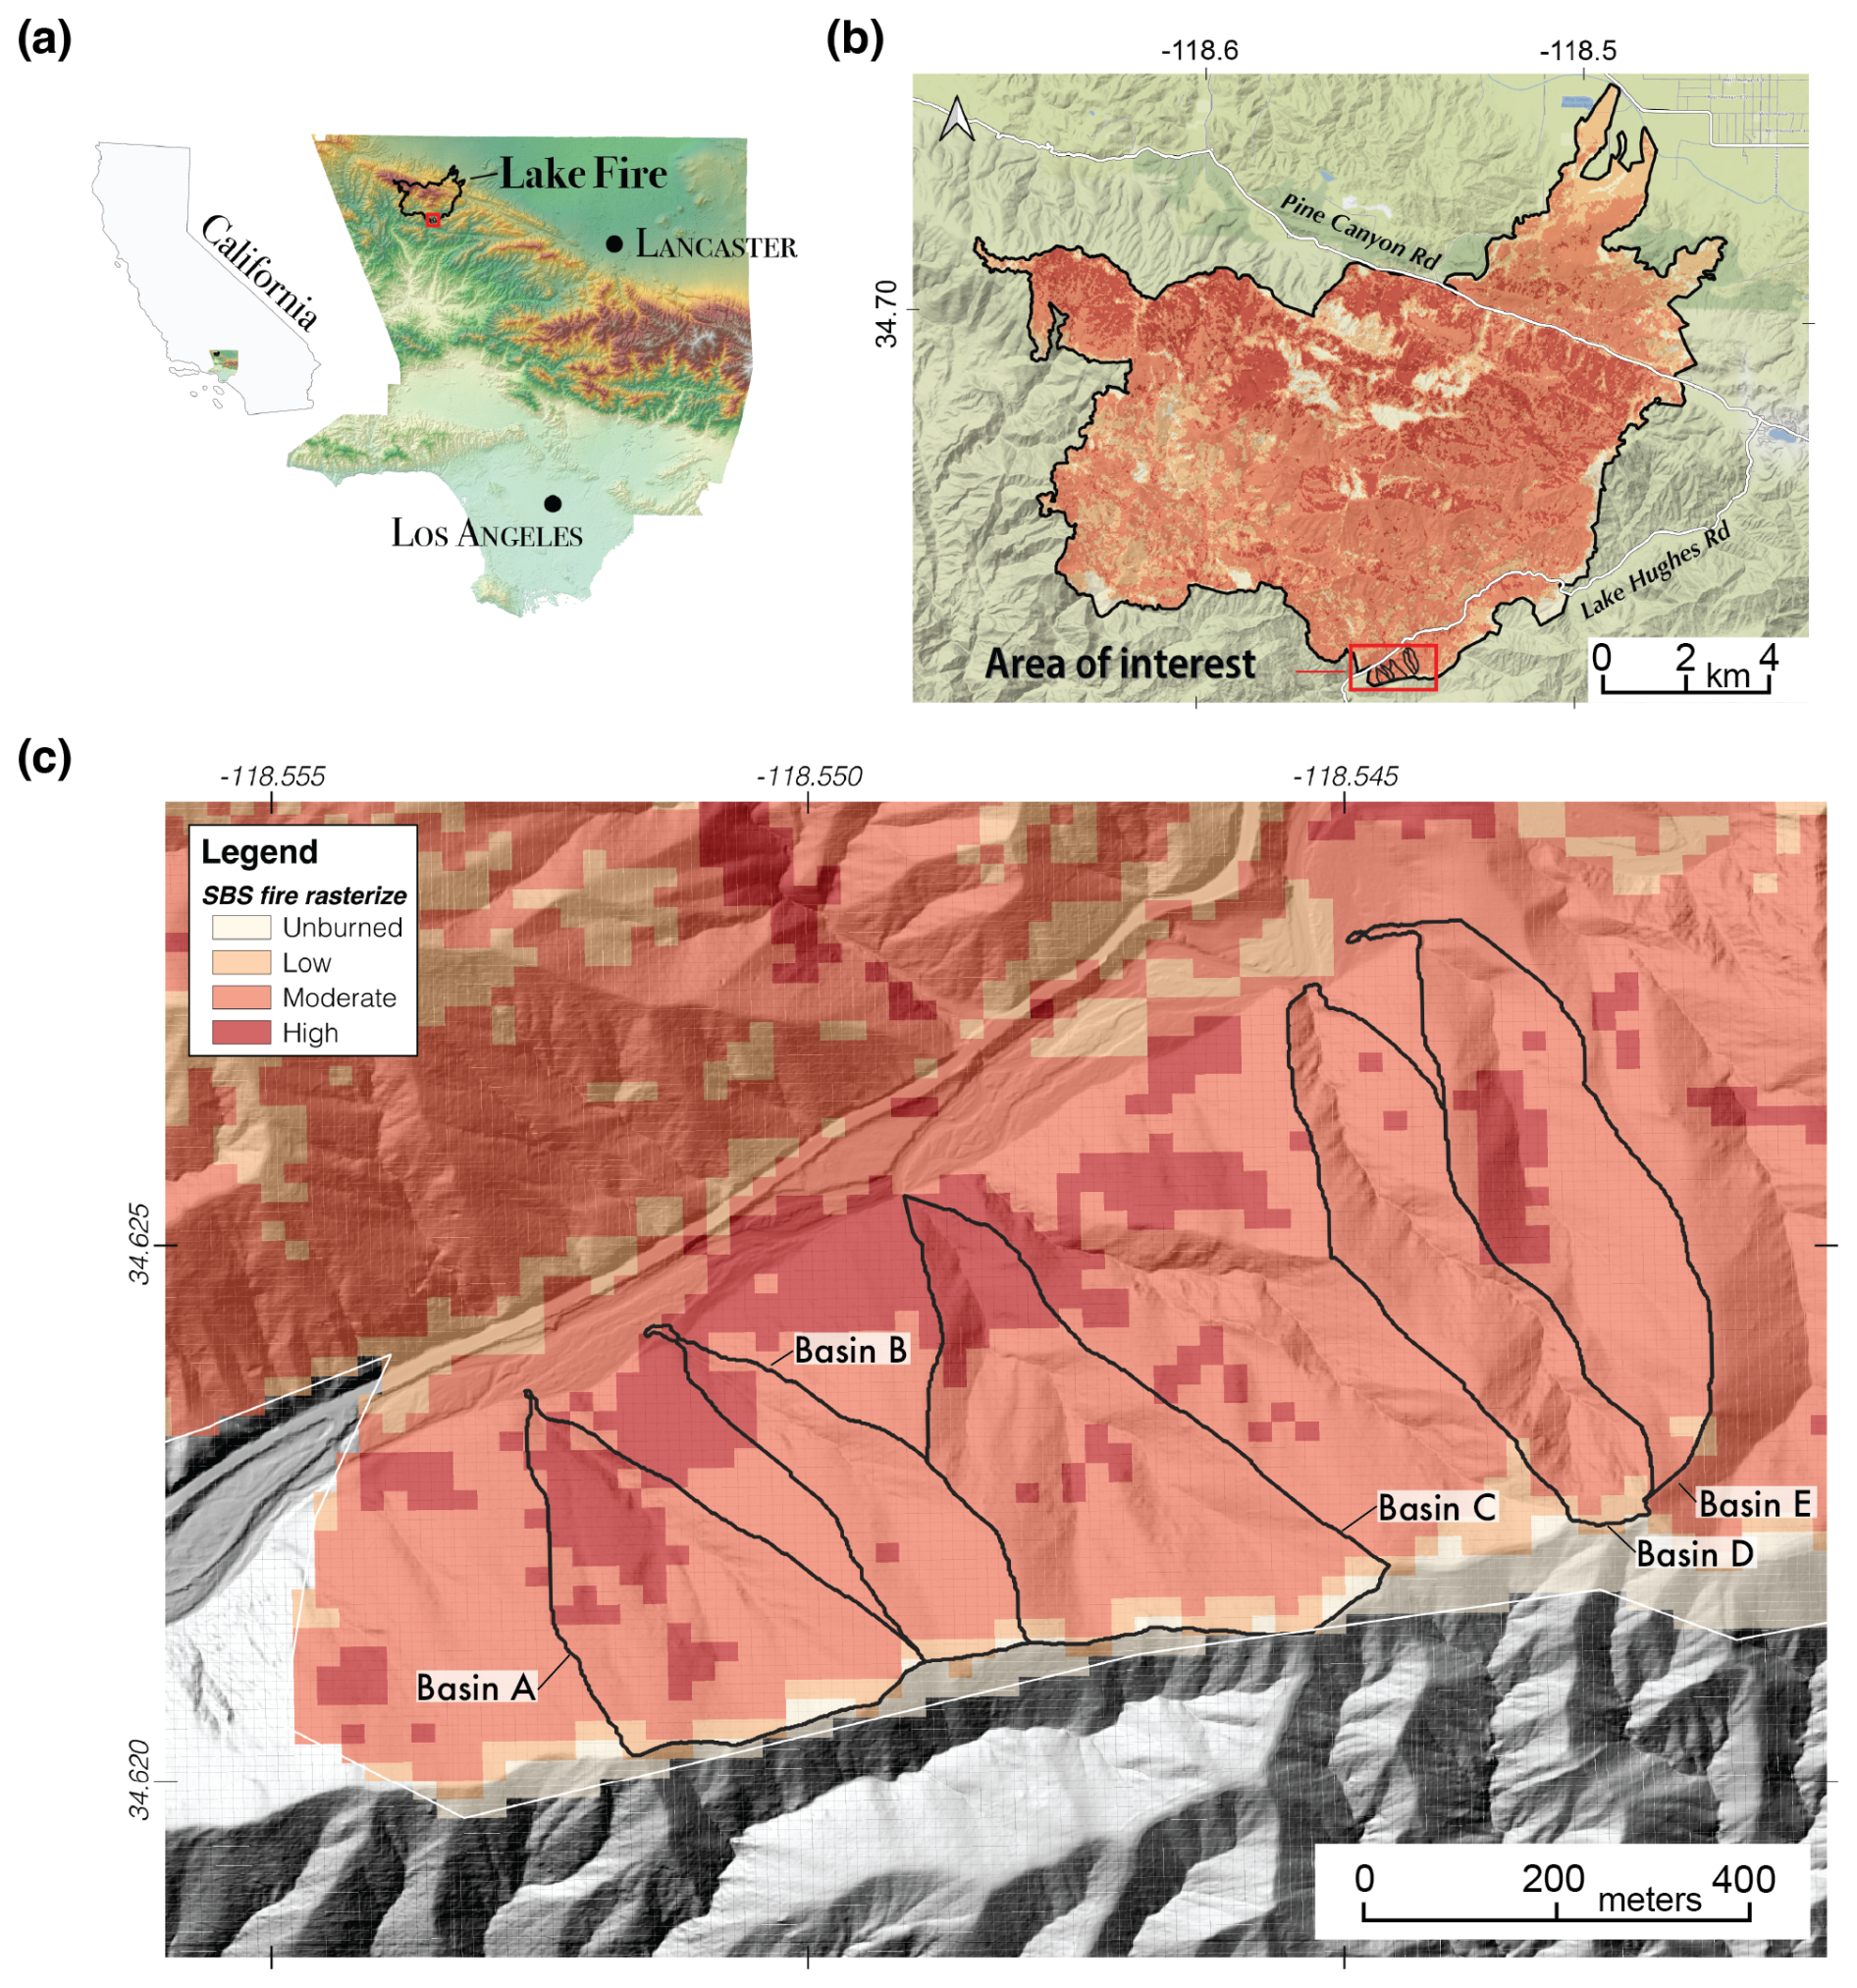
Figure 1(a) Location of study area within California and Los Angeles County, (b) The Lake Fire perimeter with different soil burn severity (SBS) from the US Forest Service (US BAER). (c) Close-up view of the study area (black outlines). Basin outlets are located at the northern tip of each basin.
3.1 Field sampling and observation
We selected five basins with the highest probability (high burn severity) for debris flow across all rain intensities, as predicted by the USGS Landslide Hazards Program. Post-fire field samples and measurements were collected at 3 months (December 2020), 45 months (wet season of Year 4), and 50 months (dry season of Year 4). We define the wet season (winter months) between November and March, and the dry season (summer months) between April and October. Due to the difficulty of accessing the basin interiors, we collected field samples at basin outlets for grain size analysis, assuming most eroded sediment passes through the main channel (Santi et al., 2008) (Fig. 2). We measured unsaturated soil hydraulic conductivity for the second and third field surveys using a Mini Disk Infiltrometer METER Group (METER, 2021) adjacent to our soil samples within the basin outlet without disturbing the surface material (i.e., flattening the surface) (Watson and Luxmoore, 1986). We only report the initial hydraulic conductivity values for each basin, as there is a limited undisturbed area with a suitable flat area. During the first field survey, due to limited instrumentation and access, we assumed a hydraulic conductivity of 10 mm h−1 as a conservative estimate based on data from the 2016 Fish Fire in the adjacent San Gabriel Mountains with no vegetation cover (McGuire et al., 2021). We also performed a Water Droplet Penetration Test (WDPT) at the basin outlets during this survey. The 2016 Fish Fire occurred in an area with similar granitic bedrock, average slope (46–51°), northwest-facing aspect, and vegetation types as compared to the 2020 Lake Fire (Table S7 in the Supplement) (McGuire et al., 2021; Staley et al., 2018; Paysen et al., 1980). We also collected soil core samples (down to 20 cm) during the second and third surveys and visually inspected for stratification. The canopy throughfall coefficient was defined as the open space calculated by subtracting the satellite-derived vegetation cover (Sect. 3.3) from 1 (100 %).

Figure 2Field comparison of the three field surveys (December 2020, April 2024, and September 2024). (a) Direct view of the Basin A outlet and the location of soil collection in December 2020. (b) Same as (a) in September 2024. (c) Looking NW towards the vegetation differences between burned and unburned in September 2024, arrow indicates basin location only. (d) Basin A in December 2020. (e) Looking NE from Basin A to Basin B in April 2024. (f) Same as (e), but in September 2024, the box identifies the same tree as a reference. (g) Looking south at Basin D in April 2024 from the highway. (h) Looking SW at Basin D with the river of lower height in September 2024.

Figure 3dNDVI of the study sites (a) changes immediately after the fire, (b–e) the subsequent 4 years, and (f) vegetation classification from NLCD2019 (Yang et al., 2018). Cooler colors indicate an increase in the green index (i.e., vegetation), and warmer colors indicate a loss of the green index (i.e., soil exposure, drying vegetation). The grain sizes of each of the first field surveys are indicated by the circles labeled with the median grain size in mm (d50).
3.2 Precipitation record
Rainfall intensity was calculated from the precipitation record obtained from the Los Angeles Department of Public Works (LADPW) Elizabeth Lake monitoring site, located 1 mile southeast of the area of interest (34.6083, −118.5594). To evaluate whether each precipitation event can trigger debris-dominated or water-dominated flows, we report the peak 15 min rainfall intensity (I15) for each year. The threshold used to distinguish between these flow types is based on the lower limit of the dimensionless discharge threshold defined in Tang et al. (2019a). We apply the same threshold to our modeling results as a conservative estimate to trigger debris flows.
Rainfall intensity was highest in the first year at I15∼13 mm h−1. A total of 12 precipitation events exceeded I15=15 mm h−1 throughout the study period. 4 events exceeded I15=20 mm h−1, but none exceeded I15=25 mm h−1 (Table S6; Fig. S2 in the Supplement). Specifically, these 12 events occurred as follows: 2 events in November 2021–March 2022 (mean I15=20.32 mm h−1 and max I15=22.35 mm h−1), 7 events during the November 2022–March 2023 wet season (mean I15=19 mm h−1, max I15=24.38 mm h−1), 1 event in the dry season of August 2023 (I15=18.28 mm h−1), and 2 events in February 2024 (mean I15=17.65 mm h−1, max I15=19.03 mm h−1).
The cumulative rainfall recorded for the first, second, third, and fourth years was 127.5, 404.1, 1329, and 693.7 mm, respectively. There was a cumulative rainfall of 25.4 mm before the first survey in December 2020, with a maximum 15 min duration (I15) of ∼1 mm h−1 during this period.
3.3 Differenced Normalized Difference Vegetation Index (dNDVI)
We estimated vegetation change using high-resolution satellite imagery spanning from pre-fire to the fourth year post-fire. We acquired PlanetScope (3 m) images and calculated the Normalized Difference Vegetation Index (NDVI) (Eq. 1) within the basins and estimated the differences between two dates of interest, a reference and a subsequent image, to estimate the vegetation change and possible soil mobilization (i.e., debris flows) (Eq. 2). Here we classify “pre” and “post” imagery as the before and after the Lake Fire. “Reference” imagery represents the earlier-date image (which may be before or after the fire), and “subsequent” represents the later-date image.
We applied several selection criteria for PlanetScope imagery, including being cloud-free within the area of interest, high solar elevation angle (45–90°) to reduce shadow artifacts, and interoperable with image products from Sentinel-2 (PSB.SD). PlanetScope images consist of 8 bands: Red-sixth band, Green-fourth band, Blue-third band, and Near-infrared-eighth band. We calculated NDVI for each image in QGIS's raster calculator using the following equation (Carlson and Ripley, 1997):
where Near-Infrared (NIR) is the eighth band, and Red is the sixth band. The NDVI values range between −1 and 1.
Positive NDVI values indicate greener or healthier vegetation, whereas lower or negative NDVI values show less healthy vegetation, bare soil, snow, or water (e.g., Dye and Tucker, 2003). Pixels with vegetation loss or exposed bare ground exhibit lower dNDVI values, whereas vegetation growth or increased cover is represented by higher dNDVI values. Although it is difficult to distinguish debris flows and flood events solely from satellite imagery, areas affected by sediment accumulation or high erosion could still show lower dNDVI values (<0) due to the lack of vegetation or exposed soil. The use of dNDVI is similar to the differenced normalized burn ratio (dNBR), which uses Landsat's mid-infrared band (Miller and Thode, 2007):
where dNDVI represents the difference in the Normalized Difference Vegetation Index.
A total of 61 monthly images were acquired from August 2020 (including 3 months before the fire) to September 2024, conforming to the aforementioned criteria (Table S1 in the Supplement). For simplicity, we compare yearly dNDVI changes to estimate vegetation cover for our model input while qualitatively tracking vegetation recovery and loss (Table 1). Our yearly dNDVI images begin and end in either August or September to align with the fire's conclusion in September 2020. We also processed dNDVI between our two surveys in 2024 (Fig. 4) and defined the observation period leading up to our field surveys: Year 4-Wet spans September 2023 to April 2024, and Year 4-Dry spans April 2024 to September 2024.
Table 1Pairs of dNDVI images used to track the yearly vegetation cover and vegetation recovery estimates. Year 4-Wet and Year 4-Dry are defined as the observation period leading up to the field surveys, which also correspond to the seasonal conditions.
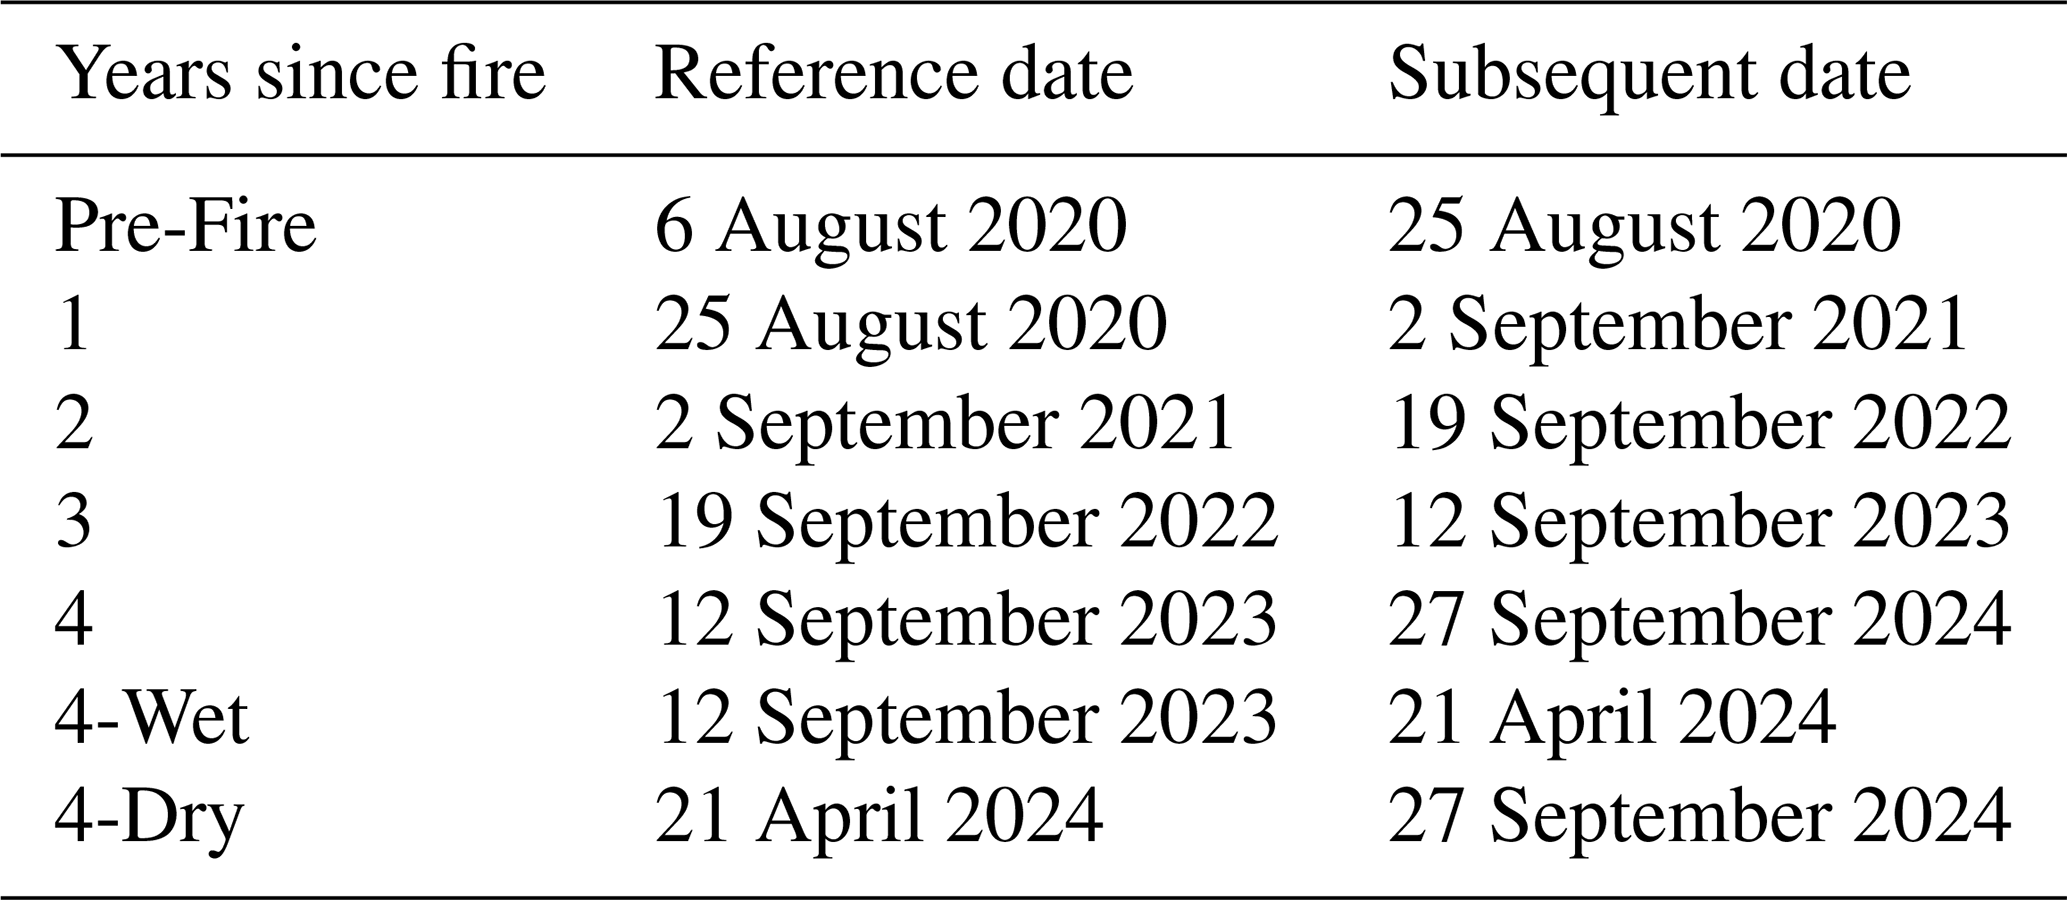

Figure 4dNDVI of the two field surveys (April 2024 and September 2024) post-September 2023. The bottom panel shows a close-up view of the basin outlets. Values within (a) and (b) represent the median grain sizes (mm) shown here are listed in Table 2.
We estimated vegetation cover within each basin using dNDVI from satellite imagery by calculating the fraction of pixels with dNDVI values greater than 0, which are considered to be vegetated (Table 2). The dNDVI values are later used as an input for PFDF likelihood modeling. We also performed a 20 m point-intercept survey (Herrick et al., 2009) during the second field survey along the riverbank outside the burn scar to validate our dNDVI values for vegetation cover. We noted the surface cover (canopy/vegetation, litter, or soil) every 20 cm, where litter refers to exposed loose plant material, and calculated the vegetation cover as the fraction of points intercepting canopy or vegetation.
Table 2Input parameters for our dimensionless discharge model over time. Our satellite-derived dNDVI is used for vegetation cover; vegetation cover is assumed to be zero immediately after the fire (Year 0), and vegetation cover at 12 months is estimated from our dNDVI values; see the methods section. The wet season survey was conducted 45 months post-fire (April 2024) and the dry season survey 50 months post-fire (September 2024). We assumed similar grain sizes from the first survey for 3 months and 12 months after the fire. d50 and d84 denote the median and 84th percentile grain sizes, respectively.
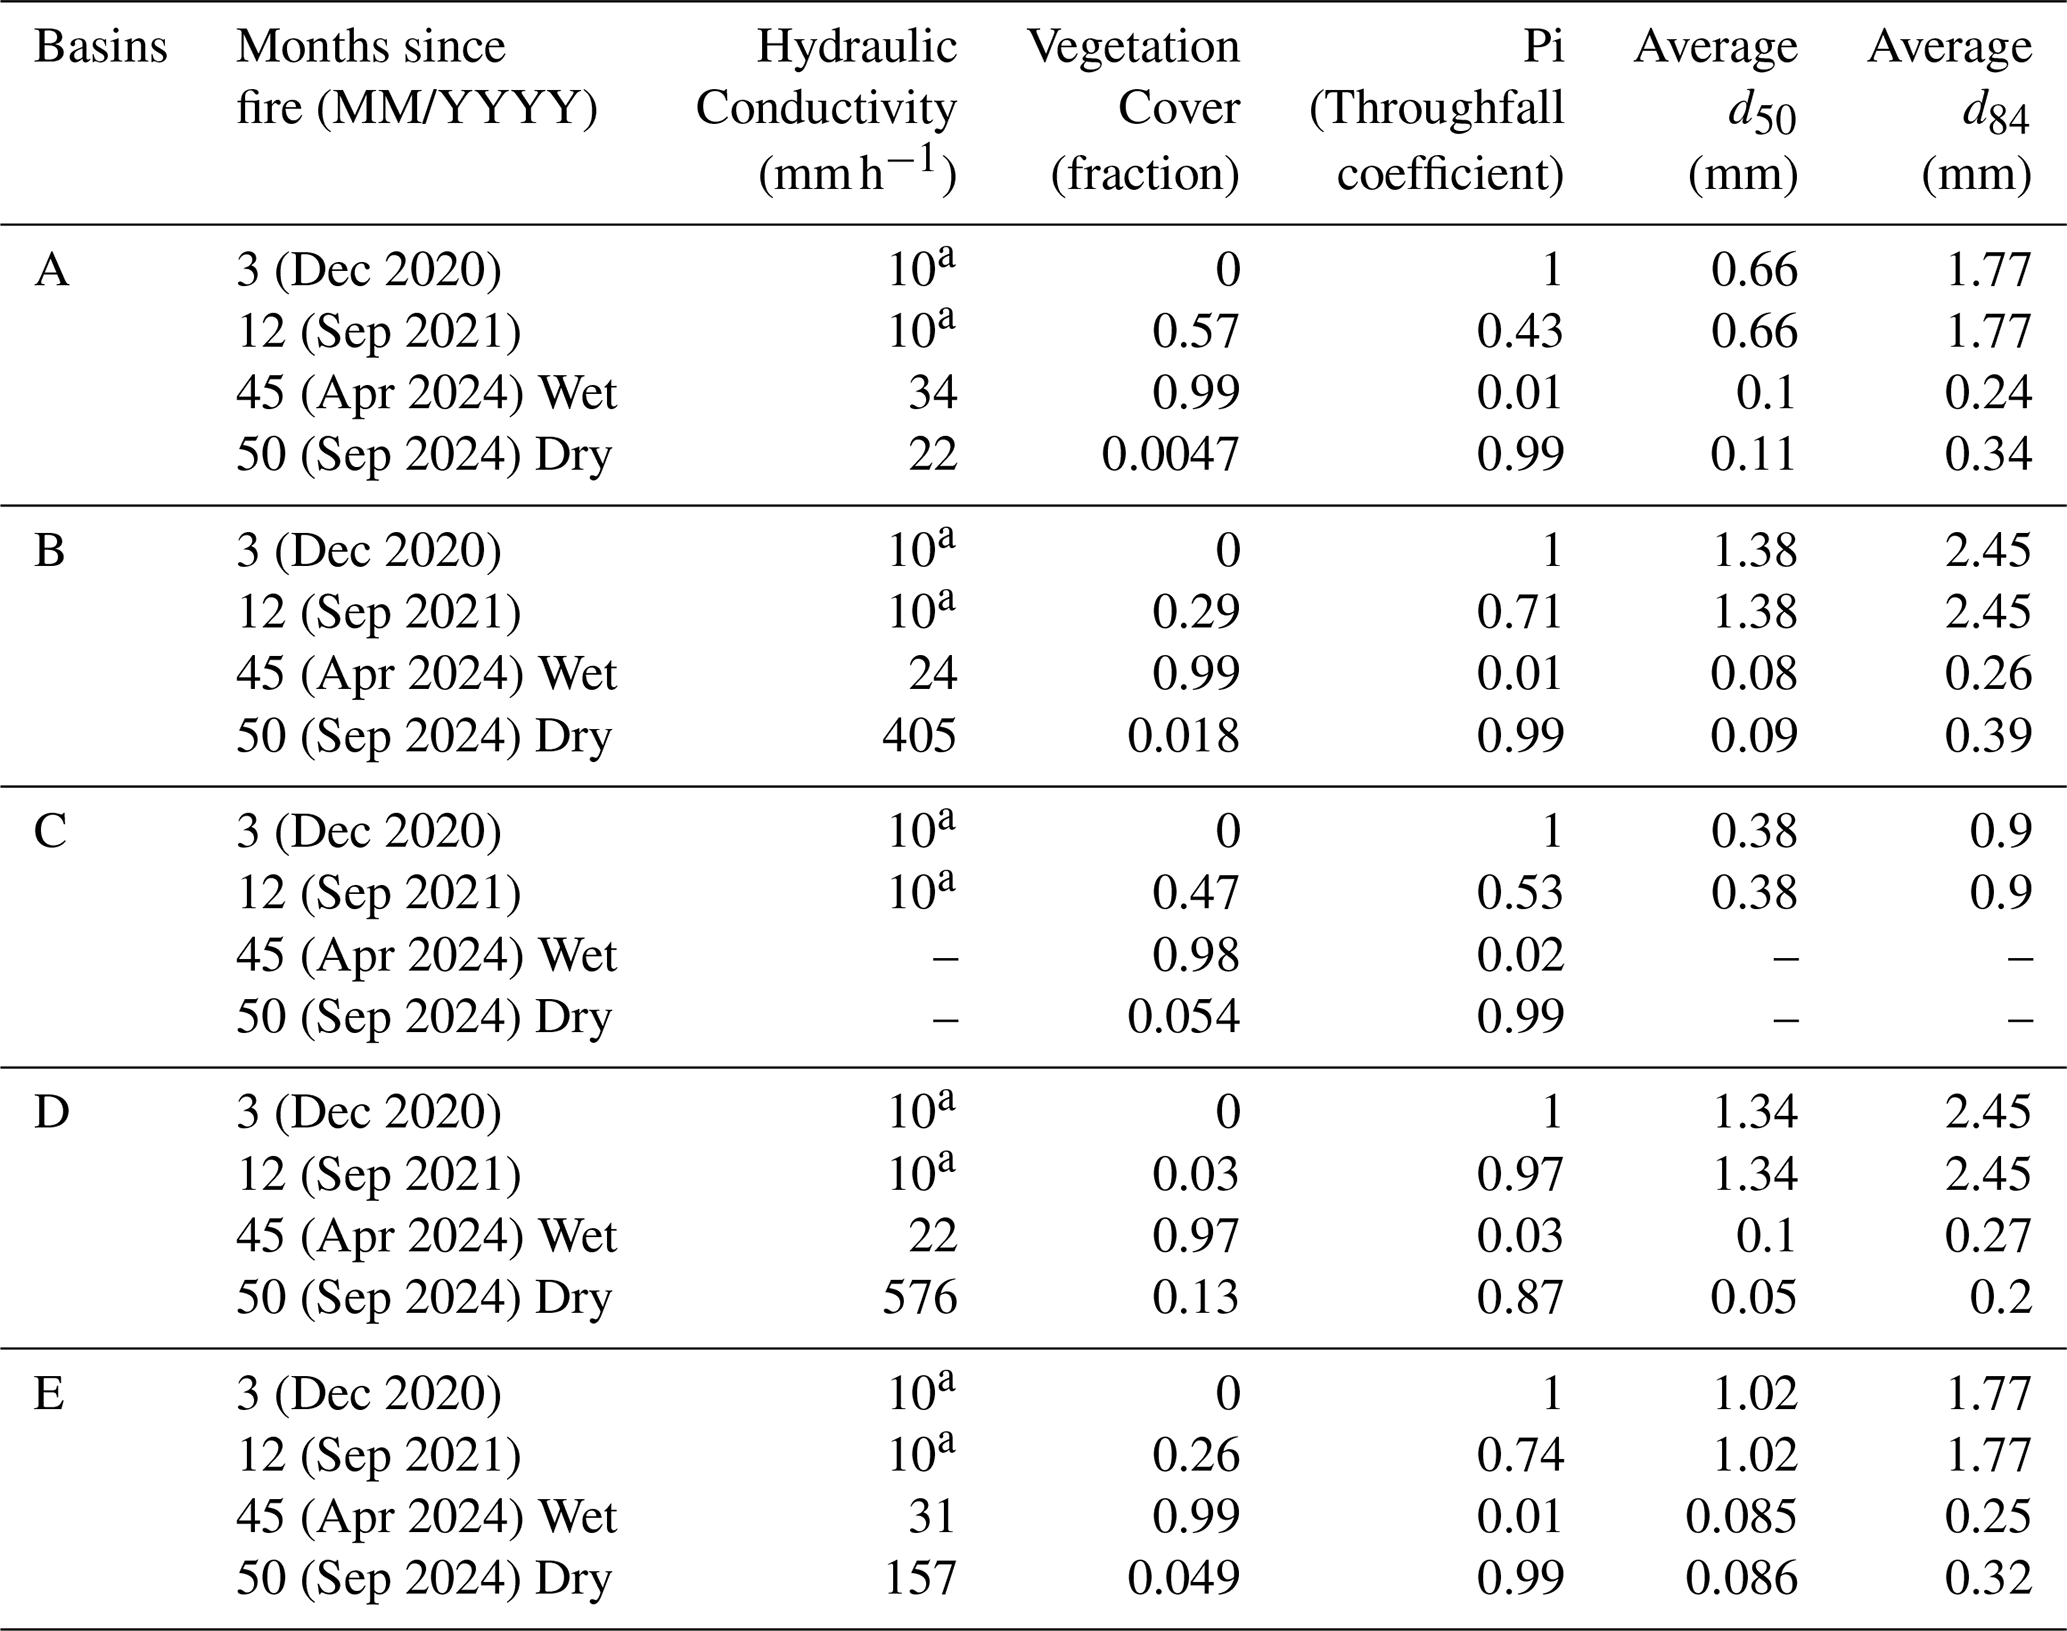
a denotes values used from the 2016 Fish Fire from McGuire et al. (2021). Basin C is excluded from the study as it does not have subsequent measurements due to accessibility issues in the second and third surveys.
3.4 Numerical modeling inputs
We used a modeling approach to investigate the effects of the measured parameters on PFDF initiation, regardless of whether debris flows actually occurred within the study area. We used the KWAVE numerical model (Rengers et al., 2016b, 2019), which uses the kinematic wave approximation for overland flow routing, the Green-Ampt equation for infiltration, and the Rutter et al. (1975) for canopy interception, to simulate runoff discharge. We then used a slope-dependent dimensionless-discharge numerical model to estimate the rainfall intensity-duration (ID) needed to trigger runoff-generated debris flows based on simulated infiltration, interception, and runoff across a catchment's topography (Tang et al., 2019b). In this study, we varied the input parameters, including the unsaturated hydraulic conductivity, vegetation cover, grain size, and rainfall intensity, while maintaining other parameters constant across basins and years (Sect. S4 in the Supplement). A complete list of input parameters used in our models is provided in Table 2 and the Supplement (Sect. 4 and Table S2).
We estimated the rainfall ID thresholds needed to trigger runoff-generated debris flows for all sampled basins for Year 0 (immediately after fire), Year 1 (one year after the fire), Year 4 (Wet), and Year 4 (Dry). The threshold for post-fire debris flow initiation (red line in Fig. 5) is based on the calibrated lower limit threshold from the Fish Fire (Tang et al., 2019a). We used a 1 m bare-Earth DEM acquired by the USGS 3DEP lidar program before the fire (last accessed December 2020 from OpenTopography).
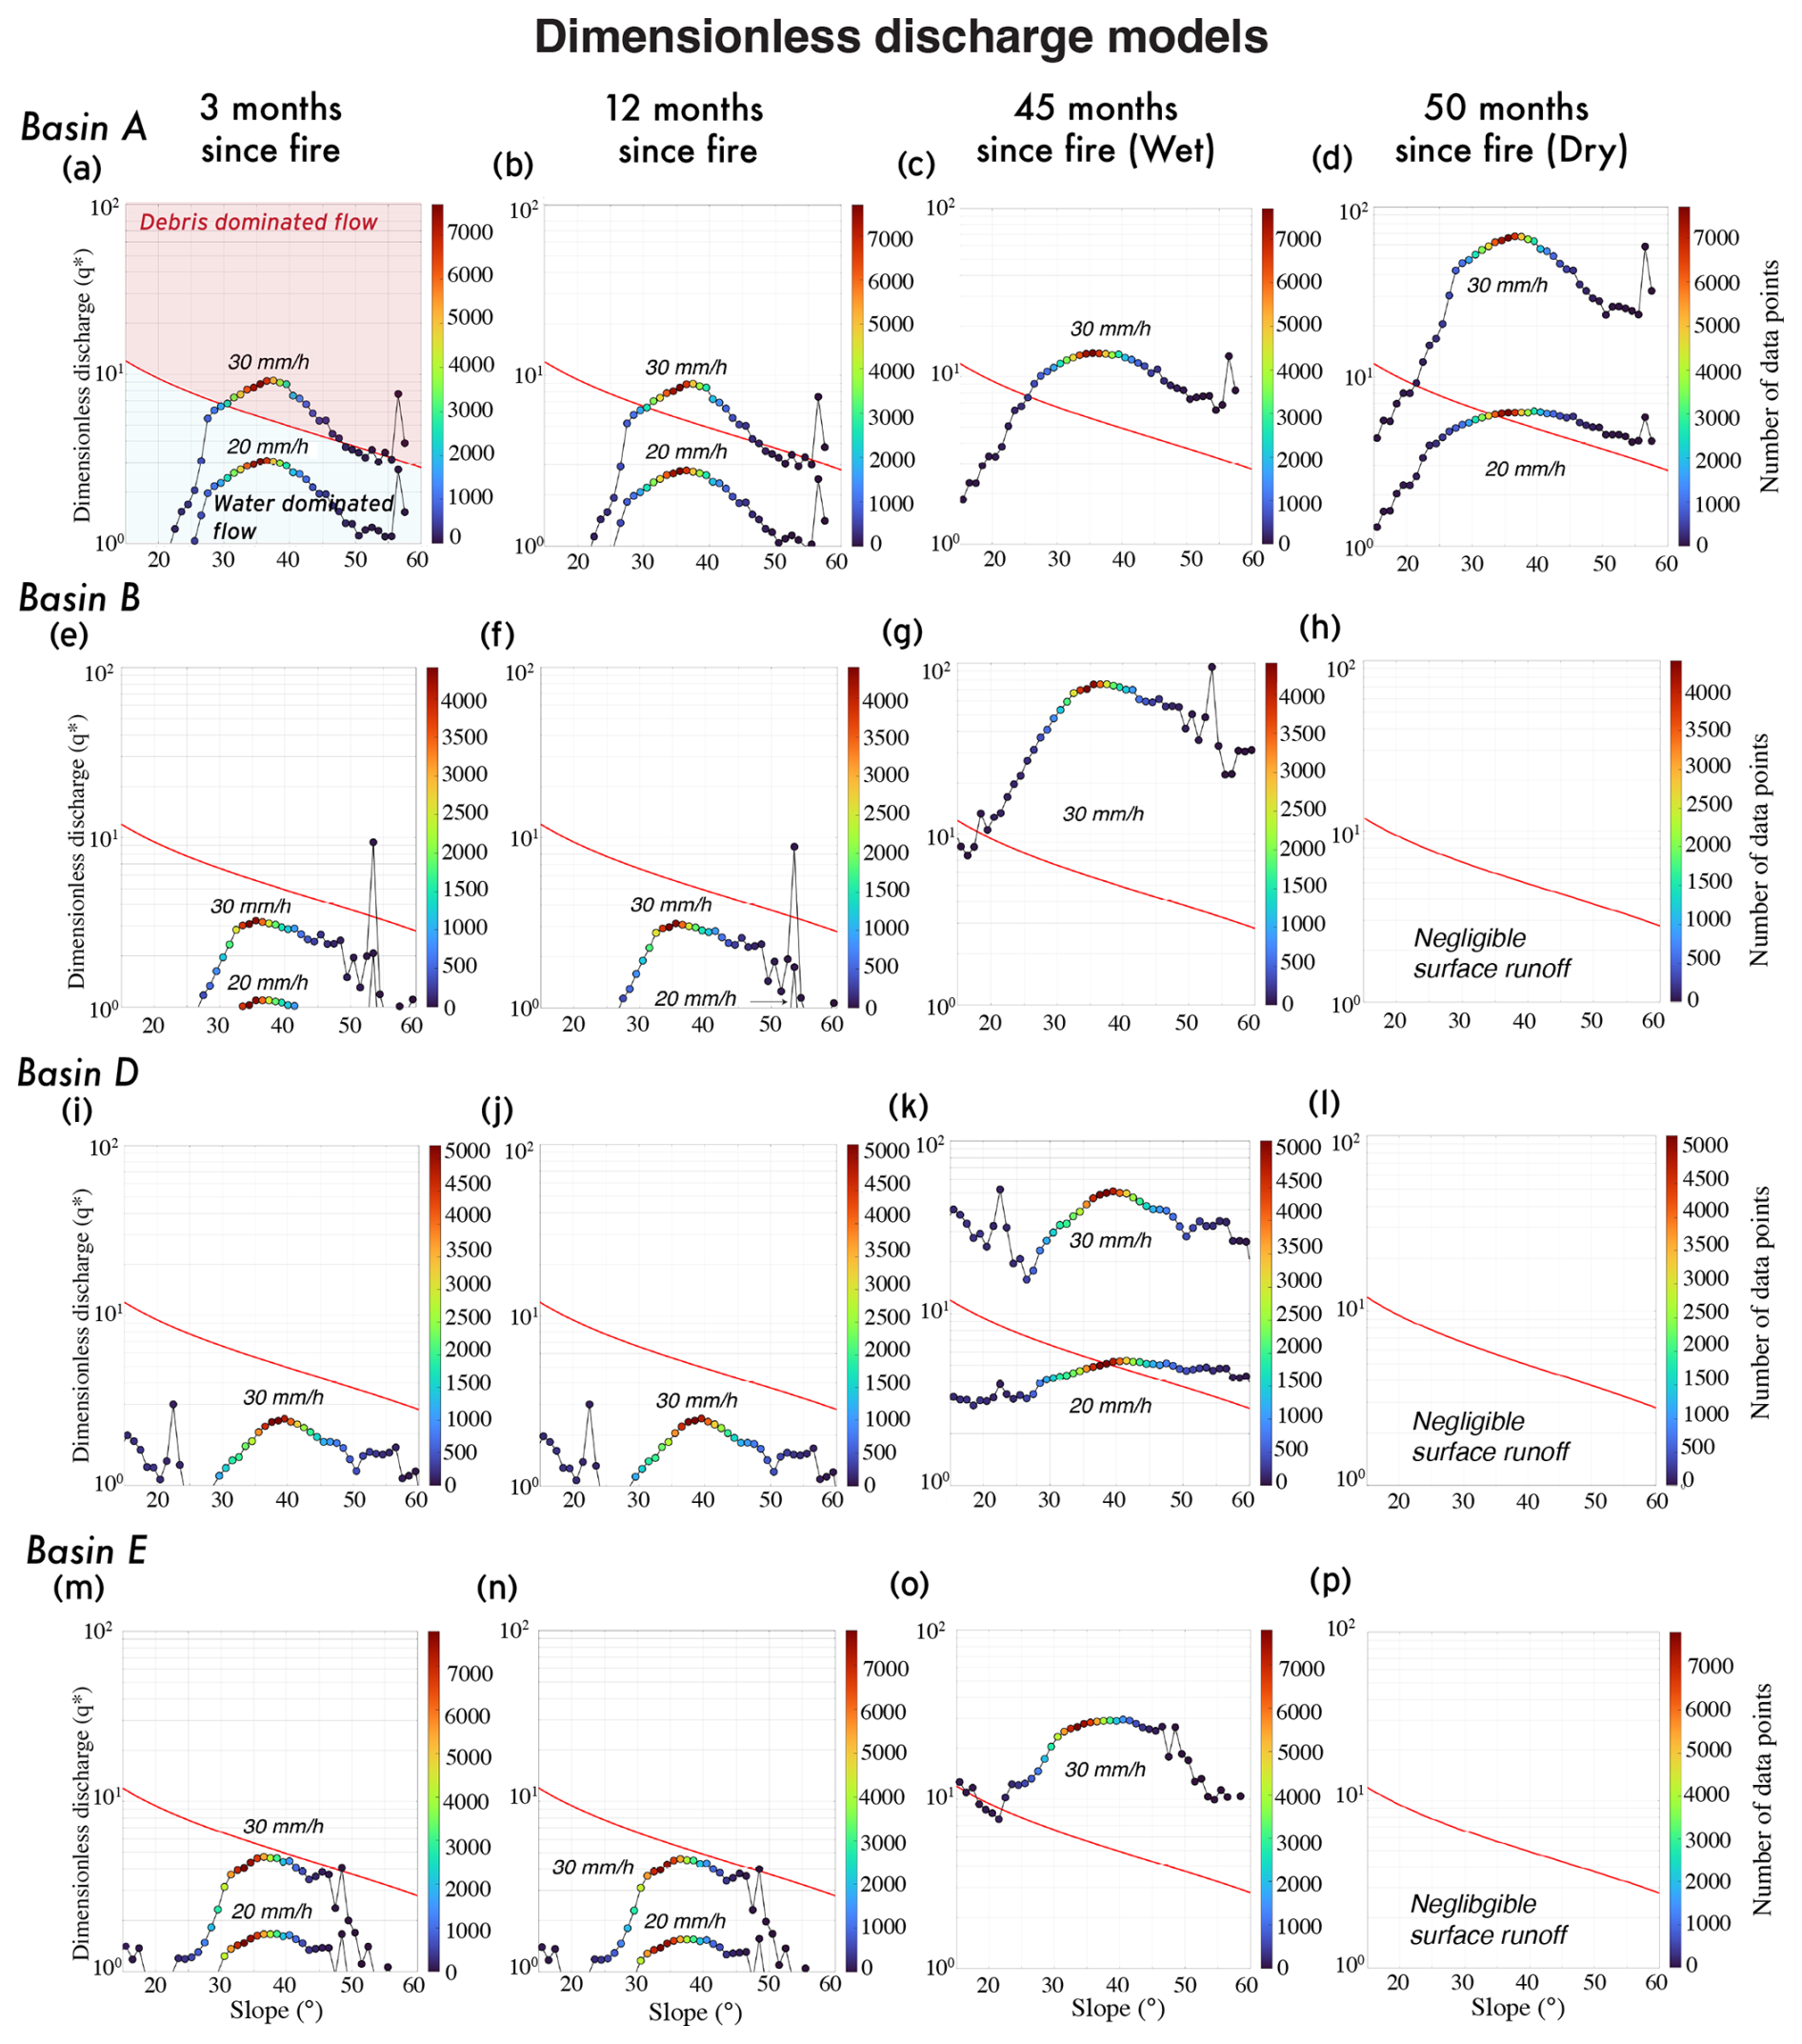
Figure 5Modeled dimensionless discharge for Basins A, B, D, and E, showing the slopes (x axis) within each basin exceeding the debris flow initiation threshold (red line) at different 15 min rain intensities (i.e., I15=20 or 30 mm h−1). Slopes above the threshold indicate debris-dominated flow conditions; slopes below indicate water-dominated flow. The color bar represents the number of data points per slope bin. Modeled results for 3 months post-fire use measured grain sizes and dNDVI-derived vegetation cover (zero vegetation cover) and a hydraulic conductivity of 10 mm h−1. 12 months post-fire assumes the same soil properties from the first field survey (3 months post-fire) but with dNDVI-derived vegetation cover. The remaining two panels represent field surveys conducted at 45 months post-fire (wet season) and 50 months post-fire (dry season), using measured hydraulic conductivity, grain sizes, and dNDVI-derived vegetation cover. Basin C is excluded due to insufficient data from subsequent surveys.
Our simulations use an idealized Gaussian rainfall intensity distribution at 15 min intensities (I15) of 15, 20, and 30 mm h−1. We selected these intensities based on rain intensities recorded at the Elizabeth Lake rain gauge, which has a maximum 5-year recurrence interval for I15 of 30 mm h−1 (NOAA, last accessed July 2025). Our highest simulated rain intensity is sufficient, given that most PFDFs in the southwest United States are triggered during rain events with recurrence intervals of less than 2 years (Staley et al., 2020). In our simulations, we input the parameters (i.e., grain size distribution, hydraulic conductivity, and vegetation cover) from our field and satellite observations to estimate the rainfall ID threshold needed to trigger runoff-generated debris flows across the four basins.
For Year 1, we assumed that only vegetation cover changed during that period, while maintaining other parameters the same as in Year 0. Grain size distributions (d50 and d84) were measured from samples collected during all three field surveys. Field-measured unsaturated hydraulic conductivity values were measured during the final two surveys (wet and dry seasons in 2024) and used directly as model input (Table 2).
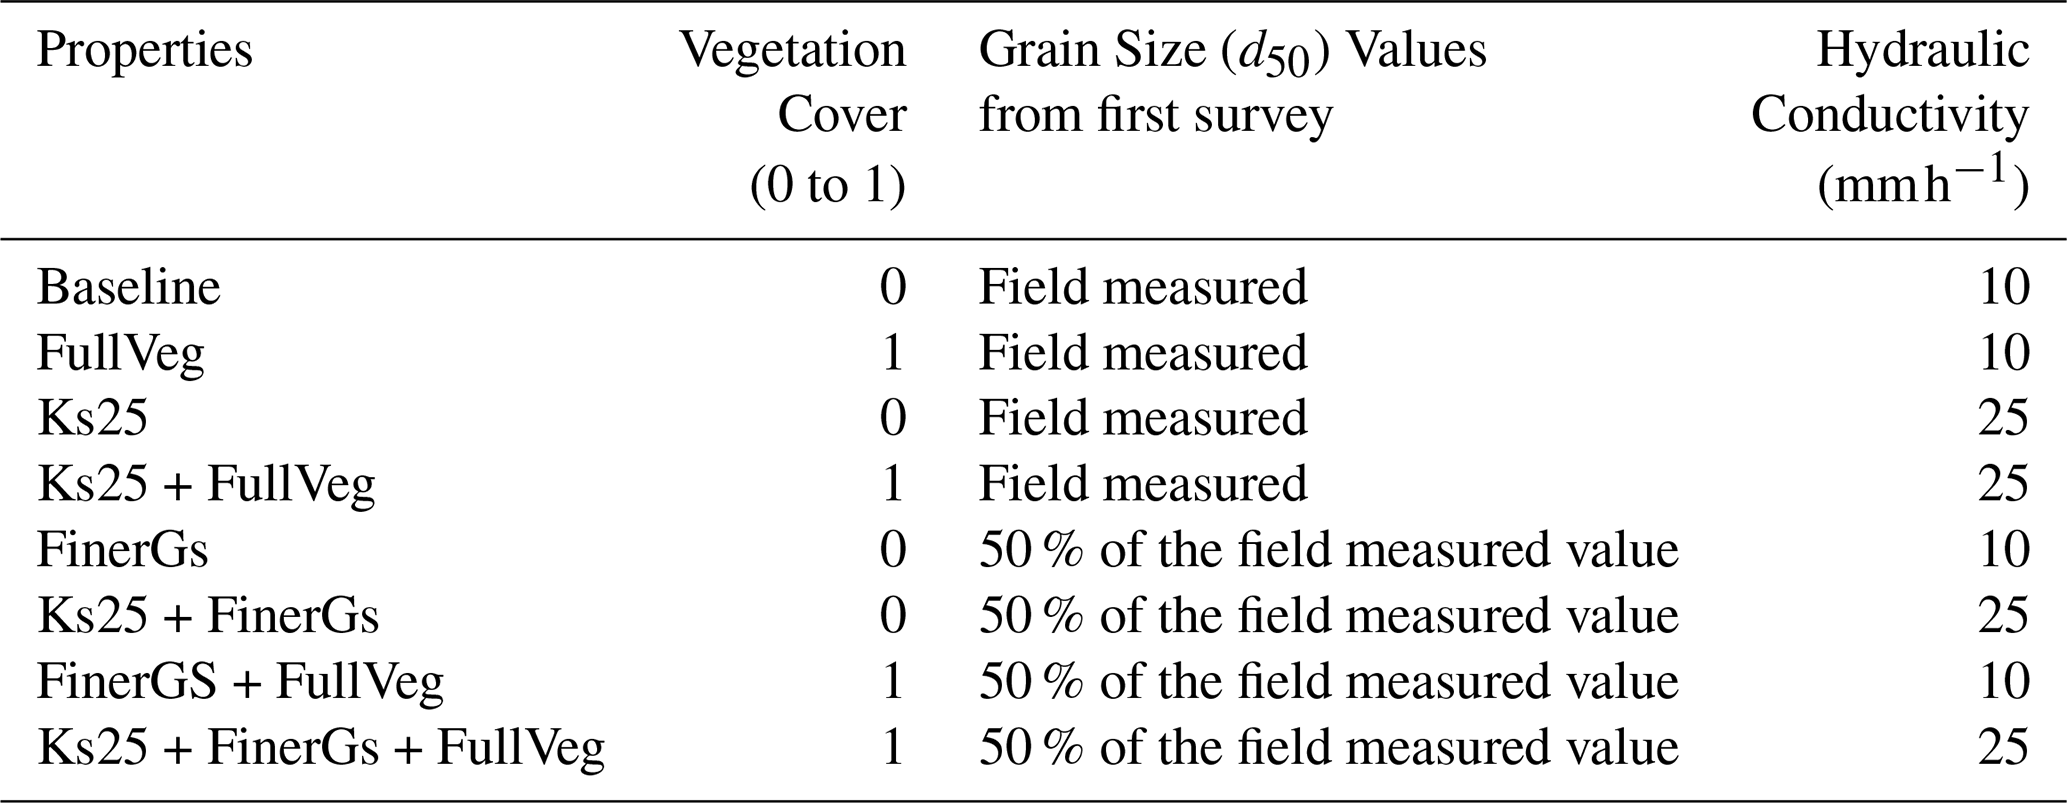
Additionally, we performed a sensitivity analysis to better understand how each parameter influences the PFDF likelihood across all basins using the dimensionless discharge model (Tang et al., 2019a) (discussed in Sect. 5.2). More specifically, we varied the individual parameters in our model input (i.e., hydraulic conductivity, vegetation cover, and grain size) either one at a time or by changing more than one parameter simultaneously at different rain intensities (i.e., I15=10, 20, 30, and 40 mm h−1). All simulations started with the baseline parameters based on the field surveys and assumptions immediately after the fire: a hydraulic conductivity of 10 mm h−1, no vegetation cover (0 %), and median grain sizes measured for each basin from the first-year survey.
Postfire recovery surveys
Our dNDVI results show the burn perimeter outlined clearly with the negative dNDVI values (corresponding to vegetation loss) immediately following the fire (Fig. 3a). The most negative dNDVI values correspond to the lower elevations of Basin C, in the larger basin north of Basin C, and along the main river channel. These negative dNDVI values may indicate significant vegetation loss, increased soil exposure, or sediment deposition (e.g., a culvert transporting sediment across Basin C). The areas with the lowest dNDVI values correspond closely to locations identified as high burn severity by the US Burned Area Emergency Response (BAER), which uses either Landsat or Sentinel-1 for their estimates. During the first field survey, we did not observe any changes after 10 min during the Water Droplet Penetration Test, indicating a strong repellency. We also identified dry ravel, including on slopes outside our basin boundaries.
Immediately after the fire, our simulations show that Basins A, B, D, and E require a minimum of I15=30 mm h−1 to trigger runoff-generated debris flows (Fig. 5), although there were no significant high-intensity rainfall events recorded during that period (Fig. S3 in the Supplement). Basin C is excluded from this analysis as we did not have sufficient data collected in the subsequent years. We found an overall decrease in median grain size from the first survey was larger than in the subsequent surveys (i.e., the second and third surveys) (Table 2).
One year post fire
In Year 1, the precipitation record shows lower cumulative precipitation than in subsequent years and a peak rainfall intensity (I15) of 13 mm h−1 (Fig. S2). The majority of positive dNDVI values are located along the river and within some of the basins (i.e., Basin A, Basin C, and Basin E). We also observe a positive dNDVI region along the slopes downstream of Basin A, which we interpret as rapidly growing vegetation (i.e., grasses). Given the maximum observed rainfall intensity throughout the year (max I15=13 mm h−1), we found that runoff-generated debris flow is unlikely to occur during this period because the rainfall intensity threshold (I15=30 mm h−1) was not exceeded (Fig. 5).
Two years post fire
In Year 2, there is an increase in areas with negative dNDVI values along the river, possibly indicating sediment deposition or exposure of soil. The negative dNDVI along the river is unlikely to indicate vegetation die-off due to the surrounding positive dNDVI during the same period (Fig. 3c). We also identified negative dNDVI values southeast of our basins on the slope face, outside of the burn perimeter, but we could not discern if they indicate erosional or depositional features. We propose that the negative dNDVI along the river is likely associated with sediment deposition, given that we recorded days with higher rain intensities (March 2022 exceeded I15=20 mm h−1) that could trigger debris flows either within our basins or upstream (outside our study area).
Three years post fire
In Year 3, we observed a greater positive dNDVI along the river than in the basins, which likely indicates increased vegetation growth along the river due to increased precipitation, as recorded in the precipitation record (Fig. S2). Seven events exceeded 15 mm h−1 within this period, of which three exceeded 20 mm h−1 (Fig. S2). Due to road closures that prevented access to the site, we are unable to verify if the negative dNDVI within portions of the hillslopes and along the river was due to sediment erosion or debris flows (Fig. 3c and d).
Four years post fire
Increased positive dNDVI in the basins and negative dNDVI along the river were observed from September 2023 to April 2024, supported by field observations (Figs. 3e and 4). We posit that the positive dNDVI is indicative of the growth of dense shrubs and grasses due to increased precipitation in the months prior, while negative dNDVI values indicate sediment deposition or removal from rain events, vegetation change, or water ponding. Between April 2024 and September 2024 (Fig. 4), we observed significant vegetation change, with basin slopes exhibiting negative dNDVI values and areas along the river exhibiting positive dNDVI, possibly showing different vegetation responding to the seasonal changes with the shift from wet season to dry season (Fig. 2e and f). Measured hydraulic conductivity increased by nearly an order of magnitude except for Basin A (Table 2). Grain sizes were comparable between April 2024 and September 2024 across all basins but were generally reduced compared to the first survey in 2020 (Table 2).
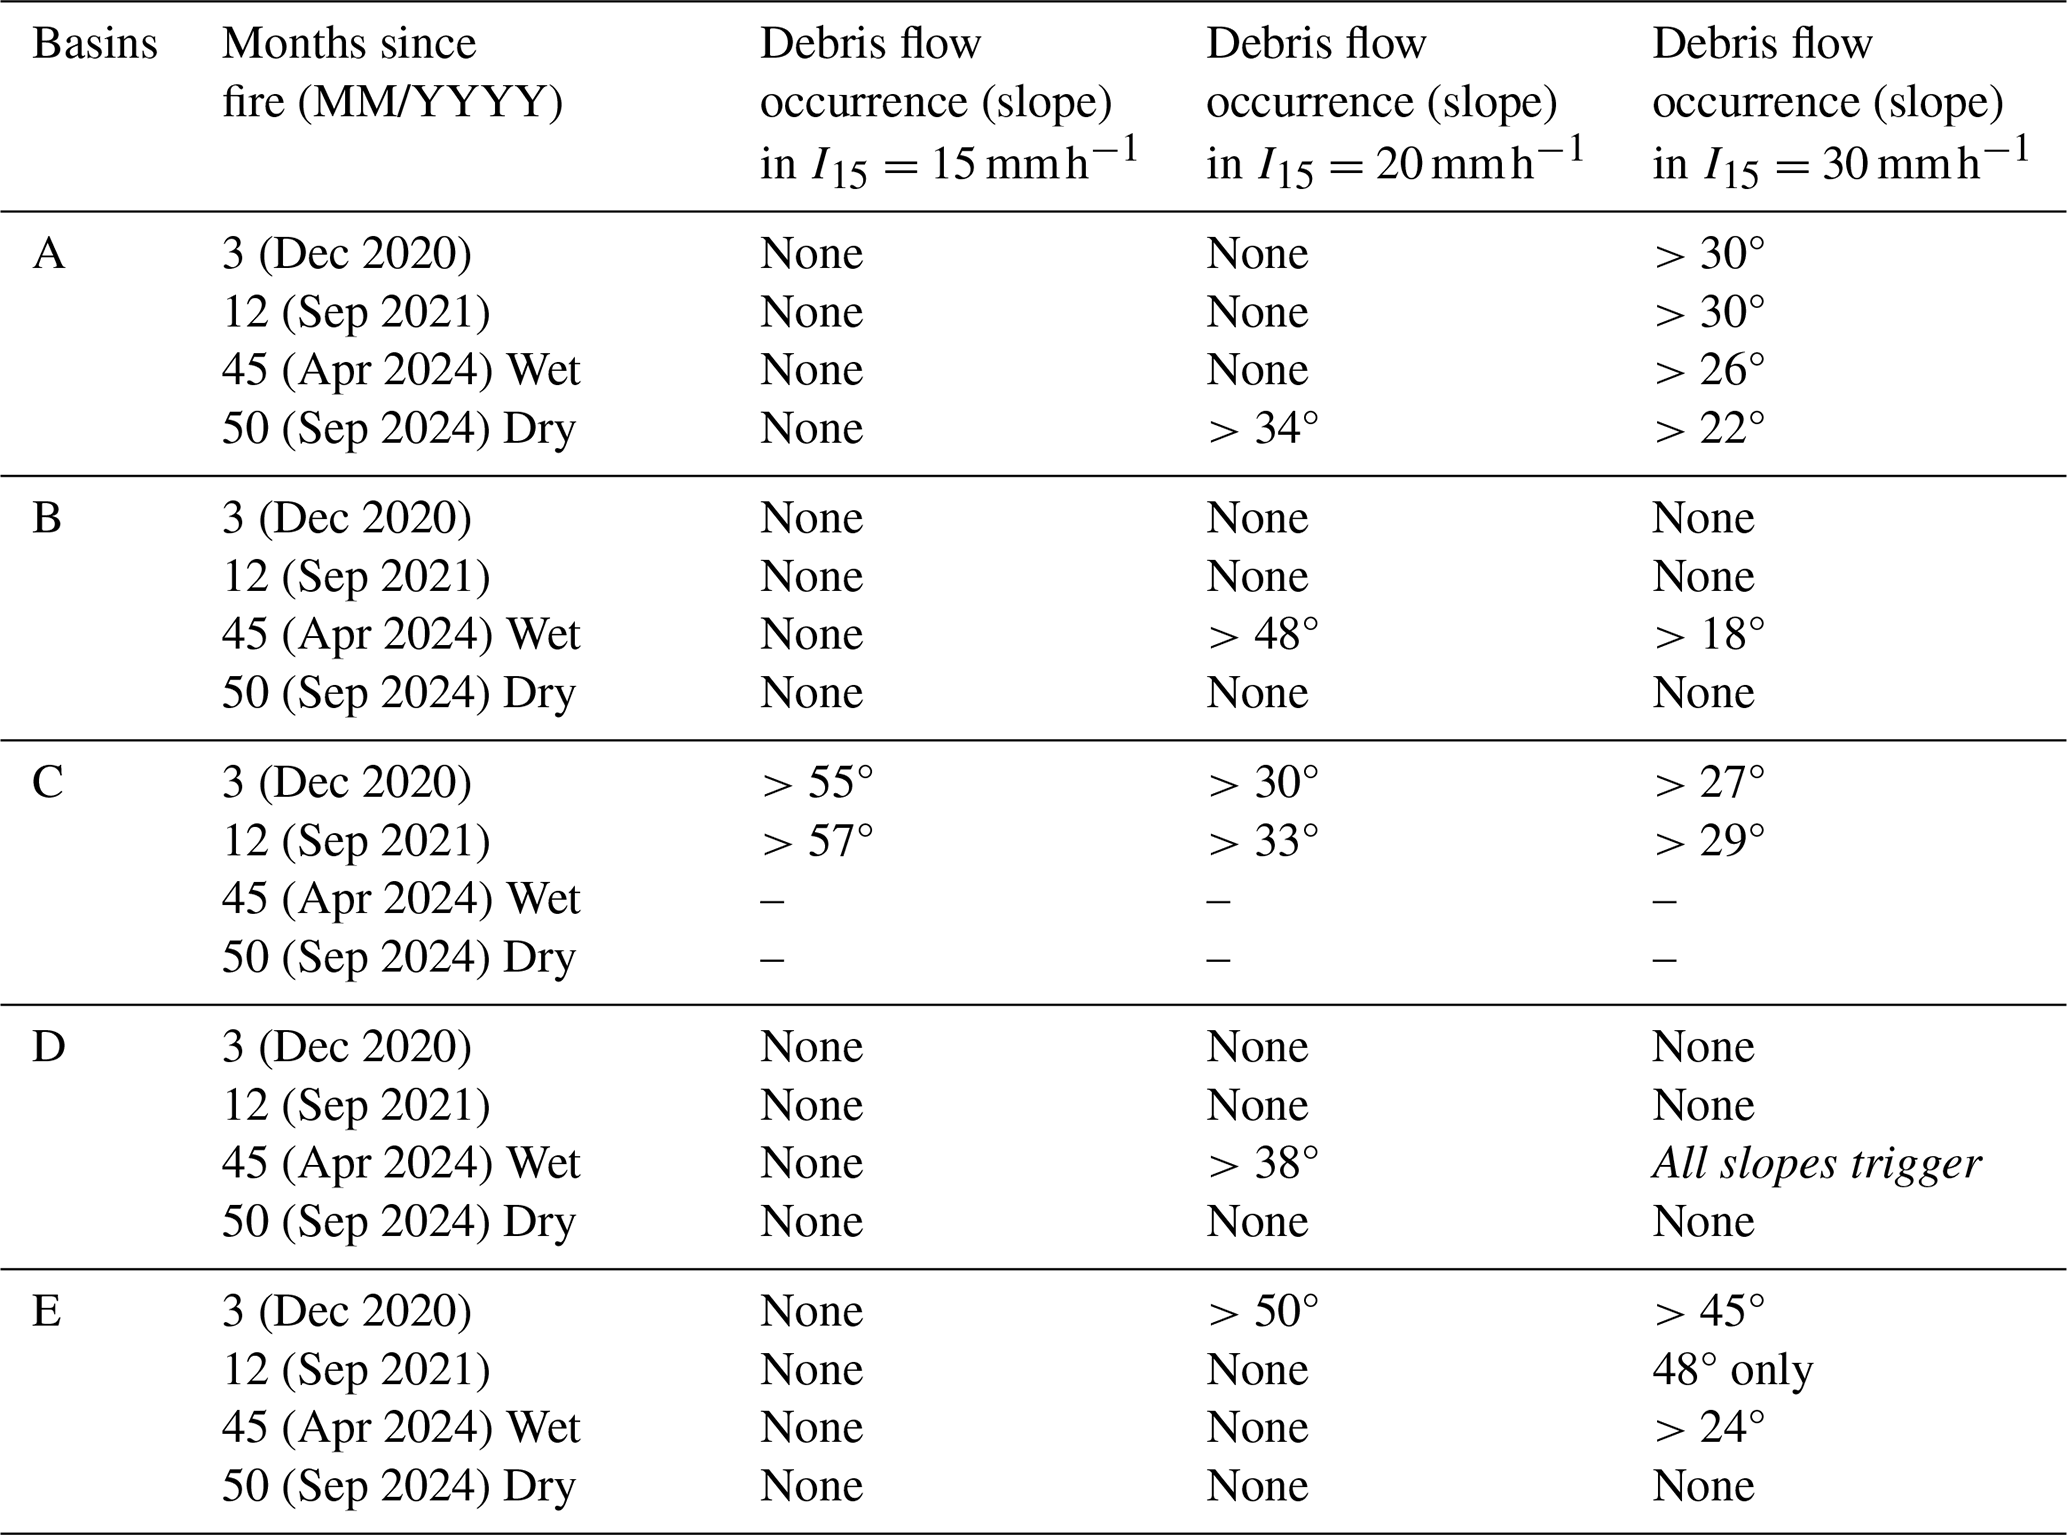
Our simulations indicate that all basins during the wet season of Year 4 could trigger debris flows at I15=30 mm h−1, except Basin D, which could be triggered at I15=20 mm h−1 (Table 3, Fig. S2), for which we identified two rain events with very closely matching rain intensity (4 and 7 February 2024). We also observed an increase in areas of negative dNDVI along the river, while the basins have mostly positive dNDVI (Fig. S4d in the Supplement). During the dry season of Year 4, all basins were unlikely to trigger debris flows except Basin A, with little to no surface runoff even at I15=30 mm h−1. In contrast, Basin A could potentially trigger debris flows at I15=20 mm h−1. Simulations further indicate that a minimum of I15 of 80 mm h−1 would be needed to trigger PFDFs in the dry season for basins B, D, and E, corresponding to the I15 associated with a 100- to 200-year recurrence interval precipitation event (NOAA, last accessed July 2025).
Table 3Simulation results showing the minimum slope angle at which debris flow initiation occurs for each basin at different rain intensities (I15=15, 20, and 30 mm h−1). For example, the first row shows that in Basin A, 3 months after the fire, slopes greater than 30° can trigger debris flows at a rain intensity of I15=30 mm h−1. “None” indicates no debris flow triggered. “All slopes trigger” indicates all slopes within the basin exceeded the debris flow initiation threshold. Dashes indicate no data available.
We suspect that the bell-shaped curves in our modeled dimensionless discharge (Fig. 5) result from a lack of loose sediment at steeper slopes (e.g., >45°), where the angle of repose is exceeded (e.g., Statham, 1976). Limited slope data within the basin may also contribute to the high variability at steeper slopes (e.g., >50° in Basin A). The results of the sensitivity tests for each basin at different rain intensities to isolate the effects of hydraulic conductivity, grain size, and vegetation cover on post-fire debris flow initiation are discussed in Sect. 5.2 (Fig. 6; Table 4).
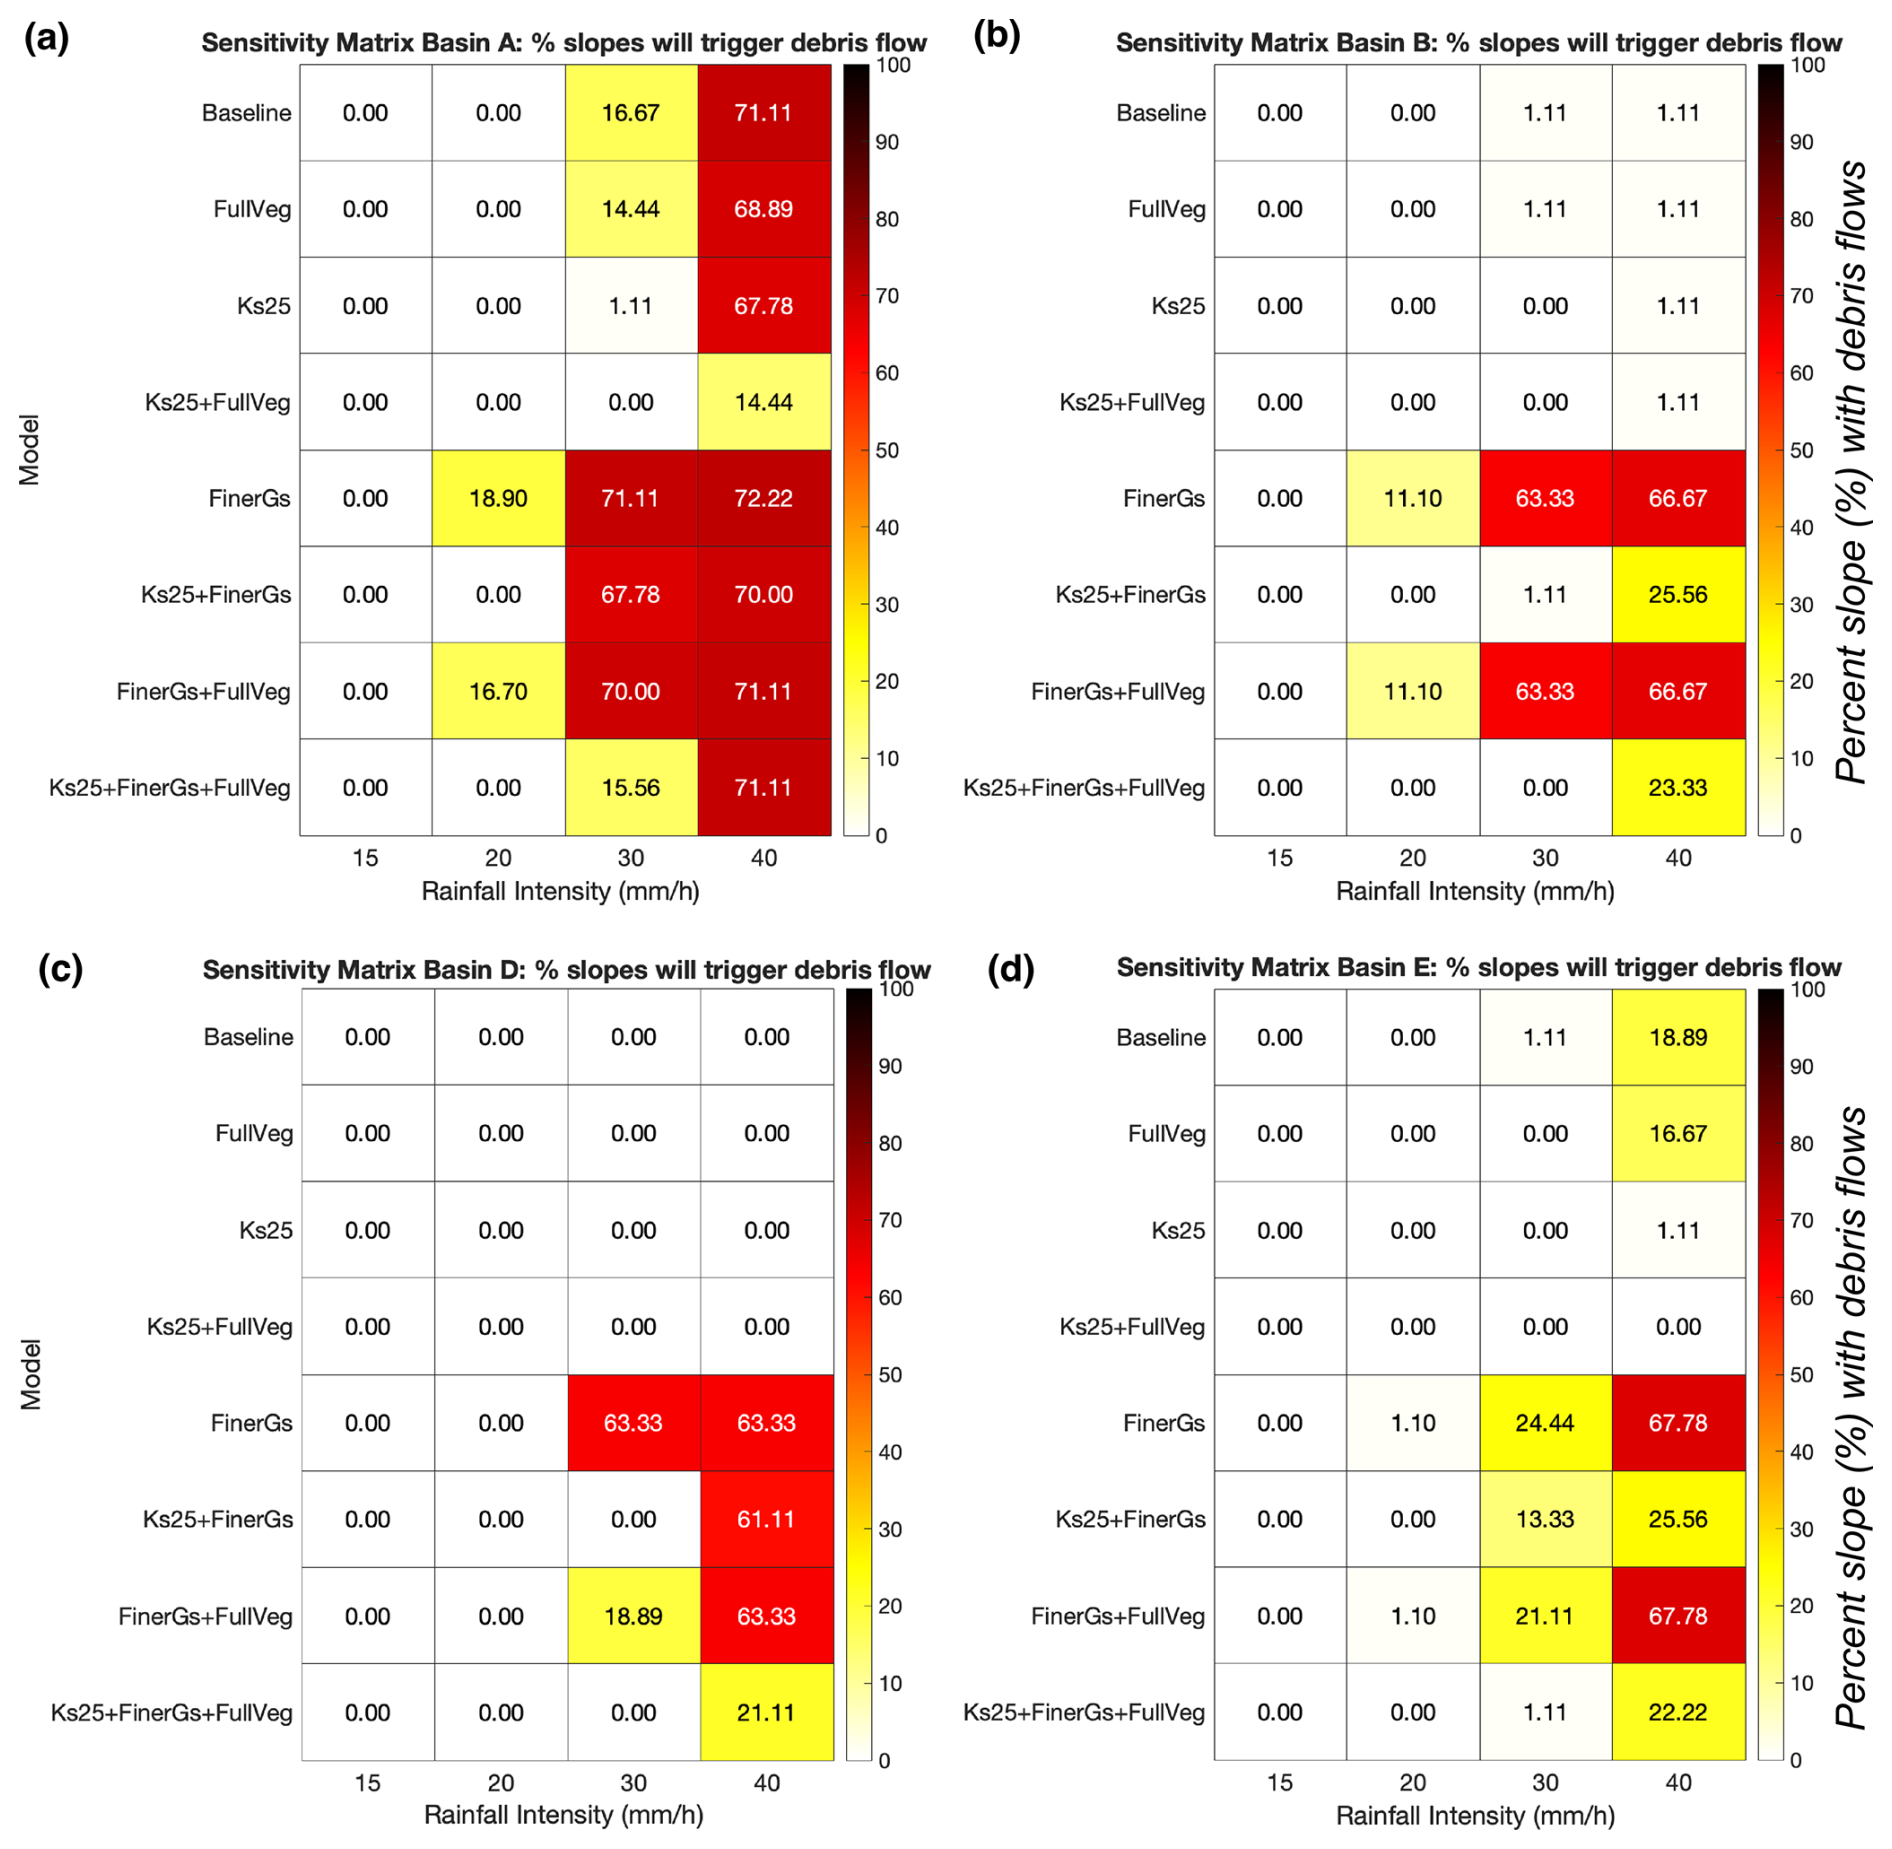
Figure 6Sensitivity analysis showing the influence of vegetation cover, grain size, and hydraulic conductivity on debris flow initiation across different slopes and 15 min rainfall intensities (I15). Warmer colors indicate a higher percentage of slopes (% out of 90°) that exceed the debris flow initiation threshold. Percentages do not reach 100 % because the maximum slope in each basin is less than 90°. The baseline model uses parameters from the first survey (3 months after the fire) of zero vegetation cover, measured grain sizes, and a hydraulic conductivity of 10 mm h−1. Each row indicates a different parameter combination modified from the baseline. Table 4 provides the description of parameters for each model. For example, Ks25 indicates an increased hydraulic conductivity to 25 mm h−1 (baseline: 10 mm h−1), FullVeg indicates increased vegetation cover to 100 % (baseline: 0 %), and finer grain size (FinerGs) indicates a reduction of grain size by 50 % relative to the baseline.
Table 4Description of the parameter combinations used for the sensitivity test. The baseline grain sizes are from the first survey in 2020. Simulation results from the three field surveys are shown in Figs. 6, S5, and S6 in the Supplement. Baseline: reference parameters from the first field survey; FullVeg: only increased the vegetation cover by 100 % (1); Ks25: increased the hydraulic conductivity to 25 mm h−1; FinerGs: Grain size reduced by half (50 %). Combined scenarios (e.g., Ks25 + FinerGs + FullVeg) use multiple parameters simultaneously.
5.1 Evolution of the landscape and post-fire debris flow likelihood
Our simulations, informed by three field surveys, suggest that most basins require at least I15=30 mm h−1 to trigger debris flows. Observations from nearby fires in Southern California indicated a wide range of triggering rainfall intensities in the first year post-fire, ranging from less than 10 mm h−1 (Cannon et al., 2008; Hoch et al., 2021) to 30 mm h−1 (McGuire and Youberg, 2020). In subsequent years, the threshold increased by at least a factor of two (McGuire and Youberg, 2020; McGuire et al., 2021; Hoch et al., 2021).
Our simulation shows higher PFDF likelihood in the Year 4 wet season than in Year 1, despite greater vegetation recovery by Year 4 (Fig. 5). We suspect the main causes of this increase in PFDF likelihood are the relatively lower hydraulic conductivity (wetter soil) measured in the wet season and finer grain sizes as compared to the first survey (Fig. 5; Tables 2 and 3). Similarly, lower measured hydraulic conductivity in Basin A during the dry season also contributes to a higher PFDF likelihood shown in our simulations. Our field observations revealed that moist and wetter soil around Basin A during dry months could have lowered the hydraulic conductivity.
For the other basins with high measured hydraulic conductivity in the dry months, the drier conditions could promote the opening of macropore fractures in the soil, allowing for a significant increase in hydraulic conductivity by several factors (Ritsema and Dekker, 1994; Nyman et al., 2014; Perkins et al., 2022; Martinez et al., 2025). Despite relying on a single measurement, we observed an increase in hydraulic conductivity from the wet to dry season, consistent with Martinez et al. (2025), who reported an approximately 5-fold increase in mean field hydraulic conductivity following the Contreras Fire in Arizona. By comparison, our highest measured hydraulic conductivity shows several orders of magnitude variation in seasonal variability and is approximately 2 to 4 times higher than values reported by Martinez et al. (2025).
Hydraulic conductivity measurements taken immediately after a fire can be generalized across multiple basins under certain conditions, such as similar burn severity (Rengers et al., 2019). However, regional climate and the timing of field surveys must also be considered, as monsoons, droughts, and seasonal variability can influence soil properties (Cannon et al., 2001; DeGraff et al., 2015; Ebel et al., 2022; Thomas et al., 2023; Gorr et al., 2023, 2024; McGuire et al., 2024a; Martinez et al., 2025). The large variability in hydraulic conductivity between seasons has been documented within the first two years (Martinez et al., 2025) or, as shown here, this variability could persist even longer. This underscores the importance of considering seasonal influence in estimating longer-term PFDF likelihoods.
Although vegetation cover can play a role in debris flow initiation (Rengers et al., 2016a; Tillery and Rengers, 2020; McGuire and Youberg, 2020; McGuire et al., 2021; McGuire et al., 2024b), our simulations suggest it has a minimal influence on PFDF likelihood as compared to grain size and hydraulic conductivity. For example, when all parameters immediately after the fire are held constant but with a higher vegetation cover as observed in Year 1, the rainfall ID threshold shows little difference in all the basins (Fig. 5). This implies that vegetation cover does not significantly reduce the likelihood of debris flow in these basins. This contrasts with findings from the 2016 Fish Fire in the San Gabriel Mountains, where vegetation recovery played a bigger role in raising the threshold for triggering debris flows (McGuire et al., 2021; Hoch et al., 2021). We further examine the influence of increasing vegetation cover through a sensitivity test in Sect. 5.2.
Despite a significant increase in vegetation cover observed in our dNDVI values after Year 2 due to precipitation (Keeley et al., 2005; Horn and St. Clair, 2017) (Figs. 3 and S2), full vegetation recovery does not necessarily inhibit triggering of PFDF if other conditions enable it (Graber et al., 2023). We note, however, that vegetation cover and hydraulic conductivity are not necessarily independent of each other (Atchley and Maxwell, 2011) – increased vegetation cover increases evapotranspiration demand, resulting in faster soil drying (Zhang et al., 2001), and potentially a more rapid return to higher hydraulic conductivity states. A grass-dominated region combined with evaporation can continue to remove water from soil to depths of 50 cm, which leads to further increases in hydraulic conductivity during the dry season (Chavez Rodriguez et al., 2024). Our temporal sampling is insufficient to resolve this phenomenon, but it represents an important avenue for future study.
Grain size distributions from other fires showed little change or an increase over the course of the recovery period (e.g., Hoch et al., 2021). We observed a reduction in measured grain size in the 2024 surveys relative to the first survey in 2020. It is possible that our point source grain size measurements do not capture the change in the entire basin, despite prior work suggesting that basin outlets yield representative grain sizes (Santi et al., 2008). Alternatively, repeated rainfall may have removed coarser material and exposed a finer baseline grain size representative of hillslope materials (Kean et al., 2019), as shown by consistent grain sizes across the wet and dry seasons. Since we collected samples at the basin outlets, any existing debris flows deposit a higher concentration of finer materials in the body (center) as it exited the basin outlet (Iverson et al., 2010). Alternatively, we could be observing deposited finer sediments that are easier to mobilize (Lamb et al., 2008), burying the coarser sediments.
We note that the lack of upslope data does limit our ability to verify the representativeness of samples collected at the basin outlets. In any case, the observed variation in grain sizes was not the most significant factor affecting PFDF in our results (Fig. 5). Debris flow deposits could rework the sediments in subsequent years (e.g., Hoch et al., 2021; Wall et al., 2022). However, we did not identify strong indications of rework in the basin outlets from our field sampling. We did not observe any significant stratification from our soil cores during the second and third surveys. We recognize that samples from basin outlets may not fully capture the range of grain sizes needed to characterize basin-scale grain size. Future work should examine variability within the basin interior and at the outlets over the recovery period to better understand how grain size evolves within basins.
5.2 Sensitivity analysis between hydraulic conductivity, grain size, and vegetation cover
Higher rain intensities generally lead to an increase in PFDF likelihood, and studies have shown that greater rainfall intensities are required to trigger debris flows in the years after a fire (Caine, 1980; Cannon et al., 2008; Kean et al., 2011; Staley et al., 2013; Tang et al., 2019a; Hoch et al., 2021; Thomas et al., 2021, 2023). In this section, we present our sensitivity analysis on the effects of different parameters (i.e., hydraulic conductivity, vegetation cover, and grain size) at different rain intensities in this section (Fig. 6; Table 4).
A major difference between the wet and dry seasons from our field surveys is the hydraulic conductivity and vegetation cover (Figs. 6 and 7). The significant increase in measured hydraulic conductivity plays a strong role in changing the PFDF likelihood despite having an increase in vegetation cover (Fig. 6), similar to our simulation results. The sensitivity analyses indicate that different parameters have a varying degree of influence on the post-fire debris flow. For instance, Basins B and D show that I15=30 mm h−1 will trigger a significant PFDF for a number of slopes when the grain sizes are reduced by 50 %, whereas Basin E is less affected (Fig. 6). PFDF likelihood are also sensitive to changes in the magnitude of hydraulic conductivity. For example, if hydraulic conductivity increases by an order of magnitude or more, as seen in our field observations from wet to dry seasons, we expect hydraulic conductivity to play a stronger control on PFDF likelihood than grain size. We suspect that hydraulic conductivity has a greater impact than grain size when comparing seasonal impacts, as it is less likely for grain sizes to have such large variability in a short amount of time (Hoch et al., 2021).
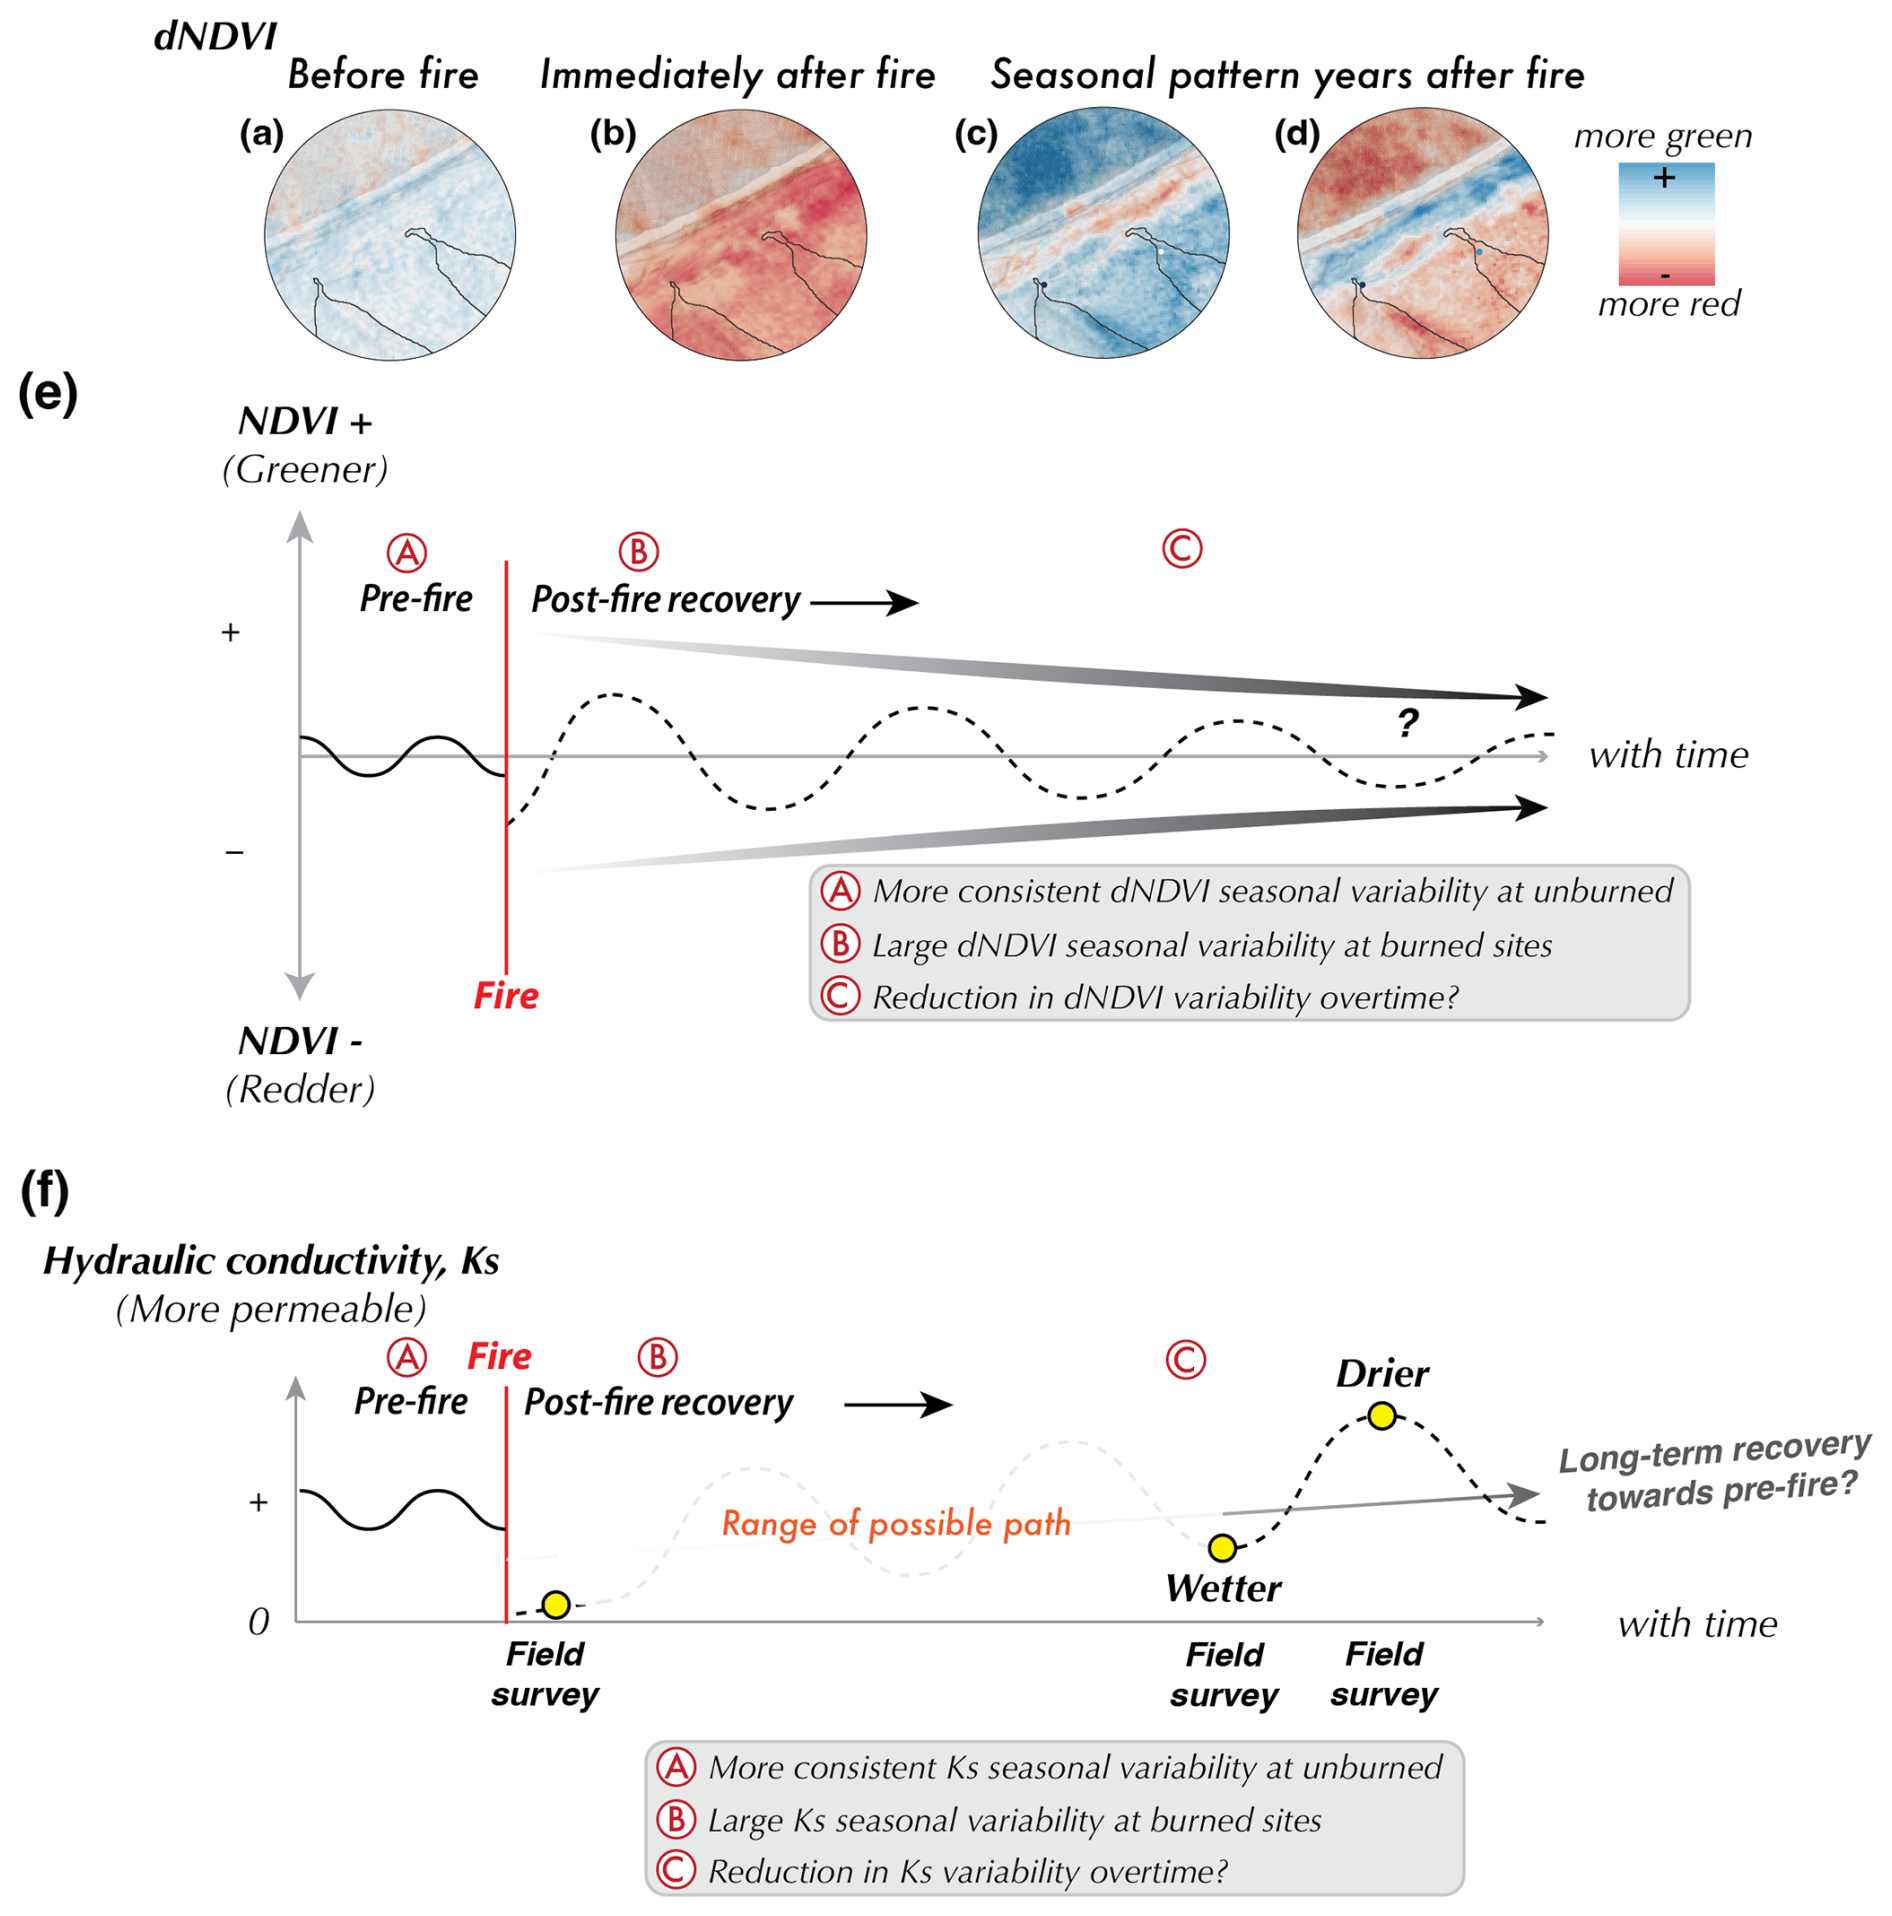
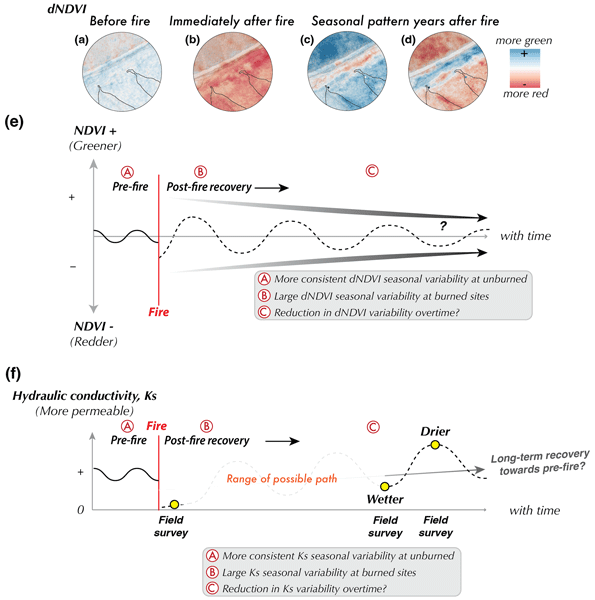
Figure 7Summary of post-fire change and conceptual recovery trajectories. (a)–(d) represent the changes in dNDVI before and after the 2020 Lake Fire. (e) The conceptual model of NDVI change over time. (f) Conceptual model of hydraulic conductivity (Ks) changes over time, illustrating potentially non-monotonic change in Ks over time. Pre-fire conditions show variability in NDVI and Ks, largely through seasonal variation. Following the fire, NDVI may show greater variability due to grasses, which exhibit stronger greening. Ks may exhibit greater variability potentially due to opening of macropore fractures in dry conditions and grass-dominated evapotranspiration, both of which promote large variability in soil moisture. Yellow circles in (f) represent the field survey timing performed in this study.
While hydraulic conductivity recovery has been shown to increase monotonically toward pre-fire levels (Ebel and Martin, 2017), our observations suggest a potentially non-monotonic relationship of hydraulic conductivity despite tracking seasonal variation for only a year. Such non-monotonic changes have been observed in fires in the southwest United States and could significantly impact the inhibition or promotion of post-fire debris flows (Hoch et al., 2021; Graber et al., 2023; McGuire et al., 2024b; Martinez et al., 2025). Despite needing a higher temporal resolution to capture the seasonal signal of hydraulic conductivity, our results highlight the importance of accounting for seasonal variation when estimating the PFDF likelihood. We suspect the temporal variability in rainfall patterns could also influence the triggering of debris flows (Thomas et al., 2021).
Our sensitivity analysis on vegetation cover also shows little to no change in the PFDF likelihood between a basin with full vegetation cover and one with no vegetation cover, assuming all other soil properties remain constant (Fig. 6). One potential explanation for why vegetation cover has a lower impact is that in high-intensity rain events, canopy storage capacity can become saturated, reducing the influence of canopy interception (Hoch et al., 2021). We also note that satellite-derived vegetation cover used in our model input can include shrubs or grasses in areas without tree cover. Areas with high tree cover can obscure the understory. Therefore, the vegetation cover here does not necessarily represent understory density and surface roughness, and canopy interception can vary depending on the vegetation type (Zhao et al., 2019). The estimate from our 20 m point-intercept survey vegetation cover (∼81 %) is in reasonable agreement with the mean NDVI (0.5191) along the same transect (max NDVI within image is 0.74), which yields ∼70 % vegetation cover. The dNDVI between the field measurement (April 2024) and 7 months earlier (September 2023) was low, with a mean of 0.034, indicating minimal vegetation changes in that period.
Overall, our results suggest that for the basins in this area, the combination of lower hydraulic conductivity and finer grain sizes has the greatest impact on triggering runoff-generated debris flows relative to vegetation cover. We propose that the increase in debris flow likelihood in the wet season in the 4th year reflects short-term variability, such as intense rainfall shortly before our field collection, which resulted in significantly low hydraulic conductivity values rather than a long-term yearly increase in debris flow likelihood. Further studies are needed to understand how long-term seasonal PFDF likelihood varies across regions with different climatic regions (e.g., He et al., 2024; Zhou et al., 2026; Ridgway et al., 2026).
5.3 Applicability of high-resolution imagery to estimate vegetation cover
We demonstrated that PlanetScope's high-resolution and high repeat frequency can successfully track vegetation change and complement field observations, despite challenges in standardizing the images due to inconsistencies in orbit geometry and imagery acquisition time. Ground cover surveys and Leaf Area Index (LAI) can estimate vegetation cover and vegetation recovery over time but are limited to basins that are accessible or large enough to avoid the effects of coarse spatial resolution from satellites such as Sentinel-2 (10 to 30 m) and MODIS (500 m) (Rutter et al., 1975; Hoch et al., 2021; Graber et al., 2023). PlanetScope-derived dNDVI can further distinguish between burned and unburned areas even two years post-fire, showing comparable capabilities to LAI measurements in other fire studies (Graber et al., 2023) (Figs. 2 and 3). We note that the point-intercept survey focuses on the understory, but satellite imagery captures the vegetation cover or canopy from tree cover, exposed understory, and bare ground, which could explain the variations in vegetation cover between these two methods.
We suggest that the strong seasonal vegetation signal observed between the drier and wetter surveys, several years after the fire, is due to the transition from perennial shrubs to annual grasses (Figs. 4 and 7). This vegetation transition has been observed in other fires in the southwestern United States and has the potential to increase fire hazard due to rapid drying (e.g., Keeley et al., 2005; Horn and St. Clair, 2017; Underwood et al., 2021; Thomas et al., 2021) (Fig. 2). Further research is needed to determine the persistence of large seasonal pattern variations and whether they will return to pre-fire levels, with some studies suggesting that full recovery may take more than a decade (Bright et al., 2019) (Fig. 7).
We observed that some trees survived in our second and third field surveys despite the high burn severity as reported in US BAER and our dNDVI. This likely indicates that the satellite-derived products captured changes from either burned plant material or drying out of leaves after the fire. The effects of low cumulative precipitation correspond to low positive dNDVI values, indicating low levels of vegetation recovery across the burn scar (Fig. 3b) (Table 2). Our dNDVI might not fully capture Manning's roughness on channels or hillslopes, and further work is needed to validate the best practices of using dNDVI to constrain Manning's roughness. For example, we identified grasses and shrubs in the field that show comparable dNDVI values as trees with green leaves but no dense undergrowth.
Additional validation through field campaigns or other techniques is needed to ensure dNDVI can accurately detect, delineate, and quantify debris flow features. Future studies should integrate lidar, a tool that is successful in detecting and estimating surficial erosion rates and volumes from channel incisions, interrill and rill erosion (Santi et al., 2008; Wagenbrenner and Robichaud, 2014; Sankey et al., 2017). Future studies should also characterize vegetation properties such as types, height, and density, along with the sediment changes, to help refine the interpretation of dNDVI variations (e.g., Omasa et al., 2007; Scheip and Wegmann, 2022). The integration of high-repeat, high-resolution remote sensing methods has the potential to provide more reliable data for post-fire debris flow hazard assessment and emergency response.
Estimating changes in post-fire debris flow likelihood in multi-year studies can be challenging with limited resources. Here, we demonstrated that we could track landscape change during the post-fire recovery period, across multiple years, using limited field sampling in combination with temporally and spatially high-resolution satellite imagery. This approach allowed for a post-fire debris flow likelihood assessment following the 2020 Lake Fire in the Angeles National Forest. We were able to use field and satellite observations to identify that fast-growing grasses continue to dominate the landscape several years after the fire, and their distribution is largely dependent on precipitation availability. However, our simulations suggest that an increase in vegetation cover does not contribute as significantly to PFDF as the seasonal variability of hydraulic conductivity. Our hydraulic conductivity measurements show an order of magnitude difference between wet and dry conditions even in several years after the fire. Despite our inability to verify debris flow occurrence due to limited site access following the fire, our study reveals the complex interaction between hydraulic conductivity, grain size, and vegetation canopy in driving post-fire debris flow likelihood several years after the fire.
The numerical model (KWAVE) used to simulate model runoff can be found through the Community Surface Dynamics Modeling System (CSDMS) model repository at https://csdms.colorado.edu/wiki/Model:KWAVE (last access: 31 March 2021). The MATLAB codes, results, and descriptions for the models will be available upon acceptance of the manuscript in Dryad (https://doi.org/10.5061/dryad.vdncjsz6t, Chong et al., 2026). The rainfall precipitation record can be obtained from LADPW (https://dpw.lacounty.gov/wrd/rainfall/, last access: 24 December 2024). PlanetScope images can be obtained via https://www.planet.com/explorer/ (last access: 21 December 2024) through the education and research program.
The supplement related to this article is available online at https://doi.org/10.5194/nhess-26-4723-2026-supplement.
Conceptualization: JHC, AG, BTP, GJ, DJS, SCH, EOL, LAS; Data curation: JHC; Formal analysis: JHC; Funding acquisition: JHC; Investigation: JHC, AG, BTP, GJ, DVB, ML, DU, DJS, SCH; Methodology: JHC, AG, BTP, GJ, DVB, ML, DU, DJS, SCH, LAS, EOL; Resources: JHC, SCH; Software: JHC; Supervision: SCH, LAS, EOL; Visualization: JHC, AG, BTP, GJ, DVB, ML, DU, DJS, SCH, EOL, LAS; Writing (original draft preparation): JHC, AG, BTP, GJ, DVB, ML, DU, DJS, SCH, EOL, LAS; Writing (review and editing): JHC, AG, BTP, GJ, DVB, ML, DU, DJS, SCH, EOL, LAS.
The contact author has declared that none of the authors has any competing interests.
Publisher's note: Copernicus Publications remains neutral with regard to jurisdictional claims made in the text, published maps, institutional affiliations, or any other geographical representation in this paper. The authors bear the ultimate responsibility for providing appropriate place names. Views expressed in the text are those of the authors and do not necessarily reflect the views of the publisher.
We are grateful to the editor, three anonymous reviewers, and Kun He for their reviews, which significantly improved this manuscript. We also thank Olivia Hoch, Marisa Repasch, Brian Swanson, and Airui Li for the fruitful discussion that helped shape the project. We acknowledge the University of New Mexico Earth Surface Processes Lab for providing access to laboratory facilities and equipment. A permit from the US Forest Service was obtained for the field sampling. The text was edited with the assistance of Grammarly and Claude.
This research is partially funded by the University of New Mexico (UNM) Graduate Professional Student Association grant (2022) awarded to JHC, the UNM Office of Graduate Studies travel grant awarded to JHC, and the 2024 American Society of Photogrammetry and Remote Sensing (ASPRS) William A. Fischer grant awarded to JHC.
The article processing charges for this open-access publication were covered by the GEOMAR Helmholtz Centre for Ocean Research Kiel.
This paper was edited by Mihai Niculita and reviewed by Kun He and three anonymous referees.
Abatzoglou, J. T. and Williams, A. P.: Impact of anthropogenic climate change on wildfire across western US forests, P. Natl. Acad. Sci. USA, 113, 11770–11775, https://doi.org/10.1073/pnas.1607171113, 2016.
Atchley, A. L. and Maxwell, R. M.: Influences of subsurface heterogeneity and vegetation cover on soil moisture, surface temperature and evapotranspiration at hillslope scales, Hydrogeol. J., 19, 289–305, https://doi.org/10.1007/s10040-010-0690-1, 2011.
Bright, B. C., Hudak, A. T., Kennedy, R. E., Braaten, J. D., and Khalyani, A. H.: Examining post-fire vegetation recovery with Landsat time series analysis in three western North American forest types, Fire Ecol., 15, 8, https://doi.org/10.1186/s42408-018-0021-9, 2019.
Caine, N.: The rainfall intensity–duration control of shallow landslides and debris flows, Geogr. Ann. A, 62, 23–27, https://doi.org/10.1080/04353676.1980.11879996, 1980.
Cannon, S. H., Bigio, E. R., and Mine, E.: A process for fire-related debris flow initiation, Cerro Grande fire, New Mexico, Hydrol. Process., 15, 3011–3023, https://doi.org/10.1002/hyp.388, 2001.
Cannon, S. H., Gartner, J. E., Wilson, R. C., Bowers, J. C., and Laber, J. L.: Storm rainfall conditions for floods and debris flows from recently burned areas in southwestern Colorado and southern California, Geomorphology, 96, 250–269, https://doi.org/10.1016/j.geomorph.2007.03.019, 2008.
Carlson, T. N. and Ripley, D. A.: On the relation between NDVI, fractional vegetation cover, and leaf area index, Remote Sens. Environ., 62, 241–252, https://doi.org/10.1016/S0034-4257(97)00104-1, 1997.
Chavez Rodriguez, L., Parker, S., Fiore, N. M., Allison, S. D., and Goulden, M. L.: Impact of Drought on Ecohydrology of Southern California Grassland and Shrubland, Ecosystems, 27, 106–121, https://doi.org/10.1007/s10021-023-00876-8, 2024.
Chong, J.-H., Ghosh, A., Page, B., Jesmok, G., Berg, D., Lopez, M., Upadhyay, D., Stone, D., Hauswirth, S., Lindsey, E., and Scuderi, L.: Seasonal influence on Post-Fire Debris Flow likelihood on the 2020 Lake Fire, Dryad [data set], https://doi.org/10.5061/dryad.vdncjsz6t, 2026.
DeGraff, J. V., Cannon, S. H., and Gartner, J. E.: The Timing of Susceptibility to Post-Fire Debris Flows in the Western United States, Environ. Eng. Geosci., 21, 277–292, https://doi.org/10.2113/gseegeosci.21.4.277, 2015.
Dye, D. G. and Tucker, C. J.: Seasonality and trends of snow-cover, vegetation index, and temperature in northern Eurasia, Geophys. Res. Lett., 30, 1405, https://doi.org/10.1029/2002GL016384, 2003.
Ebel, B. A. and Martin, D. A.: Meta-analysis of field-saturated hydraulic conductivity recovery following wildland fire: Applications for hydrologic model parameterization and resilience assessment, Hydrol. Process., 31, 3682–2696, https://onlinelibrary.wiley.com/doi/10.1002/hyp.11288 (last access: 1 August 2026), 2017.
Ebel, B. A., Wagenbrenner, J. W., Kinoshita, A. M., and Bladon, K. D.: Hydrologic recovery after wildfire: A framework of approaches, metrics, criteria, trajectories, and timescales, J. Hydrol. Hydromech., 70, 412–427, https://doi.org/10.2478/johh-2022-0033, 2022.
Graber, A. P., Thomas, M. A., and Kean, J. W.: How Long Do Runoff-Generated Debris-Flow Hazards Persist After Wildfire?, Geophys. Res. Lett., 50, https://doi.org/10.1029/2023GL105101, 2023.
Granged, A. J. P., Zavala, L. M., Jordán, A., and Bárcenas-Moreno, G.: Post-fire evolution of soil properties and vegetation cover in a Mediterranean heathland after experimental burning: A 3-year study, Geoderma, 164, 85–94, https://doi.org/10.1016/j.geoderma.2011.05.017, 2011.
Gorr, A. N., McGuire, L. A., Beers, R., Youberg, A., Rengers, F. K., Kean, J. W., and Staley, D. M.: Triggering conditions, runout, and downstream impacts of debris flows following the 2021 Flag Fire, Arizona, USA, Nat. Hazards, 117, 2473–2504, https://doi.org/10.1007/s11069-023-05952-9, 2023.
Gorr, A. N., McGuire, L. A., Youberg, A. M., Beers, R., and Liu, T.: Inundation and flow properties of a runoff-generated debris flow following successive high-severity wildfires in northern Arizona, USA, Earth Surf. Proc. Land., 49, 622–641, https://doi.org/10.1002/esp.5724, 2024.
He, K., Hu, X., Wu, Z., Zhong, Y., Zhou, Y., Gong, X., and Luo, G.: Preliminary analysis of the wildfire on March 15, 2024, and the following post-fire debris flows in Yajiang County, Sichuan, China, Landslides, 21, 3179–3189, https://doi.org/10.1007/s10346-024-02364-z, 2024.
Herrick, J. E., Van Zee, J. W., Havstad, K. M., Burkett, L. M., and Whitford, W. G. (Eds.): Monitoring Manual for Grassland, Shrubland, and Savanna Ecosystems, Volume 1: Quick Start, USDA – ARS Jornada Experimental Range, distributed by the University of Arizona Press, Tucson, AZ, ISBN 0-9755552-0-0, 2009.
Hoch, O. J., McGuire, L. A., Youberg, A. M., and Rengers, F. K.: Hydrogeomorphic Recovery and Temporal Changes in Rainfall Thresholds for Debris Flows Following Wildfire, J. Geophys. Res.-Earth, 126, https://doi.org/10.1029/2021JF006374, 2021.
Horn, K. J. and St. Clair, S. B.: Wildfire and exotic grass invasion alter plant productivity in response to climate variability in the Mojave Desert, Landscape Ecol., 32, 635–646, https://doi.org/10.1007/s10980-016-0466-7, 2017.
Iverson, R. M., Logan, M., LaHusen, R. G., and Berti, M.: The perfect debris flow? Aggregated results from 28 large-scale experiments, J. Geophys. Res.-Earth, 115, F03005, https://doi.org/10.1029/2009JF001514, 2010.
Kean, J. W., Staley, D. M., and Cannon, S. H.: In situ measurements of post-fire debris flows in southern California: Comparisons of the timing and magnitude of 24 debris-flow events with rainfall and soil moisture conditions, J. Geophys. Res.-Earth, 116, e2011JF002005, https://doi.org/10.1029/2011JF002005, 2011.
Kean, J. W., McGuire, L. A., Rengers, F. K., Smith, J. B., and Staley, D. M.: Amplification of post-wildfire peak flow by debris, Geophys. Res. Lett., 43, 8545–8553, https://doi.org/10.1002/2016GL069661, 2016.
Kean, J. W., Staley, D. M., Lancaster, J. T., Rengers, F. K., Swanson, B. J., Coe, J. A., Hernandez, J. L., Sigman, A. J., Allstadt, K. E., and Lindsay, D. N.: Inundation, flow dynamics, and damage in the 9 January 2018 Montecito debris-flow event, California, USA: Opportunities and challenges for post-wildfire risk assessment, Geosphere, 15, 1140–1163, https://doi.org/10.1130/GES02048.1, 2019.
Keeley, J. E., Baer-Keeley, M., and Fotheringham, C. J.: Alien plant dynamics following fire in Mediterranean-climate California shrublands, Ecol. Appl., 15, 2109–2125, https://doi.org/10.1890/04-1222, 2005.
Lamb, M. P., Dietrich, W. E., and Venditti, J. G.: Is the critical Shields stress for incipient sediment motion dependent on channel-bed slope?, J. Geophys. Res.-Earth, 113, F02008, https://doi.org/10.1029/2007JF000831, 2008.
Martinez, J. R., McGuire, L. A., and Youberg, A. M.: Insights into temporal changes in debris flow susceptibility following fire in the Southwest USA from monitoring and repeat estimates of soil hydraulic and physical properties, Earth Surf. Proc. Land., 50, https://doi.org/10.1002/esp.70015, 2025.
McGuire, L. A., Rengers, F. K., Kean, J. W., and Staley, D. M.: Debris flow initiation by runoff in a recently burned basin: Is grain-by-grain sediment bulking or en masse failure to blame?, Geophys. Res. Lett., 44, 7310–7319, https://doi.org/10.1002/2017GL074243, 2017.
McGuire, L. A. and Youberg, A. M.: What drives spatial variability in rainfall intensity-duration thresholds for post-wildfire debris flows? Insights from the 2018 Buzzard Fire, NM, USA, Landslides, 17, 2385–2399, https://doi.org/10.1007/s10346-020-01470-y, 2020.
McGuire, L. A., Rengers, F. K., Oakley, N., Kean, J. W., Staley, D. M., Tang, H., de Orla-Barile, M., and Youberg, A. M.: Time since burning and rainfall characteristics impact post-fire debris-flow initiation and magnitude, Environ. Eng. Geosci., 27, 43–56, https://doi.org/10.2113/EEG-D-20-00029, 2021.
McGuire, L. A., Rengers, F. K., Youberg, A. M., Gorr, A. N., Hoch, O. J., Beers, R., and Porter, R.: Characteristics of debris-flow-prone watersheds and debris-flow-triggering rainstorms following the Tadpole Fire, New Mexico, USA, Nat. Hazards Earth Syst. Sci., 24, 1357–1379, https://doi.org/10.5194/nhess-24-1357-2024, 2024a.
McGuire, L. A., Ebel, B. A., Rengers, F. K., Vieira, D. C. S., and Nyman, P.: Fire effects on geomorphic processes, Nat. Rev. Earth Environ., 5, 486–503, https://doi.org/10.1038/s43017-024-00557-7, 2024b.
METER Group, Inc. USA: Mini Disk Infiltrometer Operator's Manual, https://publications.metergroup.com/Manuals/20421_Mini_Disk_Manual_Web.pdf?_gl=1*16vczg*_gcl_au*MTM2NTU2MTM3LjE3ODk2NTYwNTA (last access: 17 September 2026), 2021.
Miller, J. D. and Thode, A. E.: Quantifying burn severity in a heterogeneous landscape with a relative version of the delta Normalized Burn Ratio (dNBR), Remote Sens. Environ., 109, 66–80, https://doi.org/10.1016/j.rse.2006.12.006, 2007.
NOAA (National Oceanic and Atmospheric Administration): Precipitation Frequency Data Server (PFDS), Hydrometeorological Design Studies Center, Office of Water Prediction, https://hdsc.nws.noaa.gov/pfds/pfds_map_cont.html?bkmrk=ca, last access: 15 July 2025.
Nyman, P., Sheridan, G. J., Smith, H. G., and Lane, P. N. J.: Modeling the effects of surface storage, macropore flow, and water repellency on infiltration after wildfire, J. Hydrol., 513, 301–313, https://doi.org/10.1016/j.jhydrol.2014.02.044, 2014.
Omasa, K., Hosoi, F., and Konishi, A.: 3D lidar imaging for detecting and understanding plant responses and canopy structure, J. Exp. Bot., 58, 881–898, https://doi.org/10.1093/jxb/erl142, 2007.
Paysen, T. E., Derby, J. A., Black Jr., H., Bleich, V. C., and Mincks, J. W.: A vegetation classification system applied to southern California, USDA Forest Service, Pacific Southwest Forest and Range Experiment Station, General Technical Report PSW-45, Berkeley, CA, USA, 39 pp., https://doi.org/10.2737/PSW-GTR-45, 1980.
Perkins, J. P., Diaz, C., Corbett, S. C., Cerovski-Darriau, C., Stock, J. D., Prancevic, J. P., Micheli, E., and Jasperse, J.: Multi-stage soil-hydraulic recovery and limited ravel accumulations following the 2017 Nuns and Tubbs wildfires in northern California, J. Geophys. Res.-Earth, 127, e2022JF006591, https://doi.org/10.1029/2022JF006591, 2022.
Rengers, F. K., McGuire, L. A., Coe, J. A., Kean, J. W., Baum, R. L., Staley, D. M., and Godt, J. W.: The influence of vegetation on debris-flow initiation during extreme rainfall in the northern Colorado Front Range, Geology, 44, 823–826, https://doi.org/10.1130/G38096.1, 2016a.
Rengers, F. K., McGuire, L. A., Kean, J. W., Staley, D. M., and Hobley, D. E. J.: Model simulations of flood and debris flow timing in steep catchments after wildfire, Water Resour. Res., 52, 6041–6061, https://doi.org/10.1002/2015WR018176, 2016b.
Rengers, F. K., McGuire, L. A., Kean, J. W., Staley, D. M., and Youberg, A. M.: Progress in simplifying hydrologic model parameterization for broad applications to post-wildfire flooding and debris-flow hazards, J. Geophys. Res.-Earth, 121, 588–608, https://doi.org/10.1002/esp.4697, 2019.
Ridgway, P., Bläsi, L. T., Halso, M. C., Vetsch, D. F., and Lane, B.: Beyond the initial impact: Channel evolution following wildfire and debris flows in a mountain stream of the Upper Colorado River Basin, Geomorphology, 110485, https://doi.org/10.1016/j.geomorph.2026.110485, 2026.
Ritsema, C. J. and Dekker, L. W.: How water moves in a water repellent sandy soil: 2. Dynamics of fingered flow, Water Resour. Res., 30, 2519–2531, https://doi.org/10.1029/94WR00750, 1994.
Robichaud, P. R., Wagenbrenner, J. W., Pierson, F. B., Spaeth, K. E., Ashmun, L. E., and Moffet, C. A.: Infiltration and interrill erosion rates after a wildfire in western Montana, USA, Catena, 142, 77–88, https://doi.org/10.1016/j.catena.2016.01.027, 2016.
Rutter, A. J., Morton, A. J., and Robins, P. C.: A predictive model of rainfall interception in forests. II. Generalization of the model and comparison with observations in some coniferous and hardwood stands, J. Appl. Ecol., 12, 367–380, https://doi.org/10.2307/2401739, 1975.
Sankey, J. B., Kreitler, J., Hawbaker, T. J., McVay, J. L., Miller, M. E., Mueller, E. R., Vaillant, N. M., Lowe, S. E., and Sankey, T. T.: Climate, wildfire, and erosion ensemble foretells more sediment in western USA watersheds, Geophys. Res. Lett., 44, 11520–11530, https://doi.org/10.1002/2017GL073979, 2017.
Santi, P. M., deWolfe, V. G., Higgins, J. D., Cannon, S. H., and Gartner, J. E.: Sources of debris flow material in burned areas, Geomorphology, 96, 310–321, https://doi.org/10.1016/j.geomorph.2007.02.022, 2008.
Scheip, C. and Wegmann, K.: Insights on the growth and mobility of debris flows from repeat high-resolution lidar, Landslides, 19, 1297–1319, https://doi.org/10.1007/s10346-022-01862-2, 2022.
Singleton, M. P., Thode, A. E., Sánchez Meador, A. J., and Iniguez, J. M.: Increasing trends in high-severity fire in the southwestern USA from 1984 to 2015, Forest Ecol. Manag., 433, 709–719, https://doi.org/10.1016/j.foreco.2018.11.039, 2019.
Staley, D. M., Kean, J. W., Cannon, S. H., Schmidt, K. M., and Laber, J. L.: Objective definition of rainfall intensity–duration thresholds for the initiation of post-fire debris flows in southern California, Landslides, 10, 547–562, https://doi.org/10.1007/s10346-012-0341-9, 2013.
Staley, D. M., Negri, J. A., Kean, J. W., Laber, J. L., Tillery, A. C., and Youberg, A. M.: Prediction of spatially explicit rainfall intensity–duration thresholds for post-fire debris-flow generation in the Western United States, Geomorphology, 278, 149–162, https://doi.org/10.1016/j.geomorph.2016.10.019, 2017.
Staley, D. M., Tillery, A. C., Kean, J. W., McGuire, L. A., Pauling, H. E., Rengers, F. K., and Smith, J. B.: Estimating post-fire debris-flow hazards prior to wildfire using a statistical analysis of historical distributions of fire severity from remote sensing data, Int. J. Wildland Fire, 27, 595–608, https://doi.org/10.1071/WF17122, 2018.
Staley, D. M., Kean, J. W., and Rengers, F. K.: The recurrence interval of post-fire debris-flow generating rainfall in the southwestern United States, Geomorphology, 370, 107392, https://doi.org/10.1016/j.geomorph.2020.107392, 2020.
Statham, I.: A scree slope rockfall model, Earth Surface Processes, 1, 43–62, https://doi.org/10.1002/esp.3290010106, 1976.
Stoof, C. R., Ferreira, A. J. D., Mol, W., Van den Berg, J., De Kort, A., Drooger, S., Slingerland, E. C., Mansholt, A. U., Ferreira, C. S. S., and Ritsema, C. J.: Soil surface changes increase runoff and erosion risk after a low–moderate severity fire, Geoderma, 239–240, 58–67, https://doi.org/10.1016/j.geoderma.2014.09.020, 2015.
Tang, H., McGuire, L. A., Rengers, F. K., Kean, J. W., Staley, D. M., and Smith, J. B.: Developing and testing physically based triggering thresholds for runoff-generated debris flows, Geophys. Res. Lett., 46, 8830–8839, https://doi.org/10.1029/2019GL083623, 2019a.
Tang, H., McGuire, L. A., Rengers, F. K., Kean, J. W., Staley, D. M., and Smith, J. B.: Evolution of debris-flow initiation mechanisms and sediment sources during a sequence of post-wildfire rainstorms, J. Geophys. Res.-Earth, 124, 1572–1595, https://doi.org/10.1029/2018JF004837, 2019b.
Thomas, M. A., Rengers, F. K., Kean, J. W., McGuire, L. A., Staley, D. M., Barnhart, K. R., and Ebel, B. A.: Postwildfire soil-hydraulic recovery and the persistence of debris flow hazards, J. Geophys. Res.-Earth, 126, e2021JF006091, https://doi.org/10.1029/2021JF006091, 2021.
Thomas, M. A., Lindsay, D. N., Cavagnaro, D. B., Kean, J. W., McCoy, S. W., and Graber, A. P.: The rainfall intensity–duration control of debris flows after wildfire, Geophys. Res. Lett., 50, e2023GL103645, https://doi.org/10.1029/2023GL103645, 2023.
Tillery, A. C. and Rengers, F. K.: Controls on debris-flow initiation on burned and unburned hillslopes during an exceptional rainstorm in southern New Mexico, USA, Earth Surf. Proc. Land., 45, 1051–1066, https://doi.org/10.1002/esp.4761, 2020.
Underwood, E. C., Hollander, A. D., Molinari, N. A., Larios, L., and Safford, H. D.: Identifying priorities for post-fire restoration in California chaparral shrublands, Restor. Ecol., 30, e13513, https://doi.org/10.1111/rec.13513, 2021.
USDA Forest Service, Geospatial Technology and Applications Center, BAER Imagery Support Program: Burned Area Reflectance Classification (BARC) Data Bundle for the LAKE Fire occurring on the Angeles National Forest – 2020, raster digital data, USDA Forest Service, https://inci-web-media-bucket.s3.us-gov-west-1.amazonaws.com/s3fs-public/2022-10/2020_09_11-16.02.00.092-CDT.pdf, last access: 27 August 2020.
U.S. Geological Survey Landslide Hazards Program: Post-fire debris-flow hazards dashboard, https://landslides.usgs.gov/hazards/postfire_debrisflow/, last access: December 2021.
Valencia, F. N., Swanson, B. J., and Hernandez, J. L.: Preliminary geologic map of the Burnt Peak 7.5' Quadrangle, Los Angeles County, California: California Geological Survey Preliminary Geologic Map 22-06, scale 1 : 24 000, https://www.conservation.ca.gov/cgs/documents/publications/preliminary-geologic-maps/PGM_22-06-BurntPeak-24k-a11y.pdf (last access: 17 September 2026), 2022.
Wagenbrenner, J. W. and Robichaud, P. R.: Post-fire bedload sediment delivery across spatial scales in the interior western United States, Earth Surf. Proc. Land., 39, 865–876, https://doi.org/10.1002/esp.3488, 2014.
Wall, S., Murphy, B. P., Belmont, P., and Yocom, L.: Predicting post-fire debris flow grain sizes and depositional volumes in the Intermountain West, United States, Earth Surf. Proc. Land., 48, 179–197, https://doi.org/10.1002/esp.5480, 2022.
Watson, K. W. and Luxmoore, R. J.: Estimating macroporosity in a forest watershed by use of a tension infiltrometer, Soil Sci. Soc. Am. J., 50, 578–582, https://doi.org/10.2136/sssaj1986.03615995005000030007x, 1986.
Yang, L., Jin, S., Danielson, P., Homer, C., Gass, L., Bender, S. M., Case, A., Costello, C., Dewitz, J., Fry, J., Funk, M., Granneman, B., Liknes, G. C., Rigge, M., and Xian, G.: A new generation of the United States National Land Cover Database: Requirements, research priorities, design, and implementation strategies, ISPRS J. Photogramm., 146, 108–123, https://doi.org/10.1016/j.isprsjprs.2018.09.006, 2018.
Zhang, L., Dawes, W. R., and Walker, G. R.: Response of mean annual evapotranspiration to vegetation changes at catchment scale, Water Resour. Res., 37, 701–708, https://doi.org/10.1029/2000WR900325, 2001.
Zhao, B., Zhang, L., Xia, Z., Xu, W., Xia, L., Liang, Y., and Xia, D.: Effects of rainfall intensity and vegetation cover on erosion characteristics of a soil containing rock fragments slope, Adv. Civ. Eng., 7043428, https://doi.org/10.1155/2019/7043428, 2019.
Zhou, Y., Hu, X., Gong, X., He, K., Jiang, M., Yang, J., and Peng, H.: Variability of post-fire debris-flow initiation mechanisms across different lithological zones in the Hengduan Mountains, China, Landslides, 23, 129–141, https://doi.org/10.1007/s10346-025-02616-6, 2026.