
the Creative Commons Attribution 4.0 License.
the Creative Commons Attribution 4.0 License.
 | 01 Oct 2026
Anthropogenic aerosol forcing of European windstorms in CMIP6 climate models
Stephen Cusack
A recently developed set of historical storm reconstructions were extensively validated by insurance loss data and revealed how European windstorm damages were three times higher in the 1980s and '90s compared to a few decades before and since. A better understanding of these slower fluctuations could improve how this costly risk is managed. Here, we explore the impacts of anthropogenic aerosols (AA) on European property damage using results from DAMIP (Detection and Attribution Model Intercomparison Project) climate model experiments. Multimodel mean DAMIP results indicate AA boosted European wind losses by 45 % in the late 20th century relative to preindustrial times, with the signal varying from zero to 100 % between the six models. A validation of these modelling results using independent data from previous climate studies suggested the signal is more likely to be at the higher end of this range. While this evidence suggests AA forcing contributed significantly to recent multidecadal changes in European windstorm losses, there remains significant uncertainties in model responses and the observational data used in their validation. Further research would benefit those exposed to this hazard.
- Article
(4713 KB) - Full-text XML
- BibTeX
- EndNote


European windstorm activity has varied at multidecadal scales over the past few centuries (e.g. Dawson et al., 1997; WASA Group, 1998; Brázdil et al., 2004; Mellado-Cano et al., 2019; Hu et al., 2022; Brönnimann et al., 2025). The most recent and best-documented variations in storminess were particularly large, with insured property damages (indexed to 2022) rising from EUR 2.8 billion in 1960–1979 to EUR 6.7 billion in 1980–1999, before falling to EUR 2.5 billion in 2000-2019, based on the storm loss reconstructions in Cusack (2023).
The causes of longer timescale changes in European wind climate are not fully understood. Zanchettin et al. (2013) presented evidence that major volcanic eruptions injecting huge amounts of sulphur into the tropical stratosphere contribute to some extent. They reported positive anomalies in the North Atlantic Oscillation (NAO) for up to approximately 15 years after major tropical sulphur-rich eruptions, with NAO anomalies in several consecutive 5 year periods significantly different from zero at around the 5 % level. The 11-year solar cycle has been established as a driver of changes in European winter winds (e.g. Ineson et al., 2011; Scaife et al., 2013; Thiéblemont et al., 2015; Gray et al., 2016), though the modulation of recent solar cycles corresponds to weak forcing (e.g. Fig. 2.10 of Gulev et al., 2021). Multidecadal storm variations have also been reported to emerge from internal variability of the climate system. For example, climate model simulations with constant external forcings produce slower climate variations in the North Atlantic sector (e.g. Zhang et al., 2019; Fang et al., 2021), including storminess (e.g. Brayshaw et al., 2009; Gastineau and Frankignoul, 2012; Peings and Magnusdottir, 2014; Omrani et al., 2014; Woollings et al., 2015).
Recent research indicates anthropogenic aerosols (AA) have also influenced the European wind climate. Qin et al. (2020) found steeper meridional surface pressure gradients over Europe in the late 20th century in the multimodel means from both the fifth and sixth phases of the Coupled Model Intercomparison Project (CMIP5 and CMIP6, e.g. Eyring et al., 2016), while Hassan et al. (2021) found about of the observed slackening of pressure gradients between the subpolar Atlantic and Mediterranean areas from 1990 to 2020 could be attributed to the concurrent decline in AA forcing, in CMIP6 model simulations. Needham and Randall (2023) and Needham et al. (2024) described how changes in AA emissions over North America and Europe caused a strengthening storm track in northern mid-latitudes over the second half of the 20th century, and subsequent weakening this century, in their climate model. Further, their simulated storm track changes co-vary with a reconstruction of European windstorm losses (with socio-economic effects removed) in Cusack (2023). These recent studies point to a link from AA forcing to multidecadal windstorm loss variations in modern times.
A more complete understanding of multidecadal variations of storminess is hampered by limitations in both observations and modelling. Reliable observational records of the European storm climate are a few decades in length, hence providing little information on past multidecadal variations, let alone the relative roles of forcings and their interactions. Meanwhile, the information from modern climate models is compromised by documented problems simulating the processes generating low frequency storm variations. Specifically, volcanic and solar forcings both operate via a stratosphere pathway and models have known weaknesses in their simulation of processes in this layer of the atmosphere, and their effects on storminess (e.g. Hermanson et al., 2020; Bushell et al., 2022). Further, the Atlantic Meridional Overturning Circulation (AMOC) has been found to influence storminess at longer timescales, and models tend to underestimate the low frequency variability of AMOC (e.g. Yan et al., 2018) and ocean forcing of cyclones (e.g. Sheldon et al., 2017). The persistence of these modelling issues suggests complete solutions are unlikely to be found soon.
While a fuller understanding of multidecadal variations may require time to improve observational records and modelling, there remain opportunities to make progress in understanding multidecadal storm variations in the present-day. For instance, external forcing by AA has only recently been connected to storm tracks, and investigations into the modelled impacts on European windstorm risk have not been done. Such model-based investigations are potentially worthwhile, since AA climate forcing originates in the troposphere hence the fidelity of its simulations may be better than from those forcings acting along stratosphere and ocean pathways, mentioned above. Moreover, a focus on AA forcing of storminess may lead to deeper insights into model behaviour than when resources are spread over several forcings. Finally, from a practical view, aerosol emissions from northern mid-latitudes in the future are more predictable, hence AA forcing has greater potential to improve management of future wind risk, than more stochastic forcings such as major, tropical volcanic eruptions.
These considerations suggest a focused study of the AA forcing of multidecadal storm loss anomalies could be valuable to those exposed to this hazard. Here, we analyse a special set of climate model experiments to estimate the AA forcing of European storm losses. Near-surface winds from the DAMIP (Detection and Attribution Model Intercomparison Project) set of climate model experiments (Gillett et al., 2016) were processed into storm events, then an established model converted these winds to property losses. The contribution of AA forcing was found by comparing DAMIP-AA forced results to control simulations with external forcings set to preindustrial values. Section 2 contains a description of the climate model experiments, and the conversion of their near-surface winds to European storm losses. Results from the DAMIP-AA experiments are presented in Sect. 3, then assessed in Sect. 4 using additional information from published research. Conclusions are given in Sect. 5.
2.1 DAMIP climate model data
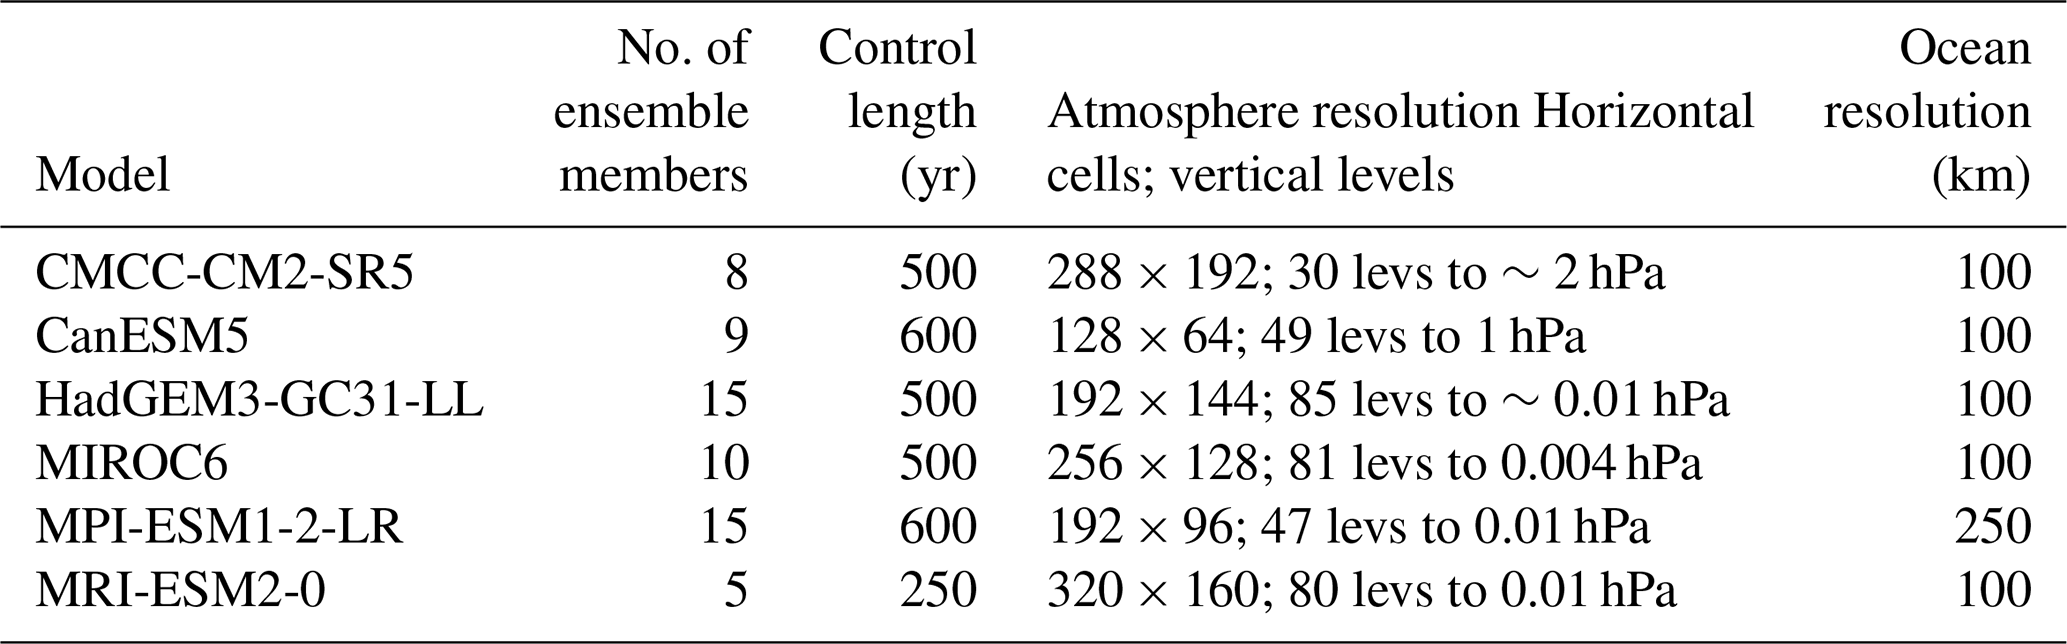
CMIP6 includes a series of 23 sub-projects targeting specific questions about the climate. In particular, the DAMIP sub-project was designed to measure the relative roles of various climate forcings during the industrial period. Its Tier 1 experiments consist of climate model simulations covering the 1850–2014 period, with one type of forcing set to historical values and all others fixed at preindustrial values, and initial conditions from corresponding preindustrial control runs (from the main climate model experiments of CMIP6). We focus here on results from the DAMIP Tier 1 test of AA forcings. This study used climate models from six different modeling centres with the necessary diagnostics for at least five different ensemble members for the Tier 1 test, at the time of download in July and August 2024. Table 1 summarises the models and simulations.
Table 1Summary details of DAMIP-AA climate model simulations analysed in this study.
Gillett et al. (2016) recommended that starting conditions for different ensemble members be taken from well-separated states of the long Control integration. The historical AA forcings for the forced simulations are based on inventories in the Community Emissions Data System described in Hoesly et al. (2018), with associated radiative forcings described in several studies (e.g. Lund et al., 2018, 2019; Gulev et al., 2021; Bauer et al., 2022). In brief, sulphates have been responsible for the largest multidecadal anomalies of shortwave radiative forcing in the industrial period, growing from a relatively small amount at the start of the 20th century to peak negative values in the 1980s and 1990s. The main source regions for 20th century sulphates were Europe, Russia, and to a lesser extent North America (e.g. Lund et al., 2019). There have been large cuts in sulphate emissions from these territories since the late 20th century leading to much smaller burdens this century. This is notable, because studies such as Diao et al. (2021) and Needham and Randall (2023) found the strength of the storm track in the northern hemisphere was more sensitive to emissions from mid-latitude regions.
2.2 Converting Model Winds to Losses
Windstorm losses in climate simulations have been estimated using a method published by Klawa and Ulbrich (2003), which was validated using timeseries of insurance losses. Further insights into this method were provided in a review of storm damage functions by Prahl et al. (2015). Its established validity has led to its widespread use (e.g. Leckebusch et al., 2007; Pinto et al., 2007; Karremann et al., 2014; Priestley et al., 2024). An overview of how their method is applied is now given.
Daily maximum near-surface (10 m) winds in the October to April windstorm season were extracted from model simulations for every grid cell in a study domain consisting of 16 countries in northern and central Europe which experience the vast majority of all insured wind losses, shown in Fig. 1. The first stage of processing defines the 98th percentile of the daily maximum wind in each grid cell (vi,98). This quantity is defined uniquely for each model, based on all windstorm seasons in its Control simulation (see Table 1). The second stage is to calculate a proxy of wind damage (Dd) in day d for the whole domain, for each ensemble member of each model, defined as:
where there are N grid cells in the domain, vi,d is the daily maximum wind for the ith grid cell on day d, and vi,98 is defined above. The third stage is to identify storm events (s) in each model integration: an event is defined as a period of up to 3 d centred on the days with peak values of Dd, though may be of shorter duration in practice when the maximum winds are below the 98th percentile throughout the domain. For each identified storm, the event maximum wind (vi,e) is set to the maximum of the daily values comprising the storm, for each grid cell. As mentioned above, published studies of observed windstorm damages to properties, such as Klawa and Ulbrich (2003), Prahl et al. (2015), and Cusack (2023) found that event-maximum winds per location lead to valid estimates of total event losses.

Figure 1A map of Europe with grey shading highlighting the region for which losses were computed.
Finally, domain-wide event losses were estimated from the storm-maximum winds:
where Le is the loss for event e, and Pi is the population count for the ith cell from Gridded Population of the World, version 4, at 2.5 min of arc resolution (CIESIN, 2018). The constant of proportionality (c) in the above loss equation was used by KU03 to re-scale their index values to actual loss data. This study analysed the relative change in losses, and setting this coefficient to unity does not alter results.
While populations evolve over time, we follow the common practice of using population data fixed to a common year when applying Eq. (2). This ensures all modelled loss anomalies are caused by changes in storm climate, in isolation from socio-economic factors that drive changes in nominal losses.
Losses from a model simulation with AA forcing were converted to anomalies by subtracting the long-term mean losses of their corresponding control simulation, then re-scaled by 100 (mean loss of control) to obtain the change in percent. The storm loss anomalies were grouped into ensemble means for each model, and the multimodel mean too, using linear averaging. Part of the later analysis will use filtered versions of loss anomalies to highlight the multidecadal timescale of storm variation. These have been created using a low-pass second-order Butterworth filter with a 20 year cutoff.
2.3 Statistical testing
Two types of statistical measures have been used to assess the size of sampling errors in model results.
First, uncertainties in multimodel mean signals were estimated as follows. Low-pass filtered storm anomalies for historical year y were extracted from each of the 62 model simulations, then the standard deviation of this set was computed, and subsequently divided by the square root of the total number of simulations to estimate the standard error of the filtered ensemble mean for year y. This was repeated for all historical years, to yield the timeseries of standard errors of the filtered multimodel ensemble mean.
Second, sampling errors in ensemble mean signals from each model were assessed using t tests of a null hypothesis that each model's mean anomaly over the 1960–2009 period was zero. This time period was chosen to maximise the signal-to-noise ratio in model results, based on physical and statistical considerations. In more detail, Needham and Randall (2023) identified northern mid-latitude storm tracks to be more sensitive to AA emissions from the same zone, and their Fig. 6 indicates the period 1960–2009 covers the period of maximum AA forcing (i.e. larger signal). While a shorter time period could resolve stronger AA forcing, the longer 50 year period is preferred to reduce sampling error in results (i.e. lower levels of noise). The testing of each model consists of inputting unfiltered ensemble-mean loss anomalies for each year in the 1960–2009 period into a t test, to assess the extent to which the mean value over this time period is consistent with no response, given the variability of unfiltered annual anomalies.
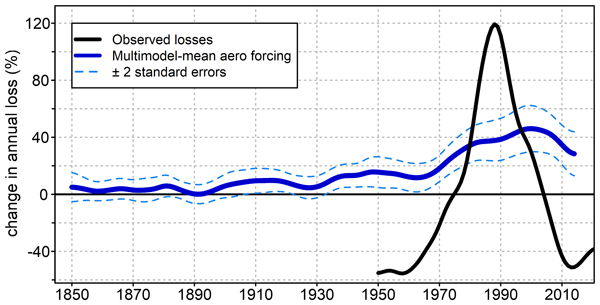
Figure 2a shows the timeseries of multimodel mean change in Europe-wide storm losses due to AA forcing, based on all 62 DAMIP-AA simulations. The main feature is a DAMIP-AA model peak at the end of the 20th century with 45 % greater windstorm losses than its preindustrial control run; the model signal is more than four standard errors above zero throughout the last two decades of the 20th century and indicates significant increases in European windstorm losses due to AA forcing. This conclusion is strengthened by the observation that the timing of the peak multi-model mean loss anomalies coincides with peak AA forcing from northern mid-latitudes (e.g. Lund et al., 2019). An observed loss reconstruction for the 1950–2023 period is also shown in Fig. 2a, and it can be seen that the AA-forced changes have smaller magnitude and slightly different phase from that experienced over the past seven decades. This is expected, since research indicates forcing from two major volcanic eruptions in the late 20th century and internal variability will exert influence on multidecadal variations in storminess.

Figure 2(a) Change in DAMIP multimodel mean Europe-wide storm losses due to AA forcing, (solid blue line) and uncertainty (plus and minus two standard errors of the mean, dashed lines), together with observed anomalies from the windstorm loss reconstruction in Cusack (2023). Note that observed anomalies are expressed relative to its long-term mean (1950–2023), whereas model anomalies are relative to long control integrations. (b) Ensemble-mean AA forcing of European windstorm losses in each of the six climate models. The p-value of a null hypothesis that the model has zero anomaly in the 1960–2009 period is given in the legend.
AA-forced anomalies were computed for individual model ensemble-means, and shown in Fig. 2b. The p-values of the null hypothesis that a model's ensemble mean anomaly over the 1960–2009 period was zero is given in parentheses in the legend of Fig. 2b. These p-values indicate four models have a non-zero signal at the 99.9 % confidence level, including two models projecting a near-certain increase in storm loss due to AA. However, two models simulate no significant AA forcing on European storm losses. At this point in the analysis, there is no evidence to prefer one model over another, and the fact that only four of six have a significant signal suggests AA forcing of storminess is likely, but less certain than that portrayed by the multimodel mean signal in Fig. 2a. It can be seen from Fig. 2b that the size of the multimodel mean signal is mainly due to strong AA forcing of storminess in two of the six models (CanESM5 and HadGEM3-GC31-LL). This wide range of storm responses to AA forcing indicates large uncertainty in the amplitude of the AA signal, and a key feature of model results. Additional information on the AA forcing and climate responses in the six models will be presented in Sect. 4, to reduce uncertainty in storm responses to this forcing.
Figure 3 presents maps of the anomalies in the 500 hPa geopotential heights (ϕ500) for the 30 year period 1970–99 versus the earlier, less stormy 1940–69 period, for both the DAMIP-AA multimodel mean and ERA5 reanalyses, to illustrate the evolution of circulation anomalies in the later part of the 20th century. Figure 3a indicates the DAMIP-AA multimodel mean contains significant meridional gradients of ϕ500 anomalies over the northern Atlantic area, with an amplitude of about 12 m. This anomalous gradient is about of the magnitude in the ERA5 reconstruction (Fig. 3b), and consistent with the model-to-observed relativity found for losses (Fig. 2a). Therefore, the changes in modelled storm losses are physically connected to larger-scale circulation anomalies.

Figure 3Geopotential height anomalies at 500 hPa (m) for the 1970–1999 period relative to 1940–1969, for (a) DAMIP-AA multimodel-mean, and (b) ERA5.
The corresponding circulation anomalies for each model ensemble are shown in Fig. 4. A similar consistency between circulation and loss anomalies is found, namely that the changes in losses in the late 20th century for each model (Fig. 2b) are generally aligned with the size of the model's meridional gradients in ϕ500 anomalies over Europe in Fig. 4. For example, CanESM5 contains the steepest gradient in ϕ500 anomalies over the Euro-Atlantic sector, and also produces the largest storm loss anomalies of all models.
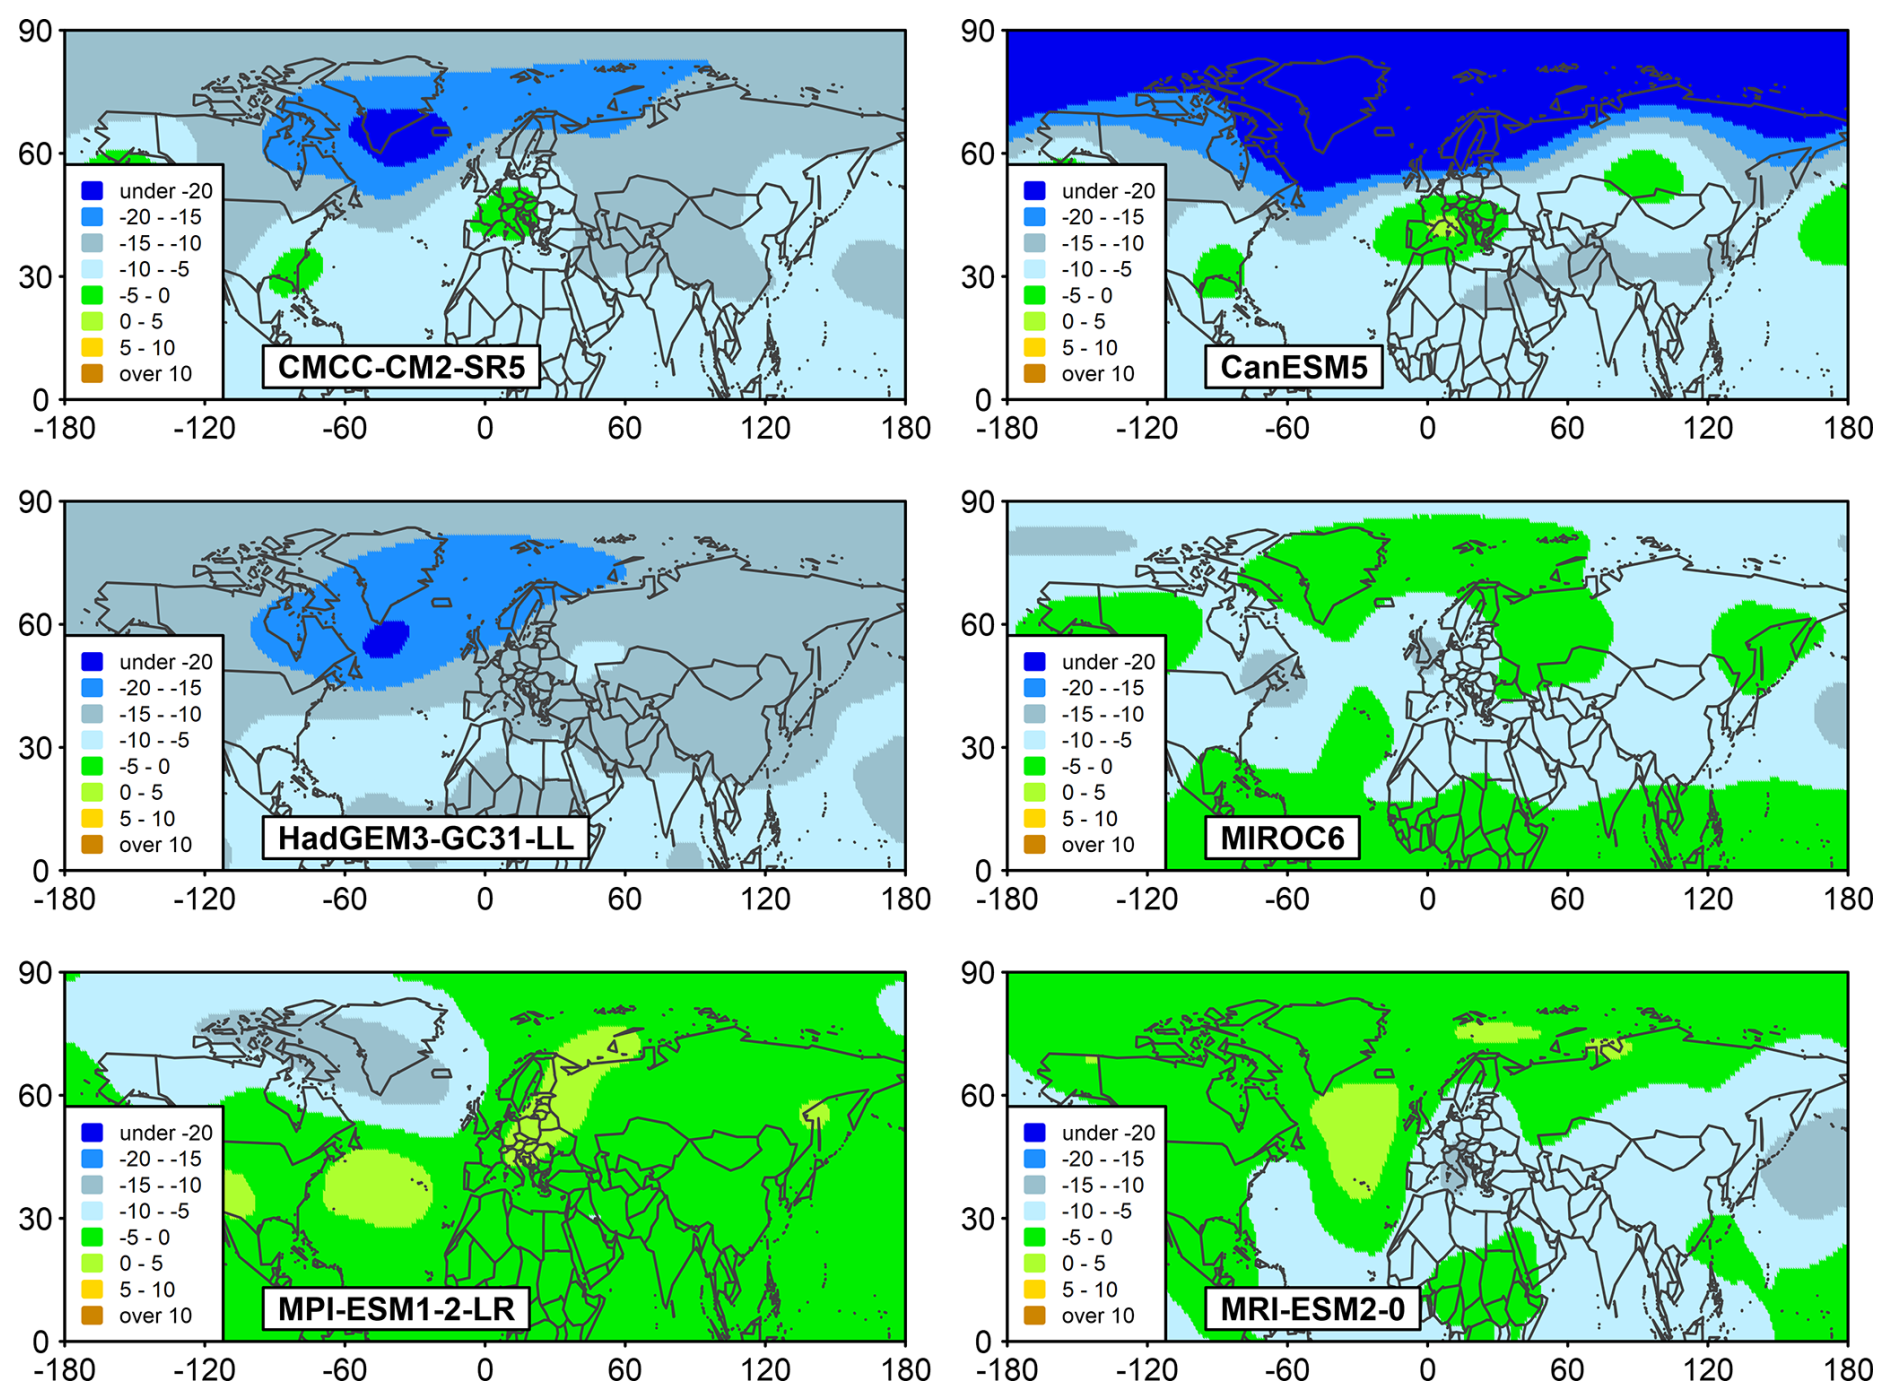
Figure 4Geopotential height anomalies at 500 hPa (m) for the 1970–1999 period relative to 1940–1969, for the six individual DAMIP-AA model ensemble means.
The spread in DAMIP-AA results signifies large uncertainty in model estimates of the size of European windstorm loss anomalies due to AA forcing. As mentioned previously, only four of the six models simulate significant anomalies in European storm losses, and further, the mean signal is mostly due to contributions from just two models. In this section, we aim to reduce this uncertainty by conducting an assessment of the modelled storm responses using data and insights from past studies.
The assessment framework is founded on a relation between variables uncovered in past research. In brief, AA radiative forcing drives changes in poleward energy transports (PET) that are manifested in the northern mid-latitudes as anomalies in both AMOC and storm tracks. Therefore, consideration of both modelled AA forcing, and associated AMOC responses to such forcing, can help understand the different storm track responses to AA forcing in models. Further, the validity of both the modelled AA forcing, and AMOC responses to it, can inform on the accuracy of modelled storm track responses. More details of this methodology are now given, before applying it to modelling results.
Needham and Randall (2023) described how the total PET is connected to the latitudinal gradient of net radiation at the top of atmosphere (TOA), therefore, the perturbed TOA radiation balance from AA forcing drives anomalies in total PET. In turn, Needham et al. (2024) showed how the total PET anomalies in northern mid-latitudes in a modern climate model (CESM2; Danabasoglu et al., 2020) are largely the sum of changes in two quantities, namely ocean heat transport via AMOC and atmosphere heat transport via eddies, or storm tracks. Therefore, the validity of the modelled change in storm tracks can be inferred from assessments of the accuracy of anomalies in both TOA radiation and AMOC in model simulations.
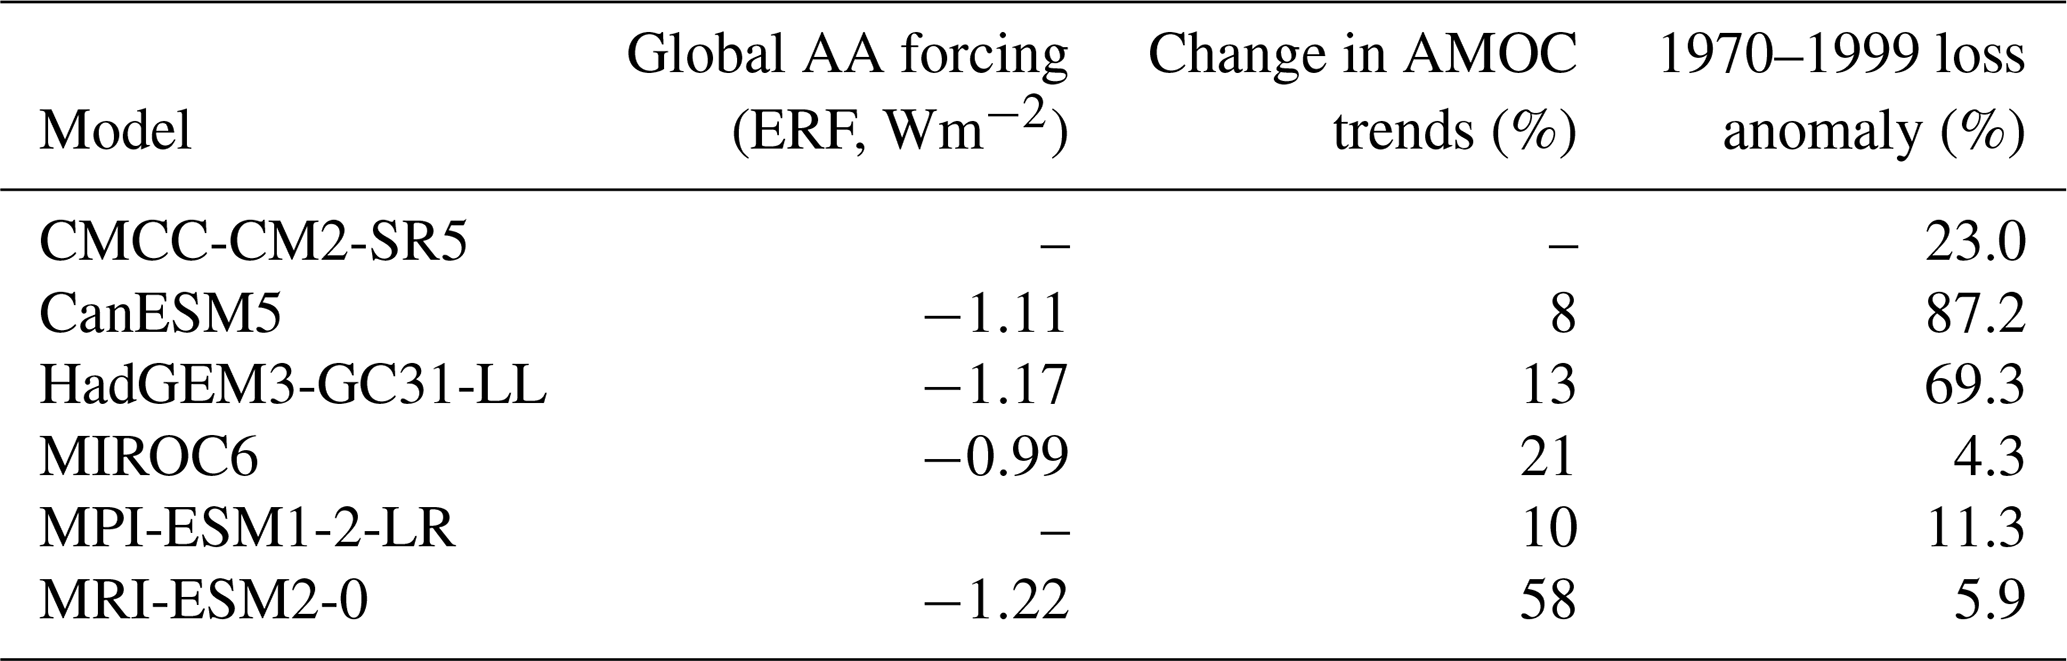
We begin by assessing perturbations to the TOA radiation balance over northern mid-latitudes due to AA forcing, measured using effective radiative forcing (ERF). There are no published estimates of zonal-mean AA net radiation anomalies in northern mid-latitudes for CMIP6 models. Instead, we analyse global ERF, based on the assumption that it is reasonably aligned with corresponding values over the northern storm-tracks, since most of the sulphur emissions in the historical period have been from the northern mid-latitudes. Forster et al. (2021) provided a summary of the latest modelling and observational estimates of AA ERF at 2014, relative to the pre-industrial period, and includes four of the six models used in this study. Table 2 presents the data for these four models (extracted from table 7.6 of Forster et al., 2021) and their average is −1.12 Wm−2, which is 13 % smaller magnitude than a best observational estimate of −1.3 Wm−2 from Forster et al. (2021), suggesting the DAMIP-AA ensemble used here may underestimate true AA forcing, on average. Forster et al. (2021) also indicate it is very likely that the true global ERF due to AA forcing in 2014 lies in a range from −0.6 to −2.0 Wm−2, which in turn suggests some possibility that the AA forcings in these models are stronger than the true value. In summary, the studied models tend to have slightly weaker global radiative forcing from AA than best observational estimates, though within the very likely range of true forcing.
Table 2DAMIP-AA climate model diagnostics. Global top-of-atmosphere effective radiative forcings are taken from Forster et al. (2021). The difference in the AMOC trends between 1950–1990 (increases) and 1990–2020 (reductions) are taken from Fig. S1 of Hassan et al. (2021). The final column shows the AA-forced windstorm loss anomalies in the 1970–1999 period relative to corresponding control runs.
The validity of CMIP6 model simulations of historical AMOC anomalies has been addressed by both Menary et al. (2020) and Hassan et al. (2021). Both studies conclude that the AMOC changes over the past several decades from an ensemble of CMIP6 models were largely driven by AA forcing, and the amplitude of the simulated AMOC anomalies are likely to be larger than best estimates of observed change. However, there are significant uncertainties in the estimates of AMOC anomalies and trends throughout the 20th century. Direct AMOC measurements began in 2004 with the RAPID array (Rayner et al., 2011), and estimates before this time span a wide range, extending to uncertainty in the sign of 20th century trends as well as its magnitude (e.g. Tett et al., 2014; Karspeck et al., 2017; McCarthy and Caesar, 2023). In this context, it is notable that the estimates of historical AMOC used by both Menary et al. (2020) and Hassan et al. (2021) were based on relations between sea surface temperature (SST) anomalies in the North Atlantic's subpolar gyre and AMOC, from CMIP5 climate models (Rahmstorf et al., 2015). This SST proxy tends to estimate significantly weakening AMOC trends in the 20th century relative to other reconstruction methods, as can be found from comparing SST-based AMOC reconstructions in Rahmstorf et al. (2015) with those from ocean reanalyses (e.g. Danabasoglu et al., 2016) or ocean observations (e.g. Fraser and Cunningham, 2021). These estimates of weaker AMOC trends are maybe due to relative SST anomalies in the subpolar gyre being driven by other processes, in addition to AMOC deviations (e.g. Keil et al., 2020; Little et al., 2020). Therefore, while CMIP6 models tend to simulate AMOC changes in the 20th century that are more positive than those reconstructed from SSTs, it is unclear whether models are above the true AMOC trends during that period.
The above validation indicates CMIP6 models produce slightly low magnitudes of net TOA radiation anomalies, and slightly too large AMOC anomalies, both of which imply weaker storm track responses to AA forcing in CMIP6 models. However, the uncertainties in these results are noteworthy. Reference historical estimates of net TOA radiation and AMOC are poorly constrained, and the use of global AA ERF as a proxy of the strength of northern mid-latitude AA forcing creates extra doubt. Uncertainties in net TOA radiation and AMOC are large enough to admit the possibility that the simulated storm loss changes are not too weak, though this scenario is less likely.
There are sources of uncertainty in the validation framework too. First, the zonal-mean scale of the PET analysis does not resolve regional anomalies within a zone. While a zonal scale is consistent with the observed zonal strengthening of storm track anomalies in the late 20th century (e.g. Chang and Fu, 2002; Woollings et al., 2014), it remains likely that processes within the Atlantic sector could create a local anomaly to some extent, and go undetected in a zonal-mean framework. Second, the AA-forced PET anomalies in northern mid-latitudes were decomposed into anomalies of both AMOC and storm tracks in this analysis, based on the behaviour of a single climate model (CESM2). However, extra data in Table 2 indicate other climate models contain the same behaviour, with AA-forced PET anomalies manifesting as changes in both AMOC and storm tracks in northern mid-latitudes. In more detail, Hassan et al. (2021) provide AMOC trends (in %) for a selection of CMIP6 models in two consecutive periods, one with an upward trend (1950–1990) and the other with a declining trend (1990–2020), and reported how the change in the trend was largely driven by changes in AA emissions. Here, we use the difference in their trends (i.e. [1950–1990 trend in %] minus [1990–2020 trend in %]) as a measure of a model's AMOC responsiveness to AA forcing, and results are listed in Table 2. The data indicate how models with greater AMOC changes have smaller European windstorm loss changes in the late 20th century, and vice-versa. Such compensation between AMOC and storm track anomalies supports the validation framework.
In summary, results in past studies have been used to measure the validity of modelled storm track responses to AA forcing. They suggest CMIP6 models could underestimate mid-latitude storm increases in the late 20th century, because (a) the magnitude of modelled AA forcing is slightly smaller than best estimates of observed, and (b) models tend to overestimate AMOC responses to recent AA forcing, which would tend to reduce their storm track response to the same forcing. However, there is low confidence in these findings, mainly due to large uncertainties in estimates of AA forcing and AMOC in the 20th century. Further research into northern mid-latitude AA radiative forcing, and AMOC anomalies through the 20th century, would improve our knowledge of the contribution of AA forcing to European windstorm risk.
We estimated the AA-forced contribution to multidecadal variations in European windstorm losses using results from multiple simulations of six climate models participating in the DAMIP-AA experiment. The multimodel ensemble mean had 45 % higher European windstorm losses in the late 20th century relative to preindustrial times, though anomalies range from zero to 100 % between models and signify large uncertainty in the strength of AA-forced impacts.
Findings from earlier studies provide additional insights into the DAMIP-AA estimates of storm responses to AA forcing. First, the global radiative forcing due to AA was found to be 10 % to 15 % lower in models than the best estimate of observed, which would lead to a low bias in DAMIP-AA storm responses. Second, modelled AMOC responses to AA forcing are larger than estimates of historical AMOC behaviour, which implies the same models would simulate weaker changes in mid-latitude storminess. Therefore, both sets of validation data indicate DAMIP-AA windstorm loss changes are biased low.
Significant uncertainties remain. For example, past values of both global radiative forcing and AMOC provide weak constraints on the modelled storm responses to AA forcing, while the zonal-mean diagnostics used in validation do not resolve processes local to the Atlantic sector which may modulate European storminess. Future research into these uncertainties could lead to a better understanding of past multidecadal storminess in Europe and its future trajectory, and better management of this risk.
CMIP6-DAMIP climate model results were downloaded from the Earth System Grid Federation (ESGF): https://aims2.llnl.gov/search/cmip6/ (last access: July–August 2024). Model data references are as follows: CMCC-CM2-SR5 (https://doi.org/10.22033/ESGF/CMIP6.3874, Lovato and Peano, 2020; https://doi.org/10.22033/ESGF/CMIP6.17947, Lovato and Peano, 2024); CanESM5 (https://doi.org/10.22033/ESGF/CMIP6.3610, Swart et al., 2019a; https://doi.org/10.22033/ESGF/CMIP6.3597, Swart et al., 2019b); HadGEM3-GC31-LL (https://doi.org/10.22033/ESGF/CMIP6.6294, Ridley et al., 2018; https://doi.org/10.22033/ESGF/CMIP6.6052, Jones, 2019); MIROC6 (https://doi.org/10.22033/ESGF/CMIP6.5711, Tatebe and Watanabe, 2018; https://doi.org/10.22033/ESGF/CMIP6.5579, Shiogama, 2019); MPI-ESM1-2-LR (https://doi.org/10.22033/ESGF/CMIP6.6675, Wieners et al., 2019; https://doi.org/10.22033/ESGF/CMIP6.15024, Müller et al., 2019); MRI-ESM2-0 (https://doi.org/10.22033/ESGF/CMIP6.6900, Yukimoto et al., 2019a; https://doi.org/10.22033/ESGF/CMIP6.6821, Yukimoto et al., 2019b). The dataset of Europe windstorm loss reconstructions is described in https://doi.org/10.5194/nhess-23-2841-2023 (Cusack, 2023), with licensing restrictions, and are not accessible to the public or research community. Contact Stormwise Ltd at information@stormwise.co.uk to obtain access. All analyses were performed using R Statistical Software (v4.2.2; https://www.R-project.org/, R Core Team, 2022), and the low-pass filtering used the dplR package (v1.7.4; https://CRAN.R-project.org/package=dplR, Bunn et al., 2022).
The author has declared that there are no competing interests.
Publisher's note: Copernicus Publications remains neutral with regard to jurisdictional claims made in the text, published maps, institutional affiliations, or any other geographical representation in this paper. The authors bear the ultimate responsibility for providing appropriate place names. Views expressed in the text are those of the authors and do not necessarily reflect the views of the publisher.
The author is very grateful to the editor and reviewers for their time and expertise which significantly improved the original manuscript, and would like to thank Tyler Cox and Matt Raywood for valuable comments during development of this work.
This paper was edited by Uwe Ulbrich and reviewed by two anonymous referees.
Bauer, S. E., Tsigaridis, K., Faluvegi, G., Nazarenko, L., Miller, R. L., Kelley, M., and Schmidt, G.: The turning point of the aerosol era, J. Adv. Model. Earth Syst., 14, e2022MS003070, https://doi.org/10.1029/2022MS003070, 2022.
Brayshaw, D. J., Woollings, T., and Vellinga, M.: Tropical and extratropical responses of the North Atlantic atmospheric circulation to a sustained weakening of the MOC, J. Climate, 22, 3146–3155, https://doi.org/10.1175/2008JCLI2594.1, 2009.
Brázdil, R., Dobrovolny, P., Stekl, J., Kotyza, O., Valasek, H., and Jaroslav, J.: History of weather and climate in the Czech lands VI: Strong winds. Masaryk University, Brno, Czech Republic, 378 pp., ISBN 80-210-3547-1, 2004.
Brönnimann, S., Franke, J., Valler, V., Hand, R., Samakinwa, E., Lundstad, E., Burgdorf, A.-M., Lipfert, L., Pfister, L., Imfeld, N., and Rohrer, M.: Past hydroclimate extremes in Europe driven by Atlantic jet stream and recurrent weather patterns, Nat. Geosci., 18, 246–253, https://doi.org/10.1038/s41561-025-01654-y, 2025.
Bunn, A., Korpela, M., Biondi, F., Campelo, F., Mérian, P., Qeadan, F., and Zang, C.: dplR: Dendrochronology Program Library in R. R package version 1.7.4, The R Foundation for Statistical Computing [code], https://CRAN.R-project.org/package=dplR (last access: 31 May 2024), 2022.
Bushell, A. C., Anstey, J. A., Butchart, N., Kawatani, Y., Osprey, S. M., Richter, J. H., Serva, F., Braesicke, P., Cagnazzo, C., Chen, C.-C., Chun, H.-Y., Garcia, R. R., Gray, L. J., Hamilton, K., Kerzenmacher, T., Kim, Y.-H., Lott, F., McLandress, C., Naoe, H., Scinocca, J., Smith, A. K., Stockdale, T. N., Versick, S., Watanabe, S., Yoshida, K., and Yukimoto, S.: Evaluation of the Quasi-Biennial Oscillation in global climate models for the SPARC QBO-initiative, Q. J. R. Meteorol. Soc., 148, 1459–1489, https://doi.org/10.1002/qj.3765, 2022.
Chang, E. K. M. and Fu, Y.: Interdecadal variations in Northern Hemisphere winter storm track intensity, J. Climate, 15, 642–658, https://doi.org/10.1175/1520-0442(2002)015<0642:IVINHW>2.0.CO;2, 2002.
CIESIN (Center for International Earth Science Information Network) Columbia University: Gridded Population of the World, Version 4.11: Population Count, Revision 11, Palisades, NY: NASA Socioeconomic Data and Applications Center (SEDAC), https://doi.org/10.7927/H4JW8BX5, 2018.
Cusack, S.: A long record of European windstorm losses and its comparison to standard climate indices, Nat. Hazards Earth Syst. Sci., 23, 2841–2856, https://doi.org/10.5194/nhess-23-2841-2023, 2023.
Danabasoglu, G., Yeager, S. G., Bailey, D., Behrens, E., Bentsen, M., Bi, D., Biastoch, A., Böning, C., Bozec, A., Canuto, V. M., Cassou, C., Chassignet, E., Coward, A. C., Danilov, S., Diansky, N., Drange, H., Farneti, R., Fernandez, E., Fogli, P. G., Forget, G., Fujii, Y., Griffies, S. M., Gusev, A., Heimbach, P., Howard, A., Jung, T., Kelley, M., Large, W. G., Leboissetier, A., Lu, J., Madec, G., Marsland, S. J., Masina, S., Navarra, A., Nurser, A. J. G., Pirani, A., Salas y Mélia, D., Samuels, B. L., Scheinert, M., Sidorenko, D., Treguier, A. M., Tsujino, H., Uotila, P., Valcke, S., Voldoire, A., and Wang, Q.: North Atlantic simulations in Coordinated Ocean-ice Reference Experiments phase II (CORE-II). Part II: Inter-annual to decadal variability, Ocean Model., 97, 65–90, https://doi.org/10.1016/j.ocemod.2015.11.007, 2016.
Danabasoglu, G., Lamarque, J.-F., Bacmeister, J., Bailey, D. A., DuVivier, A. K., Edwards, J., Emmons, L. K., Fasullo, J., Garcia, R., Gettelman, A., Hannay, C., Holland, M. M., Large, W. G., Lauritzen, P. H., Lawrence, D. M., Lenaerts, J. T. M., Lindsay, K., Lipscomb, W. H., Mills, M. J., Neale, R., Oleson, K. W., Otto-Bliesner, B., Phillips, A. S., Sacks, W., Tilmes, S., van Kampenhout, L., Vertenstein, M., Bertini, A., Dennis, J., Deser, C., Fischer, C., Fox-Kemper, B., Kay, J. E., Kinnison, D., Kushner, P. J., Larson, V. E., Long, M. C., Mickelson, S., Moore, J. K., Nienhouse, E., Polvani, L., Rasch, P. J., and Strand, W. G.: The Community Earth System Model Version 2 (CESM2), J. Adv. Model.Earth Sy., 12, e2019MS001916, https://doi.org/10.1029/2019MS001916, 2020.
Dawson, A. G., Hickey, K., McKenna, J., and Foster, D. L.: A 200-year record of gale frequency, Edinburgh, Scotland: possible link with high-magnitude volcanic eruptions, The Holocene, 7, 337–341, https://doi.org/10.1177/095968369700700310, 1997.
Diao, C., Xu, Y., and Xie, S.-P.: Anthropogenic aerosol effects on tropospheric circulation and sea surface temperature (1980–2020): separating the role of zonally asymmetric forcings, Atmos. Chem. Phys., 21, 18499–18518, https://doi.org/10.5194/acp-21-18499-2021, 2021.
Eyring, V., Bony, S., Meehl, G. A., Senior, C. A., Stevens, B., Stouffer, R. J., and Taylor, K. E.: Overview of the Coupled Model Intercomparison Project Phase 6 (CMIP6) experimental design and organization, Geosci. Model Dev., 9, 1937–1958, https://doi.org/10.5194/gmd-9-1937-2016, 2016.
Fang, S.-W., Khodri, M., Timmreck, C., Zanchettin, D., and Jungclaus, J.: Disentangling internal and external contributions to Atlantic multidecadal variability over the past millennium, Geophys. Res. Lett., 48, e2021GL095990, https://doi.org/10.1029/2021GL095990, 2021.
Forster, P., Storelvmo, T., Armour, K., Collins, W., Dufresne, J.-L., Frame, D., Lunt, D. J., Mauritsen, T., Palmer, M. D., Watanabe, M., Wild, M., and Zhang, H.: The Earth's Energy Budget, Climate Feedbacks, and Climate Sensitivity, in: Climate Change 2021: The Physical Science Basis. Contribution of Working Group I to the Sixth Assessment Report of the Intergovernmental Panel on Climate Change, edited by: Masson-Delmotte, V., Zhai, P., Pirani, A., Connors, S. L., Péan, C., Berger, S., Caud, N., Chen, Y., Goldfarb, L., Gomis, M. I., Huang, M., Leitzell, K., Lonnoy, E., Matthews, J. B. R., Maycock, T. K., Waterfield, T., Yelekçi, O., Yu, R., and Zhou, B., Cambridge University Press, Cambridge, United Kingdom and New York, NY, USA, pp. 923–1054, https://doi.org/10.1017/9781009157896.009, 2021.
Fraser, N. J. and Cunningham, S. A.: 120 years of AMOC variability reconstructed from observations using the Bernoulli inverse, Geophys. Res. Lett., 48, e2021GL093893, https://doi.org/10.1029/2021GL093893, 2021.
Gastineau, G. and Frankignoul, C.: Cold-season atmospheric response to the natural variability of the Atlantic meridional overturning circulation, Clim. Dynam., 39, 37–57, https://doi.org/10.1007/s00382-011-1109-y, 2012.
Gillett, N. P., Shiogama, H., Funke, B., Hegerl, G., Knutti, R., Matthes, K., Santer, B. D., Stone, D., and Tebaldi, C.: The Detection and Attribution Model Intercomparison Project (DAMIP v1.0) contribution to CMIP6, Geosci. Model Dev., 9, 3685–3697, https://doi.org/10.5194/gmd-9-3685-2016, 2016.
Gray, L. J., Woollings, T. J., Andrews, M., and Knight, J.: Eleven-year solar cycle signal in the NAO and Atlantic/European blocking, Q. J. Roy. Meteor. Soc., 142, 1890–1903, https://doi.org/10.1002/qj.2782, 2016.
Gulev, S.K., Thorne, P. W., Ahn, J., Dentener, F. J., Domingues, C. M., Gerland, S., Gong, D., Kaufman, D. S., Nnamchi, H. C., Quaas, J., Rivera, J. A., Sathyendranath, S., Smith, S. L., Trewin, B., von Schuckmann, K., and Vose, R. S.: Changing State of the Climate System. In Climate Change 2021: The Physical Science Basis. Contribution of Working Group I to the Sixth Assessment Report of the Intergovernmental Panel on Climate Change, edited by: Masson-Delmotte, V., Zhai, P., Pirani, A., Connors, S. L., Péan, C., Berger, S., Caud, N., Chen, Y., Goldfarb, L., Gomis, M. I., Huang, M., Leitzell, K., Lonnoy, E., Matthews, J. B. R., Maycock, T. K., Waterfield, T., Yelekçi, O., Yu, R., and Zhou, B., Cambridge University Press, Cambridge, United Kingdom and New York, NY, USA, pp. 287–422, https://doi.org/10.1017/9781009157896.004, 2021.
Hassan, T., Allen, R. J., Liu, W., and Randles, C. A.: Anthropogenic aerosol forcing of the Atlantic meridional overturning circulation and the associated mechanisms in CMIP6 models, Atmos. Chem. Phys., 21, 5821–5846, https://doi.org/10.5194/acp-21-5821-2021, 2021.
Hermanson, L., Bilbao, R., Dunstone, N., Ménégoz, M., Ortega, P., Pohlmann, H., Robson, J., Smith, D., Strand, G., Timmreck, C., Yeager, S. G., and Danabasoglu, G.: Robust Multiyear Climate Impacts of Volcanic Eruptions in Decadal Prediction Systems, J. Geophys. Res.-Atmos., 125, https://doi.org/10.1029/2019jd031739, 2020.
Hoesly, R. M., Smith, S. J., Feng, L., Klimont, Z., Janssens-Maenhout, G., Pitkanen, T., Seibert, J. J., Vu, L., Andres, R. J., Bolt, R. M., Bond, T. C., Dawidowski, L., Kholod, N., Kurokawa, J.-I., Li, M., Liu, L., Lu, Z., Moura, M. C. P., O'Rourke, P. R., and Zhang, Q.: Historical (1750–2014) anthropogenic emissions of reactive gases and aerosols from the Community Emissions Data System (CEDS), Geosci. Model Dev., 11, 369–408, https://doi.org/10.5194/gmd-11-369-2018, 2018.
Hu, H.-M., Trouet, V., Spötl, C., Tsai, H.-C., Chien, W.-Y., Sung, W.-H., Michel, V., Yu, J.-Y., Valensi, P., Jiang, X., Duan, F., Wang, Y., Mii, H.-S., Chou, Y.-M., Lone, M. A., Wu, C.-C., Starnini, E., Zunino, M., Watanabe, T. K., Watanabe, T., Hsu, H.-H., Moore, G. W. K., Zanchetta, G., Pérez-Mejías, C., Lee, S.-Y., and Shen, C.-C.: Tracking westerly wind directions over Europe since the middle Holocene, Nat. Commun., 13, 7866. https://doi.org/10.1038/s41467-022-34952-9, 2022.
Ineson, S., Scaife, A. A., Knight, J. R., Manners, J. C., Dunstone, N. J., Gray, L. J., and Haigh, J. D.: Solar forcing of winter climate variability in the Northern Hemisphere, Nat. Geosci., 4, 753–757, https://doi.org/10.1038/ngeo1282, 2011.
Jones, G.: MOHC HadGEM3-GC31-LL model output prepared for CMIP6 DAMIP hist-aer, Earth System Grid Federation [data set], https://doi.org/10.22033/ESGF/CMIP6.6052, 2019.
Karremann, M. K., Pinto, J. G., von Bomhard, P. J., and Klawa, M.: On the clustering of winter storm loss events over Germany, Nat. Hazards Earth Syst. Sci., 14, 2041–2052, https://doi.org/10.5194/nhess-14-2041-2014, 2014.
Karspeck, A. R., Stammer, D., Köhl, A., Danabasoglu, G., Balmaseda, M., Smith, D. M., Fujii, Y., Zhang, S., Giese, B., Tsujino, H., and Rosati, A.: Comparison of the Atlantic meridional overturning circulation between 1960 and 2007 in six ocean reanalysis products, Clim. Dynam., 49, 957–982, https://doi.org/10.1007/s00382-015-2787-7, 2017.
Keil, P., Mauritsen, T., Jungclaus, J., Hedemann, C., Olonscheck, D., and Ghosh, R.: Multiple drivers of the North Atlantic warming hole, Nat. Clim. Change, 10, 667–671, https://doi.org/10.1038/s41558-020-0819-8, 2020.
Klawa, M. and Ulbrich, U.: A model for the estimation of storm losses and the identification of severe winter storms in Germany, Nat. Hazards Earth Syst. Sci., 3, 725–732, https://doi.org/10.5194/nhess-3-725-2003, 2003.
Leckebusch, G. C., Ulbrich, U., Fröhlich, L., and Pinto, J. G.: Property loss potentials for European midlatitude storms in a changing climate, Geophys. Res. Lett., 34, L05703, https://doi.org/10.1029/2006GL027663, 2007.
Little, C. M., Zhao, M., and Buckley, M. W.:. Do surface temperature indices reflect centennial-timescale trends in Atlantic Meridional Overturning Circulation strength? Geophys. Res. Lett., 47, e2020GL090888, https://doi.org/10.1029/2020GL090888, 2020.
Lovato, T. and Peano, D.: CMCC CMCC-CM2-SR5 model output prepared for CMIP6 CMIP piControl, Earth System Grid Federation [data set], https://doi.org/10.22033/ESGF/CMIP6.3874, 2020.
Lovato, T. and Peano, D.: CMCC CMCC-CM2-SR5 model output prepared for CMIP6 DAMIP hist-aer, Earth System Grid Federation [data set], https://doi.org/10.22033/ESGF/CMIP6.17947, 2024.
Lund, M. T., Myhre, G., Haslerud, A. S., Skeie, R. B., Griesfeller, J., Platt, S. M., Kumar, R., Myhre, C. L., and Schulz, M.: Concentrations and radiative forcing of anthropogenic aerosols from 1750 to 2014 simulated with the Oslo CTM3 and CEDS emission inventory, Geosci. Model Dev., 11, 4909–4931, https://doi.org/10.5194/gmd-11-4909-2018, 2018.
Lund, M. T., Myhre, G., and Samset, B. H.: Anthropogenic aerosol forcing under the Shared Socioeconomic Pathways, Atmos. Chem. Phys., 19, 13827–13839, https://doi.org/10.5194/acp-19-13827-2019, 2019.
McCarthy, G. D. and Caesar, L.: Can we trust projections of AMOC weakening based on climate models that cannot reproduce the past?, Philos. Trans. A. Math. Phys. Eng. Sci., 381, 20220193, https://doi.org/10.1098/rsta.2022.0193, 2023.
Mellado-Cano, J., Barriopedro, D., García-Herrera, R., Trigo, R. M., and Hernández, A.: Examining the North Atlantic Oscillation, east Atlantic pattern, and jet variability since 1685, J. Climate, 32, 6285–6298, https://doi.org/10.1175/JCLI-D-19-0135.1, 2019.
Menary, M. B., Robson, J., Allan, R. P., Booth, B. B. B., Cassou, C., Gastineau, G., Gregory, J., Hodson, D., Jones, C., Mignot, J., Ringer, M., Sutton, R., Wilcox, L., and Zhang, R.: Aerosol-forced AMOC changes in CMIP6 historical simulations, Geophys. Res. Lett., 47, e2020GL088166, https://doi.org/10.1029/2020GL088166, 2020.
Müller, W., Ilyina, T., Li, H., Timmreck, C., Gayler, V., Wieners, K.-H., Botzet, M., Brovkin, V., Giorgetta, M., Jungclaus, J., Reick, C., Esch, M., Bittner, M., Legutke, S., Schupfner, M., Wachsmann, F., Haak, H., de Vrese, P., Raddatz, T., Mauritsen, T., von Storch, J.-S., Behrens, J., Claussen, M., Crueger, T., Fast, I., Fiedler, S., Hagemann, S., Hohenegger, C., Jahns, T., Kloster, S., Kinne, S., Lasslop, G., Kornblueh, L., Marotzke, J., Matei, D., Meraner, K., Mikolajewicz, U., Modali, K., Nabel, J., Notz, D., Peters-von Gehlen, K., Pincus, R., Pohlmann, H., Pongratz, J., Rast, S., Schmidt, H., Schnur, R., Schulzweida, U., Six, K., Stevens, B., Voigt, A., and Roeckner, E.: MPI-M MPI-ESM1.2-LR model output prepared for CMIP6 DAMIP hist-aer, Earth System Grid Federation [data set], https://doi.org/10.22033/ESGF/CMIP6.15024, 2019.
Needham, M. R. and Randall, D. A.: Anomalous Northward Energy Transport due to Anthropogenic Aerosols During the 20th Century, J. Climate, 36, 1–37, https://doi.org/10.1175/JCLI-D-22-0798.1, 2023.
Needham, M. R., TCox, T., and Randall, D. A.: Aerosol-Induced Changes in Atmospheric and Oceanic Heat Transports in the CESM2 Large Ensemble, J. Climate, 37, 6395–6412, https://doi.org/10.1175/JCLI-D-23-0455.1, 2024.
Omrani, N. E., Keenlyside, N. S., Bader, J., and Manzini, E.: Stratosphere key for wintertime atmospheric response to warm Atlantic decadal conditions, Clim. Dynam., 42, 649–663, https://doi.org/10.1007/s00382-013-1860-3, 2014.
Peings, Y. and Magnusdottir, G.: Forcing of the wintertime atmospheric circulation by the multidecadal fluctuations of the North Atlantic Ocean, Environ. Res. Lett., 9, 034018, https://doi.org/10.1088/1748-9326/9/3/034018, 2014.
Pinto, J. G., Fröhlich, E. L., Leckebusch, G. C., and Ulbrich, U.: Changing European storm loss potentials under modified climate conditions according to ensemble simulations of the ECHAM5/MPI-OM1 GCM, Nat. Hazards Earth Syst. Sci., 7, 165–175, https://doi.org/10.5194/nhess-7-165-2007, 2007.
Prahl, B. F., Rybski, D., Burghoff, O., and Kropp, J. P.: Comparison of storm damage functions and their performance, Nat. Hazards Earth Syst. Sci., 15, 769–788, https://doi.org/10.5194/nhess-15-769-2015, 2015.
Priestley, M. D. K., Stephenson, D. B., Scaife, A. A., Bannister, D., Allen, C. J. T., and Wilkie, D.: Forced trends and internal variability in climate change projections of extreme European windstorm frequency and severity, Q. J. Roy. Meteor. Soc., 150, 4933–4950, https://doi.org/10.1002/qj.4849, 2024.
Qin, M., Dai, A., and Hua, W.: Aerosol-forced multidecadal variations across all ocean basins in models and observations since 1920, Sci. Adv., 6, eabb0425, https://doi.org/10.1126/sciadv.abb0425, 2020.
R Core Team: R: A language and environment for statistical computing [software], R Foundation for Statistical Computing, Vienna, Austria, https://www.R-project.org/ (last access: 31 May 2024), 2022.
Rahmstorf, S., Box, J. E., Feulner, G., Mann, M. E., Robinson, A., Rutherford, S., and Schaffernicht, E. J.: Exceptional twentieth-century slowdown in Atlantic Ocean overturning circulation, Nat. Clim.Change, 5, 475–480, https://doi.org/10.1038/nclimate2554, 2015.
Rayner, D., Hirschi, J. J.-M., Kanzow, T., Johns, W. E., Wright, P. G., Frajka-Williams, E., Bryden, H. L., Meinen, C. S., Baringer, M. O., Marotzke, J., Beal, L. M., and Cunningham, S. A.: Monitoring the Atlantic meridional overturning circulation, Deep Sea Res. II, 58, 1744–1753, https://doi.org/10.1016/j.dsr2.2010.10.056, 2011.
Ridley, J., Menary, M., Kuhlbrodt, T., Andrews, M., and Andrews, T.: MOHC HadGEM3-GC31-LL model output prepared for CMIP6 CMIP piControl, Earth System Grid Federation [data set], https://doi.org/10.22033/ESGF/CMIP6.6294, 2018.
Scaife, A. A., Ineson, S., Knight, J. R., Gray, L., Kodera, K., and Smith, D. M.: A mechanism for lagged North Atlantic climate response to solar variability, Geophys. Res. Lett., 40, 434–439, https://doi.org/10.1002/grl.50099, 2013.
Sheldon, L., Czaja, A., Vannière, B., Morcrette, C., Sohet, B., Casado, M., and Smith, D.: A “warm path” for Gulf Stream–troposphere interactions. Tellus A, 69, 1299397. https://doi.org/10.1080/16000870.2017.1299397, 2017.
Shiogama, H.: MIROC MIROC6 model output prepared for CMIP6 DAMIP hist-aer, Earth System Grid Federation [data set], https://doi.org/10.22033/ESGF/CMIP6.5579, 2019.
Swart, N. C., Cole, J. N. S., Kharin, V. V., Lazare, M., Scinocca, J. F., Gillett, N. P., Anstey, J., Arora, V., Christian, J. R., Jiao, Y., Lee, W. G., Majaess, F., Saenko, O. A., Seiler, C., Seinen, C., Shao, A., Solheim, L., von Salzen, K., Yang, D., Winter, B., and Sigmond, M.: CCCma CanESM5 model output prepared for CMIP6 CMIP historical, Earth System Grid Federation [data set], https://doi.org/10.22033/ESGF/CMIP6.3610, 2019a.
Swart, N. C., Cole, J. N. S., Kharin, V. V., Lazare, M., Scinocca, J. F., Gillett, N. P., Anstey, J., Arora, V., Christian, J. R., Jiao, Y., Lee, W. G., Majaess, F., Saenko, O. A., Seiler, C., Seinen, C., Shao, A., Solheim, L., von Salzen, K., Yang, D., Winter, B., and Sigmond, M.: CCCma CanESM5 model output prepared for CMIP6 DAMIP hist-aer, Earth System Grid Federation [data set], https://doi.org/10.22033/ESGF/CMIP6.3597, 2019b.
Tatebe, H. and Watanabe, M.: MIROC MIROC6 model output prepared for CMIP6 CMIP piControl, Earth System Grid Federation [data set], https://doi.org/10.22033/ESGF/CMIP6.5711, 2018.
Tett, S. F. B., Sherwin T. J., Shravat A., and Browne O.: How Much Has the North Atlantic Ocean Overturning Circulation Changed in the Last 50 Years?, J. Climate, 27, 6325–6342, https://doi.org/10.1175/JCLI-D-12-00095.1., 2014.
Thiéblemont, R., Matthes, K., Omrani, N.-E., Kodera, K., and Hansen, F.: Solar forcing synchronizes decadal North Atlantic climate variability, Nat. Comm., 6, 8268, https://doi.org/10.1038/ncomms9268, 2015.
WASA Group: Changing waves and storms in the northeast Atlantic?, B. Am. Meteorol. Soc., 79, 741–760, https://doi.org/10.1175/1520-0477(1998)079<0741:CWASIT>2.0.CO;2, 1998.
Wieners, K.-H., Giorgetta, M., Jungclaus, J., Reick, C., Esch, M., Bittner, M., Legutke, S., Schupfner, M., Wachsmann, F., Gayler, V., Haak, H., de Vrese, P., Raddatz, T., Mauritsen, T., von Storch, J.-S., Behrens, J., Brovkin, V., Claussen, M., Crueger, T., Fast, I., Fiedler, S., Hagemann, S., Hohenegger, C., Jahns, T., Kloster, S., Kinne, S., Lasslop, G., Kornblueh, L., Marotzke, J., Matei, D., Meraner, K., Mikolajewicz, U., Modali, K., Müller, W., Nabel, J., Notz, D., Peters-von Gehlen, K., Pincus, R., Pohlmann, H., Pongratz, J., Rast, S., Schmidt, H., Schnur, R., Schulzweida, U., Six, K., Stevens, B., Voigt, A., and Roeckner, E.: MPI-M MPI-ESM1.2-LR model output prepared for CMIP6 CMIP piControl, Earth System Grid Federation [data set], https://doi.org/10.22033/ESGF/CMIP6.6675, 2019.
Woollings, T., Czuchnicki, C., and Franzke, C.: Twentieth century North Atlantic jet variability, Q. J. Roy. Meteor. Soc., 140, 783–791, https://doi.org/10.1002/qj.2197, 2014.
Woollings, T., Franzke, C., Hodson, D. L. R., Dong, B., Barnes, E. A., Raible, C. C., and Pinto, J. G.: Contrasting interannual and multidecadal NAO variability, Clim. Dynam., 45, 539–556, https://doi.org/10.1007/s00382-014-2237-y, 2015.
Yan, X., Zhang, R., and Knutson, T. R.: Underestimated AMOC variability and implications for AMV and predictability in CMIP models, Geophys. Res. Lett., 45, 4319–4328, https://doi.org/10.1029/2018GL077378, 2018.
Yukimoto, S., Koshiro, T., Kawai, H., Oshima, N., Yoshida, K., Urakawa, S., Tsujino, H., Deushi, M., Tanaka, T., Hosaka, M., Yoshimura, H., Shindo, E., Mizuta, R., Ishii, M., Obata, A., and Adachi, Y.: MRI MRI-ESM2.0 model output prepared for CMIP6 CMIP piControl, Earth System Grid Federation [data set], https://doi.org/10.22033/ESGF/CMIP6.6900, 2019a.
Yukimoto, S., Koshiro, T., Kawai, H., Oshima, N., Yoshida, K., Urakawa, S., Tsujino, H., Deushi, M., Tanaka, T., Hosaka, M., Yoshimura, H., Shindo, E., Mizuta, R., Ishii, M., Obata, A., and Adachi, Y.: MRI MRI-ESM2.0 model output prepared for CMIP6 DAMIP hist-aer, Earth System Grid Federation [data set], https://doi.org/10.22033/ESGF/CMIP6.6821, 2019b.
Zanchettin D., Timmreck, C., Bothe, O., Lorenz, S. J., Hegerl, G., Graf, H. F., Luterbacher, J., and Jungclaus, J. H.: Delayed winter warming: A robust decadal response to strong tropical volcanic eruptions?, Geophys. Res. Lett., 40, 204–209, https://doi.org/10.1029/2012GL054403, 2013.
Zhang, R., Sutton R., Danabasoglu G., Kwon Y. O., Marsh R., Yeager S. G., Amrhein, D. E., and Little, C. M.: A review of the role of the Atlantic meridional overturning circulation in Atlantic multidecadal variability and associated climate impacts, Rev. Geophys., 57, 316–375, https://doi.org/10.1029/2019RG000644, 2019.