
the Creative Commons Attribution 4.0 License.
the Creative Commons Attribution 4.0 License.
 | 29 Sep 2026
Characteristics of extreme snowfall–wind-gust events in Finland (1960–2024): frequency, duration, and intensity

Terhi K. Laurila
Ari Aaltonen
Kirsti Jylhä
Compound weather events involving both strong wind gusts and intense snowfall can have significant impacts on critical infrastructure and public safety. This study analyses the frequency, duration, and intensity of such events in Finland using ERA5 reanalysis data for 1960–2024. Extreme wind gust and snowfall conditions were identified using spatially varying 95th and 98th percentile thresholds. Events with both snowfall and wind gust exceeding these thresholds simultaneously were classified as compound events (SWG). SWGs were most frequent along Finland's south facing coastal regions and eastern Finland. Increasing the threshold from 95th to 98th reduced the number of SWGs but emphasized the dominance of coastal areas and highlighted more severe cases. Approximately half of the events were short-lived (<5 h) and involved limited accumulation of snow water equivalent (<5 mm). However, a few prolonged SWGs were identified, characterized by wind gusts > 20 m s−1, hourly snowfall rates > 2.5 mm h−1, and total snowfall > 20 mm. Although rare, these extreme SWGs can create substantial operational challenges for energy production and other critical infrastructures. The results underscore the importance of incorporating compound-event analysis into hazard assessments and preparedness strategies for regions exposed to severe winter weather.
- Article
(7917 KB) - Full-text XML
- BibTeX
- EndNote


Extreme events such as high wind gusts and intense snowfall are not only natural phenomena but also significant factors that play a crucial role in the safety and operational integrity of critical infrastructure and economic losses (Rutgersson et al., 2022). From a societal perspective, high wind gusts and intense snowfall can severely disrupt transportation networks, cause widespread power outages, and limit access to emergency services (Räisänen et al., 2026; Zhao et al., 2026; Láng-Ritter et al., 2025; Laurila et al., 2025b; Rauhala and Juga, 2010; Niinimäki, 2008). Understanding and mitigating the impacts of such conditions is vital for societal resilience, as well as for ensuring the uninterrupted functioning of essential services, including energy production.
Nuclear power plants (NPP) must adhere to strict safety protocols and are designed with multiple layers of safety features. NPPs must account for external environmental stresses including possible consequences of extreme weather. Strong winds causing snow and ice buildup on ventilation and cooling systems have been identified as potential risks that could reduce operational efficiency or even lead to unplanned shutdowns (Jylhä et al., 2018).
Recently, two strong mid-latitude cyclones affected large areas of Finland within a short time range, storm Lyly on 1 November 2024 (Laurila et al., 2025b; Punkka and Láng-Ritter, 2024) and storm Jari on 20-21 November 2024 (Lehtonen, 2024; YLE, 2024; Trimble, 2024). High wind speeds and gusts, co-occurring with heavy snowfall caused severe power outages and traffic accidents, forest damages and cancelled or delayed public transport systems. In addition, two large power line poles in Eurajoki, on the west coast of Finland, collapsed during storm Lyly due to hurricane-force winds combined with structural weakening of the line poles caused by guy-wire corrosion (STT, 2024). Understanding and mitigating the impacts of such conditions are vital for societal resilience, as well as for ensuring the uninterrupted functioning of essential services, including energy production.
In Finland in winter, the lowest level of wind gust warnings is issued when gusts exceed 20 m s−1, while the second level of warning is triggered at gusts exceeding 25 m s−1 in land areas (FMI, 2025a). The snowfall intensity has no exact threshold for warnings in Finland similarly as the rainfall has. For rainfall the extreme thresholds when warning is issued are 20 mm h−1 and 50 mm d−1 (https://www.ilmatieteenlaitos.fi/sadevaroitukset, last access: 25 September 2026). For snowfall, the intensity is commonly described as visibility, not the precipitation rate. Rasmussen et. al. (1999) has studied the relation between snowfall rate (as water equivalent) and visibility. In their field experiments, a moderate snowfall rate (estimated by Rasmussen et al., 1999 to be 1–2.5 mm h−1, 1 mm of snowfall corresponding roughly 1 cm of snow depth) corresponded to visibilities between 0.3 and 2.0 km, while a heavy snowfall rate (> 2.5 mm h−1) resulted in visibilities from 0.2 to 0.8 km, for temperatures less than 0 °C.
From a societal perspective the compound nature of wind gust and snowfall events is crucial, since it is their concurrence that can lead to cascading impacts and amplified risks. Operational services, such as road weather warnings, have acknowledged the danger of combined hazards. The Finnish Meteorological Institute (FMI) issues road weather warnings divided to four categories (normal, bad, very bad, extremely bad) based on the severity of possible impacts (FMI, 2021). In addition to snowfall, blowing snow also reduces visibility and poses hazard to traffic when snowfall coincides with wind gusts exceeding 15–20 m s−1 (FMI, 2025b). Nevertheless, no specific numerical threshold is provided for snowfall in the warnings; the category only refers to “extreme snowfall” or “low visibility”.
Knowledge of the statistical characteristics of co-occurring strong winds and heavy snowfall is crucial for evaluating their possible impacts and devising effective response strategies. In Finland, winter storms typically arrive from the southwest (Láng-Ritter et al., 2025), crossing the Baltic Sea before reaching the mainland. When the sea is ice-free, these storms can acquire additional heat and moisture, which enhances precipitation and may result in heavy snowfall along coastal areas (Olsson et al., 2023). Since Finland's nuclear power plants are located on the shoreline, understanding storm statistics over the sea as well as over land is crucial. However, direct observations of air temperature or wind gusts over the sea are sparse or entirely absent, making reanalysis data a more feasible source of information in such cases.
Temporal and spatial occurrence of strong winds and large snow load amounts in Finnish land areas based on weather station observations have been assessed by e.g., Gregow et al. (2008) and Niinimäki (2008). Gregow et al. (2008) used wind speed observations from 19 weather stations that were standardized to 10 m height, and Niinimäki (2008) used wind speed and precipitation observations from 49 weather stations. Based on Gregow et al. (2008) the strongest wind speeds were observed most often along the coastline and over the lakes in Finland during 1961–2000 but the wind speeds rarely exceeded 17 m s−1. Niinimäki (2008) found eight snowstorms in southern and southwestern Finland during the period 1965–2005 for which 10 min wind speed, daily precipitation amounts and daily increase in snow depth simultaneously exceeded the selected thresholds of 21 m s−1, 15 mm, and 15 cm, respectively. Niinimäki (2008) speculated that jointly occurring high winds and intense snowfall are likely to have been more numerous.
The frequency of severe weather events including snowfall, wind gust and blizzards (snowfall >10 cm d−1 and wind gust >17 m s−1) in Europe in past and future climates have been investigated by Vajda et al. (2014). They used 30 years of data from E-OBS observational and ERA-Interim reanalysis data as well as ENSEMBLES climate model data to produce statistics of the event frequencies of daily time resolution. They concluded that the number of snowfall days is decreasing in the future, but the number of heavy snowfall days might even increase in the Northern Europe.
There is no recent statistics in Finland of how intense and frequent these compound events are. The present study addresses this gap by examining extreme snowstorms for which both snowfall and wind gusts reach high levels. By focusing on these compound extremes, the study provides quantitative evidence on their frequency and temporal characteristics, thereby contributing to a more comprehensive understanding of winter hazards in northern Europe. Such knowledge is essential for improving risk assessment frameworks and supporting societal preparedness in the face of severe winter weather.
Because the observation stations providing information on precipitation type is sparse, we utilize hourly ERA5 reanalysis data to study these extreme events. The hourly data enables sub-daily and event-based studies. In addition, the usage of snowfall instead of precipitation ensured that we included only snowfall events without a need to use a temperature threshold for classifying precipitation events into rain or snow. As ERA5 is known to underestimate extreme winds (Laurila et al., 2025a), the use of percentiles instead of an absolute threshold value was utilized. In addition, a short comparison between two observation stations and corresponding ERA5 grid points was performed to examine the differences between observed and ERA5 wind gusts and snowfall on hourly basis (Sect. 3.1).
The co-occurrence of extreme hourly snowfall and wind gusts was investigated using spatially varying high percentiles as thresholds to define hourly extreme events, accounting for the spatial variability and distinct climatological characteristics of the regions. The primary research questions we addressed are: (i) What are the frequency and geographical distribution of co-occurring high winds and heavy snowfall (Sect. 3.2), (ii) What is the duration of consecutive hours during which compound events persist (Sect. 3.3), and (iii) What is the intensity of these compound events (Sect. 3.4).
2.1 Study locations
Four locations in Finland were selected for detailed analysis of compound events involving high wind gusts and intense snowfall. All the selected locations (Fig. 1, Table 1) are coastal since apart from some mountain stations in the north, the strongest wind gusts in Finland occur along the coastline (Laurila et al., 2025a). Two of the locations were chosen because they host nuclear power plants (Eurajoki Olkiluoto and Loviisa Hästholmen), while the remaining two (Tornio Torppi and Turku Artukainen) represent areas with a relatively high frequency of hours with snowfall >1 mm h−1 (not shown). The selection was further guided by the availability of concurrent observation stations measuring wind gusts, precipitation amount, and precipitation type, as such stations are relatively scarce. Population density was also considered to include regions of societal relevance.
Before the analysis of extreme events based on ERA5 a short comparison between station observations and ERA5 data was performed for two of the selected study locations; Tornio Torppi and Turku Artukainen. ERA5 values at the nearest grid point are used for each study location.
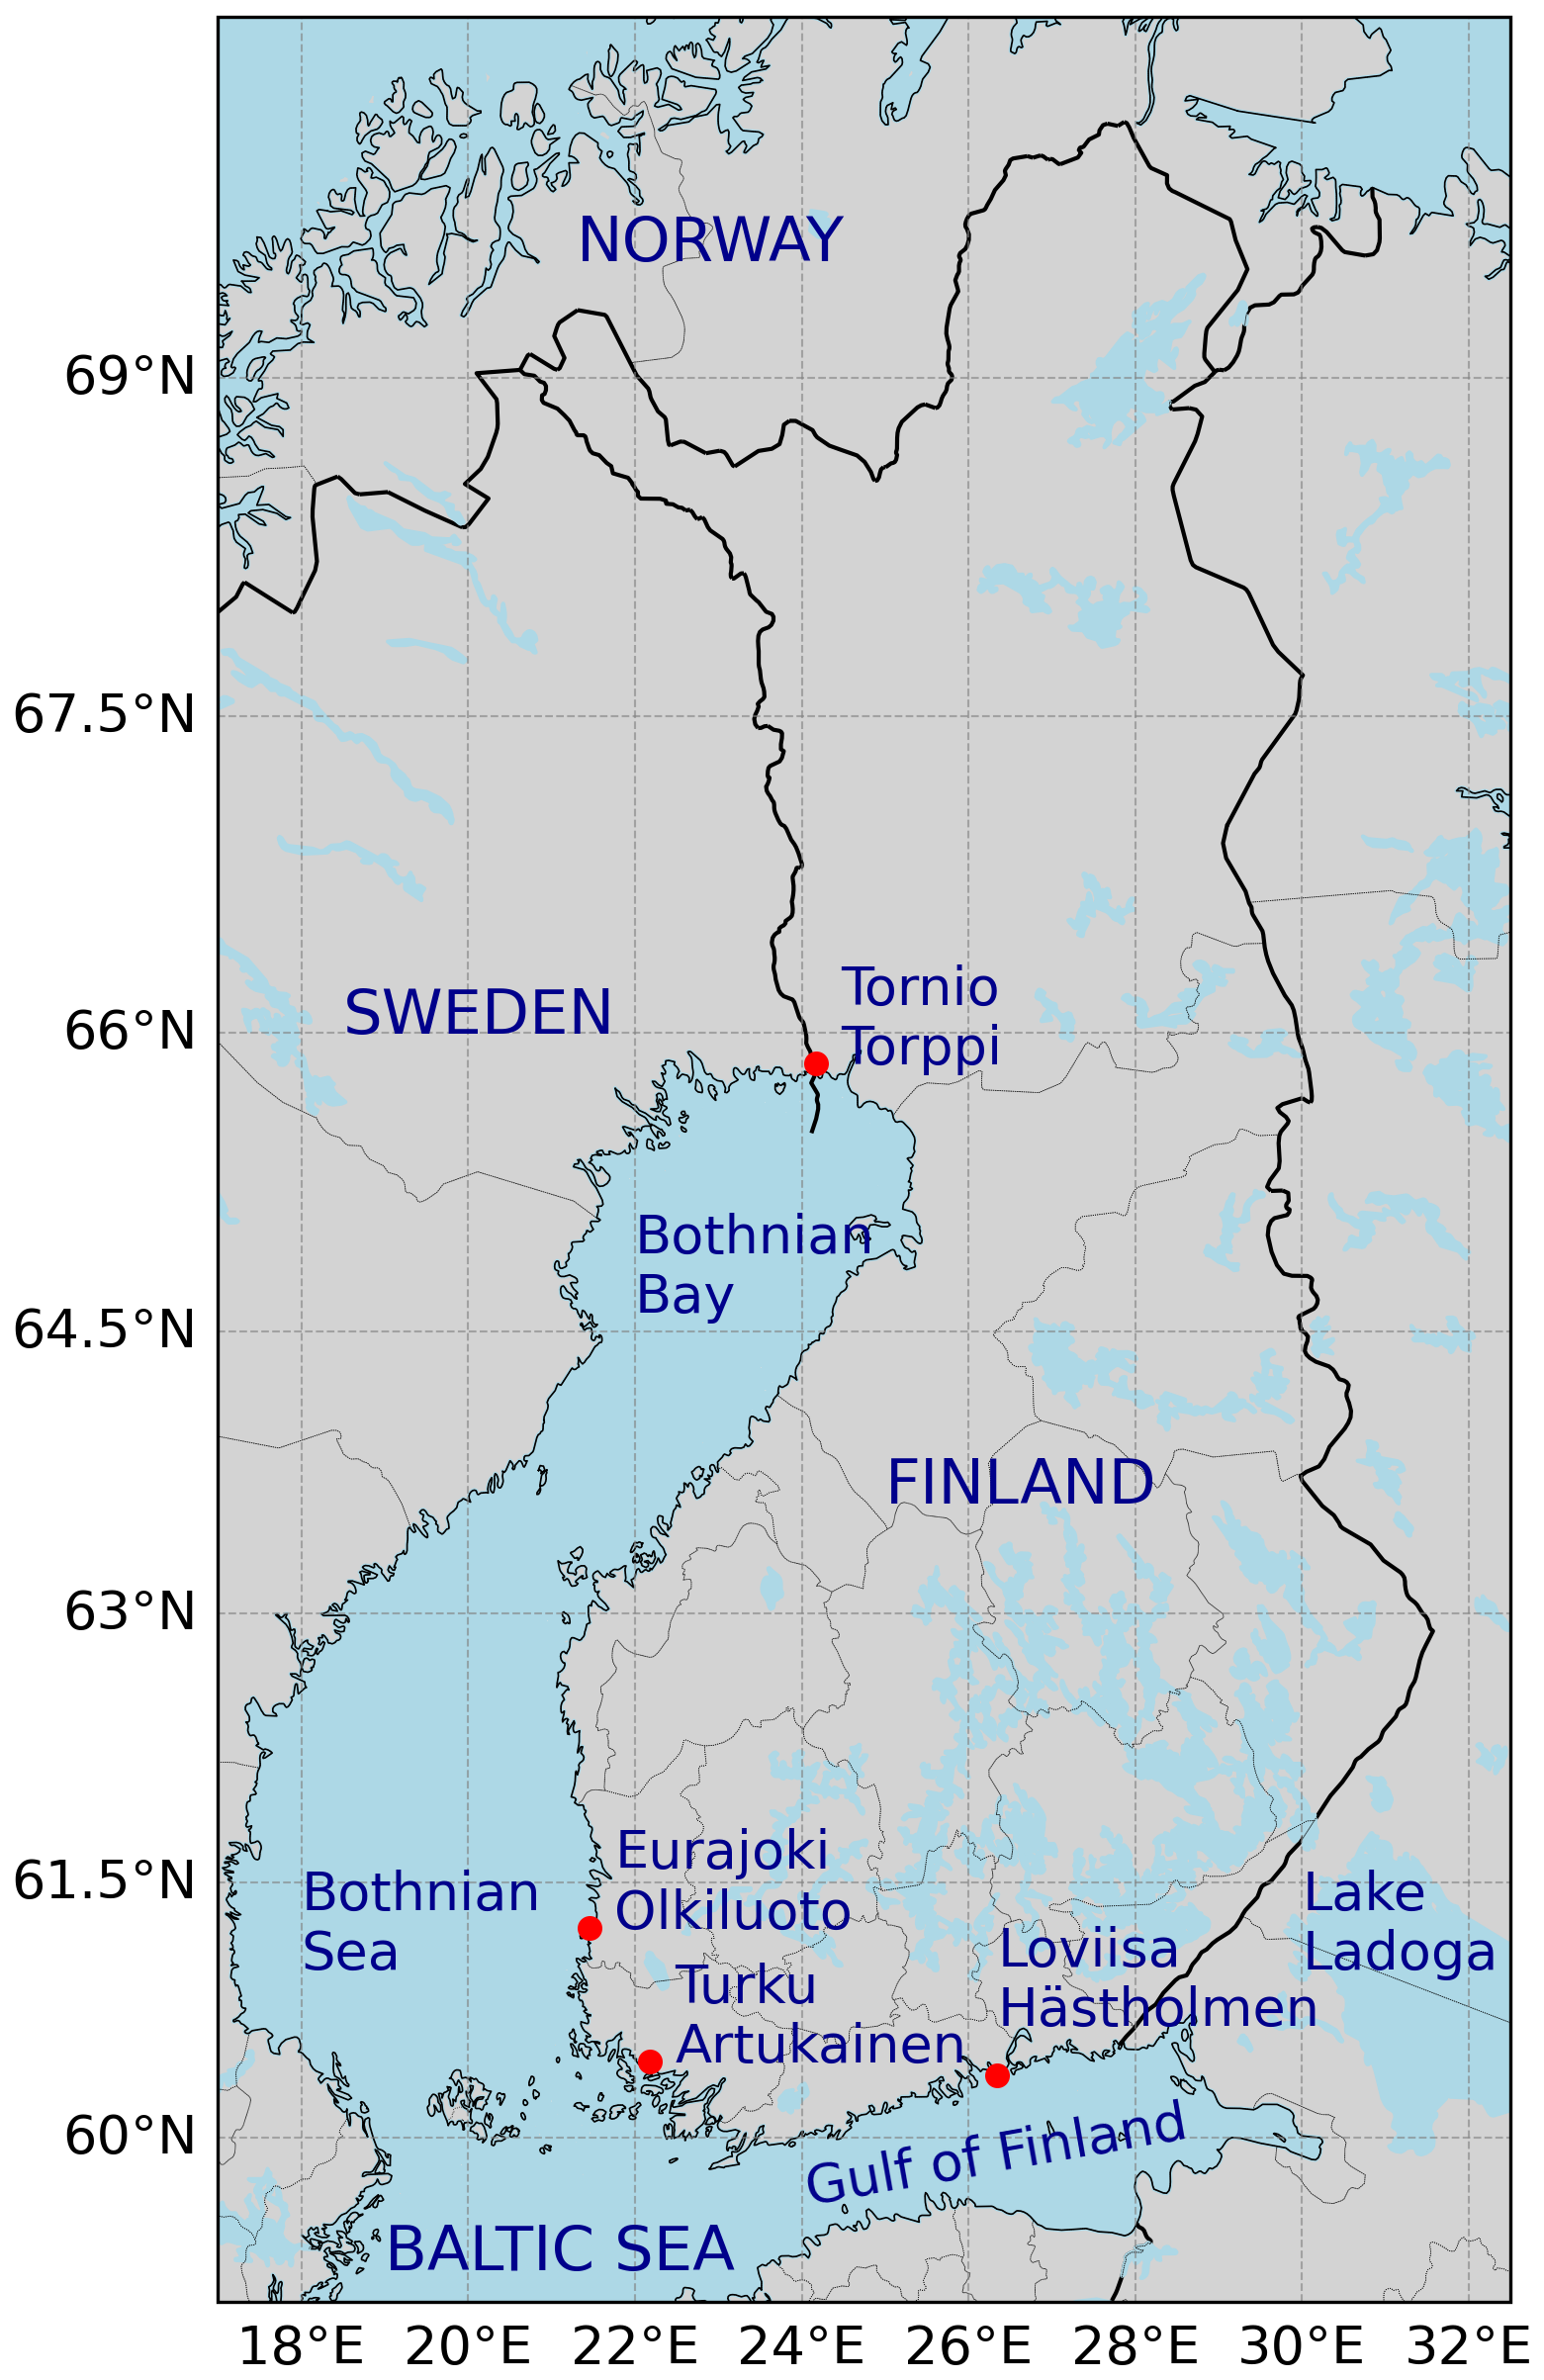
Figure 1Map of Finland. The four study locations; Tornio Torppi, Eurajoki Olkiluoto, Turku Artukainen and Loviisa Hästholmen, are marked with red dots.
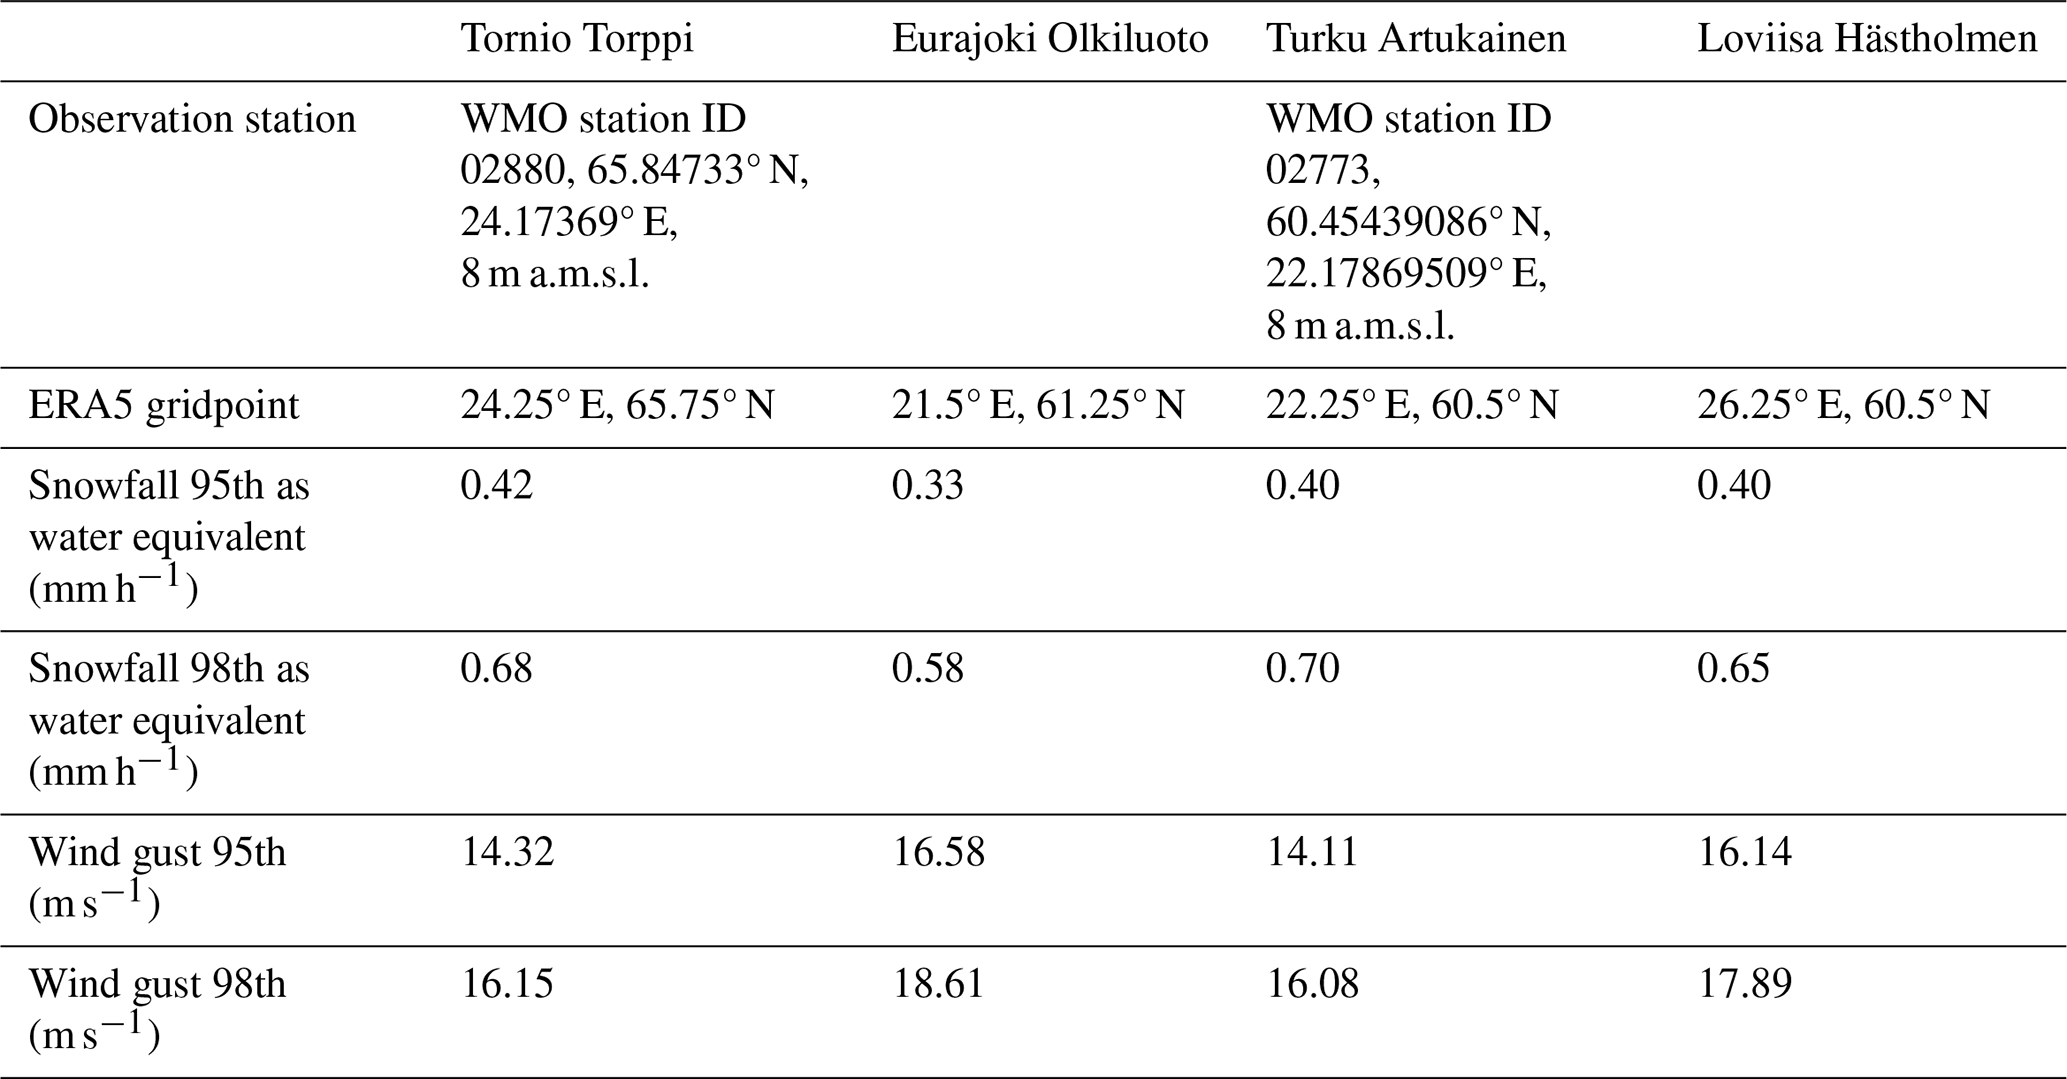
Table 1Thresholds for extreme values for hourly snowfall (mm h−1) and wind gust (m s−1) in study locations for October–March 1960–2024 based on ERA5. The 95th and 98th percentiles of hourly values were used as thresholds for compound events.
2.2 Reanalysis
This research seeks to advance the understanding of compound extreme events involving snowfall and wind gusts through analysing ERA5 hourly data for 65 years. ERA5 is the fifth generation ECMWF (European Centre for Medium Range Weather Forecasts) atmospheric reanalysis of the global climate and is openly available online in the Climate Data Store (Hersbach et al., 2023). ERA5 is a globally complete and consistent dataset which covers the Earth on a 30 km (0.25° × 0.25°) grid spacing with 137 vertical model levels up to a height of 80 km. ERA5 covers the period from January 1940 to the present with a time lag of approximately one week. ERA5 provides hourly estimates of many atmospheric climate variables.
In this study, the hourly maximum of instantaneous wind gust data at 10 m level and accumulated snowfall at hourly time steps during the period of 1960–2024 were used. Our research domain covers Finland and northern Baltic Sea from 55 to 70° N and 17 to 32° E. High percentiles of the variables were used as threshold values to investigate the frequency and intensity of compound events.
2.3 Observations
For making a short comparison between two observation stations and corresponding ERA5 grid points, it was essential to have co-located observations of precipitation type, precipitation amount, and wind gust speed. In 2025, Finnish meteorological institute operates 175 automatic weather stations, which carry out a variety of meteorological observations. Precipitation gauges were installed at 118 weather stations, an anemometer at 132 stations, and a present weather sensor, which detects precipitation type, at 79 stations. Only 51 out of 175 weather stations have all three sensors.
Automated weather stations report their instantaneous observations every 10 min. In addition, they produce various hourly values (e.g. means, maxima and sums) of the observed variables. The observations used here are the hourly precipitation accumulation (mm h−1), the hourly maximum wind gust speed (3 s average of the speed in m s−1), and the hourly most significant weather phenomenon (present weather codes).
For the comparison of ERA5 and observations, we use a 10 year period from 2014 to 2023. The weather stations Tornio Torppi and Turku Artukainen (Table 1), located near the coasts, were chosen as the weather stations to be compared against ERA5 because these stations had adequately long time series (10 years) of the three necessary quantities and the observations of the stations, especially precipitation observations, have been found to be climatologically representative. The wind measurements are taken at a 13 m height in Tornio Torppi and at a 23 m height in Turku Artukainen.
2.4 Methods
In meteorological studies, percentiles are commonly used to define extreme weather conditions (Rutgersson et al., 2022). Here, the 95th and 98th percentiles were employed as thresholds to identify extreme values and to test the suitability of the high percentiles in a compound event study. High percentiles used as threshold values for hourly snowfall and wind gusts are summarized in Table 1. The use of location-specific percentile thresholds (e.g., 95th and 98th percentiles) allows for the characterization of extreme events relative to the local climatological distribution. Since climatic conditions such as snowfall and wind gusts vary significantly across different geographic regions, applying a uniform threshold would not adequately capture what constitutes an “extreme” event at each site. By employing percentiles derived from historical data at each grid point, the approach ensures that the detection of extremes is normalized to the local variability and mean state. The individual thresholds are not intended to identify isolated extremes; they are used to identify rare joint occurrences.
The definition of a compound event is inherently impact-dependent. Different temporal definitions may be appropriate for different sectors, whereas the simultaneous occurrence of extreme wind and snowfall is particularly relevant for assessing risks associated with snow drifting, reduced visibility, infrastructure operation, and transportation.
Using hourly meteorological data from cold season months (October to March) during 1960–2024, the frequency, duration, and intensity of concurrent extreme snowfall and wind gust events were assessed. Events were considered “compound” when both snowfall and wind gust (SWG) parameters exceeded their percentile thresholds (Table 1) simultaneously within the same hour and grid point. From here on, when hourly snowfall and wind gust exceed their 95th percentiles, the compound is called SWG95, and correspondingly for 98th percentile SWG98. A compound event can last one or several consecutive hours. SWG95 represents high-impact but relatively more frequent compound events that are likely relevant for operational preparedness and infrastructure management. SWG98 isolates the most severe compound events from the SWG95 group and allows assessment of whether conclusions remain valid when attention is restricted to the upper tail.
In addition to the percentile-based thresholds, absolute metrics were used to showcase the most extreme events with comparable values between the four study sites. Extreme compound events were assessed more closely using thresholds of (i) 1 mm h−1 for moderate and 2.5 mm h−1 for heavy snowfall rate; (ii) 20 mm per event for large snowfall accumulation; (iii) 20 and 25 m s−1 for strong and extreme wind gusts, respectively, and (iv) blizzard conditions (extreme blizzard conditions) where maximum wind gust exceeds 17 m s−1 (or 20 m s−1) and snowfall accumulation is larger than 10 mm per event (or 20 mm per event).
In addition to the intensity of compound events, their persistence is of practical importance. For critical infrastructure such as nuclear power plants, prolonged periods of simultaneously strong winds and snowfall may present greater operational challenges than short-lived exceedances because in the adverse conditions are sustained over many hours. Therefore, compound events lasting at least 12 consecutive hours are assessed to illustrate the characteristics of persistent events.
Because only compound events were of interest in this study, this analysis does not take into account if e.g. the snowfall has continued longer than the compound event. Thus, the total snow accumulation might have been larger during the course of the day(s) when compound event occurred. In all the tables extreme values exceeding the 2.5 mm h−1 for heavy snowfall rate, 20 mm per event for large snowfall accumulation and 25 m s−1 for extreme wind gusts are bolded.
3.1 Comparison between station observations and ERA5
For validation purposes, ERA5 hourly wind gust and snowfall are compared to weather station observations in Turku Artukainen and Tornio Torppi for the period of 2014–2023 during the cold season (October to March). The comparison was restricted to concurrent ERA5 and station observations during hours when snowfall was recorded at the observation station.
The distributions of wind gusts (Fig. 2a, b) show that overall, the wind gust distribution is shifted more to right in ERA5 than in the observations. The 95th and 98th percentiles are somewhat higher in ERA5 than the observed values in both Turku and Tornio (ERA5 minus observed wind gust difference ranges from 2.1 to 3.1 m s−1). This finding contrasts with results from coastal stations in Finland, where ERA5 tends to underestimate high wind gusts (Laurila et al., 2025a). It is important to note that this comparison focuses exclusively on cold season data and time steps with observed snowfall, whereas Laurila et al. (2025a) include all hourly observations throughout the year. Their findings indicate that the ERA5 bias is more pronounced during summer months and the lower wind gust values (below 10 m s−1) are overestimated by ERA5. Moreover, the underestimation is the largest with much higher wind gusts (over 25 m s−1) than for wind gusts between 15 and 20 m s−1 (Laurila et al., 2025a) which is the category for the 95th and 98th percentile values in this study. The reasons for the higher wind gust percentiles in ERA5 are not entirely clear, however, a likely contributing factor is the coastal location of the stations and the associated land-sea contrasts within ERA5. Local effects related to station exposure may also contribute to the differences, as both stations have nearby trees and buildings affecting the surrounding roughness.

Figure 2The frequency distributions of (a, b) hourly wind gust and (c, d) hourly snowfall in ERA5 (grey bars) and observations (purple bars) in (a, c) Turku Artukainen and (b, d) Tornio Torppi from October to March in 2014–2023. Only time steps with snowfall are selected also for the wind gust. The vertical lines are percentiles: the dashed lines show the 95th percentiles and the solid line the 98th percentiles.
The distributions of snowfall (Fig. 2c, d) show similar shapes with a long right tail and a peak in small snowfall amounts. Notably, the 95th and 98th percentiles of snowfall are smaller in ERA5 compared to observations at both Turku Artukainen and Tornio Torppi. This discrepancy arises from the measurement accuracy of observations, which is limited to 0.1 mm h−1, while ERA5 treats snowfall amounts as a continuous variable. Additionally, observational data represents point measurements, whereas ERA5 provides a mean over grid point areas, smoothing out extreme values.
Due to the classification of observed data in 0.1 mm h−1 increments, only values above this threshold are recorded, potentially underrepresenting lighter snowfall events. In contrast, the continuous nature of the ERA5 data allows for the inclusion of values closer to zero, leading to lower upper percentile estimates. Consequently, while ERA5 captures a more comprehensive range of snowfall intensities, the observational data results in higher percentile values, which skews the interpretation of snowfall severity in this comparison.
There are inherent differences between in-situ weather observations and grid-based reanalysis datasets. Weather stations observations are point measurements that represent conditions at a specific location and are influenced by local factors such as vegetation, topography and nearby buildings. In contrast ERA5 represents average conditions over a grid cell of 30 km and therefore the small-scale and local extremes are smoothed. In addition, ERA5 winds are given at a 10 m height, while the wind measurements in weather stations are made at various heights. Therefore, one can expect to see differences between weather station observations and ERA5, instead of direct one-to-one agreement.
Overall, ERA5 effectively captures the main characteristics of wind gust and snowfall distributions during cold-season snowfall events, although differences are present in the highest percentiles. These results indicate that ERA5 provides a reliable and consistent representation of the conditions relevant to this study and can be used for the subsequent analyses.
3.2 Co-occurrence of high wind gusts and heavy snowfall
High percentiles were used to detect extreme compound events for different regions. Although the extremeness of the events was defined for each grid point separately, the number of compound events exhibits coherent spatial patterns. Maps presenting the proportion of total winter hours with co-occurring extreme snowfall and wind gusts reveal that hot spots for these extreme SWG compound events differ slightly depending on whether lower or higher percentiles are used as the threshold value (Fig. 3).
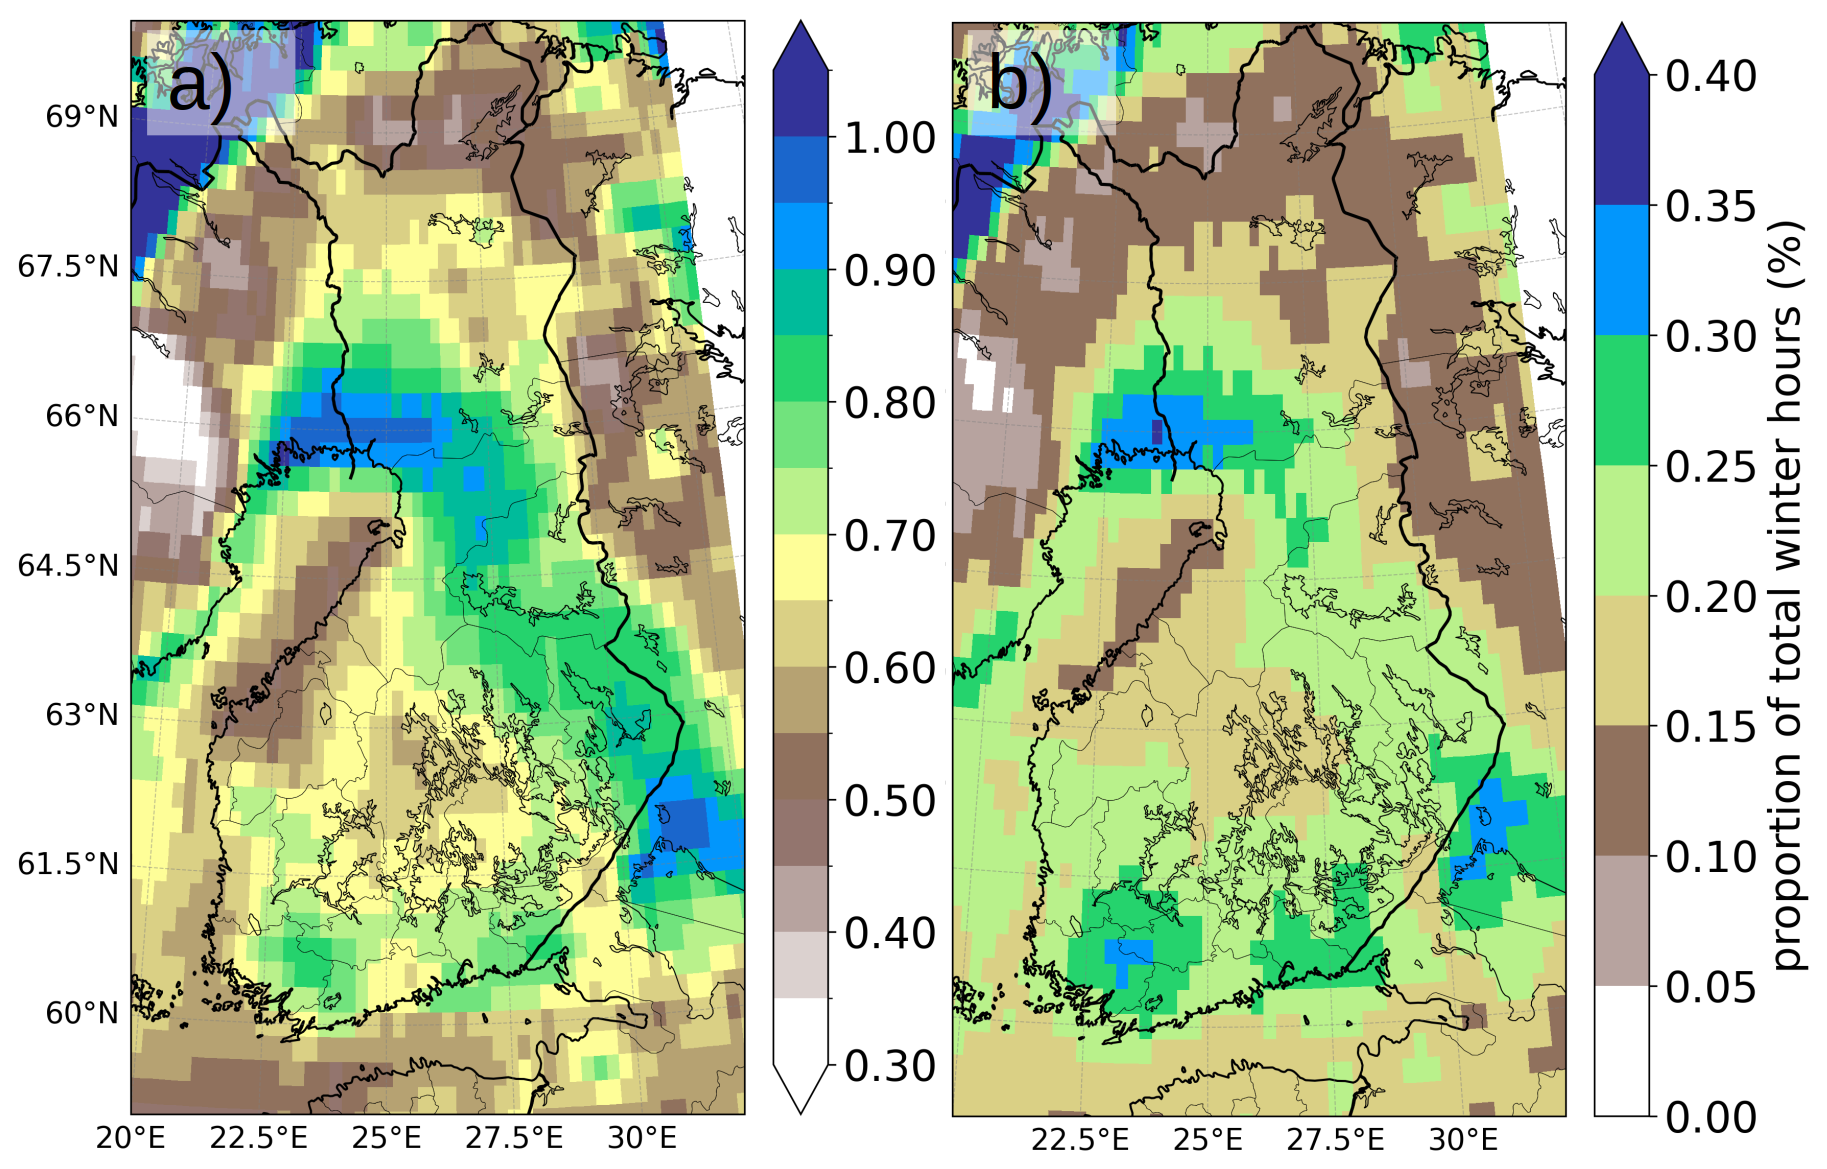
Figure 3Proportion of total winter hours when co-occurring hourly snowfall and wind gust (SWG) exceeded their 95th (a) and 98th (b) percentiles from October to March in 1960–2024 based on ERA5. Note the different scaling in colorbars.
When the 95th percentile was used as the threshold value for compound events, the largest number of hours were detected in a zone extending from the shores of the Bothnian Bay towards Lake Ladoga (Fig. 3a). With 98th percentile as threshold, the largest number of compound events are located along south facing shores of the Baltic Sea and Lake Ladoga (Fig. 3b). In contrast, the smallest amounts of compound events with both thresholds were detected in northern Finland and surrounding areas as well as in the northwest facing shore of the Bothnian Bay. The study locations, Tornio Torppi and Turku Artukainen (Fig. 1), are situated within these regions of high event frequency (Fig. 3).
The annual number of compound event days varied significantly from year to year in the study locations, ranging from zero to 12 d yr−1 (Fig. 4) with SWG98, and up to 19 d yr−1 with SWG95 (Fig. A1). There is no statistically significant increase or decrease in the annual SWG95 nor SWG98 days over time due to large year-to-year variations.
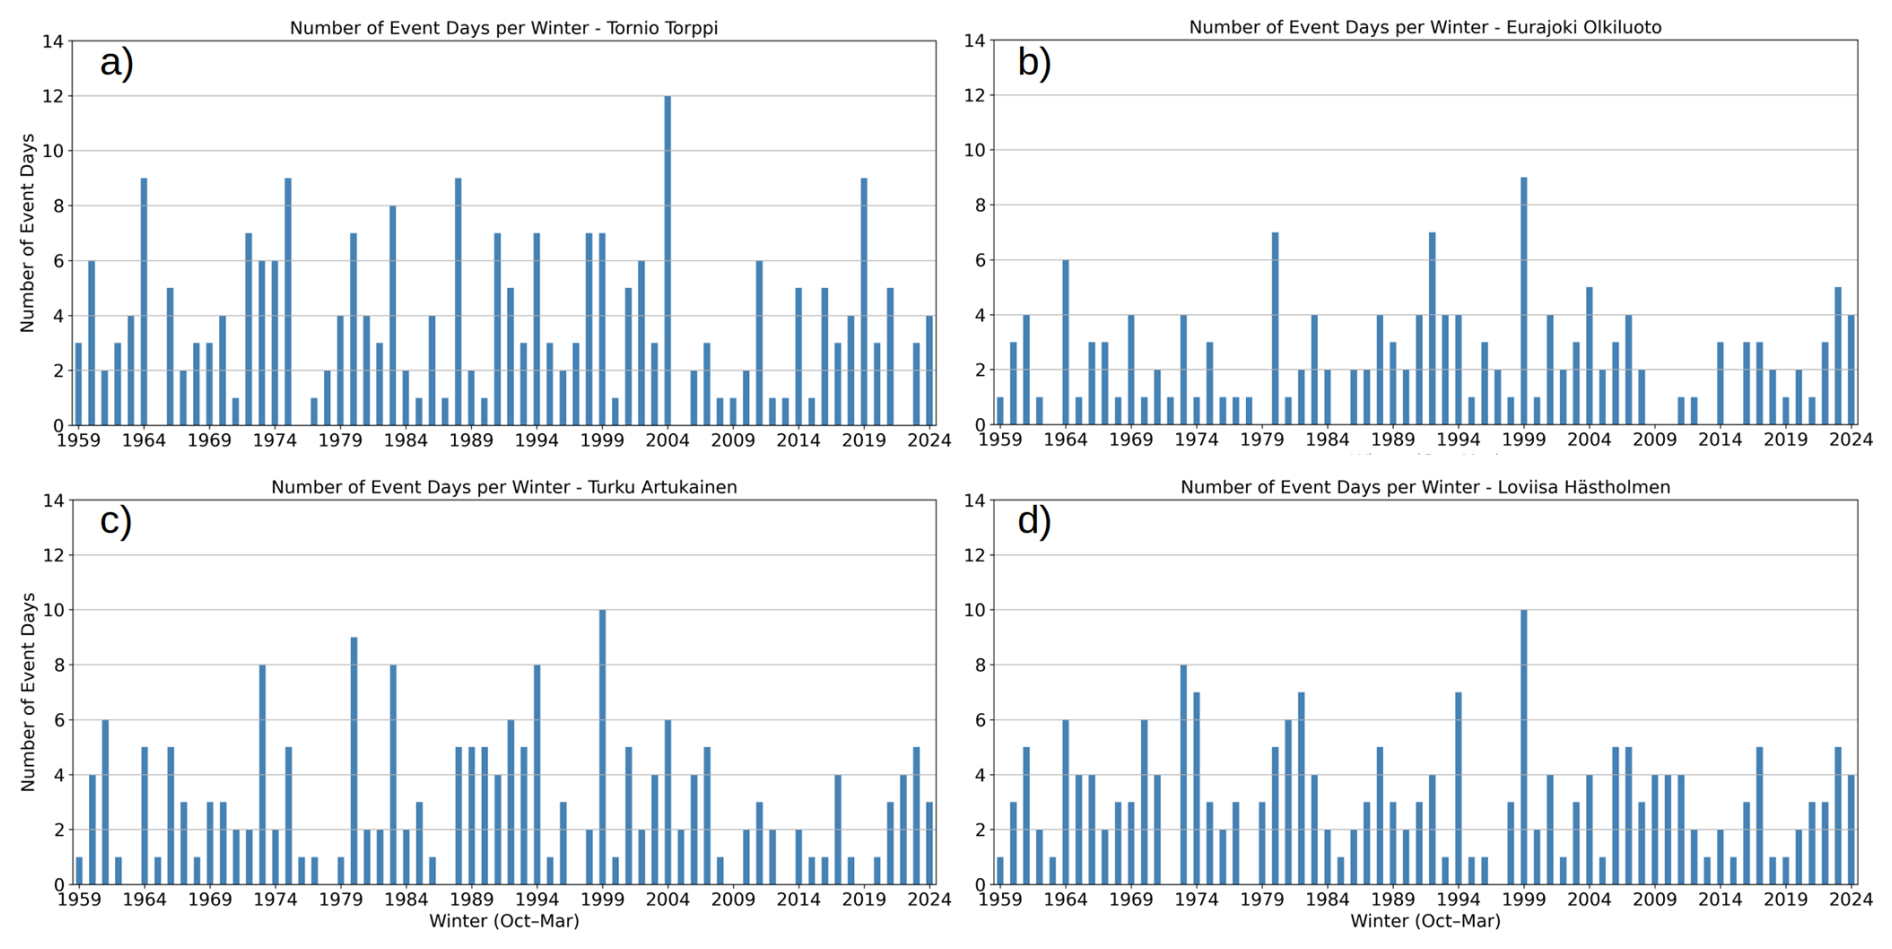
Figure 4The annual number of days when wind gusts and snowfall exceeded their 98th percentile (SWG98) in Tornio Torppi (a), Eurajoki Olkiluoto (b), Turku Artukainen (c) and Loviisa Hästholmen (d) for each year from 1960 to 2024 based on ERA5 data. The annual number of events is calculated from October to March except for the first and last year of the data set when only January–March is calculated as year 1959 and October–December as year 2024 to cover the whole study period.
When considering the SWG events (i.e. events with consecutive hours), one can see that the mean annual number of SWG events is similar between the four study locations, varying between 6–9 events for SWG95 and 2–4 for SWG98 (Table 2). The highest annual mean SWG95 event number was found in Tornio Torppi (9.1 events yr−1, Table 2). The slightly higher event number in Loviisa Hästholmen (8 events yr−1, Table 2) compared to Turku Artukainen (7.5 events yr−1) suggests that there is a larger number of shorter events in Loviisa Hästholmen, because the total amount of hours was larger in Turku Artukainen than in Loviisa Hästholmen (Fig. 5).
Table 2The number of events of co-occurring wind gust and snowfall (SWG) exceeding their 95th and 98th percentiles in study areas in October–March 1960–2024, based on ERA5 data.
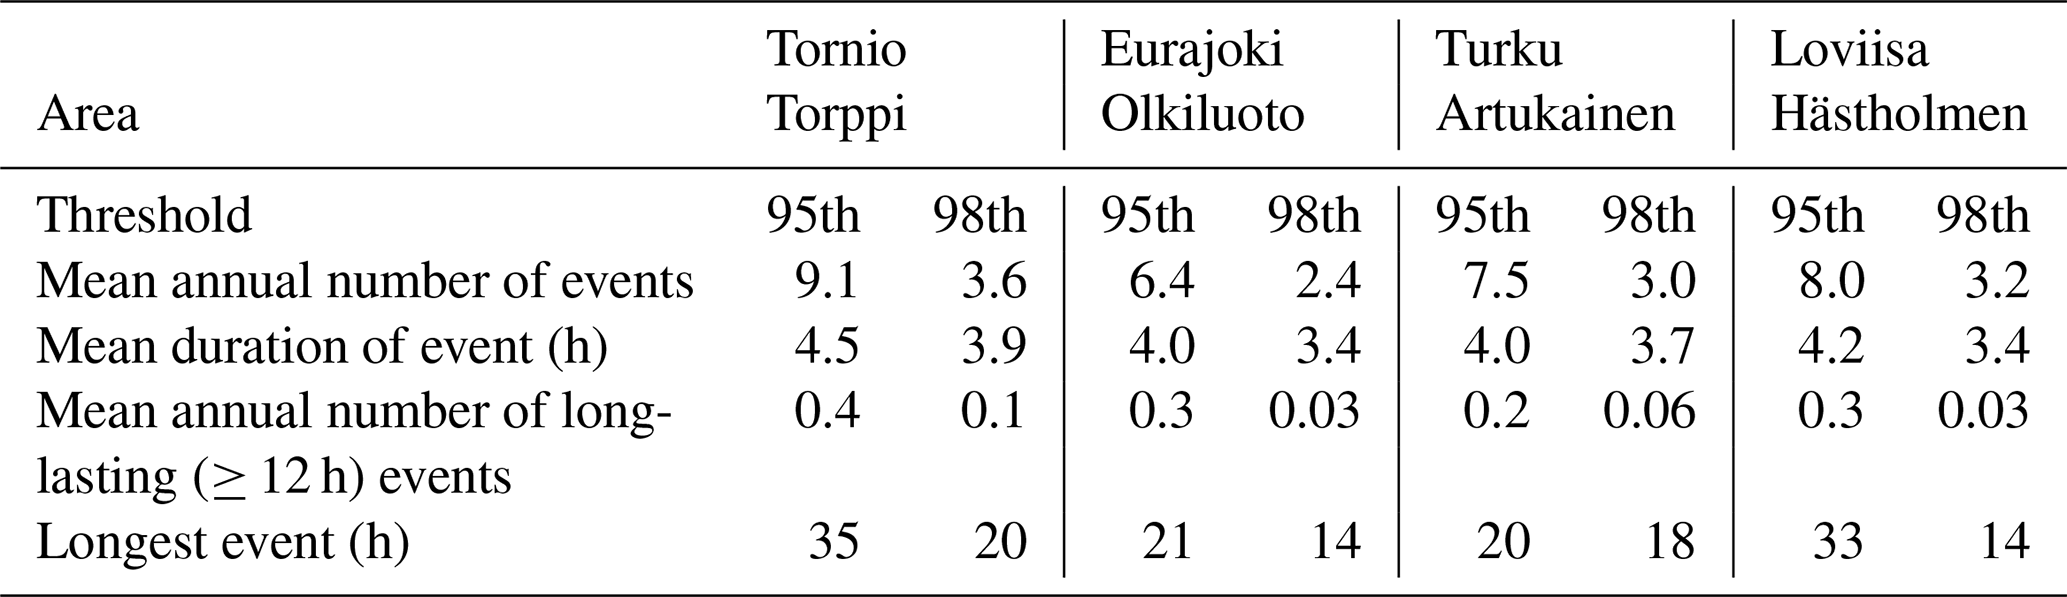
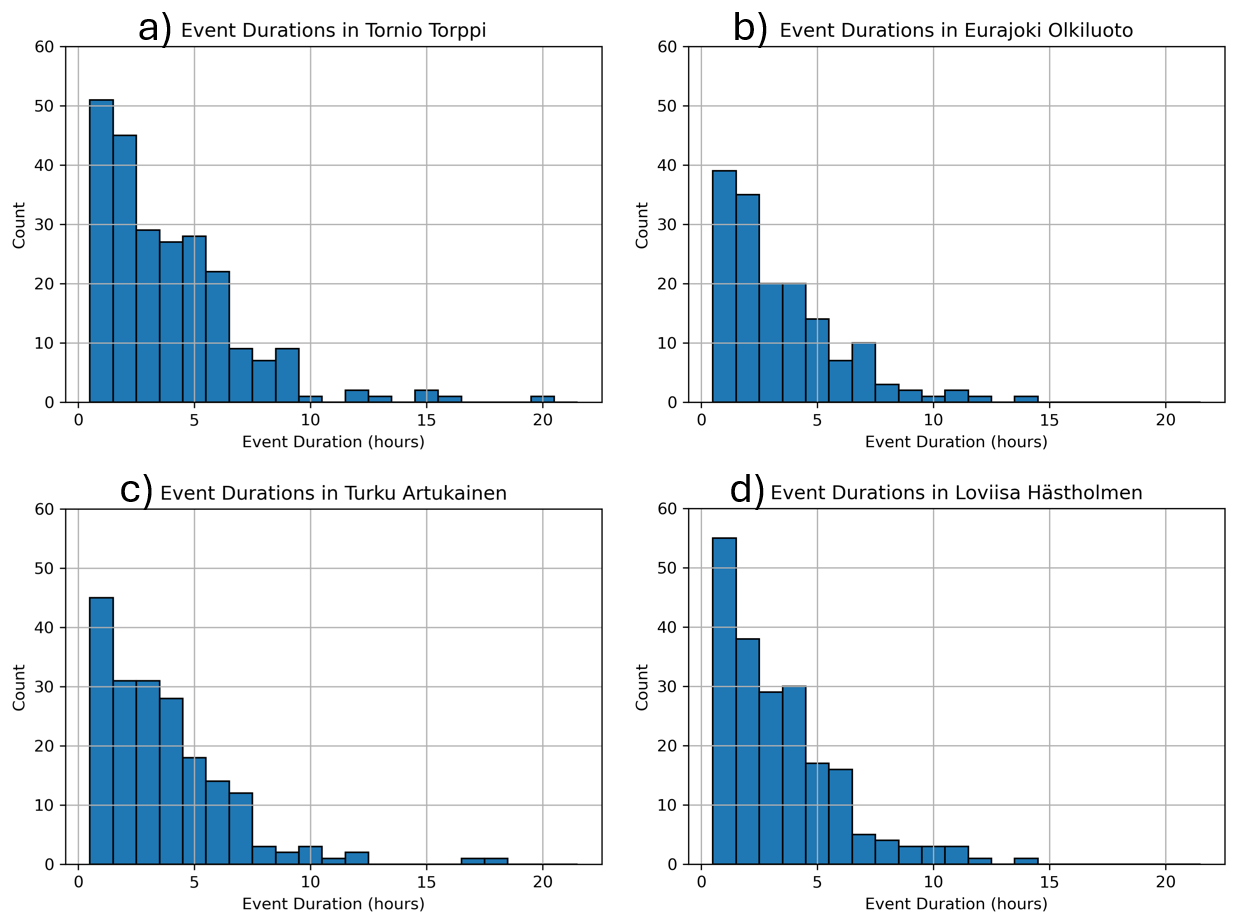
Figure 5Histograms of compound event's durations in Tornio, Torppi (a), Eurajoki Olkiluoto (b), Turku Artukainen (c) and Loviisa Hästholmen (d) for the threshold value of 98th percentile. Histograms show the number of consecutive hours when snowfall and wind gust exceeded their threshold value simultaneously during October–March 1960–2024 based on ERA5.
3.3 Duration of SWG events
The duration of compound events is an important quantity because the longer the extreme conditions persist, the greater the potential risk for infrastructures is. Thus, consecutive hours of wind gusts and snowfall were investigated. In this section, only the four study locations are elaborated.
The duration of compound events varied from 1 up to 35 h (Table 2, Fig. 5). Compound events were mainly short-lived as the mean duration varied between 3.4 and 4.5 h (Table 2). The choice of threshold had a modest effect on the mean duration of the classified compound events, with SWG95 events lasting 4.0–4.5 h on average, compared with 3.4–3.9 h for SWG98 events. The shorter duration of SWG98 events is a consequence of the stricter thresholds, which capture only the most extreme portions of the underlying meteorological events. In contrast, the lower SWG95 thresholds encompass a longer period of the same events, resulting in longer classified durations. Regardless of the selected threshold value, short-lived (<5 h) compound events dominated, 1 h events being the most common (Figs. 5, A2).
As expected, SWG95 events generally lasted longer than their SWG98 counterparts, reflecting the shorter persistence of simultaneous exceedance at the higher threshold (Table 2, Figs. 5, A2). Because the longer lasting compound events are of more interest to end users, such as NPP companies, the duration of over 12 h was selected as a threshold for a long-lasting (LL) event. These LL events were not detected annually or even every second year. The annual mean number of the LL events exceeding SWG95 conditions in 1960–2024 was 0.4 in Tornio Torppi, 0.3 in Eurajoki Olkiluoto and Loviisa Hästholmen and 0.2 in Turku Artukainen. When the 98th percentile was used as a threshold, the annual mean number of LL compound events were distinctly smaller, accounting for only 0.1 events in Tornio Torppi, 0.06 in Turku Artukainen and 0.03 in Eurajoki Olkiluoto and Loviisa Hästholmen. No statistically significant long-term change in event duration was found.
The maximum duration of SWG95 events in the study locations varied between 20 h in Turku Artukainen to 35 h in Tornio Torppi (Table 2). The extremely long SGW95 event in Tornio Torppi (35 h) was one single peak event, whereas Loviisa Hästholmen has faced two over 30 h long SWG95 events (33 and 31 h, Fig. A2, Table A1). When the 98th percentile was used as a threshold value, the maximum event duration varied between 14 h in Eurajoki Olkiluoto and Loviisa Hästholmen to 20 h in Tornio Torppi (Tables 2 and 3).
Table 3The five longest lasting SWG compound events in each study location when the 98th percentile were used as a threshold value for hourly snowfall and wind gust from October to March in 1960–2024 based on ERA5. In addition, statistics for mean and maximum snowfall and wind gust values are given for each event. Extreme values exceeding the 2.5 mm h−1 for heavy snowfall rate, 20 mm per event for large snowfall accumulation and 25 m s−1 for extreme wind gusts are bolded.
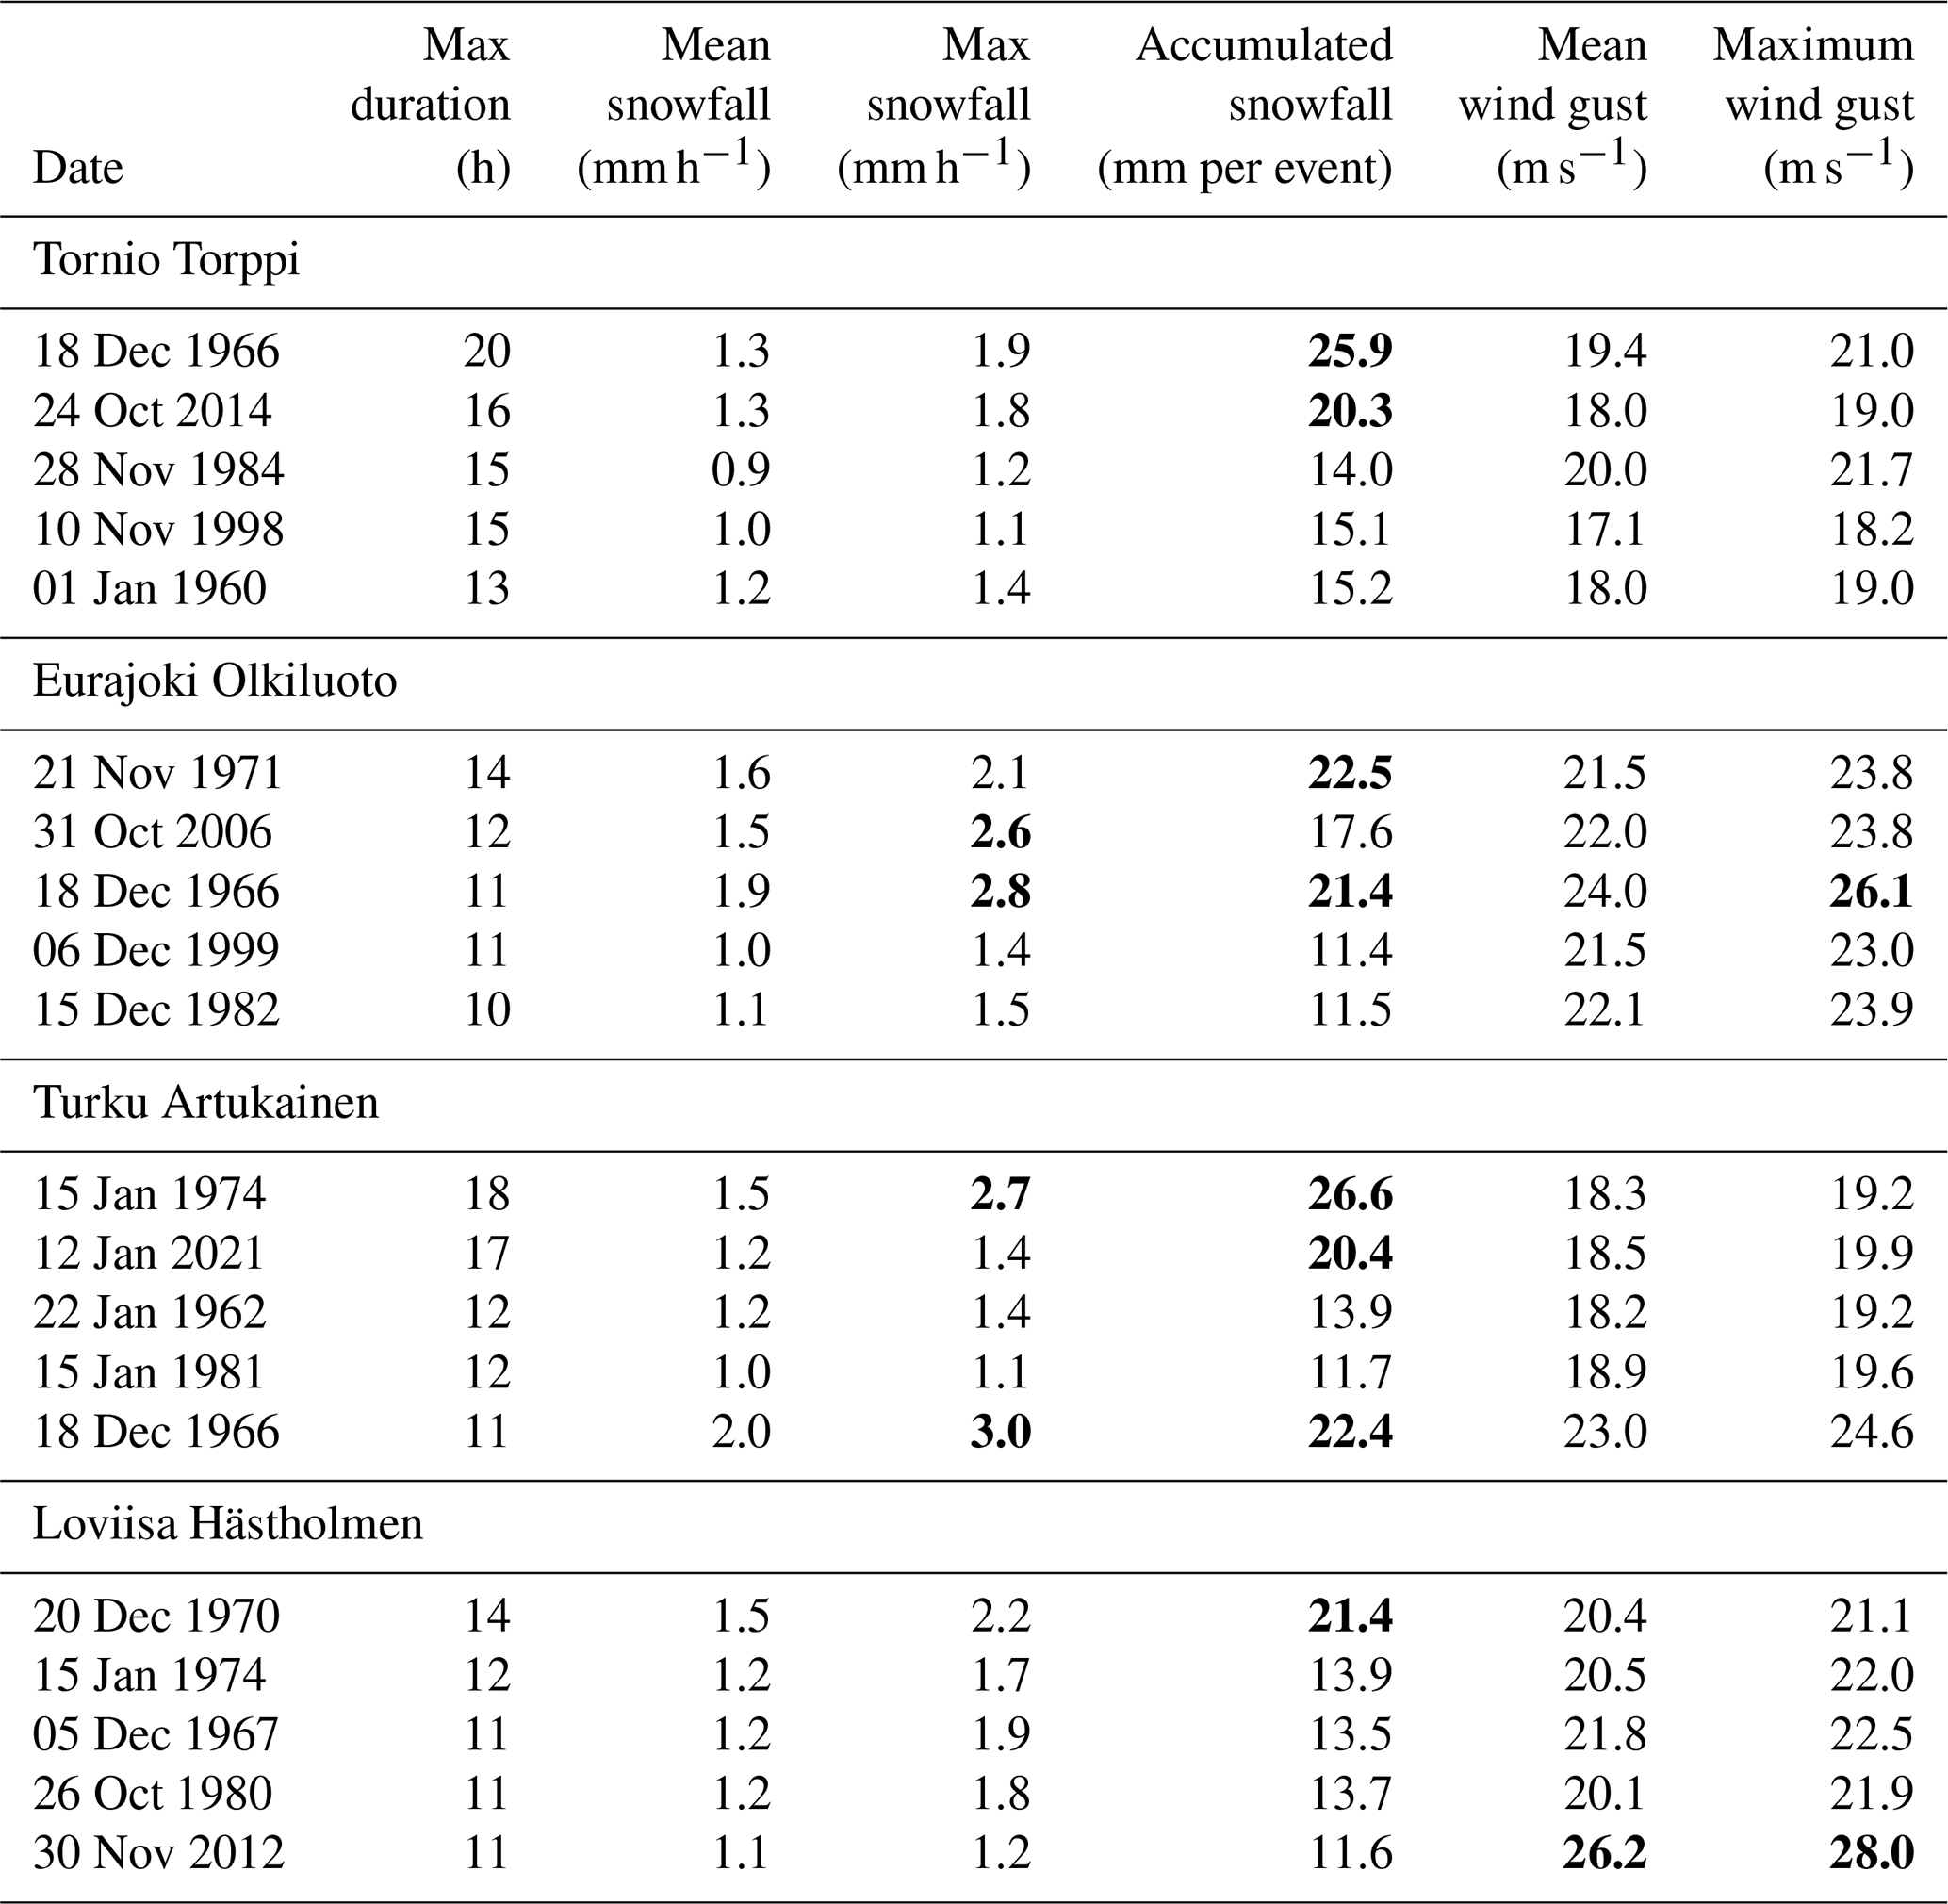
All the longest lasting events presented in Table 3 fulfill the blizzard definition (wind gust > 17 m s−1, accumulated snowfall >10 mm per event). One of the most extreme events occurred simultaneously in Tornio Torppi, Eurajoki Olkiluoto and Turku Artukainen on 18 December 1966 (Table 3). This event was so intense that the SWG98 conditions were exceeded for up to 20 h with mean hourly snowfall rate of 2 mm h−1 and the maximum snowfall rate of 3 mm h−1 with wind gust reaching 26 m s−1. Almost 26 mm of snowfall was accumulated during the SWG98 conditions in the study locations.
3.4 Intensity of SWG events
Mean values for hourly snowfall and wind gust during the detected SWG95 and SWG98 compound events in 1960–2024 are presented in Fig. 6. On average, the hourly mean snowfall as well as wind gusts are higher with events fulfilling the stricter SWG98 conditions than with loser SWG95 conditions as detailed below. On average, the highest wind gust values during compound events occur over the Bothnian Sea (Fig. 6c and d), while the largest snowfall values are concentrated over the southern coast of Finland (and east coast of Sweden, Fig. 6a and b). This indicates that the western coast of Finland could be more affected by strong wind gusts and the southern coast by heavy snowfall during the SWG compound events.

Figure 6Average hourly snowfall (a, b) and wind gust (c, d) during SWG events when the 95th (a, c) and 98th (b, d) percentile was used as a threshold value from October to March in 1960–2024 based on ERA5.
In the south facing coastal areas the mean hourly snowfall is 0.8–1.0 mm h−1 with SGW95 and 1.1–1.3 mm h−1 with SWG98 (Fig. 6). Over the Bothnian Sea, the mean wind gusts are 20–24 m s−1 with SWG95 and 21–26 m s−1 with SWG98. The difference between SWG95 and SWG98 originates from the threshold values which are approximately 0.2 mm h−1 higher regarding the snowfall and 2 m s−1 higher regarding the wind gusts when using the 98th percentile as threshold compared to 95th percentile (Table 1). What is notable is that even with SWG95 the mean snowfall amount is larger in south facing coastal areas than in the region from Bothnian Bay to Lake Ladoga (Fig. 6a) where most of the events were found (Fig. 3a). Thus, the hourly snowfall related to compound events is typically larger in coastal regions than inland. In addition, the mean values are higher during the SWG events (Fig. 6) compared to the mean values during single extreme events (only snowfall or wind gust exceeding their percentile thresholds, Fig. A3).
The annual mean and maximum hourly snowfall amount during compound event days (SWG95 and SWG98) exhibited substantial interannual variability across the study sites. Analysis of hourly maximum snowfall intensities (mm h−1) during these compound events showed no statistically significant long-term trends in the annual maxima at any of the four locations. When examining the number of all snowfall events (regardless of wind gust value), statistically significant (p<0.05) decrease in events with at least 10 mm of accumulated snowfall was found across most coastal areas (0.1–0.4 events per decade, not shown), while northwestern Lapland showed an increase (0.2–0.4 events per decade, not shown). However, the number of events exceeding SWG95 and SWG98 conditions that produced at least 10 mm of snowfall showed no change. This indicates that although substantial snowfall events have become less frequent in southwestern Finland, the frequency of snowstorms accumulating substantial snowfall has not shown corresponding decline.
To complement the percentile-based approach, extreme compound events were also defined using fixed thresholds. Table 4 summarizes the mean decadal number of extreme events with different thresholds elaborated in the Introduction and Sect. 2.4, in the four study locations for the compound events fulfilling the SWG95 and SWG98 definitions. The severity of a compound event was first investigated based on the maximum hourly snowfall amount and accumulated snowfall during the compound events. Compound events exceeding the 1 mm h−1 hourly snowfall threshold, representing moderate snowfall associated with reduced visibility and poor driving conditions, occurred relatively frequently, with 19–34 events per decade across the four study locations (Table 4).
Table 4The mean decadal frequency of SWG compound events with the 95th (and the 98th in parentheses) threshold(s) in four study locations along the coastline from northwest to southeast; Tornio, Eurajoki, Turku and Loviisa, during October–March in 1960–2024 based on ERA5. The table includes the mean decadal frequency of compound events with maximum hourly snowfall exceeding 1 mm h−1 (1st row), compound events exceeding snowfall of 2.5 mm h−1 (2nd row) as well as 20 mm per event (3rd row), compound events with maximum wind gusts exceeding 20 m s−1 (4th row) and 25 m s−1 (5th row), compound events exceeding maximum wind gust ≥ 20 m s−1 and maximum snowfall 2,5 mm h−1 (6th row), compound events with blizzard conditions (maximum wind gust ≥ 17 m s−1, snow accumulation ≥ 10 mm per event, 7th row) as well as with stricter conditions (maximum wind gust ≥ 20 m s−1, snow accumulation ≥ 20 mm per event, 8th row) are presented.
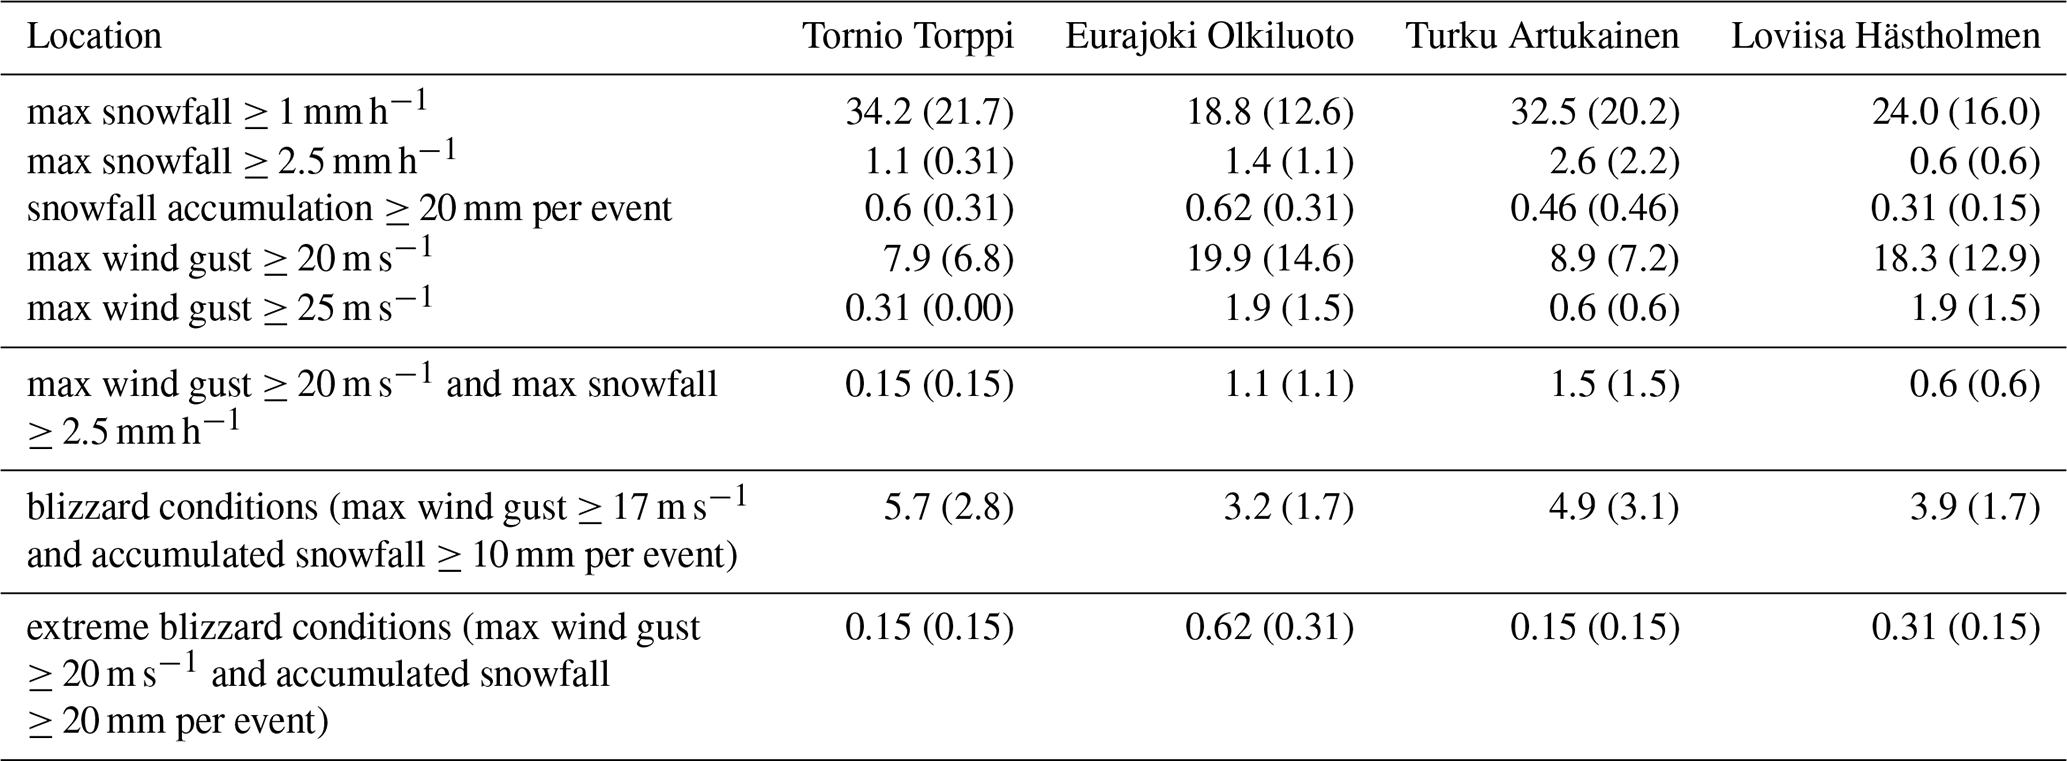
SWG95 events influenced by heavy snowfall rates of over 2.5 mm h−1 were rare, with 1–3 events per decade. When the stricter SWG98 threshold was applied, the frequency decreased to fewer than one event per decade (Table 4). The largest number of events with heavy snowfall rate was found in Turku Artukainen. SWG events with large snowfall accumulations (>20 mm per event) were even rarer in all four study locations (Table 4). On average, the SWG events with heavy snowfall rate (>2.5 mm h−1) lasted slightly longer than the mean duration of all events. The duration of these extreme events varied from 5 h in Tornio Torppi, 7 h in Turku Artukainen and Loviisa Hästholmen, to 8 h in Eurajoki Olkiluoto (not shown). No notable differences in event duration were found between SWG95 and SWG98. On average, these high-snowfall-rate events produced 9–14 mm of snowfall. The duration of these extreme events was long enough to accumulate more than 20 mm of snowfall only at Eurajoki Olkiluoto (during 3 SWG events) and at Turku Artukainen (during 2 SWG events).
SWG95 (SWG98) events with maximum wind gusts exceeding the first warning level of 20 m s−1 were relatively common compared with events with extreme snowfall amounts, with a mean decadal frequency of 8–20 (7–15) events across the study locations. In contrast, SWG95 (SWG98) events with maximum wind gust exceeding 25 m s−1 were relatively rare, with mean decadal frequencies of 0.3–2 (0–2) events. The largest numbers of SWG events with extreme wind gusts were found in Eurajoki Olkiluoto and Loviisa Hästholmen (Table 4, Fig. 7).
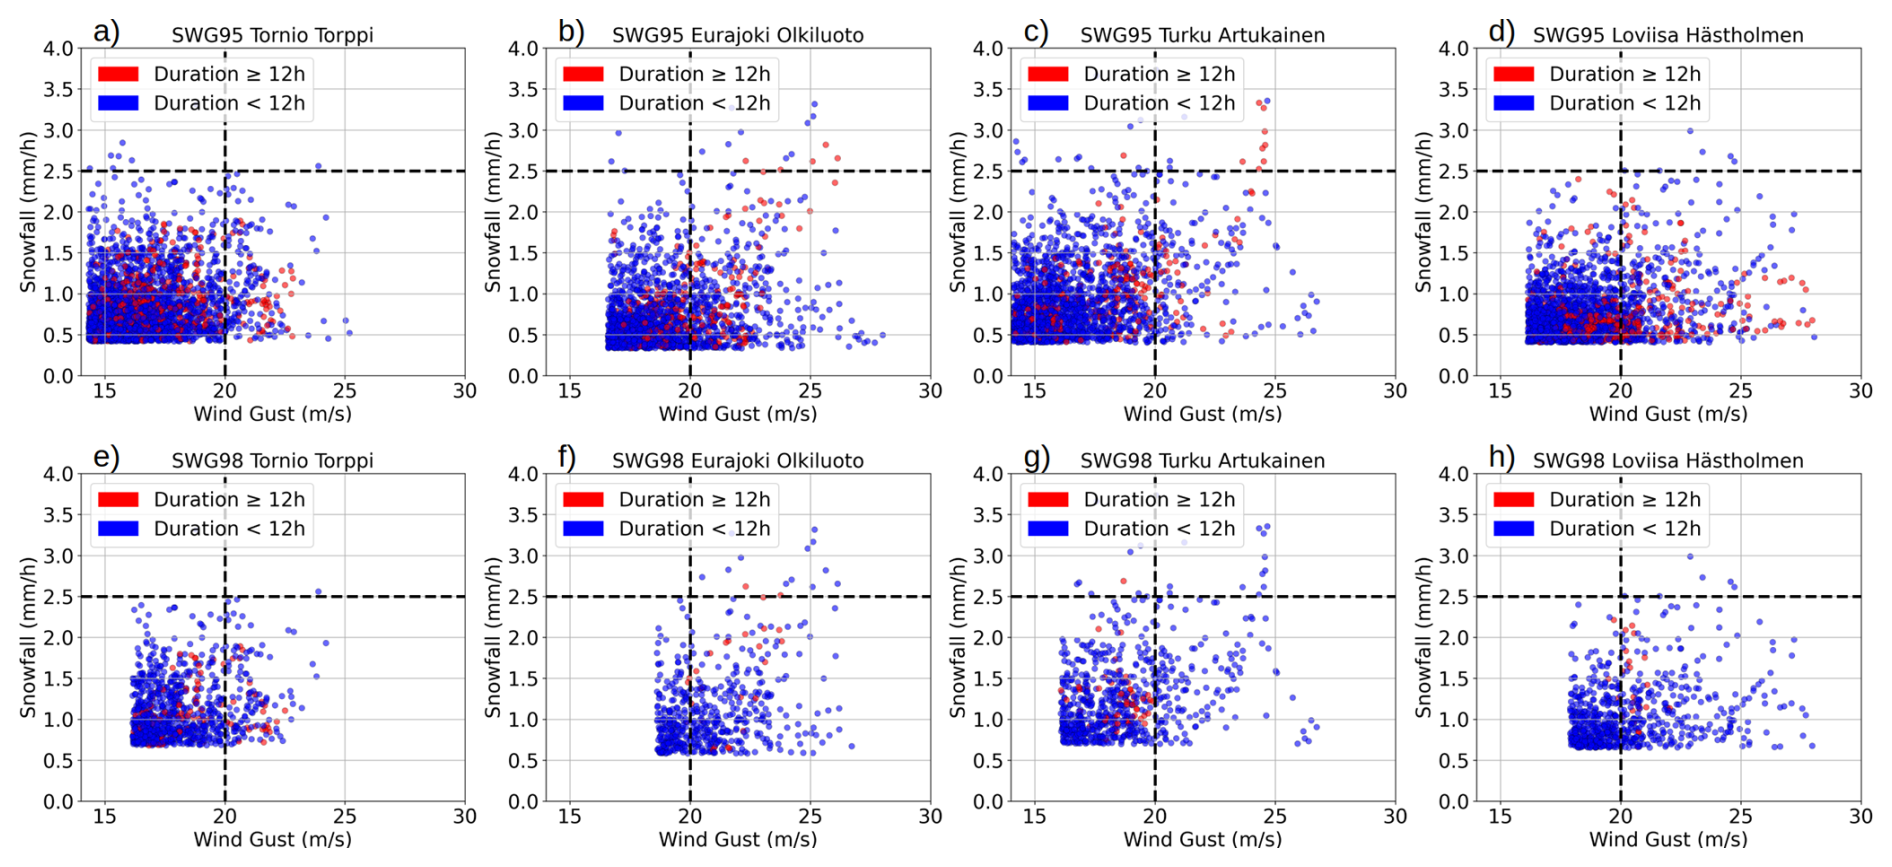
Figure 7Hourly values of SWG compound events involving snowfall (vertical axis) and wind gust (horizontal axis) when the 95th (a, b, c, d) and 98th (e, f, g, h) percentiles for snowfall and wind gusts were used as threshold values in Tornio Torppi (a, e), Eurajoki Olkiluoto (b, f), Turku Artukainen (c, g) and Loviisa Hästholmen (d, h) in 1960–2024 based on ERA5. Hourly values related to SWG compound events that lasted over 12 h are highlighted with red dots. Black dashed lines are added to showcase snowfall exceeding 2.5 mm h−1 and wind gust exceeding 20 m s−1.
Figure 7 illustrates the joint distribution of hourly snowfall and wind gust values during compound-event hours. Most observations are concentrated close to the percentile thresholds, while combinations of very high snowfall rates and very strong wind gusts are relatively rare. The scatterplots exhibit a triangular-shaped distribution, indicating that moderate wind gusts (snowfall) are associated with a wide range of snowfall (wind gust) intensities. This suggests that the simultaneous magnitudes of hourly snowfall and wind gust vary considerably within compound events and that the highest values of the two variables do not necessarily occur at the same time.
The points highlighted with red correspond to hours belonging to compound events that persist for at least 12 consecutive hours. Their distribution indicates that long-duration compound events do not necessarily coincide with the highest hourly snowfall or wind gust intensities. Instead, these events are characterized by the persistence of simultaneously elevated snowfall and wind gust conditions over many consecutive hours. The figure therefore demonstrates that both event intensity and duration contribute to the overall severity of compound snowfall–wind events. Applying the higher (98th percentile) threshold isolates only the most intense portions of the compound events identified using the 95th percentile threshold. Consequently, the durations become shorter because fewer consecutive hours exceed the more stringent threshold, while the identified periods represent the peak intensity within the same underlying meteorological events. In Fig. 7, lines for wind gust of 20 m s−1 and snowfall of 2.5 mm h−1 are added to showcase the event hours when snowfall and wind gust exceeds their warning levels discussed in Introduction -section. Only in Eurajoki Olkiluoto and Turku Artukainen the most extreme events with maximum snowfall >2.5 mm h−1 and wind gust >20 m s−1 exceeded 12 h duration.
Blizzard conditions with maximum wind gust exceeding 17 m s−1 and snowfall accumulation exceeding 10 mm per event were identified at all four study locations. Blizzard conditions were fulfilled at mean decadal frequencies of 3–6 SWG95 events and 2–3 SWG98 events, with the highest frequencies found in Tornio Torppi, followed by Turku Artukainen (Table 4). When applying the stricter threshold for blizzard conditions with maximum wind gust exceeding 20 m s−1 and snowfall accumulation exceeding 20 mm per event only up to 4 events were detected from the study locations during the whole study period 1960–2024. Under the stricter criteria for blizzards, Eurajoki Olkiluoto had the highest mean frequency, although the number of events was low. All these extreme events exceeded 11 h duration and can be regarded extremely hazardous based on the heavy hourly snowfall, accumulated snow amount and/or strong wind gusts.
A few highly extreme events were identified in our analysis. Eurajoki Olkiluoto has experienced a larger number of extreme events than the other three locations. For example, the longest lasting SWG98 event in Eurajoki Olkiluoto produced the second-largest daily snow accumulation ever recorded in Finland (50 cm d−1 on 21 November 1971, Table 3). This event has previously been attributed to sea-effect snowfall (Olsson et al., 2023), with moisture uptake from the ice-free sea enhancing precipitation over the coastal zone. Another example is the December 1966 snowstorm, which simultaneously affected Tornio Torppi, Eurajoki Olkiluoto, and Turku Artukainen. During this event, thresholds corresponding to the 98th percentile were exceeded continuously for at least 11 h, the total snowfall accumulation exceeded 20 mm, and maximum wind gusts surpassed 20 m s−1 at all three sites (and even 25 m s−1 in Eurajoki Olkiluoto). This combination makes it one of the most extreme compound snowfall–wind events in the current record.
Across the 65-year period and four study locations, the highest hourly snowfall rate (3.7 mm h−1) as well as the largest snowfall accumulation (28.5 mm per event) during the SWG95 and SWG98 events occurred in Turku Artukainen. Somewhat surprisingly – given the patterns shown in Fig. 6 – the strongest wind gust occurred in Loviisa Hästholmen with 29 and 28 m s−1 during SGW95 and SWG98, respectively. Notably, the 28 m s−1 wind gust coincided with one of the longest SGW95 events (31 h) in Loviisa Hästholmen (Table A1). Although the snowfall intensities remained moderate (<1.2 mm h−1) throughout this event, its long duration allowed nearly 23 mm of snowfall to accumulate.
In general, the largest snowfall accumulations during SWG95 and SWG98 occurred during the longest SWG98 events, but not consistently during the longest SWG95 events. A comparison between, for example, Tables 3 and A1 illustrates that SWG95 event duration does not necessarily determine the total snowfall accumulation.
3.5 Case studies
To illustrate the practical application of the compound-event framework, we examine two recent high-impact winter storms that affected Finland in November 2024. Although both storms produced severe weather and widespread societal impacts, they differed markedly in the temporal and spatial co-occurrence of extreme snowfall and wind gusts. These case studies demonstrate how the compound-event approach complements hazard assessments by distinguishing storms that produce simultaneous hazards from those in which the individual hazards occur separately.
In November 2024, Finland experienced two extratropical cyclones, Lyly and Jari, which together represented some of the most severe weather events recorded in the country in recent decades. These storms occurred within a three-week interval and caused extensive meteorological and socio-economic impacts across large parts of Finland.
The first event, known as the Lyly storm, developed over the North Atlantic and reached Finland on 1 November 2024. As the system moved across the western and southern parts of the country, it produced unprecedented wind speeds. At the Kylmäpihlaja lighthouse near Eurajoki Olkiluoto, the Finnish Meteorological Institute recorded a ten-minute mean wind speed of 33.5 m s−1, marking the first time that officially hurricane-force winds had been observed in Finnish marine areas (Laurila et al., 2025b). Highest wind gust over coastline was 39.6 m s−1 and inland gusts reached up to 26 m s−1, particularly in the Satakunta region. Snow depth increased 10–20 cm. The combination of strong winds and early-season snow led to widespread damage to trees and power lines. Approximately 67 000 customers were left without electricity, and emergency services reported hundreds of storm-related incidents (Fig. 8a).
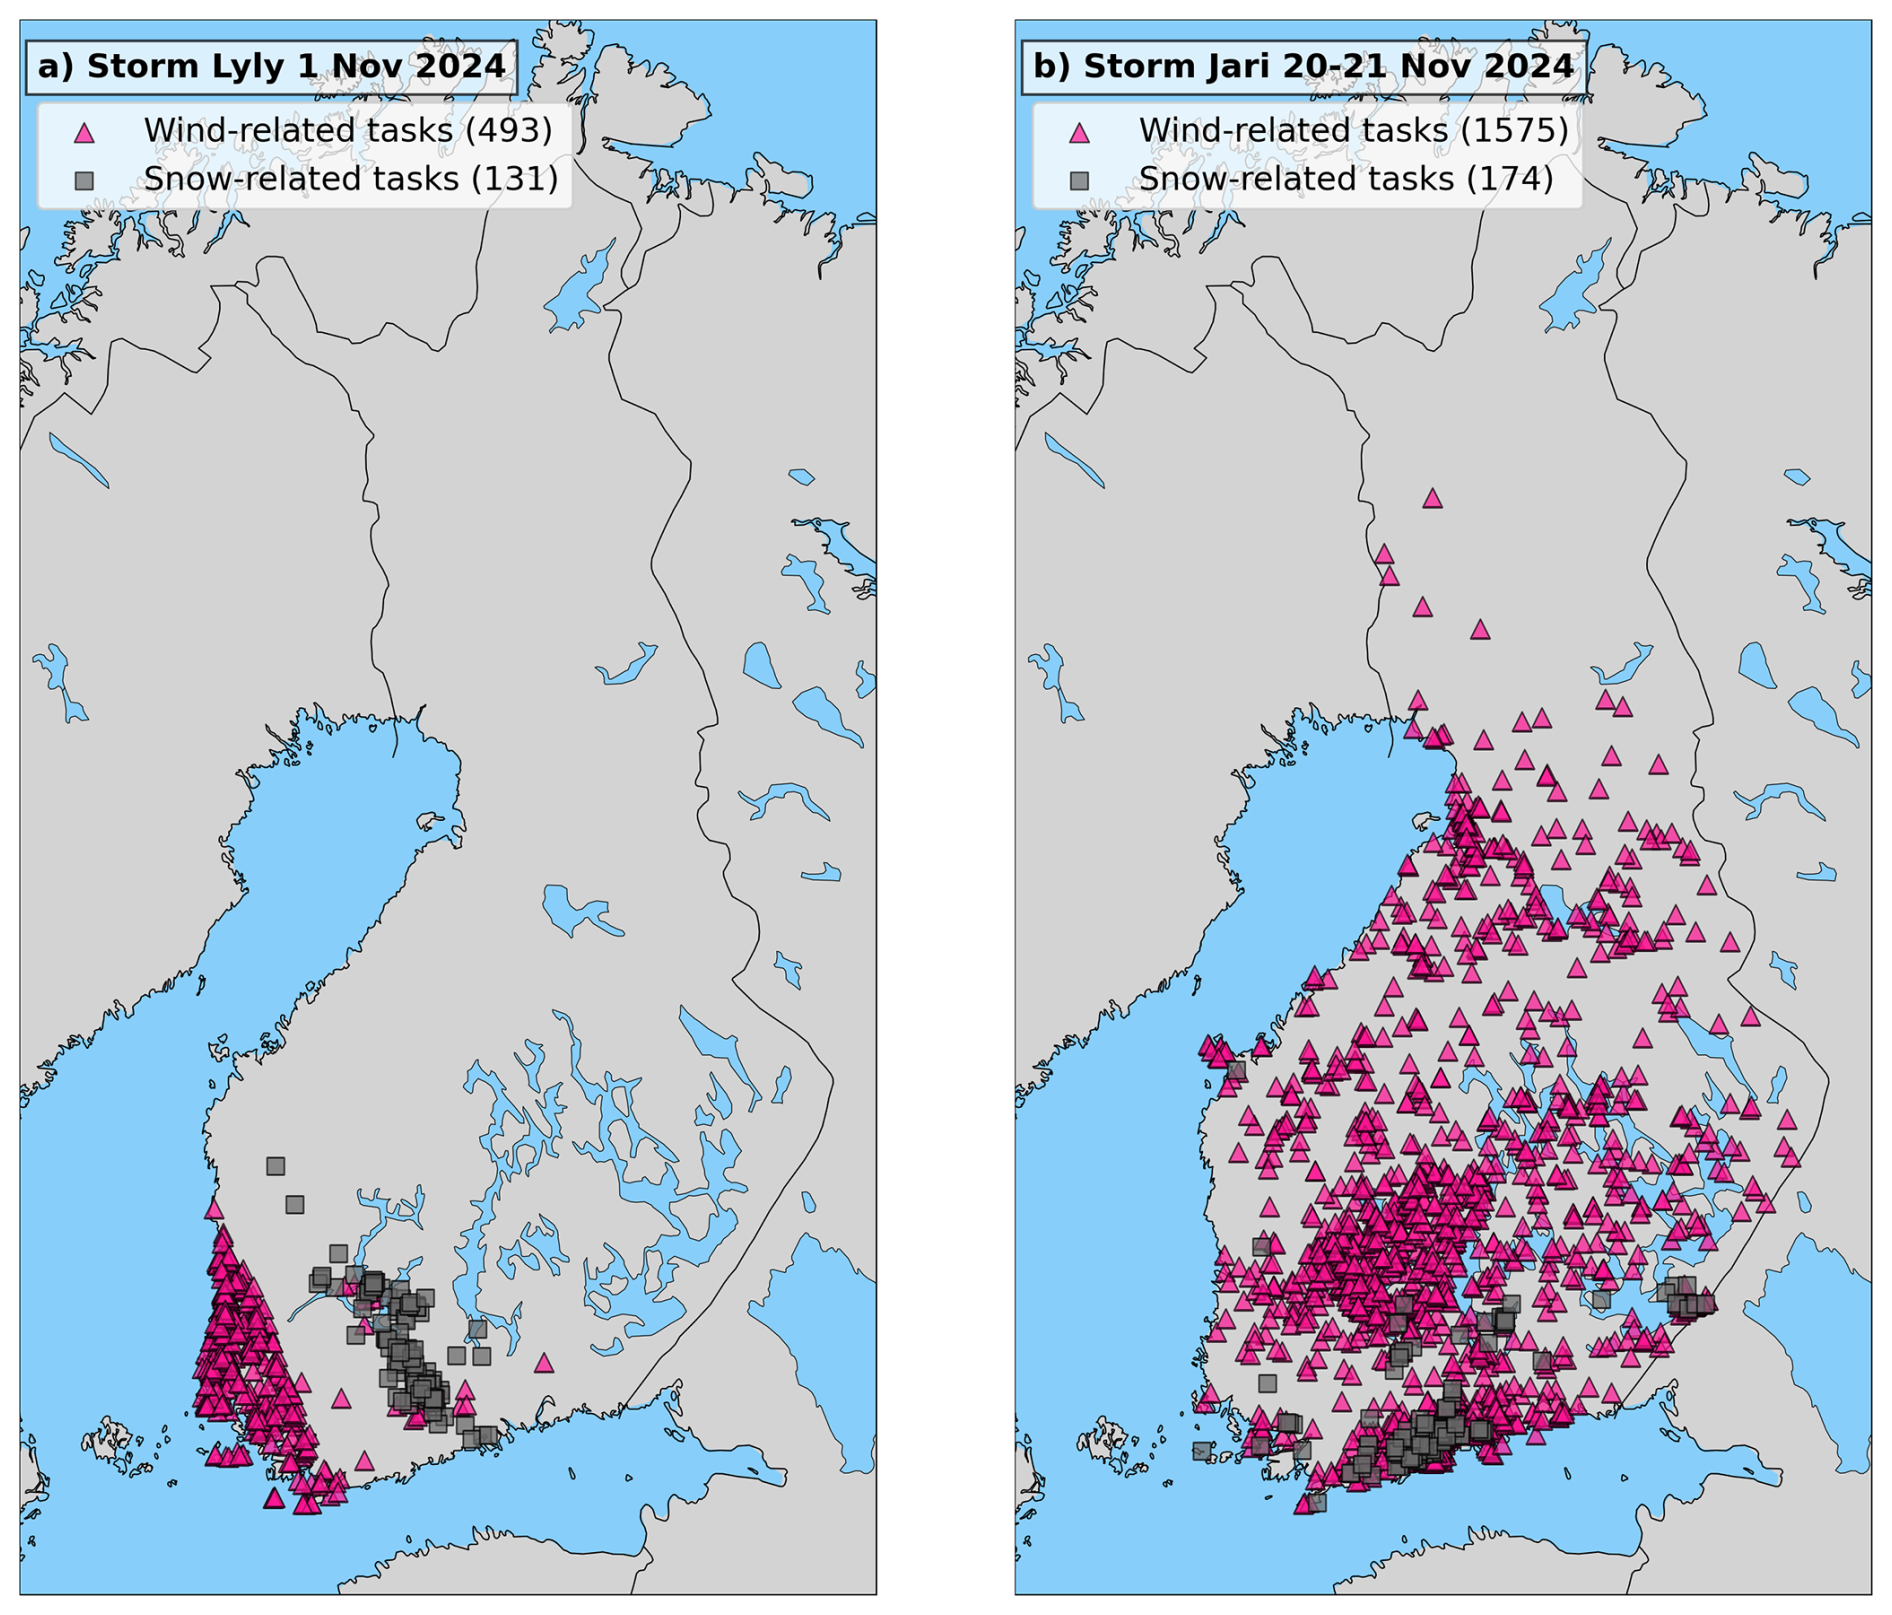
Figure 8Emergency response tasks during storms Lyly (a) and Jari (b). Wind related tasks are marked with pink triangles and snow related tasks with grey squares.
The second system, the Jari storm, affected Finland between 20 and 21 November 2024. Although its peak mean wind speeds and gusts were lower than Lyly's, Jari was characterized by a complex combination of hazards, including strong winds, heavy snowfall, and significant fluctuations in sea level. The highest recorded mean wind, 28.2 m s−1, and gusts up to 34.2 m s−1, were measured at Ulkokalla off the west coast of Finland in the Bothnian Bay (Lehtonen, 2024). In addition, relatively warm and ice-free sea enabled the formation of persistent snowbands over the open water. These snowbands repeatedly moved toward the southern and western coast bringing locally intense, long-lasting showers. As a result, snow depth increased 10–20 cm but, in some areas, even up to 28 cm. The storm caused widespread power outages – exceeding 70 000 households at the peak – and disrupted road and rail transport due to snow accumulation and fallen trees (Fig. 8b). Along the coast of the Bothnian Bay, wind-driven surges and withdrawals of water produced rapid sea-level changes; in Kemi (near Tornio), for instance, the water level dropped by approximately 1.6 m below the seasonal average.
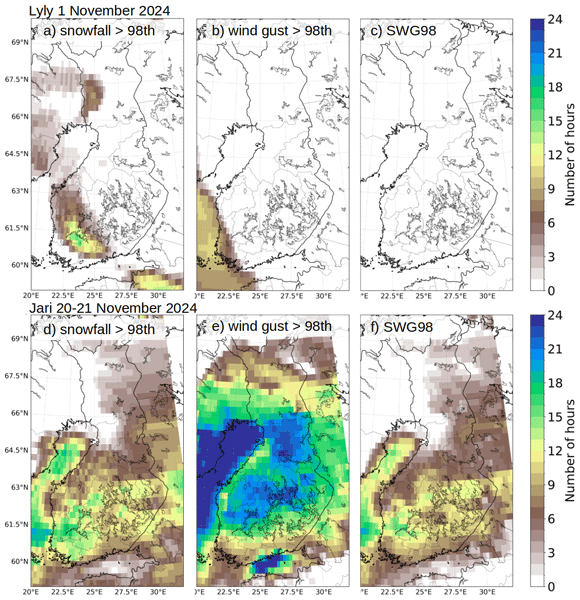
Although Lyly was exceptional for its record-breaking wind speeds, Jari exhibited a much greater temporal and spatial overlap between extreme snowfall and wind gust, resulting in widespread simultaneous compound-event conditions according to the definition adopted in this study. Figure 9 illustrates the temporal and spatial extent of extreme wind gusts and snowfall exceeding the 98th percentile used in this study, and their co-occurrence during the two storms. During Lyly, periods of high wind speeds did not coincide with heavy snowfall (Fig. 9a–b) and therefore did not satisfy the simultaneous compound-event definition adopted in this study (Fig. 9c). In contrast, during Jari, extensive areas over both land and sea experienced simultaneous wind gusts and snowfall exceeding the 98th percentile (Fig. 9d–e). Consequently, large regions were subjected to compound extreme weather conditions (Fig. 9f) although maximum wind speed and gust values were lower than during Lyly. Jari storm was noted also as one of the longest lasting SWG95 event in Eurajoki Olkiluoto (18 h, Table A1).

Figure 9Number of consecutive hours when snowfall (a, d) and wind gust (b, e) 98th percentile thresholds were exceeded, and their co-occurrence (c, f) during storms Lyly (a, b, c) and Jari (d, e, f) based on ERA5.
These two storms illustrate that the severity of individual hazards alone does not determine whether a storm constitutes an extreme compound event. While Lyly was characterized by record-breaking wind speeds, the limited temporal and spatial overlap with heavy snowfall meant that it did not satisfy the simultaneous compound-event definition. In contrast, Jari produced lower peak wind speeds but a much greater overlap between extreme snowfall and wind gust, resulting in widespread compound conditions. These case studies demonstrate that the simultaneous occurrence of extreme snowfall and wind gust provides impact-relevant information beyond the magnitude of the individual hazards. While both storms caused widespread disruption, only Jari produced extensive concurrent exceedances of both hazards, a situation that may lead to enhanced snow drifting, reduced visibility, and greater operational challenges than when the hazards occur separately.
Previous studies have adopted various definitions for temporally compounding wind–precipitation events, including simultaneous exceedances, events linked by specified sub-daily time lags or temporal windows, and daily co-occurrence approaches allowing exceedances to occur on the same day or with a separation of several days (e.g. Xoplaki et al., 2025; Hénin et al., 2021; Owen et al., 2021; Zhang et al., 2021;, Martius et al., 2016). Each approach addresses different research questions and impact pathways. Thus, the choice of definition should ultimately be guided by the intended application and the underlying impact mechanisms rather than by a single universal definition of compound events.
In the present study, compound events were defined as the simultaneous occurrence of extreme wind gusts and extreme snowfall at hourly resolution. This definition was chosen because many of the most severe wintertime impacts on infrastructure, transportation, and industrial facilities arise from the interaction of these hazards when they occur concurrently. Strong winds acting on falling snow enhance snow drifting and deposition, potentially leading to substantial snow accumulation on structures and formation of large snow drifts that can block roads, railways, and access routes, reduce visibility, and obstruct ventilation systems and air intakes in critical infrastructure. Concurrent heavy snowfall and strong winds also increase the likelihood of trees falling onto power lines and transport networks due to the combined effects of snow loading and wind forcing. Although heavy snowfall and strong winds occurring with a time lag may also cause substantial societal impacts, the potential for snow drifting, redistribution, and decreased visibility is likely reduced in such cases compared with exactly concurrent events.
A key challenge in identifying extreme events involving snowfall and wind gusts lies in the choice of threshold values. The use of percentile-based thresholds provides a data-driven approach that accounts for the underlying distributions of the meteorological variables. By defining extreme wind gusts and snowfall relative to their respective distributions, the thresholds identify conditions that are unusual for each variable while maintaining a consistent statistical basis for compound-event detection. In contrast, fixed thresholds, such as 17 m s−1 for wind gusts and 10 mm d−1 for snowfall, are typically selected based on predefined levels of severity or potential societal impacts (Vajda et al., 2014; Rauhala and Juga, 2010). Although such thresholds are relevant for impact-oriented assessments, they do not necessarily represent equally unusual conditions across locations or variables. Percentile-based thresholds therefore provide a more distribution-informed basis for identifying concurrent meteorological extremes and facilitate comparisons of meteorological rarity across locations.
While the 95th and 98th percentiles provide a useful framework for identifying extremes, the two threshold definitions should not be interpreted as identifying independent populations of compound events. Instead, the 98th percentile definition represents a more restrictive characterization of the same underlying events as identified using the 95th percentile threshold, but now only those periods are retained during which both snowfall and wind gust simultaneously reach the highest intensities (Fig. 7). Comparing the two thresholds therefore provides insight into how estimates of event duration, accumulated snowfall during threshold exceedance, and event frequency depend on the severity level used to define the compound event.
While the intensity of individual hourly snowfall and wind gust values is an important characteristic of compound events, event duration is also relevant from an impact perspective. Persistent compound events may lead to prolonged loading of structures, reduced accessibility, and extended operational challenges for critical infrastructure. In the case of nuclear power plants, adverse weather conditions that persist for many hours can have greater operational significance than isolated short-lived exceedances (Helander, 2017). Consequently, evaluating both the intensity and persistence of compound snowfall–wind events provide a more complete characterization of their potential impacts. This is particularly important for snowfall, where long-lasting events identified using a lower percentile threshold (e.g. the 95th percentile) may lead to substantial snow accumulation, even if hourly snowfall rates are moderate. When a higher threshold (e.g. the 98th percentile) is applied, only the most intense part of the compound event satisfies the event definition, resulting in shorter identified durations. Therefore, absolute accumulation metrics were tested alongside percentile-based thresholds to compare the wind gust and snowfall values during the most extreme events (Table 4).
The relevance of short-duration extremes should also be emphasized. One to a few hours of coincident high snowfall rates and strong wind gusts may not disrupt industrial operations or power generation but can still trigger severe traffic accidents, hinder emergency services, and overwhelm snow removal capacity. Thus, even relatively short-lived compound extremes can have significant societal consequences.
Recent storms in Finland further highlight the importance of compound-event analysis. For example, storm Jari qualified as an extreme compound event under our framework, while storm Lyly – occurring only two weeks earlier – did not satisfy the simultaneous compound-event definition adopted in this study (see Sect. 3.5). Although Lyly produced very high wind speeds and widespread warnings for heavy snowfall, the maxima of these two hazards did not exactly coincide spatially or temporally. As a result, it did not meet the compound-event definition, despite causing significant impacts across south-western Finland. In contrast, during Jari, extreme snowfall and wind gust thresholds were exceeded simultaneously for prolonged periods and across a relatively large area. Thus, although the wind gusts during Jari were lower than those observed during Lyly, Jari was classified as severe compound event because the two hazards occurred concurrently, persistently, and over a wider area (Fig. 9, Table A1). This contrast illustrates that compound-event severity is not necessarily determined by the magnitude of the individual hazards alone, but also by their temporal and spatial co-occurrence.
The identification of extremes is also influenced by how meteorological condition are represented in the underlying dataset. Care should be taken when comparing ERA5 variables with observations, because observations are local to a particular point in space and time, rather than representing averages over a model grid box and model time step (Hersbach et al., 2020). Furthermore, observational practices (e.g., precipitation recorded at 0.1 mm resolution) differ from the continuous output of reanalysis, where values < 0.1 mm h−1 are retained. Such differences are also evident in histogram comparisons of snowfall frequency distributions (Fig. 2). Nevertheless, winter precipitation is commonly produced by extratropical cyclones, and ERA5 resolves these large-scale atmospheric processes better than convective processes (Lavers et al., 2022). Accordingly, the smallest differences between ERA5 and observed precipitation have been found to occur during winter in the Extratropics including many stations in northern Europe (Lavers et al., 2022). Because of the ERA5 tendency to underestimate the snowfall and wind gust values (Laurila et al., 2025a), we wanted to avoid using fixed absolute thresholds. The percentile-based approach defines extremes relative to the local climatology, allowing meaningful comparisons of compound-event characteristics across regions with markedly different snowfall and wind climates. In addition, using percentile thresholds provides a sufficiently large sample of compound events for robust statistical analysis while still focusing on the upper tail of the climatological distributions.
Finally, the geographical location of observation stations used in comparison between station observations and ERA5 (Sect. 3.1) strongly influences both snowfall and wind gust values. As shown in Fig. 6, large differences arise over short spatial scales, particularly in coastal regions where exposure to open sea versus inland modifies event intensity.
This study addressed the frequency, duration and intensity of co-occurring high wind gust and intense snowfall events impacting Finnish coastal areas with special focus on four study locations Tornio Torppi, Eurajoki Olkiluoto, Turku Artukainen and Loviisa Hästholmen, with data spanning 1960–2024 from ERA5 reanalysis. High wind gusts and intense snowfall were assessed using the 95th and 98th percentile thresholds for snowfall and wind gusts. The higher percentile threshold shifted the focus of the spatial distribution of compound events from inland to coastal regions. Expectedly, the number of events were smaller but the mean hourly snowfall and wind gust higher with the 98th percentile than the 95th percentile. Key findings:
-
Frequency and location: The highest number of hours exceeding the 95th percentile was found in southwestern Lapland on the shore of the Bothnian Bay. With the stricter threshold of 98th percentile, also southwestern coast of Finland has a pronounced proportion of extreme event hours. Tornio Torppi experienced slightly more compound events than the other study locations.
-
Duration: Most compound events were brief, lasting less than five hours. Long-duration events exceeding 12 h were rare, with only 16–28 events found over the 65-year period at the 95th percentile threshold, and 4–7 events at the 98th percentile in the four study locations.
-
Intensity: Most of the events were moderate with hourly snowfall less than 1 mm h−1 and accumulation less than 5 mm per event. All four study locations faced compound events with heavy hourly snowfall (>2.5 mm h−1), large snow accumulation (>20 mm per event) or high wind gusts (>20 m s−1), but those events where all these three components were exceeded simultaneously during one compound event were detected only from Eurajoki Olkiluoto (3 events) and Turku Artukainen (1 event).
This study emphasizes the importance of understanding simultaneous extreme weather events for assessing the operational safety and emergency preparedness of critical infrastructures and society. While most observed events were short-lived and not particularly severe, a small number of prolonged and intense compound events were identified that could pose significant risks to critical infrastructure.
Tornio Torppi experienced the largest number of simultaneous wind gust–snowfall events, including the longest-lasting event and most frequent blizzard events (≥ 17 m s−1 wind gusts and ∼ 10 mm snowfall per event). However, the most extreme compound events – characterized by simultaneous long duration, heavy hourly snowfall (> 2.5 mm h−1), high total snow accumulation (> 20 mm per event), and strong wind gusts (> 20 m s−1) – were found in Eurajoki Olkiluoto.
Because the primary focus of this study was on hazards to industry, particular attention was given to long-lasting events with both high wind gusts and substantial snowfall. While blizzard events with ∼ 10 mm snowfall per event can disrupt urban life and city services, they are generally less critical for industrial operations. In contrast, a few extremely strong compound events were identified where hourly snowfall exceeded 2.5 mm h−1, wind gusts surpassed 20 m s−1 (and in some cases 25 m s−1), and total snowfall accumulation exceeded 20 mm. Such conditions not only cause poor visibility and hazardous traffic but also lead to drifting snow accumulation far greater than snowfall amounts alone would suggest. For nuclear power plants, in particular, these conditions could block ventilation intakes and overwhelm snow removal operations during prolonged events.
No statistically significant long-term changes were detected in the duration, intensity, or frequency of high–wind-gust and heavy–snowfall compound events over the 65-year study period. However, the observed decrease in heavy snowfall events (>10 mm per event), contrasted with the absence of change in heavy compound snowfall–wind gust events, suggests that although substantial snowfall amounts may be declining, the occurrence of significant snowstorms has remained stable.
Overall, this study demonstrates the importance of examining wind–snowfall combinations as distinct meteorological situations rather than treating them as isolated hazards. By characterizing how often such compound events occur and how intense they can be, the analysis provides a more realistic basis for understanding the conditions that may challenge power transmission lines, transportation systems, or areas susceptible to falling trees. Although these combined events are relatively rare, their potential to create unfavourable circumstances highlights the value of incorporating compound-event perspectives into risk assessments and preparedness planning.
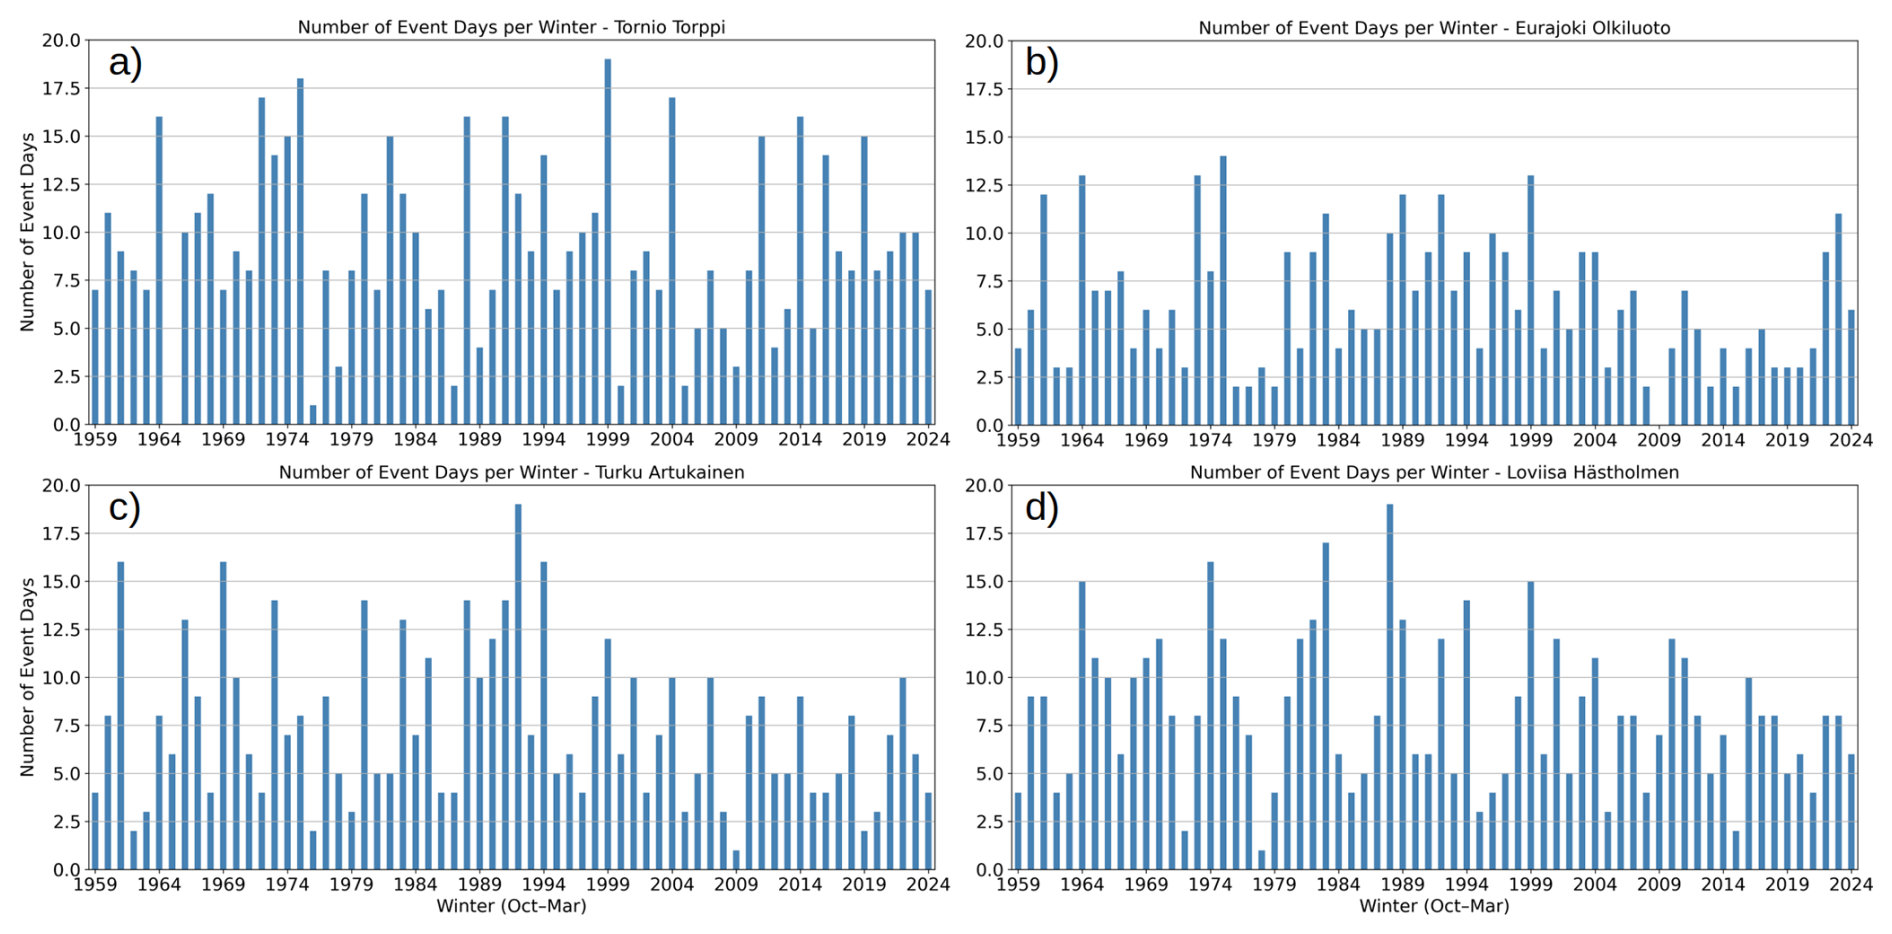
Figure A1The annual number of days when wind gusts and snowfall exceeded their 95th percentile (SWG95) in Tornio Torppi (a), Eurajoki Olkiluoto (b), Turku Artukainen (c) and Loviisa Hästholmen (d) for each year from 1960 to 2024 based on ERA5 data. The annual number of events is calculated from October to March except for the first and last year of the data set when only January–March is calculated as year 1959 and October–December as year 2024 to cover the whole study period.
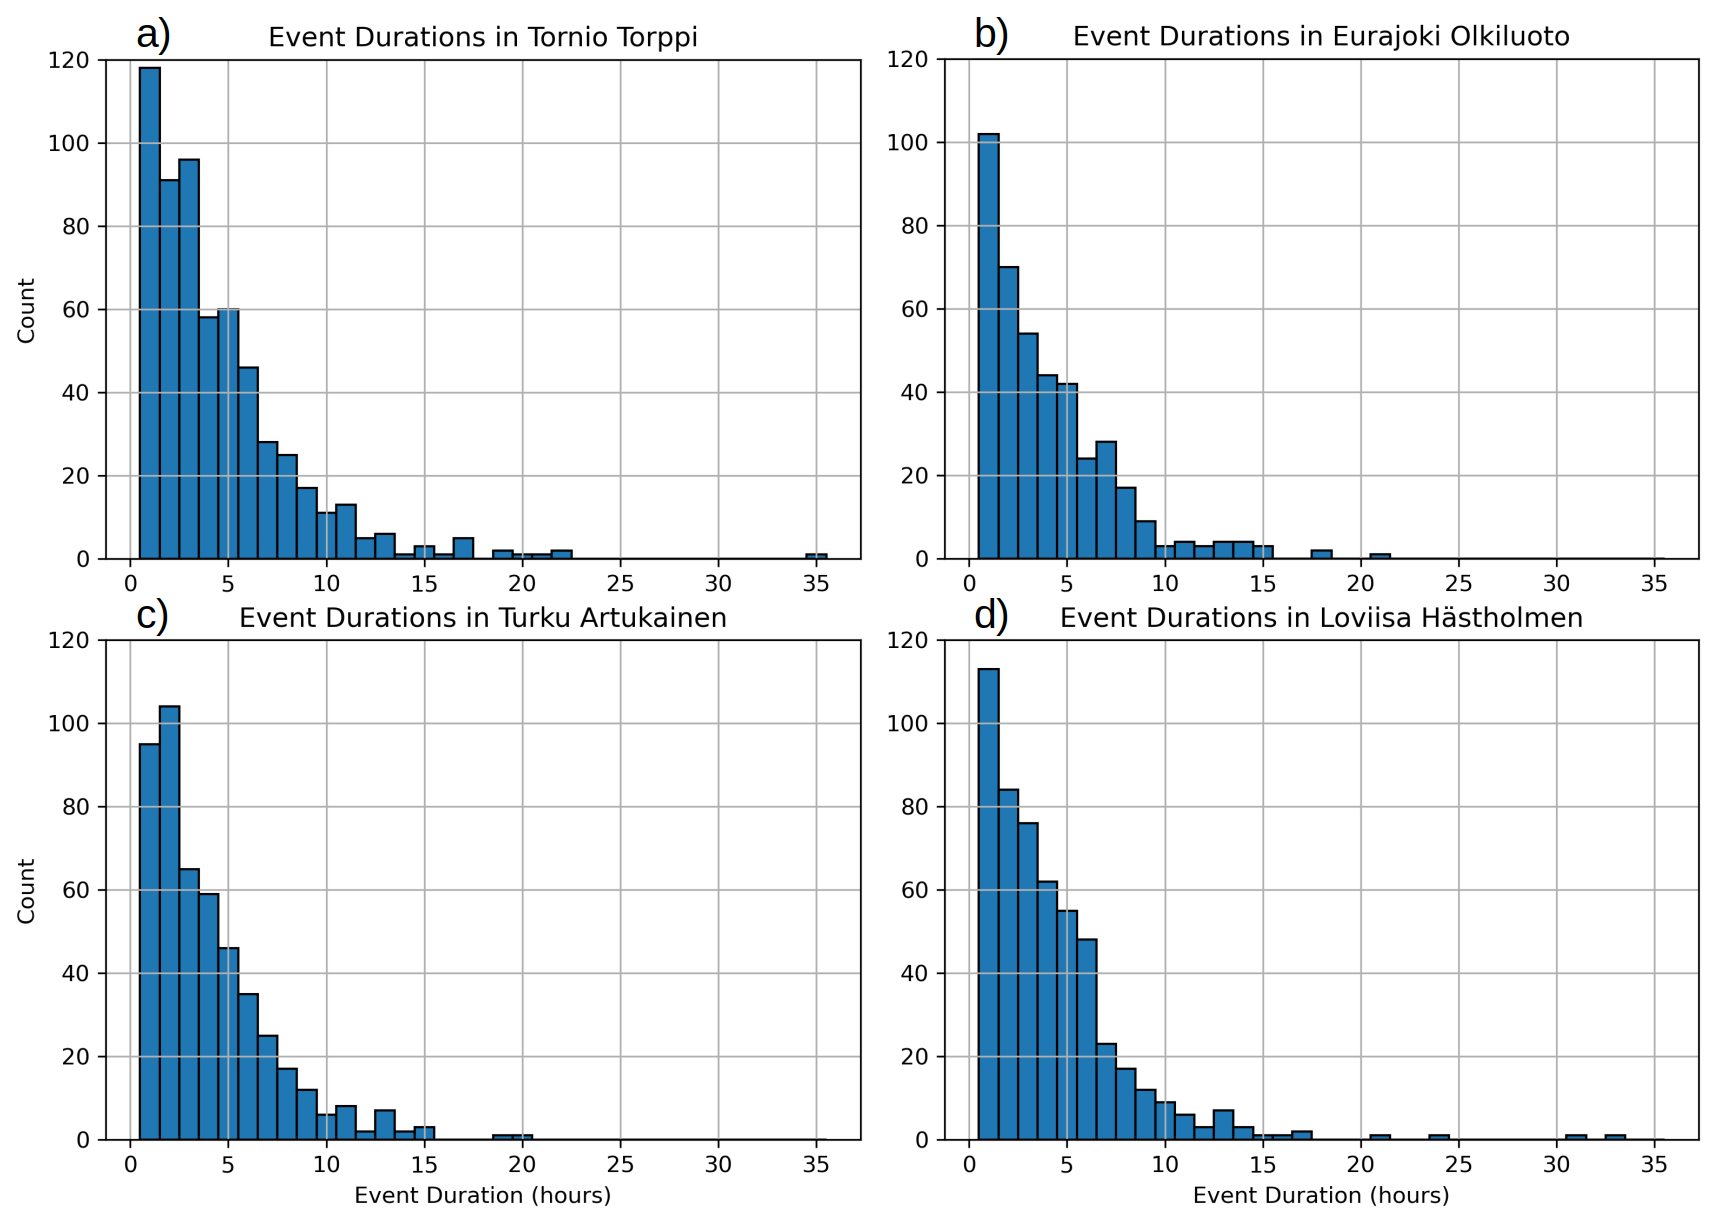
Figure A2Histograms of SWG compound event's durations in Tornio Torppi (a), Eurajoki Olkiluoto (b), Turku Artukainen (c) and Loviisa Hästholmen (d) for the threshold value of 95th percentile. Histograms show the number of consecutive hours when snowfall and wind gust exceeded their threshold value simultaneously during October–March 1960–2024 based on ERA5.
Table A1The five longest lasting SWG compound events in each study location when the 95th percentile were used as a threshold value for hourly snowfall and wind gust during October to Marh in 1960–2024 based on ERA5. In addition, statistics for mean and maximum snowfall and wind gust values are given for each event. Extreme values exceeding the 2.5 mm h−1 for heavy snowfall rate, 20 mm per event for large snowfall accumulation and 25 m s−1 for extreme wind gusts are bolded.
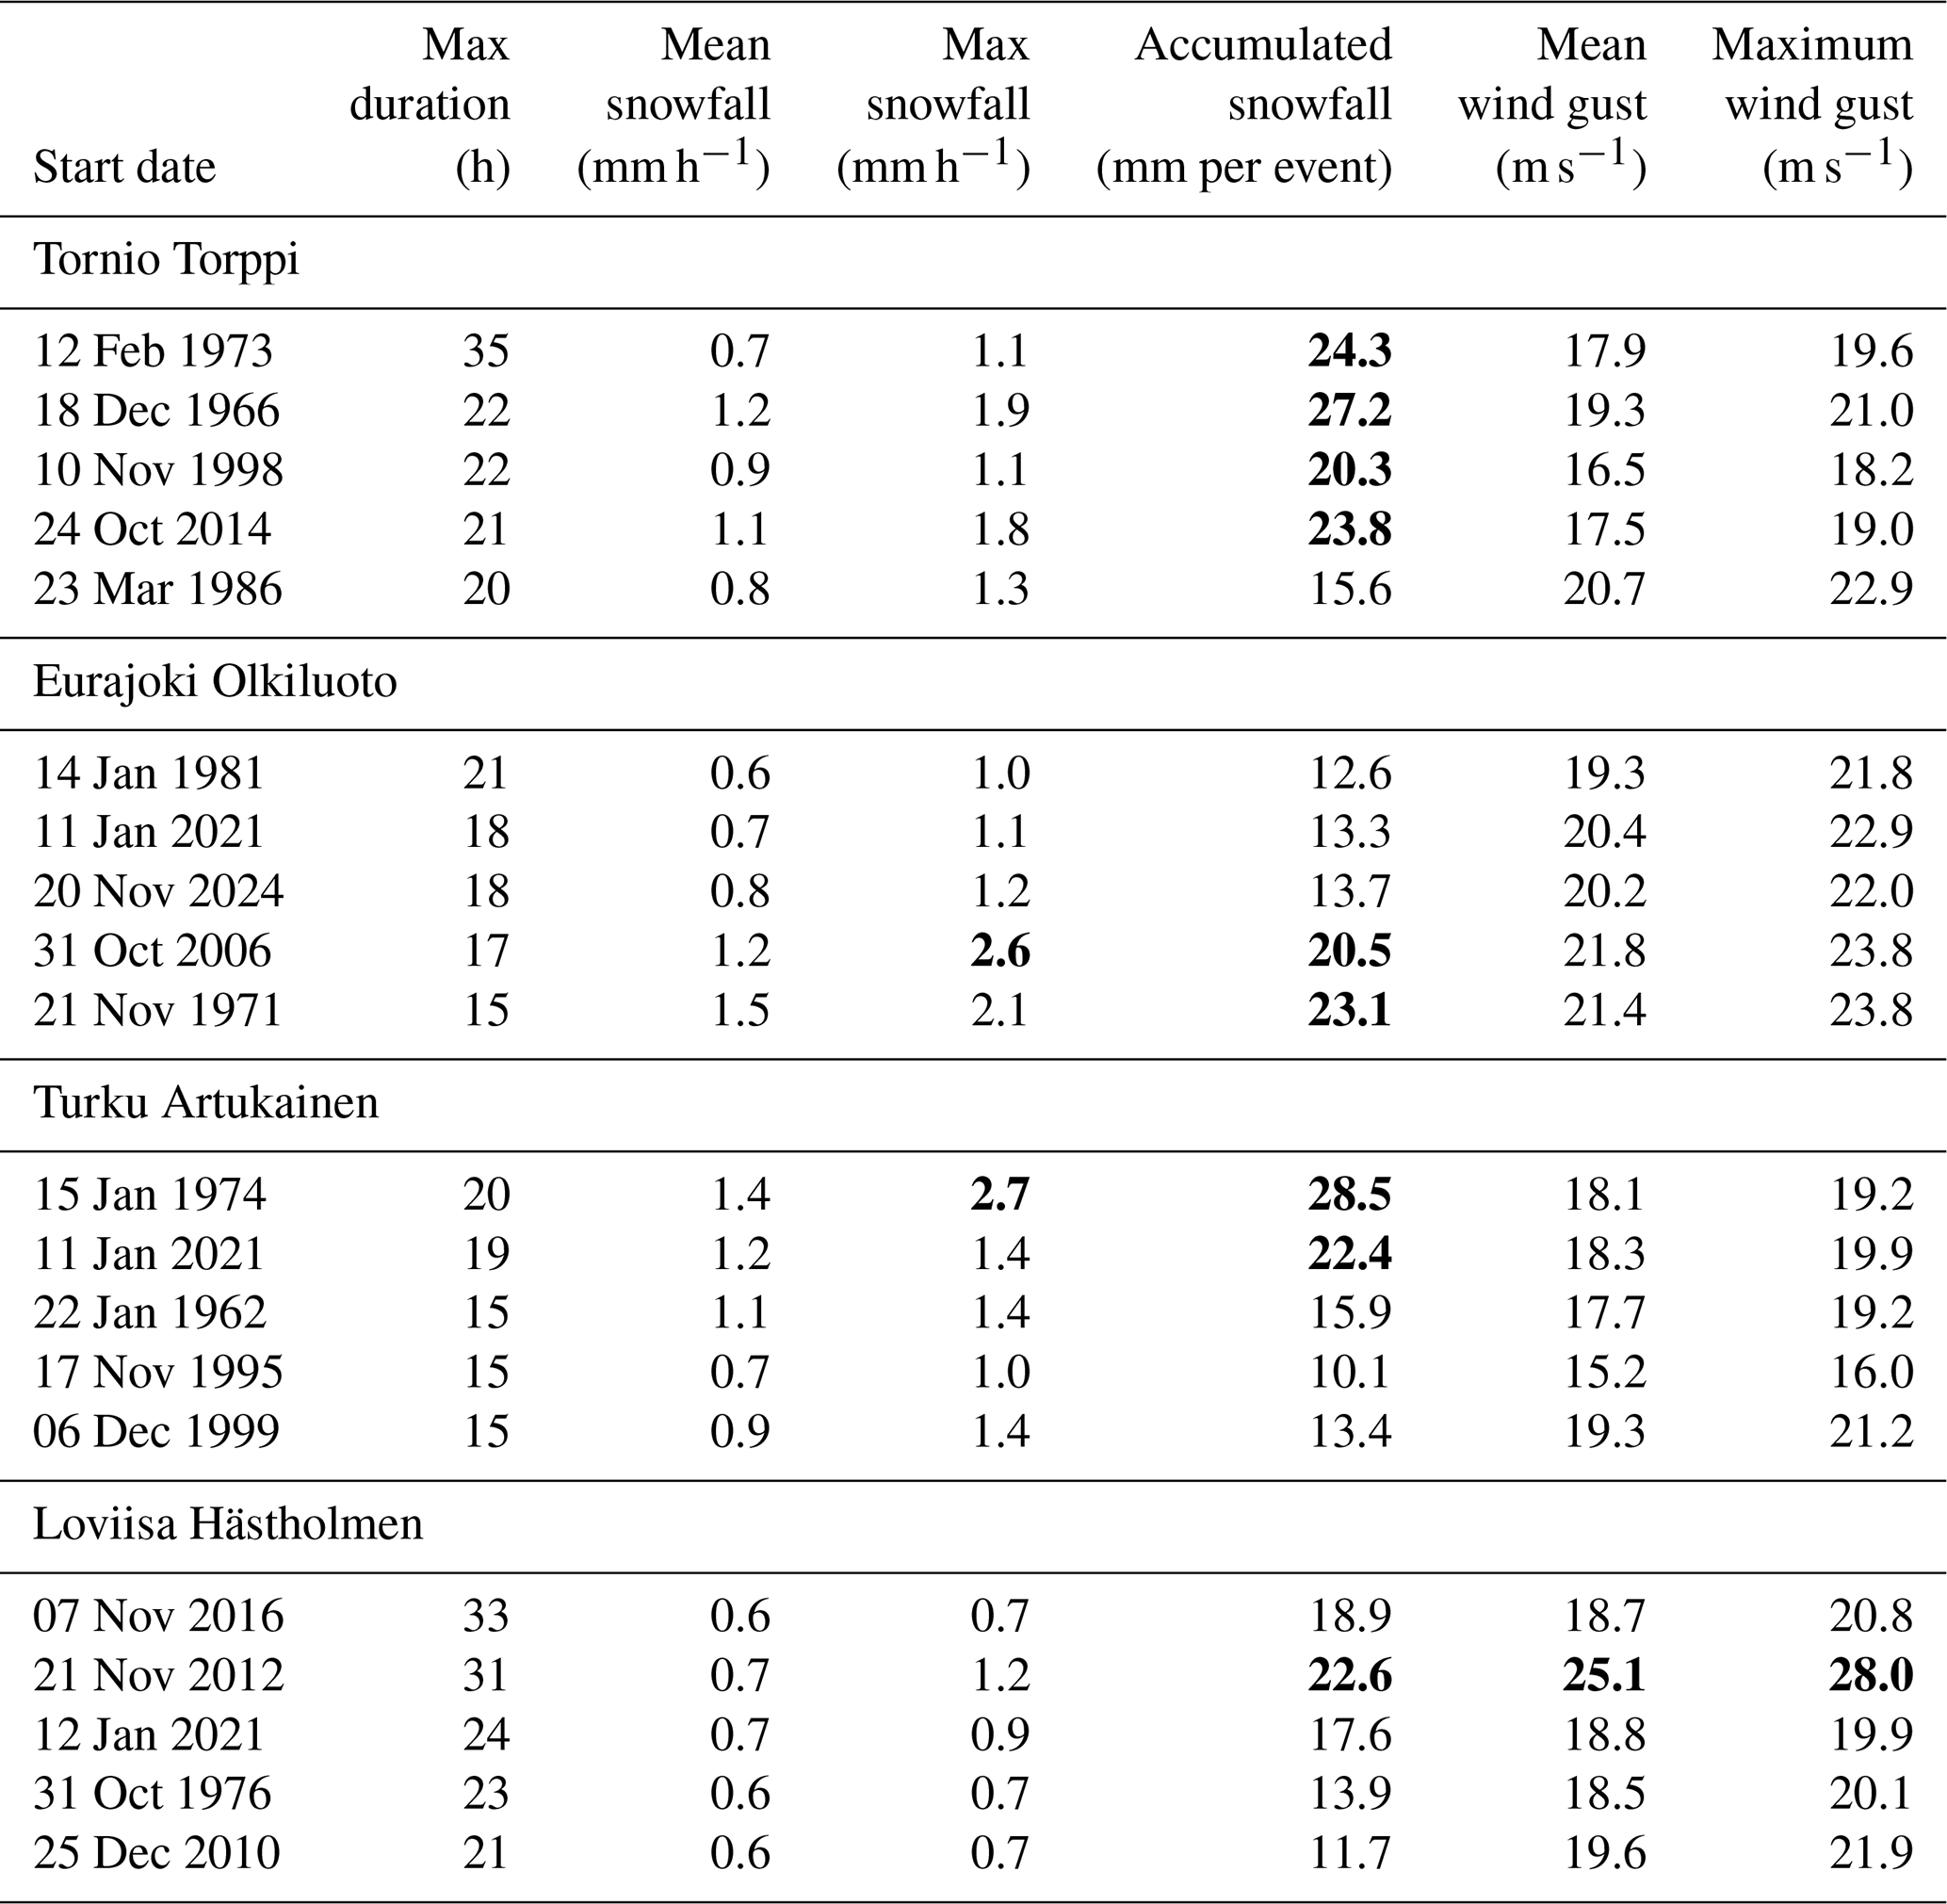
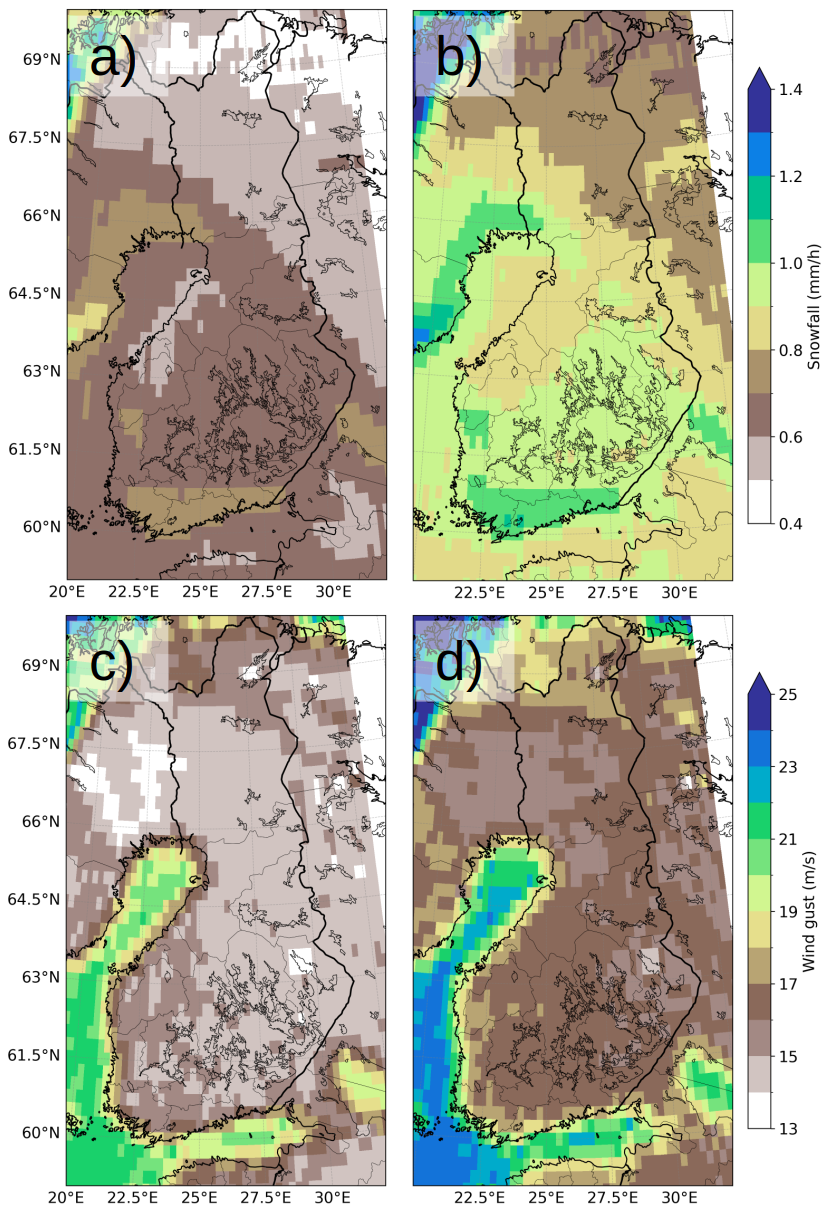
Figure A3Average hourly snowfall (a, b) and wind gust (c, d) during single events when the 95th (a, c) and 98th (b, d) percentile was used as a threshold value from October to Marh in 1960–2024 based on ERA5.
ERA5 data was downloaded from Copernicus Climate Change Service (C3S) Climate Data Store (CDS) (https://doi.org/10.24381/cds.adbb2d47, Hersbach et al., 2023). FMI weather observations are available from FMI open data (https://en.ilmatieteenlaitos.fi/open-data, last access: 11 April 2025). Emergency response tasks show in Sect. 3.5 are not publicly available data.
TO and TL contributed to the conceptualization of the study, performed the statistical analysis of the data, created the visualizations, and wrote the original draft of the manuscript. AA contributed to data acquisition and participated in reviewing and editing the text. KJ was responsible for funding acquisition and project administration and contributed to reviewing and editing the manuscript.
The contact author has declared that none of the authors has any competing interests.
Publisher's note: Copernicus Publications remains neutral with regard to jurisdictional claims made in the text, published maps, institutional affiliations, or any other geographical representation in this paper. The authors bear the ultimate responsibility for providing appropriate place names. Views expressed in the text are those of the authors and do not necessarily reflect the views of the publisher.
We wish to thank Dr. Anna Luomaranta for insightful comments during the writing process. We would like to sincerely thank the two anonymous referees for their constructive and insightful comments.
This research was partially funded by the Finnish State Nuclear Waste Management Fund (VYR) through the MAWECLI project (grant nos. Dnro SAFER 6/2023, 8/2024 and 5/2025) and MAWECLI2 project (grant no. Dnro SAFER 5/2026) in the SAFER2028 programme.
This paper was edited by Christos Giannaros and reviewed by two anonymous referees.
FMI: Road weather conditions for drivers, Finnish Meteorological Institute, https://en.ilmatieteenlaitos.fi/traffic-weather-warning (last access: 15 October 2025), 2021.
FMI: Wind warnings for land and sea, Finnish Meteorological Institute, https://en.ilmatieteenlaitos.fi/wind-warnings (last access: 16 October 2025), 2025a.
FMI: Lumipyryn vaikutuksia Suomessa (The effects of snowstorms in Finland), Finnish Meteorological Institute, https://www.ilmatieteenlaitos.fi/lumipyryn-vaikutuksia-suomessa (last access: 15 October 2025), 2025b.
Gregow, H., Puranen, U., Venäläinen, A, Peltola, H., Kellomäki, S., and Schultz, D.: Temporal and spatial occurrence of strong winds and large snow load amounts in Finland during 1961–2000, Silva Fenn., 42, 231, https://doi.org/10.14214/sf.231, 2008.
Helander, J.: Identification and Analysis of External Event Combinations for Hanhikivi 1 PRA, Nucl. Eng. Technol., 49, 380–386, ISSN 1738-5733, https://doi.org/10.1016/j.net.2017.01.007, 2017.
Hénin, R., Ramos, A. M., Pinto, J. G., and Liberato, M. L. R.: A ranking of concurrent precipitation and wind events for the Iberian Peninsula, Int. J. Climatol., 41, 1421–1437, https://doi.org/10.1002/joc.6829, 2021.
Hersbach, H., Bell, B., Berrisford, P., Hirahara, S., Horányi, A., Muñoz-Sabater, J., Nicolas, J., Peubey, C., Radu, R., Schepers, D., Simmons, A., Soci, C., Abdalla, S., Abellan, X., Balsamo, G., Bechtold, P., Biavati, G., Bidlot, J., Bonavita, M., Chiara, G., Dahlgren, P., Dee, D., Diamantakis, M., Dragani, R., Flemming, J., Forbes, R., Fuentes, M., Geer, A., Haimberger, L., Healy, S., Hogan, R. J., Hólm, E., Janisková, M., Keeley, S., Laloyaux, P., Lopez, P., Lupu, C., Radnoti, G., Rosnay, P., Rozum, I., Vamborg, F., Villaume, S., and Thépaut, J.-N.: The ERA5 global reanalysis, Q. J. Roy. Meteorol. Soc., 146, 1999–2049, https://doi.org/10.1002/qj.3803, 2020.
Hersbach, H., Bell, B., Berrisford, P., Biavati, G., Horányi, A., Muñoz Sabater, J., Nicolas, J., Peubey, C., Radu, R., Rozum, I., Schepers, D., Simmons, A., Soci, C., Dee, D., and Thépaut, J.-N.: ERA5 hourly data on single levels from 1940 to present, Copernicus Climate Change Service (C3S) Climate Data Store (CDS) [data set], https://doi.org/10.24381/cds.adbb2d47, 2023.
Jylhä, K., Kämäräinen, M., Fortelius, C., Gregow, H., Helander, H., Hyvärinen, O., Johansson, M., Karppinen, A., Korpinen, A., Kouznetsov, Kurzeneva, R.E., Leijala, U., Mäkelä, A., Pellikka, H., Saku, S., Sandberg, J., Sofiev, M., Vajda, A., Venäläinen, A., and Vira, A.: Recent meteorological and marine studies to support nuclear power plant safety in Finland, Energy, 165, 1102–1118, https://doi.org/10.1016/j.energy.2018.09.033, 2018.
Láng-Ritter, I., Laurila, T. K., Mäkelä, A., Gregow, H., and Sinclair, V. A.: Classifying extratropical cyclones and their impact on Finland's electricity grid: insights from 92 damaging windstorms, Nat. Hazards Earth Syst. Sci., 25, 1697–1717, https://doi.org/10.5194/nhess-25-1697-2025, 2025.
Laurila, T. K., Laapas, M., Olsson, T., and Jylhä, K.: Wind speeds and gusts in Finland: a comparison of observations and ERA5 reanalysis, Boreal Environ. Res., 30, 181–193, https://doi.org/10.60910/ber2025.q6kf-qp39, 2025a.
Laurila, T. K., Rantanen, M., and Punkka, A.-J.: Storm Lyly, the first storm with observed hurricane-force winds in Finland, Weather, 80, 124–126, https://doi.org/10.1002/wea.7684, 2025b.
Lavers, D. A., Simmons, A., Vamborg, F., and Rodwell, M. J.: An evaluation of ERA5 precipitation for climate monitoring, Q. J. Roy. Meteorol. Soc., 148, 3124–3137, https://doi.org/10.1002/qj.4351, 2022.
Lehtonen, I.: Marraskuussa oli useita myrskypäiviä, Ilmastokatsaus, 26, 4–5, https://doi.org/10.35614/ISSN-2341-6408-IK-2024-11-01, 2024.
Martius, O., Pfahl, S., and Chevalier, C.: A global quantification of compound precipitation and wind extremes, Geophys. Res. Lett., 43, 7709–7717, https://doi.org/10.1002/2016GL070017, 2016.
Niinimäki, N.: Lumimyrskyt Etelä- ja Lounais-Suomessa 1965–2005, MS Thesis, Department of Physics: University of Helsinki, 80 pp., 2008 (in Finnish).
Olsson, T., Luomaranta, A., Nyman, H., and Jylhä, K.: Climatology of sea-effect snow in Finland, Int. J. Climatol., 43, 650–667, https://doi.org/10.1002/joc.7801, 2023.
Owen, L., Catto, J. L., Stephenson, D. B., and Dunstone, N. J.: Compound precipitation and wind extremes over Europe and their relationship to extratropical cyclones, Weather Clim. Extr., 33, https://doi.org/10.1016/j.wace.2021.100342, 2021.
Punkka, A.-J. and Láng-Ritter, I.: Lyly puhalsi hirmumyrskyn voimalla, FMI Clim. Bull., 26, 8–10, https://doi.org/10.35614/ISSN-2341-6408-IK-2024-11-02, 2024.
Räisänen, O., Saleem, A., Lehtonen, I., Haakana, J., Haapaniemi, J., and Lassila, J.: High-resolution model for assessing the impact of climate change on the outage risk caused by crown snow load in distribution networks, Reliab. Eng. Syst. Safe., 267, Part A, https://doi.org/10.1016/j.ress.2025.111864, 2026
Rasmussen, R. M., Vivekanandan, J., Cole, J., Myers, B., and Masters, C.: The Estimation of Snowfall Rate Using Visibility, J. Appl. Meteor. Climatol., 38, 1542–1563, https://doi.org/10.1175/1520-0450(1999)038<1542:TEOSRU>2.0.CO;2, 1999.
Rauhala, J. and Juga, I.: Wind and Snow Storm Impacts on Society, Proceedings of the 15th SIRWEC Conference, International Road Weather Conference, Quebec City, Canada, 5–7 February 2010, https://sirwec.org/wp-content/uploads/2022/04/Quebec-D-20.pdf (last access: 28 September 2026), 2010.
Rutgersson, A., Kjellström, E., Haapala, J., Stendel, M., Danilovich, I., Drews, M., Jylhä, K., Kujala, P., Larsén, X. G., Halsnæs, K., Lehtonen, I., Luomaranta, A., Nilsson, E., Olsson, T., Särkkä, J., Tuomi, L., and Wasmund, N.: Natural hazards and extreme events in the Baltic Sea region, Earth Syst. Dynam., 13, 251–301, https://doi.org/10.5194/esd-13-251-2022, 2022.
STT: Fingrid: Suurjännitepylväiden kaatumisen taustalla rakenteiden heikentyminen, Maaseudun Tulevaisuus. https://www.maaseuduntulevaisuus.fi/uutiset/b67aaf73-25e8-40ae-b225-2ff254a2b243 (last access: 5 August 2026), 2024.
Trimble: November storm tested Finland's power grids and utility companies' readiness, Trimble Energy and Public Administration (Europe), https://upa.trimble.com/en-eu/november-storm-tested-finlands-power-grids-and-utility (last access: 5 August 2025), 2024.
Vajda, A., Tuomenvirta, H., Juga, I., Nurmi, P., Jokinen, P., and Rauhala, J.: Severe weather affecting European transport systems: The identification, classification and frequencies of events, Nat. Hazards, 72, https://doi.org/10.1007/s11069-013-0895-4, 2014.
Xoplaki, E., Ellsäßer, F., Grieger, J., Nissen, K. M., Pinto, J. G., Augenstein, M., Chen, T.-C., Feldmann, H., Friederichs, P., Gliksman, D., Goulier, L., Haustein, K., Heinke, J., Jach, L., Knutzen, F., Kollet, S., Luterbacher, J., Luther, N., Mohr, S., Mudersbach, C., Müller, C., Rousi, E., Simon, F., Suarez-Gutierrez, L., Szemkus, S., Vallejo-Bernal, S. M., Vlachopoulos, O., and Wolf, F.: Compound events in Germany in 2018: drivers and case studies, Nat. Hazards Earth Syst. Sci., 25, 541–564, https://doi.org/10.5194/nhess-25-541-2025, 2025.
YLE: Finland's roads remain hazardous following first winter storm, YLE News, https://yle.fi/a/74-20126495 (last access: 5 August 2025), 2024.
Zhang, Y., Sun, X., and Chen C.: Characteristics of concurrent precipitation and wind speed extremes in China, Weather Clim. Extr., 32, 100322, https://doi.org/10.1016/j.wace.2021.100322, 2021.
Zhao, J., Li, J., Khan, M. S. H., Oka, K., Yasunaga, A., Nakaya, T., Kaczynski, A. T., McCormack, G. R., and Koohsari, M. J.: Snow-sensitive built environment metrics and active behaviour: a systematic review, BMC Public Health, https://doi.org/10.1186/s12889-026-28674-6, 2026.