
the Creative Commons Attribution 4.0 License.
the Creative Commons Attribution 4.0 License.
 | 17 Sep 2026
Ballistic projectile hazard of major explosions and paroxysms at Stromboli (Italy) with uncertainty quantification – Part 1: Mapping method and data analysis
Andrea Bevilacqua
Patrizia Landi
Paola Del Carlo

Massimo Pompilio
This study presents a novel method to map the areas affected by ballistic fallout generated by major explosions and paroxysms at Stromboli as well as quantitative analyses of these areas. The mapping method is based on a simplified description of the affected areas by a circular proximal area and up to three circular sectors with variable radius and width, and uncertainty based on expert judgement. The dataset of maps includes a total of 67 events over ≈ 150 years, based on an extensive review of historical, observational, and monitoring data. Our findings highlight that: (1) 12 %–14 % of major explosions can exceed 1000 m, and 29 % of paroxysms extend over 2000 m of distance; (2) directional analysis of ballistic dispersal shows a predominant direction towards the East half-plane (87 %) for major explosions and towards the North half-plane (64 %) for paroxysms; (3) the average affected area was 6.9 × 10⁴ m2 for major explosions and 3.6 × 10⁵ m2 for paroxysms with a mean sector width of ≈ 90° for both categories. Notably, major explosions and paroxysms show a continuous distribution of maximum ballistic distance and area affected, suggesting the absence of a net separation between these two categories in terms of these products dispersal. Results highlight the limited influence of uncertainty in reconstructing the dispersal areas and stress the importance of ad hoc continuous observation of ballistic dispersal. By quantifying distances, directions, and areas affected by ballistic fallout, we provide the necessary data, together with their uncertainty, to produce probabilistic maps of ballistic hazard presented in the companion study.
- Article
(16068 KB) - Full-text XML
- Companion paper
-
Supplement
(50879 KB) - BibTeX
- EndNote


Volcanic ballistic projectiles are typically centimeter- to meter-sized clasts, either juvenile or lithic and solid or partially molten, which are ejected during explosive activity and are sufficiently large to travel through the atmosphere along ballistic trajectories (e.g., Taddeucci et al., 2017). A ballistic trajectory is the free-flight path followed by an ejected particle after it has dynamically decoupled from the eruptive jet or plume, with its motion governed predominantly by gravity and aerodynamic forces. Several previous studies were focused on the volcanic hazard associated with ballistics (Blong, 1984; Alatorre-Ibargüengoitia et al., 2006, 2012, 2016; Rosi et al., 2013; Fitzgerald et al., 2014; Tsunematsu et al., 2016; Bernard, 2018). In fact, ballistics ejected during sudden explosions producing single or multiple directed blasts, are the most common cause of fatal accidents within a 5 km radius from active volcanoes and caused tens of casualties and hundreds of injuries in the past decades (Brown et al., 2017). They represent a major hazard at many active volcanoes in the world, in particular those that are sites of tourist attraction, e.g., Galeras (Colombia), Popocatepetl (Mexico), Yasur (Vanuatu), Tongariro (New Zealand), Ontake and Shinmoedake (Japan) (Maeno et al., 2013; Yamaoka et al., 2016; Fitzgerald et al., 2018) and Stromboli (Italy).
Stromboli island constitutes the ca. 3 × 4 km subaerial section of an active composite volcano, slightly elongated in the NE-SW direction and rising to an elevation of 924 m above sea level. The island is notable for a horseshoe-shaped depression called Sciara del Fuoco located in the NW part of the volcano. The ongoing volcanic activity generally occurs in multiple craters within a relatively flat region known as Crater Terrace, located at about 750 m elevation above the Sciara del Fuoco (Fig. 1i).
At Stromboli, the greater ballistic hazard is related to major explosions and paroxysms that interrupt the persistent mild strombolian activity of the volcano (Barberi et al., 1993; Pompilio et al., 2010; Bertagnini et al., 2011). The hazardous area affected by ballistic projectiles is a key observation and is commonly assumed as the main discriminant factor to distinguish between ordinary activity, major explosions and paroxysms (Barberi et al., 1993; Rosi et al., 2013; Bevilacqua et al., 2020b). This area is limited to the Crater Terrace and upper Sciara del Fuoco in case of ordinary activity, to the summit area of the volcano (up to a maximum distance of about 1 km from the vents) and Sciara del Fuoco during major explosions, and can extend down to low elevations along large part of the island, and sometimes beyond the shoreline (up to ca. 2.5 km), during the paroxysms. Notably, during major explosions and paroxysms tephra is commonly dispersed through convective columns of ca. 1 km and a few km high, respectively (Rosi et al., 2013). However, in our analysis of the documents, we focused exclusively on ballistic projectiles, ruling out light pumice fallout, as it is not expected to pose a significant hazard, in particular to inhabited areas.
The present early-warning systems at Stromboli are able to recognize precursor signals a few minutes before these explosive events, a time too short to find a safe shelter or escape from the hazard zone (Di Lieto et al., 2020; Ripepe et al., 2021; Insinga et al. 2025). In this context, quantitative assessments of the ballistic hazard at different sites of the island becomes a crucial means for any action of risk mitigation and emergency planning.
Estimates and robust statistics of distances, directions and areas affected by ballistic projectiles therefore represent key information to feed reliable hazard assessments. Stromboli offers observations of tens of explosive events in either the major explosions and paroxysms categories (Bertagnini et al., 1999, 2008; Coltelli et al., 2000; Rosi et al., 2006; Pistolesi et al., 2011; Giordano and De Astis 2021; Andronico et al., 2021) and several illustrative examples of ballistics ejected during these events are shown in Figs. 1 and S1 in the Supplement.
In this study, we performed a careful spatial analysis and uncertainty assessment using the data collected in two open INGV catalogs of major explosions and paroxysms at Stromboli (Bevilacqua et al., 2020a, 2023). Building on the two datasets we have developed a novel method to map the area affected by the fallout of ballistic projectiles in a remarkable number of events (a total of 67 events, i.e., 24 paroxysms and 43 major explosions) including the assessment of its uncertainty. The new method uses circular sectors with varying radii, angles and uncertainty ranges. Thank to this approach, we calculated the statistics of the radius, directional angle, and the extent of the area affected by ballistic projectiles.
To evaluate the effect of poorly constrained information on the distances and directions of past explosions, we utilize a doubly stochastic methodology, involving uncertain probabilities (Sparks and Aspinall, 2004; Marzocchi and Bebbington, 2012; Bevilacqua et al., 2015). Historical data are regarded as a random array, and we separately estimate this epistemic uncertainty from the statistical model for future distance, direction, and affected area (Bebbington, 2013; Bevilacqua et al., 2016, 2018; Richardson et al., 2017; Watson et al., 2017). Specifically, our calculations are conducted using Monte Carlo simulations that randomly perturb the simplified maps of past events. We present all our results as mean values along with the 5th and 95th percentile values (Neri et al., 2015; Bevilacqua et al., 2017; Rutarindwa et al., 2019; Tadini et al., 2022; Aravena et al., 2022, 2023).
These results enable a greater understanding of the hazard and ultimately risk of ballistics on Stromboli and represent the key information to produce probability hazard maps of ballistic projectiles from major explosions and paroxysms, or for both types of events considered together, as described in the companion study (Bevilacqua et al., 2026).
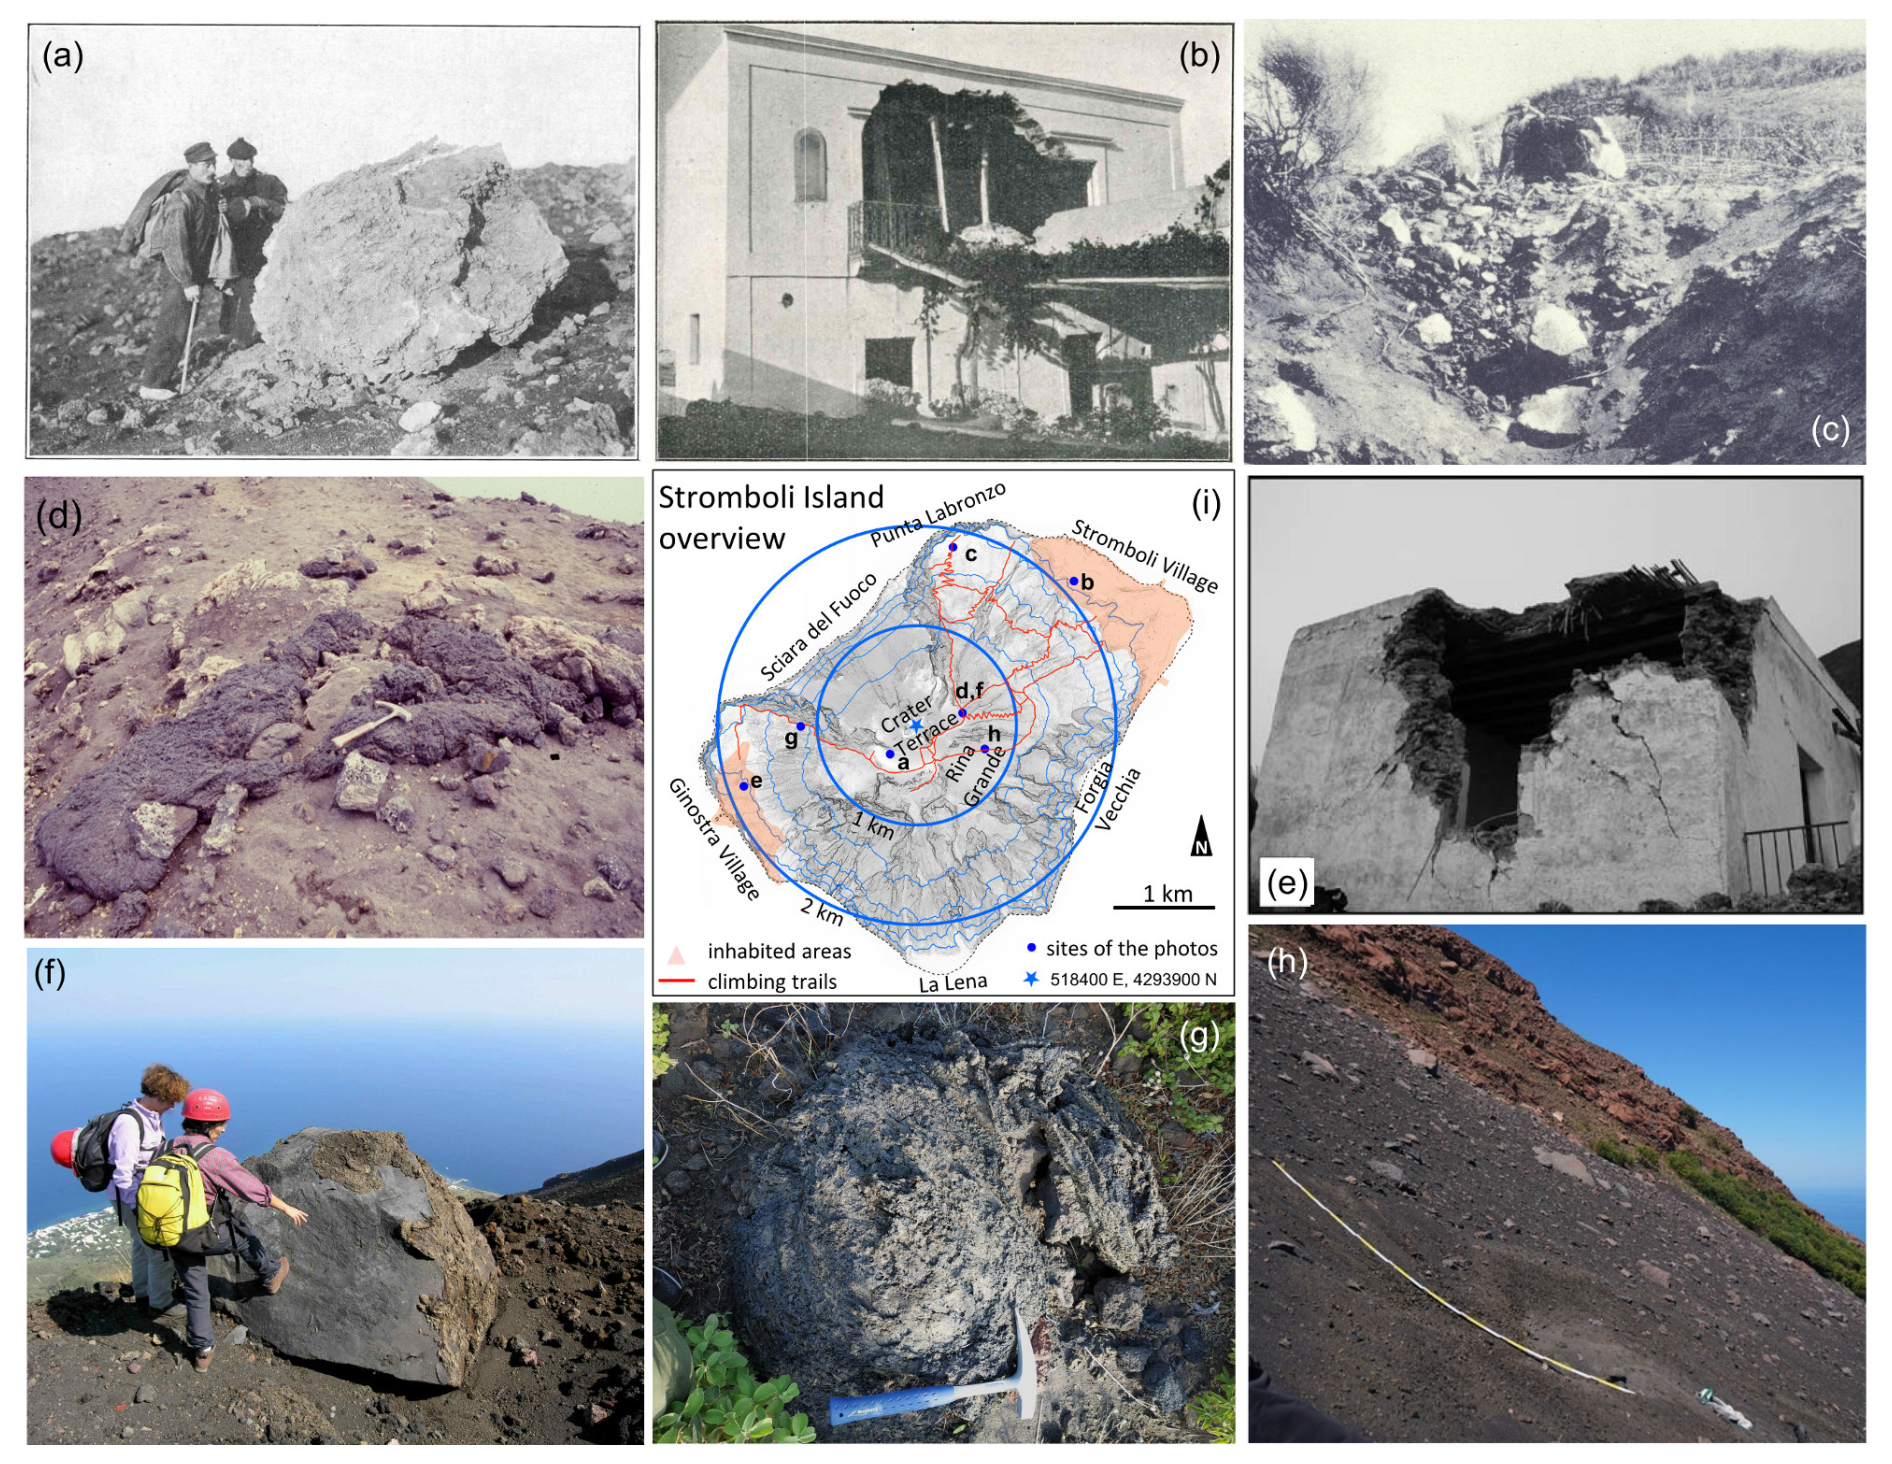
Figure 1Examples of sizes and type of ballistic projectiles observed during past events at Stromboli. (a) conglomerate boulder ejected by the paroxysm of 26 November 1915 (Perret, 1916); (b) house in S. Bartolo hamlet hit by a large ballistic projectile during the paroxysm of 22 May 1919 (Ponte, 1924); (c) ballistic block impacted near Labronzo Lighthouse during the paroxysm of 11 September 1930 (Rittmann, 1931); (d) flattened bomb ejected ca. 500 m from the craters by the major explosion of 8 September 1998 (P. Landi ph.); (e) house in Ginostra village hit by a large ballistic projectile during the paroxysm of 5 April 2003 (Rosi et al., 2006); (f) large block ejected ca. 600 m from the craters during the paroxysm of 5 April 2003 (courtesy of A. Bertagnini); (g) flattened bomb observed along Ginostra trail after the paroxysm of 3 July 2019 (A. Bevilacqua ph.); (h) impact crater found in Rina Grande area after the major explosion of 13 May 2022 (P. Landi ph.). The small map (i) indicates the sites of the photos.
Our analysis relies on the critical study of all available documentation of past events, fully reported in Bevilacqua et al. (2020a, 2023) and detailed in Sect. 3. In particular, we schematically mapped the area reached by ballistic projectiles by using circular sectors that envelope the areas affected by ballistic projectiles as deduced from the field reports, the surveillance cameras' reports and the tele-photos. Sites of fire ignition, field observations made by the authors of this study, and witness testimonies, were useful complementary information, keeping in mind that unreliable testimonies could introduce wrong pieces of information, and that incandescent pumice fallout may also be able to set fire on dry vegetation.
The approach that we followed for mapping past ballistic distributions involved some assumptions and limitations:
-
the projectile distribution is reconstructed based on all available ground and remote observations. No specific assumptions regarding the conditions of the explosive mixture at the source, nor any descriptive models of projectile dynamics, were used in the definition of the areas affected, although available knowledge on projectile dynamics in the literature was considered in defining the lower limit of the clast size (de'Michieli Vitturi et al., 2010; Vanderkluysen et al., 2012; Valentine et al., 2012; Taddeucci et al., 2013, 2017; Tsunematsu et al., 2015; Bertin, 2017; Massaro et al., 2022).
-
We focused on the maximum distances and dispersion directions concerning the potentially most dangerous projectiles, i.e., lithic and scoria clasts larger than about 5–10 cm in diameter. Smaller clasts and pumice fallout were not considered.
Our historical reconstructions do not quantify the areal density of the projectiles, and exclusively describe the areas affected by ballistic fallout. The areal density distribution of the projectiles which is highly variable, e.g. up to 2 orders of magnitude depending on the distance from the crater (Gurioli et al., 2013; Breard et al., 2014; Bisson et al., 2023; Bevilacqua et al., 2024; Schmid et al., 2025), was not considered in this analysis, although it is important for impact assessments.
2.1 Reconstructing the areas affected by ballistics of past major explosions and paroxysms
Circular sectors approximately represent the areas affected by ballistics because this geometry mirrors, at a first order, the envelope of the trajectories of projectiles that are radially ejected from a central eruptive vent. Moreover, the great majority of the pre-existing maps were roughly shaped in that way. In fact, they consisted of one or more hand-drawn lobes enlarging further from the vents (Bertagnini et al., 1999; Rosi et al., 2006), open half-ovals (Andronico and Pistolesi, 2010; Rosi et al., 2013), or arched isoline segments (Pistolesi et al., 2011; Giordano and De Astis, 2021). A few pre-existing maps resembled ovals or irregular segments (Coltelli et al., 2000; Giordano and De Astis, 2021) which we replicated by using a circular sector plus a proximal axisymmetric part, as described in the following sections.
However, this approximation is uncertain, and most pieces of information on ballistic dispersal are imprecise, for several reasons:
-
named localities or trail paths lack of geographic coordinates;
-
distance or altitude values are commonly expressed in multiples of 100 m;
-
most recognizable projectiles are described but others could not be excluded nearby; as a consequence, a measurement of the areal density of projectiles is rarely provided;
-
ignited fires possibly started by ballistic fallout are described but the actual ballistic source was not determined;
-
access to the summit areas after the eruptions is limited to a few trails and depends on safety conditions, and observations are often carried out in haste and from a distance;
-
observations from remote locations (e.g., villages) are affected by perspectival errors;
-
distances and angles are often, but not always, related to the vent ejecting the projectile, which can differ from case to case;
-
observations are often collected days to months after the explosion has occurred.
Importantly, the number of projectiles per unit area was most of the times hard to evaluate, and therefore our reconstructions cannot be read in terms of isolines of projectile density or of ground cover percentage. Unobserved, broken, or unrecognized projectiles of small size are a significant limitation to such measurements. In fact, witnesses did not easily provide quantitative information, and, as a result, only the greatest or the most damaging projectiles are usually mentioned. As a consequence, in our estimates we focused on the areas affected by ballistic fallout with no information on the areal density also due to this difficulty.
Depending on the accuracy and reliability of the information sources, we also assigned the past events to different “uncertainty classes” as detailed in the sequel. We classified the information of past events in three types:
-
constraints on radial distance (radially affected areas);
-
constraints on direction, only at low elevation (affected sectors);
-
constraints on radial distance and direction (affected locations);
-
pre-existing maps of affected area, possibly incomplete or incorporating lapilli fallout.
In Fig. 2 we sketched examples of how these four types of information were utilized to draw circular sectors. By utilizing circular sectors, we assumed that if a location was affected by ballistics, also the segment between that place and the vents was considered affected. This assumption was conservative against possibly rolling and bouncing projectiles, but it also considered that the available records may have primarily reported the farthest projectiles from the eruptive vents, which determined an impact in the inhabited or frequented areas.
In Fig. 2a we show an example constraint on radial distance, in all directions. In fact, to every major explosion and paroxysm we assumed that there is a minimum proximal circular area affected by ballistics, but some explosions were described to have been radially greater. This was a relatively uncommon type of constraint: only ca. of major explosions and of the paroxysms maps assumed such a larger circular area.
In Fig. 2b we show an example constraint on sector direction at low elevation, assumed in mapping of the paroxysms and not for major explosions. In fact, we know that some historical paroxysms affected a flank of the volcanic edifice, an inhabited area, or its cultivated land, without further information. For of the paroxysms this happened in the direction where the ballistics were observed farthest from the vents. In this case, a circular sector was defined in a way that the lateral sides enveloped the mentioned area (e.g., inhabited areas, cultivated lands, burned areas); its radius was left significantly uncertain (more details in Table 1, high uncertainty class).
In Fig. 2c we show an example constraint on specific sites or areas. A circular sector enveloping the affected region is defined, centered on the center of Crater Terrace. When multiple observations of this type were made in different sites, separate sectors were distinguished if the distance was significantly different (with respect to a precision of 100 m). This is the most common type of information, available in of the paroxysms, and of major explosions.
In Fig. 2d we show an example constraint based on a pre-existing map of ballistic dispersion. Only ca. of the considered paroxysms and of the major explosions were previously mapped. In these cases, we followed a conservative approach, and fully enveloped the mapped area within the uncertainty buffer of one or more circular sectors.
2.2 Mapping of ballistic projectile distribution with uncertainty assessment
Our statistical analysis of distance and direction is expressed in polar coordinates, with the center located at 518400° E, 4293900° N, UTM WGS84, Zone 33N, that is approximately the center of the Crater Terrace. In fact, the involvement of distinct and/or multiple craters in the different events is included in the radial uncertainty detailed below. Note that all vents are generally located within ca. 100–150 m from this center. In each simplified map, a proximal axisymmetric part was defined, followed by 1 to 3 circular sectors with greater distance ranges. Craters' architecture, possibly modified by the most intense explosions, as well as shielding obstacles and differences in elevation are possible factors in determining these asymmetric features, although at Stromboli these were mostly studied for smaller events than major explosions (e.g., Valentine et al., 2012; Taddeucci et al., 2013; Iezzi et al., 2023). The proximal axisymmetric part was a circle determined by just a radial distance and the circular sectors were characterized by radial distances, the azimuth angles of the bisector and the half-width angles. These measurements are all reported in Tables S1 and S2.
While we tailored these sectors as tight as possible on the existing data or the pre-existing maps, this in a few cases produced a slight enlargement, up to ca. 100 m for major explosions and 200 m for paroxysms, of the areas affected by the ballistic fallout. These uncertainties are consistent with the uncertainty classes defined in the sequel.
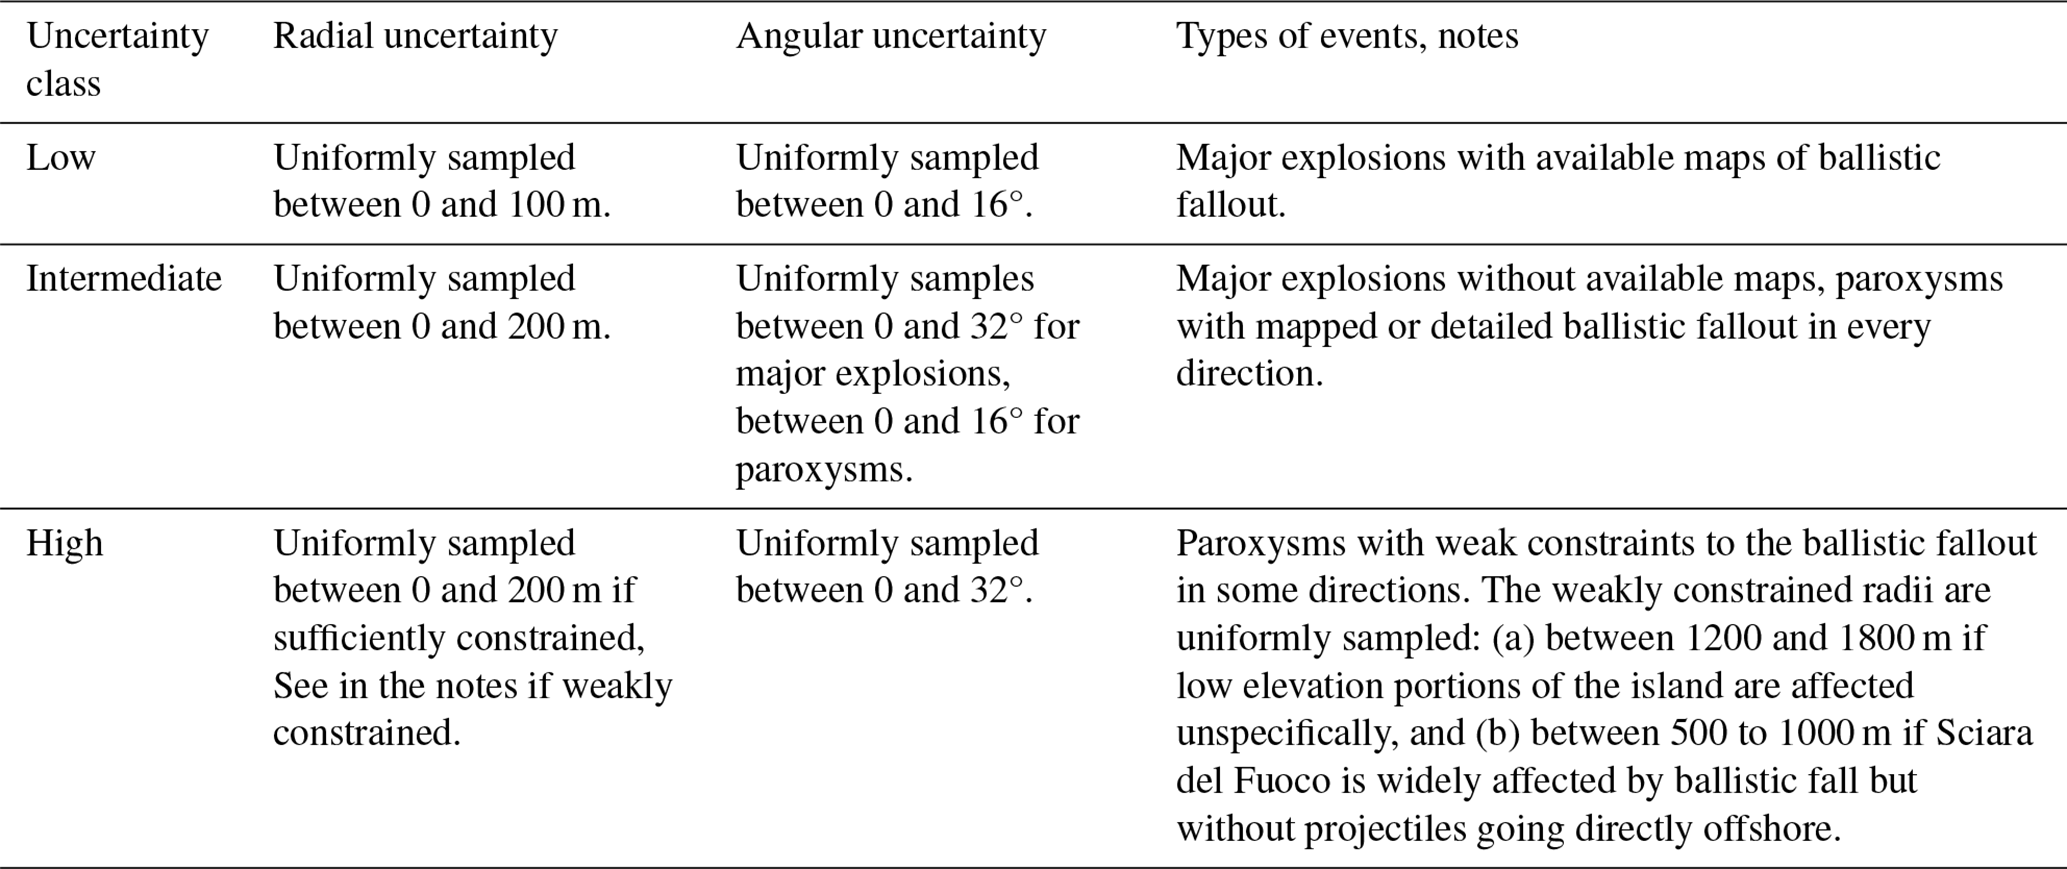
Three classes of uncertainty on radii and angles were considered: low uncertainty (just for the major explosions of which any maps of ballistic fallout were available), moderate uncertainty (for both the major explosions and the paroxysms of which the ballistic fallout has been fully described all around the source), and high uncertainty (for some of the historical paroxysms that have weak constraints to the ballistic fallout in some directions).
In the low uncertainty class, a uniform uncertainty between 0 and 100 m was assumed on all radial distances, equivalent to a mean enlargement of 50 m. In fact, our field experience led us to estimate within 100 m the accuracy of many of the past field observations missing geographical coordinates and the capability to recognize a ballistic bomb from distance. Moreover, this is also approximately the radial size of Crater Terrace, where all active vents are located.
In the moderate and high uncertainty classes the field observations on radial distance were not pinpointed to any specific modern reference site, and therefore we assumed doubled this uncertainty, i.e, we produced a mean enlargement of 100 m. Such distance uncertainty was also translated to an equivalent angular uncertainty by considering the length of circular arcs drawn at approximately the average maximum ballistic distance (i.e., ca. 700 m for major explosions and 1400 m for the paroxysms).
Finally, the high uncertainty class stood again for a mean enlargement of 100 m in each sector for which a specific distance value was available in literature, but, in addition, denoted greater uniform errors in the sectors where the lower portions of the island had been affected by ballistic projectiles, but no precise distance values were specified.
In general, we expressed the radial and the angular uncertainties as independent uniformly distributed variables, with a range of variability depending on the class of uncertainty of the corresponding event, as reported in Table 1.
In Figs. 3 and S2 we describe a few illustrative examples of ballistics maps following the described strategy, showcasing the four typologies of data constraints described above and the three classes of uncertainty (low, intermediate, high); Files S1 and S2 in the Supplement provide a complete description of all the 67 mapped events. We remark that, ultimately, this analysis process adopts expert judgment to transform diverse observational data into a dataset of simplified maps able to capture the first-order characteristics of the dispersal process. In doing this, we aimed at keeping things as simple as possible to maintain full transparency on our choices and ease the replicability of our maps and results.
2.3 Analysis of maximum distance, direction and area affected by ballistic projectiles
For each sector of each explosion, a Monte Carlo simulation is performed with respect to uncertainty sources, sampling independently the radial and angular uncertainties. This enables the production of doubly stochastic probability percentages, density functions, exceedance probability functions, all affected by uncertainty and expressed in terms of 5th, mean and 95th percentile values (Sparks and Aspinall, 2004; Marzocchi and Bebbington, 2012; Bevilacqua et al., 2015). We note that the random enlargement of the circular sectors can appropriately reduce the size of adjacent sectors defined over a different distance, if the latter is shorter.
In particular, for every distance threshold d>0 m, the exceedance probability function of the maximum ballistic distances in all directions is calculated as:
where j is uniformly sampled in 1,..., N, and i is sampled among the number of sectors of explosion j-th, weighted in proportion to °, where N is the total number of the explosions in the dataset and Wij is the width of the sector. In this formula, the width of the axisymmetric part is defined as the complement to 360° of the union of all the sectors.
Similarly, for every angle θ in [0, 360°], the ballistic direction probability percentage is:
where αij and Wij are the bisector azimuth and the width values of the i-th sector of the j-th explosion, and N is the total number of the explosions in the dataset. This calculation is done while not considering the axisymmetric part.
By numerically implementing these formulas, and by using the measurements collected in Tables S1 and S2 in the Supplement, we randomized 1000 array realizations of the radii, bisector directions, and sector widths of every circular sector from every major explosion and paroxysm that we mapped. With these arrays, first we calculated empirical binned statistics of these variables by counting the number of realizations in appropriate domain partitions. Then, we plotted the probability density functions (PDF) of each array realization by applying a Gaussian Kernel density estimator, and also the cumulative density functions (CDF) of the radii, and probability percentages of the ballistic directions, by numerical integration of the PDFs. Notably, when dealing with angular data we worked on a periodic domain. Finally, we point wise estimated the mean values, the 5th and 95th percentiles of these PDFs and CDFs, to express the uncertainty effects. The main scripts are attached in Bevilacqua and Neri (2026).
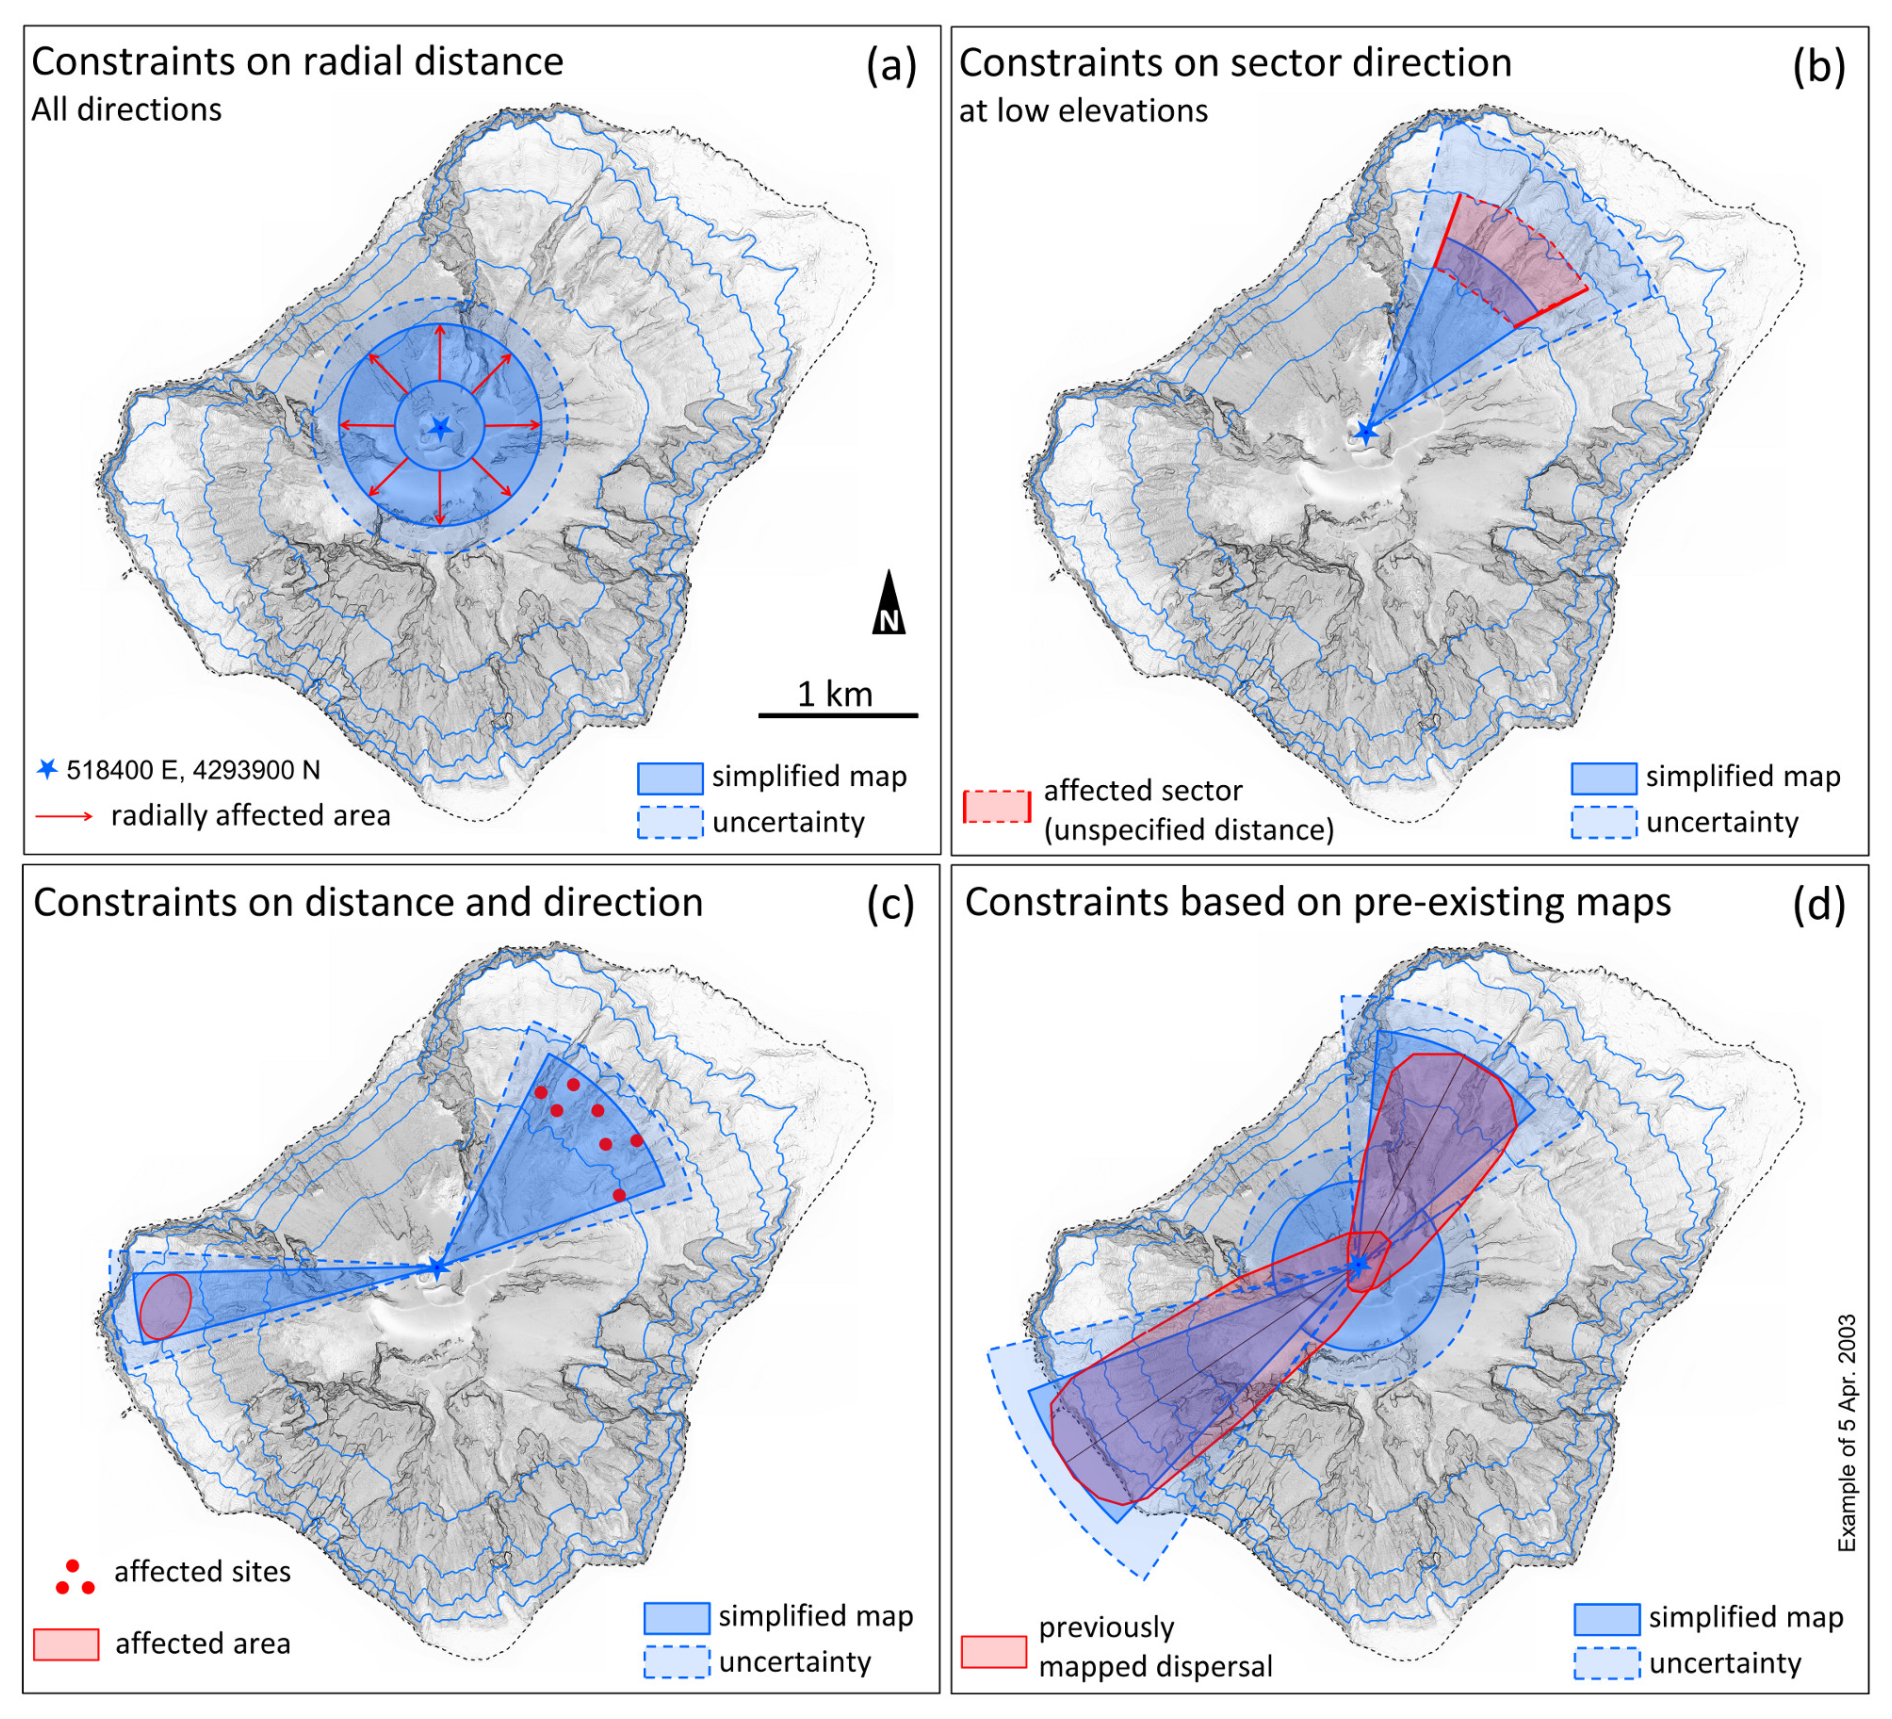
Figure 2Examples of simplified mapping data on: (a) affected radius, (b) affected sectors at low elevation, (c) affected sites or areas, (d) pre-existing maps of ballistic dispersion. The red arrows, shapes, and dots indicate the spatial observation data processed. The solid blue circular sectors show the areas assumed as affected, and the dashed blue shapes are the areas uncertainly affected. A blue star marks the center of Crater Terrace.
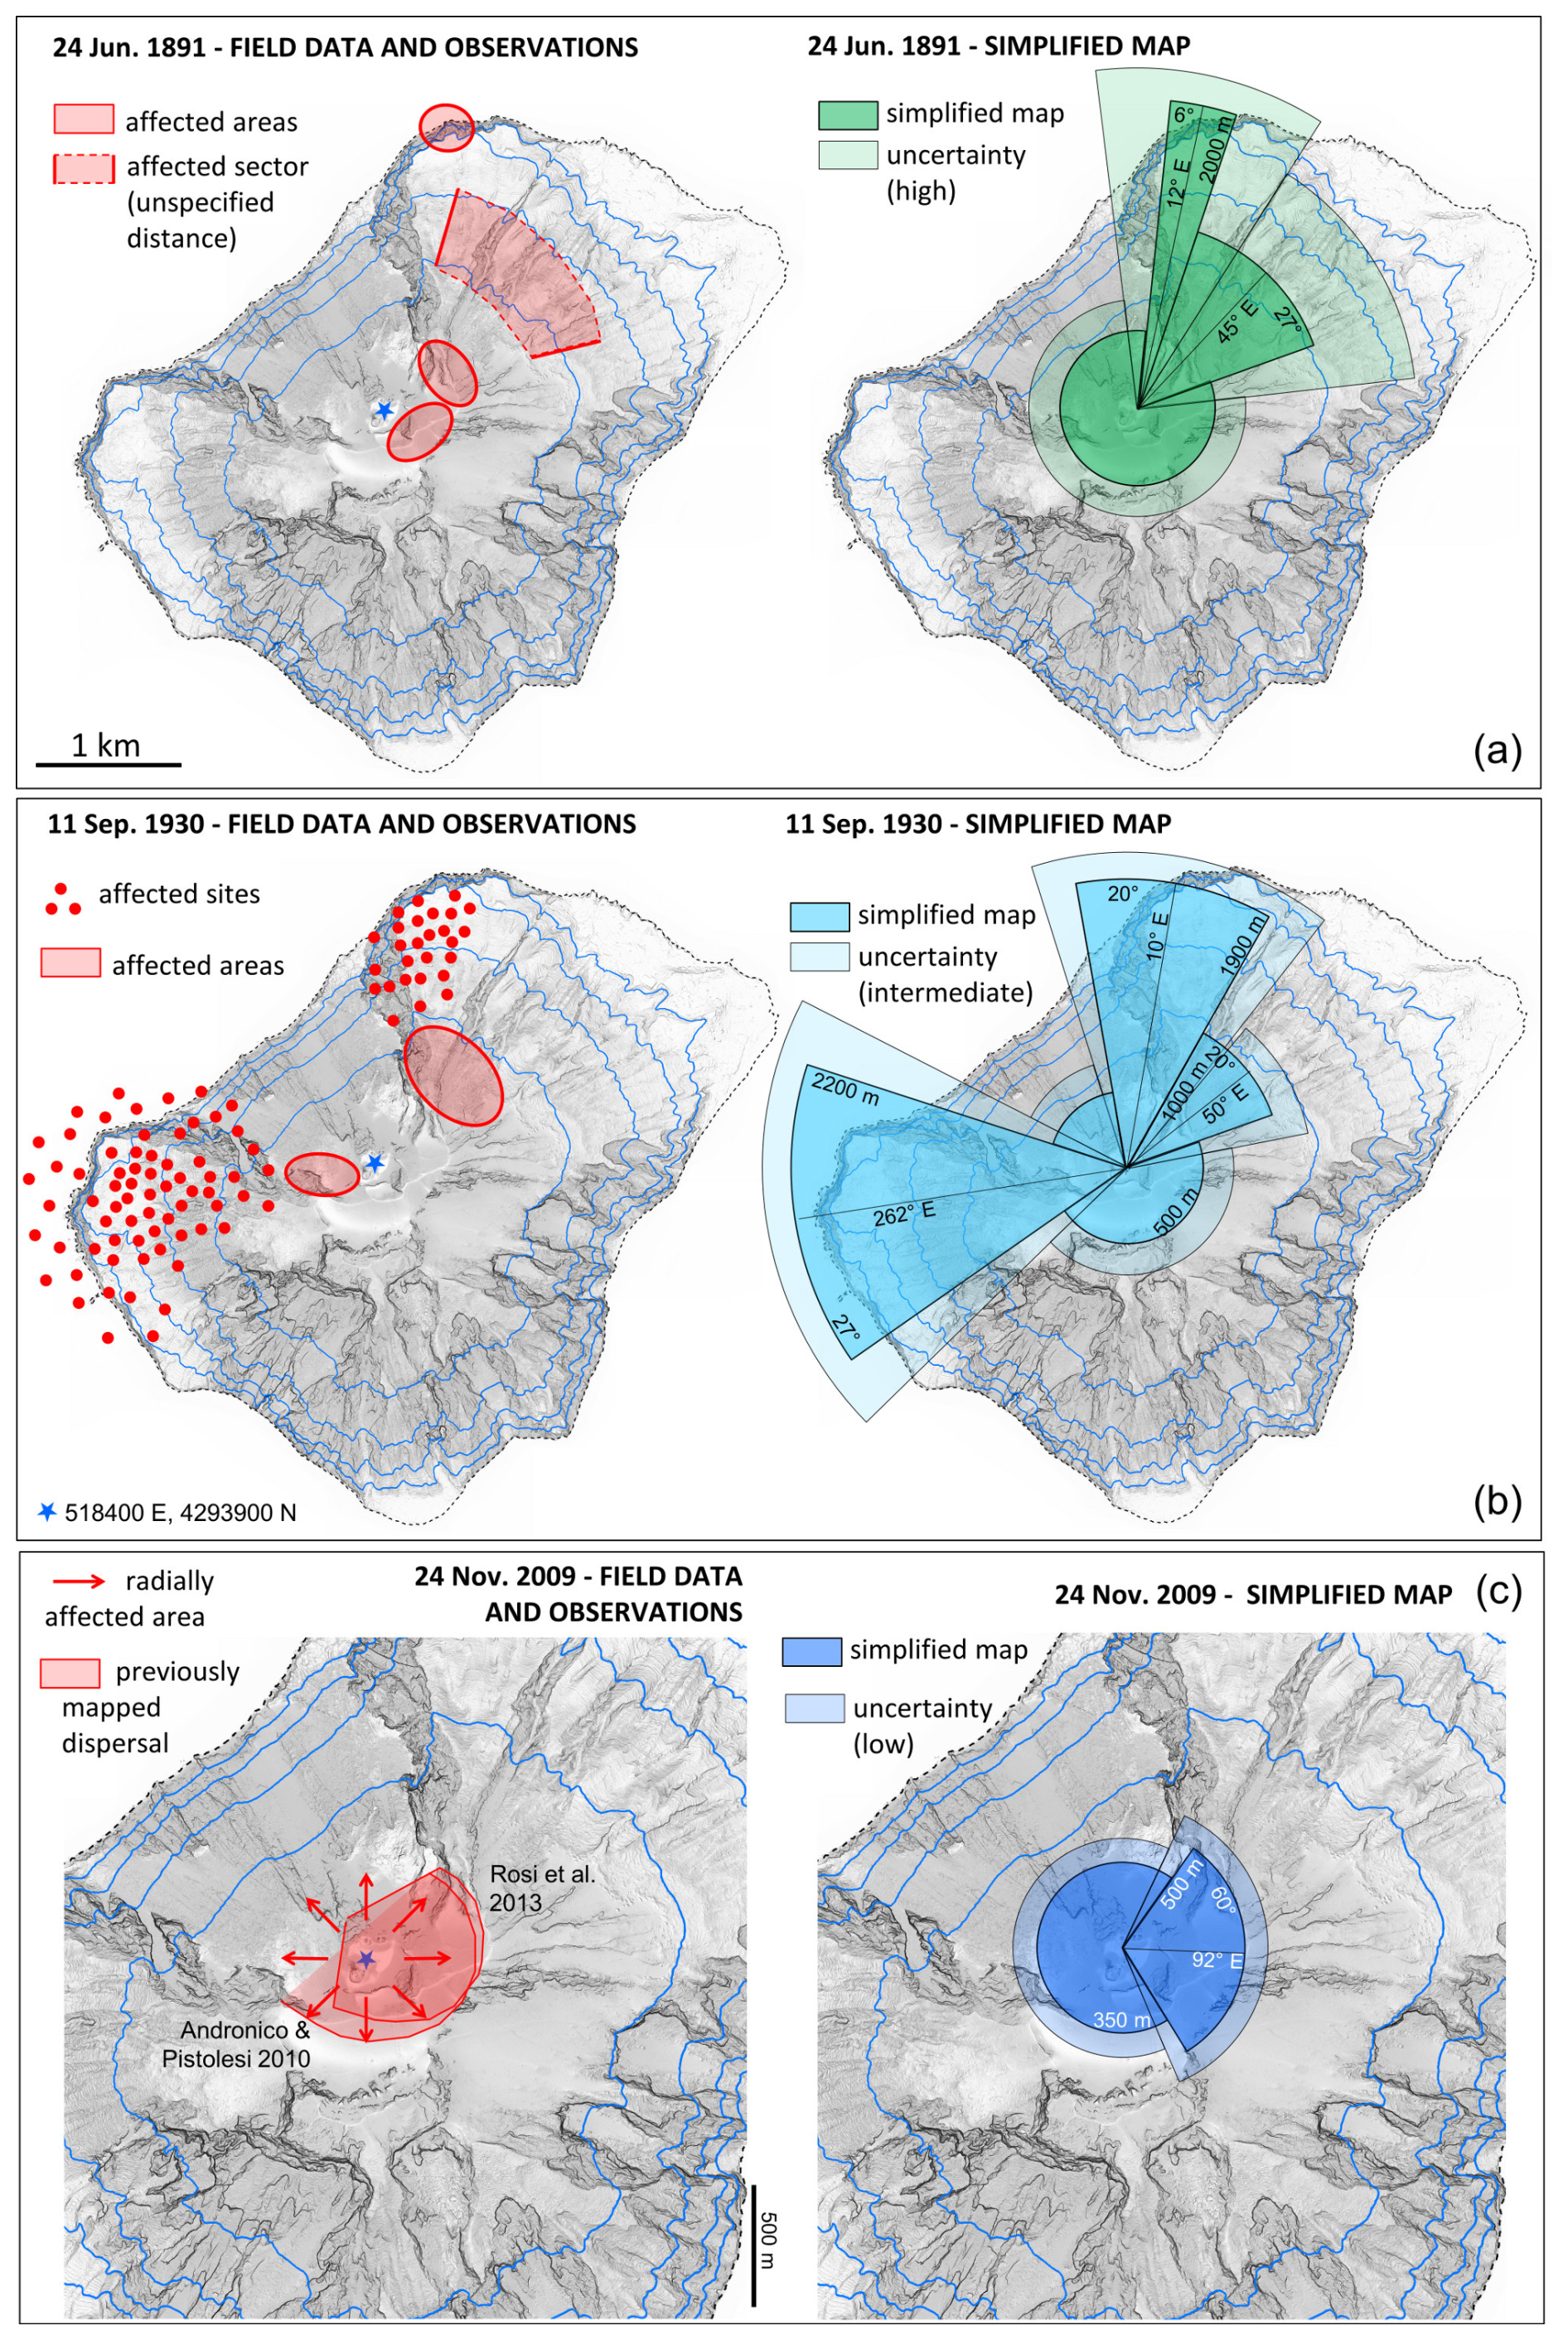
Figure 3Three examples of field data (left) and resulting simplified maps (right) of the areas affected by ballistics, including measurements of maximum distances, directional angles, and sector widths. See also Files S1, S2 and Tables S1, S2. Different hues indicate different uncertainty classes: blue for low, azure for intermediate, green for high uncertainty. The boundary areas in lighter colors around each sector represent the uncertainty considered.
Table 1Summary of the uncertainty classes associated with the ballistic maps.
In this study, we analyze two open INGV catalogs of major explosions and paroxysms at Stromboli, summarized in Fig. 4. The first catalog (Bevilacqua et al., 2020a), named “historical catalog”, is the review of more than a hundred scientific literature sources from 1879 to 1960. The ballistics of the major explosions listed in the historical catalog are not possible to map, only those of some of the historical paroxysms are mappable. No major explosion or paroxysm has been recorded between 1960 and 1970. The second catalog (Bevilacqua et al., 2023), named “recent catalog”, is the detailed review of monitoring bulletins and reports, previous catalogs, and scientific literature of the last ca. 50 years, i.e. the period from 1970 to 2023 (more details in the Open Research Statement and in Files S1 and S2). It should be noted that the catalogued record is possibly affected by under recording of major explosions occurred between 1960 and 1985, due to the cessation of military observations on Stromboli.
The historical catalog and a preliminary recent catalog up-to-date at 31 August 2020 were both statistically analyzed in terms of inter-event times, cluster analysis and annual rates in Bevilacqua et al. (2020b). The new version of the historical catalog analyzed here was released in January 2024 and includes a few additional events due to further bibliographic research, i.e., 4 paroxysms, 2 major explosions, 4 uncertain major explosions. Similarly, the recent catalog used here differs from the data analyzed in Bevilacqua et al. (2020b) in that the former includes ca. 3 years of new events and a more detailed description of the major explosions and of the uncertain major explosions, which was essential for mapping the ballistic projectiles distribution. In both INGV catalogs we acknowledge the incorporation of all the information contained in previous datasets of explosive activity at Stromboli, e.g., Barberi et al. (1993), Jaquet and Carniel (2003), Falsaperla and Spampinato (2003), Rosi et al. (2013), Calvari and Nunnari (2023), after the investigation of the original sources that first-hand described the phenomena, and that are summarized in Files S1 and S2 for what concerns the ballistic fallout.
3.1 Collection of simplified maps of ballistic projectile distribution of major explosions
The recent catalog encompasses 51 major explosions and 34 uncertain major explosions, i.e. explosions of unclear characterization that could have been major explosions or ordinary activity. We mapped the areas affected by ballistic fallout for the majority of explosions included in this recent catalog. In detail, we managed to map 43 events, i.e., ca. 85 % out of the 51 major explosions.
The collection of 43 mapped major explosions is made of 37 % low uncertainty maps, and 63 % intermediate uncertainty maps, all reported in Figs. 5 and 6. Of these maps, 5 % include three sectors, 33 % two sectors, 62 % one sector. In just one event, i.e. 2008-B, the distribution is radial and we mapped it by one full circular sector with a radius equal to its axisymmetric part. In 23 % of the mapped major explosions one of the sectors is directed towards Sciara del Fuoco, but in 56 % the information about the ballistic distance in Sciara del Fuoco is unclear. Therefore, under-recording of ballistics projectiles in Sciara del Fuoco may be significant for major explosions.
In Fig. S4 we report the chart overly, and map the percentage, of all the 43 maps of past major explosions whose ballistic fallout affected each spatial point. Please note that, because this simple approach does not handle possible under recording in the least accessible parts of the island, it should not be considered a full hazard estimate yet. More details are provided the companion paper Bevilacqua et al. (2026).
3.2 Collection of simplified maps of ballistic projectile distribution of paroxysms
The historical catalog Bevilacqua et al. (2020a) describes 36 paroxysms and the recent catalog Bevilacqua et al. (2023) describes 4 paroxysms. We mapped 20 out of 36 historical events and all the recent events, i.e., ca. 60 % of the paroxysms from 1879 to 2023. The collection of 24 mapped paroxysms encompasses 33 % intermediate uncertainty maps and 67 % high uncertainty maps, all reported in Fig. 7. Of these maps, 21 % include three sectors, 54 % two sectors, and 25 % one sector. In 54 % of the mapped paroxysms one of the sectors is directed towards Sciara del Fuoco and in 24 % the information on the ballistic distance in Sciara del Fuoco is not specifically quantified. The under-recording of ballistics ejected towards Sciara del Fuoco is therefore likely also for the paroxysms; it should be noted that to the NW, any ballistics falling further than about 1200 m would be in the sea (see Fig. 1), and they could be documented only if their trajectory was directly observed during the eruption. In Fig. S5 we report the superimposition, and map the percentage, of all the 24 maps of past paroxysms whose ballistic fallout affected each spatial point. More details in Bevilacqua et al. (2026).

Figure 4(a) Historical catalog of major explosions and paroxysms at Stromboli from 1879 to 1960, (b) recent catalog from 1970 to 2023. Black bars mark the major explosions including the uncertain major explosions, and red bars mark the paroxysms. Below the bar plots, the time intervals described in the key literature sources labeled, fully listed in Files S1 and S2, are reported. Figure S3 shows the catalogs without the uncertain major explosions; Table S3 lists the full explosion record of the two catalogs.
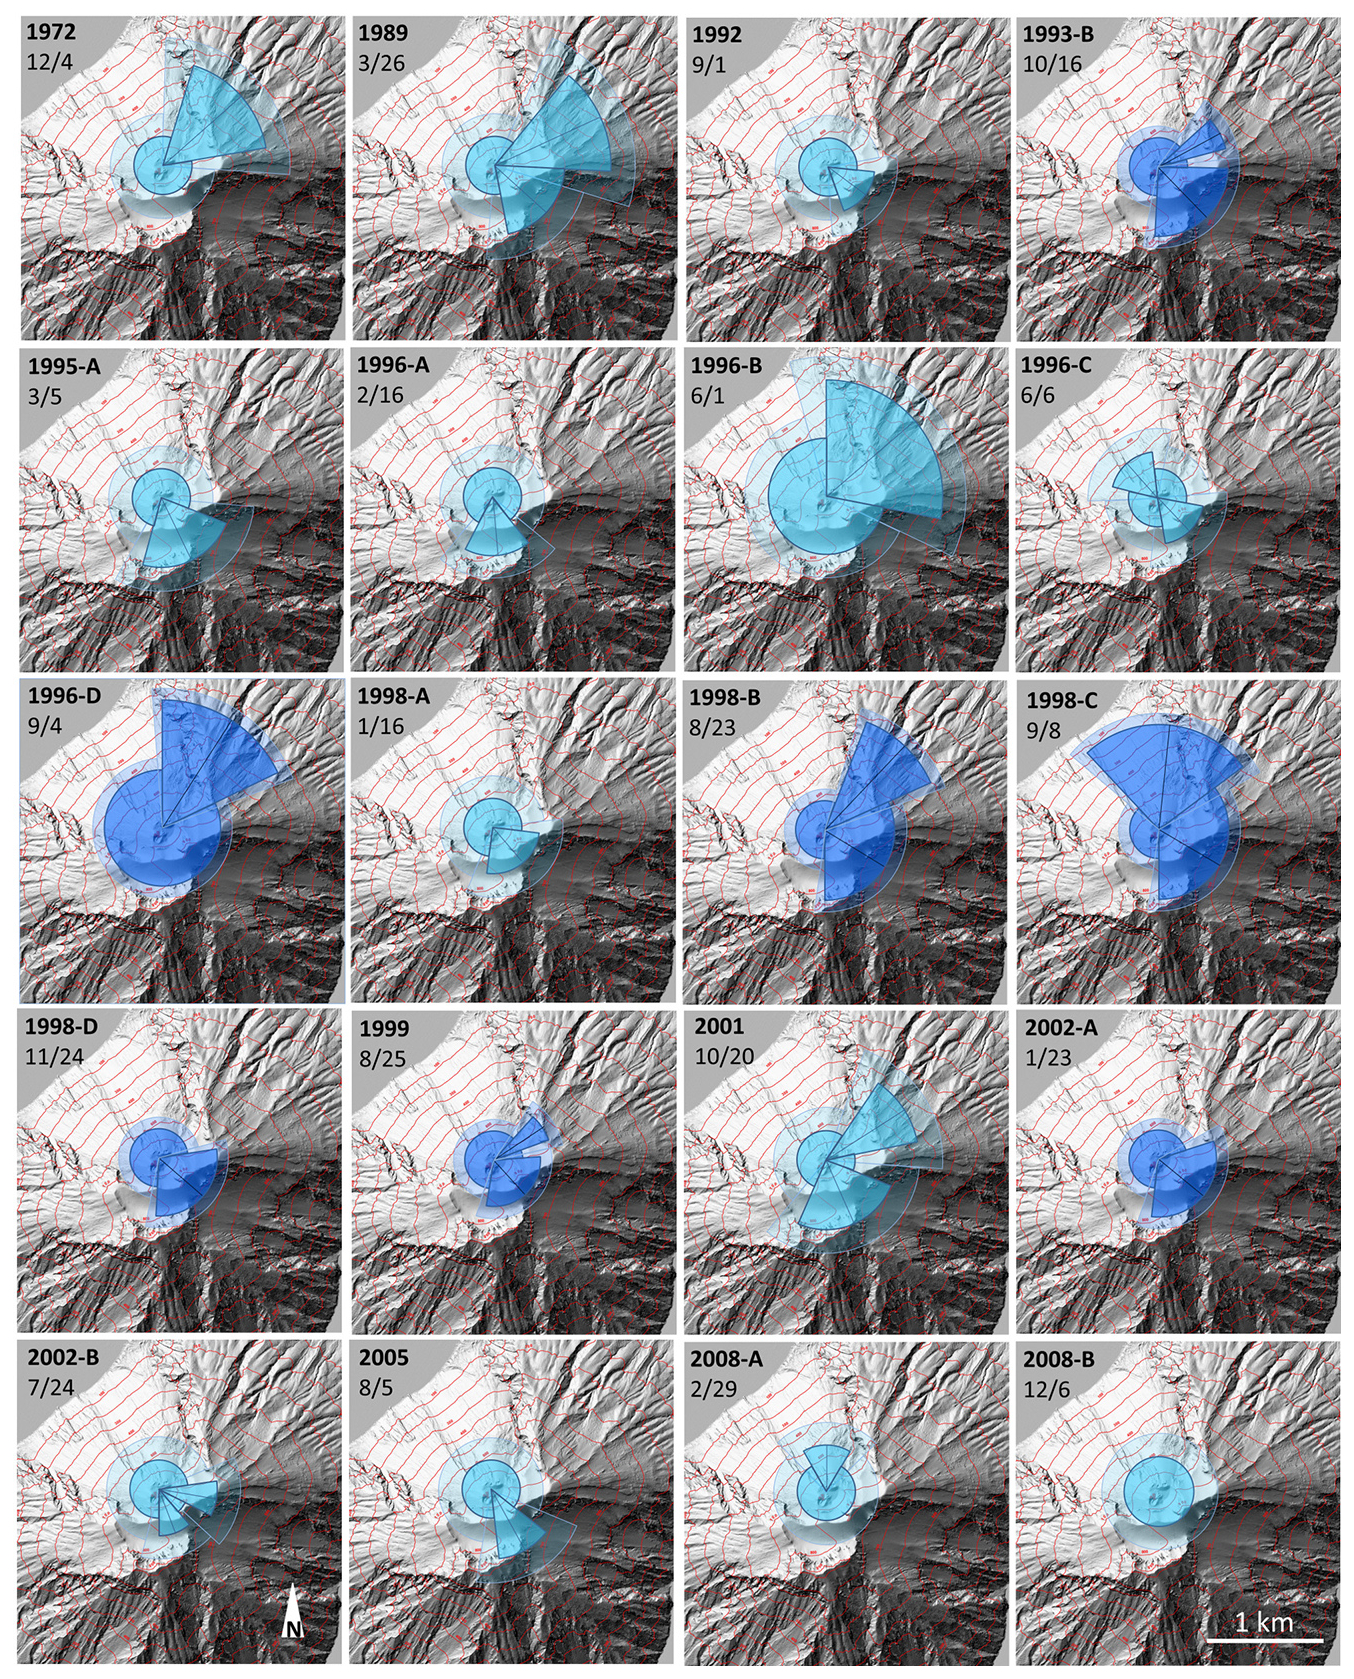
Figure 5Simplified spatial maps of the areas affected by ballistic projectiles for 20 major explosions from 1970 to 2008. Different hues indicate different uncertainty classes: blue for low, azure for intermediate uncertainty. Lighter color areas mark the uncertainty considered. In Table S1 are reported the distances and angles of the sectors of all events considered and labeled as in the figure. Maps detailed in File S1.

Figure 6Simplified spatial maps of the areas affected by ballistic projectiles for 23 major explosions from 2009 to 2023. Different hues indicate different uncertainty classes: blue for low, azure for intermediate uncertainty. Lighter color areas mark the uncertainty considered. In Table S1 are reported the distances and angles of the sectors of all events considered and labeled as in the figure. Maps detailed in File S1.
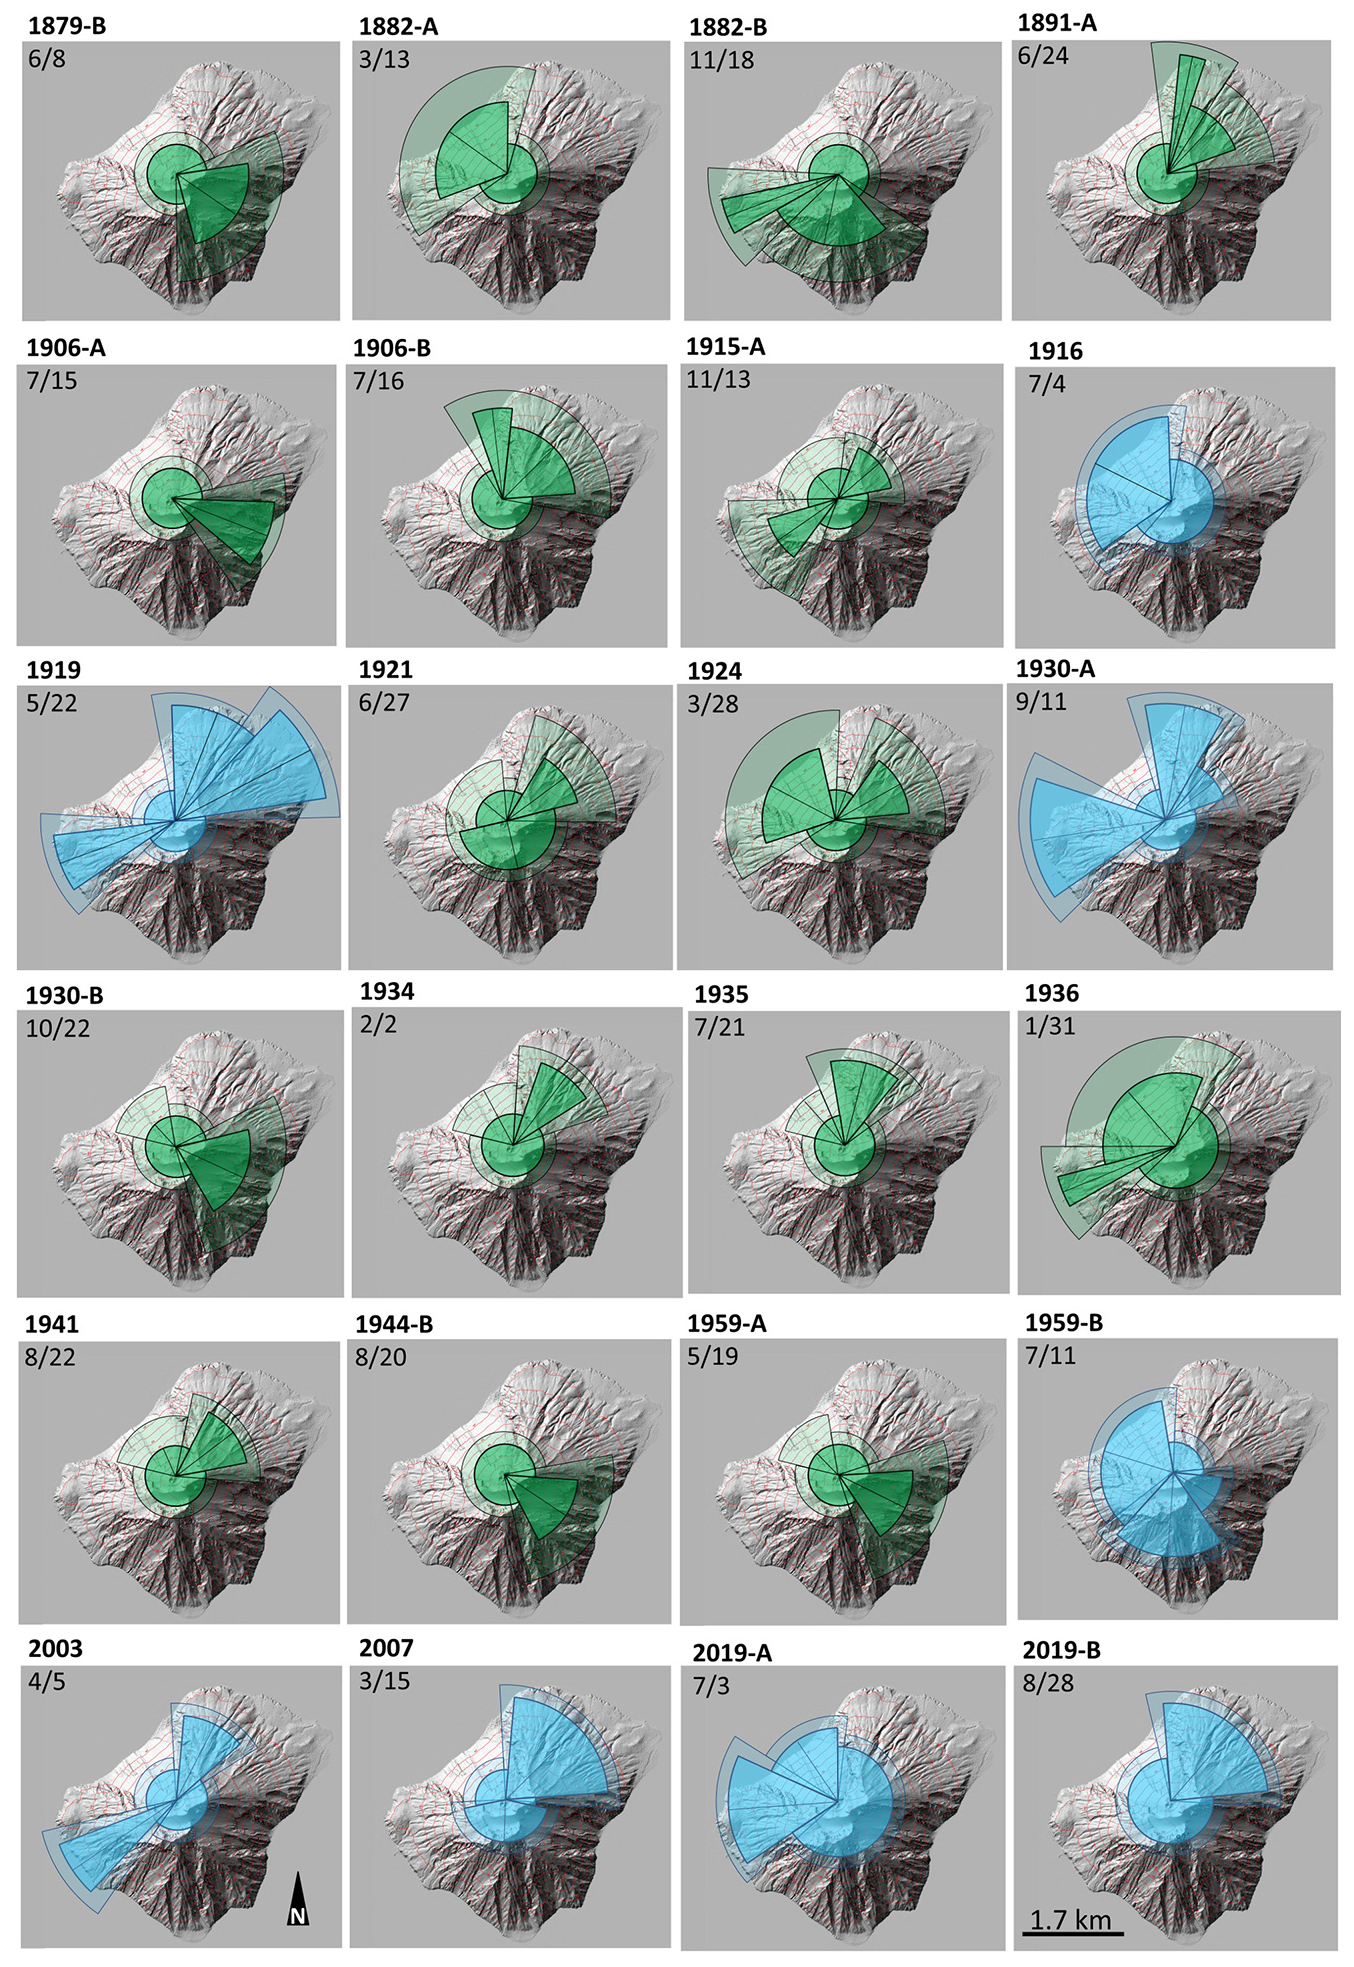
Figure 7Simplified spatial maps of the areas affected by ballistic projectiles for 24 paroxysms. Different hues indicate different uncertainty classes: azure for intermediate, green for high uncertainty. Lighter color areas mark the uncertainty considered. In Table S2 are reported the distances and angles of the sectors of all events considered and labeled as in the figure. Maps detailed in File S2.
4.1 Statistical description of the distance of ballistic projectiles
Figure 8 describes the distribution of the maximum distances of ballistic projectiles from the center of the Crater Terrace in each specific event considered. In particular, Fig. 8a and b list the maximum distances reached in major explosions and paroxysms, respectively, and indicate the 90 % uncertainty intervals of the probability estimates. These data are plotted chronologically, while Fig. S6 shows the same data plotted in ascending order. It should be noted that our uncertainty ranges are only on the right side of the intervals because they represent an incremental buffer around the circular sector, and not a reduction of its area. Also, in Fig. 8b the uncertainty ranges related to the high uncertainty class of paroxysms, i.e., the green dots, differ as a function of the type of information that constrains the distance, i.e., if in terms of an affected location or more generically as an affected sector at low elevation (see Fig. 2 for more details).
The following percentage estimates are evaluated by counting the events in a Monte Carlo simulation that uniformly sampled the distance uncertainty. Figure 8c summarizes that in 23 % to 37 % of the major explosions the maximum distances were less than 500 m; in 51 % to 65 % they were above or equal to 500 m but less than 1000 m; in 12 % to 14 % above of 1000 m. Figure 8d summarizes that in 17 % to 42 % of the paroxysms the maximum distances were less than 1500 m; in 29 % to 54 % they were above or equal to 1500 m but less than 2000 m; in 25% above of 2000 m but less than 2500 m; in 4 % above 2500 m. It should be noted that in both the collections of major explosions and paroxysms there is a greater uncertainty on the maximum distances of small-size events, than of the large-size events. Table S4 summarizes all the described values.
Finally, Fig. 8e shows the combined exceedance probability functions obtained by sampling from the distances in Fig. 8a and b, and by weighting the paroxysms 12 % of the total, which is the event ratio recorded in Tables S1 and S2 from 2003 to 2023. It should be noted that the fraction of paroxysms with respect to the total of major explosions and paroxysms would decrease to 7.3 % if evaluated between 1970 and 2023, because of the complete absence of paroxysms between 1959 and 2003 (Bevilacqua et al., 2020b). This plot represents the continuous distribution of maximum distances of the two phenomena.
Figure 9 considers the ballistic distances in all dispersal sectors chronologically, i.e., 61 sectors for the major explosions, in Fig. 9a, and 47 sectors for the paroxysms, in Fig. 9b. Figure S6 shows the same data plotted in ascending order. It should be noted that the same explosion possibly achieved different distances in each sector because of the asymmetrical features described in Files S1 and S2, and therefore up to three values can correspond to the same explosive event. In this way, the distances are statistically lower than in Fig. 8, and there are more distance values than the number of events, because the description of the ballistic projectiles distribution is not limited to the maximum distance. Moreover, this description equally counts all sectors, regardless of their width, and it does not consider the axisymmetric part of the explosions.
In Fig. 9c and d, we plotted the exceedance probability functions obtained by sampling from the distances in Fig. 9a and b after weighting the sectors according to their width. For the major explosions, we obtained a probability of 64 % ± 6.5 % to exceed 500 m, of 18 % ± 4.5 % to exceed 750 m, and of 8 % ± 1.5 % to exceed 1000 m. For the paroxysms, we obtained a probability of 79 % ± 2.0 % to exceed 1000 m, of 48 % ± 11 % to exceed 1500 m, of 13 % ± 2.0 % to exceed 2000 m, of 1.5 % ± 0.5 to exceed 2500 m. All these estimates do not consider the proximal axisymmetric part; if we include it, thus fully representing the distribution of mapped ballistic distances in all directions, this produces probabilities of exceedance up to ca. 3 times lower, and reported in Table S4. Figure S7 shows the exceedance probability only of the maximum distance, and only of the proximal axisymmetric part.
4.2 Statistical description of the direction of ballistic projectiles
Figure 10 shows the range graphs and probability percentage of ballistic sectors directions. This was done while not considering the proximal axisymmetric part, because otherwise the statistics would have covered a round angle for every explosion. Figure 10a details the range graphs of the 61 sectors of 43 mapped major explosions from 1970 to 2023. In this case, 57 % of the circular sectors have bisectors in the SE quadrant, 30 % in the NE quadrant, 10 % in the NW quadrant, 1.5 % in the SW quadrant and 1.5 % have no preferential direction. Table S4 summarizes all the described values. We note that the paroxysms in 2003 and 2007 were followed by a general shift towards N in the directions of the next major explosions; this did not happen after the paroxysms occurred in 2019. Similarly, Fig. 10b details the range graphs of the 47 sectors of 24 mapped paroxysms from 1879 to 2023. In this case, 34 % of the bisectors fell in the NE quadrant, 30 % in the NW, 21 % in the SW and 15 % in the SE quadrant.
In Fig. 10c and d we plotted the probability percentage of the ballistics directions, as a function of the azimuth angle. Figure 10c shows the probability percentage of the ballistics directions for major explosions. The function has a maximum of 77 % ± 2 % at 140° E ± 10°, i.e., in the SE direction, and a minimum of 0 % at 250° E ± 10°, i.e., in the SW direction. This latter value may be affected by some under-recording of major explosions in the SW direction. The angular uncertainty in these estimates is equivalent to the width of the maximum values in the 95th percentile plot. We observe that the uncertainty affecting the aggregated data can be smaller than on the single pieces of data, because of the independent sampling. Figure 10d shows the probability percentage of the ballistics directions for paroxysms. The function has a maximum of 70 % ± 9 % at 355° E ± 10°, i.e., in the N direction, and a minimum of 19 % ± 2% at 175° E ± 10°, i.e., in the S direction. In addition, a plateau above 50 % is observed from NE to W clockwise. It should be noted that major explosions and paroxysms are dispersed in significantly different directions, due to the complex interplay of conduit and craters' architecture, and the different scales of these events, in terms of magma volume and energy. Figure S8 shows the results only considering the sectors of maximum distance. See Table S4 for more details.
4.3 Statistical description of the total area of ballistic projectiles distribution
Figure 11 shows the histograms of the width of the circular sectors and of the total area affected by projectile fallout. Figure 11a and b do not consider the proximal axisymmetric part, and just focus on the circular sectors. In particular, Fig. 11a is the histogram of the width of the 61 sectors of 43 mapped major explosions from 1970 to 2023. The mean width value is 90°, with 5th percentile of 41° and 95th percentile of 136°. Similarly, Fig. 11b is the histogram of the width of the 47 sectors of 24 mapped paroxysms from 1879 to 2023. In this case the mean width value is again 90°, with 5th percentile of 33° and 95th percentile of 183°. In fact, the sectors of the paroxysms have a similar average width to the sectors of the major explosions, but sectors wider than 150° are only observed for the paroxysms. Figure S3 shows the histogram of the width only of the sectors of maximum distance.
Figure 11c and d are the histograms of the total area affected by ballistics of major explosions and paroxysms, respectively. The mean area value of major explosions is 6.9 × 10⁴ m2, with the 5th percentile of 3.3 × 10⁴ m2 and the 95th percentile of 14.8 × 10⁴ m2. The mean area of paroxysms is 3.6 × 10⁵ m2, with the 5th percentile of 2.0 × 10⁵ m2 and 95th percentile of 6.1 × 10⁵ m2. These values are 4 to 6 times larger than those of major explosions. The histogram of major explosions total area is characterized by a relatively longer tail than the histogram of paroxysms, and this tail is partially overlapping with their values. In fact, in the former case the maximum value is ca. +70 % of the 95th percentile, while in the latter is ca. +20 %. Table S4 summarizes all the statistics in this paragraph. Finally, Fig. 11e shows the combination of the histograms in Fig. 11c and d, by weighting the paroxysms 12 % of the total, similarly to Fig. 8e. Also in this case, the distribution of the areas is continuous between major explosions and paroxysms: the former representing the bulk and the latter the tail.
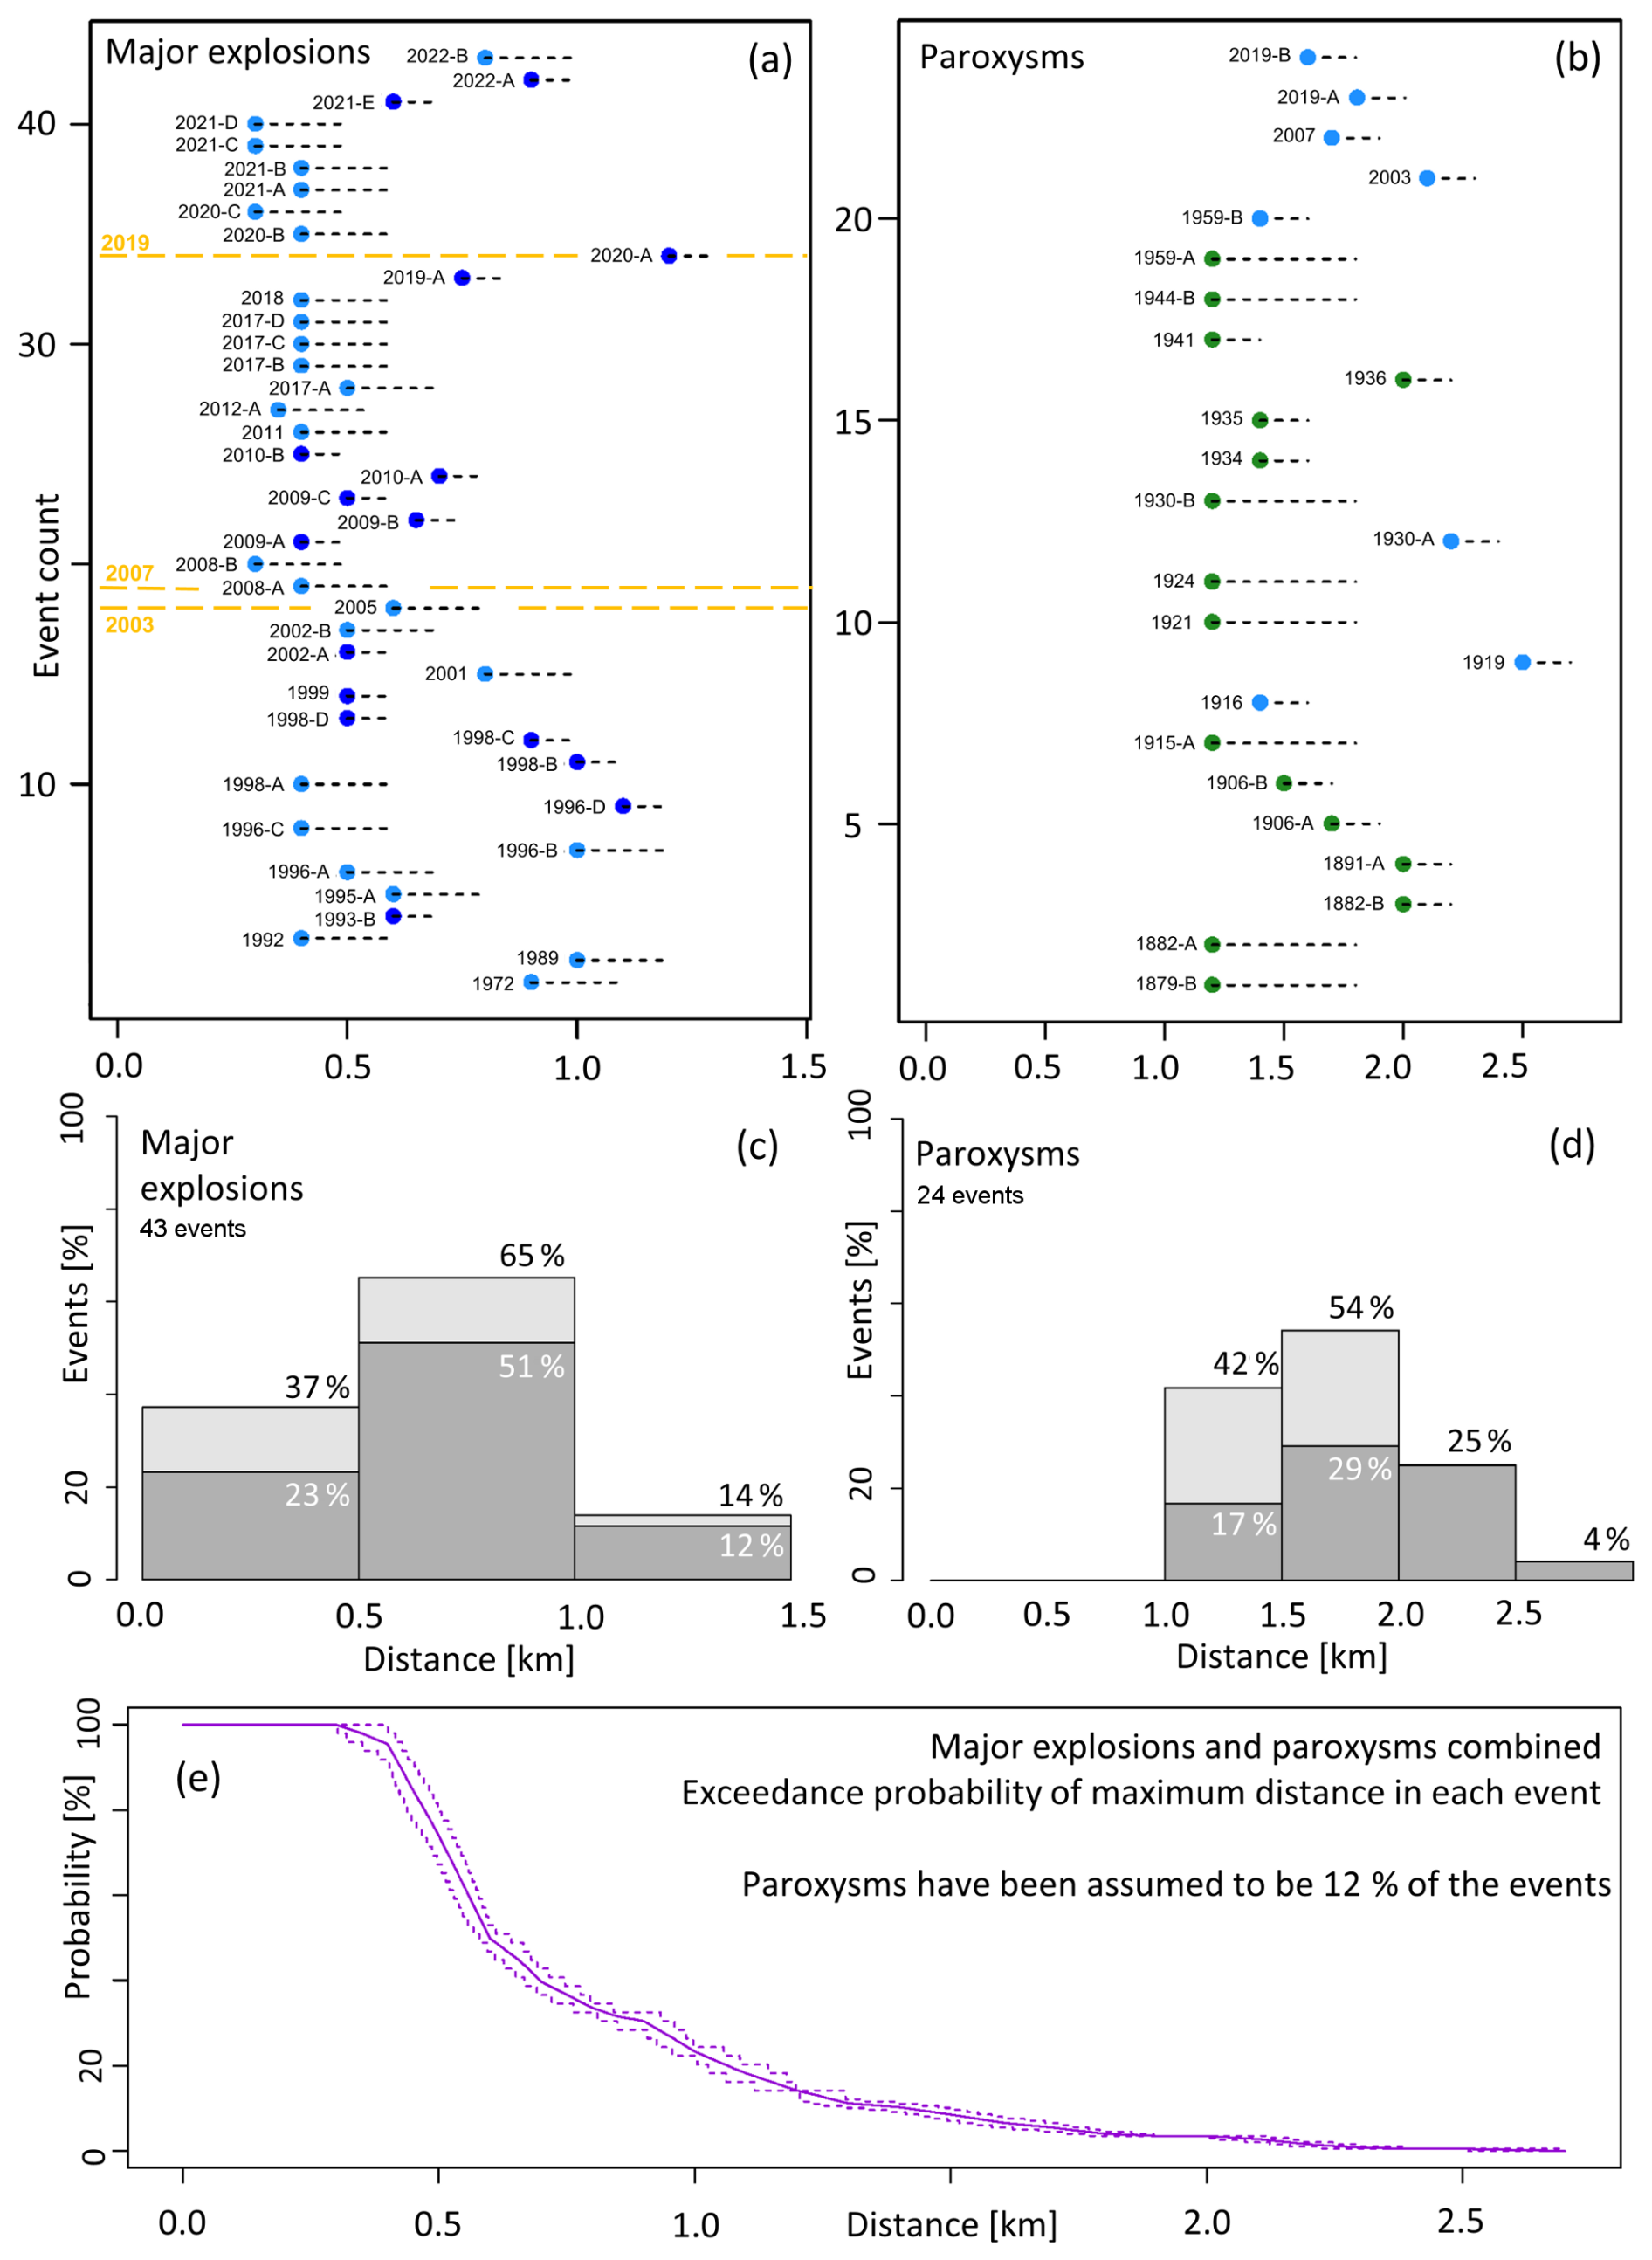
Figure 8List of the maximum ballistic distances in each event, in (a) and (b) arranged in chronological order from bottom to top of each panel, in (c) and (d) partitioned in distance bins, in (e) the exceedance probability function. In (a) and (c) we show the major explosions and in (b) and (d) the paroxysms, in (e) combined together. In (a) the paroxysms are marked by orange dashed lines. In (a) and (b) the colors distinguish the classes of uncertainty, i.e. blue is low, azure is intermediate, green is high. The dashed lines highlight the uncertainty considered: the colored dots indicate the recorded values and the dashed line their possible increase. In (a) we marked the three paroxysms because they significantly changed the crater morphology. The light colored bars in (c) and (d) and the dashed lines in (e) are the 5th and 95th percentiles of uncertainty. In (e) the paroxysms have been assumed to be the 12 % of all events as results from the analysis of the last two decades (2003–2023).
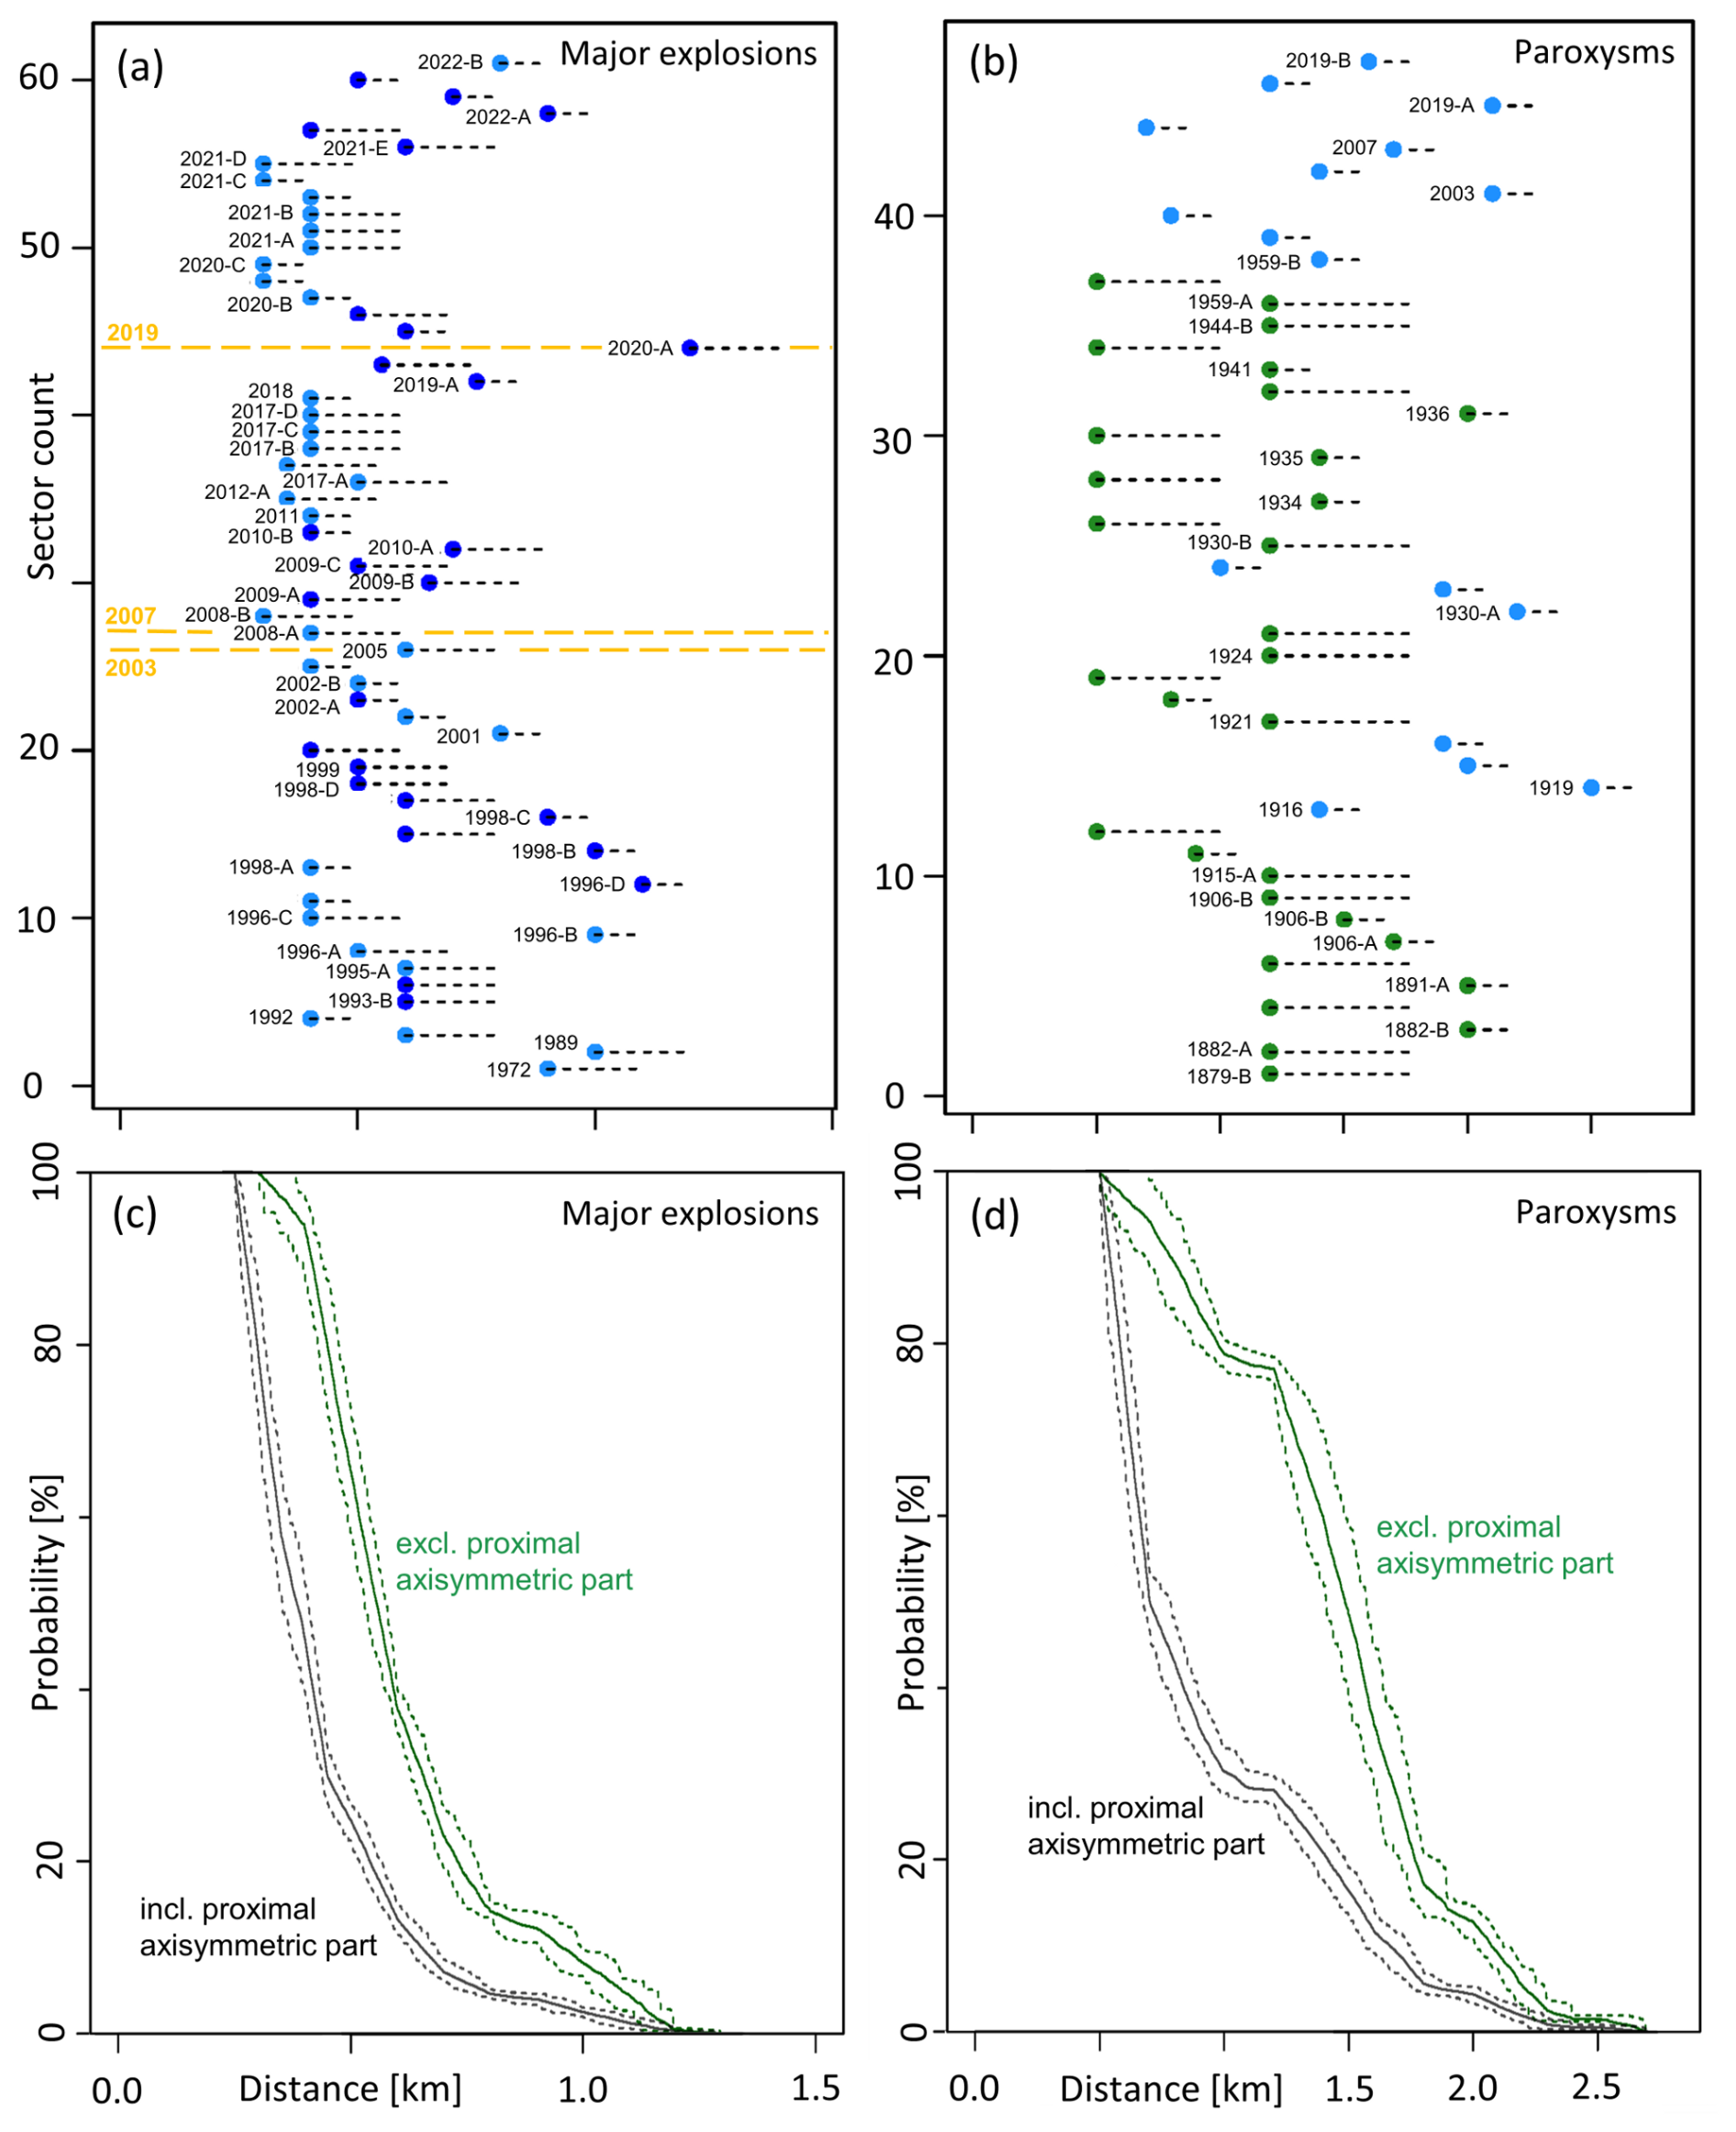
Figure 9(a, b) List of the ballistic distances, arranged in chronological order from bottom to top of each panel, by considering all the circular sectors involved. For each explosion it is labeled only the sector in which the largest distance was achieved. The colors distinguish the classes of uncertainty. (c, d) Exceedance probability function of the ballistic distances in all sectors, in green by excluding the proximal axisymmetric part, in black by including it. The circular sectors are weighted according to their width. In (a) and (c) we show the major explosions and in (b) and (d) the paroxysms; in (a) the paroxysms are marked by orange dashed lines. In (a) and (b) the dashed lines highlight the uncertainty considered: the colored dots indicate the recorded values and the dashed line their possible increase. In (a) we marked the three paroxysms because they significantly changed the crater morphology. In (c) and (d) the dashed lines represent the 5th and 95th percentiles of uncertainty.
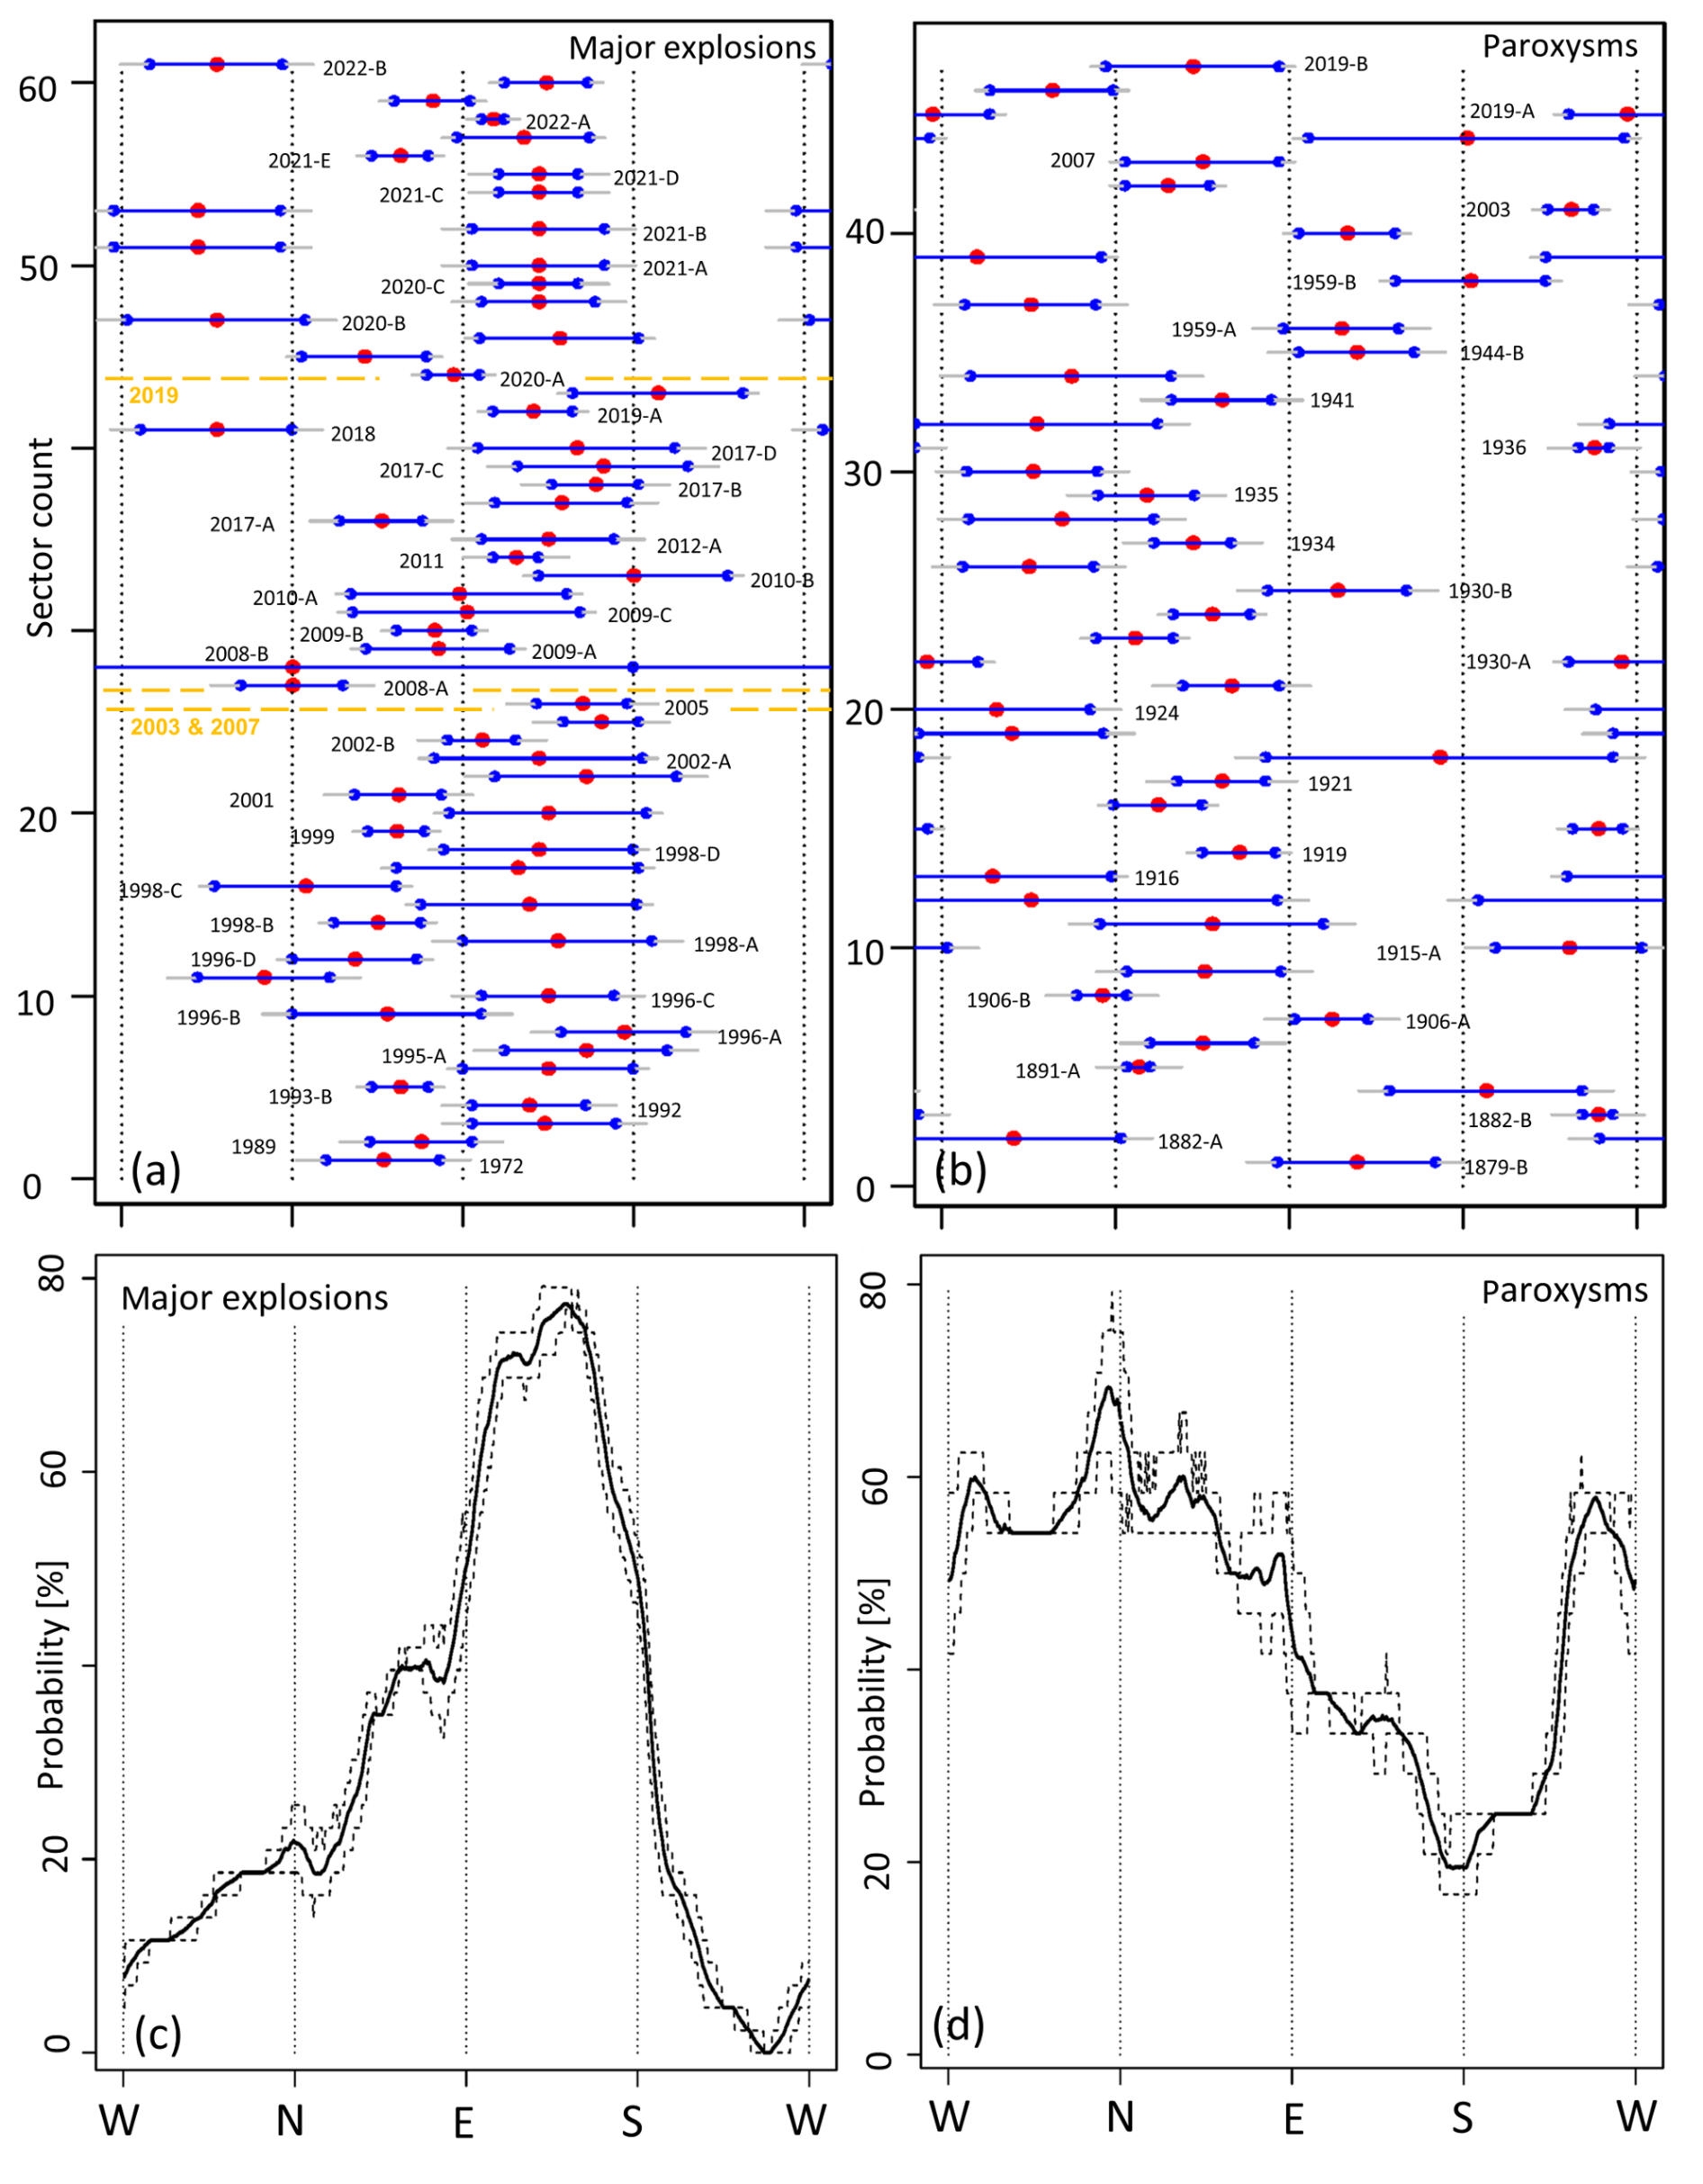
Figure 10(a, b) Range graphs of the ballistic sectors direction (red dots) and width (blue lines). All directional sectors of each paroxysm are considered, and for each explosion it is labeled only the sector in which the largest distance was achieved. The counting index is ordered chronologically among different events, from the bottom to the top of each plot. The uncertainty is represented in gray. In (a) the paroxysms are marked by orange dashed lines. (c, d) Ballistics direction probability percentage. The dashed lines are 5th and 95th percentiles of the associated uncertainty. In (a) and (c) we show the major explosions and in (b) and (d) the paroxysms.

Figure 11Histograms of (a) and (b) the width of all the circular sectors not considering the axisymmetric part, and of (c)–(e) the total area affected by projectile fallout. In (a) and (c) are mapped the major explosions, in (b) and (d) the paroxysms, in (e) combined together. In (e) the paroxysms have been assumed to be the 12 % of all events as results from the analysis of the last two decades (2003–2023). The sample count includes a Monte Carlo simulation of the random effects of mapping uncertainty, i.e., 103 replicas for every sector in (a) and (b), 102 replicas for every event in (c) and (d).
A first novel contribution of this study is the investigation effort to reconstruct and map a significant number of areas affected by ballistic fallout generated by major explosions and paroxysms at Stromboli. It should be noted that only a small fraction, i.e., ca. , of major explosions and paroxysms were previously mapped. This study aimed at filling such knowledge gap and collected all available information on past ballistic fallout at Stromboli, rich but sparse into tens of articles many of which were written at the end of the XIX Century and in the first half of the XX Century, mostly in Italian or in German.
A major difficulty related to this investigation was that the Island of Stromboli is characterized by a complex history of place names (i.e., toponyms), and their evolution has been a matter of semantic and ethnographic research, since the XIX century (Asburgo, 1896; Losacco, 1973; Files S1 and S2). For this reason, the full understanding and geographical interpretation of the documents describing past ballistic fallouts was often a complex duty, significantly intertwined with uncertainty quantification guided by expert judgment. This was achieved by the authors' group without following a formal procedure to quantify their judgement but simply through discussion and reaching a group consensus.
Moreover, our study required a changed approach with respect to the classical problem of reconstructing the detailed footprint of ballistic dispersion of a single explosive event, up to the geographic coordinates of the single greatest clasts (e.g., Bertagnini et al., 1999; Andronico and Pistolesi, 2010; Pistolesi et al., 2008, 2011). Our new method to map the areas of ballistic fallout was based on the representation of the area affected through a circular proximal area and up to three circular sectors of variable radius and width. Such a statistical approach has the advantage of representing each explosion in terms of a minimum number of scalar parameters: 1 to 4 distances and up to 6 angles. Moreover, every scalar estimate was naturally related to an uncertainty range, which was an output of our investigation. In addition, these uncertainties enabled us to neglect the variability and multiplicity of explosion sources, and the detailed shape of the directional lobes of ballistic fallout, while tailoring the maps of past events. Without following this simplified approach, it would have been significantly more difficult to map most of past events, and, ultimately, to collect a sufficient dataset of ballistic fallouts to be used to produce probabilistic hazard assessment maps at Stromboli (see companion study Bevilacqua et al., 2026).
A second novel contribution of our investigation was the quantitative characterization of the areas affected by ballistic fallout generated by major explosions and paroxysms at Stromboli as represented by the simplified maps produced. The distinction between these two categories is the traditional way in which the volcanological community described the explosions more intense than the ordinary activity at Stromboli. This terminology is rooted in the XIX Century language (e.g., Mercalli, 1883; Riccò, 1907; Ponte, 1916; Imbò, 1928), but it was formalized with its modern meaning only from the last decade of XX Century (e.g., Barberi et al., 1993; Rosi et al., 2013; Bevilacqua et al., 2020b). In addition, Barberi et al. (1993) suggested a possible further characterization of the paroxysms based on their products, i.e., paroxysms dominated by expulsion of old material and ash, and paroxysms dominated by lava fountains. However, this classification was not a clear dichotomy and has not been fully established yet.
We showed that major explosions and paroxysms primarily differ in their maximum and mean ballistic distances, which are roughly twice for the paroxysms. However, these two categories are adjacent, and partially overlapping, in terms of their ballistic ranges (see Fig. 8). In particular, the greatest distance of every major explosion in our dataset, i.e. 1200 m plus uncertainty, was observed in the event of 19 July 2020. In fact, based on ground deformation data that event was placed at the boundary between major explosions and paroxysms by Voloschina et al. (2023), and it was considered a paroxysmal explosion according to the classification method proposed by Calvari et al. (2021). The greatest distance of every paroxysm in our dataset, i.e. 2500 m plus uncertainty, was observed in the event of 22 May 1919, which produced significant ballistic damage to the buildings in the Stromboli village (Ponte et al., 1919, 1924; Ranfaldi, 1921; Platania et al., 1922).
Notably, the use of the ballistics projectile range in dividing major explosions from paroxysms may appear arbitrary, because it is made a priori but the two styles are shown to have no clear divide in terms of the probability distribution of maximum distances (Fig. 8) and of total affected areas (Fig. 11). However, we remark that such distinction has an important practical need, related to the different datasets time periods in which the areas affected by ballistics of a sufficient number of major explosions and paroxysms could be adequately mapped, i.e., 43 major explosions in ca. 50 years and 24 paroxysms in ca. 150 years, respectively.
A comprehensive probability distribution of maximum ballistic distances at Stromboli should merge the major explosions and the paroxysms, but the estimate of their occurrence ratio is difficult to compute. In fact, major explosions before 1970 are affected by significant uncertainty and likely under-recording issues. Moreover, only 5 paroxysms occurred after 1970, and their time series is irregular and characterized by temporal clusters and a 44-year gap between 1959 and 2003 (Bevilacqua et al., 2020b). As a consequence, the fraction of the number of paroxysms over the number of all explosions (i.e., major explosions plus paroxysms) was 12 % from 2003 and 2023, but dropped down to 7.3 % from 1970 to 2023. Conversely, the same ratio grew to ca. 19 % if we considered all the paroxysms and the major explosions from 1879 to 2023, even after we included all the uncertain major explosions (see Table S3). Therefore, we assumed 12 % as a plausible and relatively robust estimate of this important scale parameter. Notably, updating the dataset up to June 2026 does not have a significant effect on this estimate (Bevilacqua et al., 2026).
When comparing major explosions and paroxysms, we also remark that significant differences in their asymmetric directions of furthermost ballistic dispersal characterize the two categories. In fact, while the major explosions have a peak probability towards SE, the paroxysms have two peaks towards N and WSW (more details in Fig. 10). It should be noted that the most frequented trails, from N to SE, and inhabited areas, towards NE and WSW, are the easiest places to survey in the hours/days after the explosions, and their directions roughly include those of peak probabilities. For this reason, in the production of ballistic hazard maps based on past data it is very important to develop ad hoc methods to mitigate potential under recording biases (see companion study Bevilacqua et al., 2026).
Physical reasons for these asymmetries should be investigated case by case. In general, the paroxysms appear able to re-shape the shallow conduits and craters more greatly and deeply than major explosions (Rittmann, 1931, 1933; Salvatore et al., 2018; Civico et al., 2021, 2024; Zuccarello et al., 2025), and this might significantly affect the trajectories of ballistics (e.g., Valentine et al., 2012; Taddeucci et al., 2013). It should be noted that within the large paroxysms of Stromboli described in Bertagnini et al. (2011), which occurred in 1930 and in the 16th Century, a different nature of lithic clasts suggested the involvement of different portions of the upper conduit during the crater excavation. It is also important to consider that the widening and deepening of the craters can be the result of a structural collapse due to the possible drainage of the lava host in the volcano conduit preceding the explosion.
With this respect, experimental studies on the craters obtained by several detonations showed that the depth of the explosion and of a pre-existing crater morphology can have a distinctive effect on the evolution of the craters and the consequent jet and dispersal of ballistic projectiles (Valentine et al., 2014; Graettinger et al., 2014). Furthermore, it was observed that experimental craters created by several detonations in layered aggregates, as in the case of Stromboli, can significantly differ from a single-blast (Sonder et al., 2015). These differences may be even more evident in the case of short-lived explosions such as major explosions and paroxysms occurring from sub-vertical or inclined shallow conduits, because the conduit and crater walls formed by each event are likely different from those existing before the same event (Valentine et al., 2015; Salvatore et al., 2018; Schmid et al., 2021; Sonder et al., 2022; Civico et al., 2021, 2024).
Regarding the potential influence of prevailing winds on preferential ballistic dispersal directions, it should be noted that wind effects are implicitly incorporated into our estimates, because the dispersal sectors were defined from the observed ground positions of the ballistic projectiles. Although atmospheric winds can, under some conditions, significantly affect ballistic trajectories, their influence on Stromboli's explosive activity appears to be relatively limited. As an illustrative example, based on studies investigating crosswind effects (e.g., Mastin, 2001; Saunderson, 2008; Bertin, 2017), under standard atmospheric conditions, a 5 m s−1 crosswind, which is typical of Stromboli, would produce a horizontal displacement of approximately 60–125 m for a 10 cm-diameter spherical lithic clast with a drag coefficient of 0.5 and a trajectory apex 500–1000 m above the source, as typical of a major explosion. Under the same conditions, the displacement would be approximately 155–210 m for a free fall from 3000–4000 m above the source, as it may be during a paroxysm. Based on the low-level wind field at Stromboli between 0 and 5 km elevation, reconstructed from the low-resolution reanalysis dataset of Mastin (2017), the prevailing winds are directed mainly toward the E and SE and therefore do not appear sufficient to explain the observed dispersal patterns. However, the pronounced topography of the volcano is likely to exert a substantial influence on the local wind field. A robust reconstruction of these local circulation patterns would require a dedicated study, which is beyond the scope of the present work.
In summary, there are clear evidences that the architecture and geometry of vents and shallow conduits greatly influence the ballistic dispersion: conduit and crater walls, layers, ridges and cones can all produce shielding effects, so enabling the generation of inclined jets, or be partially or entirely demolished into additional projectile fragments, depending on the explosion intensity, duration, and depth. In addition to the role of vents and shallow conduits, and atmospheric winds, it should be stressed that bouncing and rolling of the ballistic projectiles could also significantly affect their final dispersal, particularly on the steeper slopes of Stromboli, and therefore contribute to determine the potentially hazardous areas that we mapped. All these complexities make the definition of input conditions for the numerical simulation of major explosions and paroxysms significantly uncertain when treated case-by-case, and very difficult to predict in general.
In this study, we presented a new method to map the ballistic fallout and quantified the key variables describing the areas affected by ballistic projectiles generated by several tens of past major explosions and paroxysms at Stromboli. The application of the new mapping method has allowed us to build a new dataset of the areas affected by ballistics, complementary to the historical and recent catalogs of explosive activity of Stromboli. The new dataset, coming from all available scientific literature as well as monitoring and field/observation reports, allowed us to quantify the distances, directions and areas affected describing the ballistic fallout of major explosions and paroxysms, but also to estimate the size of the associated uncertainties. In the companion study, we will show how these data and analyses allow producing first probabilistic hazard maps of the areas affected by ballistic fallout with uncertainty quantification (Bevilacqua et al., 2026).
Based on the data and analyses presented these are the main outcomes and conclusions of the study:
-
A new dataset of the reconstructed areas affected by ballistic fallout from a total of 67 major explosions and paroxysms at Stromboli was produced based on a new simplified mapping method. Although the information has been collected over a significantly long period, i.e. ca. 150 years, and with details and accuracy quite different among them, the dataset represents, to our knowledge, a first attempt to systematically describe the areas potentially affected by ballistics and a key source of information for the quantification of the ballistic hazard at this volcano.
-
The dataset allowed analyzing the distribution of the maximum ballistic distances produced by major explosions and paroxysms from the center of Crater Terrace. A significant percentage of major explosions, i.e., from 23 % to 37 %, did not surpass 500 m ballistic distance; similarly, from 17 % to 42 % of the paroxysms did not reach 1500 m ballistic distance. Nevertheless, in 12 % to 14 % of major explosions the ballistics reached 1000 m distance, and 29 % of the paroxysms reached 2000 m. The combined distance distribution of major explosions and paroxysms resulted to be remarkably continuous suggesting the absence of a net separation between the two categories in terms of generating mechanisms.
-
With the aim to produce probabilistic hazard maps, the statistics of the ballistic distance in all the circular sectors mapped in the past events analyzed was also computed, by weighting the sectors according to their width. Estimates were obtained by including the proximal axisymmetric part of explosions too. These two estimates are systematically lower than the maximum distance values discussed in point 2 above and will be both used in the companion study (Bevilacqua et al., 2026) to produce the hazard probability maps of ballistic fallout.
-
The directionality of the ballistic dispersal is remarkably asymmetric and differs significantly between major explosions and paroxysms. About 87 % of the bisectors of major explosions fell towards the East half-plane, whereas 64 % of the bisectors of the paroxysms fell towards the North half-plane. It was also possible to calculate the probability function of the ballistics directions, which for major explosions has a well-pronounced maximum of 77 % ± 2 % at 140° E ± 10° (i.e. towards SE) whereas for the paroxysms has a less evident maximum of 70 % ± 9 % at 355° E ± 10° (i.e. towards N).
-
For both the major explosions and the paroxysms, the mean width value of the circular sectors reconstructed was about 90°, but the paroxysms showed a greater variability in the 95th percentile values (up to about 180° with respect to about 130° for major explosions). The mean area of major explosions was 6.9 × 10⁴ m2, and the mean area of paroxysms was 3.6 × 10⁵ m2, i.e., ca. 5 times larger. However, the distribution of the areas affected is continuous between major explosions and paroxysms. As the ballistic distance, also the mean sector width and the area affected suggest the continuity between the two categories in terms of dispersal of ballistic particles.
-
The compiled map dataset accounts for the quantification of the uncertainties on the areas affected by the ballistic fallout of past events. This is a key feature of the dataset given the significant variability in the accuracy of the data and observations used. These sources of uncertainty were fully integrated in the statistical analyses, all conducted using Monte Carlo simulations that randomly perturb the data, and therefore reflected in the results presented. It is worth underlining that the results obtained were significantly robust with a limited influence of the uncertainties considered.
Finally, the study highlights the fundamental importance of a continuous and detailed observation of the explosive activity of Stromboli for a quantitative description of ballistics dispersal and a robust assessment of its hazards.
The main historical sources that we relied upon are detailed in Files S1 and S2. In addition to the scientific publications, we considered several hundreds of monitoring and surveillance bulletins and reports regarding Stromboli volcano, issued by the “International Association of Volcanology and Geochemistry of the Earth Interior” (IAVCEI); by “Istituto Internazionale di Vulcanologia” (IIV) and “Gruppo Nazionale di Vulcanologia” (GNV) of “Consiglio Nazionale delle Ricerche” (CNR), by “Istituto Nazionale di Geofisica e Vulcanologia” (INGV), and by “Laboratorio di Geofisica Sperimentale” of Università di Firenze (UNIFI-LGS). We also considered the open documents on the “Stromboli Online” website by SwissEduc, the “Scientific Event Alert Network” (SEAN) and the “Global Volcanism Network” (GVN) of the Smithsonian Institution.
The historical catalog of major explosions and paroxysms at Stromboli (https://doi.org/10.13127/STROMBOLI/STRCATALOG, Bevilacqua et al., 2023), and the recent catalog of major explosions and paroxysms at Stromboli from 1970 to 2023 (https://doi.org/10.13127/STROMBOLI/STRCATALOG2, Bevilacqua et al., 2020a) are available on the INGV – Sezione di Pisa. The derived data is available under request and the R scripts utilized for statistical analysis are available in https://doi.org/10.5281/zenodo.21476659 (Bevilacqua and Neri, 2026).
The supplement related to this article is available online at https://doi.org/10.5194/nhess-26-4479-2026-supplement.
All authors gathered, cured, and discussed the historical data, their classification, and uncertainty quantification of the past ballistic dispersions. A.B., P.L., P.D.C. drew the simplified maps. A.B. and A.N. conceived the main modeling ideas and scientific objectives. A.B. implemented the codes, performed the statistical analysis, and produced the graphs and plots. A.B. and A.N. prepared the first draft of the manuscript. All authors discussed the results, commented on the manuscript, provided critical feedback, and gave final approval for publication.
The contact author has declared that none of the authors has any competing interests.
The manuscript does not necessarily represent official views and policies of the Dipartimento della Protezione Civile (Italy).
Publisher's note: Copernicus Publications remains neutral with regard to jurisdictional claims made in the text, published maps, institutional affiliations, or any other geographical representation in this paper. The authors bear the ultimate responsibility for providing appropriate place names. Views expressed in the text are those of the authors and do not necessarily reflect the views of the publisher.
We would like to thank the Associate Editor, and the two anonymous reviewers for their thoughtful review of this study, as well as Mauro Rosi and two anonymous reviewers that provided comments on a previous version of the manuscript, which significantly helped to strengthen our analysis. The contribution and support of ideas of many colleagues participating to the supporting projects are acknowledged.
This research has been supported by the Dipartimento della Protezione Civile, Presidenza del Consiglio dei Ministri (Convenzione Attuativa per il Potenziamento delle Attività di Servizio, Task 4.1, Accordo Quadro DPC-INGV 2022-2028, and Piano di Potenziamento Stromboli EW-DPC, ex OCDPC n. 762/2021 grant) and the Istituto Nazionale di Geofisica e Vulcanologia (Rete Multiparametrica – Vulcani grant).
This paper was edited by Amy Donovan and reviewed by two anonymous referees.
Alatorre-Ibargüengoitia, M. A., Delgado-Granados, H., and Farraz-Montes, I. A.: Hazard zoning for ballistic impact during volcanic explosions at Volcán de Fuego de Colima (México), Geological Society of America, Special Paper, 402, https://doi.org/10.1130/2006.2402(09), 2006.
Alatorre-Ibargüengoitia, M. A., Delgado-Granados, H., and Dingwell, D. B.: Hazard map for volcanic ballistic impacts at Popocatépetl volcano (Mexico), Bull Volcanol, 9, 2155–2169, 2012.
Alatorre-Ibargüengoitia, M. A., Morales-Iglesias, H., Ramos-Hernández, S. G., Jon-Selvas, J., and Jiménez-Aguilar, J. M.: Hazard zoning for volcanic ballistic impacts at El Chichón Volcano (Mexico), Nat. Hazards, 81, https://doi.org/10.1007/s11069-016-2152-0, 2016.
Andronico, D. and Pistolesi, M.: The November 2009 paroxysmal explosions at Stromboli, J. Volcanol. Geoth. Res., 196, 120–125, https://doi.org/10.1016/j.jvolgeores.2010.06.005, 2010.
Andronico, D., Del Bello, E., D'Oriano, C., Landi, P., Pardini, F., Scarlato, P., de' Michieli Vitturi, M., Taddeucci, J., Cristaldi, A., Ciancitto, F., Pennacchia, F., Ricci, T., and Valentini, F.: Uncovering the eruptive patterns of the 2019 double paroxysm eruption crisis of Stromboli volcano, Nat. Comm., 12, 4213, https://doi.org/10.1038/s41467-021-24420-1, 2021.
Aravena, A., Bevilacqua, A., de' Michieli Vitturi, M., Esposti Ongaro, T., Neri, A., and Cioni, R.: Calibration strategies of PDC kinetic energy models and their application to the construction of hazard maps, Bull. Volcanol., 84, 29, https://doi.org/10.1007/s00445-022-01538-8, 2022.
Aravena, A., Bevilacqua, A., Neri, A., Gabellini, P., Ferrés, D., Escobar, D., Aiuppa, A., and Cioni, R.: Scenario-based probabilistic hazard assessment for explosive events at the San Salvador volcanic complex, El Salvador, J. Volcanol. Geoth. Res., 438, 107809, https://doi.org/10.1016/j.jvolgeores.2023.107809, 2023.
Asburgo, L. S.: Die Liparischen Inseln, Siebentes Heft: Stromboli, Prag, Druck Und Verlag Von Heinr. Mercy, 51 pp., 1896.
Barberi, F., Rosi, M., and Sodi, A.: Volcanic hazard assessment at Stromboli based on review of historical data, ActaVulcanol., 3, 173–187, 1993.
Bebbington, M. S.: Assessing spatio-temporal eruption forecast in a monogenetic volcanic field, J. Volcanol. Geoth. Res., 252, 14–28, 2013.
Bernard, B.: Rapid hazard assessment of volcanic ballistic projectiles using long-exposure photographs: insights from the 2010 eruptions at Tungurahua volcano, Ecuador, Volcanica, 1, 49–61, https://doi.org/10.30909/vol.01.01.4961, 2018.
Bertagnini, A., Coltelli, M., Landi, P., Pompilio, M., and Rosi, M.: Violent explosions yield new insights into dynamics of Stromboli volcano, Eos, Trans. Am. Geophys. Union, 80, 633–636, https://doi.org/10.1029/99EO00415, 1999.
Bertagnini, A., Metrich, N., Francalanci, L., Landi, P., Tommasini, S., and Conticelli, S.: Volcanology and magma geochemistry of the present-day activity: constraints on the feeding system, in: Learning from Stromboli, edited by: Calvari, S., Inguaggiato, S., Puglisi, G., Ripepe, M., and Rosi, M., American Geophysical Union, Geophys. Mono 182, Washington, DC, 19–38, https://doi.org/10.1029/182GM04, 2008.
Bertagnini, A., Di Roberto, A., and Pompilio, M.: Paroxysmal activity at Stromboli: lessons from the past, Bull. Volcanol., 73, https://doi.org/10.1007/s00445-011-0470-3, 2011.
Bertin, D.: 3-D ballistic transport of ellipsoidal volcanic projectiles considering horizontal wind field and variable shape-dependent drag coefficients, J. Geophys. Res.-Solid Earth, 122, 1126–1151, https://doi.org/10.1002/2016JB013320, 2017.
Bevilacqua, A. and Neri, A.: Software supporting: Ballistic projectile hazard of major explosions and paroxysms at Stromboli (Italy) with uncertainty quantification: 1. Mapping method and data analysis, Zenodo [computer software], https://doi.org/10.5281/zenodo.21476659, 2026.
Bevilacqua, A., Isaia, R., Neri, A., Vitale, S., Aspinall, W. P., Bisson, M., Flandoli, F., Baxter, P. J., Bertagnini, A., Esposti Ongaro, T., Iannuzzi, E., Pistolesi, M., and Rosi, M.: Quantifying volcanic hazard at Campi Flegrei caldera (Italy) with uncertainty assessment: I. Vent opening maps, J. Geophys. Res.-Solid Earth, 120, 2309–2329, https://doi.org/10.1002/2014JB011775, 2015.
Bevilacqua, A., Flandoli, F., Neri, A., Isaia, R., and Vitale, S.: Temporal models for the episodic volcanism of Campi Flegrei caldera (Italy) with uncertainty quantification, J. Geophys. Res.-Solid Earth, 121, 7821–7845, https://doi.org/10.1002/2016JB013171, 2016.
Bevilacqua, A., Neri, A., Bisson, M., Esposti Ongaro, T., Flandoli, F., Isaia, R., Rosi, M., and Vitale, S.: Effects of vent location, event scale and time forecasts on pyroclastic density currents hazard maps at Campi Flegrei caldera, (Italy), Front Earth Sci., 5, 1–16, https://doi.org/10.3389/feart.2017.00072, 2017.
Bevilacqua, A., Bursik, M., Patra, A., Pitman, E. B., Yang, Q., Sangani, R., and Kobs-Nawotniak, S.: Late Quaternary eruption record and probability of future volcanic eruptions in the Long Valley volcanic region (CA, USA), J. Geophys. Res.-Solid Earth, 123, 5466–5494, https://doi.org/10.1029/2018JB015644, 2018.
Bevilacqua, A., Bertagnini, A., Pompilio, M., Landi, P., Del Carlo, P., Di Roberto, A., Piccione, C., and Neri, A.: Historical catalog of major explosions and paroxysms at Stromboli (Italy), INGV Ufficio Dati, https://doi.org/10.13127/STROMBOLI/STRCATALOG, 2020a.
Bevilacqua, A., Bertagnini, A., Pompilio, M., Landi, P., Del Carlo, P., Di Roberto, A., Aspinall, W., and Neri, A.: Major explosions and paroxysms at Stromboli (Italy): a new historical catalog and temporal models of occurrence with uncertainty quantification, Sci. Rep., 10, 17357, https://doi.org/10.1038/s41598-020-74301-8, 2020b.
Bevilacqua, A., Bertagnini, A., Pompilio, M., Landi, P., Del Carlo, P., Di Roberto, A., Piccione, C., Falsaperla, S., Spampinato, S., and Neri, A.: Catalog of major explosions and paroxysms at Stromboli volcano (Italy) from 1970 to 2023, INGV Ufficio Dati, https://doi.org/10.13127/STROMBOLI/STRCATALOG2, 2023.
Bevilacqua, A., Nannipieri, L., Favalli, M., and Fornaciai, A.: UAS-based mapping of the July 3, 2019, ballistics density distribution on the W flank of Stromboli with uncertainty quantification, Bull. Volcanol., 86, 48, https://doi.org/10.1007/s00445-024-01741-9, 2024.
Bevilacqua, A., Neri, A., Landi, P., Del Carlo, P., Pompilio, M., and Baxter, P.: Ballistic projectile hazard of major explosions and paroxysms at Stromboli (Italy) with uncertainty quantification – Part 2: Conditional and temporal probability maps, Nat. Hazards Earth Syst. Sci., Nat. Hazards Earth Syst. Sci., 26, 4503–4527, https://doi.org/10.5194/nhess-26-4503-2026, 2026.
Bisson, M., Spinetti, C., Gianardi, R., Strehlow, K., De Beni, E., and Landi, P.: High-resolution mapping and dispersion analyses of volcanic ballistics emitted during the 3rd July 2019 paroxysm at Stromboli, Sci. Rep., 13, 13465, https://doi.org/10.1038/s41598-023-39600-w, 2023.
Blong, R. J.: Volcanic hazards: a sourcebook on the effects of eruptions, Academic Press, Orlando, https://doi.org/10.1016/C2009-0-21853-8, 1984.
Breard, E. C. P., Lube, G., Cronin, S. J., Fitzgerald, R., Kennedy, B., Scheu, B., Montanaro, C., White, J. D. L., Tost, M., Procter, J. N., and Moebis, A.: Using the spatial distribution and lithology of ballistic blocks to interpret eruption sequence and dynamics: August 6 2012 Upper Te Maari eruption, New Zealand, J. Volcano. Geoth. Res., 276, 383–376, 2014.
Brown, S. K., Jenkins, S. F., Stephen, R., Sparks, J., Odbert, H., and Auker, M. R.: Volcanic fatalities database: analysis of volcanic threat with distance and victim classification, J. Appl. Volcanol., 6, 15, https://doi.org/10.1186/s13617-017-0067-4, 2017.
Calvari, S. and Nunnari, G.: Statistical Insights on the Eruptive Activity at Stromboli Volcano (Italy) Recorded from 1879 to 2023, Remote Sens., 15, 4822, https://doi.org/10.3390/rs15194822, 2023.
Calvari, S., Giudicepietro, F., Di Traglia, F., Bonaccorso, A., Macedonio, G., and Casagli, N.: Variable Magnitude and Intensity of Strombolian Explosions: Focus on the Eruptive Processes for a First Classification Scheme for Stromboli Volcano (Italy), Remote Sens., 13, 944, https://doi.org/10.3390/rs13050944, 2021.
Civico, R., Ricci, T., Scarlato, P., Andronico, D., Cantarero, M., Carr, B. B., De Beni, E., Del Bello, E., Johnson, J. B., Kueppers, U., Pizzimenti, L., Schmid, M., Strehlow, K., and Taddeucci, J.: Unoccupied Aircraft Systems (UASs) Reveal the Morphological Changes at Stromboli Volcano (Italy) before, between, and after the 3 July and 28 August 2019 Paroxysmal Eruptions, Remote Sens., 13, 2870, https://doi.org/10.3390/rs13152870, 2021.
Civico, R., Ricci, T., Cecili, A., and Scarlato, P.: High-resolution topography reveals morphological changes of Stromboli volcano following the July 2024 eruption, Sci. Data, 11, 1219, https://doi.org/10.1038/s41597-024-04098-y, 2024.
Coltelli, M., Del Carlo, P., and Pompilio, M.: Vulcano and Stromboli, 1. Eruptive History (Stromboli), Acta Vulcanol., 12, 93–95, 2000.
de' Michieli Vitturi, M., Neri, A., Esposti Ongaro, T., Lo Savio, S., and Boschi, E.: Lagrangian modeling of large volcanic particles: Application to Vulcanian explosions, J. Geophys. Res., 115, B08206, https://doi.org/10.1029/2009JB007111, 2010.
Di Lieto, B., Romano, P., Scarpa, R., and Linde, A. T.: Strain signals before and during paroxysmal activity at Stromboli volcano, Italy, Geophys. Res. Lett., 47, e2020GL088521, https://doi.org/10.1029/2020GL088521, 2020.
Falsaperla, S. and Spampinato, S.: Seismic insight into explosive paroxysms at Stromboli volcano, Italy, J. Volcanol. Geoth. Res., 125, 1–2, https://doi.org/10.1016/S0377-0273(03)00093-3, 2003.
Fitzgerald, R. H., Tsunematsu, K., Kennedy, B. M., Breard, E. C. P., Lube, G., Wilson, T. M., Jolly, A. D., Pawson, J., Rosenberg, M. D., and Cronin, S. J.: The application of a calibrated 3D ballistic trajectory model to ballistic hazard assessments at Upper TeMaari, Tongariro, J. Volcanol. Geoth. Res., 286, 248–262, 2014.
Fitzgerald, R. H., Kennedy, B. M., Wilson, T. M., Leonard, G. S., Tsunematsu, K., and Keys, H.: The communication and risk management of volcanic ballistic hazards, in: Observing the Volcano World, Volcano Crisis Communication, edited by: Fearnley, C. J., Bird, D. K., Haynes, K., McGuire, W. J., and Jolly, G., Springer Open, Adv. Volcanol., 121–147, https://doi.org/10.1007/11157_2016_35, 2018.
Giordano, G. and De Astis, G.: The summer 2019 basaltic Vulcanian eruptions (paroxysms) of Stromboli, Bull. Volcanol., 83, 1–27, https://doi.org/10.1007/s00445-020-01423-2, 2021.
Graettinger, A. H., Valentine, G. A., Sonder, I., Ross, P.-S., White, J. D. L., and Taddeucci, J.: Maar-diatreme geometry and deposits: Subsurface blast experiments with variable explosion depth, Geochem. Geophys. Geosyst., 15, 740–764, https://doi.org/10.1002/2013GC005198, 2014.
Gurioli, L., Harris, A. J. L., Colo, L., Bernard, J., Favalli, M., Ripepe, M., and Andronico, D.: Classification, landing distribution, and associated flight parameters for a bomb field emplaced during a single major explosion at Stromboli, Italy, Geology, 41, 559–562, 2013.
Iezzi, A. M., Buzard, R. M., Fee, D., Matoza, R. S., Gestrich, J. E., Jolly, A. D., Schmid, M., Cigala, V., Kueppers, U., Vossen, C. E. J., Cimarelli, C., Lacanna, G., and Ripepe, M.: UAS-based observations of infrasound directionality at Stromboli volcano, Italy, Geophys. Res. Lett., 50, https://doi.org/10.1029/2023GL102905, 2023.
Imbò, G.: Parossismo di Stromboli nel settembre 1930, Bull. Volcanol., 15–18, 177–185, 1928.
Jaquet, O. and Carniel, R.: Multivariate stochastic modeling: Towards forecasts of paroxysmal phases at Stromboli, J. Volcanol. Geoth. Res., 128, 261–271, 2003.
Losacco, U.: Saggio sulla toponomastica delle Isole Eolie, L'Universo, anno LIII, Firenze, I.G.M., 381–446, 1973.
Maeno, F., Nakada, S., Nagai, M., and Kozono, T.: Ballistic ejecta and eruption condition of the vulcanian explosion of Shinmoedake volcano, Kyushu, Japan on 1 February, 2011, Earth Planets Space, 65, 609–621, 2013.
Marzocchi, W. and Bebbington, M. S.: Probabilistic eruption forecasting at short and long time scales, Bull. Volcanol., 74, 1777–1805, 2012.
Massaro, S., Rossi, E., Sandri, L., Bonadonna, C., Selva, J., Moretti, R., and Komorowski, J. C.: Assessing hazard and potential impact associated with volcanic ballistic projectiles: The example of La Soufrière de Guadeloupe volcano (Lesser Antilles), J. Volcanol. Geoth. Res., 423, 107473, https://doi.org/10.1016/j.jvolgeores.2021.107453, 2022.
Mastin, L. G.: A simple calculator of ballistic trajectories for blocks ejected during volcanic eruptions, U.S. Geological Survey Open-File Report, 01-45, https://doi.org/10.3133/ofr0145, 2001.
Mastin, L. G.: Plots of Wind Patterns of the World's Volcanoes: U.S. Geological Survey data release, USGS Volcano Science Center [data set], https://doi.org/10.5066/F7SQ8XKT, 2017.
Mercalli, G.: I vulcani ed i fenomeni vulcanici in Italia. Lo Stromboli, in: ”Geologia d'Italia”, Vallardi, Milano, 135–144, 1883.
Neri, A., Bevilacqua, A., Esposti Ongaro, T., Isaia, R., Aspinall, W. P., Bisson, M., Flandoli, F., Baxter, P. J., Bertagnini, A., Iannuzzi, E., Orsucci, S., Pistolesi, M., Rosi, M., and Vitale, S.: Quantifying volcanic hazard at Campi Flegrei caldera (Italy) with uncertainty assessment: II. Pyroclastic density current invasion maps, J. Geophys. Res.-Solid Earth, 120, 2330–2349, https://doi.org/10.1002/2014JB011776, 2015.
Perret, F. A.: The lava eruption of Stromboli summer-autumn, 1915, Am. J. Sci., 42, 436–457, 1916.
Pistolesi, M., Rosi, M., Pioli, L., Renzulli, A., Bertagnini, A., and Andronico, D.: The Paroxysmal Event and Its Deposits, in: The Stromboli Volcano: An Integrated Study of the 2002–2003 Eruption, edited by: Calvari, S., Inguaggiato, S., Puglisi, G., Ripepe, M., and Rosi, M., Geophysical Monograph Series AGU, https://doi.org/10.1029/182GM26, 2008.
Pistolesi, M., Delle Donne, D., Pioli, L., Rosi, M., and Ripepe, M.: The 15 March 2007 explosive crisis at Stromboli volcano, Italy: Assessing physical parameters through a multidisciplinary approach, J. Geophys. Res., 116, B12206, https://doi.org/10.1029/2011JB008527, 2011.
Platania, G.: L'esplosione dello Stromboli del maggio 1919, Boll. Accad. Gioenia Sci. Nat. Catania, 50, 1–17, 1922.
Pompilio, M., Bertagnini, A., and Di Roberto, A.: Present-day activity of Stromboli: eruptive history and eruptive styles, Acta Vulcanol., 22, 29–34, 2010.
Ponte, G.: Lo Stromboli dopo il parossismo del 1915, R. Accad. Naz. Lincei, 25, 373–377, 1916.
Ponte, G.: La catastrofica esplosione dello Stromboli, R. Accad. Naz. Lincei, 28, 89–94, 1919.
Ponte, G.: Stato attuale dei vulcani italiani, Riv. Ita. Vulc., 1, 32–35, 1924.
Ranfaldi, F.: Sull'eruzione dello Stromboli del 22 maggio 1919 e sui fenomeni vulcanici in generale, Atti Reale Accad Peloritana, 29, 3–57, 1921.
Riccò, A.: Attività dello Stromboli, Boll Accad Gioenia Sci Nat Catania, 19, 7–12, 1907.
Richardson, J. A., Wilson, J. A., Connor, C. B., Bleacher, J. E., and Kiyosugi, K.: Recurrence rate and magma effusion rate for the latest volcanism on Arsia Mons, Mars, Earth Planet Sci. Lett., 458, 170–178, 2017.
Ripepe, M., Lacanna, G., Pistolesi, M., Silengo, M. C., Aiuppa, A., Laiolo, M., Massimetti, F., Innocenti, L., Della Schiava, M., Bitetto, M., La Monica, F. P., Nishimura, T., Rosi, M., Mangione, D., Ricciardi, A., Genco, R., Coppola, D., Marchetti, E., and Delle Donne, D.: Ground deformation reveals the scale-invariant conduit dynamics driving explosive basaltic eruptions, Nat. Comm., 12, 1683, https://doi.org/10.1038/s41467-021-21722-2, 2021.
Rittmann, A.: Der Ausbruch des Stromboli am 11 September 1930, Zeits. Vulkanol, 14, 47–77, 1931.
Rittmann, A.: Beitrag zur Kenntnis des Strombolikraters, Zeits. Vulkanol., 15, 184–190, 1933.
Rosi, M., Bertagnini, A., Harris, A. J. L., Pioli, L., Pistolesi, M., and Ripepe, M.: A case history of paroxysmal explosion at Stromboli: timing and dynamics of the April 5, 2003 event, Earth Planet Sci. Lett., 243, 594–606, https://doi.org/10.1016/j.epsl.2006.01.035, 2006.
Rosi, M., Pistolesi, M., Bertagnini, A., Landi, P., Pompilio, M., and Di Roberto, R.: Stromboli volcano, Aeolian Islands (Italy): present eruptive activity and hazards, in: The Aeolian Islands Volcanoes, edited by: Lucchi, F., Peccerillo, A., Keller, J., Tranne, C. A., and Rossi, P. L., Geological Society, London, Memoirs, 37, 473–490, https://doi.org/10.1144/M37.14, 2013.
Rutarindwa, R., Spiller, E. T., Bevilacqua, A., Bursik, M. I., and Patra, A. K.: Dynamic probabilistic hazard mapping in the Long Valley Volcanic Region CA: Integrating vent opening maps and statistical surrogates of physical models of pyroclastic density currents, J. Geophys. Res.-Solid Earth, 124, https://doi.org/10.1029/2019JB017352, 2019.
Salvatore, V., Silleni, A., Corneli, D., Taddeucci, J., Palladino, D. M., Sottili, G., Bernini, D., Andronico, D., and Cristaldi, A.: Parameterizing multi-vent activity at Stromboli volcano (Aeolian Islands, Italy), Bull. Volcanol., 80, 64, https://doi.org/10.1007/s00445-018-1239-8, 2018.
Saunderson, H. C.: Equations of motion and ballistic paths of volcanic ejecta, Comput. Geosci., 34, 802–814, 2008.
Schmid, M., Kueppers, U., Civico, R., Ricci, T., Taddeucci, J., and Dingwell, D. B.: Characterising vent and crater shape changes at Stromboli: implications for risk areas, Volcanica, 4, 87–105, https://doi.org/10.30909/vol.04.01.87105, 2021.
Schmid, M., Kueppers, U., Ricci, T., Civico, R., Cigala, V., Fee, D., Gestrich, J. E., Iezzi, A. M., Cimarelli, C., Vossen, C. E. J., Buzard, R. M., Ripepe, M., Lacanna, G., and Dingwell, D. B.: The morphological response to the 13 May 2022 major explosive event at Stromboli volcano, Italy, characterised by high-resolution UAS surveys, Volcanica, 8, 387–397, https://doi.org/10.30909/vol/crjj4989, 2025.
Sonder, I., Graettinger, A. H., and Valentine, G. A.: Scaling multiblast craters: general approach and application to volcanic craters, J. Geophys. Res.-Solid Earth, 120, 6141–6158, https://doi.org/10.1002/2015JB012018, 2015.
Sonder, I., Graettinger, A., Neilsen, T. B., Matoza, R. S., Taddeucci, J., Oppenheimer, J., Lev, E., Tsunematsu, K., Waite, G., Valentine, G. A., and Befus, K. S.: Experimental multiblast craters and ejecta – seismo-acoustics, jet characteristics, craters, and ejecta deposits and implications for volcanic explosions, J. Geophys. Res.-Solid Earth, 127, e2022JB023952, https://doi.org/10.1029/2022JB023952, 2022.
Sparks, R. S. J. and Aspinall, W. A.: Volcanic activity: Frontiers and challenges in forecasting, prediction and risk assessment, In: The state of the planet, Frontiers and challenges in geophysics, Geophysical Monograph 150, IUGG, 19, 359–373, 2004.
Taddeucci, J., Valentine, G. A., Sonder, I., White, J. D. L., Ross, P. S., and Scarlato, P.: The effect of pre-existing craters on the initial development of explosive volcanic eruptions: An experimental investigation, Geophys. Res. Lett., 40, 507–510, https://doi.org/10.1002/grl.50176, 2013.
Taddeucci, J., Alatorre-Ibargüengoitia, M. A., Cruz-Vàzquez, O., Del Bello, E., Scarlato, P., and Ricci, T.: In-flight dynamics of volcanic ballistic projectiles, Rev. Geophys., 55, 675–718, https://doi.org/10.1002/2017RG000564, 2017.
Tadini, A., Azzaoui, N., Roche, O., Samaniego, P., Bernard, B., Bevilacqua, A., Hidalgo, S., Guillin, A., and Gouhier, M.: Tephra fallout probabilistic hazard maps for Cotopaxi and Guagua Pichincha volcanoes (Ecuador) with uncertainty quantification, J. Geophys. Res.-Solid Earth, 127, e2021JB022780, https://doi.org/10.1029/2021JB022780, 2022.
Tsunematsu, K., Chopard, B., Falcone, J. L., and Bonadonna, C.: A numerical model of ballistic transport with collisions in a volcanic setting, Comput. Geosci., 63, 62–69, https://doi.org/10.1016/j.cageo.2013.10.016, 2015.
Tsunematsu, K., Ishimine, Y., Kaneko, T., Yoshimoto, M., Fujii, T., and Yamaoka, K.: Estimation of ballistic block landing energy during 2014 Mount Ontake eruption, Earth, Planets Space, 68, 88, https://doi.org/10.1186/s40623-016-0463-8, 2016.
Valentine, G. A., White, J. D. L., Ross, P.-S., Amin, J., Taddeucci, J., Sonder, I., and Johnson, P. J.: Experimental craters formed by single and multiple buried explosions and implications for volcanic craters with emphasis on maars, Geophys. Res. Lett., 39, L20301, https://doi.org/10.1029/2012GL053716, 2012.
Valentine, G. A., Graettinger, A. H., and Sonder, I.: Explosion depths for phreatomagmatic eruptions, Geophys. Res. Lett., 41, 3045–3051, https://doi.org/10.1002/2014GL060096, 2014.
Valentine, G. A., Graettinger, A. H., Macorps, É., Ross, P., White, J., Doring, E., and Sonder, I.: Experiments with vertically and laterally migrating subsurface explosions with applications to the geology of phreatomagmatic and hydrothermal explosion craters and diatremes, Bull. Volcanol., 77, 15, https://doi.org/10.1007/s00445-015-0901-7, 2015.
Vanderkluysen, L., Harris, A. J. L., Kelfoun, K., Bonadonna, C., and Ripepe, M.: Bombs behaving badly: unexpected trajectories and cooling of volcanic projectiles, Bull. Volcanol., 74, 1849–1858, https://doi.org/10.1007/s00445-012-0635-8, 2012.
Voloschina, M., Métrich, N., Bertagnini, A., Marianelli, P., Aiuppa, A., Ripepe, M., and Pistolesi, M.: Explosive eruptions at Stromboli volcano (Italy): a comprehensive geochemical view on magma sources and intensity range, Bull. Volcanol., 85, 34, https://doi.org/10.1007/s00445-023-01647-y, 2023.
Watson, E. J., Swindles, G. T., Savov, I. P., Lawson, I. T., Connor, C. B., and Wilson, J. A.: Estimating the frequency of volcanic ash clouds over northern Europe, Earth Planet Sci. Lett., 460, 41–49, 2017.
Yamaoka, K., Geshi, N., Hashimoto, T., Ingebritsen, S. E., and Oikawa, T.: Special issue “The phreatic eruption of Mt. Ontake volcano in 2014” – (Preface), Earth Planet. Space, 68, 175, https://doi.org/10.1186/s40623-016-0548-4, 2016.
Zuccarello, L., Gheri, D., De Angelis, S., Civico, R., Ricci, T., and Scarlato, P.: Geophysical fingerprint of the 4–11 July 2024 eruptive activity at Stromboli volcano, Italy, Nat. Hazards Earth Syst. Sci., 25, 2317–2330, https://doi.org/10.5194/nhess-25-2317-2025, 2025.