
the Creative Commons Attribution 4.0 License.
the Creative Commons Attribution 4.0 License.
 | 14 Sep 2026
Short-term drought forecasting in Iran using multi-source machine learning: an assessment of autoregressive, teleconnection-driven, and hybrid paradigms

Pouria Jafari
Alireza Ghaemi
Jing Yang
Fatemeh Firoozi
Accurate meteorological drought forecasting is a major scientific challenge due to its complexities and the competition among modeling paradigms. For the first time, this study provides a comprehensive and comparative assessment at the national scale of Iran to determine the relative superiority or synergy of three competing paradigms: (1) autoregressive (based on temporal memory), (2) teleconnection-driven (based on large-scale climate drivers), and (3) hybrid. Using 30-year precipitation data from 96 synoptic stations and 19 global climate indices, the performance of nine machine and deep learning models was tested for forecasting the Standardized Precipitation Index (SPI) at 1-, 2-, and 3-month lead times. The results conclusively reject the idea of a single paradigm's universal superiority, demonstrating that the optimal model structure is highly location-dependent. The hybrid approach, integrating temporal memory with large-scale climate drivers, prevailed in the vast arid and semi-arid regions of Iran, while the standalone paradigms performed best in specific “climate niches” (such as the northern and southern coasts). Among the models, Random Forest (RF) was the most robust and stable algorithm. These findings underscore the necessity of transitioning from “one-model-fits-all” approaches towards developing adaptive, region-centric modeling frameworks to enhance drought early warning systems.
- Article
(4251 KB) - Full-text XML
-
Supplement
(2175 KB) - BibTeX
- EndNote


Skillful drought forecasting, as one of the most destructive and complex natural hazards, is a major scientific challenge and an urgent practical need for policymakers (Deo et al., 2017; Chandrasekara et al., 2021; Oyarzabal et al., 2025). This challenge stems not only from the multi-scale and nonlinear nature of atmosphere-ocean processes (Djerbouai and Souag-Gamane, 2016) but also from a fundamental and unresolved debate in the modeling domain: the strategic choice of the input paradigm (Mishra and Singh, 2010; Fung et al., 2020). In the scientific literature, two main philosophies for predictor selection compete. The first approach, autoregressive, relies on the temporal memory and internal patterns of the drought index time series (Rezaiy and Shabri, 2024; Poudel et al., 2024). The second approach, the teleconnection-driven paradigm, leverages large-scale climate indices as a source of information for predicting regional conditions (Anshuka et al., 2021; Anochi and Shimizu, 2025). Although both paradigms have shown success in case studies (Ali et al., 2023), a comprehensive assessment evaluating the relative superiority or synergistic potential of these two approaches on a vast geographical scale and using a wide array of modern models is notably absent. This research gap, which relates directly to the heart of forecasting practice, forms the core of the present study.
For quantifying drought in such a comparative assessment, the Standardized Precipitation Index (SPI) has become a standard and global tool due to its statistical robustness, minimal data requirement (only precipitation), and comparability across different spatio-temporal scales (McKee et al., 1993; Oyarzabal et al., 2025). This index allows for a fair evaluation of model performance in regions with diverse climates (Shi et al., 2020; Esquivel-Saenz et al., 2024). Consequently, the ability to accurately predict SPI values is considered the cornerstone of early warning systems and proactive drought risk management (Aldhafeeri et al., 2025).
The evolution of forecasting methods shows a transition from traditional statistical models toward complex machine learning (ML) and deep learning (DL) algorithms (Achite et al., 2023; Gyaneshwar et al., 2023). While standalone models like Artificial Neural Networks (ANN) and Support Vector Machines (SVM) were pioneers in this field (Rezaeianzadeh et al., 2016; Ganguli and Janga Reddy, 2014), the dominant trend in current research is toward hybrid architectures that seek to overcome the limitations of single models by intelligently integrating multiple components (Ozger et al., 2011). These advanced approaches typically combine signal preprocessing techniques (such as wavelet analysis) to extract non-stationary patterns with metaheuristic optimization algorithms for fine-tuning hyperparameters (Rezaiy and Shabri, 2023; Kikon et al., 2023; Alkan, 2023). Numerous studies confirm that these hybrid approaches, by significantly reducing prediction error, decisively outperform standard models (Malik et al., 2021; Komasi et al., 2018) and demonstrate high adaptability to contrasting climates (Moghaddasi et al., 2025).
Despite the effectiveness of autoregressive models, whether standalone (Prodhan et al., 2022) or hybrid (Almikaeel et al., 2022), they inherently overlook the physical dynamics governing the climate system. Drought variability is not a purely random process; rather, it is largely controlled by large-scale ocean-atmosphere interactions known as teleconnection patterns. These patterns, which are natural fluctuations in the general atmospheric circulation, are the primary source of climate predictability on seasonal to multi-decadal scales (Santos et al., 2024; Craig and Allan, 2022). Patterns such as the El Niño-Southern Oscillation (ENSO), the North Atlantic Oscillation (NAO), and the Indian Ocean Dipole (IOD), by modulating sea surface temperature and atmospheric pressure patterns, exert significant impacts on regional precipitation regimes, including in Iran (Pourasghar and Babaeian, 2023; Cai et al., 2024; Yun et al., 2021). Therefore, understanding and modeling these physical relationships holds the potential to improve the accuracy and extend the horizon of drought forecasts (Yang and Xing, 2022; Liu et al., 2023; Xing et al., 2024).
However, previous research in Iran examining the impact of teleconnections on drought, despite its value, has faced multidimensional limitations in data and methodology that have constrained their practical application. Firstly, the range of predictors has been limited, with most studies confining their analysis to a few well-known patterns (mainly ENSO and NAO) (Amini et al., 2020; Mahmoudi et al., 2020). This is while the complex climate of Iran is influenced by a wide network of teleconnections from all three ocean basins (Helali et al., 2022; Ghamghami and Bazrafshan, 2021). Secondly, the geographical scale has often been local (Mokhtar et al., 2021; Tuğrul and Hinis, 2025), which challenges the generalizability of the results. More importantly, many of these studies have relied on linear statistical methods (Seibert et al., 2017) which are incapable of fully explaining the complex, nonlinear, spatially non-stationary, and temporally asymmetric interactions between teleconnections and drought (Dong et al., 2024; Tozer and Kiem, 2017) and may lead to misleading conclusions (Razmjo et al., 2020). The emergence of eXplainable Artificial Intelligence (XAI) tools like SHAP has provided an unprecedented opportunity to open the black box of ML/DL models and gain a deeper understanding of these nonlinear relationships (Dikshit and Pradhan, 2021a, b). In a recent study, Mahmoudi et al. (2026b) utilized such an XAI framework to successfully decode the specific teleconnection drivers of Iran's drought, identifying the critical role of nonlinear patterns like the Zonal Wind at 200 hPa (ZWNDz200) and the Atlantic Meridional Mode (AMM). However, while that study focused on the diagnostic interpretation of physical mechanisms, it did not address the prognostic challenge of systematically comparing the autoregressive versus teleconnection-driven paradigms for operational forecasting.
This analysis reveals a prominent and multi-faceted research gap. As noted in the most recent systematic review articles (Oyarzabal et al., 2025; Zellou et al., 2023; Alawsi et al., 2022), a systematic, large-scale comparison to determine whether models based on the teleconnection-driven paradigm can outperform or synergistically enhance conventional autoregressive models has not been conducted. This is a fundamental question in the science of drought forecasting, the answer to which could determine the direction of future research and the design of operational systems.
Aiming to fill this critical gap, this study develops a comprehensive and comparative framework for the short-term forecasting (1-, 2-, and 3-month lead times) of meteorological drought (SPI) across Iran. Leveraging precipitation data from a dense network of 96 synoptic stations over a 30-year period and a diverse suite of nine machine and deep learning models, we critically evaluate three distinct predictor scenarios: the teleconnection-driven scenario (S1), which utilizes a comprehensive set of 19 global climate indices as a proxy for the climate driver-based paradigm; the autoregressive scenario (S2), which uses historical SPI values as a proxy for the temporal memory paradigm; and the hybrid scenario (S3), which tests the synergistic potential of the two paradigms by integrating both datasets. By conducting this systematic comparison, we seek to answer the fundamental question: Can our knowledge of the current state of the oceans and atmosphere, either alone or in combination with past information, provide more accurate forecasts of future drought in Iran, and how is this superiority distributed geographically?
The novelty of this research lies in its scale, scope, and systematic approach. By moving beyond local analyses and limited predictor sets, this study provides the first nationwide, multi-model, and multi-paradigm assessment of drought predictability in Iran, directly challenging competing forecasting philosophies in a vast experimental arena. The findings of this research are expected to provide deep physical insights and practical guidance for the development of a new generation of drought forecasting systems that are not only more accurate but also have a more robust scientific foundation, thereby enhancing national resilience to climate variability and change.
Iran, with an area of approximately 1.65 million km2 in Southwest Asia, is situated between latitudes 25 and 40° N and longitudes 44 and 64° E (Fig. 1a). This geographical location places Iran at the heart of the Northern Hemisphere's arid and semi-arid belt and at the crossroads of large-scale atmospheric circulation patterns. However, Iran's unique characteristic, which makes it an ideal natural laboratory for this research, is its highly complex topography and extreme climatic contrasts. The country's physical landscape is dominated by two massive mountain ranges: the Alborz mountain range in the north, which creates a barrier against the intrusion of moisture from the Caspian Sea, and the Zagros mountain range, which extends from northwest to southeast and acts as a primary obstacle to Mediterranean and westerly rain-bearing systems. These two mountain ranges, alongside the two vast hyper-arid deserts of Dasht-e Kavir and Dasht-e Lut in the central plateau, create exceptionally steep climatic gradients over relatively short geographical distances (Heydarizad et al., 2018; Saemian et al., 2022).
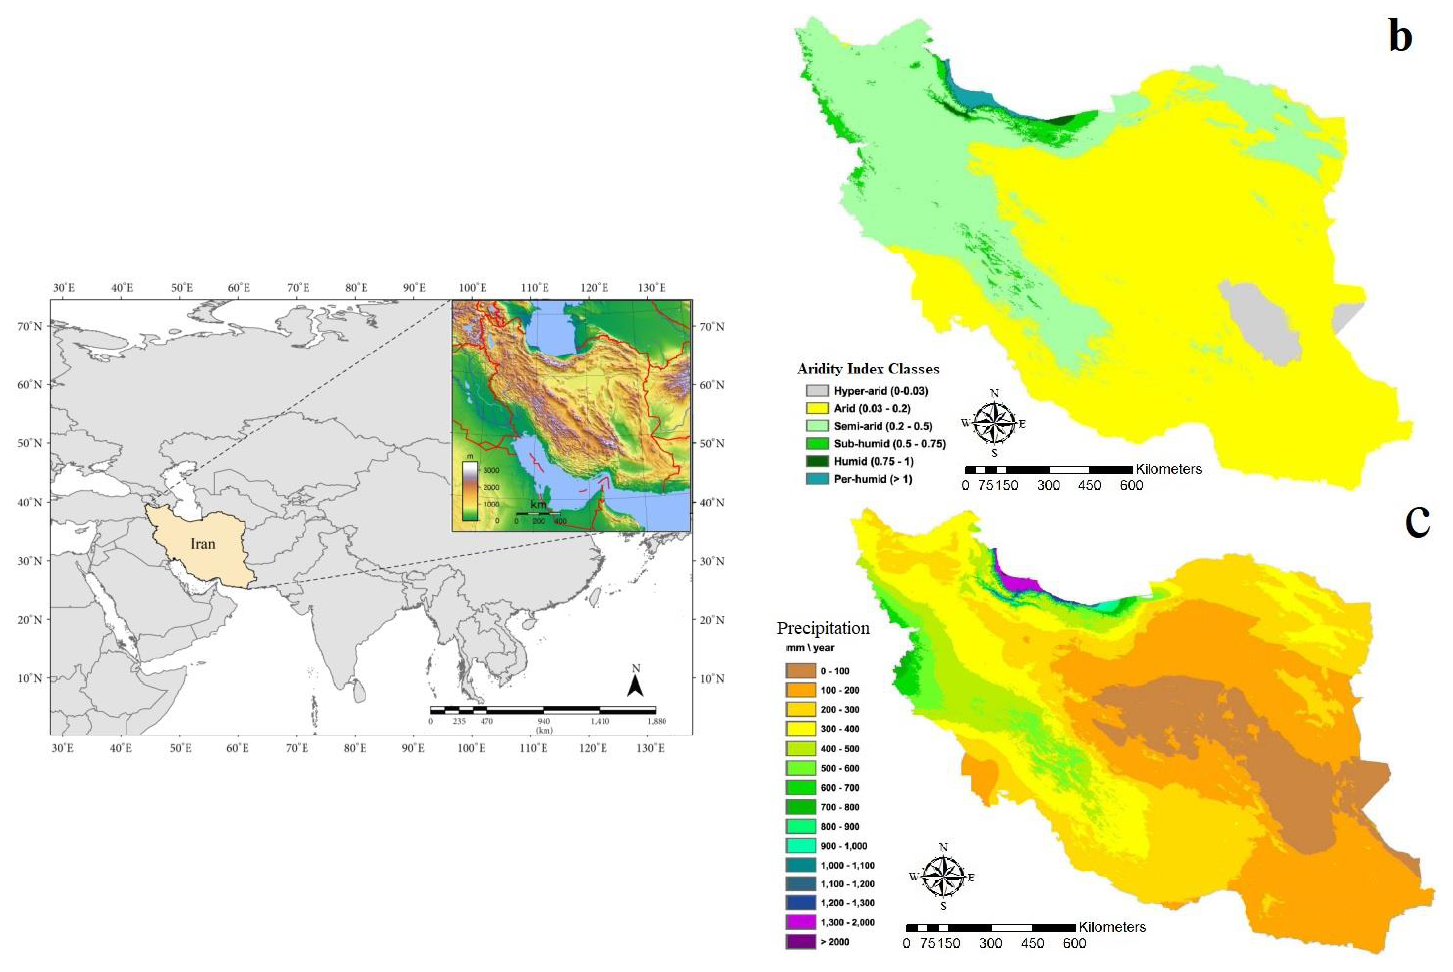
Figure 1(a) Geographical location of Iran in Southwest Asia, showing the region's topography; (b) climatic zonation of Iran based on the UNESCO aridity index classes, calculated from the ratio of annual precipitation (P) to potential evapotranspiration (PET) (De Pauw et al., 2018); (c) spatial distribution of mean total annual precipitation (in mm) across Iran (De Pauw et al., 2018).
This prominent configuration has transformed Iran into a climatic mosaic where almost all moisture regimes, from hyper-arid to hyper-humid, are found. Analysis of climatic data indicates that approximately 97 % of the country's area falls within the realm of hyper-arid, arid, and semi-arid climates. As shown in Fig. 1b, based on the UNESCO (1979) classification, vast areas of the central, eastern, and southern parts of the country experience hyper-arid conditions. In stark contrast to these conditions, the southern coastal strip of the Caspian Sea and the northern slopes of the Alborz experience humid and even hyper-humid climatic regimes. This extreme climatic diversity provides a unique opportunity to test the hypothesis of whether different forecasting paradigms (autoregressive, teleconnection-driven, and hybrid) exhibit variable performance across different hydroclimatic regimes.
The spatial distribution of mean annual precipitation (Fig. 1c) quantitatively illustrates these contrasts. While the country's average total precipitation is estimated to be around 225 mm, this value conceals a massive spatial variability: from less than 100 mm in the central deserts to over 1500 and even 2000 mm in parts of the Caspian coasts (Katiraie-Boroujerdy et al., 2020). This precipitation pattern is strongly controlled by the interaction between large-scale atmospheric circulation and local topography. The orographic lift of atmospheric systems over the western slopes of the Zagros and the northern slopes of the Alborz leads to significant precipitation in these regions, while the “rain shadow” effect causes severe aridity in the central Iranian plateau (Alijani, 1997). This complex interaction makes Iran a region where simple and simultaneous relationships between variables are expected to break down, and nonlinear and time-lagged patterns (which form the core of teleconnection analysis) play a dominant role. Therefore, a comparative assessment of models that rely solely on the system's internal memory (autoregressive) versus models that leverage teleconnection-based drivers, within such a complex setting, can lead to fundamental and generalizable findings for the science of drought forecasting.
This research is built upon a multi-layered methodological framework designed to comparatively assess competing paradigms in drought forecasting (autoregressive versus teleconnection-driven) within a complex geographical context. This process comprises three main components: (1) the collection and quality control of two fundamental datasets: station-based precipitation data and teleconnection indices; (2) the calculation of the drought index as the target variable; and (3) the development and evaluation of a diverse suite of machine learning models under different input scenarios.
3.1 Research Datasets: From Local Observations to Global Drivers
To address the research questions, two distinct yet complementary datasets were collected and processed for a 30-year period (January 1993 to December 2022).
3.1.1 Station Precipitation Data and Quality Control
The foundation of the drought analysis in this study is monthly total precipitation data, obtained from the observational network of the Iran Meteorological Organization (IRIMO) for 96 selected synoptic stations. These stations (Fig. 2) were chosen to provide optimal spatial coverage of Iran's diverse climatic regions, from the humid northern coasts to the hyper-arid central and southern deserts. Recognizing that the quality of input data determines the validity of modeling results, a rigorous Quality Assurance/Quality Control (QA/QC) protocol was applied to all time series. This protocol involved two essential steps:
- a.
Data Completeness Check: All 96 time series for the 360-month study period were inspected for missing data, and it was confirmed that there were no gaps in the records.
- b.
Homogeneity Testing: To ensure that the variability present in the precipitation time series is solely due to climatic processes and not non-natural factors (such as station relocation, instrument changes, or changes in surrounding land use), the homogeneity of each time series was assessed using a suite of four standard statistical tests: the Standard Normal Homogeneity Test (SNHT), the Buishand range test, the Pettitt test, and the Von Neumann ratio test. This set of tests, recommended by Wijngaard et al. (2003), has a high capability to detect inhomogeneities caused by both abrupt shifts and gradual trends. The results confirmed that all utilized time series were homogeneous and suitable for subsequent analyses.
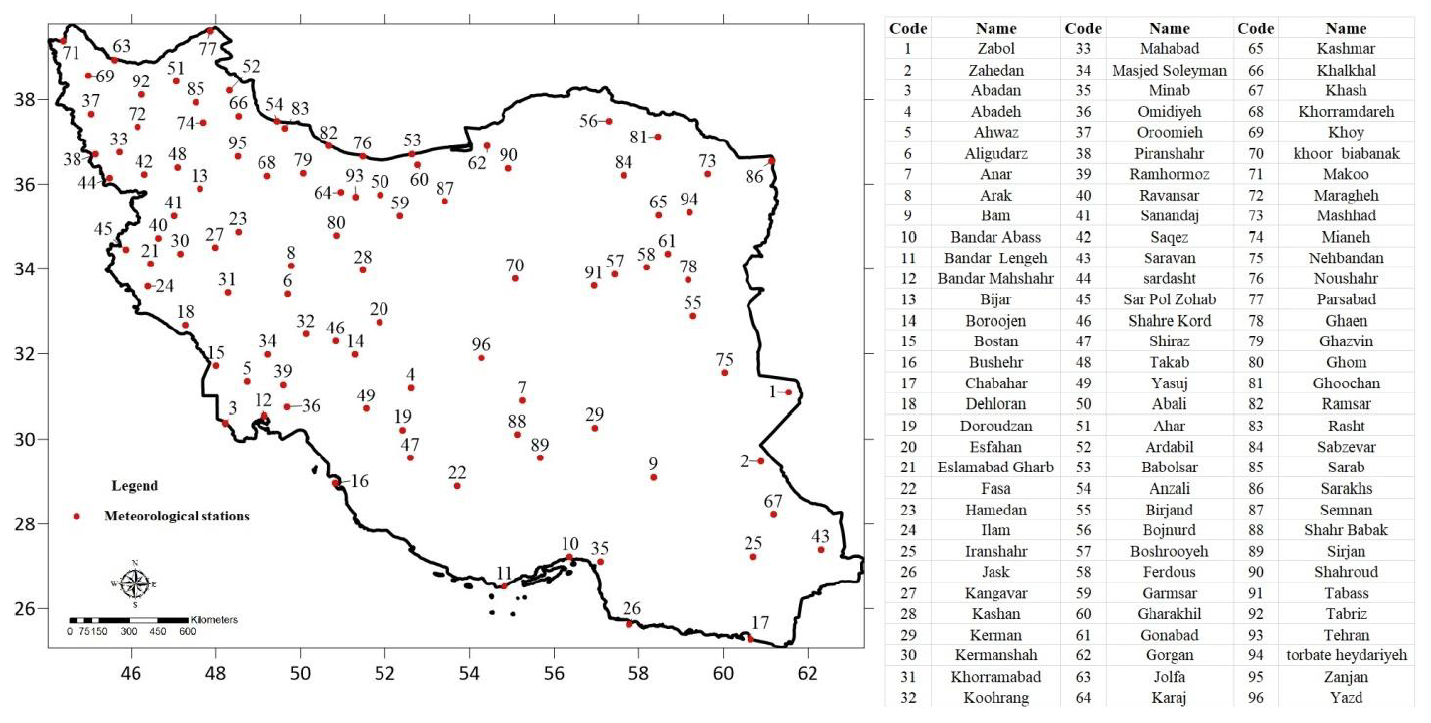
Figure 2Spatial distribution of the 96 selected synoptic meteorological stations across Iran. The numerical code for each station is indicated on the map, and its corresponding name is provided in the legend table next to the map. This network covers Iran's extensive climatic diversity for the subsequent analyses.
3.1.2 Large-Scale Climate Indices (Teleconnections)
To evaluate the forecasting paradigm based on physical drivers, a comprehensive set of 19 global teleconnection indices, which quantify natural oscillations in the ocean-atmosphere system, were selected. These indices, extracted as monthly time series from the reputable databases of the National Centers for Environmental Prediction (NCEP) and the Climate Prediction Center (CPC) at the National Oceanic and Atmospheric Administration (NOAA), represent key dynamics from the three main oceanic basins: the Pacific, Atlantic, and Indian Oceans (Table 1).
Table 1Specifications of the set of 19 global teleconnection indices used in this research as physical predictors. The indices are categorized based on their primary oceanic basin and associated physical phenomenon.
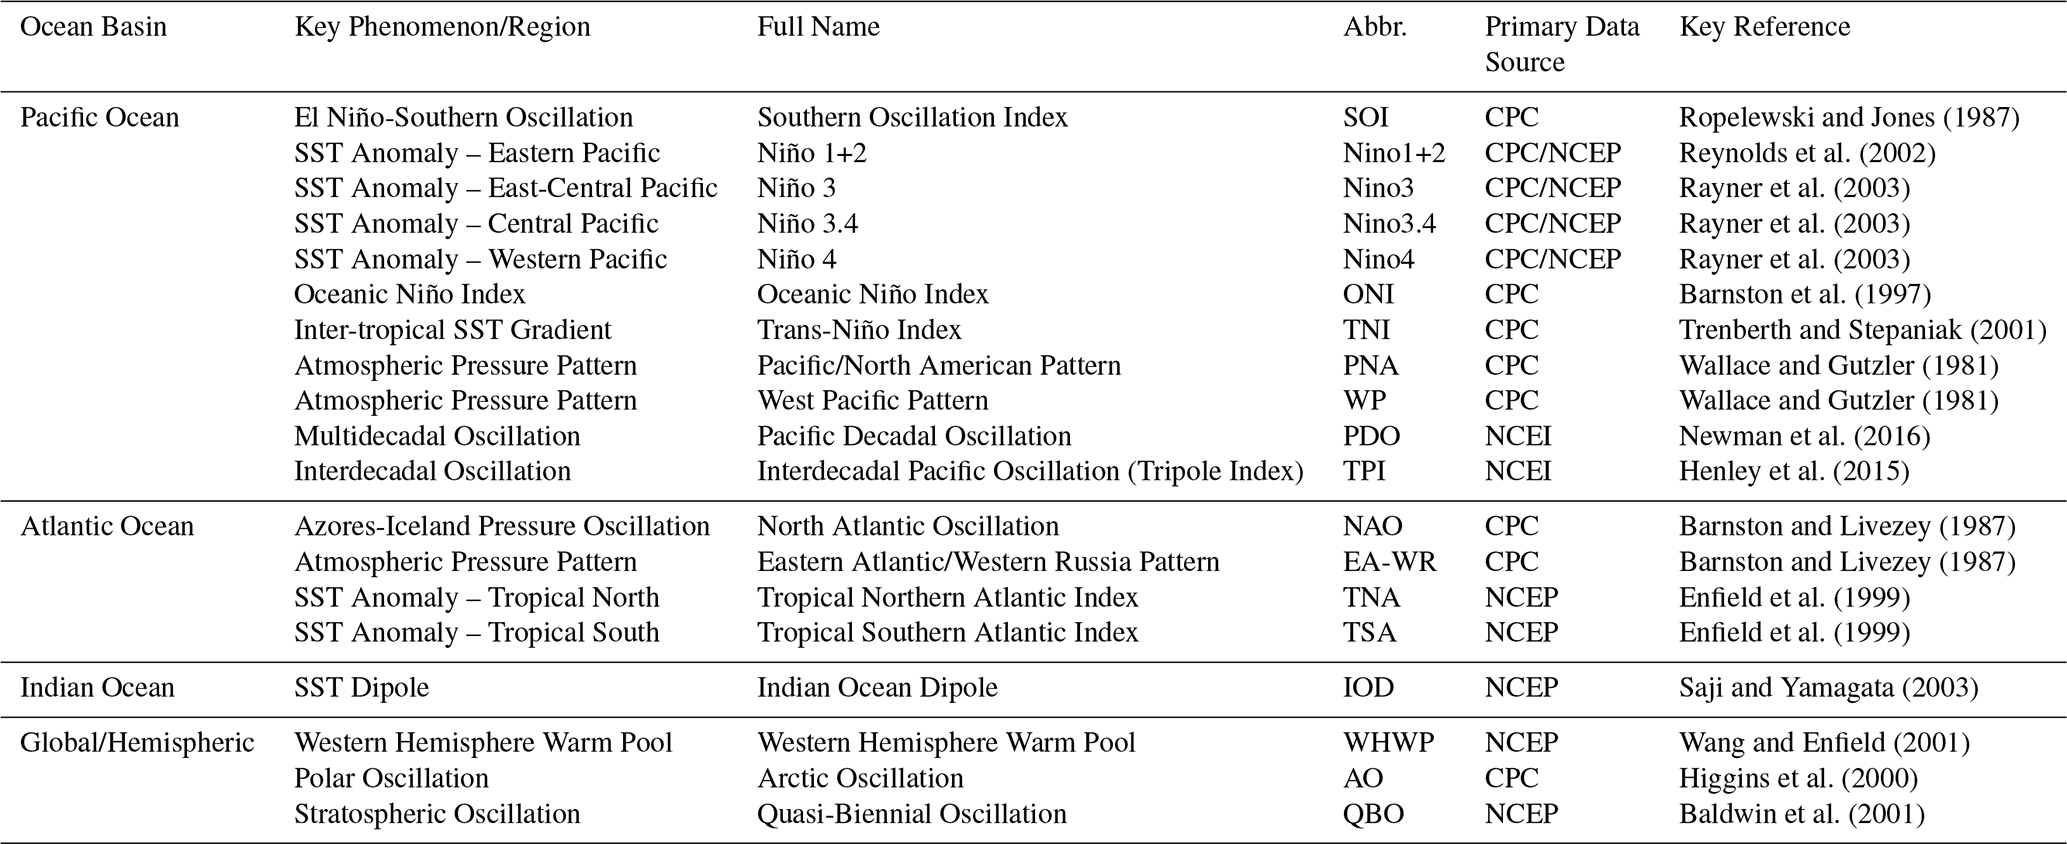
Abbreviations: CPC: Climate Prediction Center; NCEP: National Centers for Environmental Prediction; NCEI: National Centers for Environmental Information; SST: Sea Surface Temperature.
The selection of this extensive set of predictors was guided by previous climatological literature and prior empirical and dynamical studies that have demonstrated the influence of large-scale climate signals on precipitation and drought variability in Iran (e.g., Mahmoudi et al., 2026a, b; Barlow et al., 2016, 2002). Going beyond commonly used indices (such as ENSO and NAO), this comprehensive set was intended to cover the complex network of potential climatic influences on Iran. These indices are not merely statistical variables; rather, each represents a distinct physical state in the general circulation of the atmosphere and ocean. They modulate global-scale pressure patterns and moisture pathways through atmospheric Rossby waves, thereby creating predictability on seasonal to multi-year timescales (Tozer and Kiem, 2017). The inclusion of indices from the Atlantic Ocean (e.g., AMO, TNA, TSA) and other less-studied patterns (e.g., WP, EA-WR) allows for a more comprehensive identification of the sources of drought variability in Iran.
3.2 Calculation of the Drought Index as the Target Variable
The target variable in this research is the Standardized Precipitation Index (SPI), which is recognized by the World Meteorological Organization (WMO) as a global standard for quantifying meteorological drought (Lorenzo et al., 2024). This index, introduced by McKee et al. (1993), measures the deviation of cumulative precipitation over a specific period (a k-month timescale) from its long-term mean, after normalization to a standard distribution. The main advantage of the SPI lies in its independence from the climatic conditions of a region and the comparability of its results across different temporal and spatial scales (Tsesmelis et al., 2023). The process of calculating the SPI for each station includes the following steps (Ghaemi et al., 2024a):
-
Creating cumulative precipitation time series for the desired timescales (e.g., 1-month, 3-month, 6-month, etc.).
-
Fitting a probability distribution function, typically the two-parameter gamma function, to each cumulative time series.
-
Transforming the cumulative probability obtained from the gamma function into a standard normal variable with a mean of zero and a variance of one. The final value of this variable is the SPI.
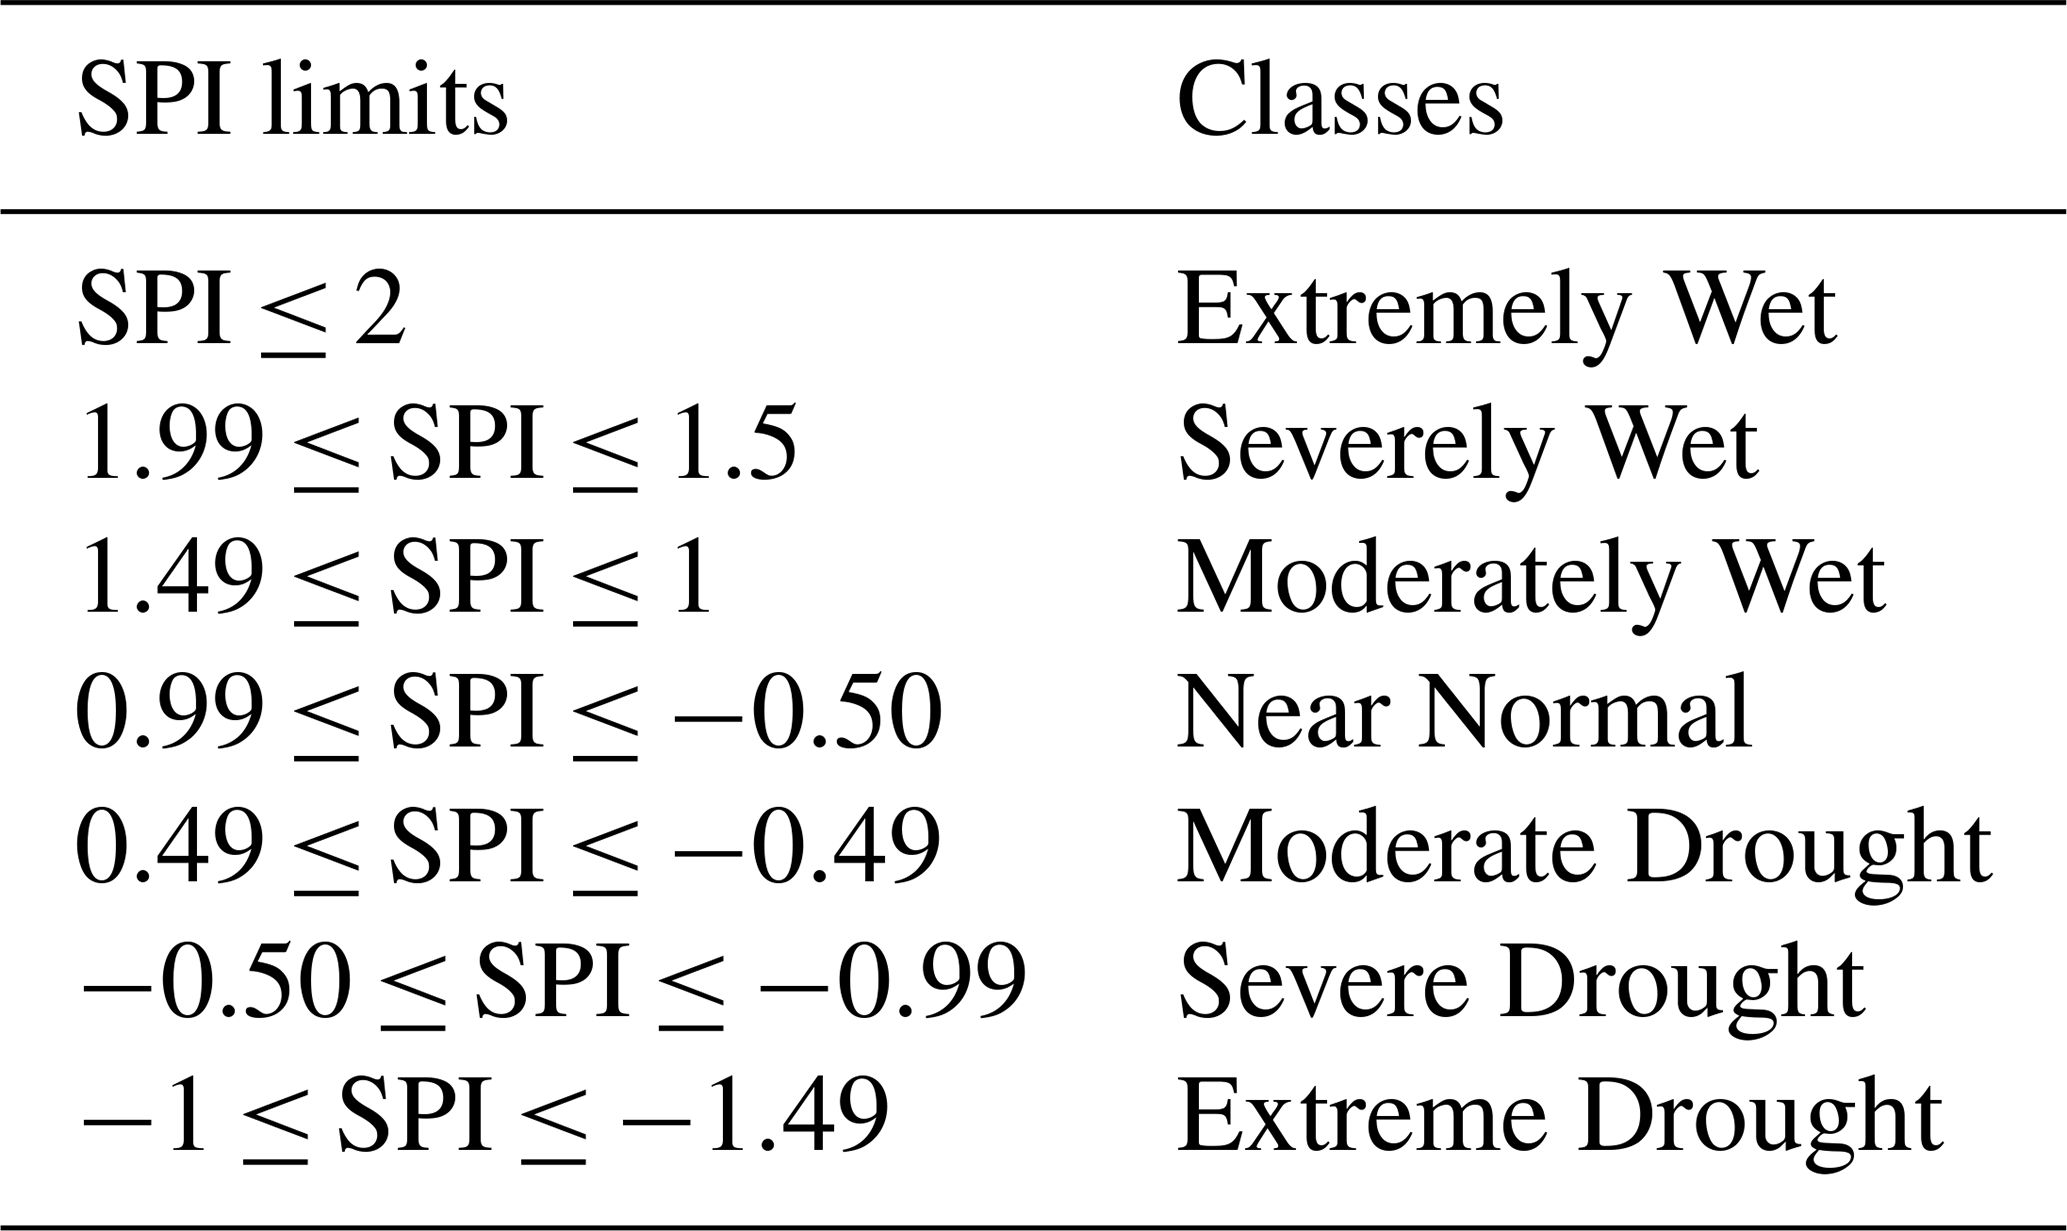
This process is performed using standard numerical approximations for the transformation of the gamma distribution to the standard normal distribution (Rezaiy and Shabri, 2025). The resulting SPI values classify the intensity of wet (positive values) and dry (negative values) conditions (Table 2). In this research, the SPI is used as a proxy for drought status and serves as the dependent variable in all forecasting models.
Table 2Classification of climatic conditions based on the Standardized Precipitation Index (SPI) values (adapted from McKee et al., 1993).
3.3 Modeling Paradigms and Experimental Framework
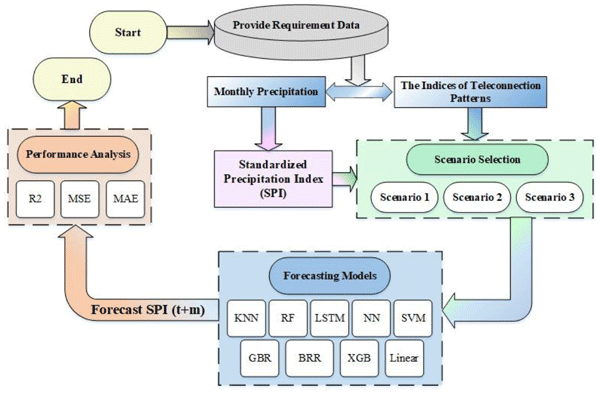
The core of this research is the design and implementation of a comprehensive comparative experiment to evaluate competing paradigms in drought forecasting. This framework is built upon three distinct input scenarios and a diverse set of forecasting algorithms (Fig. 3).
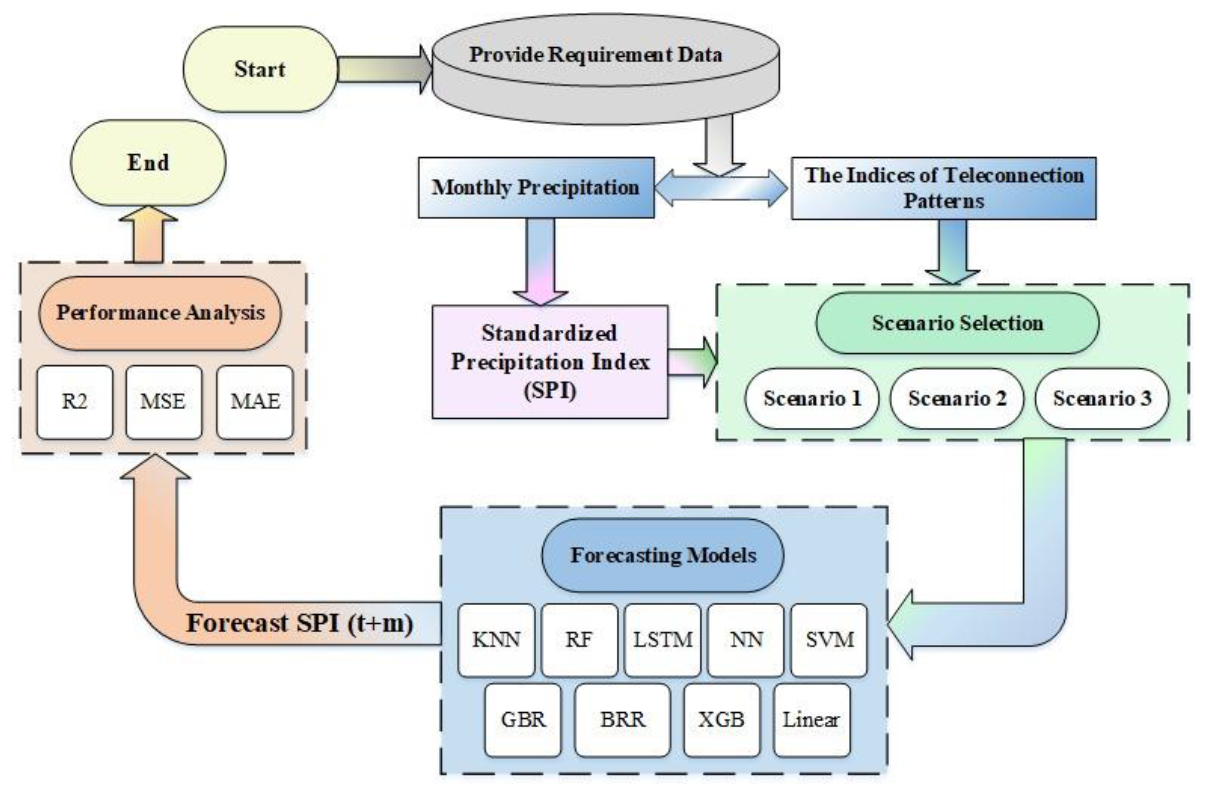
Figure 3Methodological framework of the research for short-term drought forecasting in Iran. This flowchart illustrates the step-by-step process, from the ingestion of raw data (precipitation and teleconnection indices), calculation of the SPI, design of input scenarios, training of a suite of machine learning models, to the final performance evaluation and selection of the optimal model.
3.3.1 Designing Input Scenarios: From Large-Scale Climate Drivers to Temporal Memory
To address the fundamental research questions and identify the primary sources of predictability, three main families of scenarios were designed for the models' input structure, each representing a different forecasting philosophy.
-
Scenario 1 (S1): Based on Large-Scale Climate Drivers: This scenario is founded on the hypothesis that the primary source of drought predictability on a monthly scale lies not in local history, but in the current state of the global climate system. In this scenario, the model inputs consist exclusively of the values of the 19 teleconnection indices with time lags of 1 to 3 months (Telet−1, Telet−2, Telet−3).
-
Scenario 2 (S2): Autoregressive with Increasing Temporal Memory: This family of scenarios represents the classic time-series forecasting paradigm, where information is extracted solely from the history of the variable itself (SPI). To test the importance of the system's memory length, this scenario was divided into four subsets, as detailed in Table 3. This design allows us to identify the optimal depth of temporal memory required for forecasting in a data-driven manner.
-
Scenario 3 (S3): Hybrid: This family of scenarios seeks to test the synergistic potential of the two preceding paradigms. This approach investigates whether adding knowledge of the global climate state (large-scale climate drivers) can improve predictions based on temporal memory (autoregressive). The structure of these scenarios is presented in Table 4.
Table 3Structure of the autoregressive sub-scenarios (S2 family) for evaluating the impact of temporal memory length.
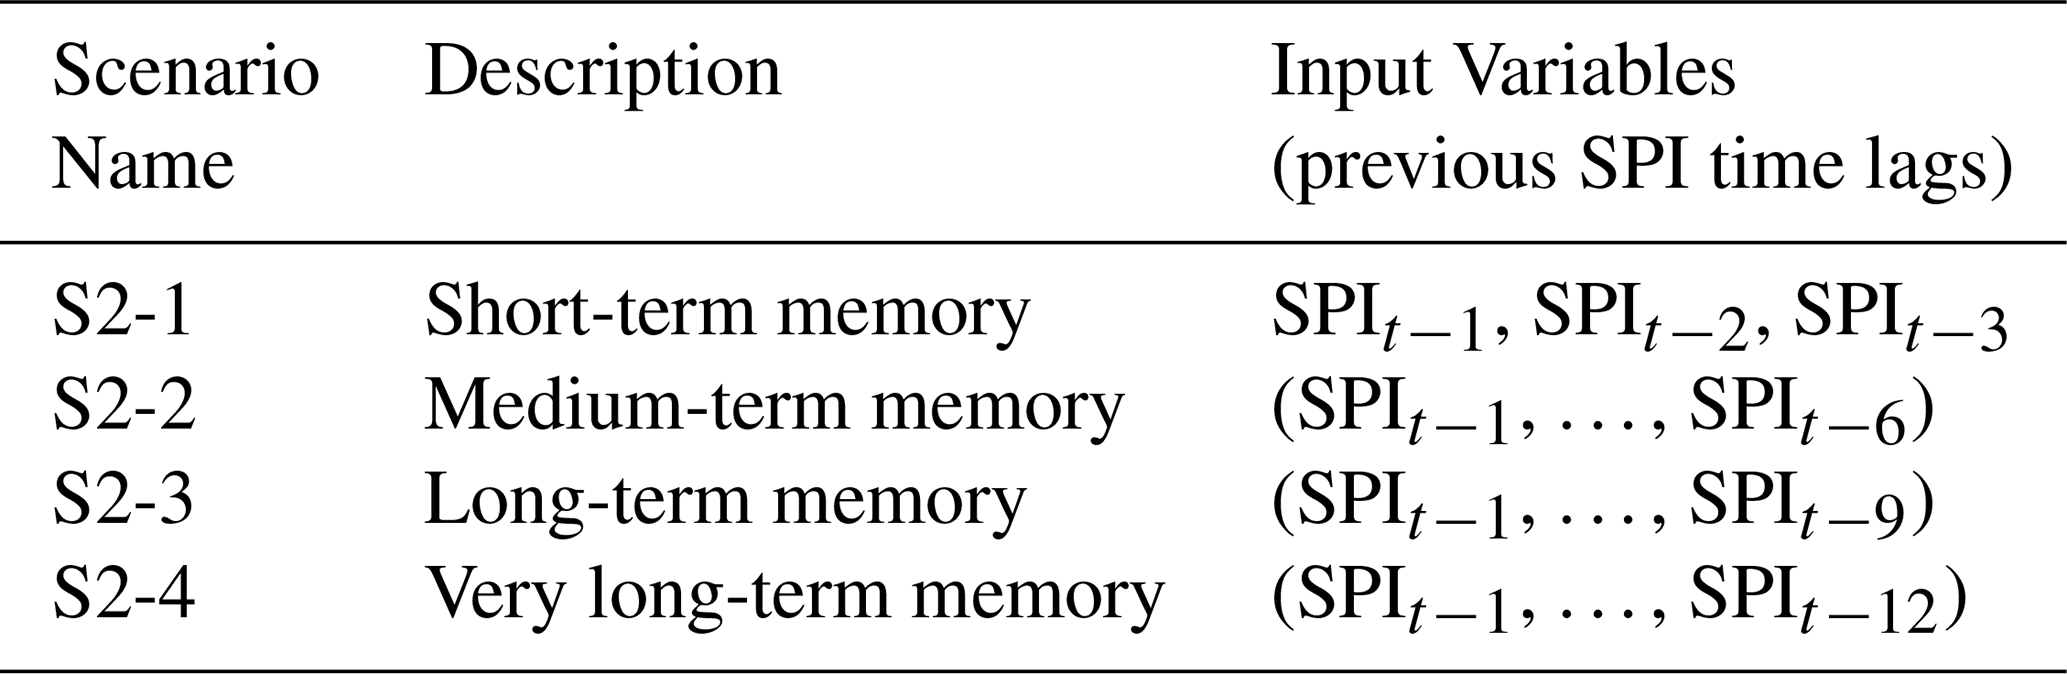
Table 4Structure of the hybrid sub-scenarios (S3 family) for evaluating the synergistic effect.

For all scenarios, the models' objective is to predict SPI values for forecasting horizons of 1, 2, and 3 months ahead (SPIt+1, SPIt+2, SPIt+3).
3.3.2 Suite of Forecasting Algorithms
To ensure that the comparison of scenarios is not dependent on a specific model and that the results are sufficiently robust, a diverse suite of ten machine learning and deep learning algorithms was employed. This collection covers a wide spectrum from simple linear models to highly complex nonlinear structures.
-
Baseline Models:
-
Multiple Linear Regression (MLR): Utilized as a simple linear model to establish a baseline for gauging the performance of more complex models (Manriquez-Padilla et al., 2023).
-
K-Nearest Neighbors (KNN): A non-parametric, instance-based algorithm that is capable of capturing local nonlinear relationships by identifying similar samples in the feature space (Zhou et al., 2024).
-
-
Classic Machine Learning Models:
-
Artificial Neural Network (ANN): A Multilayer Perceptron (MLP) trained with the Levenberg-Marquardt optimization algorithm, recognized as a universal approximator for modeling complex nonlinear relationships (Mohammadi, 2023).
-
Least Squares Support Vector Machine (LS-SVM): A computationally efficient version of SVM that trains the model by solving a system of linear equations instead of a quadratic programming problem. To comprehensively evaluate its performance, two distinct kernel functions were implemented in this study: the Radial Basis Function (SVM-RBF) for capturing complex non-linear patterns, and the Polynomial kernel (SVM-Poly) for modeling polynomial relationships in a high-dimensional feature space (Saravanan et al., 2023; Zhang et al., 2023).
-
-
Tree-Based Ensemble Models:
-
Random Forest (RF): A powerful ensemble model that reduces variance and prevents overfitting by aggregating the predictions of a large number of independent decision trees, each built on bootstrap subsamples of the data (Islam et al., 2023; Ghaemi et al., 2024b).
-
Gradient Boosting Regression (GBR): A boosting algorithm that sequentially and additively builds models (typically decision trees), such that each new model attempts to correct the errors of the previous one (Zhang et al., 2021; Wu et al., 2024).
-
Extreme Gradient Boosting (XGBoost): A highly optimized, scalable, and engineered implementation of the gradient boosting framework. XGBoost has gained global renown in data science competitions and practical applications for its high speed and accuracy, achieved through techniques like parallelization, regularization to prevent overfitting, and handling of missing values (Alipour, 2025; Niazkar et al., 2024).
-
Bayesian Ridge Regression (BRR): A probabilistic regression model that applies a Bayesian approach to linear regression. Instead of finding a single value for the regression coefficients, it estimates a probability distribution for them. This feature, by imposing a prior on the parameters, naturally regularizes the model and makes it robust against overfitting, particularly when the number of features is large (Reddy et al., 2024; Snaan and Shukur, 2025).
-
-
Deep Learning Model:
-
Long Short-Term Memory (LSTM): An advanced type of Recurrent Neural Network (RNN) specifically designed to learn long-term dependencies in sequential data and time series. Its gated memory architecture (input, output, and forget gates) allows it to selectively retain or discard relevant information over long sequences, thereby overcoming the vanishing gradient problem of standard RNNs (Li et al., 2023; Tang et al., 2025).
-
3.3.3 Performance Evaluation and Assessment Metrics
To quantitatively evaluate and compare the performance of the models during the testing phase, three standard statistical metrics were employed. These metrics cover various aspects of the prediction error:
-
Coefficient of Determination (R2): A metric that measures the proportion of the variance in the target variable explained by the model. Values approaching 1 indicate a better model fit.
-
Mean Squared Error (MSE): This metric computes the average of the squared differences between observed and predicted values, thus giving greater weight to larger errors.
-
Mean Absolute Error (MAE): Represents the average of the absolute prediction errors, disregarding their direction, which makes it easily interpretable.
The formulas for these metrics are as follows, respectively:
where Oi are the observed values, Pi are the predicted values, and are the mean of the observed and predicted values, respectively, and N is the total number of observations in the test set (Mesgari et al., 2024).
4.1 Predictability Based on Large-Scale Climate Drivers (Scenario S1)
This section evaluates the capability of large-scale climate drivers (teleconnection indices) to forecast drought conditions across increasing lead times. The comprehensive evaluation of nine machine learning algorithms across 96 stations revealed a distinct hierarchy in model performance. As illustrated in Fig. 4, ensemble-based learning models, specifically Random Forest (RF), Gradient Boosting Regression (GBR), and Extreme Gradient Boosting (XGBoost), alongside the Long Short-Term Memory (LSTM) deep learning network, consistently outperformed simpler algorithms such as Linear Regression and K-Nearest Neighbors (KNN). Among these, the Random Forest (RF) model demonstrated the highest stability and accuracy across diverse climatic zones – evident in the high R2 values for the 1-month lead time (SPIt+1) shown in the bar charts – and was therefore selected as the representative algorithm for the subsequent spatial analysis.
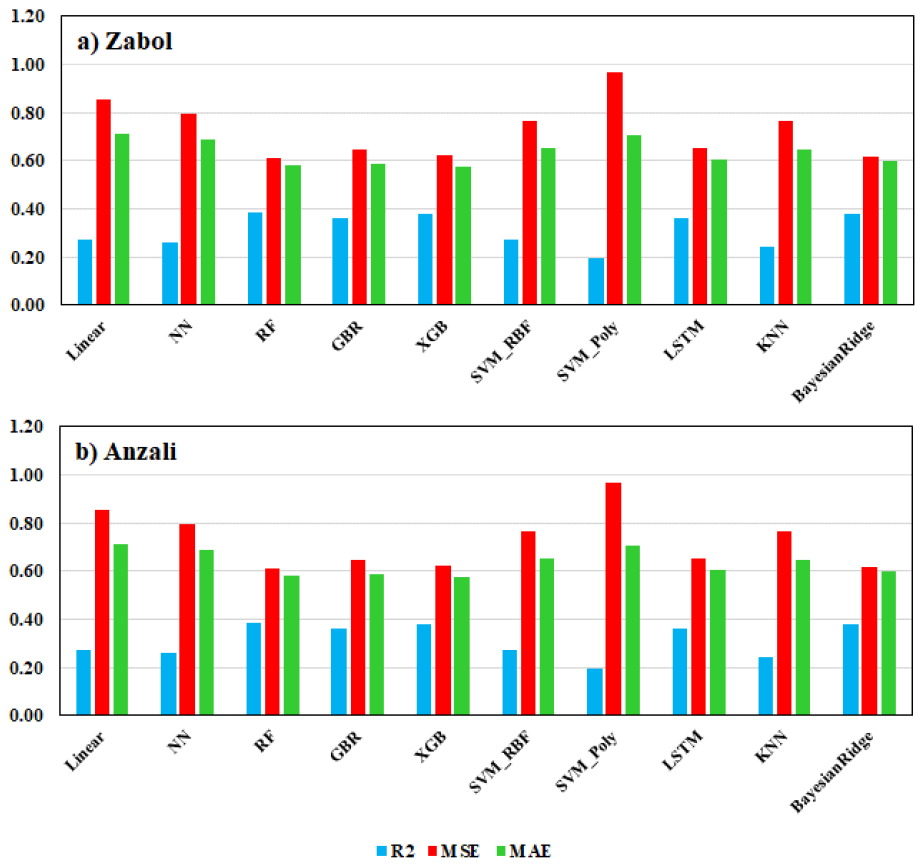
Figure 4Performance comparison of different machine learning algorithms for 1-month-ahead drought forecasting (SPIt+1) under Scenario S1 across selected representative stations. The Random Forest (RF) model demonstrates superior accuracy and lower error rates compared to other models.
The geographical distribution of forecast skill highlights a strong dependency on regional hydroclimatology, particularly in the short-term horizon where teleconnection signals are most potent. Figure 5 illustrates the spatial performance of the RF model for the 1-month lead time, representing the best-case scenario for teleconnection-based forecasting. The Coefficient of Determination (R2) map (Fig. 5a) reveals a high-accuracy band stretching from the northwest across the Caspian Sea coasts and the western slopes of the Zagros Mountains. In these regions, the teleconnection signals are strong enough to explain up to 50 % of the variance in the drought index. For instance, at the Anzali station (hyper-humid), where the climate is strongly modulated by large-scale circulation patterns, the accuracy reached an R2 of 0.57. Conversely, the model's explanatory power weakens considerably in the central, southern, and southeastern regions, where local convective processes often dominate over large-scale forcing.
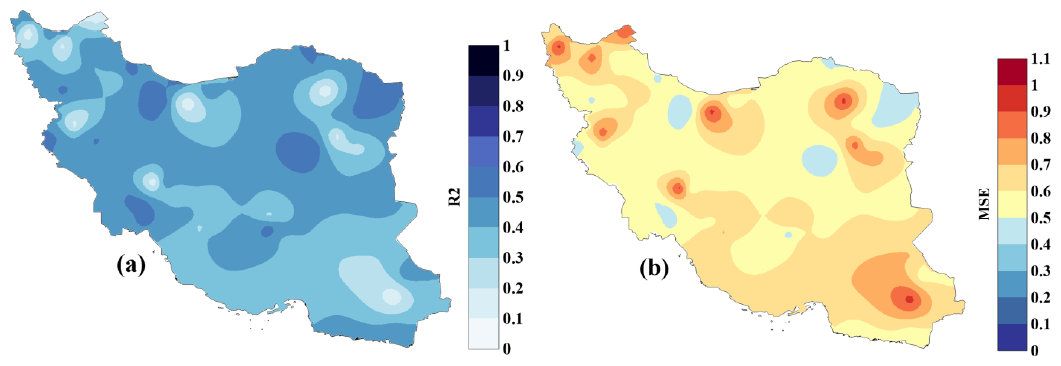
Figure 5Spatial distribution of the performance of the best-selected model (Random Forest) for 1-month-ahead drought forecasting (SPIt+1) under Scenario S1. (a) Coefficient of Determination (R2). (b) Mean Squared Error (MSE).
However, the robust initial signal observed at the 1-month horizon progressively decays as the forecast lead time extends. While the performance remained relatively stable in humid regions – potentially due to the lagged response of the Caspian Sea climate to large-scale drivers – it deteriorated significantly in arid regions. As detailed in the Supplement, extending the lead time to 2 and 3 months exposes the limitations of relying solely on teleconnections. By the 3-month horizon (SPIt+3), the spatial coherence observed in Fig. 5 begins to fragment, and the area of high predictability shrinks to scattered patches (see Maps in Fig. S2 in the Supplement). Furthermore, the competition among models tightens in these longer horizons; while RF maintains its lead, the Bayesian Ridge Regression (BRR) occasionally challenges its superiority (see Bar Charts in Fig. S1), suggesting that probabilistic approaches may better handle the heightened uncertainty of seasonal forecasting when the teleconnection signal fades.
4.2 Impact of Temporal Memory in Autoregressive Modeling (Scenario S2)
This section assesses the role of internal temporal memory – represented by antecedent SPI values with varying lag lengths (3, 6, 9, and 12 months) – in forecasting drought conditions across increasing lead times. The analysis of autoregressive patterns revealed a robust and consistent trend: increasing the length of the input temporal memory directly leads to improved performance for most machine learning models. Unlike the first scenario where ensemble tree models dominated, here the Long Short-Term Memory (LSTM) network, owing to its specialized architecture for learning long-term dependencies, emerged as the superior algorithm. As visually demonstrated in the heatmaps in Fig. 6, the transition from a short-term 3-month memory (S2-1) to a long-term 12-month memory (S2-4) resulted in a substantial leap in accuracy. For instance, at the Anzali station, the LSTM model's R2 improved significantly, while errors (MSE and MAE) decreased, confirming that longer historical sequences provide richer contextual information about the persistence and evolution of drought dynamics.
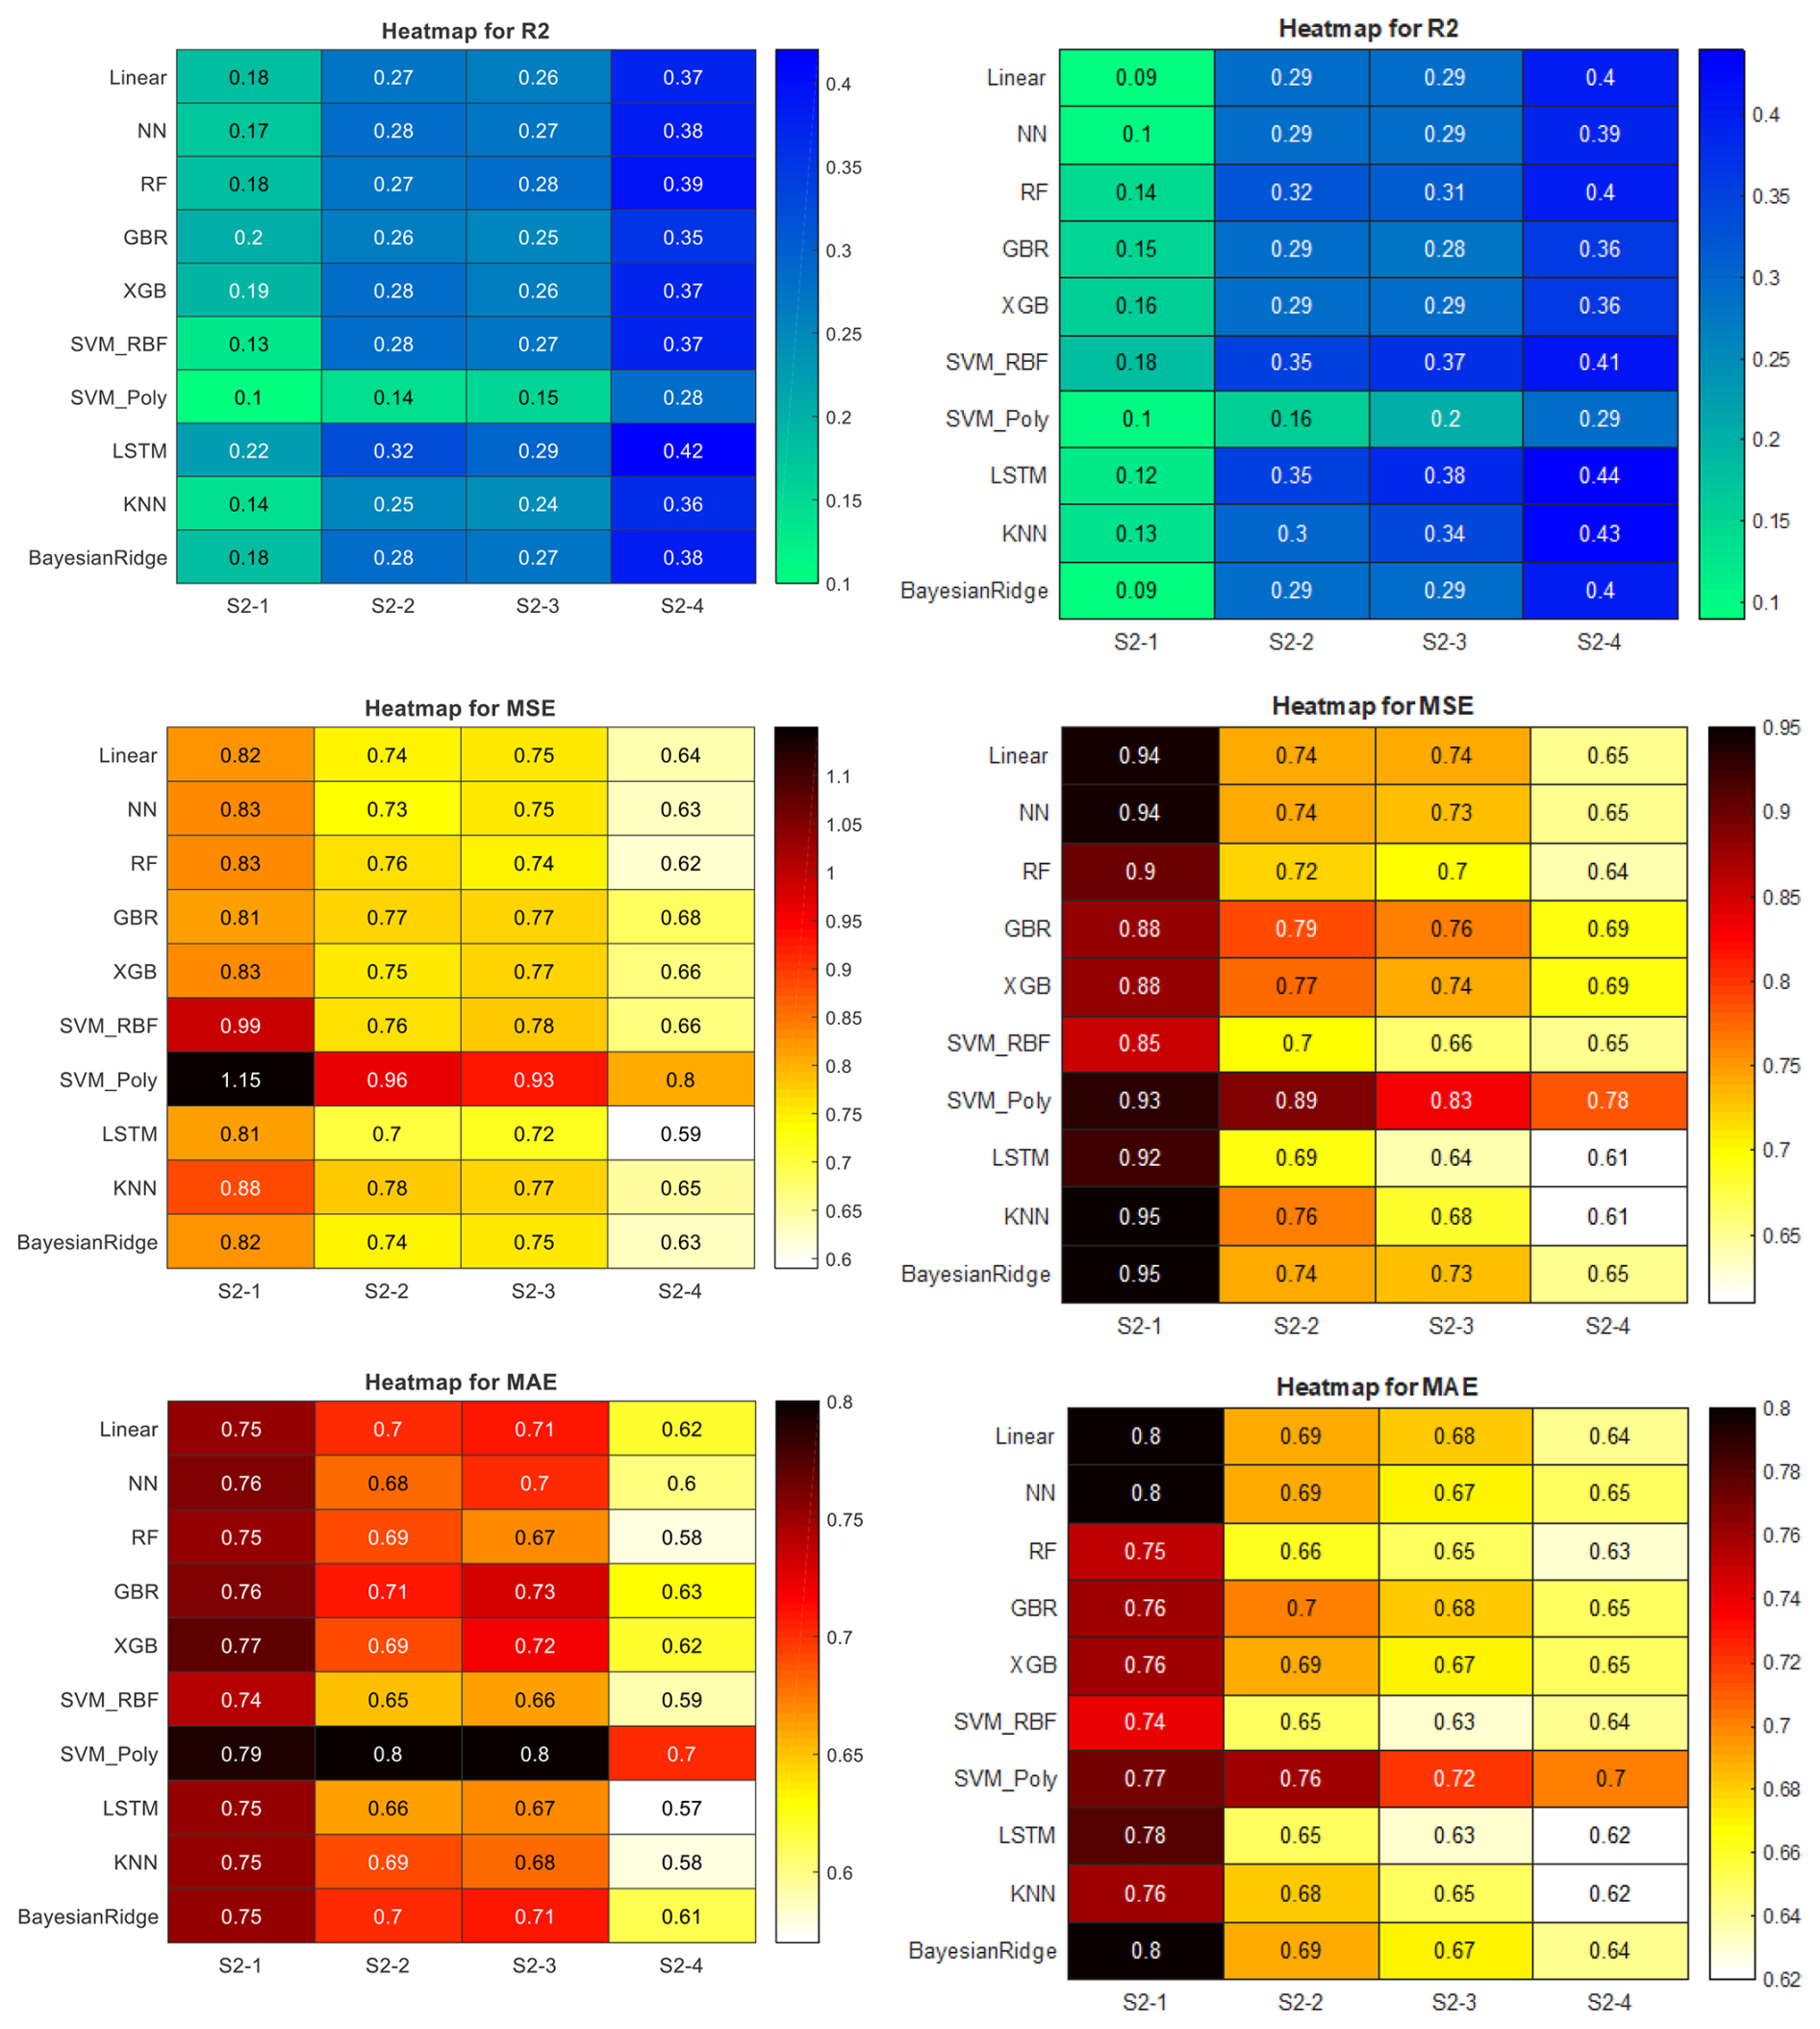
Figure 6Heatmap of performance metrics (R2 MSE, MAE) for 1-month-ahead SPI prediction (SPIt+1) at the Anzali (right columns) and Zabol (left columns) stations under four temporal memory scenarios (S2-1 to S2-4). The results clearly demonstrate that for most models, particularly LSTM, increasing the memory length from 3 months (S2-1) to 12 months (S2-4) leads to a substantial increase in R2 and a reduction in error, underscoring the importance of longer-term historical data.
The spatial distribution of this optimal configuration (LSTM with 12-month memory) for the 1-month lead time is presented in Fig. 7. Similar to Scenario S1, the highest forecast accuracy (R2 > 0.50) is concentrated in the western and northwestern regions, as well as parts of eastern Iran. This indicates that autoregressive signals are highly reliable in these areas for short-term forecasting. However, performance in the hyper-arid southeastern regions remains a challenge, likely due to the high frequency of zero-precipitation months which creates a time series with limited informative signal for the model to learn from.
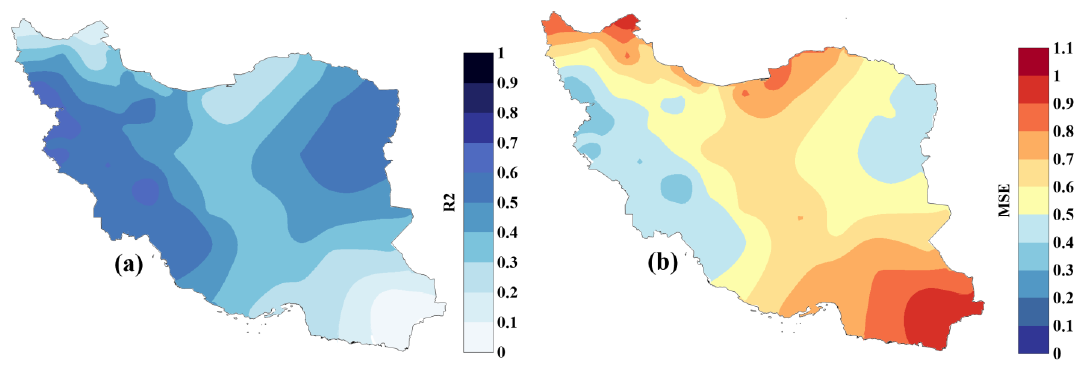
Figure 7Spatial distribution of the performance of the best-selected model (LSTM) with a 12-month memory input (S2-4) for 1-month-ahead drought forecasting (SPIt+1). (a) Coefficient of Determination (R2). (b) Mean Squared Error (MSE). The model demonstrates robust predictive capability in the west and northwest, while performance decreases in the hyper-arid southeastern regions.
As the forecast horizon extends to 2 and 3 months (t+2 and t+3), the reliance on long-term memory becomes even more critical, yet the overall predictability inevitably declines. The comprehensive results provided in the Supplement illustrate this decay. The heatmaps for longer lead times (Fig. S3 in the Supplement) show that while the 12-month memory input (S2-4) continues to yield the best results compared to shorter memory inputs, the absolute values of R2 drop. For example, at the Zabol station for the 2-month forecast, the LSTM model in the S2-4 configuration manages to maintain an R2 of 0.38, a significant recovery from the poor performance observed with shorter memory inputs, but still lower than the 1-month horizon. Spatially, this decay manifests as a shrinkage of the high-accuracy zones. As shown in the supplementary maps (Fig. S4), by the third month, the extent of regions with R2 > 0.50 is considerably reduced compared to Fig. 7, and the error values generally increase across the country. This suggests that while extending the input memory helps mitigate the loss of information over time, the persistence signal present in the SPI time series alone is insufficient to support reliable seasonal forecasting in many regions beyond the first month.
4.3 Synergy of Teleconnections and Temporal Memory: Evaluation of Hybrid Modeling (Scenario S3)
The third scenario investigates the synergistic potential of combining large-scale climate drivers with local temporal memory. Two hybrid input structures were evaluated: S3-1 (teleconnections + 3-month memory) and S3-2 (teleconnections + 6-month memory). In contrast to the memory-only scenario where LSTM excelled, the inclusion of climate indices saw the Random Forest (RF) model regain its position as the superior algorithm across all lead times, consistently achieving the highest R2 and lowest error rates.
The analysis of model performance revealed a critical finding: the optimal balance between external climate signals and internal memory depth is strictly climate-dependent. As illustrated in the radar charts for the first month (Fig. 8), there is a trade-off in complexity. At the hyper-humid Anzali station, the simpler structure (S3-1) outperformed the more complex one; increasing memory to 6 months (S3-2) actually degraded performance (lower R2, higher MSE), suggesting an over-complexity that offers no gain. Conversely, at the hyper-arid Zabol station, the extended memory of S3-2 was beneficial, significantly improving all metrics. This suggests that arid regions, with their erratic rainfall, require a longer history combined with teleconnections to establish a reliable trend.
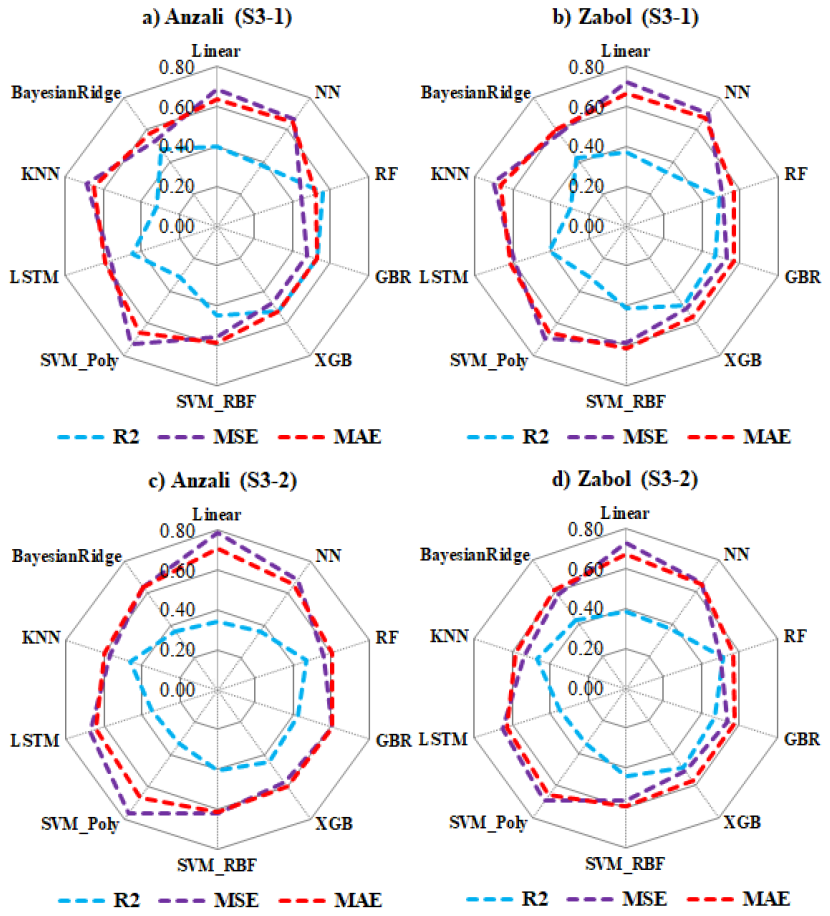
Figure 8Radar charts comparing the performance (R2 MSE, and MAE) of nine machine learning models for 1-month-ahead forecasting (SPIt+1) at the Anzali (humid) and Zabol (arid) stations. The comparison between S3-1 (3-month memory) and S3-2 (6-month memory) reveals a climatic dependency: while the shorter memory structure (S3-1) is sufficient and more accurate for the humid climate, the arid climate benefits from the extended memory of S3-2. Random Forest (RF) demonstrates superior performance in both cases.
This climatic dichotomy creates a distinct pattern of spatial complementarity across Iran, as mapped in Fig. 9. The S3-2 structure (right column) is dominant in the northern and western regions, providing high accuracy (R2=0.6). Meanwhile, the S3-1 structure (left column) acts as a necessary complement, offering significantly better predictions in the eastern and central regions where S3-2 struggles. This implies that a single hybrid configuration is not universally optimal; rather, an adaptive selection of memory length based on regional climate is required for maximum accuracy.
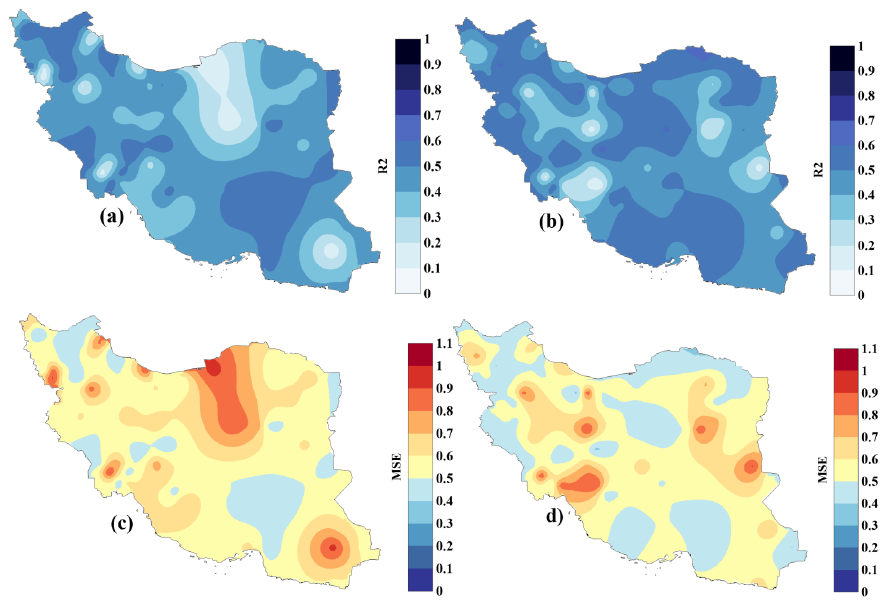
Figure 9Spatial distribution of the performance (R2 and MSE) of the superior Random Forest (RF) model for 1-month-ahead prediction (SPIt+1) under hybrid scenarios S3-1 and S3-2. The maps reveal a clear spatial complementarity: S3-2 (b, d) excels in the north and west, while S3-1 (a, c) provides necessary coverage and higher accuracy in the eastern and central regions.
Extending the forecast horizon to 2 and 3 months (t+2 and t+3) confirms the stability of this spatial pattern, despite the expected general decay in accuracy. The results for longer lead times, provided in the Supplement (Figs. S5 and S6 in Supplement), mirror the findings of the first month. Although the absolute R2 values decrease – for instance, Anzali's R2 drops but remains favorable for S3-1 – the spatial preference remains consistent: the north/west continues to favor S3-2, while the east favors S3-1. This consistency across time horizons validates the hybrid approach, proving that even as predictive power fades with time, the structural preference of each climatic zone remains robust.
4.4 Final Comparative Analysis: Identifying Regionally Optimal Scenarios
In this final stage, the top-performing models from each of the three scenarios (S1, S2, and S3) were compared side-by-side to identify the definitive optimal input structure for each climatic region. Table 5 summarizes these results for the 1-month lead time (SPIt+1). A simultaneous analysis of performance metrics across all lead times reveals a crucial conclusion: no single input structure is universally optimal for Iran; rather, the choice depends heavily on regional hydroclimatology.
Table 5Performance comparison of the best-selected models from each of the three main scenarios (S1, S2, S3) for 1-month-ahead forecasting of the SPI index (SPIt+1) at sample stations. This table presents the statistical metrics R2 MSE, and MAE to facilitate the selection of the optimal input structure in different climatic regions of Iran and highlights the geographical dependency of the models' performance. Values in bold font indicate the best performance for each statistical metric per station.
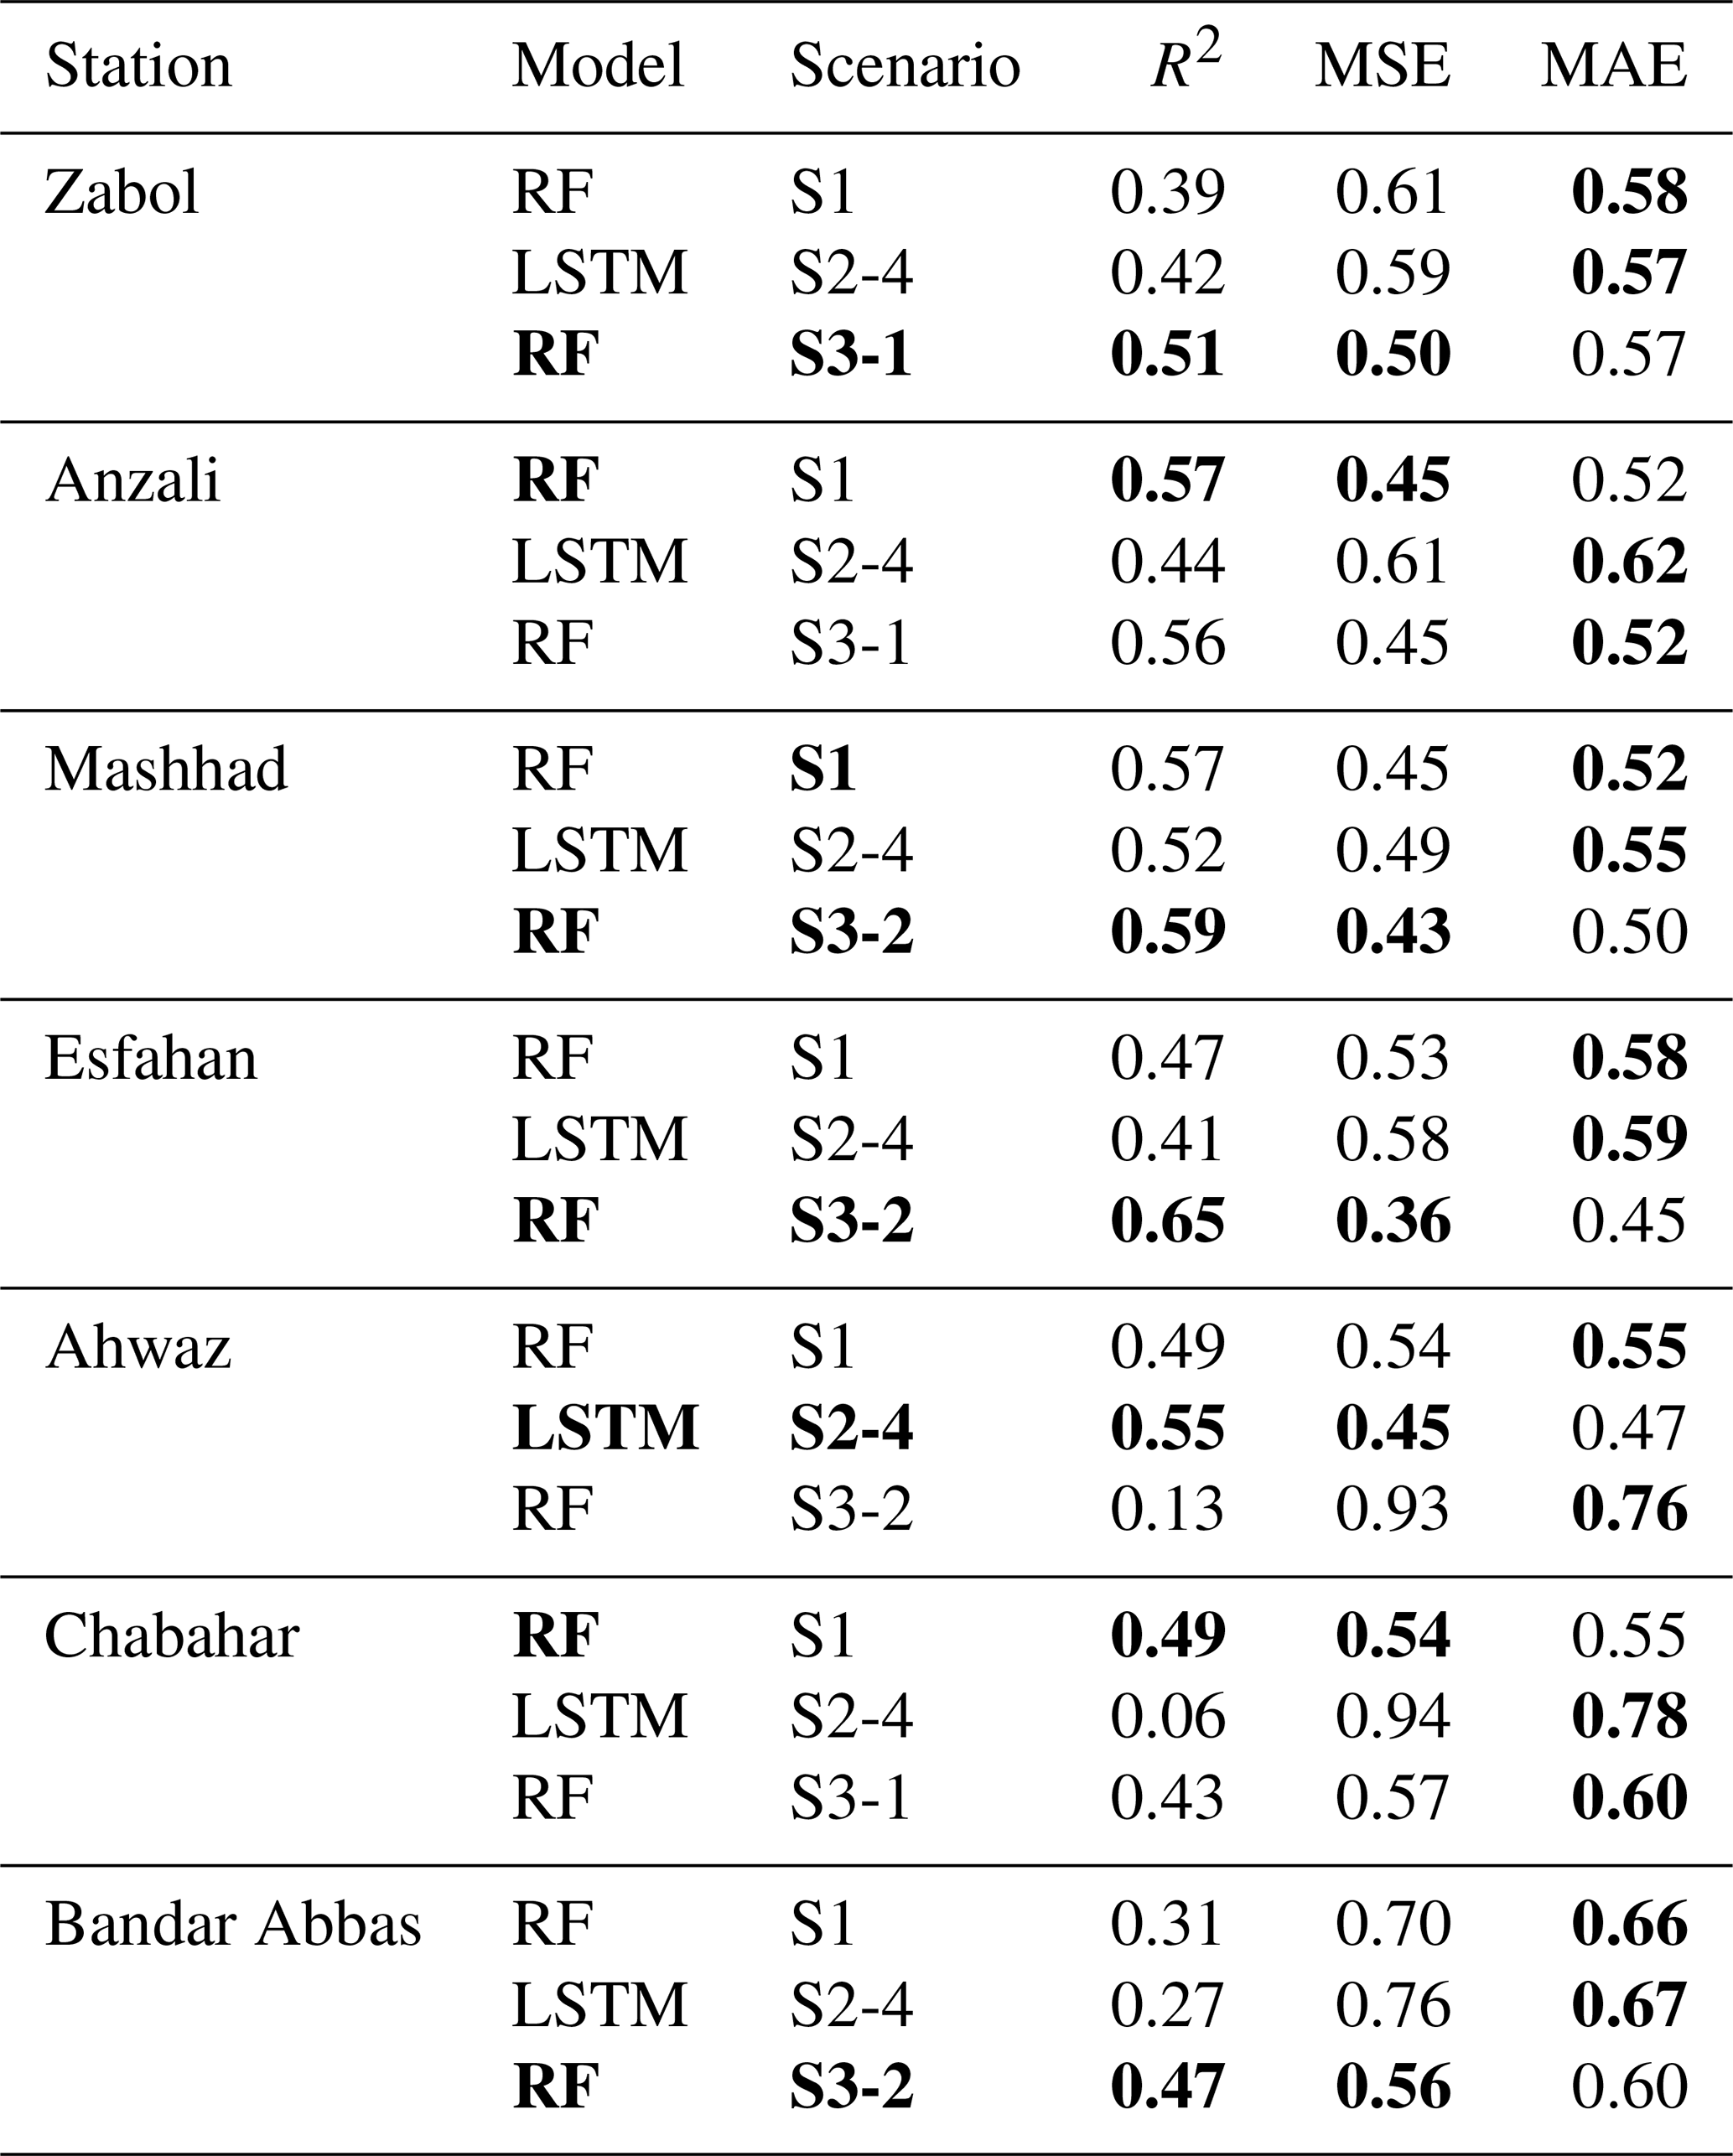
Dominance of Hybrid Models (S3) in the Central Plateau: In the arid and semi-arid regions covering the central plateau (e.g., Isfahan, Zabol, Bandar Abbas), the hybrid scenario (S3) demonstrated decisive superiority. For instance, in Isfahan, the S3-2 structure achieved an outstanding (R2=0.65) with the lowest error (MSE = 0.36), outperforming both the teleconnection-only and memory-only models. This confirms that in water-stressed regions with erratic rainfall, reliable forecasting requires the synergy of physical climate drivers and extended historical memory.
Superiority of Teleconnections (S1) in Coastal and Irregular Regimes: Conversely, in regions with complex atmospheric dynamics or highly irregular precipitation regimes, such as Chabahar and Anzali, the teleconnection-based scenario (S1) frequently emerged as the winner. Notably, in Chabahar, S1 provided a robust (R2=0.49), whereas the memory-based model struggled significantly. This indicates that local temporal memory is unreliable in these areas, and large-scale climate drivers provide a more stable predictive signal.
Role of Persistence (S2) in Specific Locales: In select stations like Ahvaz, the autoregressive scenario (S2) with long-term memory (12 months) outperformed others (R2=0.55), highlighting the dominant role of internal drought persistence in this specific region.
Stability across Lead Times: Crucially, this regional preference for specific input structures remains remarkably stable as the forecast horizon extends to 2 and 3 months (t+2 and t+3). As detailed in the Supplement (Tables S1 and S2), while the absolute accuracy naturally declines with time (e.g., Chabahar's best R2 drops but S1 remains the superior choice vs. S2/S3), the winning scenario for each station rarely changes. This temporal consistency validates the proposed regionalization approach, suggesting that operational drought monitoring systems in Iran should adopt a dynamic framework where the input structure is switched based on the target region's climatic characteristics.
4.5 Uncertainty Analysis and Model Robustness
Given the stochastic nature of machine learning algorithms, evaluating their stability is as crucial as assessing their accuracy. To verify the reproducibility of the results, the models were executed 20 independent times under their optimal scenarios for two contrasting climatic stations: Zabol (arid, Scenario S3-1) and Anzali (hyper-humid, Scenario S1). Figure 10 illustrates the distribution of the Coefficient of Determination (R2) and the variability of the Mean Squared Error (MSE) for the 1-month forecast horizon (t+1). The complete stability analysis for longer horizons (t+2 and t+3) is provided in the Supplement (Figs. S7 and S8).
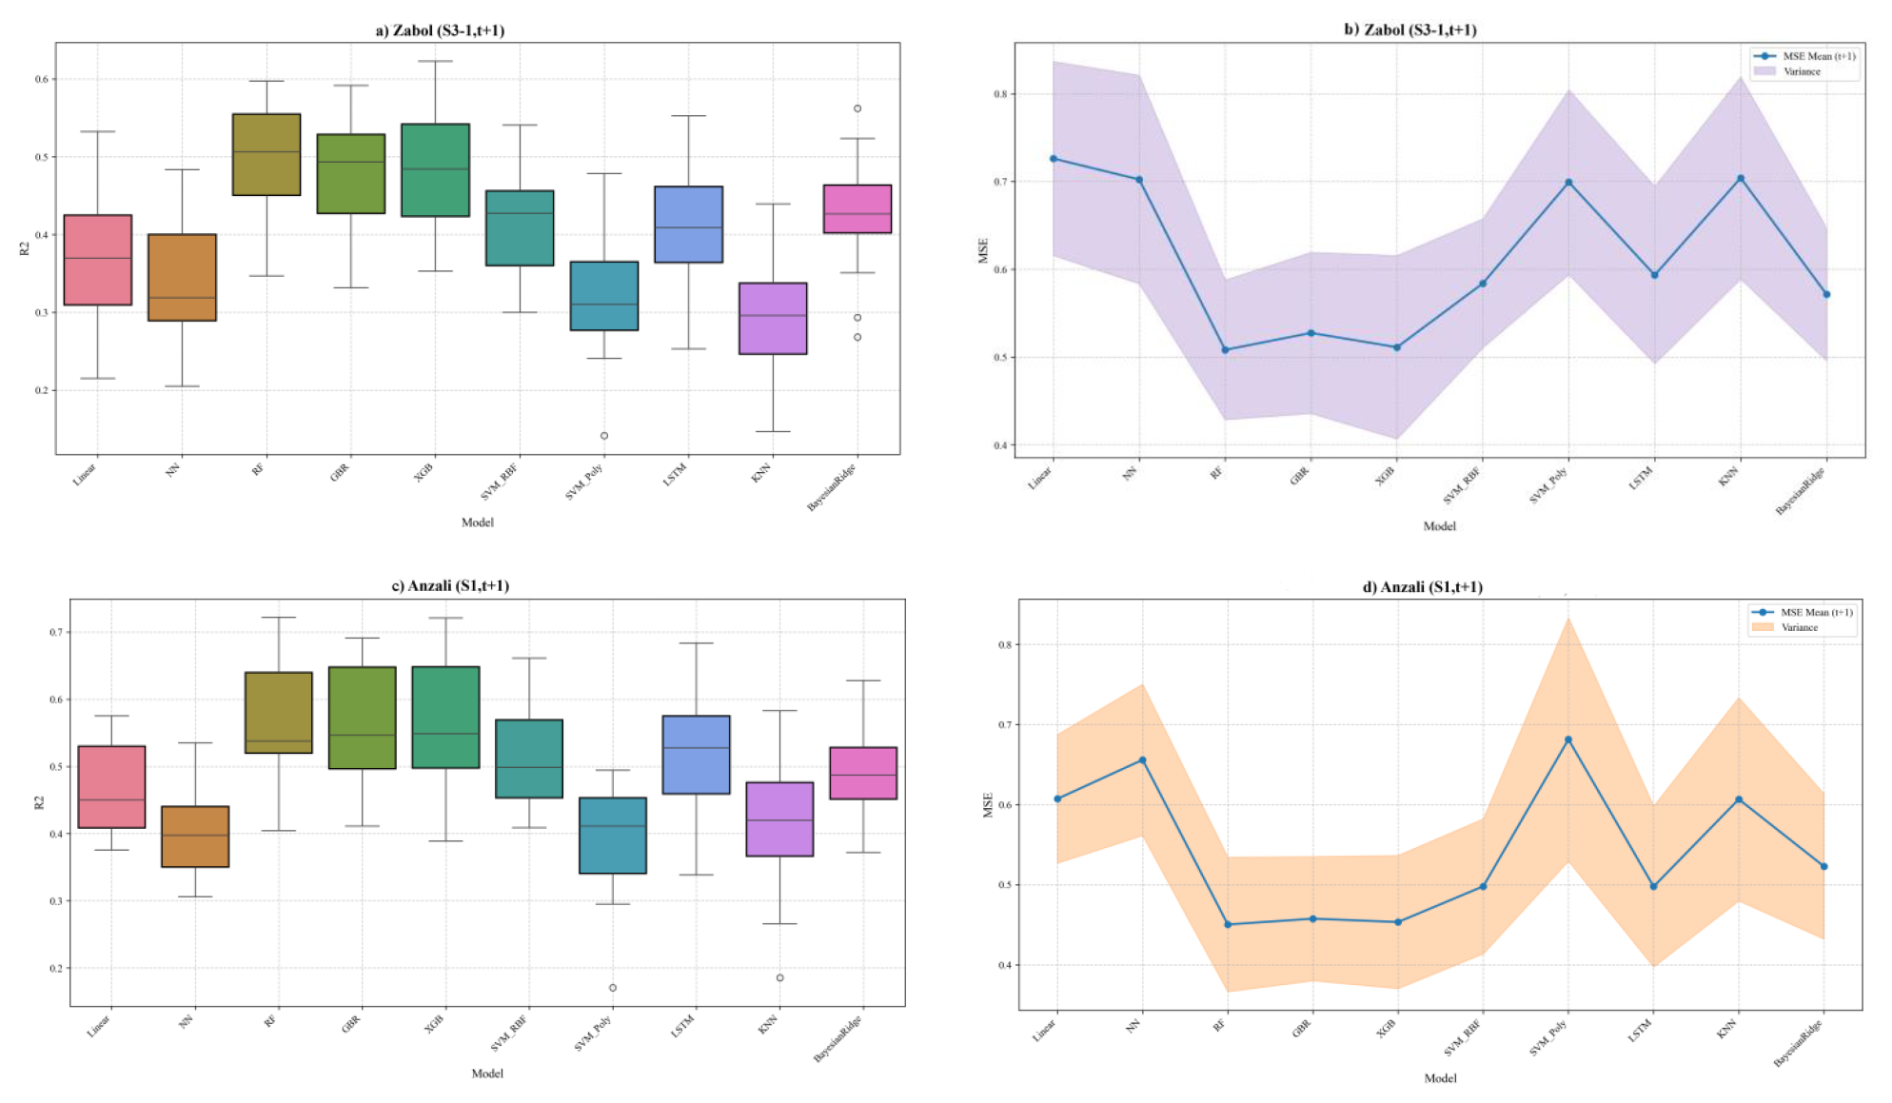
Figure 10Uncertainty analysis of the models for the 1-month forecast horizon (t+1) based on 20 independent runs. (a, b) Zabol station under Scenario S3-1. (c, d) Anzali station under Scenario S1. Left panels display the distribution of R2 (boxplots), and right panels show the mean MSE (solid line) with the 95 % confidence interval (shaded area).
Stability in Arid Regions (Zabol): As shown in the top panels of Fig. 10, the Random Forest (RF) model exhibits superior stability under the S3-1 scenario. The boxplot (Fig. 10a) reveals that RF not only achieves the highest median R2 but also possesses the narrowest Interquartile Range (IQR), indicating highly convergent results across different runs. Furthermore, the MSE analysis (Fig. 10b) demonstrates that RF maintains the lowest mean error with a significantly tighter 95 % confidence interval (shaded area) compared to deep learning models like LSTM. While LSTM and SVM-Poly show potential for high accuracy in individual runs, their wide variance bands indicate higher uncertainty and sensitivity to initial conditions.
Stability in Humid Regions (Anzali): The robustness of the RF model is further confirmed in the hyper-humid climate of Anzali under the S1 scenario (Fig. 10c, d). Similar to the arid region, RF demonstrates the best balance between accuracy and stability for the first month. However, as detailed in Fig. S8 (Supplement), this stability is time-dependent. At the t+3 horizon, the uncertainty for all models increases notably, and the performance gap between RF and LSTM narrows, reflecting the inherent challenge of long-term forecasting in irregular precipitation regimes.
Conclusion on Robustness: Overall, the uncertainty analysis confirms that among the tested algorithms, RF provides the most reliable and computationally stable predictions for operational drought monitoring in Iran, particularly for short-term forecasting (t+1), whereas complex models like SVM-Poly require careful hyperparameter tuning to mitigate instability.
This research was designed and executed to address a fundamental question in the science of drought forecasting: a comparative evaluation of the competing paradigms based on temporal memory (autoregressive), large-scale climate drivers (teleconnections), and a hybrid approach, across the complex climatic landscape of Iran. While the scientific literature is replete with studies that have employed each of these approaches individually (Rezaiy and Shabri, 2025; Anochi and Shimizu, 2025), a comprehensive assessment that simultaneously investigates the relative superiority and synergistic potential of these contrasting philosophies on a national scale, using a diverse array of machine learning models, has been notably absent (Oyarzabal et al., 2025). The findings of the present study, while aligning with the broad global trend towards more complex and hybrid models (Fung et al., 2020; Gyaneshwar et al., 2023), present a far more complex and location-dependent picture of drought predictability dynamics and decisively refute the simplistic notion that one approach is universally superior.
One of the stable and consistent findings across all scenarios was the superiority of ensemble learning models, particularly Random Forest (RF), over individual algorithms; a result that fully aligns with the prevailing trend in recent hydroclimatic forecasting literature (Poudel et al., 2024; Sadrtdinova et al., 2024). The inherent ability of the RF model to reduce variance and manage high-dimensional feature spaces makes it an ideal tool for modeling the noisy and non-linear signals of drought. However, with the increase in the forecast horizon and its associated intrinsic uncertainty, the competitive dynamics among the models underwent a shift, and the Bayesian Ridge Regression (BRR) model emerged as a serious contender. This noteworthy phenomenon reveals a profound insight: in conditions where the predictive signal weakens, the probabilistic approach of a Bayesian model, which quantifies uncertainty within its structure, gains a strategic advantage over models solely based on error optimization. This observation, while emphasizing that the superiority of a specific model is not universal and depends on the problem's conditions (Poudel et al., 2024), highlights the growing importance of probabilistic models for seasonal and longer-term forecasts.
In exploring the autoregressive paradigm (Scenario S2), the results clearly demonstrated that increasing the length of the input temporal memory up to 12 months directly and significantly improves the performance of the models, especially LSTM. This finding, repeated across all three forecast horizons, is more than a mere statistical observation; it is empirical testimony to the long-term memory and considerable inertia within Iran's hydroclimatic system. The persistence of dry or wet conditions, rooted in slow processes such as soil moisture dynamics and groundwater storage, provides a strong signal for forecasting future conditions. The superiority of the LSTM model, specifically designed to learn long-term dependencies, corroborates this hypothesis from an algorithmic perspective as well. This result aligns with a wide range of studies that emphasize the importance of signal preprocessing to unveil complex temporal patterns. Approaches such as wavelet analysis, which have been used in numerous studies as a powerful tool for decomposing the drought signal (Belayneh and Adamowski, 2013; Deo et al., 2017; Alkan, 2023), are, in fact, pursuing a similar objective: extracting information embedded in different time scales. Our research shows that using architectures with inherent long-term memory like LSTM can be an alternative and efficient solution to achieve this same goal.
On the other end of the spectrum, the paradigm based on physical drivers (Scenario S1) proved its capability as a powerful source for prediction, particularly at the short 1-month horizon. The significant performance of this scenario in the northern and western regions, which are heavily influenced by large-scale atmospheric systems, confirms the existence of a strong and modelable physical link between general atmospheric circulation and regional precipitation, consistent with studies that have successfully used teleconnection indices as inputs for prediction models (Anshuka et al., 2021). This result empirically validates the physical insights provided by Mahmoudi et al. (2026b), who used SHAP analysis to demonstrate that these specific regions exhibit the highest sensitivity to global climate drivers. Yet, the present study extends beyond that diagnostic finding by quantifying how much this physical information can enhance prediction accuracy compared to a memory-based baseline. However, the sharp decline in this scenario's performance at the 2- and 3-month lead times reveals the inherent limitation of this approach. This performance drop is an empirical manifestation of a phenomenon known in climate science as the predictability wall. Large-scale climate signals decay over time, and their influence on local conditions is weakened by stochastic and chaotic atmospheric processes. This finding suggests that relying solely on teleconnections for forecasts beyond the intra-seasonal scale may face serious limitations.
Perhaps the most significant and innovative finding of this research lies in the results of the hybrid scenario (S3) and the final comparative analysis. These results explicitly show that the answer to the question “Which paradigm is better?” does not have a universal answer but is strongly dependent on the geographical location, climatic characteristics, and forecast horizon. The decisive superiority of the hybrid scenario in large parts of the central plateau and the arid and semi-arid regions of Iran transmits a key message: in these areas, neither source of information is sufficient on its own. In arid climates with irregular precipitation, temporal memory alone cannot provide a complete picture, and the response of the local climate to large-scale drivers is either weak or complex. Under such conditions, the synergy resulting from the integration of these two information sources allows the model to achieve a more robust forecast by leveraging the weak but meaningful signal of teleconnections and complementing it with information about drought inertia. This discovery empirically confirms, on a large scale, the importance of hybrid approaches, which have been identified as the forefront of research in recent review articles (Alawsi et al., 2022). Furthermore, the discovery of the spatial complementarity pattern in optimizing memory length within the hybrid scenario – which showed that shorter-term memory is more optimal for humid regions and longer-term memory for arid regions – provides a profound insight into the different dynamics of the climate system in various regimes. In arid climates, where the system is slower and has more inertia, long memory is an asset; whereas in humid climates with faster dynamics, this same long memory can act as noise and lead to overfitting. Finally, the existence of climatic niches such as Chabahar (where the physical paradigm S1 was superior due to the dominance of monsoon dynamics) and Ahvaz (where the autoregressive paradigm S2 was likely dominant due to the prevalence of local processes) brings the complexity of drought forecasting in a country with Iran's climatic diversity to its peak and dooms any attempt to find a single, unified solution to failure.
In sum, by placing the main paradigms of drought forecasting in a comprehensive crucible, this research demonstrates that the future of this field lies not in a dogmatic adherence to one approach, but in the development of adaptive and region-centric modeling frameworks. Such frameworks must be able to dynamically select the optimal combination of predictors, memory length, and model architecture based on the climatic characteristics of each region. From an operational perspective, these findings imply the necessity of moving towards multi-model, multi-paradigm early warning systems that intelligently aggregate the outputs of models based on different philosophies. The path for future research is also clear: utilizing eXplainable Artificial Intelligence (XAI) techniques to open the “black box” of these relationships and gain a deeper understanding of the governing physical mechanisms (Dikshit and Pradhan, 2021a; Moghaddasi et al., 2025), as well as extending this framework to forecast more impact-oriented indices such as SPEI and agricultural and hydrological drought indices, are the logical next steps toward realizing a comprehensive drought risk management system in Iran.
This research was undertaken to resolve a fundamental conundrum in the science of drought forecasting: determining the relative superiority or synergistic potential of paradigms based on temporal memory versus those driven by physical teleconnections, conducted at the national scale of Iran. By executing a comprehensive, multi-model, and multi-paradigm evaluation, this study arrived at a decisive yet nuanced answer to this question: neither philosophy is singularly and universally superior to the other. Instead, their efficacy is distributed in a complex geographical pattern, contingent directly upon the local climatic regime and the forecast horizon.
The foremost contribution of this research is the empirical demonstration that the future of operational drought forecasting systems lies not in advocating for a single approach, but in the intelligent and region-centric integration of information sources. While hybrid models, which amalgamate historical and physical information, emerged as the superior approach across vast portions of Iran's arid and semi-arid climates, in specific “climatic niches,” standalone paradigms exhibited more optimal performance (teleconnection-based on the northern and southern coasts, and temporal memory-based in the southwest). This discovery decisively refutes the “one-size-fits-all” hypothesis and substantiates the necessity of transitioning towards adaptive modeling frameworks.
From an algorithmic perspective, this study confirmed the sustained superiority of ensemble learning models, particularly Random Forest (RF), as a robust tool for modeling the non-linear and noisy signals of drought. However, the close competition from the Bayesian Ridge Regression (BRR) model at longer forecast horizons underscored the growing importance of probabilistic models for managing uncertainty in seasonal forecasts.
Ultimately, by providing a detailed roadmap of “which paradigm performs best where,” this research takes a fundamental step toward the operationalization of forecasting knowledge. The findings strongly suggest that the next generation of drought early warning systems must transcend static and uniform architectures, evolving into dynamic, multi-paradigm systems capable of optimally selecting the most suitable modeling strategy based on regional characteristics. This transition will not only enhance forecast accuracy but also provide a more robust scientific foundation for risk management and national resilience against one of the most devastating climatic hazards. Future research should focus on extending this framework to other drought indices and leveraging eXplainable Artificial Intelligence (XAI) to deepen the physical understanding of these complex patterns.
The datasets utilized and analyzed during this investigation are available upon reasonable request from the corresponding author.
The supplement related to this article is available online at https://doi.org/10.5194/nhess-26-4407-2026-supplement.
Jun Jian: Formal analysis, Investigation, Writing – review & editing. Peyman Mahmoudi: Conceptualization, Data curation, Formal analysis, Investigation, Methodology, Project administration, Resources, Software, Supervision, Validation, Visualization, Writing – original draft, Writing – review & editing. Jing Yang: Conceptualization, Formal analysis, Investigation, Methodology, Project administration, Supervision, Writing – review & editing. Pouria Jafari: Methodology, Investigation, Data curation, Investigation, Software, Validation, Writing – review & editing. Alireza Ghaemi: Data curation, Resources, Software, Writing – original draft, Writing – review & editing. Fatemeh Firoozi: Resources, Visualization. All authors have read and agreed to the published version of the manuscript.
The contact author has declared that none of the authors has any competing interests.
Publisher's note: Copernicus Publications remains neutral with regard to jurisdictional claims made in the text, published maps, institutional affiliations, or any other geographical representation in this paper. The authors bear the ultimate responsibility for providing appropriate place names. Views expressed in the text are those of the authors and do not necessarily reflect the views of the publisher.
This study was successfully completed thanks to the backing of several institutions. Financial sponsorship was provided by the National Natural Science Foundation of China (NSFC; Award No. 42261144671), Innovation Group Project of Southern Marine Science and Engineering Guangdong Laboratory (Zhuhai) (Award No. 311024001), National Key R&D Program of China (Award No. 2024YFE0103200), and the Iran National Science Foundation (INSF; Award No. 4013097). The analysis herein would not have been possible without the critical precipitation data made available by the Iran Meteorological Organization (IRIMO), whose contribution is sincerely appreciated.
This research has been supported by the National Natural Science Foundation of China (grant no. 42261144671), the Southern Marine Science and Engineering Guangdong Laboratory (Zhuhai) (grant no. 311024001), the National Key R&D Program of China (grant no. 2024YFE0103200), and the Iran National Science Foundation (grant no. 4013097).
This paper was edited by Zhe Li and reviewed by three anonymous referees.
Achite, M., Elshaboury, N., Jehanzaib, M., Vishwakarma, D. K., Pham, Q. B., Anh, D. T., Abdelkader, E. M., and Elbeltagi, A.: Performance of machine learning techniques for meteorological drought forecasting in the Wadi Mina Basin, Algeria, Water, 15, 765, https://doi.org/10.3390/w15040765, 2023.
Alawsi, M. A., Zubaidi, S. L., Al-Bdairi, N. S. S., Al-Ansari, N., and Hashim, K.: Drought forecasting: A review and assessment of the hybrid techniques and data pre-processing, Hydrology, 9, 115, https://doi.org/10.3390/hydrology9070115, 2022.
Aldhafeeri, A. A., Ali, M., Khan, M., and Labban, A. H.: SPI-informed drought forecasts integrating advanced signal decomposition and machine learning models, Water, 17, 2747, https://doi.org/10.3390/w17182747, 2025.
Alkan, A.: Drought forecasting using Palmer Drought Severity Index with wavelet transform technique and machine learning methods, Int. J. Res. Publ. Rev., 4, 2177–2185, https://doi.org/10.55248/gengpi.2023.4158, 2023.
Ali, S., Khorrami, B., Jehanzaib, M., Tariq, A., Ajmal, M., Arshad, A., Shafeeque, M., Dilawar, A., Basit, I., Zhang, L., Sadri, S., Niaz, M. A., Jamil, A., and Khan, S. N.: Spatial downscaling of GRACE data based on XGBoost model for improved understanding of hydrological droughts in the Indus Basin Irrigation System (IBIS), Remote Sens., 15, 873, https://doi.org/10.3390/rs15040873, 2023.
Alijani, B.: Climate of Iran, Payam Noor University Press, Tehran, Iran, 222 pp., ISBN 978-964-455-621-0, 1997 (in Persian).
Alipour, M. H.: Streamflow prediction in ungauged basins located within data-scarce areas using XGBoost: role of feature engineering and explainability, Int. J. River Basin Manag., 23, 71–92, 2025.
Almikaeel, W., Čubanová, L., and Šoltész, A.: Hydrological drought forecasting using machine learning – Gidra River case study, Water, 14, 387, https://doi.org/10.3390/w14030387, 2022.
Amini, M., Ghadami, M., Fathian, F., and Modarres, R.: Teleconnections between oceanic–atmospheric indices and drought over Iran using quantile regressions, Hydrol. Sci. J., 65, 2286–2295, https://doi.org/10.1080/02626667.2020.1802029, 2020.
Anochi, J. A. and Shimizu, M. H.: Precipitation forecasting and drought monitoring in South America using a machine learning approach, Meteorology, 4, 1, https://doi.org/10.3390/meteorology4010001, 2025.
Anshuka, A., Buzacott, A. J. V., Vervoort, R. W., and van Ogtrop, F. F.: Developing drought index-based forecasts for tropical climates using wavelet neural network: An application in Fiji, Theor. Appl. Climatol., 143, 557–569, https://doi.org/10.1007/s00704-020-03446-3, 2021.
Baldwin, M. P., Gray, L. J., Dunkerton, T. J., Hamilton, K., Haynes, P. H., Randel, W. J., Holton, J. R., Alexander, M. J., Hirota, I., Horinouchi, T., Jones, D. B. A., Kinnersley, J. S., Marquardt, C., Sato, K., and Takahashi, N.: The quasi-biennial oscillation, Rev. Geophys., 39, 179–229, https://doi.org/10.1029/1999RG000073, 2001.
Barlow, M., Cullen, H., and Lyon, B.: Drought in Central and Southwest Asia: La Niña, the Warm Pool, and Indian Ocean Precipitation, J. Climate, 15, 697–700, https://doi.org/10.1175/1520-0442(2002)015<0697:DICASA>2.0.CO;2, 2002.
Barlow, M., Zaitchik, B., Paz, S., Black, E., Evans, J., and Hoell, A.:. A review of drought in the Middle East and southwest Asia, J. Climate, 29, 8547–8574, 2016.
Barnston, A. G. and Livezey, R. E.: Classification, seasonality, and persistence of low-frequency atmospheric circulation patterns, Mon. Weather Rev., 115, 1083–1126, https://doi.org/10.1175/1520-0493(1987)115<1083:CSAPOL>2.0.CO;2, 1987.
Barnston, A. G., Chelliah, M., and Goldenberg, S. B.: Documentation of a highly ENSO‐related SST region in the equatorial pacific: Research note, Atmos.-Ocean, 35, 367–383, https://doi.org/10.1080/07055900.1997.9649597, 1997.
Belayneh, A. and Adamowski, J.: Drought forecasting using new machine learning methods, J. Water Land Dev., 18, 3–12, https://doi.org/10.2478/jwld-2013-0001, 2013.
Cai, F., Liu, C., Gerten, D., Yang, S., Zhang, T., Li, K., and Kurths, J.: Sketching the spatial disparities in heatwave trends by changing atmospheric teleconnections in the Northern Hemisphere, Nat. Commun., 15, 8012, https://doi.org/10.1038/s41467-024-52254-0, 2024.
Chandrasekara, S. S., Kwon, H.-H., Vithanage, M., Obeysekera, J., and Kim, T.-W.: Drought in South Asia: A review of drought assessment and prediction in South Asian countries, Atmosphere, 12, 369, https://doi.org/10.3390/atmos12030369, 2021.
Craig, M. and Allan, R. P.: The role of teleconnection patterns in the variability and trends of growing season indices across Europe, Int. J. Climatol., 42, 1072–1091, https://doi.org/10.1002/joc.7290, 2022.
Deo, R. C., Tiwari, M. K., Adamowski, J. F., and Quilty, J. M.: Forecasting effective drought index using a wavelet extreme learning machine (W-ELM) model, Stoch. Environ. Res. Risk Assess., 31, 1211–1240, 2017.
De Pauw, E., Dehkordi, V. R. G., and Ghaffari, A.: Agroecological zones, in: The Soils of Iran, Springer, 163–173, https://doi.org/10.1007/978-3-319-69048-3_9, 2018.
Dikshit, A. and Pradhan, B.: Explainable AI in drought forecasting, Mach. Learn. Appl., 6, 100192, https://doi.org/10.1016/j.mlwa.2021.100192, 2021a.
Dikshit, A. and Pradhan, B.: Interpretable and explainable AI (XAI) model for spatial drought prediction, Sci. Total Environ., 801, 149797, https://doi.org/10.1016/j.scitotenv.2021.149797, 2021b.
Djerbouai, S. and Souag-Gamane, D.: Drought forecasting using neural networks, wavelet neural networks, and stochastic models: Case of the Algerois Basin in North Algeria, Water Resour. Manag., 30, 2445–2464, https://doi.org/10.1007/s11269-016-1298-6, 2016.
Dong, H., Huang, S., Wang, H., Shi, H., Singh, V. P., She, D., Huang, Q., Leng, G., Gao, L., and Wei, X.: Effects of multiple large-scale atmospheric circulations on precipitation dynamics in China, Sci. Total Environ., 923, 171528, https://doi.org/10.1016/j.scitotenv.2024.171528, 2024.
Enfield, D. B., Mestas-Nuñez, A. M., Mayer, D. A., and Cid-Serrano, L.: How ubiquitous is the dipole relationship in tropical Atlantic sea surface temperatures?, J. Geophys. Res.-Oceans, 104, 7841–7848, https://doi.org/10.1029/1998JC900109, 1999.
Esquivel-Saenz, P. J., Ortiz-Gómez, R., Zavala, M., and Flowers-Cano, R. S.: Artificial neural networks for drought forecasting in the central region of Zacatecas, Mexico, Climate, 12, 131, https://doi.org/10.3390/cli12090131, 2024.
Fung, K. F., Huang, Y. F., Koo, C. H., and Soh, Y. W.: Drought forecasting: A review of modelling approaches 2007–2017, J. Water Clim. Change, 11, 771–799, https://doi.org/10.2166/wcc.2019.236, 2020.
Ganguli, P. and Janga Reddy, M.: Ensemble prediction of regional droughts using climate inputs and the SVM-copula approach, Hydrol. Process., 28, 4989–5009, https://doi.org/10.1002/hyp.9966, 2014.
Ghaemi, A., Hashemi Monfared, S. A., Bahrpeyma, A., Mahmoudi, P., and Zounemat-Kermani, M.: Spatiotemporal variation of projected drought characteristics in Iran under climate change scenarios using CMIP5-CORDEX product, J. Water Clim. Change, 15, 1054–1075, 2024a.
Ghaemi, A., Hashemi Monfared, S. A., Bahrpeyma, A., Mahmoudi, P., and Zounemat-Kermani, M.: Exploitation of ensemble-based machine learning strategies to elevate the precision of CORDEX simulations in precipitation projection, Earth Sci. Inform., 17, 1373–1392, 2024b.
Ghamghami, M. and Bazrafshan, J.: Relationships between large-scale climate signals and winter precipitation patterns over Iran, J. Hydrol. Eng., 26, https://doi.org/10.1061/(ASCE)HE.1943-5584.0002066, 2021.
Gyaneshwar, A., Mishra, A., Chadha, U., Vincent, P. M. D. R., Rajinikanth, V., Ganapathy, G. P., and Srinivasan, K.: A contemporary review on deep learning models for drought prediction, Sustainability, 15, 6160, https://doi.org/10.3390/su15076160, 2023.
Heydarizad, M., Raeisi, E., Sori, R., and Gimeno, L.: Identification of Iran's moisture sources using a Lagrangian particle dispersion model, Atmosphere, 9, 408, https://doi.org/10.3390/atmos9100408, 2018.
Helali, J., Mohammadi Ghaleni, M., Hosseini, S. A., Lotfi Siraei, A., Saeidi, V., Safarpour, F., Mirzaei, M., and Lotfi, M.: Assessment of machine learning model performance for seasonal precipitation simulation based on teleconnection indices in Iran, Arab. J. Geosci., 15, 1343, https://doi.org/10.1007/s12517-022-10640-2, 2022.
Henley, B. J., Gergis, J., Karoly, D. J., Power, S., Kennedy, J., and Folland, C. K.: A tripole index for the Interdecadal Pacific Oscillation, Clim. Dyn., 45, 3077–3090, https://doi.org/10.1007/s00382-015-2525-1, 2015.
Higgins, R. W., Leetmaa, A., Xue, Y., and Barnston, A.: Dominant factors influencing the seasonal predictability of U.S. precipitation and surface air temperature, J. Climate, 13, 3994–4017, https://doi.org/10.1175/1520-0442(2000)013<3994:DFITSP>2.0.CO;2, 2000.
Islam, K. I., Elias, E., Carroll, K. C., and Brown, C.: Exploring random forest machine learning and remote sensing data for streamflow prediction: An alternative approach to a process-based hydrologic modeling in a snowmelt-driven watershed, Remote Sens., 15, 3999, https://doi.org/10.3390/rs15163999, 2023.
Katiraie-Boroujerdy, P. S., Rahnamay Naeini, M., Akbari Asanjan, A., Chavoshian, A., Hsu, K. L., and Sorooshian, S.: Bias correction of satellite-based precipitation estimations using quantile mapping approach in different climate regions of Iran, Remote Sens., 12, 2102, https://doi.org/10.3390/rs12132102, 2020.
Kikon, A., Dodamani, B. M., Deb Barma, S., and Naganna, S. R.: ANFIS-based soft computing models for forecasting effective drought index over an arid region of India, AQUA – Water Infrastructure, Ecosystems and Society, 72, 930–946, https://doi.org/10.2166/aqua.2023.204, 2023.
Komasi, M., Sharghi, S., and Safavi, H. R.: Wavelet and cuckoo search-support vector machine conjugation for drought forecasting using Standardized Precipitation Index (case study: Urmia Lake, Iran), J. Hydroinformatics, 20, 975–988, https://doi.org/10.2166/hydro.2018.115, 2018.
Li, B., Li, R., Sun, T., Gong, A., Tian, F., Khan, M. Y. A., and Ni, G.: Improving LSTM hydrological modeling with spatiotemporal deep learning and multi-task learning: A case study of three mountainous areas on the Tibetan Plateau, J. Hydrol., 620, 129401, https://doi.org/10.1016/j.jhydrol.2023.129401, 2023.
Liu, T., Chen, D., Yang, L., Meng, J., Wang, Z., Ludescher, J., Fan, J., Yang, S., Chen, D., Kurths, J., Havlin, S., and Schellnhuber, H. J.: Teleconnections among tipping elements in the Earth system, Nat. Clim. Chang., 13, 67–74, https://doi.org/10.1038/s41558-022-01558-4, 2023.
Lorenzo, M. N., Pereira, H., Alvarez, I., and Dias, J. M.: Standardized Precipitation Index (SPI) evolution over the Iberian Peninsula during the 21st century, Atmos. Res., 297, 107132, https://doi.org/10.1016/j.atmosres.2023.107132, 2024.
Mahmoudi, P., Razmjoo, S., and Amir Jahanshahi, S. M.: Overlap of North Atlantic Oscillation (NAO) periodicities with periodicities of droughts and wet years of Iran, Iran. J. Geophys., 14, 91–104, https://doi.org/10.30499/ijg.2020.104299, 2020.
Mahmoudi, P., Jafari, P., Ghaemi, A., Jian, J., Firoozi, F., and Yang, J.:. Deciphering asynchronous teleconnections: How dynamic time warping reveals the hidden drivers of Iranian drought, Earth Space Sci., 13, e2025EA004776, https://doi.org/10.1029/2025EA004776, 2026a.
Mahmoudi, P., Jafari, P., Ghaemi, A., Jian, J., Firoozi, F., and Yang, J.: Decoding Iran's drought drivers: An explainable AI approach to unraveling global teleconnection impacts, Earth Syst. Environ., 10, 5703–5729, https://doi.org/10.1007/s41748-025-00925-3, 2026b.
Malik, A., Tikhamarine, Y., Sammen, S. S., Abba, S. I., and Shahid, S.: Prediction of meteorological drought by using hybrid support vector regression optimized with HHO versus PSO algorithms, Environ. Sci. Pollut. Res., 28, 39139–39158, https://doi.org/10.1007/s11356-021-13445-0, 2021.
Manriquez-Padilla, C. G., Cueva-Perez, I., Dominguez-Gonzalez, A., Elvira-Ortiz, D. A., Perez-Cruz, A., and Saucedo-Dorantes, J. J.: State of charge estimation model based on genetic algorithms and multivariate linear regression with applications in electric vehicles, Sensors, 23, 2924, https://doi.org/10.3390/s23062924, 2023.
McKee, T. B., Doesken, N. J., and Kleist, J.: The relationship of drought frequency and duration to time scales, in: Proceedings of the Eighth Conference on Applied Climatology, Anaheim, CA, 17–22 January 1993, American Meteorological Society, Boston, MA, 179–184, https://www.droughtmanagement.info/literature/AMS_Relationship_Drought_Frequency_Duration_Time_Scales_1993.pdf (last access: 11 September 2026), 1993.
Mesgari, E., Mahmoudi, P., Kord Tamandani, Y., Tavousi, T., and Amir Jahanshahi, S. M.: A comparative assessment of the ability of different types of machine learning in short-term predictions of nocturnal frosts, Acta Geophys., 72, 2955–2973, https://doi.org/10.1007/s11600-023-01276-1, 2024.
Mishra, A. K. and Singh, V. P.: A review of drought concepts, J. Hydrol., 391, 202–216, https://doi.org/10.1016/j.jhydrol.2010.07.012, 2010.
Moghaddasi, M., Moradi, M., Ghaleni, M. M., and Yaseen, Z. M.: Reinforcing long lead time drought forecasting with a novel hybrid deep learning model: a case study in Iran, Appl. Water Sci., 15, 51, https://doi.org/10.1007/s13201-025-02377-6, 2025.
Mohammadi, B.: Modeling various drought time scales via a merged artificial neural network with a firefly algorithm, Hydrology, 10, 58, https://doi.org/10.3390/hydrology10030058, 2023.
Mokhtar, A., Jalali, M., He, H., Al-Ansari, N., Elbeltagi, A., Alsafadi, K., Abdo, H. G., Sammen, S. Sh., Gyasi-Agyei, Y., and Rodrigo-Comino, J.: Estimation of SPEI meteorological drought using machine learning algorithms, IEEE Access, 9, 65503–65523, https://doi.org/10.1109/ACCESS.2021.3074305, 2021.
Newman, M., Alexander, M. A., Ault, T. R., Cobb, K. M., Deser, C., Di Lorenzo, E., Mantua, N. J., Miller, A. J., Minobe, S., Nakamura, H., Schneider, N., Vimont, D. J., Phillips, A. S., Scott, J. D., and Smith, C. A.: The Pacific Decadal Oscillation, Revisited, J. Climate, 29, 4399–4427, https://doi.org/10.1175/JCLI-D-15-0508.1, 2016.
Niazkar, M., Menapace, A., Brentan, B., Piraei, R., Jimenez, D., Dhawan, P., and Righetti, M.: Applications of XGBoost in water resources engineering: A systematic literature review (Dec 2018–May 2023), Environ. Modell. Softw., 174, 105971, https://doi.org/10.1016/j.envsoft.2024.105971, 2024.
Oyarzabal, R. S., Santos, L. B. L., Cunningham, C., Broedel, E., de Lima, G. R. T., Cunha-Zeri, G., Peixoto, J. S., Anochi, J. A., Garcia, K., Costa, L. C. O., Pampuch, L. A., Cuartas, L. A., Zeri, M., Guedes, M. R. G., Negri, R. G., Muñoz, V. A., and Cunha, A. P. M. A.: Forecasting drought using machine learning: a systematic literature review, Nat. Hazards, 121, 9823–9851, https://doi.org/10.1007/s11069-025-07195-2, 2025.
Ozger, M., Mishra, A. K., and Singh, V. P.: Long lead time drought forecasting using a wavelet and fuzzy logic combination model: a case study in Texas, J. Hydrometeorol., 13, 284–297, https://doi.org/10.1175/JHM-D-10-05007.1, 2011.
Poudel, B., Dahal, D., Banjara, M., and Kalra, A.: Assessing meteorological drought patterns and forecasting accuracy with SPI and SPEI using machine learning models, Forecasting, 6, 1026–1044, https://doi.org/10.3390/forecast6040051, 2024.
Pourasghar, F. and Babaeian, I.: Relationships between climate signals and warm spells in cold season over Iran, Arab. J. Geosci., 16, 533, https://doi.org/10.1007/s12517-023-11642-4, 2023.
Prodhan, F. A., Zhang, J., Hasan, S. S., Sharma, T. P. P., and Mohana, H. P.: A review of machine learning methods for drought hazard monitoring and forecasting: Current research trends, challenges, and future research directions, Environ. Modell. Softw., 149, 105327, https://doi.org/10.1016/j.envsoft.2022.105327, 2022.
Rayner, N. A., Parker, D. E., Horton, E. B., Folland, C. K., Alexander, L. V., Rowell, D. P., Kent, E. C., and Kaplan, A.: Global analyses of sea surface temperature, sea ice, and night marine air temperature since the late nineteenth century, J. Geophys. Res.-Atmos., 108, 4407, https://doi.org/10.1029/2002JD002670, 2003.
Razmjo, S., Mahmoudi, P., and Amir Jahanshahi, S. M.: Study of the relationship between North Atlantic Oscillation (NAO) index and drought and wet years of Iran in station and regional scales, J. Clim. Res., 1399, 169–176, 2020.
Reddy, K. V., Begum, C. M., Neeraja, A., Maheswari, B. U., and Amulyashree, S.: Comprehensive Analysis of Flood Risk Using Regression Models and Interpretable Machine Learning Techniques, 2024 International Conference on Integrated Intelligence and Communication Systems (ICIICS), Bengaluru, India, 21–22 November 2024, IEEE, 1–6, https://doi.org/10.1109/ICIICS63763.2024.10859855, 2024.
Reynolds, R. W., Rayner, N. A., Smith, T. M., Stokes, D. C., and Wang, W.: An Improved In Situ and Satellite SST Analysis for Climate, J. Climate, 15, 1609–1625, https://doi.org/10.1175/1520-0442(2002)015<1609:AIISAS>2.0.CO;2, 2002.
Rezaeianzadeh, M., Stein, A., and Cox, J. P.: Drought forecasting using Markov chain model and artificial neural networks, Water Resour. Manag., 30, 2245–2259, https://doi.org/10.1007/s11269-016-1283-0, 2016.
Rezaiy, R. and Shabri, A.: Drought forecasting using W-ARIMA model with standardized precipitation index, J. Water Clim. Change, 14, 3345–3367, https://doi.org/10.2166/wcc.2023.431, 2023.
Rezaiy, R. and Shabri, A.: An innovative hybrid W–EEMD–ARIMA model for drought forecasting using the standardized precipitation index, Nat. Hazards, 120, 13513–13542, https://doi.org/10.1007/s11069-024-06758-z, 2024.
Rezaiy, R. and Shabri, A.: Integrating wavelet transform and support vector machine for improved drought forecasting based on standardized precipitation index, J. Hydroinformatics, 27, 320–337, https://doi.org/10.2166/hydro.2025.292, 2025.
Ropelewski, C. F. and Jones, P. D.: An extension of the Tahiti-Darwin Southern Oscillation Index, Mon. Weather Rev., 115, 2161–2165, https://doi.org/10.1175/1520-0493(1987)115<2161:AEOTTS>2.0.CO;2, 1987.
Sadrtdinova, R., Corzo Perez, G. A., and Solomatine, D. P.: Improved drought forecasting in Kazakhstan using machine and deep learning: A non-contiguous drought analysis approach, Hydrol. Res., 55, 237–261, https://doi.org/10.2166/nh.2024.154, 2024.
Saemian, P., Tourian, M. J., AghaKouchak, A., Madani, K., and Sneeuw, N.: How much water did Iran lose over the last two decades?, J. Hydrol. Reg. Stud., 41, 101095, https://doi.org/10.1016/j.ejrh.2022.101095, 2022.
Saji, N. H. and Yamagata, T.: Possible Impacts of Indian Ocean Dipole Mode Events on Global Climate, Clim. Res., 25, 151–169, https://doi.org/10.3354/cr025151, 2003.
Santos, C. A. G., dos Santos, D. C., Brasil Neto, R. M., de Oliveira, G., dos Santos, C. A. C., and da Silva, R. M.: Analyzing the impact of ocean-atmosphere teleconnections on rainfall variability in the Brazilian Legal Amazon via the Rainfall Anomaly Index (RAI), Atmos. Res., 307, 107483, https://doi.org/10.1016/j.atmosres.2024.107483, 2024.
Saravanan, S., Reddy, N. M., Pham, Q. B., Alodah, A., Abdo, H. G., Almohamad, H., and Al Dughairi, A. A.: Machine learning approaches for streamflow modeling in the Godavari Basin with CMIP6 dataset, Sustainability, 15, 12295, https://doi.org/10.3390/su151612295, 2023.
Seibert, M., Merz, B., and Apel, H.: Seasonal forecasting of hydrological drought in the Limpopo Basin: a comparison of statistical methods, Hydrol. Earth Syst. Sci., 21, 1611–1629, https://doi.org/10.5194/hess-21-1611-2017, 2017.
Shi, L., Feng, P., Wang, B., Liu, D. L., and Yu, Q.: Quantifying future drought change and associated uncertainty in southeastern Australia with multiple potential evapotranspiration models, J. Hydrol., 590, 125394, https://doi.org/10.1016/j.jhydrol.2020.125394, 2020.
Snaan, R. A. S. and Shukur, O. B.: Using Bayesian Ridge Regression model and ESN for climatic time series forecasting, Stat. Optim. Inf. Comput., 14, 1226–1243, https://doi.org/10.19139/soic-2310-5070-2637, 2025.
Tang, S., Sun, F., Zhang, Q., Singh, V. P., and Feng, Y.: Improving trans-regional hydrological modelling by combining LSTM with big hydrological data, J. Hydrol. Reg. Stud., 58, 102257, https://doi.org/10.1016/j.ejrh.2025.102257, 2025.
Tozer, C. R. and Kiem, A. S.: Large-scale ocean-atmospheric processes and seasonal rainfall variability in South Australia: accounting for non-linearity and establishing the hierarchy of influence, Int. J. Climatol., 37, 1180–1198, https://doi.org/10.1002/joc.5074, 2017.
Trenberth, K. E. and Stepaniak, D. P.: Indices of El Niño Evolution, J. Climate, 14, 1697–1701, https://doi.org/10.1175/1520-0442(2001)014<1697:LIOENO>2.0.CO;2, 2001.
Tsesmelis, D. E., Leveidioti, I., Karavitis, C. A., Kalogeropoulos, K., Vasilakou, C. G., Tsatsaris, A., and Zervas, E.: Spatiotemporal application of the Standardized Precipitation Index (SPI) in the Eastern Mediterranean, Climate, 11, 95, https://doi.org/10.3390/cli11050095, 2023.
Tuğrul, T. and Hinis, M. A.: Improvement of drought forecasting by means of various machine learning algorithms and wavelet transformation, Acta Geophys., 73, 855–874, https://doi.org/10.1007/s11600-024-01399-z, 2025.
UNESCO: Map of the world distribution of arid regions: Map at scale 1 : 25 000 000 with explanatory note, MAB Technical Notes 7, UNESCO, Paris, France, 54 pp., ISBN 92-3-101484-6, 1979.
Wallace, J. M. and Gutzler, D. S.: Teleconnections in the Geopotential Height Field during the Northern Hemisphere Winter, Mon. Weather Rev., 109, 784–812, https://doi.org/10.1175/1520-0493(1981)109<0784:TITGHF>2.0.CO;2, 1981.
Wang, C. and Enfield, D. B.: The tropical Western Hemisphere warm pool, Geophys. Res. Lett., 28, 1635–1638, https://doi.org/10.1029/2000GL011763, 2001.
Wijngaard, J. B., Klein Tank, A. M. G., and Können, G. P.: Homogeneity of 20th century European daily temperature and precipitation series, Int. J. Climatol., 23, 679–692, https://doi.org/10.1002/joc.906, 2003.
Wu, Y., Zhang, Z., Qi, X., Hu, W., and Si, S.: Prediction of flood sensitivity based on Logistic Regression, eXtreme Gradient Boosting, and Random Forest modeling methods, Water Sci. Technol., 89, 2605–2624, https://doi.org/10.2166/wst.2024.146, 2024.
Xing, W., Wang, C., Zhang, L., Chen, B., and Liu, H.: Influences of Central and Eastern Atlantic Niño on the West African and South American summer monsoons, npj Clim. Atmos. Sci., 7, 214, https://doi.org/10.1038/s41612-024-00762-7, 2024.
Yang, R. and Xing, B.: Teleconnections of Large-Scale Climate Patterns to Regional Drought in Mid-Latitudes: A Case Study in Xinjiang, China, Atmosphere, 13, 230, https://doi.org/10.3390/atmos13020230, 2022.
Yun, K.-S., Lee, J.-Y., Timmermann, A., Stein, K., Stuecker, M. F., Fyfe, J. C., and Chung, E.-S.: Increasing ENSO–rainfall variability due to changes in future tropical temperature–rainfall relationship, Commun. Earth Environ., 2, 43, https://doi.org/10.1038/s43247-021-00108-8, 2021.
Zellou, B., El Moçayd, N., and Bergou, E. H.: Review article: Towards improved drought prediction in the Mediterranean region – modeling approaches and future directions, Nat. Hazards Earth Syst. Sci., 23, 3543–3583, https://doi.org/10.5194/nhess-23-3543-2023, 2023.
Zhang, S., Omar, A. H., Hashim, A. S., Alam, T., Khalifa, H. A. E. W., and Elkotb, M. A.: Retracted: Enhancing waste management and prediction of water quality in the sustainable urban environment using optimized algorithm of least square support vector machine and deep learning techniques, Urban Clim., 49, 101487, https://doi.org/10.1016/j.uclim.2023.101487, 2023.
Zhang, Z., Zhu, W., Chen, J., and Cheng, Q.: Remotely observed variations of reservoir low concentration chromophoric dissolved organic matter and its response to upstream hydrological and meteorological conditions using Sentinel-2 imagery and Gradient Boosting Regression Tree, Water Supply, 21, 668–682, https://doi.org/10.2166/ws.2020.342, 2021.
Zhou, N., Hou, J., Chen, H., Chen, G., and Liu, B.: A rapid forecast method for the process of flash flood based on hydrodynamic model and KNN algorithm, Water Resour. Manag., 38, 1903–1919, https://doi.org/10.1007/s11269-023-03664-0, 2024.