
the Creative Commons Attribution 4.0 License.
the Creative Commons Attribution 4.0 License.
 | 27 Aug 2026
Rapid landslide mapping during the 2023 Emilia-Romagna disaster: assessing automated approaches with limited training data
Giuseppe Ciccarese
Davide Evangelista
Elena Loli Piccolomini
Alessandro Corsini
Matteo Berti
The catastrophic rainfall events of May 2023 in the Emilia-Romagna region, Italy, triggered more than 80 000 landslides, as documented in a publicly available inventory (https://doi.org/10.5281/zenodo.13742643, Pizziolo et al., 2024), and placed extraordinary demands on emergency response systems. One of the most critical emergency tasks was landslide mapping, which was carried out manually and required substantial time and effort. This study investigates the potential of automated landslide mapping to support rapid disaster response by evaluating two deep learning models, U-Net and SegFormer, under realistic emergency constraints, including limited training data.
The models were trained using data from one affected municipality, Casola Valsenio (84 km2), and tested on three additional municipalities, Predappio (91 km2), Modigliana (101 km2), and Brisighella (194 km2), characterized by different geological settings. To represent a range of operational scenarios, we tested seven combinations of input data, from post-event Sentinel-2 imagery alone to the integration of high-resolution aerial imagery, vegetation change maps, and slope data. Both models achieved comparable segmentation performance, with SegFormer showing greater robustness to variations in input data and geological conditions, while U-Net was more sensitive but occasionally more accurate when richer inputs were available. Both models successfully identified landslides, but showed limitations in shadowed areas, cultivated fields, and geologically distinct terrains. A major limitation emerged in the Brisighella area, where poor generalization was associated with the dominance of Blue Clay formations and the limited lithological diversity of the training data. These results highlight the importance of geologically balanced datasets for improving model transferability.
Overall, the study confirms the operational value of automated landslide mapping as a first-pass tool for emergency response. Although manual revision remains necessary, both models produced reliable baseline maps that can support validation and help prioritize interventions in time-critical situations, offering a scalable and time-efficient approach to the growing need for rapid and spatially detailed hazard information.
- Article
(17987 KB) - Full-text XML
- BibTeX
- EndNote


Rapid and accurate landslide mapping over large areas is a challenging task, particularly in the context of regional-scale rainfall or earthquake events (Iverson et al., 2015; Casagli et al., 2016; Robinson et al., 2017; Hölbling et al., 2017; Mondini et al., 2021). This task is crucial for implementing timely and effective response measures, assessing the extent of impact, and planning for recovery and mitigation efforts. The complexities of rapid landslide mapping vary depending on several factors including the extent of the affected area, the availability of cloud-free imagery, the precision needed for the mappings, and the difficulties of detecting landslides due to shadows, vegetation cover, or weak geomorphic evidences (Mondini et al., 2019; Amatya et al., 2023). Typically, these complexities are addressed by expert geologists through the visual interpretation of satellite or aerial imagery (Guzzetti et al., 2012; Scaioni et al., 2014; Tofani et al., 2013; Ferrario and Livio, 2024). These experts are skilled at identifying subtle variations in the terrain and can integrate complex contextual knowledge, including field reports, personal accounts, and specific geological information, to create highly accurate landslide maps. However, manual mapping is both time-consuming and inherently subjective, which are significant limitations during an emergency (Novellino et al., 2024).
Before the widespread adoption of deep learning, automated landslide mapping approaches evolved through several methodological stages. Early methods relied mainly on pixel-based techniques, such as thresholding of spectral indices or terrain parameters, which were simple to implement but highly sensitive to noise and illumination conditions. These approaches were later complemented by object-based image analysis (OBIA), which segments images into meaningful objects and classifies them based on spectral, spatial, and contextual features (Blaschke, 2010; Martha et al., 2010; Notti et al., 2023). OBIA-based methods represented a substantial improvement by incorporating shape, texture, and neighborhood information, and were widely applied to landslide detection from high-resolution imagery. However, both pixel- and object-based approaches typically depend on manually designed rules or handcrafted features, limiting their transferability across different events, sensors, and geological settings.
More recently, machine-learning and deep-learning approaches have progressively replaced rule-based systems by enabling data-driven feature extraction and end-to-end learning (LeCun et al., 2015). Automated landslide recognition techniques using convolutional neural networks (CNNs) have emerged as promising alternatives to manual mapping (Sameen and Pradhan, 2019; Chen et al., 2018; Ye et al., 2019; Tang et al., 2022; Ji et al., 2020; Lu et al., 2023). Numerous studies have demonstrated their effectiveness in real-world post-disaster scenarios. For example, Meena et al. (2021) applied a deep learning approach for rapid landslide mapping in India following extreme monsoon rainfall, while Prakash et al. (2021) introduced a generalized CNN framework designed to improve applicability across different geographic contexts. Prakash and Manconi (2021) further demonstrated the operational value of CNN-based mapping by rapidly delineating landslides triggered by severe storm events. Beyond individual case studies, recent research has focused on transferability, reproducibility, and systematic comparison of methods. Prakash et al. (2020) explicitly compared deep-learning models with traditional machine-learning approaches for landslide mapping from Earth observation data, highlighting the advantages of deep architectures in complex environments. In parallel, benchmark datasets such as Landslide4Sense (Ghorbanzadeh et al., 2022b), HR-GLDD (Meena et al., 2023), and the CAS Landslide Dataset (Xu et al., 2024) have been released to promote standardized evaluation across multiple events, sensors, and geographic regions. These efforts have significantly advanced the field by enabling more robust inter-comparisons and by revealing persistent challenges related to class imbalance, spatial heterogeneity, and generalization across geological domains.
In parallel with CNN developments, transformer-based architectures have recently been introduced in landslide mapping to better capture long-range spatial dependencies and multi-scale contextual information. Unlike CNNs, which primarily exploit local convolutional kernels, transformers rely on self-attention mechanisms that allow each pixel (or patch) to attend to a broader spatial context. This property is particularly relevant for landslide detection, where the geomorphological setting, slope connectivity, and spatial coherence of failures extend beyond local neighborhoods. Hybrid CNN–Transformer models and pure transformer-based architectures have shown promising results in improving robustness and generalization across heterogeneous landscapes (Chen et al., 2023; Wu et al., 2024). These characteristics are especially attractive for rapid response applications, where models must be deployed with limited training data and applied to large, spatially diverse areas under operational constraints.
Despite these advances, a substantial gap remains between methodological developments and their practical deployment during emergency response. Most deep-learning studies rely on relatively large and well-balanced training datasets, often adopting train-to-validation ratios such as 80 : 20 or 70 : 30 (Meena et al., 2023). In contrast, during an ongoing crisis only a small fraction of the affected area is typically mapped and annotated in the first hours to days, making extensive training datasets unrealistic. This limitation is often exacerbated by delays in acquiring cloud-free post-event imagery, inconsistencies in pre-event reference data, and the operational need to deploy models rapidly with minimal manual intervention. Furthermore, early training samples are frequently not representative of the full variability of landslide processes and environmental conditions, including different landslide types, lithologies, land-cover patterns, and illumination or shadow effects. As a result, models trained on limited and potentially biased early annotations may generalize poorly when applied to the broader affected region.
In this study, we utilize the landslide inventory from the May 2023 crisis in the Emilia-Romagna region of Italy (Berti et al., 2025) to assess the effectiveness and limitations of automated mapping algorithms in a practical setting. We specifically focus on the performance of the U-Net and SegFormer algorithms in identifying landslides triggered by the event, despite the challenges of very limited training data. The study also considers the variety of landslide types and geological conditions prevalent in the area, which impacted the disaster response. The main goal of this research is to determine whether advanced deep-learning methods can effectively replace manual mapping in managing large-scale landslide disasters, thus bridging the gap between academic research and real-world application in emergency management.
2.1 Overview of the disaster
In May 2023, the Emilia-Romagna region of Italy was hit by unprecedented meteorological events, as detailed by Berti et al. (2025), Foraci et al. (2023), and Pizziolo et al. (2023). Two major rainfall episodes, from 1–3 and 16–17 May, led to severe floods and landslides primarily affecting the eastern part of the region (Fig. 1a). The first event (1–3 May) was driven by a stationary low-pressure system which delivered over 200 mm in 48 h. The second event (16–17 May), featured a similar low-pressure system enhanced by bora winds and moist air from the Mediterranean, resulting in rainfall exceeding 250 mm in the same duration. The cumulative impact of these episodes resulted in more than 500 mm of rainfall over two weeks, nearly half the region's annual climatic precipitation (Fig. 1a). The return period for these combined rainfall events was estimated to exceed 1000 years (Brath et al., 2023), highlighting the unprecedented nature of this occurrence. The two cyclonic events led to extensive flooding, submerging 540 km2 of land, and triggered more than 80 000 landslides across approximately 1000 km2 (Fig. 1b). This widespread devastation impacted thousands of buildings, roads, and other infrastructure, with the estimated damages amounting to approximately EUR 9 billion.
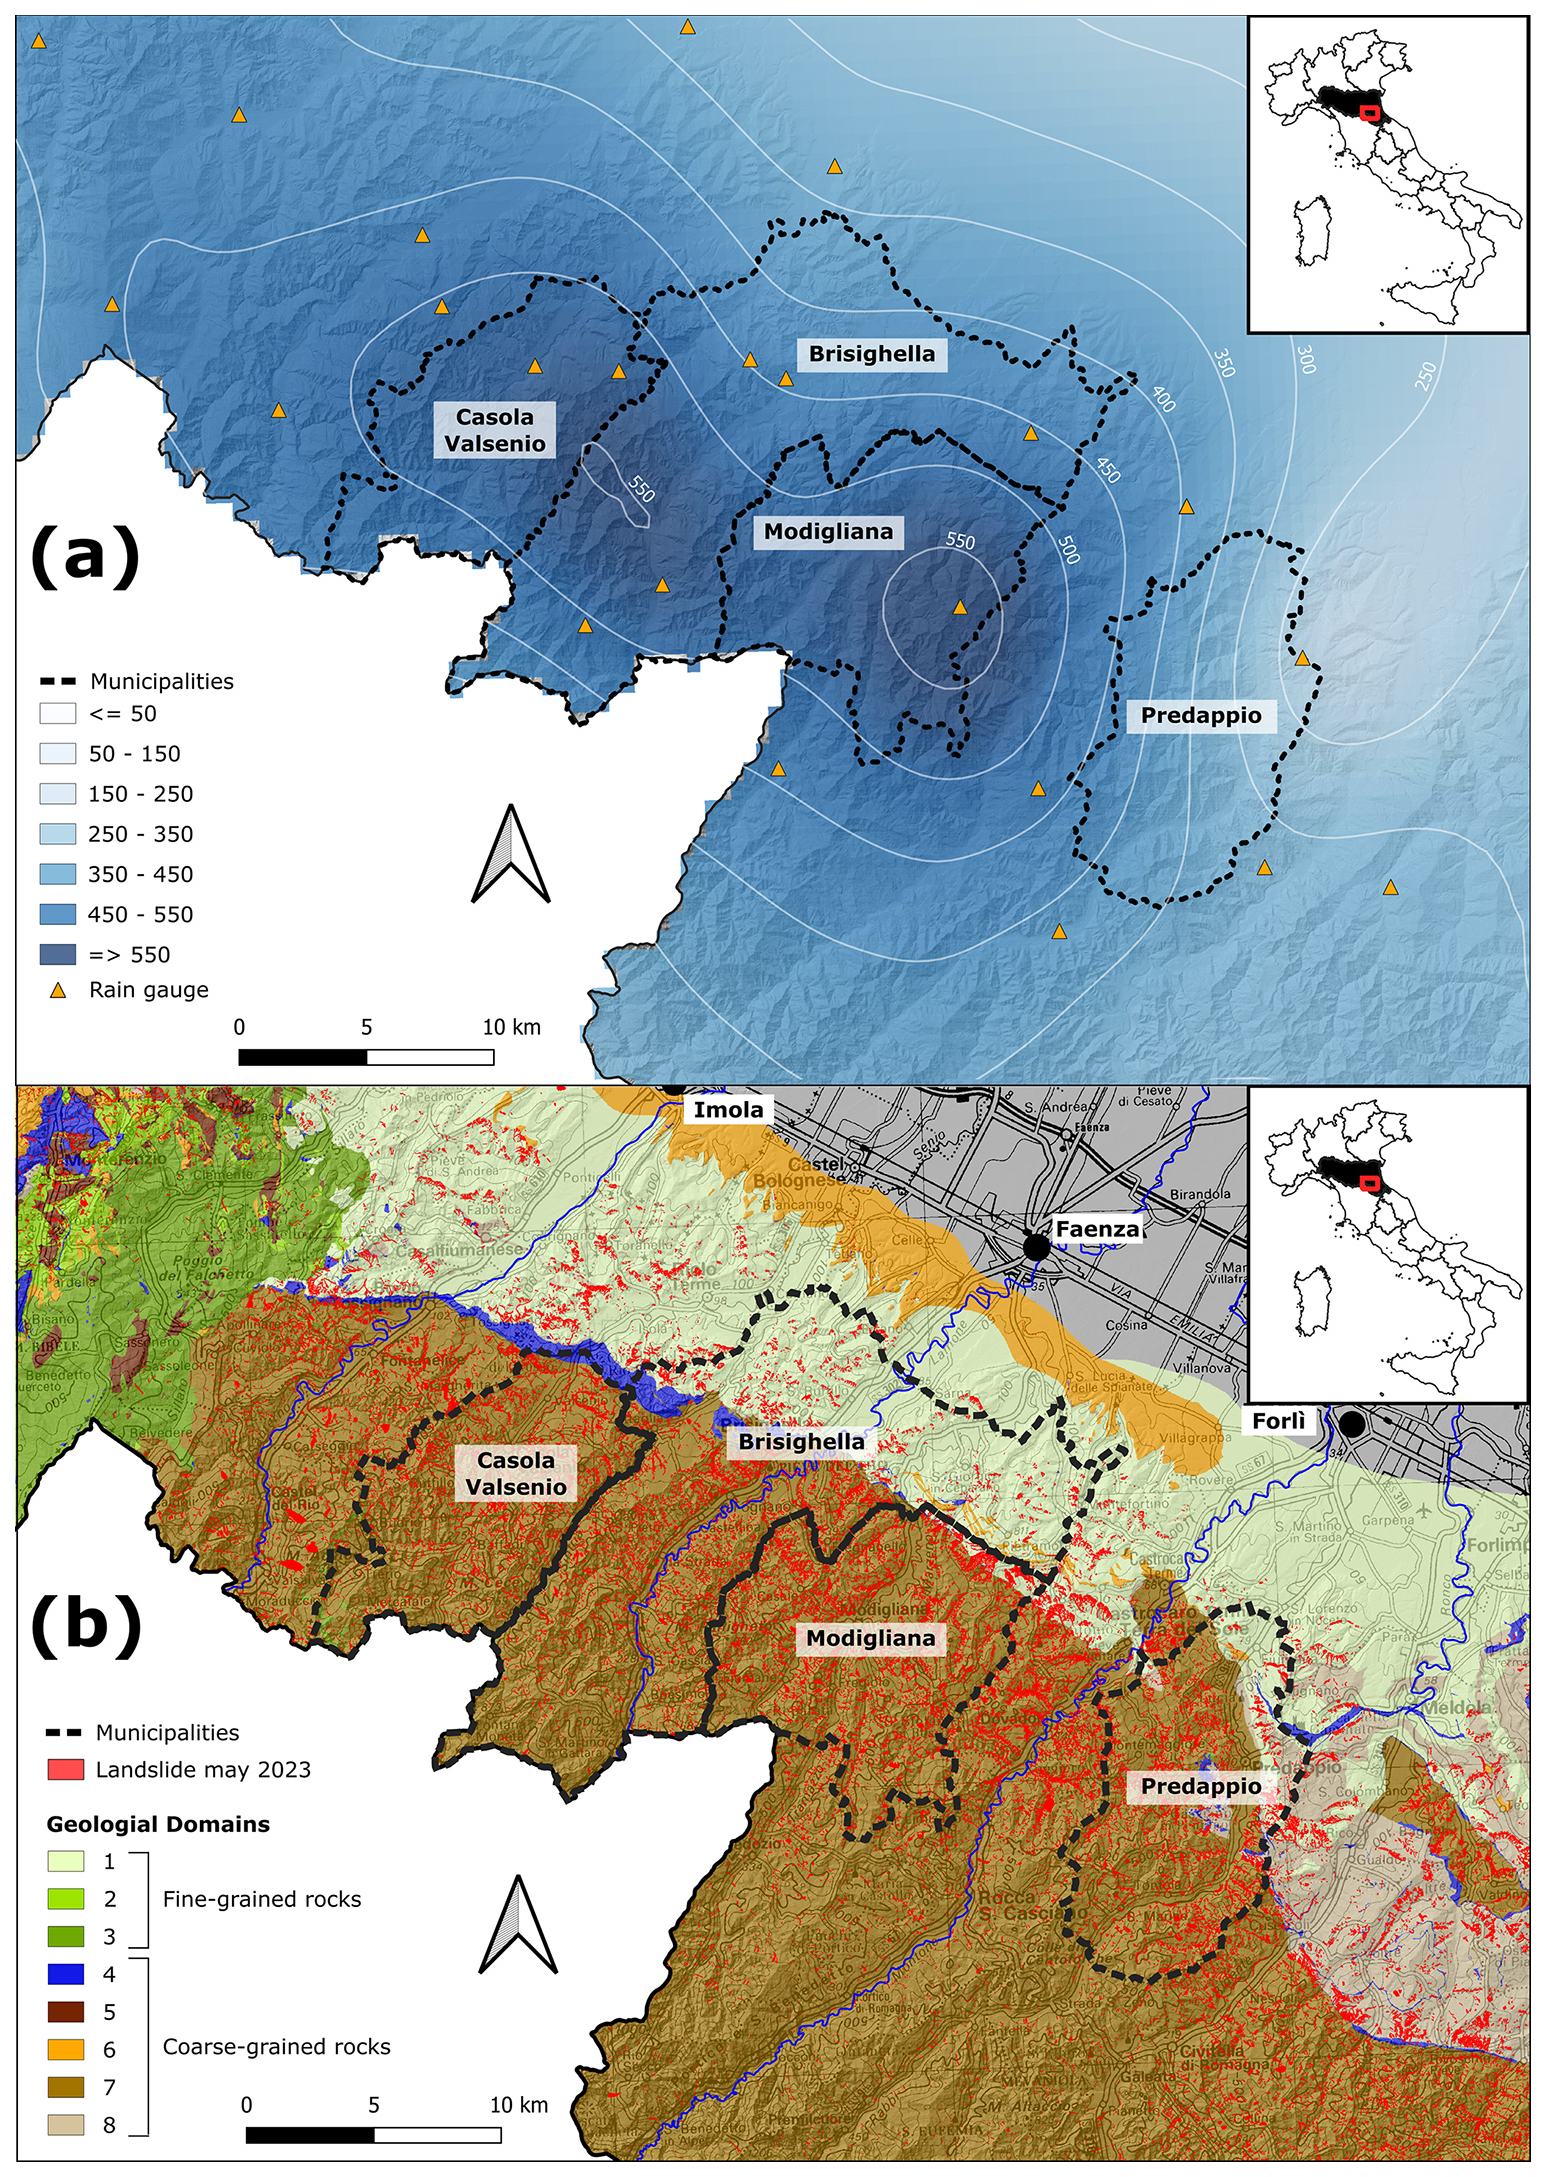
Figure 1Overview of the Effects of the Extreme Rainfall Event in Romagna, May 2023. (a) Cumulative precipitation from 1 to 17 May 2023 derived from the regional rain-gauge network operated by Regione Emilia-Romagna. (b) Manually mapped landslide distribution across the study areas, categorized by lithological units (Units 1–8) following the classification proposed by Berti et al. (2025; Table 2).
Immediately after the disaster, we initiated the development of a detailed inventory map of the landslides caused by the event. This map was manually created using high-resolution aerial imagery taken only one week following the second rainfall event. The aerial images, which include four bands (RGB+NIR) and have a resolution of 0.2 m, allowed for the accurate identification and classification of the landslides. The data derived from this mapping effort are described in Berti et al. (2025) and are available for public download in shapefile format (DOI: https://doi.org/10.5281/zenodo.13742643, Pizziolo et al., 2024).
2.2 Motivation of the work
The visual identification of the landslides from May 2023 proved to be a challenging and time-intensive process. It took six months for twelve expert geologists to identify and delineate all the landslides within the 1000 km2 area affected by the disaster. Despite these challenges, this approach was deemed the best available method at the time to meet the Civil Protection agency's specific requirements for accuracy, precision, and oversight during the emergency response coordination.
As this manual mapping progressed, we explored various automated mapping techniques to speed up the process and reduce the workload. Initial trials using NDVI methods and U-Net in a specific sample area produced promising results, demonstrating that deep-learning models can effectively replicate manual mapping efforts (Berti et al., 2026). However, these preliminary analyses were conducted in a test area (the Casola Valsenio municipality, Fig. 1), which covers only about 10 % of the total area impacted by the event. Since predictive approaches can be strongly conditioned by complex geological settings (Dal Seno et al., 2024), several critical questions remain unanswered: (i) Can automated models trained on a small area be effectively used for rapid mapping of larger regions? (ii) How do models trained in specific geological conditions perform across different geological settings? (iii) Could more sophisticated deep-learning methods surpass U-Net in improving outcomes?
Addressing these questions is crucial to determine whether emerging automated methods can enhance the efficiency of landslide mapping in future crisis scenarios, thereby potentially reducing critical response times. In this study, we simulate landslide mapping during a crisis, taking into account the limited data typically available and the accessible information under such conditions. This simulation is grounded in our firsthand experience of the real emergency during the May 2023 event, which provided us with valuable insights into the practical challenges and data limitations encountered during such crises.
Table 1Summary of the landslides mapped in the four study municipalities after the May 2023 Emilia-Romagna event, including total counts and breakdown by landslide type. DS = debris slides; DF = debris flows; DF1 = long-runout debris flows; DF2 = limited-runout debris flows; ES = earth slides; EF = earth flows; RS = rock-block slides. Data are from the RER2023 landslide inventory (Berti et al., 2025) and its open-access release (Pizziolo et al., 2024).

3.1 Casola Valsenio
The municipality of Casola Valsenio is situated 30 km southwest of Imola (Fig. 1), covering an area of 84 km2. It is predominantly known for its agricultural activities, including the cultivation of herbs, fruit orchards, and beekeeping. The underlying geology of the region is predominantly made up of the “Unit 7” mainly composed of the Marnoso-Arenacea Formation (FMA) (Unit 7 in the lithological classification of Berti et al., 2025; Table 2), a Tertiary flysch characterized by a finely interbedded sequence of marl and sandstone layers. This sequence was deposited in a deep marine foredeep basin during the Miocene epoch (Amy and Talling, 2006). The formation is characterized by a variable Arenites Pelites (A P) ratio, which reflects variations in depositional environments within the basin. In Casola Valsenio, nearly the entire area features FMA with an A P ratio ranging from to . The northern sector is distinguished by predominantly sandstone-rich layers (A P > 3) along with minor outcrops of Tectonized Clays (FPP) and Messinian Gypsum (FGY) formations. Before May 2023, the Geological Survey had documented 730 ancient, inactive landslides, primarily rock-block slides on cataclinal slopes that align with bedding planes. Following the May 2023 disaster, this figure dramatically increased to 5572 new landslides (Fig. 2a). Landslide types and counts reported here are derived from the official RER2023 inventory (Berti et al., 2025), which is openly available as a vector dataset on Zenodo (https://doi.org/10.5281/zenodo.13742643, Pizziolo et al., 2024). The post-event landslide inventory in Casola Valsenio is dominated by debris slides and debris flows, mainly triggered by shallow failures of the thin soil cover overlying the Marnoso-Arenacea bedrock (Fig. 3b–d; Table 1). Both long- and limited-runout debris flows are observed, reflecting differences in slope morphology and vegetation. Earth movements are rare, whereas rock-block slides, although less frequent, are locally significant due to their larger size and damage potential (Fig. 3a). The May 2023 disaster notably disrupted local infrastructure, blocking the main road and cutting off the southern region for weeks. Nearly 70 homes and 200 roadways were severely affected.
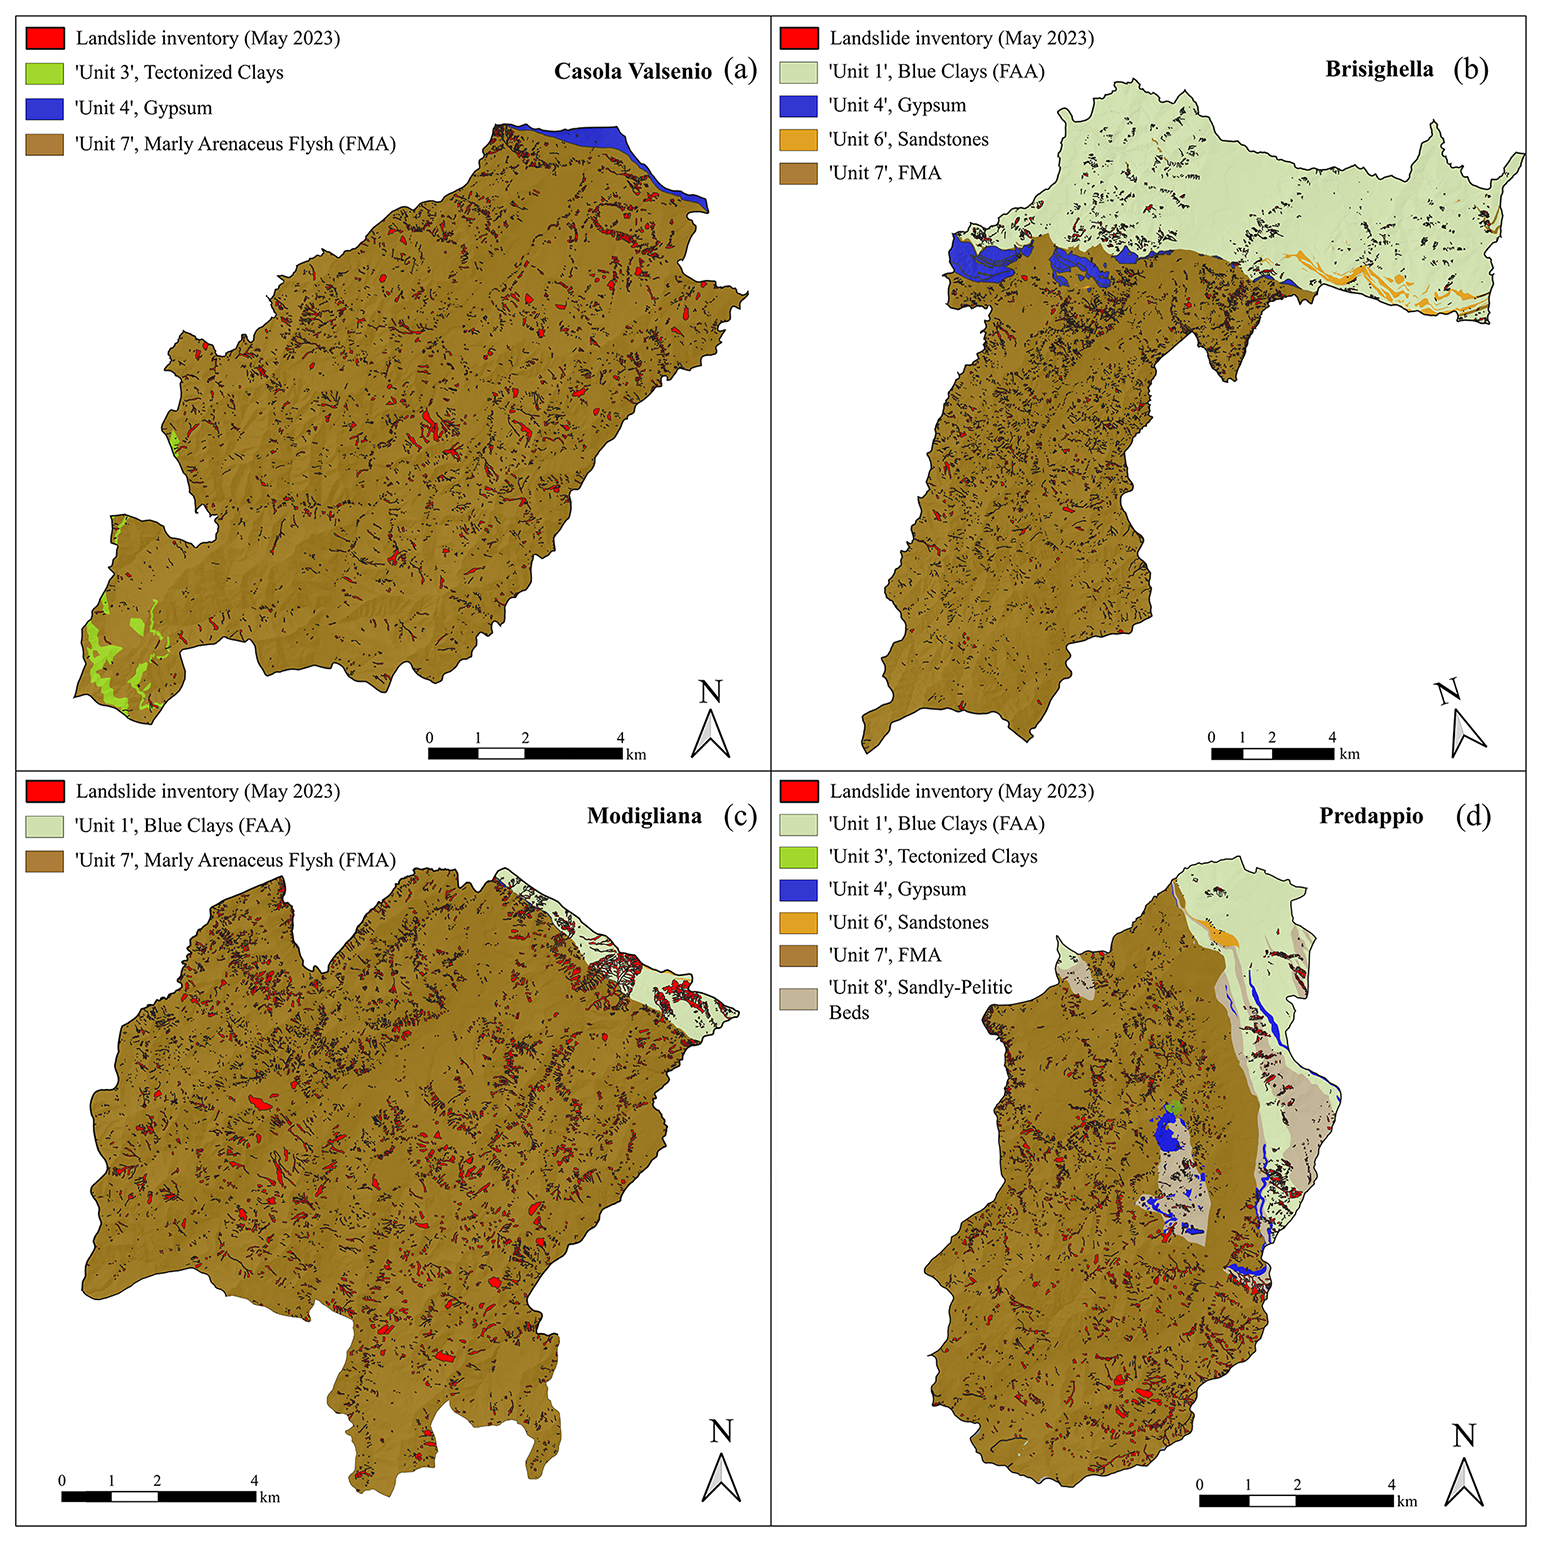
Figure 2Schematic geological map of the municipalities of Casola Valsenio (a), Brisighella (b), Modigliana (c) and Predappio (d). FMA = Marnoso-Arenacea Formation, FAA = Blue Clays Formation.
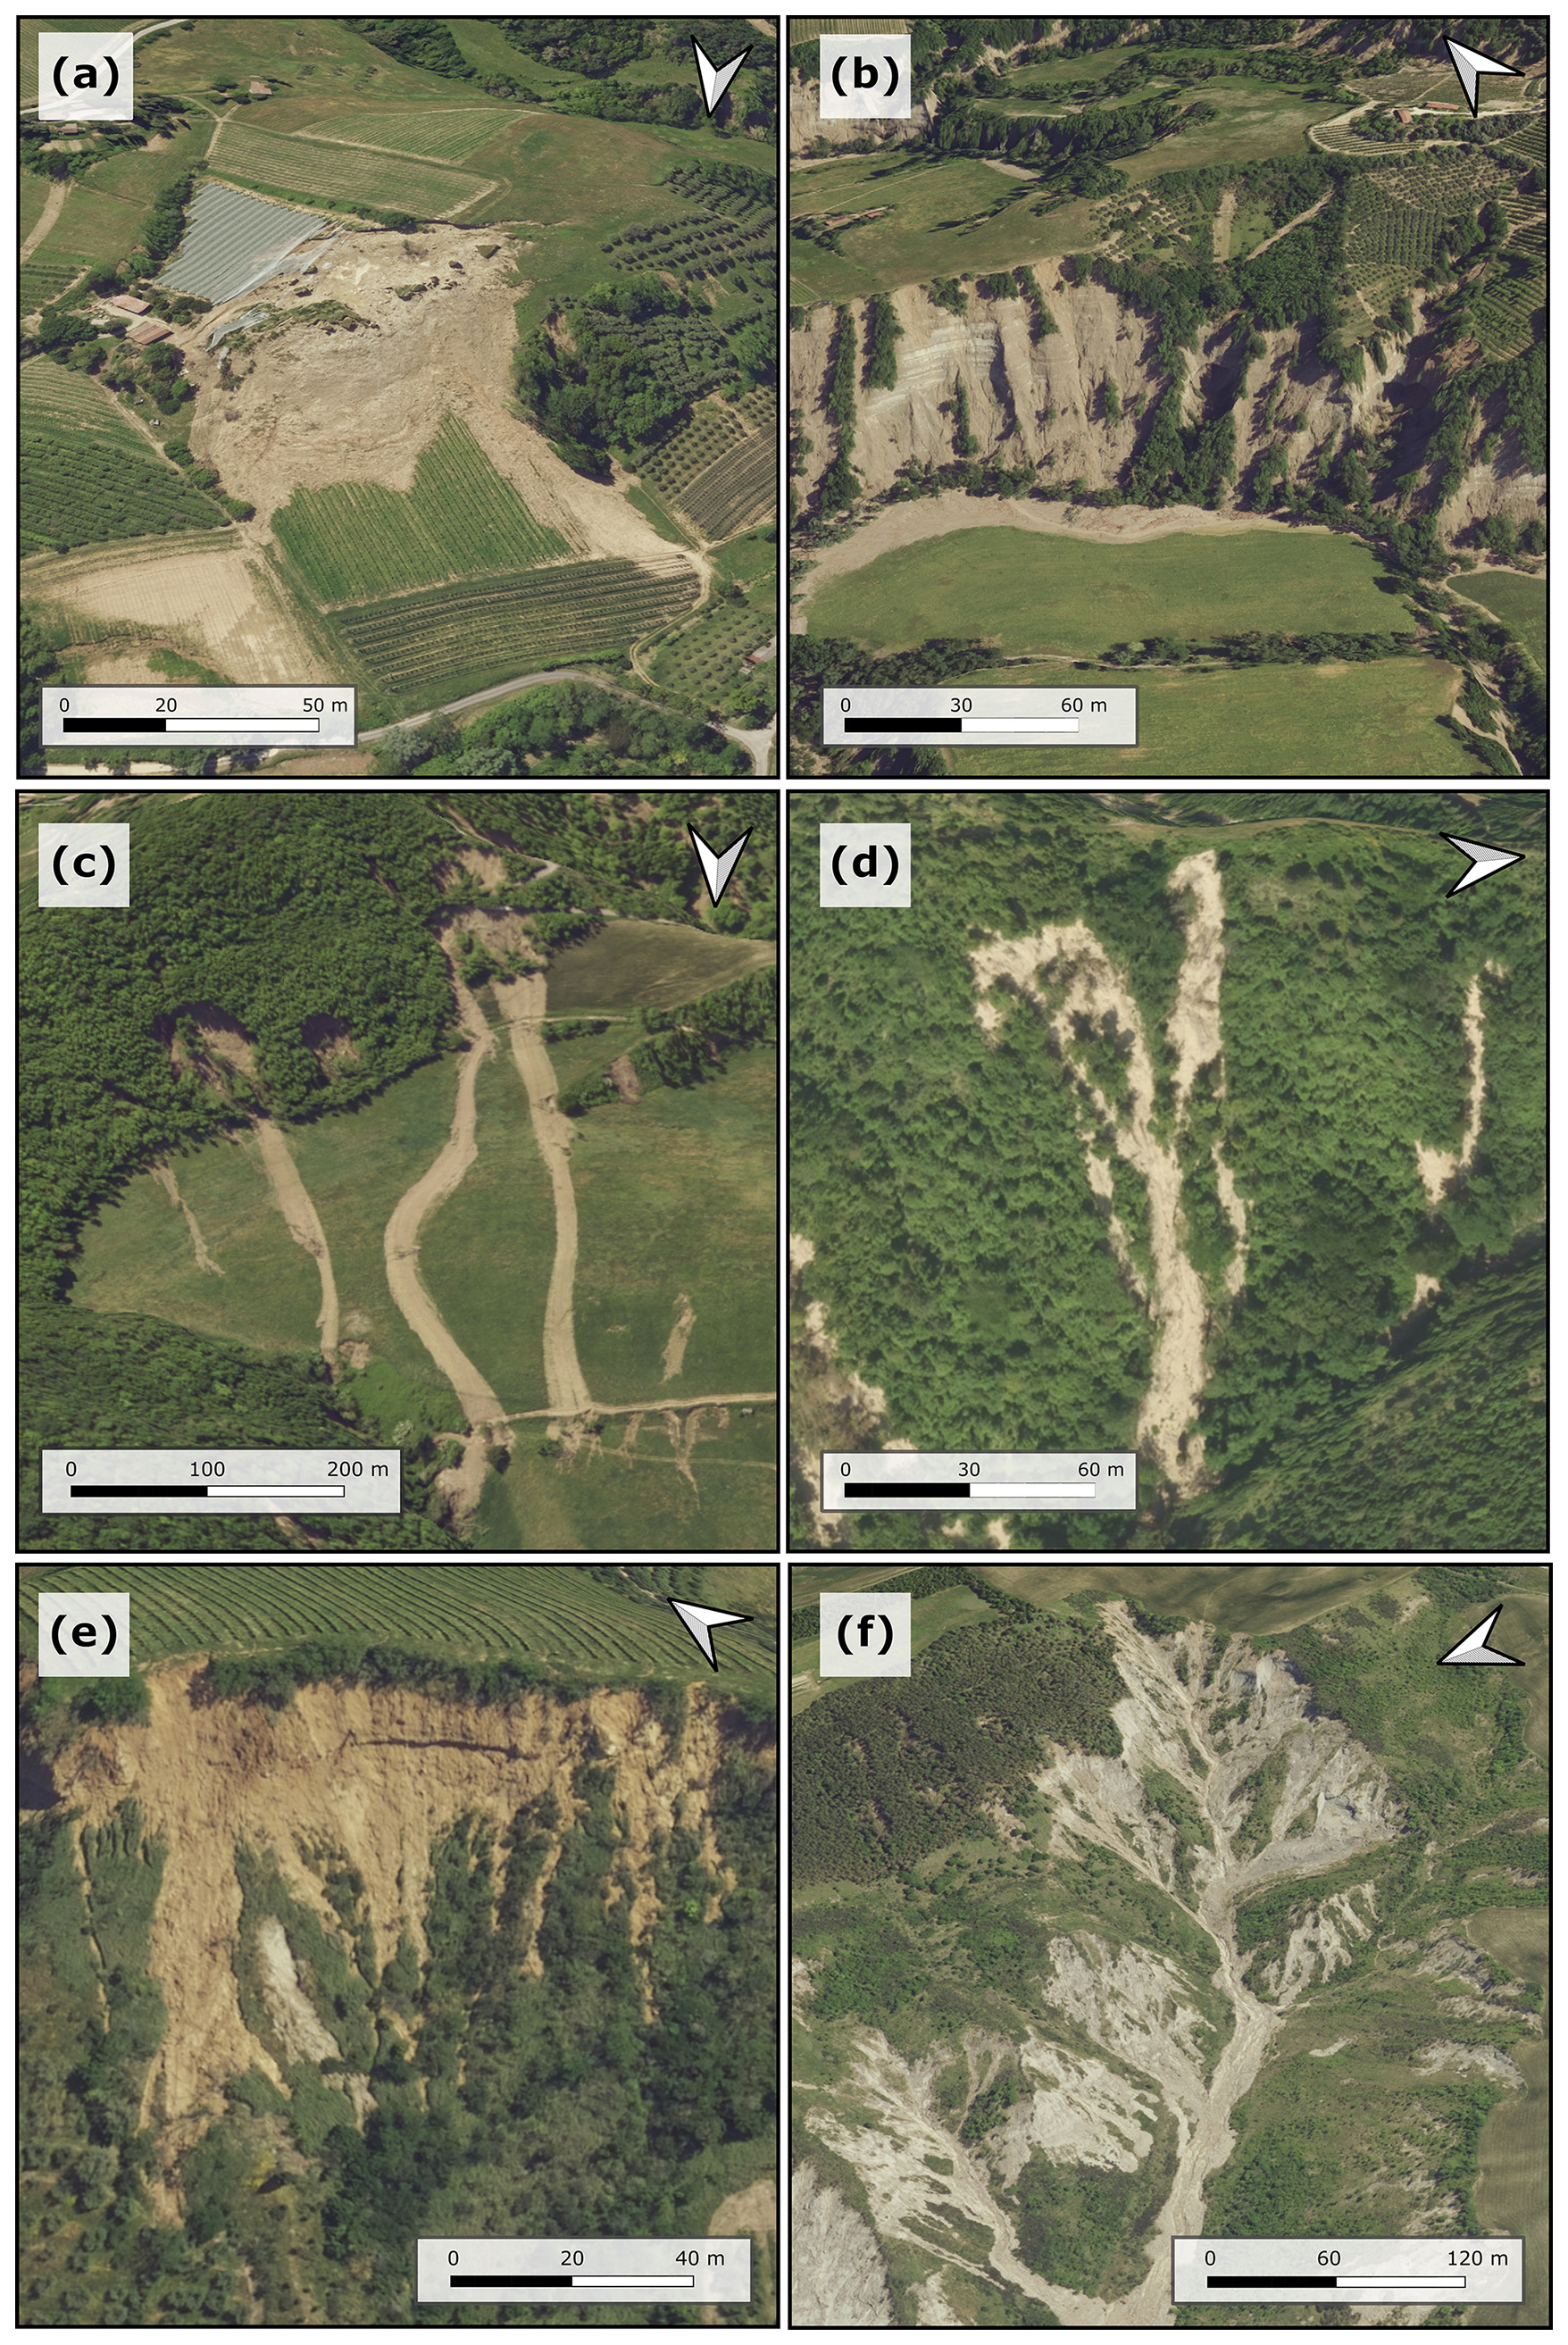
Figure 3Examples of Landslides in Romagna from May 2023 event following Berti et al. (2025) classification. (a) Rockslide (RS) at Baccagnano, Brisighella, triggered during the night of 2–3 May (WGS84: 44.2069085, 11.7739792). (b) Debris slide (DS1) at Monte Albano, Casola Valsenio (WGS84: 44.2356093, 11.6682287). (c) Debris flow with extended runout on gentle unforested slope (DF1) at Casola Valsenio (WGS84: 44.20834, 11.64312). (d) Debris flow with limited runout on steep forested slope (DF2) at Modigliana (WGS84: 44.15124, 11.75511). (e) Earth Slide (ES) at Brisighella (WGS84: 44.23912, 11.78393). (f) Earth Flow (EF) at Predappio (WGS84: 44.08947, 11.99627). Images © Regione Emilia-Romagna, Geoportale 3D (https://mappe.regione.emilia-romagna.it, last access: 24 August 2026).
3.2 Brisighella
The municipality of Brisighella borders Casola Valsenio to the east (Fig. 1) and covers 194 km2. The area is primarily composed of the “Unit 7” composed by Marnoso-Arenacea Formation (FMA) (Fig. 2b). The northern part of the municipality, approximately 75 km2 in size, consists mainly of the Blue Clays Formation (FAA) (Fine-grain rocks “Unit 1” in Fig. 1b), which is bordered by a narrow strip of gypsum (Fig. 2b). Before the event, the Geological Survey had documented 2100 landslides in the area, mostly ancient and inactive rock-block and complex slides. Following the disaster, an additional 6342 landslides were recorded. Landslide processes vary markedly with lithology in this area. Debris slides prevail in areas underlain by the Marnoso-Arenacea Formation, while earth slides and earth flows are more common in the Blue Clays sector, where badland morphologies are widespread (Table 1). Debris flows occur with variable runout, and rock-block slides are relatively rare but locally impactful.
3.3 Modigliana
The municipality of Modigliana is located approximately 15 km to the east of Casola Valsenio (Fig. 1), and is one of the area most seriously affected by the event. The area spans 101 km2 and is primarily composed of the Marnoso-Arenacea Formation, FMA (“Unit 7”) with an A P ratio ranging from to (Fig. 2c). A small portion of Blue Clays, FAA (Unit 1) outcrops in the northeast. Before the disaster, 795 landslides were documented, mostly complex and rock-block slides. After the May 2023 event, the number of landslides jumped to 6974, drastically reshaping the landscape. The landslide inventory in Modigliana is largely dominated by debris slides, with debris flows representing a secondary but relevant process (Table 1). Both long- and limited-runout debris flows contributed to slope and channel instability, whereas rock-block slides and earth movements occur only sporadically. This pattern reflects widespread shallow instability within the Marnoso-Arenacea Formation.
3.4 Predappio
The municipality of Predappio is situated around 30 km east of Casola Valsenio (Fig. 1) and spans an area of 91 km2. The geological framework of Predappio is mainly characterized by the Marnoso-Arenacea Formation, FMA (“Unit 7”) with an A P ratio ranging from to . The central part of the municipality also features the Colombacci Formation (“Unit 8” in Fig. 1b), interspersed with gypsum from the Gessoso-Solfifera Formation (“Unit 3”). Towards the northeast, the landscape transitions to the Blue Clays formation (“Unit 1”), interbedded with deposits of the Colombacci Formation and several occurrences of Pliocene sandstones (Borello Sandstones, “Unit 7”). Debris slides, here, represent the most common landslide type, accompanied by numerous debris flows with variable runout behavior (Table 1). Rock-block slides are infrequent but potentially severe, while earth slides and earth flows are more common than in purely sandstone-dominated areas, reflecting the local presence of clay-rich lithologies. The area experienced weeks of isolation due to several landslides blocking the main road, impacting 19 homes and damaging 138 roadways, again with long-lasting consequences.
Automated methods for landslide mapping were applied in the four municipalities shown in Fig. 2 (Casola Valsenio, Brisighella, Modigliana and Predappio). These areas, situated in the eastern part of the Emilia-Romagna region (Fig. 1), were significantly affected by the meteorological event of May 2023. The Casola Valsenio area was chosen for training models, whereas Brisighella, Modigliana, and Predappio served as validation sites. In their study, Berti et al. (2026) used Casola Valsenio to train a conventional U-Net model, and compared the results with those obtained using the traditional NDVI change detection method. We opted to continue using this area for training to ensure consistency with previous research. The other three areas were selected because together they encompass approximately 35 % of the regions most impacted by landslides and represent around 25 % of the recorded 80 997 landslide events (20 148). Moreover, these municipalities exhibit varied geological conditions, with both similarities and differences to Casola Valsenio, thereby offering a comprehensive test of the models' adaptability to diverse terrains and landforms.
Table 2Simplified classification of the geological formations in the Emilia-Romagna region into eight litho-structural units, adapted from Berti et al. (2025). The classification is based on lithological composition and structural domain. Units 1 to 3 predominantly include fine-grained rocks, while units 4 to 8 are composed mainly of coarse-grained lithologies.
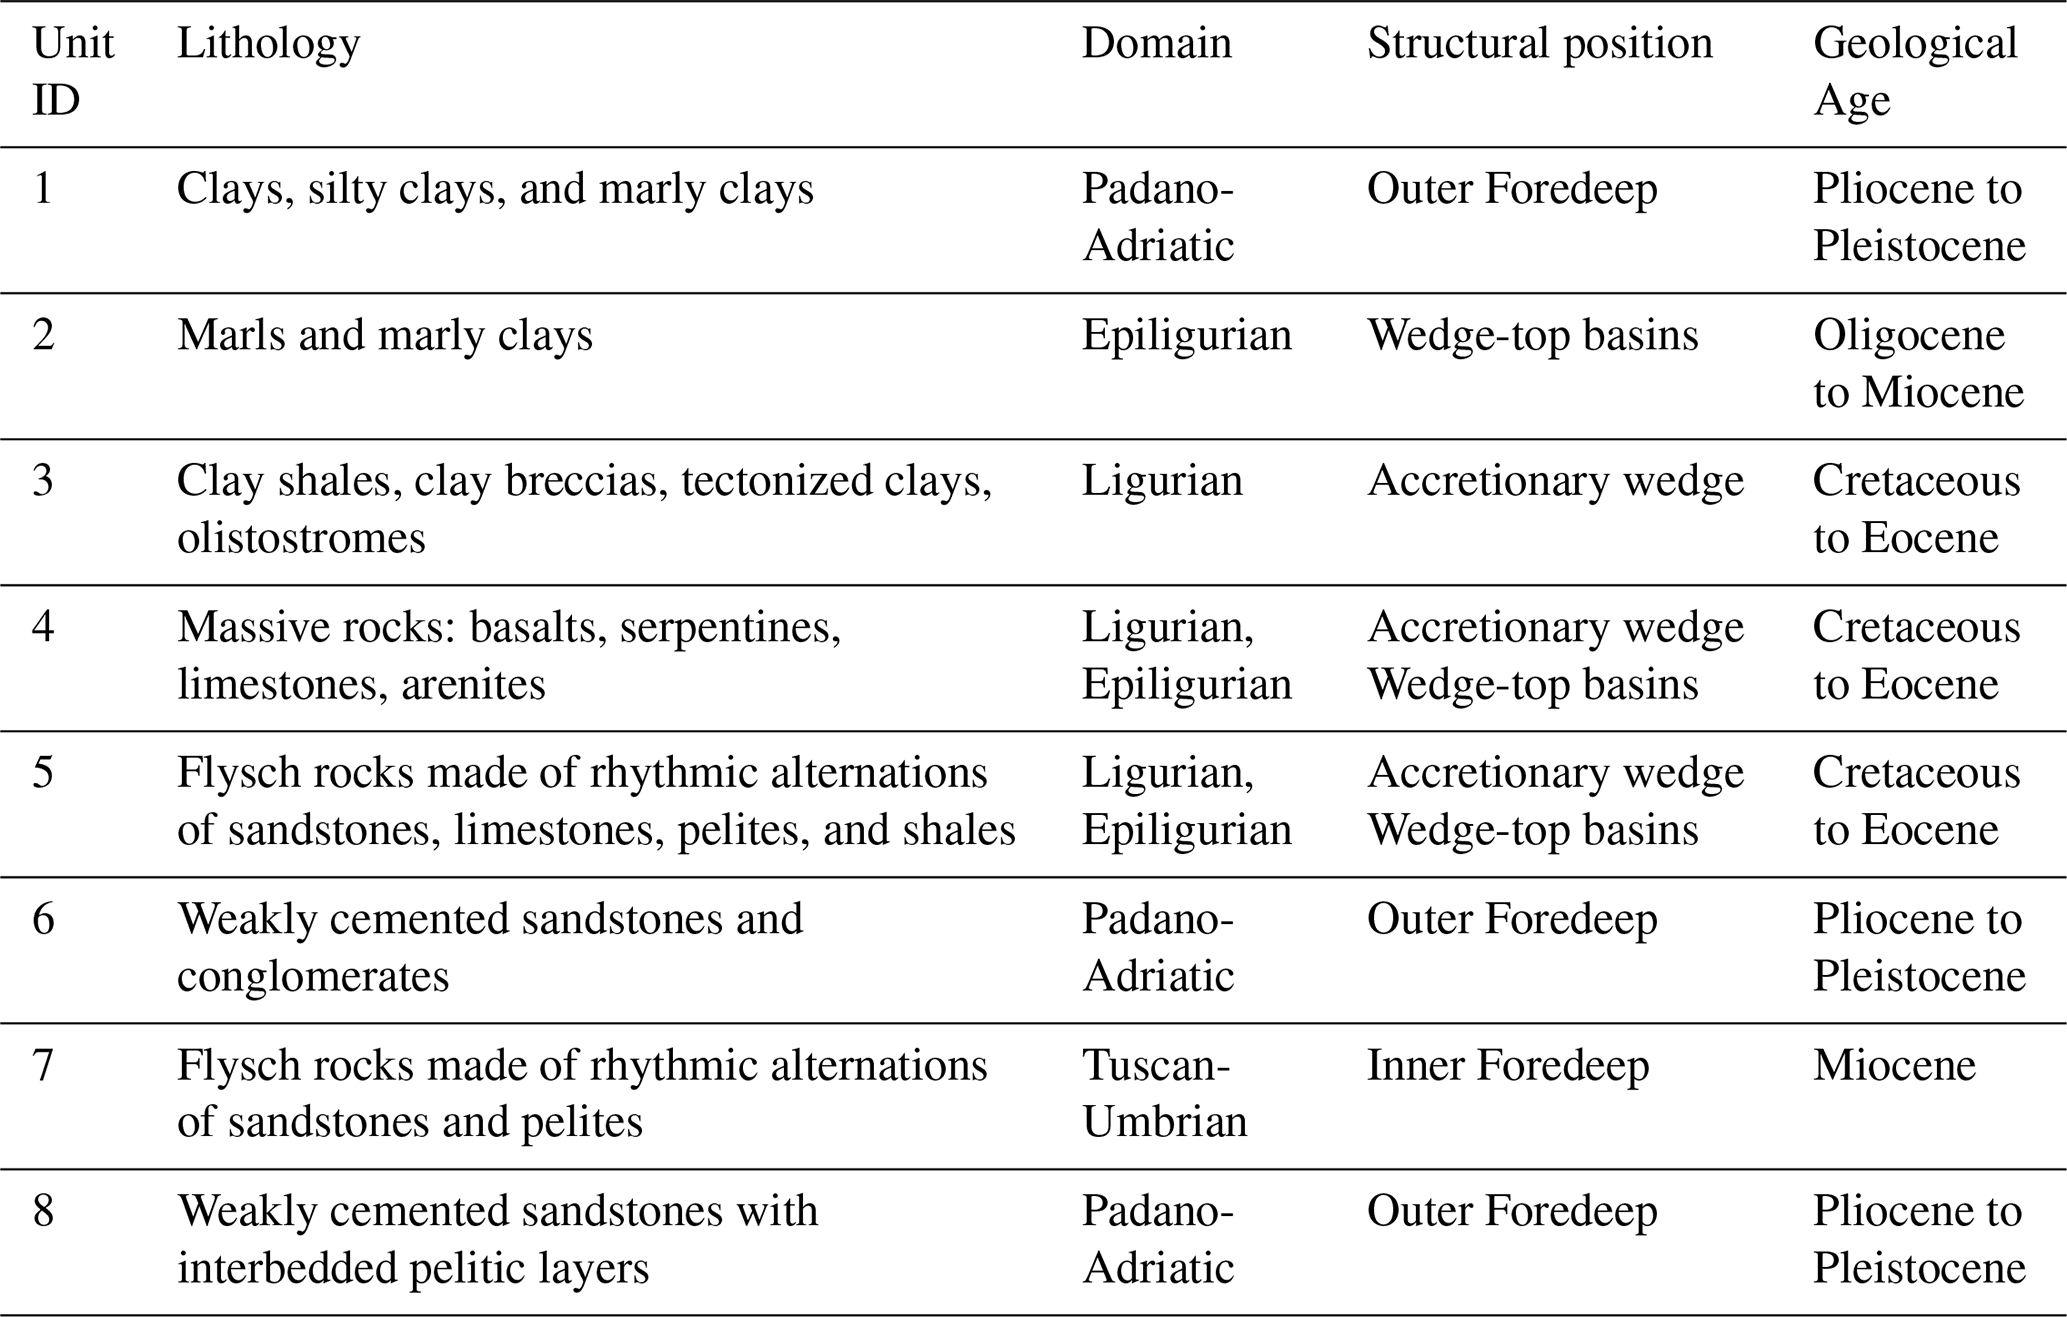
To represent geological variability in a way that is both meaningful and operational for the analysis, we adopted the lithological classification introduced by Berti et al. (2025), which groups the over 600 geological formations of the Emilia-Romagna region into eight lithological units (Table 2, Fig. 1b). This classification combines lithological characteristics with structural domains, acknowledging that the same rock type may exhibit different mechanical properties depending on its tectonic setting. Units 1 to 3 consist of fine-grained materials (e.g., clays, marls, tectonized shales), while units 4 to 8 mainly comprise coarse-grained rocks (e.g., sandstones, flysch, conglomerates). This simplified scheme captures key differences in the weathering behavior and mechanical response of the rock masses, which are known to influence the type and frequency of landslides. Fine-grained units generally produce cohesive soils prone to earth slides and flows, whereas coarse-grained units generate granular soils more susceptible to debris slides and debris flows. This categorization aligns with the “earth” and “debris” material types defined in the Cruden and Varnes (1996) landslide classification and is used throughout this study to interpret landslide patterns in relation to geological setting.
4.1 Data
Deep-learning models for landslide mapping typically utilize a multi-layer input approach, integrating a combination of satellite or aerial imagery, topographical data, and land use information to capture the complex characteristics of landslides (Ghorbanzadeh et al., 2019; Meena et al., 2022). In our analysis, we considered the following seven layers (Fig. 4):
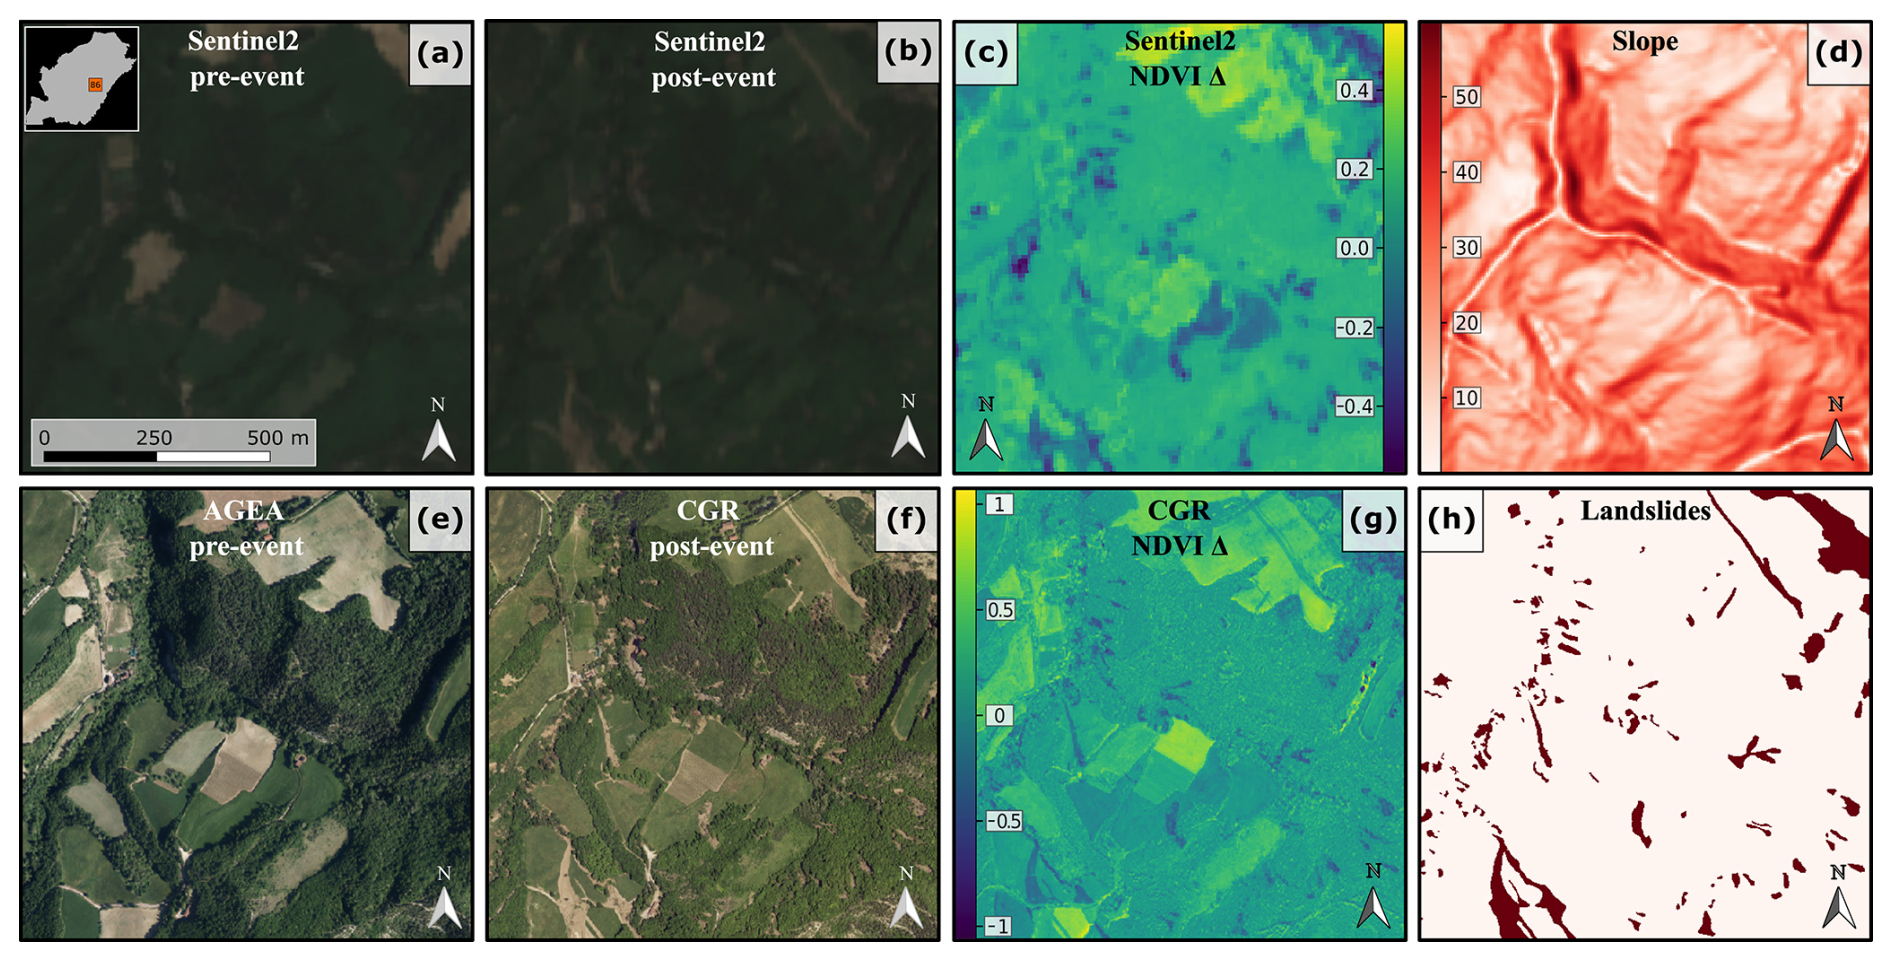
Figure 4Example of the layers included in case 7, Tile No. 86. (a) Pre-event Sentinel-2 image (2022); (b) Post-event Sentinel-2 image; (c) NDVI change map derived from Sentinel-2 imagery; (d) slope map; (e) AGEA imagery (2020), pre-event; (f) CGR aerial image (2023), post-event; (g) NDVI change map derived from high resolution imagery; (h) Binary raster showing manually mapped landslides (ground truth).
- L1
-
Post-event Sentinel-2 images: Four-band (RGB+NIR) satellite images at 10 m spatial resolution, acquired after the second rainfall event on 23 May 2023. Sentinel-2 Level-2A (L2A) products (bottom-of-atmosphere surface reflectance) were used. They represent the first post-event Sentinel-2 images obtained with minimal cloud cover (Fig. 4b).
- L2
-
Pre-event Sentinel-2 images: Four-band (RGB+NIR) satellite images at 10 m spatial resolution acquired in May 2022, one year prior to the event. Sentinel-2 Level-2A (L2A) products (bottom-of-atmosphere surface reflectance) were used. These images provide a similar vegetation state to that of May 2023 and were selected due to the lack of cloud-free images in the two months preceding the event (Fig. 4a).
- L3
-
NDVI change Sentinel-2 map: Single-band raster generated by subtracting the pre-event NDVI map (Tucker, 1979) derived from L2 from the post-event NDVI map created using L1 (Fig. 4c).
- L4
-
Post-event CGR images: Four bands (RGB+NIR) aerial photographs with a very high resolution of 0.2 m captured on May 23, 2023, shortly after the event. These images were committed by the Emilia-Romagna Region specifically for the disaster (Fig. 4f).
- L5
-
Pre-event AGEA images: Four bands (RGB+NIR) aerial photographs with a very high resolution of 0.2 m captured 3 years before the event (April to June 2020). These images were committed by the Agency for Agricultural Payments mainly for agricultural purposes (Fig. 4e).
- L6
-
NDVI change CGR map: Single-band raster generated by subtracting the pre-event NDVI map derived from L5 from the post-event NDVI map created using L4 (Fig. 4g).
- L7
-
Slope map: Single-band raster derived from the 5 × 5 m Digital Terrain Model (DTM) of the Emilia Romagna Region. The DTM, which is based on the 1 : 5000 scale Regional Technical Map, captures the pre-event slope morphology (Fig. 4d).
These layers were combined to define seven data-availability scenarios (cases 1–7 in Table 3), each reflecting realistic operational conditions following a landslide-triggering event.
Table 3Overview of the various input layer configurations used during the training processes. “NDVI” refers to the “ΔNDVI-CGR” Change map created using CGR imagery, while “ΔNDVI-S2” refers to the NDVI Change map created using Sentinel-2 imagery.
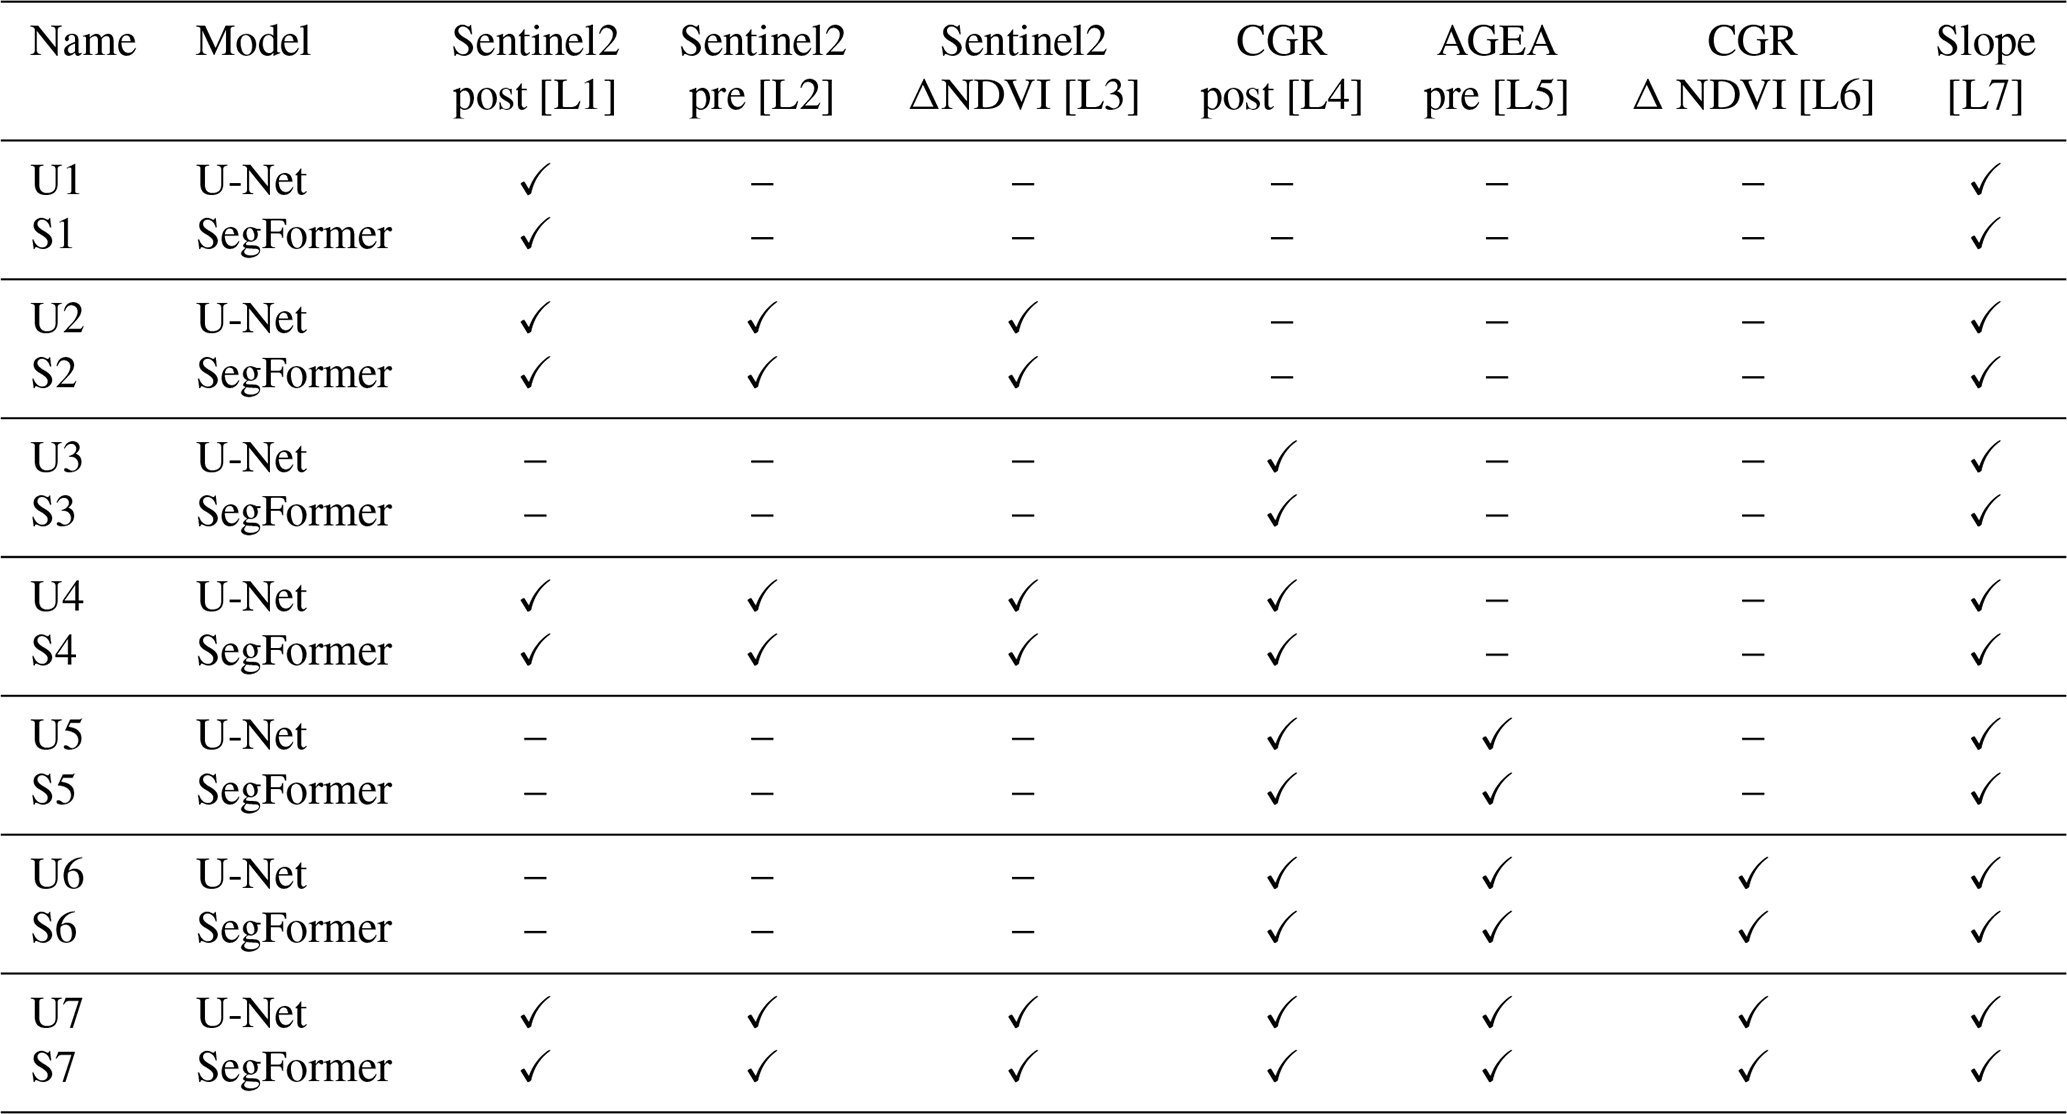
In all scenarios, the availability of a slope map (L7) was assumed. In the present study, L7 was derived exclusively from the regional 5 × 5 m DTM. However, this assumption reflects a more general operational condition, as slope information can be readily derived from freely available global digital elevation models (e.g., SRTM, ASTER, ALOS, Copernicus DEM), which are commonly accessible even in data-scarce emergency contexts.
Case 1 (Table 3) represents the most data-limited scenario, where only post-event Sentinel-2 imagery (L1) is available. Owing to its global coverage, short revisit time, and free accessibility, Sentinel-2 data often constitute the primary information source immediately after large-scale disasters (Wasowski and Bovenga, 2014; Yang et al., 2019; Ban et al., 2020).
Case 2 considers situations in which pre-event Sentinel-2 imagery (L2) is also accessible, allowing the computation of an NDVI change map (L3). While this condition is frequently met, prolonged cloud cover or strong seasonal vegetation variability may prevent the availability of suitable pre-event images.
Cases 3 and 4 describe scenarios in which high-resolution post-event imagery is acquired, either alone (case 3) or in combination with Sentinel-2 data (case 4). Such data may originate from very-high-resolution satellite systems (e.g., WorldView, Pleiades, SkySat) or dedicated aerial surveys and substantially improve the detection of small or geomorphically subtle landslides.
Cases 5 and 6 address less common situations in which high-resolution imagery is available both before and after the event, optionally complemented by a high-resolution NDVI change map. The effectiveness of these scenarios depends strongly on the temporal proximity of the pre-event imagery to the triggering event.
Finally, case 7 represents the most data-rich configuration, combining all available layers (L1–L7).
Although the post-event (L4), pre-event (L5), and derived NDVI change (L6) aerial datasets were originally available at 0.2 m spatial resolution, their use at native resolution resulted in systematic out-of-memory errors during training and inference due to the large size of the input tensors. To ensure computational stability, were therefore downsampled to 2 m, representing a practical compromise between spatial detail and computational feasibility for regional-scale mapping. By contrast, Sentinel-2 layers (L1–L3) and the slope layer (L7) were resampled to the same 2 m grid solely to ensure pixel-wise alignment when used together with the aerial datasets; this step does not add information beyond their native resolution and was performed for operational consistency.
4.2 Data preparation and training-testing design
To reproduce operational conditions typical of post-event emergency mapping, the deep-learning workflow was designed to prioritise spatial generalisation rather than random pixel-level splitting. All input layers described in Sect. 4.1 were harmonised to a common spatial resolution and grid prior to training.
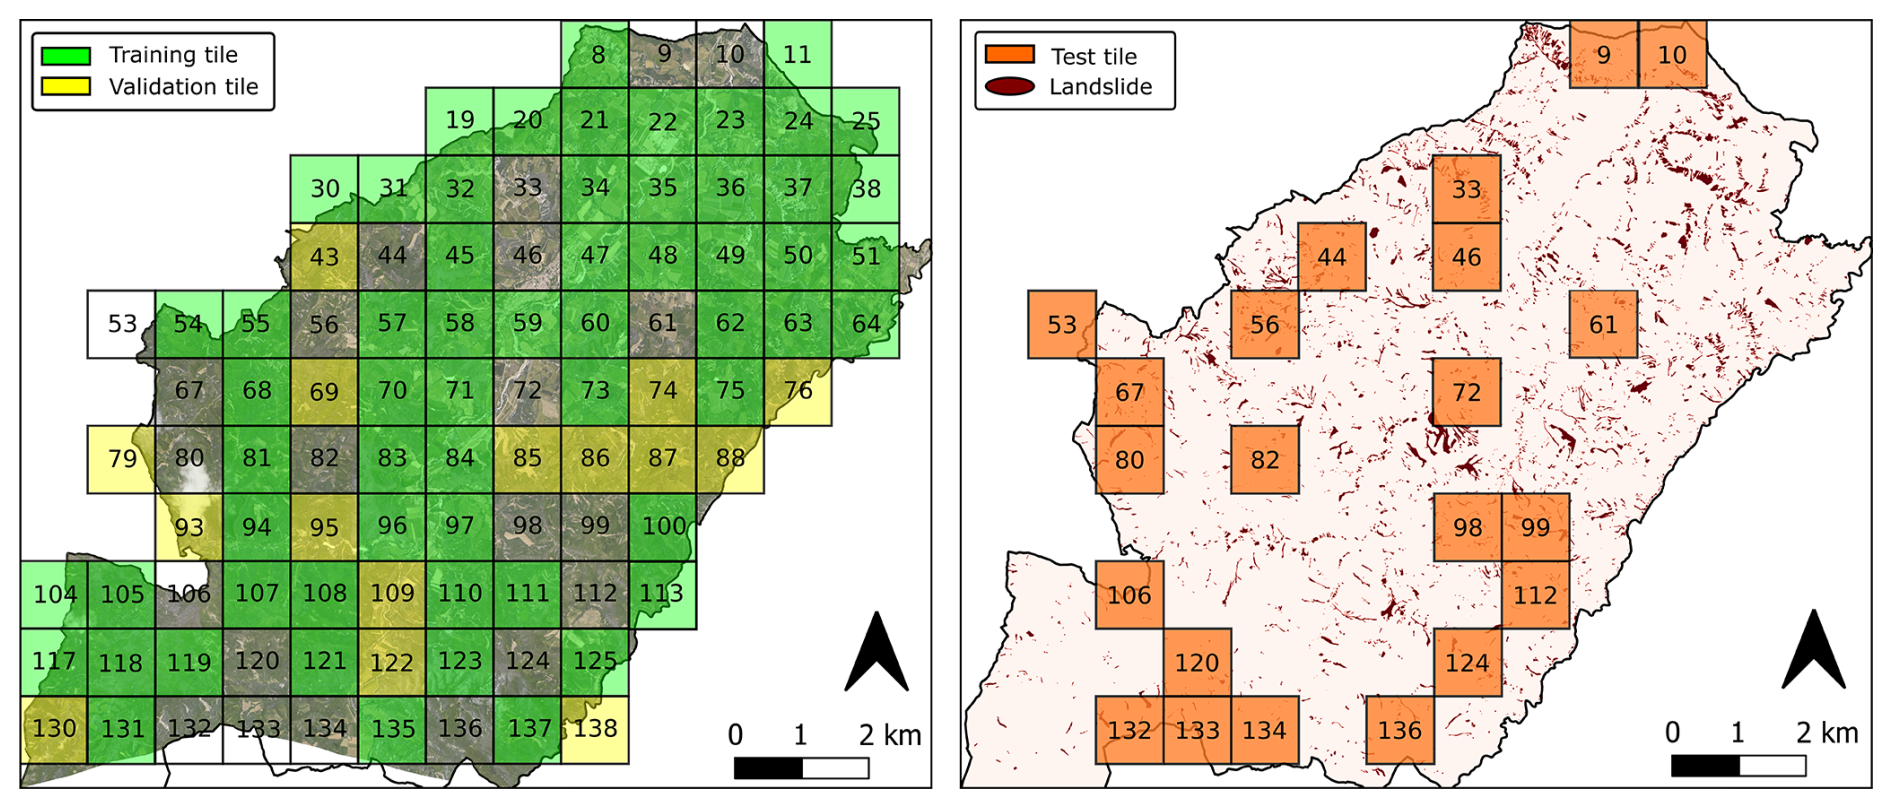
Figure 5Training and test tiles used for models' construction in Casola Valsenio, illustrating the spatial split of the area.
The training area (Casola Valsenio municipality) was subdivided into regular 1 × 1 km tiles (Fig. 5) to define consistent spatial sampling units and to reduce spatial autocorrelation effects (Abrahams et al., 2024). When resampled to a spatial resolution of 2 m, each tile corresponds to 512 × 512 pixels in the CGR imagery. Individual tiles typically include a large number of mapped landslides (often exceeding 50), providing a robust representation of landslide morphology and surrounding land cover.
Instead of conventional random splits (e.g. or ; Hastie et al., 2009), we adopted a strategy tailored to emergency response scenarios. The models were trained exclusively on data from Casola Valsenio and subsequently applied, without retraining, to three neighbouring municipalities, Predappio, Modigliana, and Brisighella, for independent testing. This setup simulates a realistic operational context in which a model trained on a limited reference area is rapidly deployed to map other affected regions.
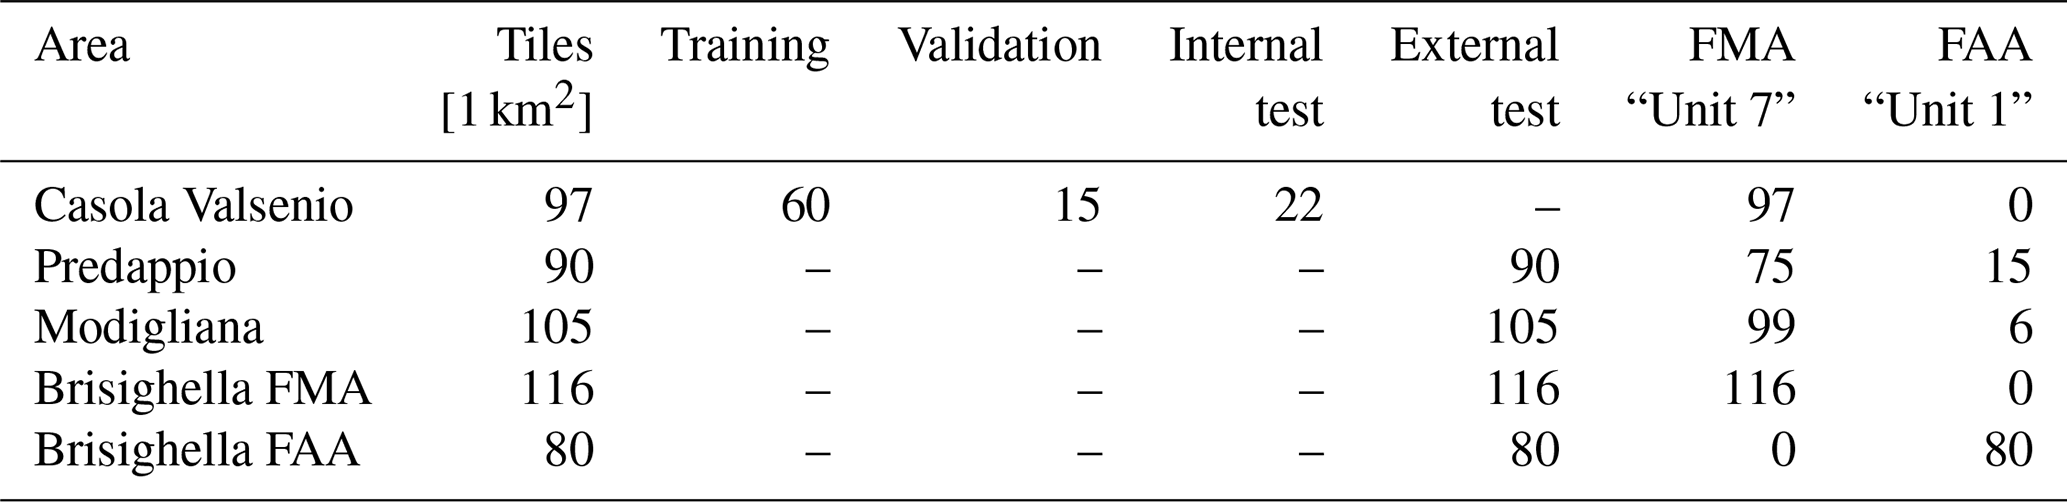
Within Casola Valsenio, a stratified random sampling strategy was used to partition the tiles into training, validation, and internal testing subsets. Out of 97 tiles, 60 (62 %) were assigned to training, 15 (15 %) to validation, and 22 (23 %) to internal testing (Fig. 5). External evaluation was then conducted on all tiles from the three remaining municipalities, providing a spatial hold-out test to assess cross-municipality generalisation. This tile-based spatial splitting yields a strongly imbalanced pixel-level segmentation problem, because landslide pixels represent only a small fraction of the mapped area. In Casola Valsenio (training area), landslide pixels account for ∼ 4 % of the total pixels (non-landslide : landslide ratio ∼ 24 : 1). A comparable imbalance characterises the external test areas, with ∼ 6 % landslide pixels in Predappio (∼ 16 : 1), ∼ 7.6 % in Modigliana (∼ 12 : 1), and ∼ 5 % in Brisighella FMA (∼ 19 : 1). The most extreme imbalance occurs in Brisighella FAA, where landslide pixels represent ∼ 2 % of the pixels (∼ 48 : 1). The implications of this class imbalance for model evaluation are discussed in Sect. 4.5.1.
4.3 Deep Learning Semantic Segmentation Models
To evaluate the performance of different deep-learning paradigms under variable data-availability scenarios (Table 3), two semantic segmentation architectures were implemented: a convolutional encoder-decoder network (U-Net) and a Transformer-based segmentation model (SegFormer). Schematic representations of both architectures are provided in Fig. 6 to facilitate understanding and comparison.
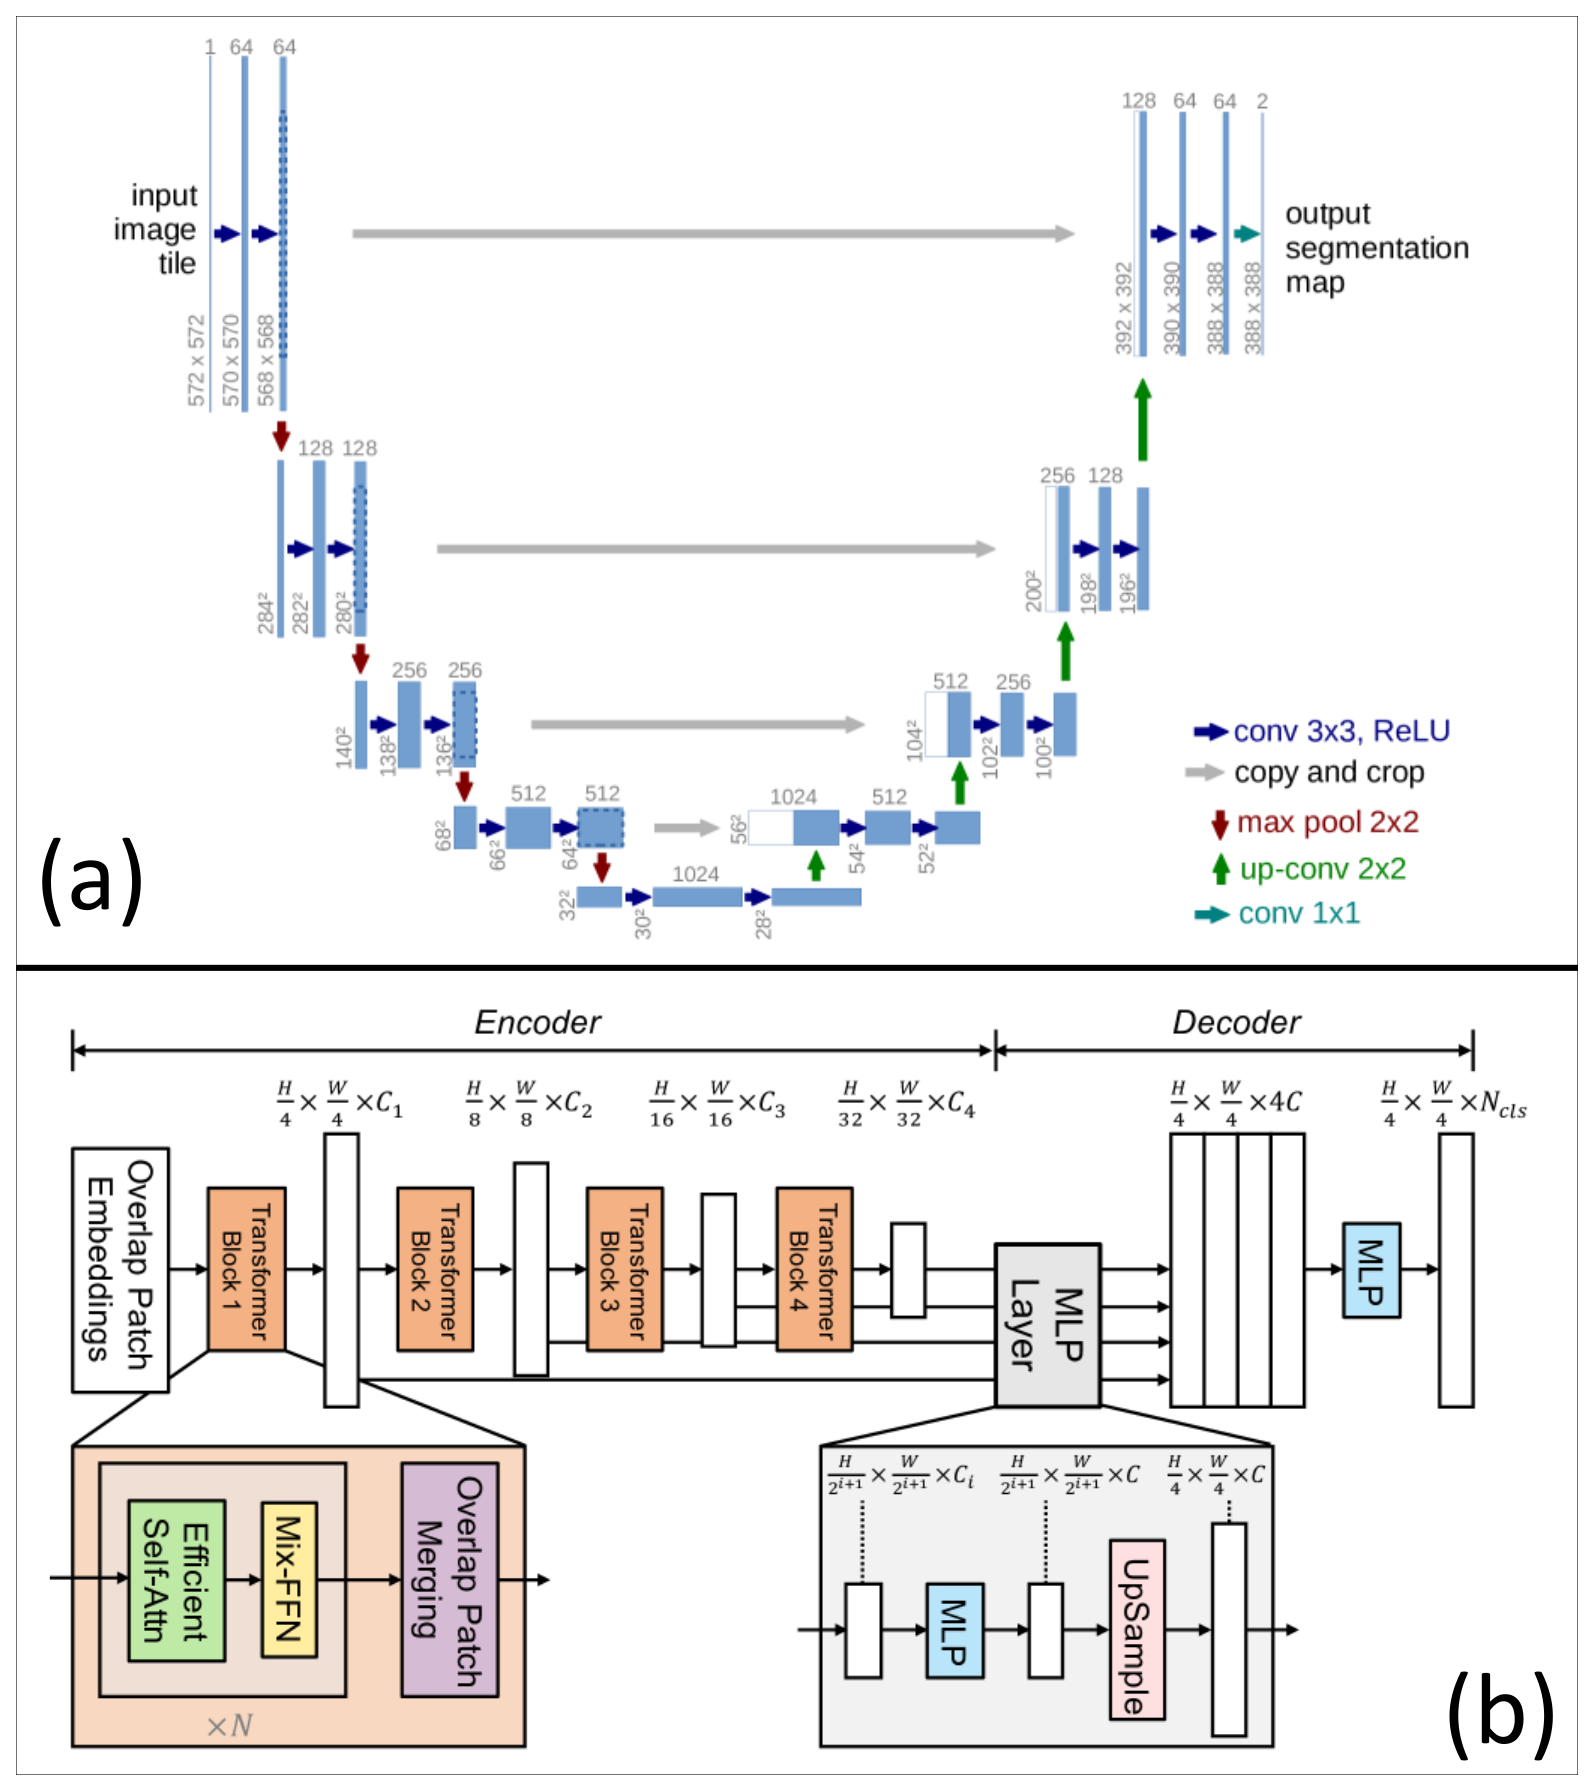
Figure 6Conceptual overview of the deep-learning semantic segmentation architectures used in this study. (a) U-Net encoder-decoder architecture with skip connections, illustrating the contracting path for contextual feature extraction and the expanding path for precise spatial localisation (adapted from Ronneberger et al., 2015). (b) SegFormer architecture, composed of a hierarchical Transformer encoder (MiT) with overlapping patch embeddings and efficient self-attention, and a lightweight all-MLP decoder for multi-scale feature fusion and dense per-pixel prediction (adapted from Xie et al., 2021).
4.3.1 U-Net
U-Net is a convolutional neural network originally developed for biomedical image segmentation (Ronneberger et al., 2015) and subsequently adopted in a wide range of geomorphological and Earth-observation applications. Its encoder-decoder structure enables the extraction of contextual information while preserving fine-scale spatial detail, a key requirement for accurate landslide delineation. The suitability of U-Net for landslide mapping has been demonstrated in several recent studies (Meena et al., 2021, 2022; Ghorbanzadeh et al., 2022a, 2023; Nava et al., 2022).
The architecture consists of a contracting encoder path and an expanding decoder path. In the encoder, spatial resolution is progressively reduced through convolutional and max-pooling layers to capture high-level contextual features. In the decoder, feature maps are upsampled using transposed convolutions and concatenated with corresponding encoder features via skip connections, which preserve spatial information and improve boundary localisation (Fig. 6a).
In this study, U-Net was implemented manually in Python and configured for binary semantic segmentation (landslide vs non-landslide). The network employed two downsampling scales, each comprising two convolutional layers. The initial number of filters was set to 64 and increased with network depth to capture progressively more complex features.
Training was performed using the Adam optimiser (Kingma and Ba, 2017) with a learning rate of 1 × 10⁻⁴ and Dice loss, for up to 300 epochs. Early stopping with a patience of 20 epochs was applied based on validation loss. All experiments were conducted using Python 3.8.18, TensorFlow 2.5.0, and CUDA 11.2.
4.3.2 SegFormer
SegFormer is a Transformer-based architecture specifically designed for efficient semantic segmentation of high-resolution and multispectral imagery (Xie et al., 2021). It addresses several limitations of earlier Vision Transformer models, including high computational cost, dependence on positional encodings, and inefficient multi-scale feature aggregation (Dosovitskiy et al., 2020).
The SegFormer architecture comprises two main components (Xie et al., 2021): (i) a hierarchical Transformer encoder that captures features at multiple spatial scales using efficient self-attention without positional encodings and Mix-FFN blocks with depth-wise convolutions, and (ii) a lightweight all-MLP decoder that fuses multi-level encoder features for dense per-pixel prediction (Fig. 6b). The absence of positional encodings allows the model to handle variable input resolutions without interpolation, which is advantageous for heterogeneous landslide imagery.
We adopted the MiT-B0 variant (Xie et al., 2021), with hidden sizes [32, 64, 160, 256], encoder depths [2, 2, 2, 2], and a decoder hidden size of 256. Although SegFormer was originally designed for three-channel RGB imagery, we exploited the flexibility of the SegformerForSemanticSegmentation implementation provided by the Hugging Face Transformers library (Wolf et al., 2020) to accommodate multi-channel inputs.
Training was performed using Cross-Entropy loss and the Adam optimiser with a learning rate of 1 × 10⁻³, for up to 300 epochs, with early stopping based on validation loss (patience = 20 epochs; Prechelt, 1998). Computations were carried out using Python 3.8.10, PyTorch 1.9.0 (Paszke et al., 2019), and CUDA 11.1.
4.4 Model application and geological transferability
Following training, the models were applied to the municipalities of Predappio, Modigliana, and Brisighella. Although ground-truth landslide inventories were available for these areas (Fig. 1a), they were not used during training and were reserved exclusively for model evaluation.
A key limitation of the training dataset is the predominance of the Marnoso-Arenacea Formation (FMA) in Casola Valsenio (Fig. 3a). To explicitly assess geological tralnsferability, the Brisighella municipality was subdivided into two distinct lithological domains: one dominated by the Marnoso-Arenacea Formation (Brisighella FMA) and one characterised by Pliocene Blue Clays (Brisighella FAA; Fig. 3d).
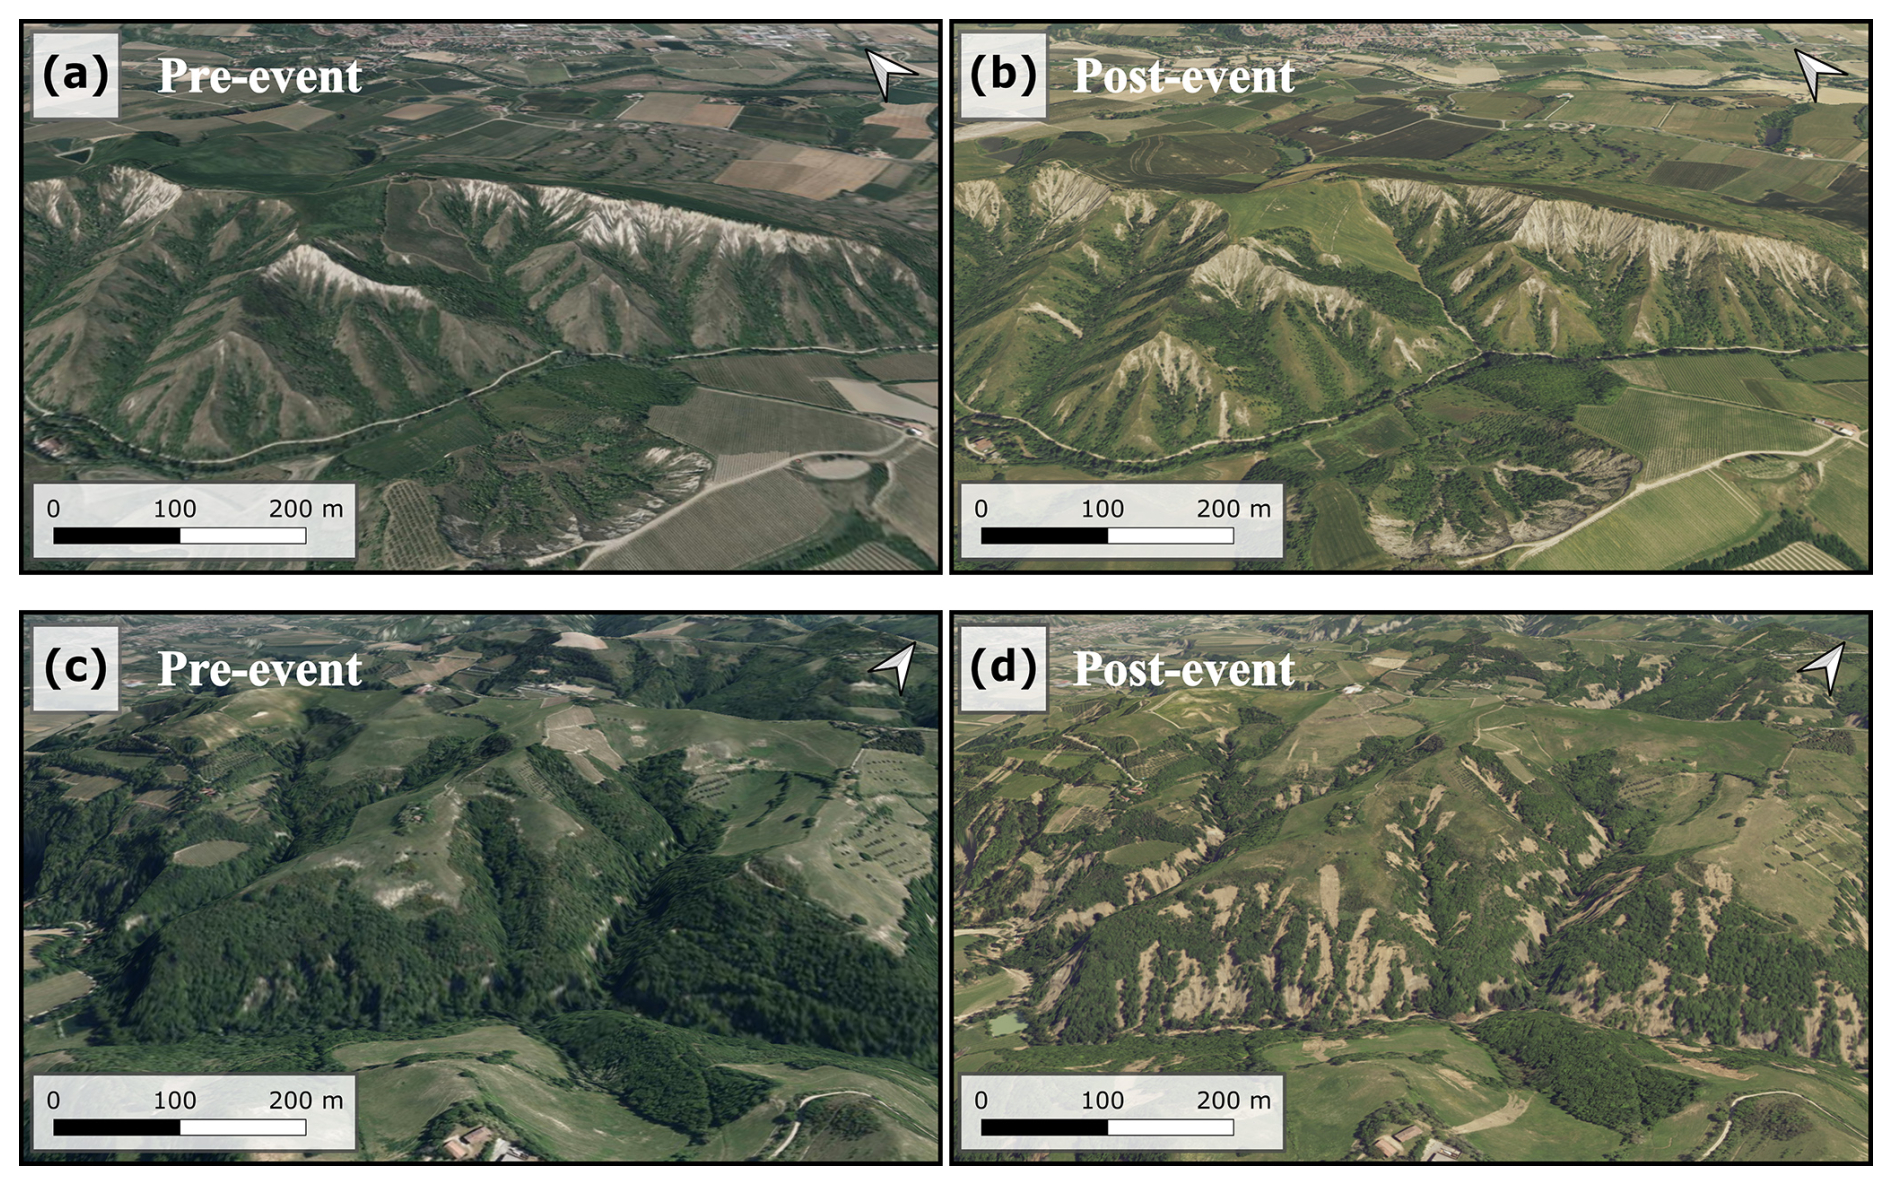
Figure 7Comparison examples are shown between pre-event (a) and post-event (b) earth flow (EF) landslides in the Blue Clays Formation (FAA) and pre-event (c) and post-event (d) debris slide (DS) in the Marnoso-Arenacea Formation (FMA), both triggered by the May 2023 disaster in Brisighella. Images © Regione Emilia-Romagna, Geoportale 3D (https://mappe.regione.emilia-romagna.it).
The FAA domain is dominated by earth flows (EF) and earth slides (ES), typically developed within fine-grained, clay-rich materials and often associated with badland-like morphologies. These landslides generally exhibit elongated shapes, lobate toes, and sparse or degraded vegetation cover, reflecting repeated reactivation processes (Fig. 7a–b). In contrast, landslides in the FMA domain, both in Brisighella and in the training area, are mainly debris slides (DS) and debris flows (DF) triggered within thin colluvial layers overlying flysch bedrock. These failures tend to be rapid, with well-defined scarps and runout zones, and commonly affect densely vegetated slopes (Fig. 7c–d).
By explicitly separating these lithological contexts, we evaluated whether models trained solely on FMA-type landslides could generalise to areas characterised by fundamentally different landslide processes, geometries, and surface expressions. A summary of the spatial extent of each lithological unit within the test municipalities is provided in Table 4 to support interpretation of the evaluation results.
Table 4Overview of the 1 km2 tiles used for model training, validation, and testing across the analysed municipalities. The table reports the number of tiles assigned to each dataset split and their distribution within the main lithological units, namely the Marnoso-Arenacea Formation (FMA) and the Pliocene Blue Clays (FAA). External testing was performed on 100 % of the tiles from Predappio, Modigliana, and Brisighella to assess cross-municipality and cross-lithology model generalisation.
4.5 Evaluation Metrics and Expert Judgment
4.5.1 Quantitative Metrics
To assess the performance of our landslide detection models, we employed two widely used metrics in semantic segmentation tasks: the F1 score and the Intersection over Union (IoU). These metrics were calculated on the entirety of the test images, rather than averaging scores across individual cells, to provide a comprehensive evaluation of the models' performance.
The F1 score (Dice coefficient) is the harmonic mean of precision and recall (Tharwat, 2020). We report F1 alongside IoU because the pixel-wise segmentation task is strongly imbalanced (Sect. 4.2), with landslide pixels representing only a small fraction of the mapped area. The F1 score is calculated as:
where Precision = TP (TP + FP) and Recall = TP (TP + FN), with TP, FP, and FN representing True Positives, False Positives, and False Negatives, respectively.
The Intersection over Union (IoU), also known as the Jaccard index, is another common metric for assessing segmentation accuracy (Rezatofighi et al., 2019). It measures the overlap between the predicted segmentation mask and the ground truth mask. The IoU is calculated as:
Both metrics range from 0 to 1, with 1 indicating perfect prediction. By using these metrics on the entire test images, we can evaluate how well our models perform in detecting and delineating landslides across varied landscapes and geological contexts.
4.5.2 Expert Judgment
In automated landslide mapping, a higher algorithmic score does not necessarily correspond to a higher quality map (Zhang et al., 2018; Isensee et al., 2021). This issue is particularly relevant in automated landslide mapping, where the practical utility of the map often depends more on its interpretability and coherence with geomorphological reality than on its statistical performance alone.
For example, a model might overpredict large landslide areas to optimize pixel-wise metrics like IoU, while neglecting smaller or fragmented features that are critical for field validation and emergency response. Conversely, models may introduce noise or irregular boundaries that artificially increase recall but reduce the practical readability of the map.
While this issue is typically addressed by selecting evaluation metrics that emphasize specific components of the confusion matrix (e.g., recall over precision), in emergency scenarios not all components carry the same operational weight. For instance, in crisis management, a higher recall may be preferred to avoid missing active landslides, even if this comes at the cost of more false positives. In contrast, in densely urbanized areas or during resource-constrained interventions, precision may become more important to avoid unnecessary alarms and misallocation of efforts.
To address this challenge, three of the authors in this study provided their expert judgment on the quality of the automatically generated landslide maps. This evaluation was conducted without prior knowledge of the scores obtained by these maps or the training input layers used to generate them.
The assessment focused on seven common error types frequently encountered in automated landslide mapping:
-
E1: False positives in plowed fields, where plowed land is mistakenly classified as landslide;
-
E2: False positives along roads and in urban areas, where the absence of vegetation may be misinterpreted as landslide activity;
-
E3: False positives along riverbeds, often due to confusion with recent sediment scouring or bedload deposits;
-
E4: False negatives in areas with known landslides;
-
E5: Over segmentation, referring to the fragmentation of a single landslide into multiple small polygons;
-
E6: Inaccurate delineation of landslide boundaries;
-
E7: Omission errors in shadowed areas, such as steep, shaded slopes or regions obscured by cloud cover.
For each error type, the experts assigned a score of 0 (limited error), 1 (moderate error), or 2 (relevant error) to indicate the severity of the issue. These scores were then summed and normalized to calculate an Expert-based Performance Index (EPI):
The index ranges from 0 to 1, with 1 representing the highest mapping performance. This evaluation was independently carried out by each of the three experts for all 16 cases included in the analysis (see Table 4). The experts assessed the model cases without prior knowledge of the specific configurations, thereby minimizing potential bias.
4.6 Identification of At-Risk Buildings
In the context of emergency mapping, a key objective was to identify buildings at risk due to the landslides triggered by the May 2023 event. This was a critical task for the Civil Protection as it allowed for timely intervention and damage assessment. Given the extensive spatial distribution of the damage caused by the event, it was essential to develop a systematic method to detect and assess the buildings at risk. Additionally, accurate damage estimation was necessary to request financial support under the European Union Solidarity Fund (EUSF), adhering to the EU's required timelines for funding requests.
To evaluate the effectiveness of our automated landslide mapping models in identifying at-risk buildings, we created a 20 m buffer around the predicted landslide boundaries. This buffer was compared to the list of buildings that the Civil Protection had classified as “at risk,” based on manual mapping (Pizziolo et al., 2024; Berti et al., 2025). The buildings identified by the automated models were then compared to these reference buildings, allowing us to assess the models' capacity for accurate identification. The confusion matrix was used to quantify the performance of the models in identifying buildings at risk, including both false positives (incorrectly flagged buildings) and false negatives (missed buildings).
This methodology ensured that the models were tested in the real-world context of emergency response, where timely and accurate damage assessments are crucial for effective resource allocation and intervention. The results of this methodology are discussed further in Sect. 6.3, while the quantitative outcomes of our models are presented in Sect. 5.3.
5.1 Model results and performance
The results of the analysis are reported in Table 5, which summarizes the F1 and IoU scores obtained by comparing the automated landslide maps generated by the two deep-learning models (U = U-Net; S = SegFormer) with the manually mapped reference inventory. Seven combinations of input layers (cases 1–7; Table 1) were tested, representing progressively richer input information. The models were trained using data from Casola Valsenio and subsequently applied to four independent test areas: Brisighella FMA, Brisighella FAA, Modigliana and Predappio. In total, 56 automated landslide maps were produced (7 input configurations × 4 test areas × 2 models).
Table 5F1-score and Intersection over Union (IoU) obtained by the two deep-learning semantic segmentation models (U = U-Net; S = SegFormer) for the seven input-layer configurations (cases 1–7; Table 3), evaluated against the manually mapped reference inventory. Models were trained in Casola Valsenio and applied without retraining to the external test municipalities (Brisighella FMA, and Brisighella FAA, Modigliana, Predappio). The table therefore reports 56 model outputs (7 cases × 4 municipalities × 2 models). Bold values indicate the best-performing configuration for each municipality and metric.
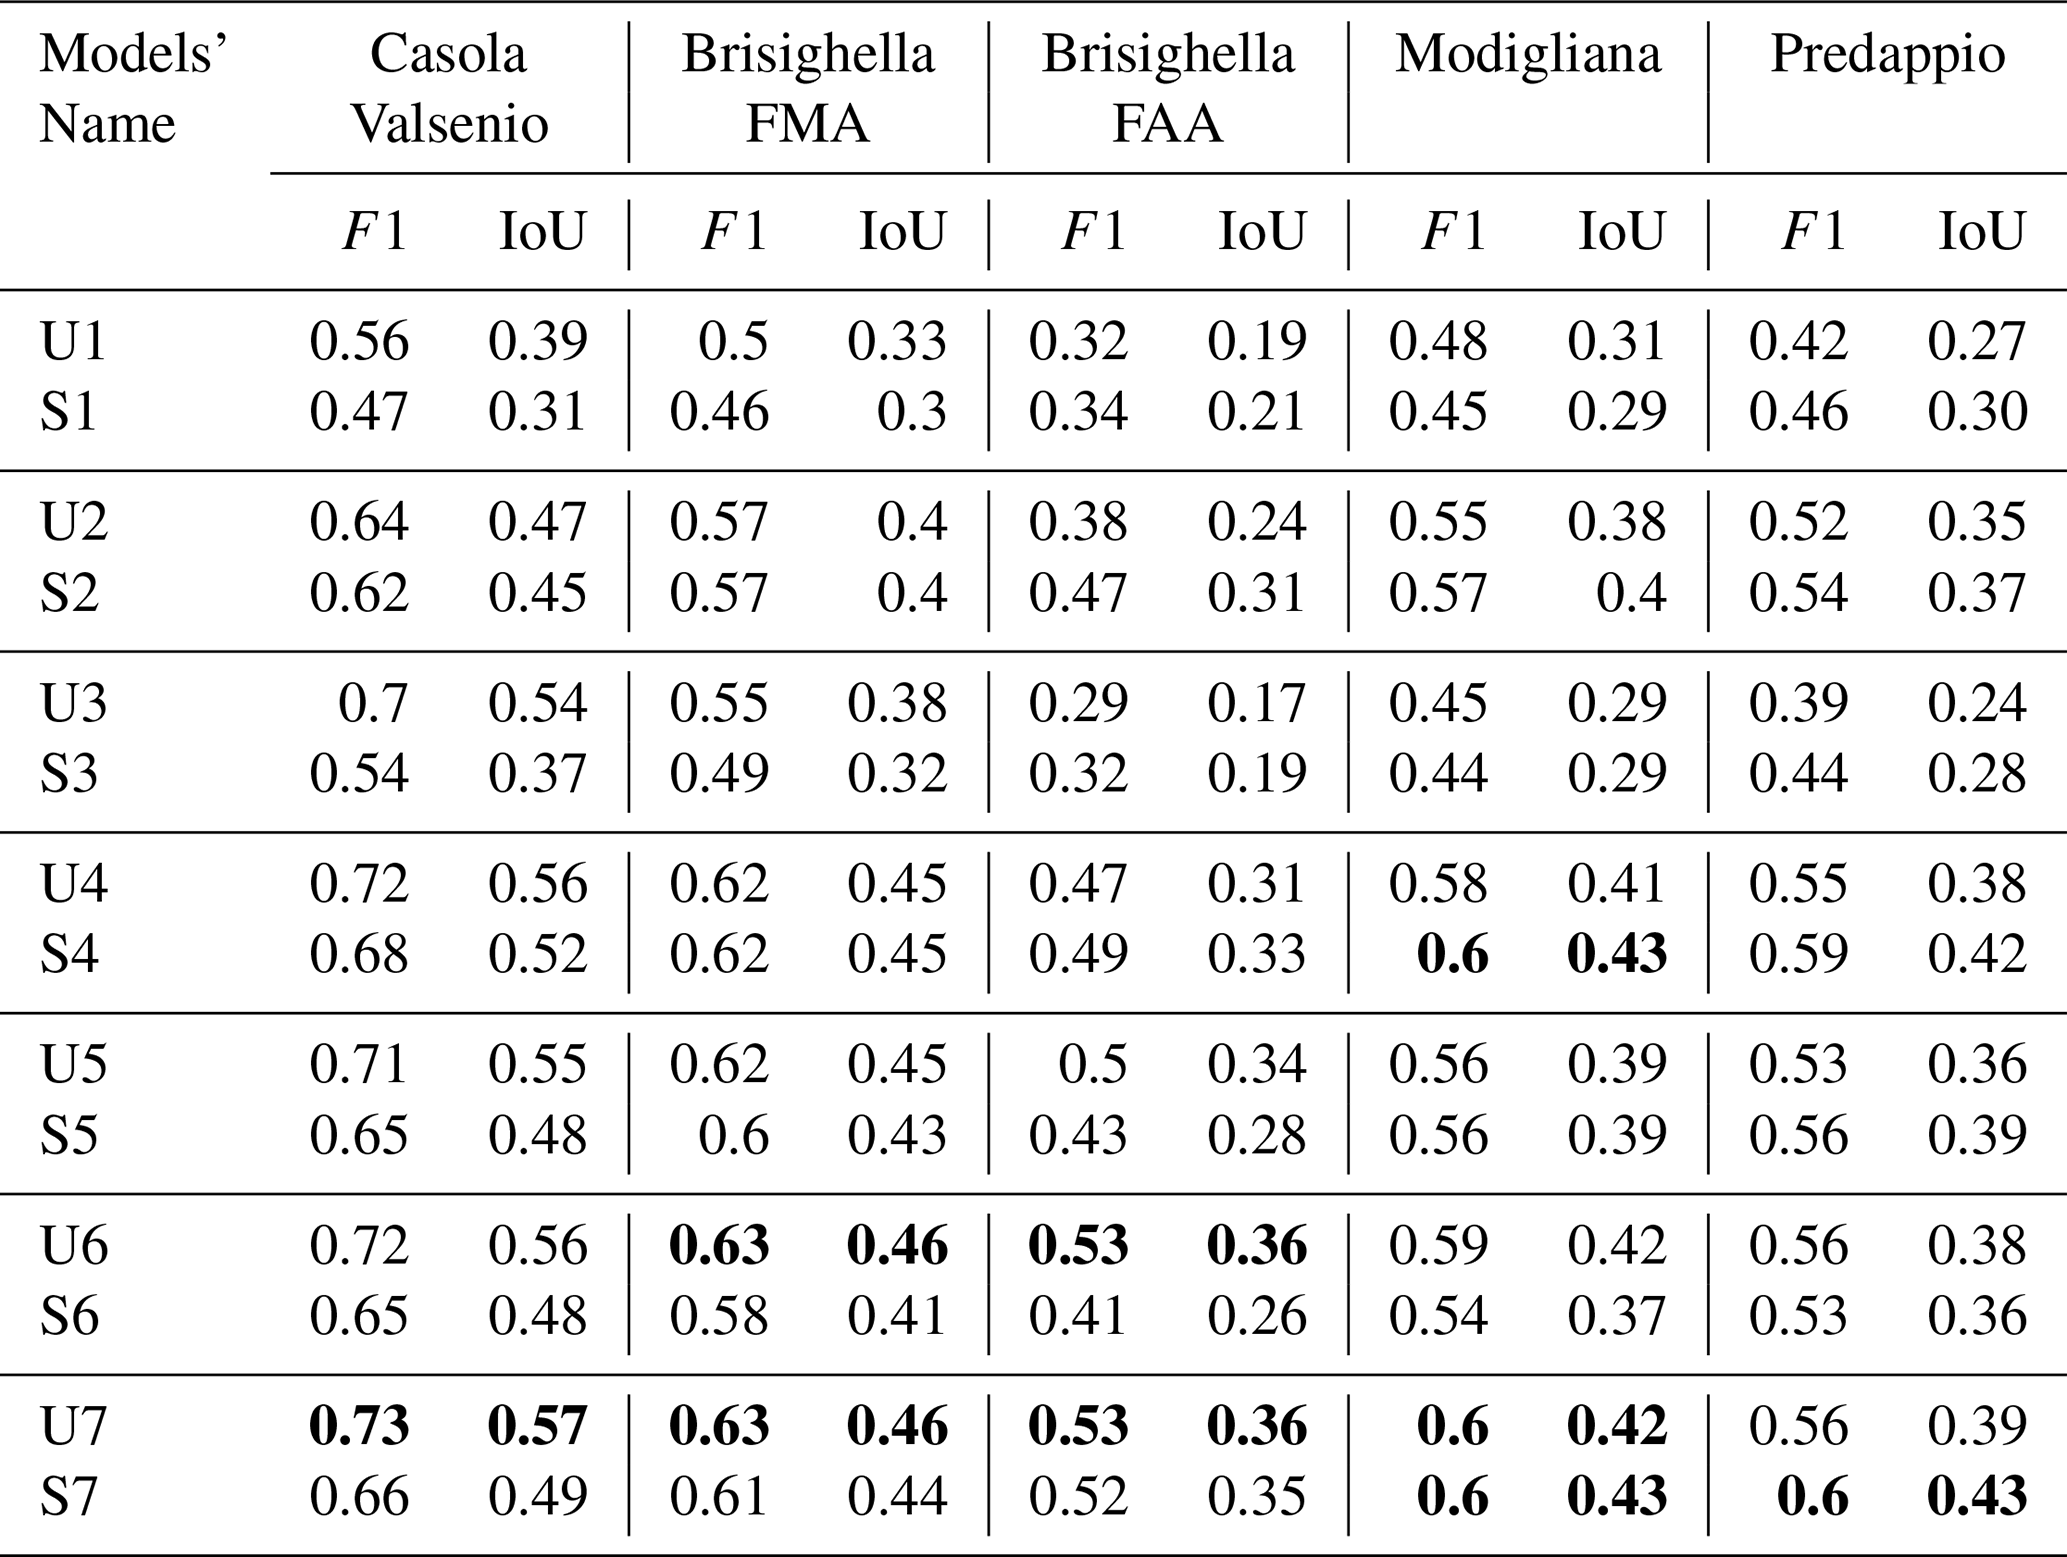
Across all municipalities, the highest performance was obtained by the most information-rich configurations, particularly U7 and U6 for U-Net and S7 for SegFormer. In Casola Valsenio, the best configuration reached F1 = 0.73 and IoU = 0.57 (U7), while in Brisighella FMA, Brisighella FAA, Modigliana and Predappio the highest F1-scores were consistently around 0.60–0.63 (e.g., U7 = 0.56–0.63; S7 = 0.60–0.61). Performance was systematically lower in Brisighella FAA, where the best configurations reached F1 = 0.53 and IoU = 0.36 (U6/U7), and F1 = 0.52 and IoU = 0.35 (S7) (Table 5).
Despite relying on a reduced set of inputs, the Sentinel-2-based configuration S2 (post-event Sentinel-2 plus Sentinel-2 NDVI change) achieved competitive results across municipalities. For instance, in Casola Valsenio S2 reached F1 = 0.62 and IoU = 0.45, compared with F1 = 0.73 and IoU = 0.57 for the best-performing configuration (U7). In Brisighella FMA, Modigliana and Predappio, S2 yielded F1-scores between 0.54 and 0.57 (IoU = 0.37–0.40), which are close to the values obtained by the strongest configurations (typically within ∼ 0.03–0.06 in F1 and ∼ 0.03–0.06 in IoU). In Brisighella FAA, S2 remained among the most stable configurations (F1 = 0.47; IoU = 0.31), whereas some intermediate cases showed marked drops (e.g., U3: F1 = 0.29; IoU = 0.17).
Overall, increasing the number of input layers resulted in measurable but limited performance improvements. The largest gain was associated with the inclusion of NDVI change information (case 2 vs. case 1), while subsequent additions of high-resolution inputs generally produced smaller incremental changes. These results indicate that streamlined configurations based on Sentinel-2 data (case 2), optionally complemented by high-resolution imagery, can achieve segmentation performance close to that obtained using the full set of available inputs (Table 5).
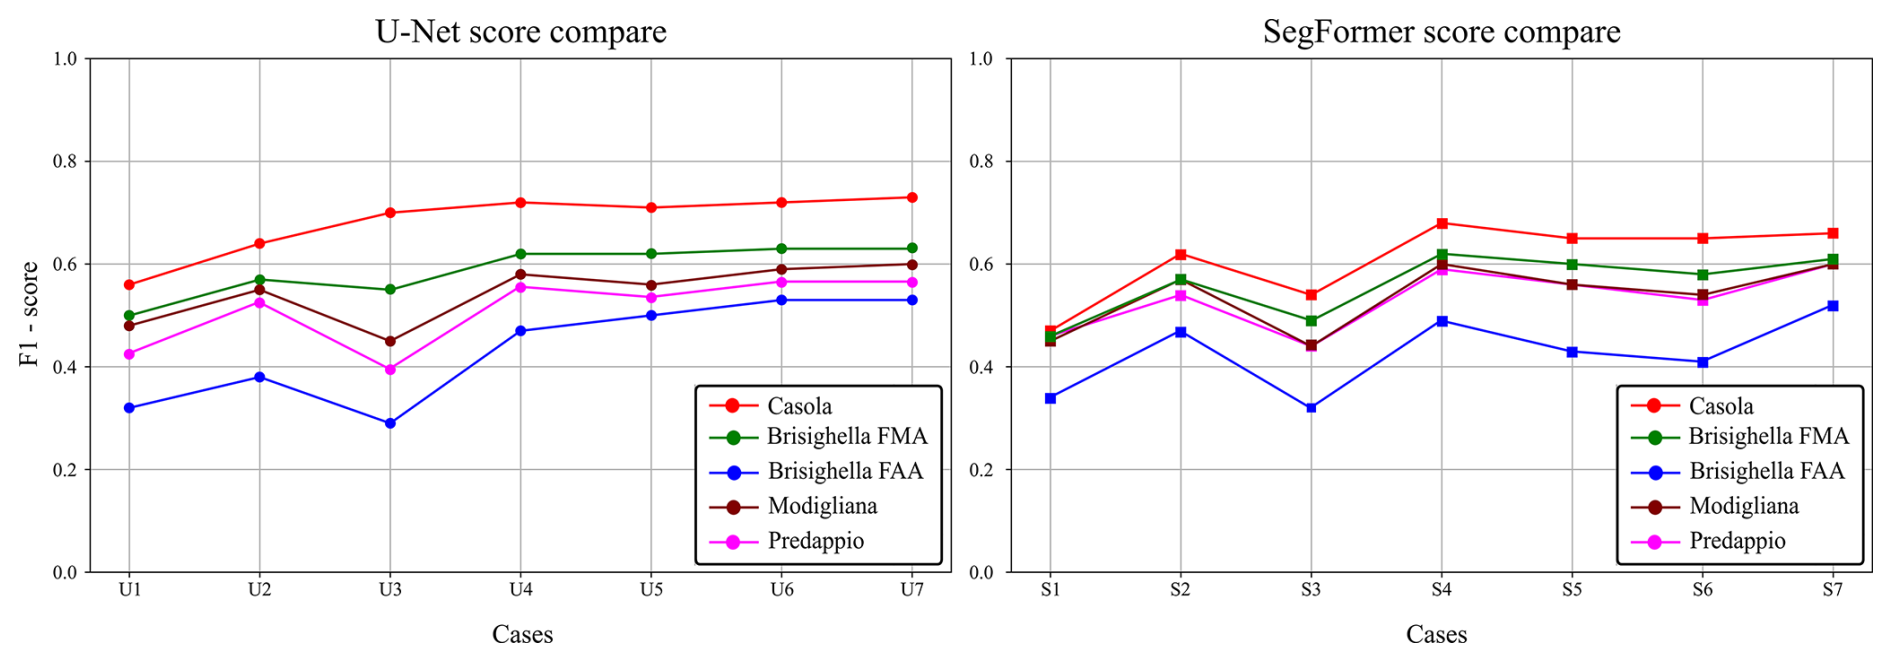
Figure 8F1-score comparison across the seven input-layer configurations for U-Net (left) and SegFormer (right). The numbering matches the input-layer cases defined in Table 3 (e.g., U1 and S1 refer to Case 1; U2 and S2 refer to Case 2), and values are summarised in Table 5.
Figure 8 illustrates the evolution of F1-scores across the seven input configurations for each municipality. For both models, the inclusion of NDVI change information (case 2) led to an increase in F1-score relative to case 1. In Casola Valsenio, F1 increased from 0.56 to 0.70 for U-Net and from 0.47 to 0.54 for SegFormer. In Modigliana and Brisighella FAA, the corresponding increases were approximately +0.15 to +0.16 for U-Net. Beyond case 2, U-Net showed gradual increases in F1-score of 0.01–0.04 per configuration up to case 7, whereas SegFormer exhibited smaller variations, generally within ±0.02, indicating a lower sensitivity to further input enrichment.
Model performance varied across municipalities. In Casola Valsenio, U-Net F1-scores increased from 0.56 (U1) to 0.73 (U7), while SegFormer ranged from 0.47 (S1) to 0.66 (S7). In Predappio, Modigliana, and Brisighella FMA, U-Net F1-scores were between 0.55 and 0.63, whereas SegFormer values remained more stable, typically between 0.55 and 0.60. Brisighella FAA consistently showed the lowest performance for both models: U-Net F1-scores ranged from 0.29 (U3) to 0.53 (U7), and SegFormer values ranged from 0.32 to 0.52, with no systematic improvement beyond case 2. IoU values exhibited the same spatial pattern, decreasing from 0.35–0.46 in FMA-dominated areas to 0.17–0.36 in the FAA domain.
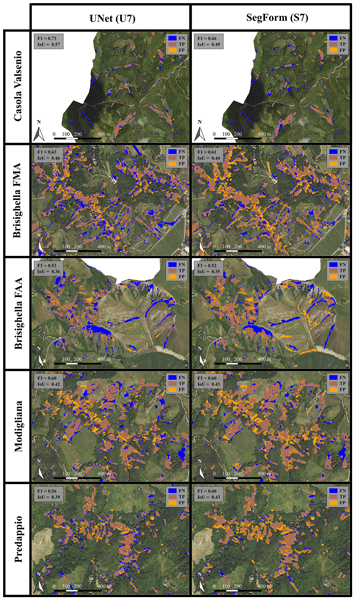
Figures 9 and 10 complement the quantitative results by providing a visual interpretation of model performance under contrasting conditions. Figure 9 illustrates representative cases in which both models performed well, showing a strong spatial agreement between the manually mapped inventory and the automated outputs. In these panels, the overlap between the reference landslide map (blue) and the predicted map (yellow) produces a beige colour, corresponding to true positives and indicating accurate landslide delineation. These examples mainly refer to debris slides and debris flows occurring in well-illuminated areas with widespread vegetation removal, where spectral and textural changes are pronounced.
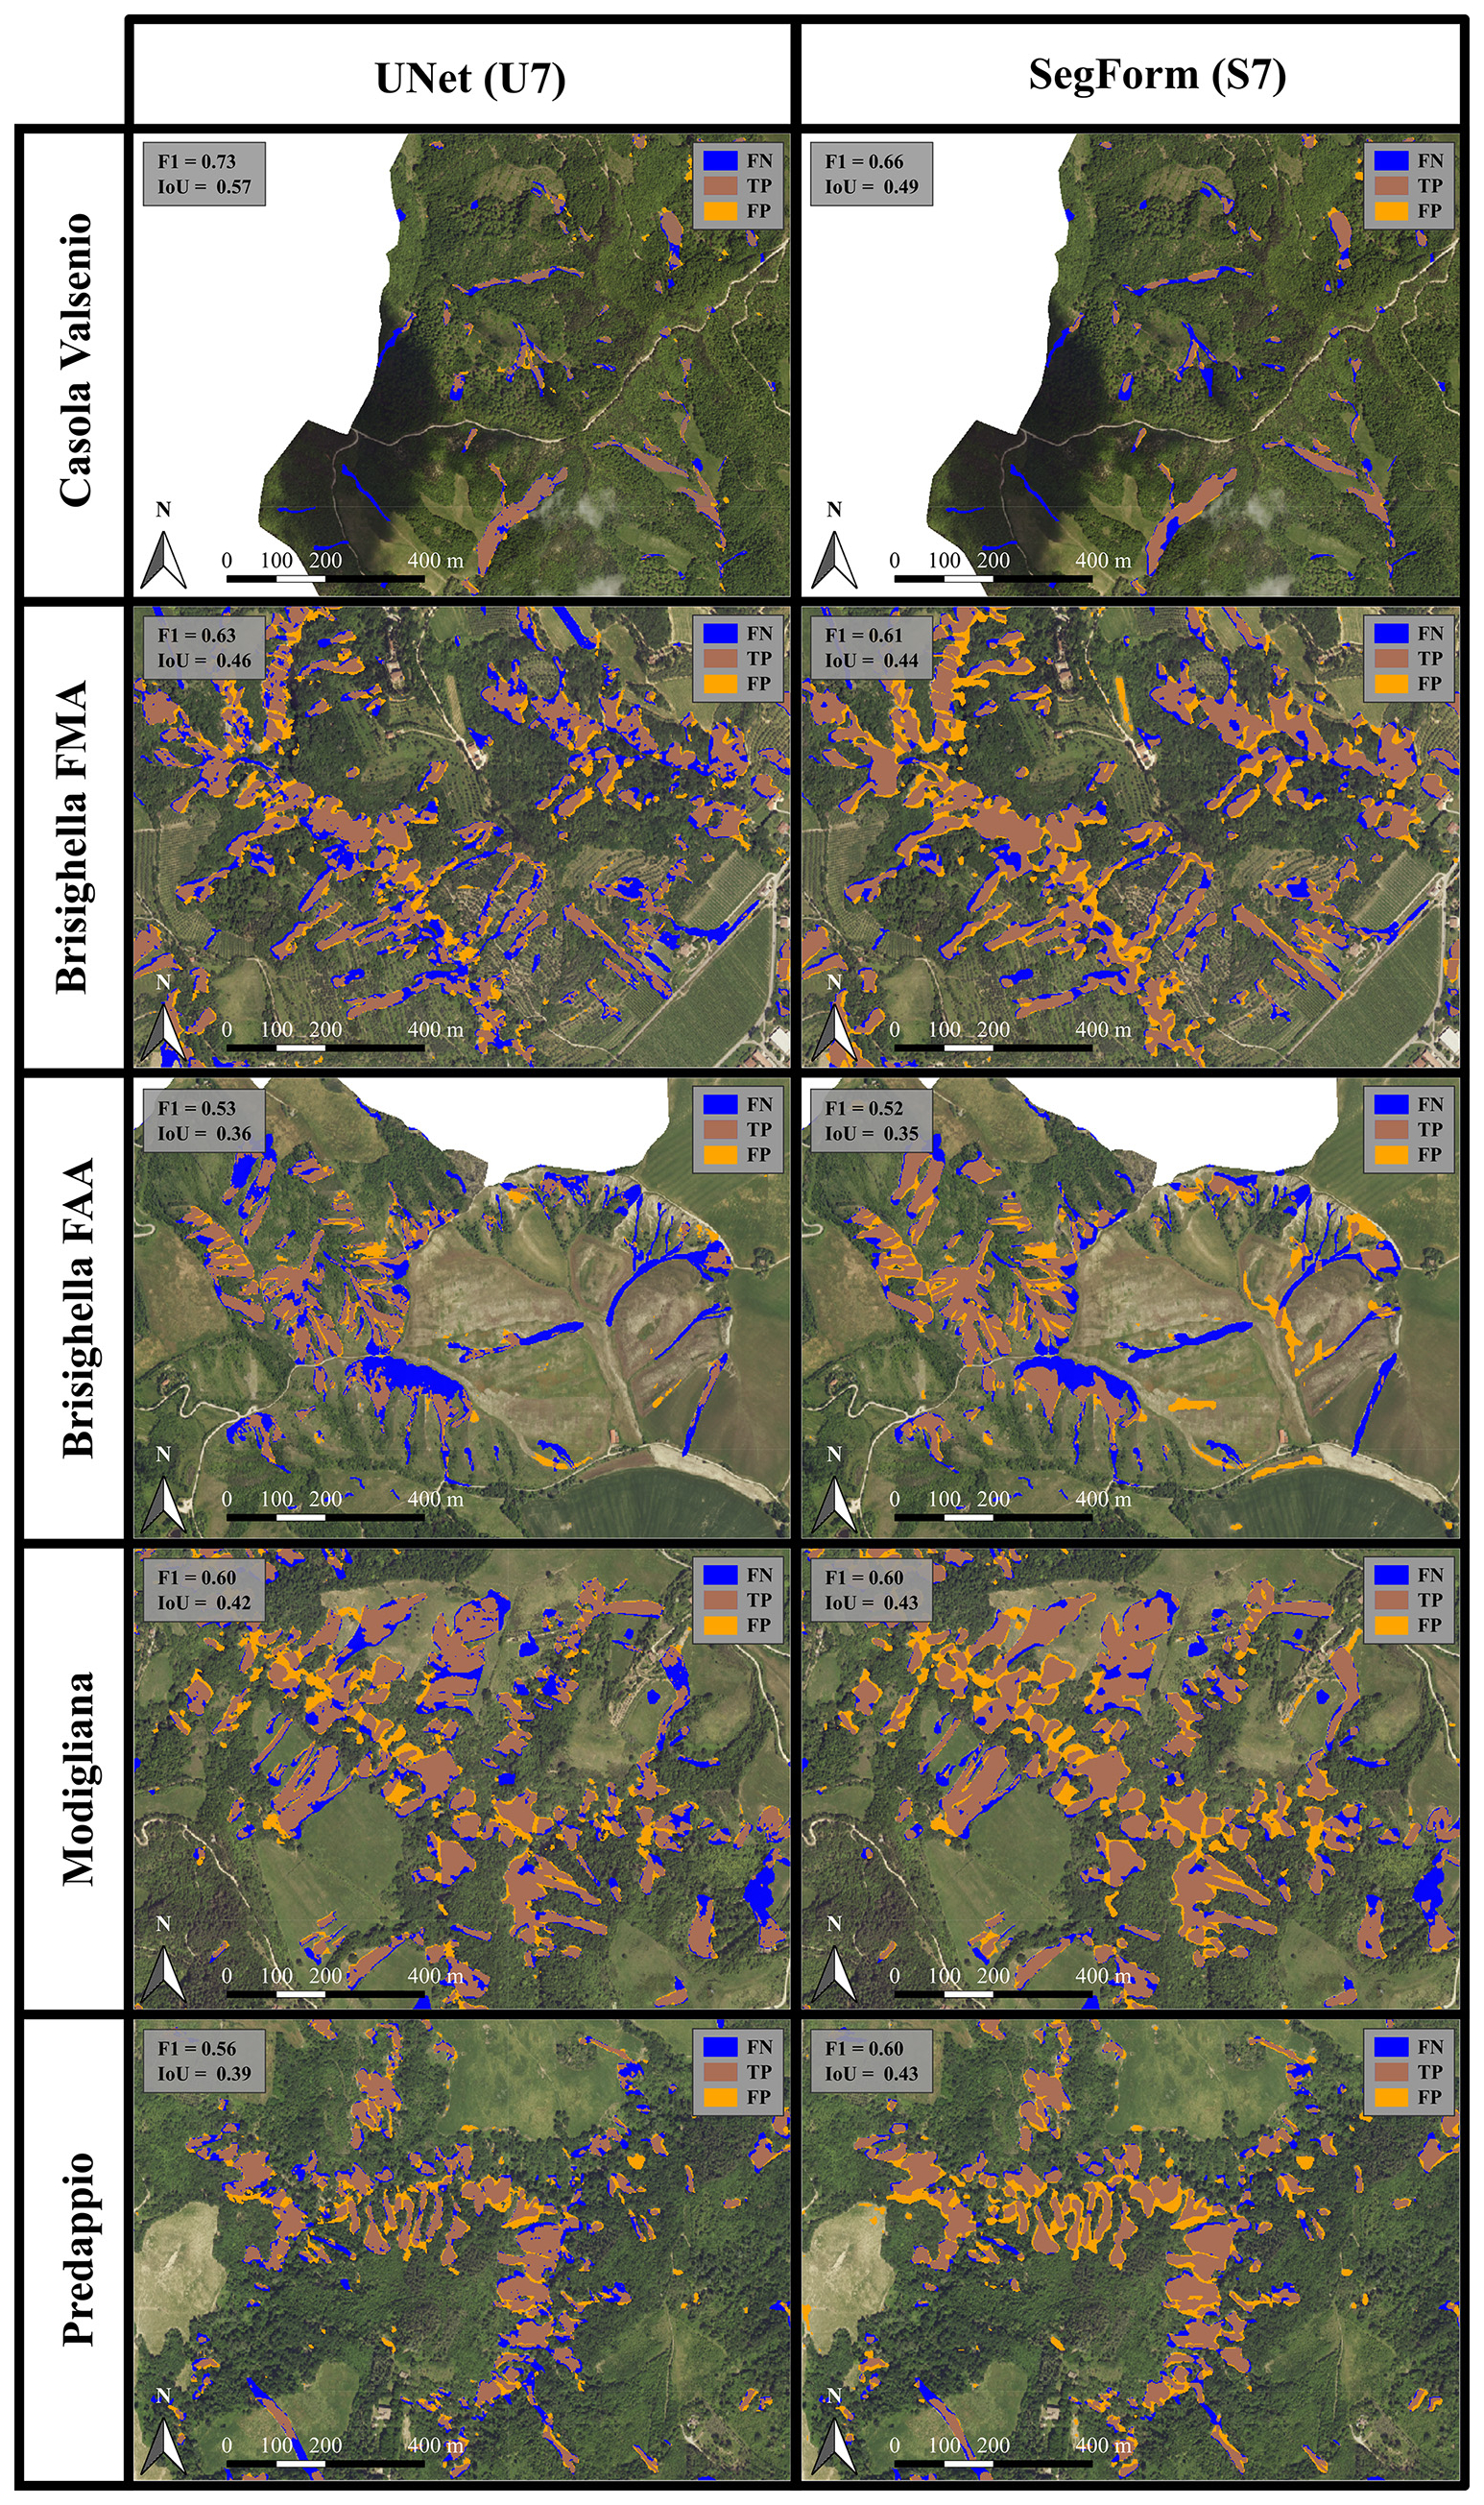
Figure 9Comparative analysis of landslide mapping results using the U7 (U-Net) and S7 (SegFormer) configurations across the analysed municipalities (Casola Valsenio, Brisighella FMA, Brisighella FAA, Modigliana and Predappio). The figure shows the spatial distribution and extent of the mapped landslides for both models. In the overlays, the reference inventory (True map) is shown in blue and the model prediction in yellow; their intersection is shown in brown (true positives), while blue-only and yellow-only areas correspond to false negatives and false positives, respectively. Map created by the authors using public geospatial layers from the Regione Emilia-Romagna Geoportal (https://geoportale.regione.emilia-romagna.it/approfondimenti/rer23_24, last access: 24 August 2026).

Figure 10Representative examples of challenging scenarios for landslide detection using the U7 (U-Net) and S7 (SegFormer) configurations across municipalities. The panels highlight recurrent error patterns under various environmental conditions: Brisighella FMA shows riverbanks and buildings as False Positives (FP), Brisighella FAA displays both False Positives and False Negatives (FP & FN) in badlands, Modigliana FN is observed on plowed fields, and Predappio FN occurs under shadows. Map created by the authors using public geospatial layers from the Regione Emilia-Romagna Geoportal (https://geoportale.regione.emilia-romagna.it/approfondimenti/rer23_24).
Figure 10, by contrast, focuses on more challenging scenarios, where the models exhibited recurrent error patterns. In Brisighella FMA, false positives (yellow polygons) are frequently mapped along riverbanks and on recently constructed buildings, likely associated with flood-related sediment redistribution and strong spectral contrasts. The most critical conditions are observed in Brisighella FAA, where widespread false positives occur within badland morphologies developed on Blue Clay formations, highlighting the limited transferability of models trained predominantly on flysch-dominated terrains. In Modigliana, false positives (yellow polygons) are often observed in plowed fields, where agricultural disturbance produces spectral signatures similar to recent landslides. Finally, in Predappio, false negatives (blue polygons) dominate in shadowed slopes, where reduced illumination and altered colour profiles limit the detectability of landslide features.
By explicitly contrasting successful detections (Fig. 9) with failure modes (Fig. 10), these visual examples clarify how different surface conditions, illumination effects, and lithological settings influence model performance, supporting the quantitative trends reported in Table 5 and Fig. 8.
5.2 Expert judgement
Figure 11 compares the quantitative performance (F1-score) of all model configurations with the Expert Performance Index (EPI) derived from the independent assessment of three experts (Sect. 4.5.2). The EPI values reflect the severity scores assigned to seven recurrent mapping errors (E1–E7), which were aggregated and normalized to obtain a single index per model configuration.
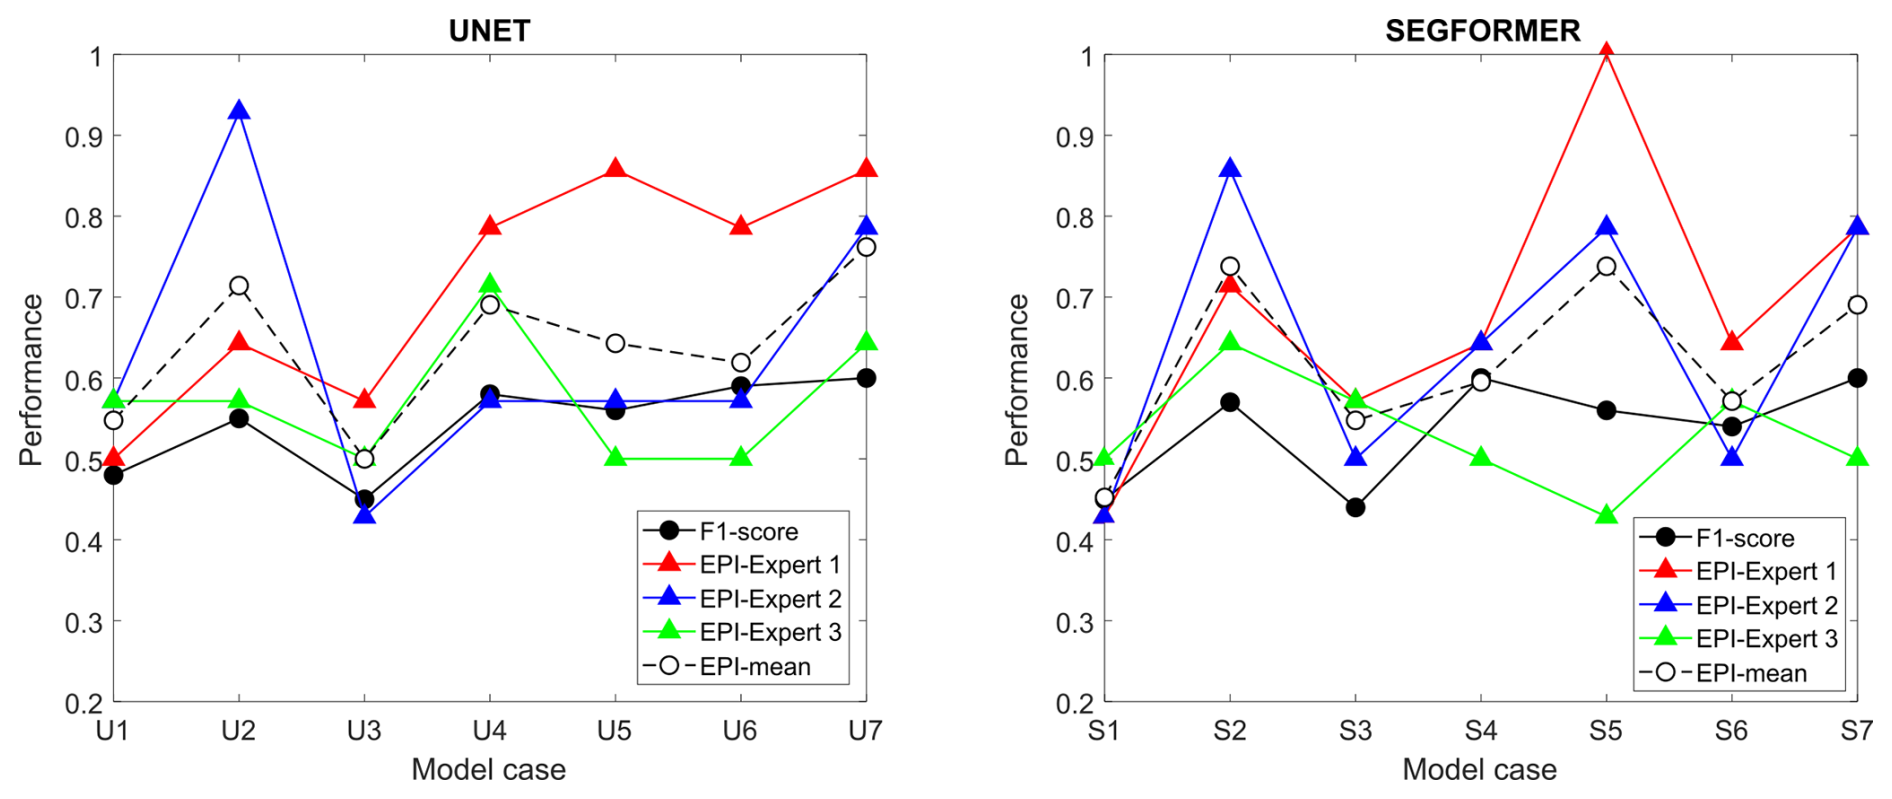
Figure 11Comparison of model performance based on F1-scores and expert-based evaluations from three independent experts.
Across configurations, EPI values show the same overall ranking observed for the F1-scores (Fig. 11). While the F1-scores span a relatively narrow interval across cases (Table 5), the EPI values exhibit a comparable monotonic increase from simpler to more information-rich input configurations, indicating that the expert-based assessment captures the same performance gradient. In particular, configuration U3 is associated with one of the lowest EPI values and one of the lowest F1-scores, whereas U7 consistently falls within the top-performing group in both metrics (Fig. 11).
Differences among individual experts are evident for some intermediate configurations. Specifically, the highest EPI score for Expert 1 is assigned to S5, for Expert 2 to U2, and for Expert 3 to U4, despite these configurations not being uniformly ranked at the top by the other experts or by the F1-scores. However, when expert scores are averaged (mean EPI; dashed line in Fig. 11), the resulting trend closely matches the F1-score curve, reducing the influence of individual preferences and providing a more robust overall assessment of map quality.
5.3 Identification of At-Risk Buildings
The identification of at-risk buildings is a crucial component in emergency response scenarios. In the aftermath of the May 2023 disaster, buildings located within landslide boundaries or within a 20 m buffer zone were considered at risk, influencing subsequent evaluations carried out by the relevant authorities. To assess the effectiveness of our automated landslide mapping for this purpose, we compared the buildings identified by our models to those derived from manual mapping (Pizziolo et al., 2024; Berti et al., 2025).
Figure 12 presents the confusion matrix for the 14 model configurations, showing the comparison between the buildings flagged by our models and those mapped manually. The F1-scores obtained for each case highlight the models' ability to identify structures at risk. For Case 1, U-Net produced an F1-score of 0.53, while SegFormer performed slightly better at 0.67. The highest F1-scores were achieved in Case 7, with U-Net reaching 0.79 and SegFormer 0.75. Notably, models U2, U4, S6, and U7 consistently yielded the best results, with F1-scores averaging around 0.78, demonstrating their effectiveness in accurately identifying buildings at risk.
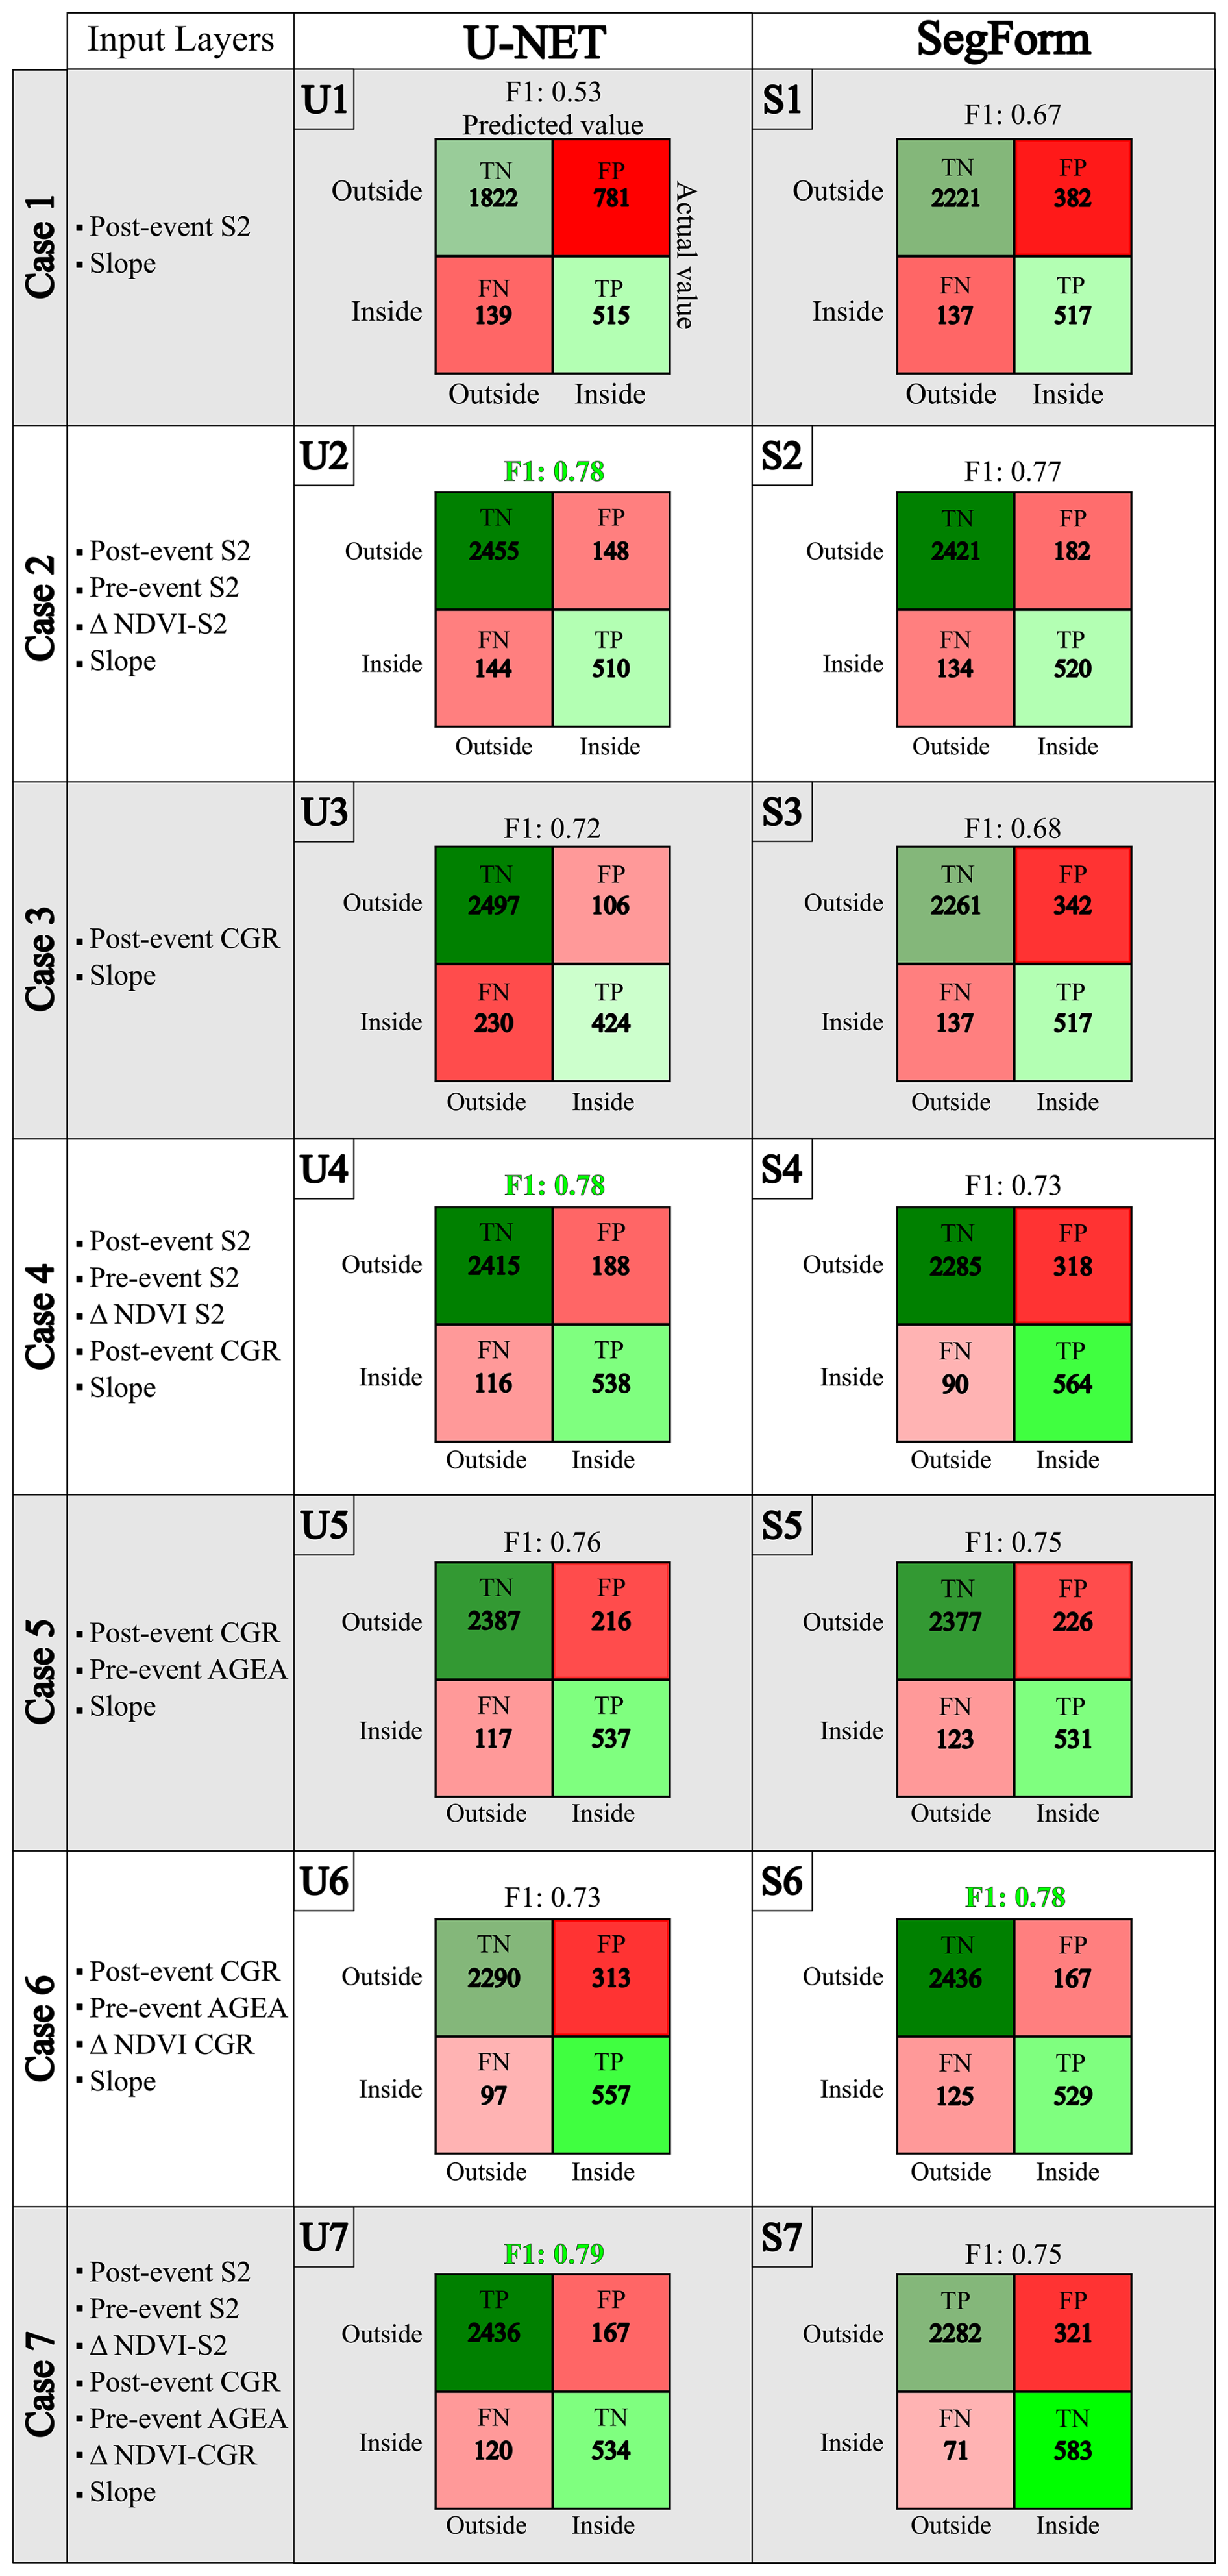
Figure 12Comparison of buildings identified as at risk (within landslide boundaries or within a 20 m buffer) by automated mapping methods and manual mapping (ground truth), showing the confusion matrices for all five cases evaluated.
Despite the relatively high F1-scores, the models still produced both false positives (incorrectly flagged buildings) and false negatives (missed buildings), which underscores the necessity of manual verification in scenarios where precision is critical. However, the performance of the automated models is considerably higher than the manual mapping, especially when considering the large-scale, time-sensitive nature of emergency response. These results suggest that the automated models can significantly assist in the rapid identification of at-risk structures, potentially saving valuable time in the early stages of disaster response. These results are discussed in Sect. 6.3.
6.1 Models comparison
One of the key observations from this study concerns the differing sensitivity of U-Net and SegFormer to input data combinations, particularly in the context of emergency response mapping. U-Net's performance varies significantly depending on the layers used, while SegFormer yields more consistent results across different configurations. This contrast is likely rooted in their architectural differences. U-Net, designed for pixel-wise segmentation, relies heavily on the spatial and spectral characteristics of the input data, making it more sensitive to the quality and availability of supplementary layers such as pre-event imagery or NDVI change maps. SegFormer, being a transformer-based model, is better equipped to capture global context, thus reducing dependency on specific input combinations and improving robustness under complex geological conditions.
This architectural contrast becomes even more evident when models are transferred across different geological domains. As shown in the results (Fig. 8), U-Net exhibits a marked decline in performance when moving from areas geologically similar to the training site (e.g., Predappio, Modigliana) to Brisighella FAA, where lithological conditions differ significantly. This suggests that U-Net has limited generalization capacity beyond the Marnoso-Arenacea Formation (FMA), and struggles in fine-grained, clay-rich terrains like those found in the FAA domain. SegFormer, although generally more stable, also underperforms in Brisighella FAA, highlighting the broader challenge of transferring models across heterogeneous geological settings.
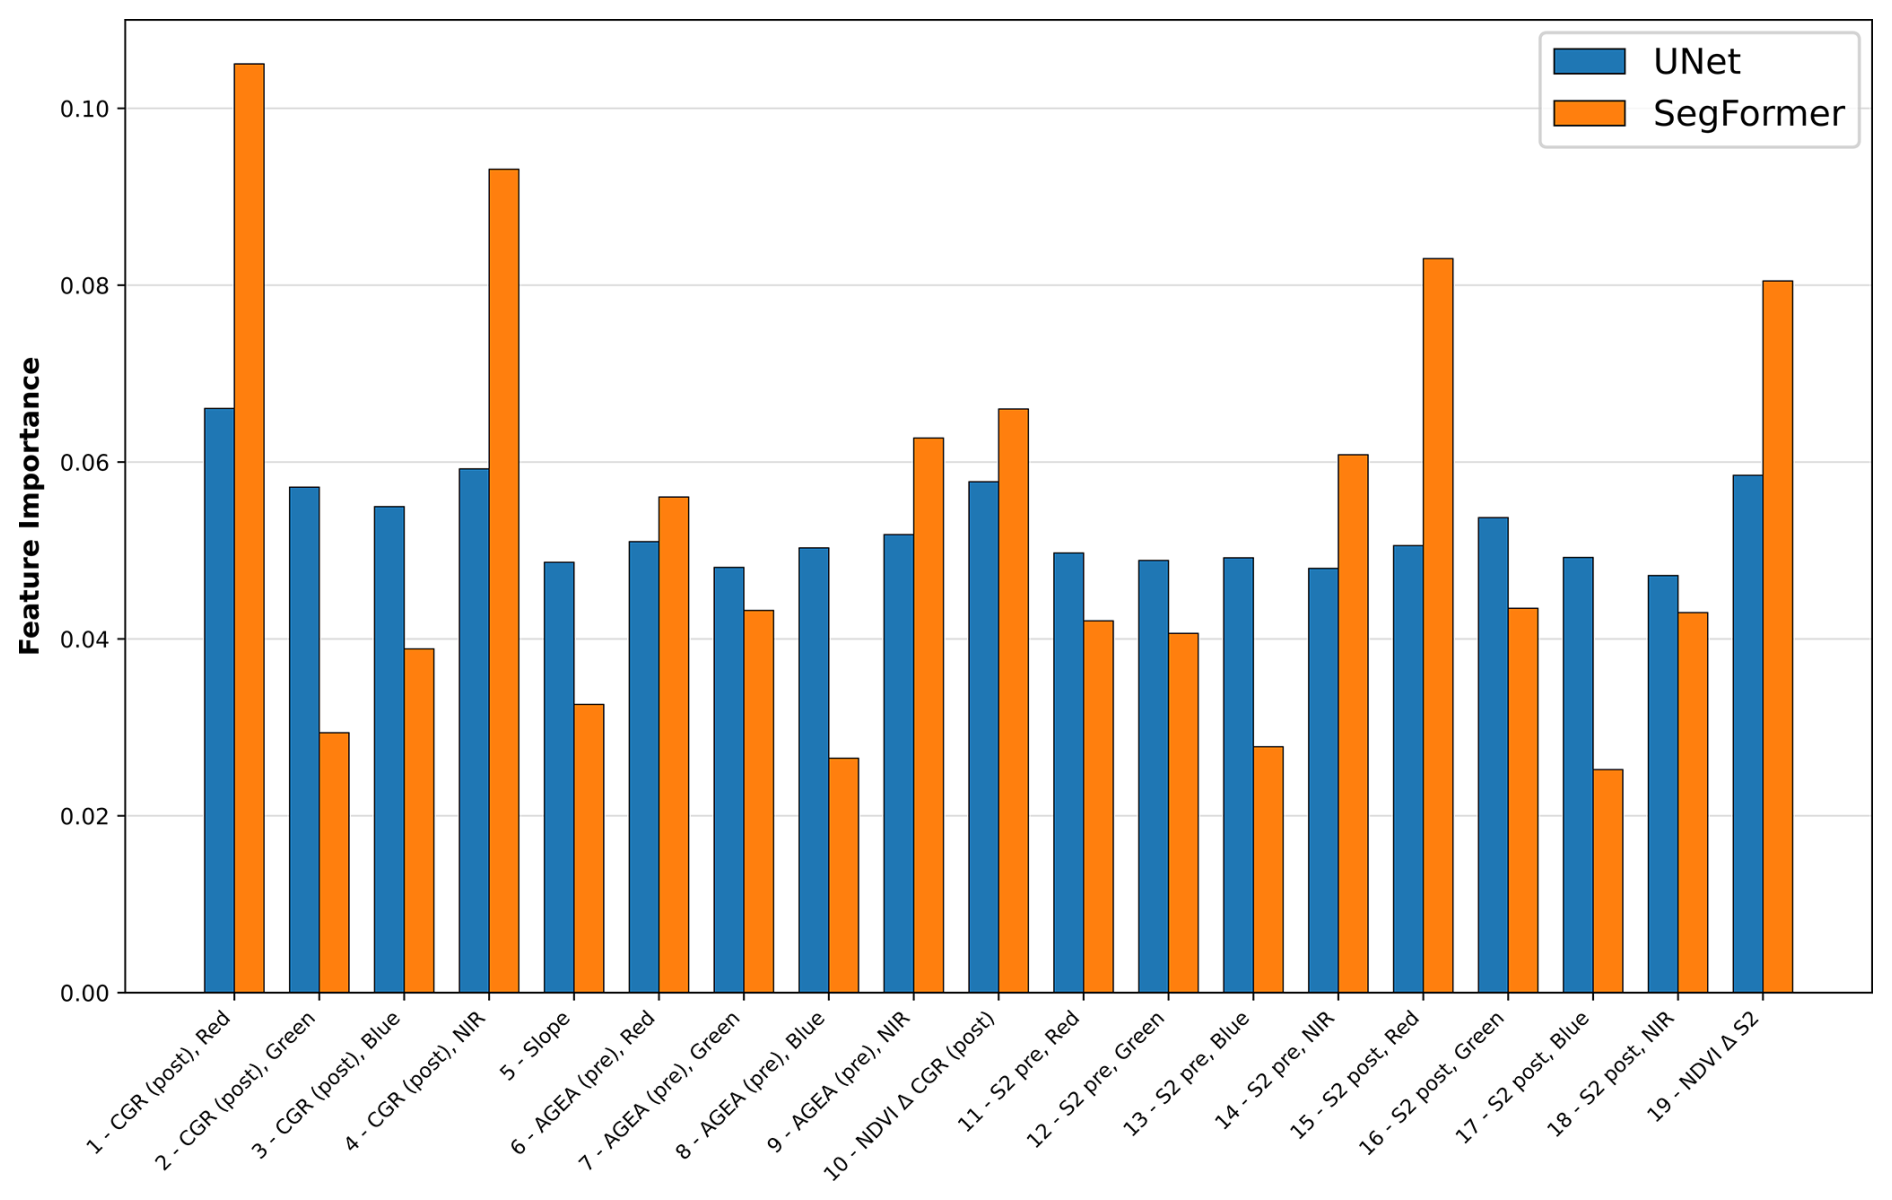
Figure 13Feature importance values for U-Net and SegFormer across different input channels. The bar chart compares the relative importance assigned to each channel by both models. The blue bars represent U-Net, while the orange bars represent SegFormer. The analysis shows that SegFormer tends to assign higher importance to the post-event CGR channels, particularly the Red and NIR bands, while U-Net exhibits more uniform importance across the channels, with a slightly more localized focus. This difference in feature importance highlights the varying strengths of the models in utilizing spectral information.
The feature importance values for U-Net and SegFormer (Fig. 13) reveal notable differences in how each model prioritizes the input channels. Upon examining the results, we can observe the following key points:
-
SegFormer places the highest importance on the post-event CGR channels, particularly the Red and NIR bands, followed by Sentinel-2 Red and Sentinel-2 NIR. This makes sense in the context of post-event analysis, as Red and NIR bands are sensitive to vegetation and surface changes, which are crucial for detecting variations in the landscape after a landslide event. The reliance on these bands is likely due to their ability to capture the shift in vegetation cover (from green to beige or brown) after a disturbance, which can be a key indicator of landslide activity. The CGR (post) channels are particularly effective at highlighting these changes, making them essential for SegFormer's decision-making process.
-
U-Net, on the other hand, follows a similar pattern but with lower variability in feature importance across different channels. While the CGR (post) channels remain important, U-Net seems to show a more uniform distribution of feature importance across the input channels, indicating that the model is less sensitive to specific features like Red and NIR. This could be a result of the model's pixel-wise segmentation approach, which might focus more on spatial relationships within the image rather than relying heavily on spectral differences between the bands.
Both models exhibit a similar trend in emphasizing the post-event data, particularly the CGR (post) channels. However, SegFormer seems to make use of a wider range of channels, including Sentinel-2 Red and Sentinel-2 NIR, which suggests that SegFormer is more adept at capturing a broader, global context. This capability allows it to effectively integrate multiple data sources. In contrast, U-Net appears to rely more heavily on the specific channels it uses, with its performance being more sensitive to the quality and selection of those channels.
This difference in how the models handle feature importance reflects their underlying architectural differences. SegFormer, with its transformer-based design, is able to capture larger-scale patterns and dependencies within the data, giving it the flexibility to work with diverse and comprehensive input combinations. On the other hand, U-Net's pixel-wise segmentation approach tends to focus on more localized patterns, which can make it less adaptable when handling a variety of input channels.
Nevertheless, both models encountered certain challenges that influenced their performance, which we will now address in the following section.
6.2 Challenges Scenarios
The models in this study encountered several challenging scenarios related to the environmental conditions of the test sites. These challenges, including riverbank areas affected by flooding, geological variations, plowed land, and shadowed regions, directly influenced the models' ability to detect landslides accurately. Spectral analysis of each scenario (Fig. 14) reveals distinct patterns that explain the models' performance limitations, while Fig. 10 displays the corresponding mapping results with recurrent error patterns.
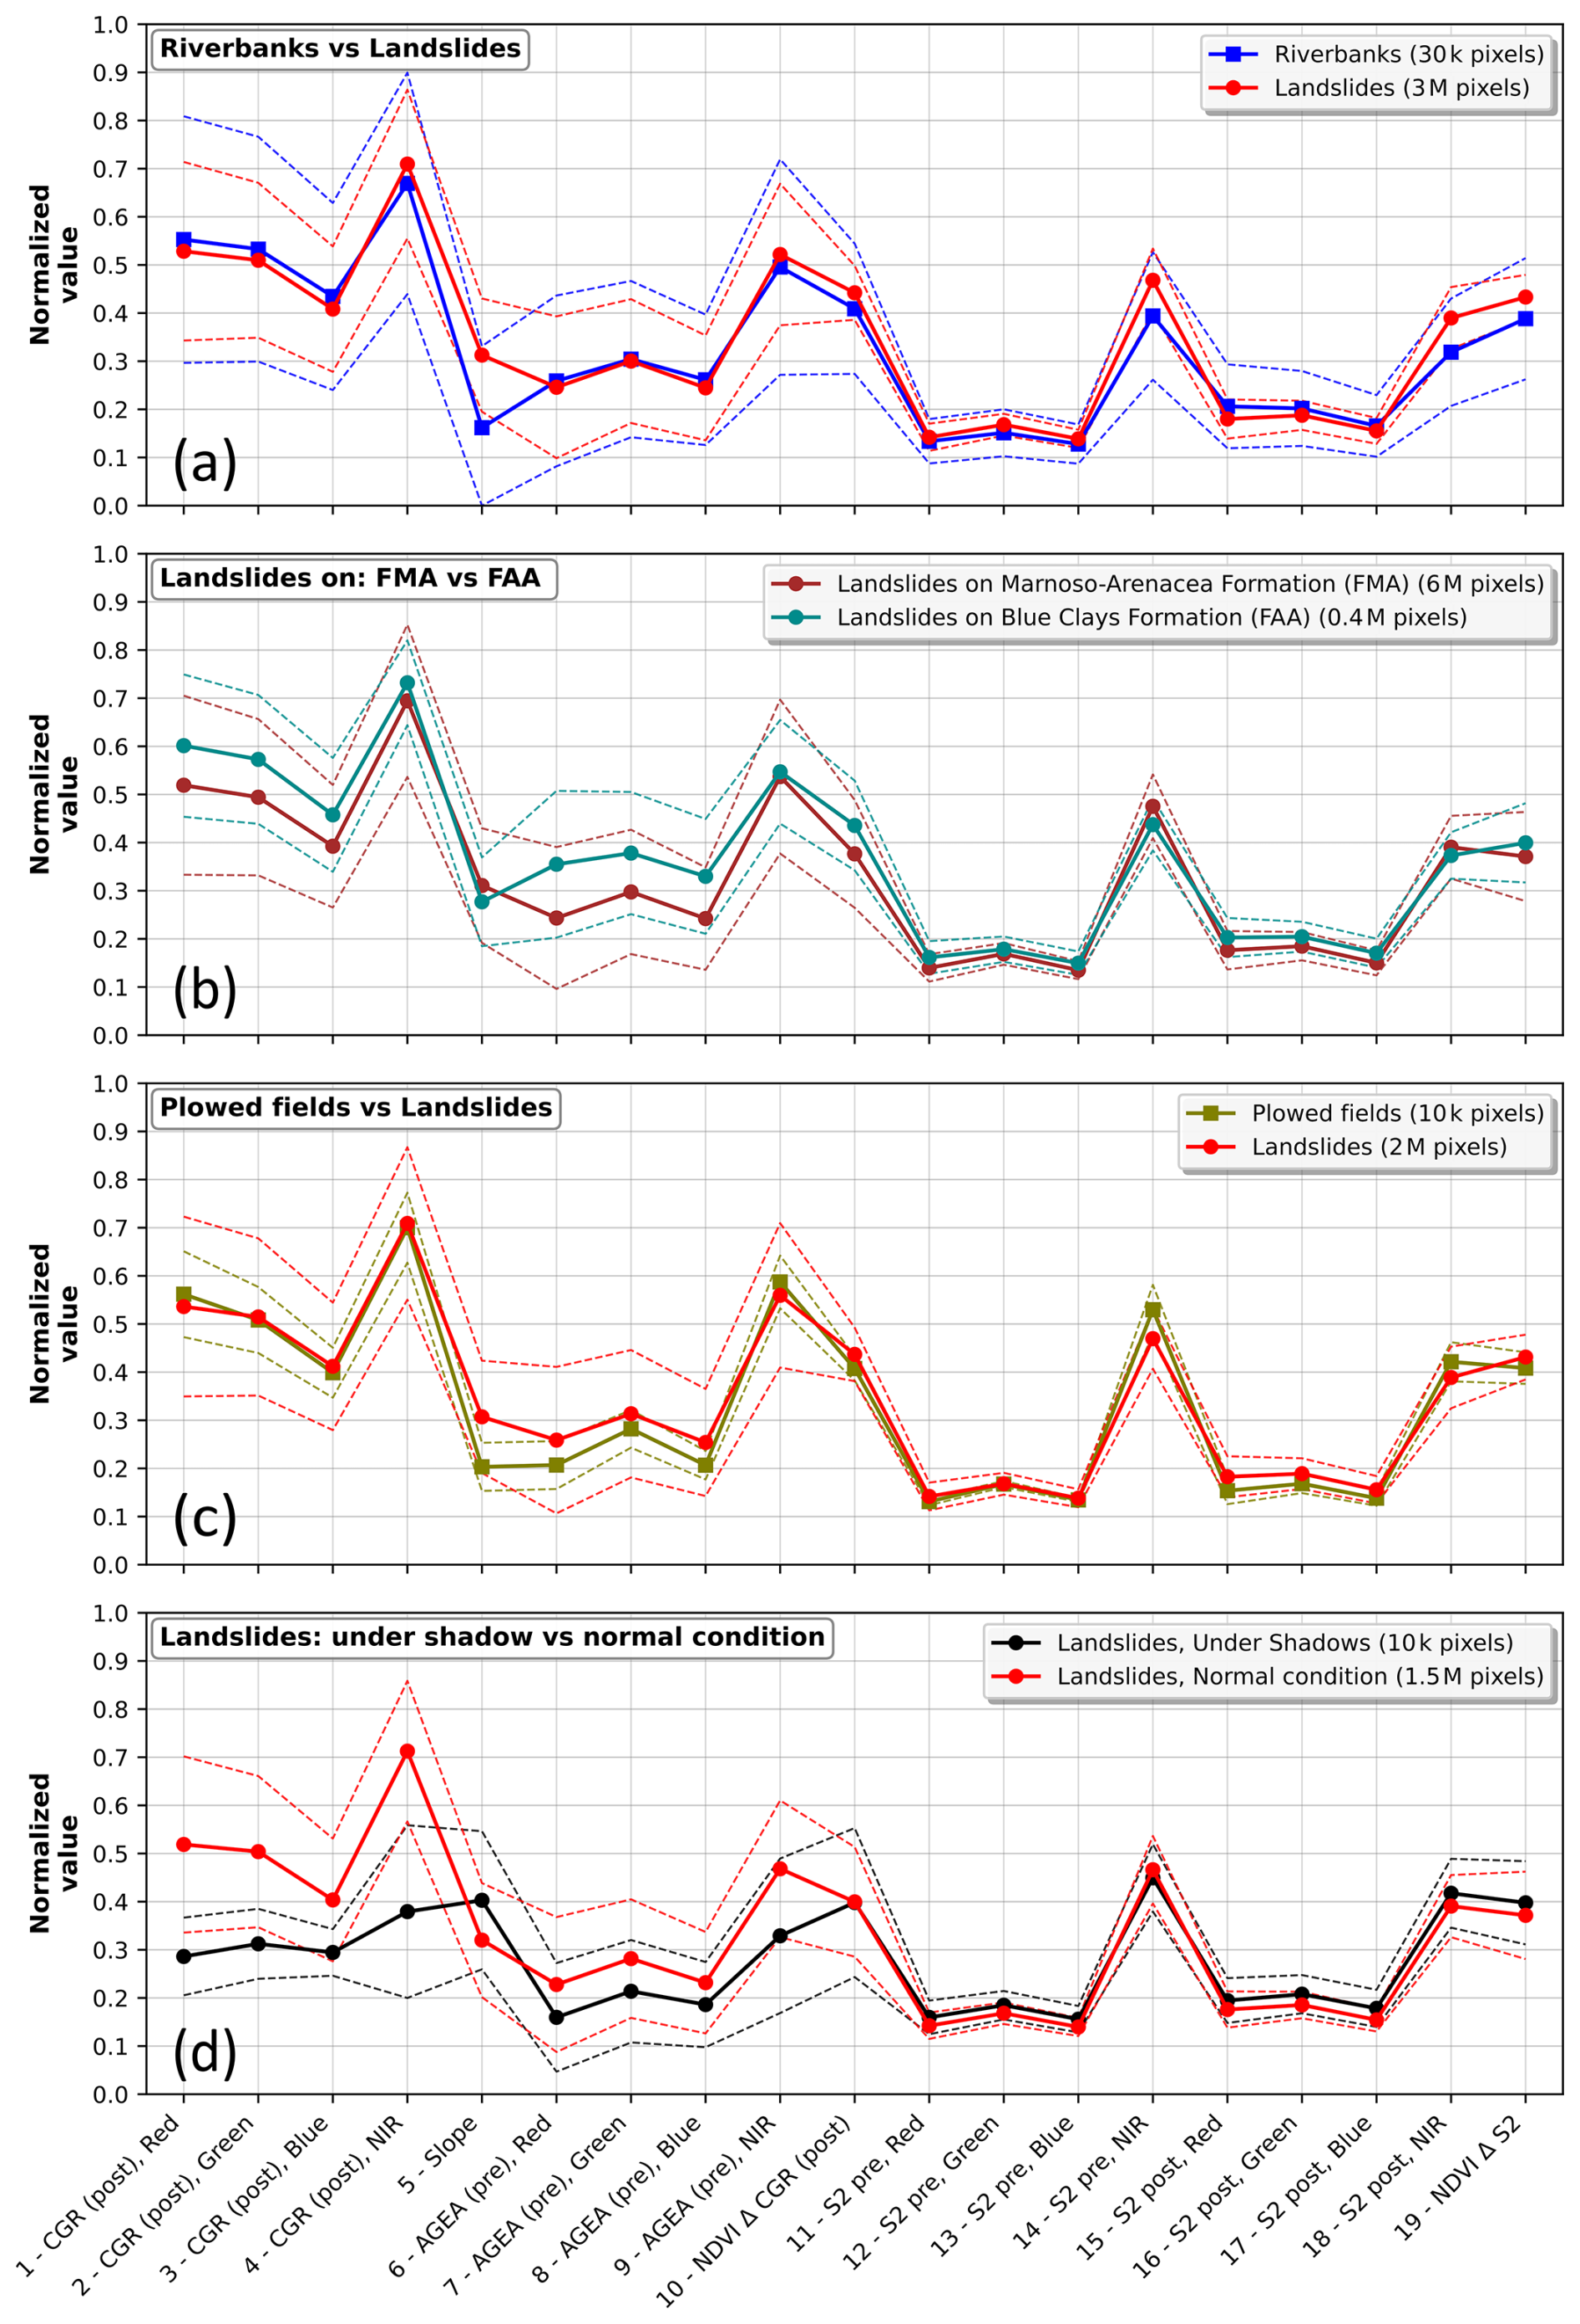
Figure 14Spectral analysis of different land types and landslide detection. (a) Comparison between riverbank areas affected by flooding and landslides. The blue line represents the spectral characteristics of buildings along the river, while the red line corresponds to landslides. (b) Spectral differences between landslides occurring on Marnoso-Arenacea Formation (FMA) and Blue Clays (FAA), showing the significant spectral dissimilarity. (c) Comparison between spectral signatures of plowed fields and landslides. The green line represents plowed fields, while the red line corresponds to landslides, with noticeable overlap in spectral characteristics. (d) Impact of shadowed regions on landslide detection, comparing normal conditions (red) with shadowed regions (black). The graph reveals how shadows significantly reduce the ability of the models to detect landslides.
6.2.1 Riverbank Areas Post-Flooding
The May 2023 flood events caused spectral signatures in riverbank areas that partially overlap with those of landslides (Fig. 14a). A comparison of pixels from non-landslide riverbank areas and those affected by landslides reveals that while the spectral signatures are similar, there are noticeable differences, particularly in the CGR RGB channels. These differences, although subtle, are appreciable enough to help differentiate the two types of areas. Additionally, the lower slope values in riverbank areas, due to their gentler topography along watercourses, and reduced vegetation change indicators (NDVI Δ channels) set them apart from genuine slope failures. Post-flood sedimentation and bank erosion generate surface disturbances that resemble landslide scars, especially where floodwaters have stripped vegetation and redistributed sediments. Despite these similarities, these features were not sufficiently weighted during training on the Casola Valsenio dataset, leading to false positives in flood-affected environments. However, the distinction in the CGR RGB channels, along with the differences in slope and NIR values, played a crucial role in limiting false negatives (FN) along riverbanks, particularly in the best models (Caso 7, S7, and U7), despite the error still being present.
6.2.2 Geological Differences (FMA vs. FAA)
The geological difference between Marnoso-Arenacea (FMA) and Blue Clays (FAA) proved challenging. Pixels from landslides in both lithologies were compared, with notable differences in the CGR (Red) and CGR (NIR) channels, which are critical for landslide detection (Fig. 14b). FAA regions exhibit lighter colors in both pre- and post-event imagery, indicating typical erosion and sediment redistribution in badlands (see Fig. 10). This aligns with the diluvial processes observed in the Blue Clays region. Training the models solely on FMA lithology, such as Casola Valsenio, rendered them ineffective when applied to FAA regions, where the spectral characteristics differ significantly. This highlights the limited transferability of models trained on a single lithology.
6.2.3 Plowed Fields (Modigliana)
Spectral signatures from landslide-affected areas in Modigliana were compared with those from plowed fields outside the landslide zones (Fig. 14c). The similarities in spectral signatures, particularly in the CGR (Blue) and CGR (Green) channels, led to false positives (yellow polygons) in Fig. 10. Agricultural fields, when plowed, share similar characteristics with disturbed landslides, especially when considering the differences in pre-event imagery. These differences are more pronounced in the Slope and pre-event channels. However, due to the relatively low importance assigned to these channels during training on the Casola Valsenio dataset, the models struggled to differentiate these fields from landslides, resulting in confusion and false positives in plowed fields.
6.2.4 Shadow Effects (Predappio)
Shadowed regions, particularly in Predappio, made it nearly impossible for the models to classify these areas as landslides. The spectral analysis (Fig. 14d) highlights much darker values in shadowed areas in the CGR (post-event) imagery, which complicates the recognition of landslides. This is due to the drastically reduced reflectance in shadowed pixels, which prevents the models from detecting landslides in these regions. Fortunately, this issue is isolated to a small portion of Predappio. The reduced illumination and altered color profiles in shadowed areas hinder the model's ability to detect the land movement, causing false negatives in these regions, as shown in Fig. 10.
The analysis of various challenging scenarios, including flood-affected riverbanks, geological variations, plowed land, and shadowed regions, reveals a consistent pattern: while identifiable spectral discriminants exist for each challenge, the models' training on a single geological and environmental domain (Casola Valsenio, FMA lithology) limited their ability to generalize across varying conditions. The failure to adapt to different geological contexts, land use patterns, flood-affected areas, and illumination conditions highlights the importance of domain-adaptive approaches and more geographically comprehensive training datasets for robust landslide detection across diverse landscapes.
To further investigate the role of geology in model generalization, an additional analysis was conducted to assess the impact of including lithology among the input layers. For this, the lithological layer was categorized into 8 distinct classes, with each class corresponding to a unique Unit ID (as detailed in Table 2). These classes were numerically encoded from 1 to 8, representing different lithological units. We compared the performance of Case S3 (RGB + slope) with the same configuration plus the lithology layer. However, this did not yield significant improvements in Casola, Predappio, Modigliana, or Brisighella MA, as these areas are predominantly characterized by the Marnoso-Arenacea Formation (“Unit 7”), which was already well represented in the training dataset (Fig. 2a). As a result, the addition of the lithology layer provided redundant information. However, when the same model was applied to Brisighella FAA, where the lithology is dominated by Blue Clays (“Unit 1”), the model failed to detect any landslides, resulting in a very low F1-score of 0.02. This underscores a key limitation: simply adding lithology as a static input layer is insufficient for ensuring generalization. If the training dataset is not lithologically balanced, the model may reinforce existing biases, associating landslide occurrence primarily with “Unit 7” and failing to detect events in “Unit 1”.
This finding highlights a fundamental issue in landslide detection models: effectively incorporating lithological information requires more than just adding it as an input feature. The training dataset itself must include landslide polygons from a representative range of lithological settings. When the model was explicitly trained and tested on Brisighella FAA using the same configuration (Case S3: RGB + slope), the F1-score increased from 0.32 to 0.41, confirming that geological consistency in the training data significantly improves the model's ability to detect landslides in previously underrepresented domains.
Although the F1-scores and Intersection over Union (IoU) achieved in this study may appear modest compared to generic machine-learning benchmarks (e.g., Ghorbanzadeh et al., 2021, 2022b; Prakash et al., 2021; Meena et al., 2023), it is important to ground these results within the context of landslide detection and segmentation literature, where lower scores are often observed. Several factors contribute to these relatively low F1-scores, including class imbalance between landslide and non-landslide areas, the spatial heterogeneity of landslides, uncertainties in reference inventories, and the influence of image resolution and labeling quality. Landslide mapping, unlike conventional image classification tasks, requires precise delineation of irregular and complex shapes across highly variable terrain, which makes it more challenging to achieve high scores.
Our dataset was specifically designed for emergency response scenarios, where a small portion of the affected area (Casola Valsenio) is mapped and the model is applied to the rest. This led to a train-validation-test ratio of 12 % for training, 3 % for validation, and 85 % for testing. The limited training and validation sets, combined with the complex nature of landslide mapping, contribute to modest F1-scores. Such a trade-off between accuracy and generalization is common in remote sensing, where high-resolution, fine-grained feature extraction is both critical and difficult to achieve at a large scale.
Nevertheless, the potential of these automated approaches in emergency scenarios is considerable. By rapidly generating landslide maps of comparable quality to expert-drawn products, these methods could significantly accelerate initial response efforts. Reducing the need for time-consuming manual digitization could save weeks of work, which is crucial during crisis events (Berti et al., 2025). The automatically generated maps may serve as a robust initial product, enabling practitioners to focus on refinement and validation rather than starting from scratch, ultimately delivering high-quality final maps in a fraction of the time required for full manual mapping.
6.3 Identification of At-Risk Buildings
A further consideration in our study is the use of automated landslide maps to identify damage and at-risk structures. Following the May 2023 disaster, the Emergency Commission determined that all buildings located within landslide boundaries or within a 20 m buffer were considered at risk and potentially subject to relocation. To evaluate the effectiveness of our automated mapping products for this task, we compared the buildings identified automatically with those derived from manual mapping.
The F1-scores for the models indicate that “U2”, “U4”, “S6”, and “U7” are the most accurate CNN outputs, identifying on average 528 out of 654 buildings at risk (∼ 0.78 F1-score). These results demonstrate the models' ability to estimate the spatial extent of the phenomenon, even when using Sentinel-2 imagery at 10 m resolution (U2). However, all models produced both false positives (incorrectly flagged buildings) and false negatives (missed buildings), underscoring the need for manual verification when high accuracy is required. Even a small number of misclassified structures, especially inhabited buildings, can have serious consequences in emergency situations, thus highlighting the importance of improving model performance for more effective response efforts.
Improving the landslide mapping itself is crucial for improving the accuracy of at-risk building identification. As discussed in Sect. 6.4, refining mapping methodologies will lead to more reliable and consistent results in future disaster scenarios.
6.4 Future Research Directions
To overcome the limitations identified in this study, future research should focus on key areas. A primary challenge is optimizing data acquisition to improve map quality, including minimizing shadow effects by scheduling imagery collection around noon, especially during winter months. Expanding training datasets to include more plowed field examples will help models better differentiate agricultural lands from landslides, reducing false positives. Further refinement could include detailed land-use layers or slope filters to improve accuracy.
Improving data resolution is another important direction. While this study used 2 m resolution data, higher-resolution datasets (e.g., 20 cm) would provide more detailed information, enabling better detection. Leveraging higher computational power would be necessary to process these datasets and enhance model performance. In terms of approach, future research could explore advanced techniques such as Multiscale Feature Pyramid Networks (FPN), which allow models to process multiple scales simultaneously, Graph Neural Networks (GNNs) for capturing complex spatial relationships in geospatial contexts, and Neural Architecture Search (NAS) to automatically identify the best network architecture, improving robustness and generalization (Lin et al., 2017; Kipf and Welling, 2017; Zoph and Le, 2017).
Lastly, addressing the issue of geologically diverse training datasets remains crucial. Training models on datasets with limited geological diversity can hinder generalization. Expanding datasets to include various lithologies and geomorphological features will enhance model robustness. As deep learning models evolve, it is essential to prioritize the collection of diverse, high-quality data, as even the most advanced models cannot replace the need for comprehensive datasets. Future research should focus on improving data acquisition, enhancing model generalization, and refining validation techniques to further strengthen AI-based mapping in disaster management.
This study investigated the potential of automated landslide mapping to support rapid emergency response following the extreme meteorological events of May 2023 in Emilia-Romagna, Italy. Using a deep learning approach, we trained and tested two semantic segmentation models, U-Net and SegFormer, on high-resolution aerial imagery, Sentinel-2 data, NDVI change maps, and slope data. The training was conducted solely in the municipality of Casola Valsenio, while model performance was assessed on three additional municipalities (Brisighella, Modigliana, Predappio), chosen for their geological settings and significant landslide occurrence.
In the training area of Casola Valsenio, both U-Net and SegFormer achieved high performance, with consistent results across different input combinations. The models showed no significant variation in performance based on the input layers, as long as high-resolution post-event imagery (CGR) was included. However, when applied to external regions such as Brisighella, Modigliana, and Predappio, the models experienced a decrease in generalization. Despite this, the automated mapping still successfully identified the majority of landslides, demonstrating its utility in emergency scenarios.
In areas like Brisighella FAA (Blue Clays), where relevant lithologies were underrepresented in the training set, the models struggled to generalize effectively. This highlights the importance of incorporating a diverse range of lithologies in the training data to ensure robust model generalization across different geologically complex regions.
The choice of model architecture, whether U-Net or SegFormer, had minimal impact on performance, with both models showing similar results. Performance decreased with less detailed inputs, like Sentinel imagery alone, and improved with more rich inputs, reinforcing that data quality, not architecture, drives performance.
In emergency contexts, where external data for validation may not be available, expert judgment becomes essential for selecting the most reliable maps when ground truth data is lacking. While automated maps offer rapid assessments, they often require expert adjustments to refine outputs offering a balanced approach between speed and accuracy. The correct and thoughtful integration of AI-based systems into civil protection protocols represents a critical step forward, ensuring that these technologies complement existing procedures and improve overall response effectiveness.
The dataset used in this study is openly available at https://doi.org/10.5281/zenodo.13742643 (Pizziolo et al., 2024). The code developed for the analyses is available from the authors upon reasonable request.
NDS performed the data analysis, developed the scripts, and wrote the manuscript. GC contributed to the interpretation of the results and supervised the work. DE contributed to the methodology and algorithmic framework. ELP contributed to the methodology and algorithmic framework. AC supervised the interpretation of the results. MB conceived the study, supervised the analysis and manuscript preparation, and provided critical review and guidance throughout the research process.
The contact author has declared that none of the authors has any competing interests.
Publisher's note: Copernicus Publications remains neutral with regard to jurisdictional claims made in the text, published maps, institutional affiliations, or any other geographical representation in this paper. The authors bear the ultimate responsibility for providing appropriate place names. Views expressed in the text are those of the authors and do not necessarily reflect the views of the publisher.
This article is part of the special issue “The influence of landslide inventory quality on susceptibility and hazard map reliability”. It is a result the EGU General Assembly 2024, session NH3.10 “Exploring the Interplay: Quality of Landslide Inventories and reliability of Susceptibility and Hazard mapping”, Vienna, Austria, 19 April 2024.
During the preparation of this work the authors used ChatGPT 4 (http://chat.openai.com, last access: 24 August 2026) to enhance the grammar and syntax, as well as to refine the sentence structure. All the content is original, and no concepts, ideas, or interpretations were produced by this tool. After using this tool, the authors reviewed and edited the content as needed and take full responsibility for the content of the publication.
This study was carried out within the RETURN Extended Partnership and received funding from the European Union Next-GenerationEU (National Recovery and Resilience Plan – NRRP, Mission 4, Component 2, Investment 1.3 – D.D. 1243 2/8/2022, PE0000005).
This paper was edited by Lorenzo Nava and reviewed by two anonymous referees.
Abrahams, E., Snow, T., Siegfried, M. R., and Pérez, F.: A concise tiling strategy for preserving spatial context in Earth observation imagery, arXiv [preprint], https://doi.org/10.48550/arXiv.2404.10927, 2024.
Amatya, P., Scheip, C., Déprez, A., Malet, J.-P., Slaughter, S. L., Handwerger, A. L., Emberson, R., Kirschbaum, D., Jean-Baptiste, J., Huang, M.-H., Clark, M. K., Zekkos, D., Huang, J.-R., Pacini, F., and Boissier, E.: Learnings from rapid response efforts to remotely detect landslides triggered by the August 2021 Nippes earthquake and Tropical Storm Grace in Haiti, Nat. Hazards, 118, 2337–2375, https://doi.org/10.1007/s11069-023-06096-6, 2023.
Amy, L. A. and Talling, P. J.: Anatomy of turbidites and linked debrites based on long distance (120 × 30 km) bed correlation, Marnoso Arenacea Formation, Northern Apennines, Italy, Sedimentology, 53, 161–212, https://doi.org/10.1111/j.1365-3091.2005.00756.x, 2006.
Ban, Y., Zhang, P., Nascetti, A., Bevington, A. R., and Wulder, M. A.: Near real-time wildfire progression monitoring with Sentinel-1 SAR time series and deep learning, Sci. Rep., 10, 1322, https://doi.org/10.1038/s41598-019-56967-x, 2020.
Berti, M., Pizziolo, M., Scaroni, M., Generali, M., Critelli, V., Mulas, M., Tondo, M., Lelli, F., Fabbiani, C., Ronchetti, F., Ciccarese, G., Dal Seno, N., Ioriatti, E., Rani, R., Zuccarini, A., Simonelli, T., and Corsini, A.: RER2023: the landslide inventory dataset of the May 2023 Emilia-Romagna meteorological event, Earth Syst. Sci. Data, 17, 1055–1074, https://doi.org/10.5194/essd-17-1055-2025, 2025.
Berti, M., Pizziolo, M., Scaroni, M., Generali, M., Olivucci, S., Gozza, G., Formicola, P., Critelli, V., Mulas, M., Tondo, M., Lelli, F., Fabbiani, C., Ronchetti, F., Ciccarese, G., Dal Seno, N., Ioriatti, E., Rani, R., Zuccarini, A., Simonelli, T., and Corsini, A.: Testing NDVI and U-Net for automated mapping of multiple-occurrence regional landslide events using satellite and aerial multispectral data (Casola Valsenio, Emilia-Romagna, Northern Apennines, Italy), Landslides, 23, 969–988, https://doi.org/10.1007/s10346-025-02671-z, 2026.
Blaschke, T.: Object based image analysis for remote sensing, ISPRS J. Photogramm. Remote Sens., 65, 2–16, https://doi.org/10.1016/j.isprsjprs.2009.06.004, 2010.
Brath, A., Casagli, N., Marani, M., Mercogliano, P., and Motta, R.: Rapporto della Commissione tecnico-scientifica istituita con deliberazione della Giunta Regionale n. 984/2023 e determinazione dirigenziale 14641/2023, al fine di analizzare gli eventi meteorologici estremi del mese di maggio 2023, Technical Report, Regione Emilia-Romagna, 147 pp., https://notizie.regione.emilia-romagna.it/comunicati/2023/dicembre/post-alluvione-ecco-il-rapporto-della-commissione-tecnico-scientifica-201cin-emilia-romagna-un-evento-senza-precedenti-nella-storia-osservata201d-la-vicepresidente-priolo-201cabbiamo-affrontato-qualcosa-di-difficilmente-immaginabile-uno-spartiacque-tra (last access: 26 August 2026), 2023.
Casagli, N., Cigna, F., Bianchini, S., Hölbling, D., Füreder, P., Righini, G., Del Conte, S., Friedl, B., Schneiderbauer, S., Iasio, C., Vlcko, J., Greif, V., Proske, H., Granica, K., Falco, S., Lozzi, S., Mora, O., Arnaud, A., Novali, F., and Bianchi, M.: Landslide mapping and monitoring by using radar and optical remote sensing: examples from the EC-FP7 project SAFER, Remote Sens. Appl. Soc. Environ., 4, 92–108, https://doi.org/10.1016/j.rsase.2016.07.001, 2016.
Chen, X., Liu, M., Li, D., Jia, J., Yang, A., Zheng, W., and Yin, L.: Conv-trans dual network for landslide detection of multi-channel optical remote sensing images, Front. Earth Sci., 11, 1182145, https://doi.org/10.3389/feart.2023.1182145, 2023.
Chen, Z., Zhang, Y., Ouyang, C., Zhang, F., and Ma, J.: Automated landslides detection for mountain cities using multi-temporal remote sensing imagery, Sensors, 18, 821, https://doi.org/10.3390/s18030821, 2018.
Cruden, D. M. and Varnes, D. J.: Landslide types and processes, in: Landslides: Investigation and Mitigation, edited by: Turner, A. K. and Schuster, R. L., Transportation Research Board Special Report, 247, National Academy Press, Washington, D.C., 36–75, ISBN 0-309-06151-2, 1996.
Dal Seno, N., Evangelista, D., Piccolomini, E., and Berti, M.: Comparative analysis of conventional and machine learning techniques for rainfall threshold evaluation under complex geological conditions, Landslides, 21, 2893–2911, https://doi.org/10.1007/s10346-024-02336-3, 2024.
Dosovitskiy, A., Beyer, L., Kolesnikov, A., Weissenborn, D., Zhai, X., Unterthiner, T., Dehghani, M., Minderer, M., Heigold, G., Gelly, S., Uszkoreit, J., and Houlsby, N.: An image is worth 16x16 words: transformers for image recognition at scale, arXiv [preprint], https://doi.org/10.48550/arXiv.2010.11929, 2020.
Ferrario, M. F. and Livio, F.: Rapid mapping of landslides induced by heavy rainfall in the Emilia-Romagna (Italy) region in May 2023, Remote Sens., 16, 122, https://doi.org/10.3390/rs16010122, 2024.
Foraci, R., Tesini, M. S., Nanni, S., Antolini, G., and Pavan, V.: L'inquadramento meteo e idrologico degli eventi, Ecoscienza, ARPAE Emilia-Romagna, anno XIV, 5, 20–24, https://www.arpae.it/it/ecoscienza/numeri-ecoscienza/anno-2023/numero-5-anno-2023/alluvione-emilia-romagna/foraci_et_al_es2023_5.pdf (last access: 24 August 2026), 2023.
Ghorbanzadeh, O., Blaschke, T., Gholamnia, K., Meena, S. R., Tiede, D., and Aryal, J.: Evaluation of different machine learning methods and deep-learning convolutional neural networks for landslide detection, Remote Sens., 11, 196, https://doi.org/10.3390/rs11020196, 2019.
Ghorbanzadeh, O., Crivellari, A., Ghamisi, P., Shahabi, H., and Blaschke, T.: A comprehensive transferability evaluation of U-Net and ResU-Net for landslide detection from Sentinel-2 data (case study areas from Taiwan, China, and Japan), Sci. Rep., 11, 14629, https://doi.org/10.1038/s41598-021-94190-9, 2021.
Ghorbanzadeh, O., Shahabi, H., Crivellari, A., Homayouni, S., Blaschke, T., and Ghamisi, P.: Landslide detection using deep learning and object-based image analysis, Landslides, 19, 929–939, https://doi.org/10.1007/s10346-021-01843-x, 2022a.
Ghorbanzadeh, O., Xu, Y., Ghamisi, P., Kopp, M., and Kreil, D.: Landslide4Sense: reference benchmark data and deep learning models for landslide detection, IEEE Trans. Geosci. Remote Sens., 60, 1–17, https://doi.org/10.1109/TGRS.2022.3215209, 2022b.
Ghorbanzadeh, O., Gholamnia, K., and Ghamisi, P.: The application of ResU-net and OBIA for landslide detection from multi-temporal Sentinel-2 images, Big Earth Data, 7, 961–985, https://doi.org/10.1080/20964471.2022.2031544, 2023.
Guzzetti, F., Mondini, A. C., Cardinali, M., Fiorucci, F., Santangelo, M., and Chang, K.-T.: Landslide inventory maps: new tools for an old problem, Earth-Sci. Rev., 112, 42–66, https://doi.org/10.1016/j.earscirev.2012.02.001, 2012.
Hastie, T., Tibshirani, R., and Friedman, J.: The Elements of Statistical Learning: Data Mining, Inference, and Prediction, 2nd edn., Springer, New York, NY, https://doi.org/10.1007/978-0-387-84858-7, 2009.
Hölbling, D., Eisank, C., Albrecht, F., Vecchiotti, F., Friedl, B., Weinke, E., and Kociu, A.: Comparing manual and semi-automated landslide mapping based on optical satellite images from different sensors, Geosciences, 7, 37, https://doi.org/10.3390/geosciences7020037, 2017.
Isensee, F., Jaeger, P. F., Kohl, S. A. A., Petersen, J., and Maier-Hein, K. H.: nnU-Net: a self-configuring method for deep learning-based biomedical image segmentation, Nat. Methods, 18, 203–211, https://doi.org/10.1038/s41592-020-01008-z, 2021.
Iverson, R. M., George, D. L., Allstadt, K., Reid, M. E., Collins, B. D., Vallance, J. W., Schilling, S. P., Godt, J. W., Cannon, C. M., Magirl, C. S., Baum, R. L., Coe, J. A., Schulz, W. H., and Bower, J. B.: Landslide mobility and hazards: implications of the 2014 Oso disaster, Earth Planet. Sci. Lett., 412, 197–208, https://doi.org/10.1016/j.epsl.2014.12.020, 2015.
Ji, S. P., Yu, D. W., Shen, C. Y., Li, W. L., and Xu, Q.: Landslide detection from an open satellite imagery and digital elevation model dataset using attention boosted convolutional neural networks, Landslides, 17, 1337–1352, https://doi.org/10.1007/s10346-020-01353-2, 2020.
Kingma, D. P. and Ba, J.: Adam: a method for stochastic optimization, arXiv [preprint], https://doi.org/10.48550/arXiv.1412.6980, 2017.
Kipf, T. N. and Welling, M.: Semi-supervised classification with graph convolutional networks, in: International Conference on Learning Representations (ICLR), arXiv [preprint], https://doi.org/10.48550/arXiv.1609.02907, 2017.
LeCun, Y., Bengio, Y., and Hinton, G.: Deep learning, Nature, 521, 436–444, https://doi.org/10.1038/nature14539, 2015.
Lin, T.-Y., Dollár, P., Girshick, R., He, K., Hariharan, B., and Belongie, S.: Feature Pyramid Networks for Object Detection, in: Proceedings of the IEEE Conference on Computer Vision and Pattern Recognition (CVPR), 2117–2125, arXiv [preprint], https://doi.org/10.48550/arXiv.1612.03144, 2017.
Lu, W., Hu, Y., Zhang, Z., and Cao, W.: A dual-encoder U-Net for landslide detection using Sentinel-2 and DEM data, Landslides, 20, 1975–1987, https://doi.org/10.1007/s10346-023-02089-5, 2023.
Martha, T. R., Kerle, N., Jetten, V., van Westen, C. J., and Kumar, K. V.: Characterising spectral, spatial and morphometric properties of landslides for semi-automatic detection using object-oriented methods, Geomorphology, 116, 24–36, https://doi.org/10.1016/j.geomorph.2009.10.004, 2010.
Meena, S. R., Ghorbanzadeh, O., van Westen, C. J., Nachappa, T. G., Blaschke, T., Singh, R. P., and Sarkar, R.: Rapid mapping of landslides in the Western Ghats (India) triggered by 2018 extreme monsoon rainfall using a deep learning approach, Landslides, 18, 1937–1950, https://doi.org/10.1007/s10346-020-01602-4, 2021.
Meena, S. R., Soares, L. P., Grohmann, C. H., van Westen, C., Bhuyan, K., Singh, R. P., Floris, M., and Catani, F.: Landslide detection in the Himalayas using machine learning algorithms and U-Net, Landslides, 19, 1209–1229, https://doi.org/10.1007/s10346-022-01861-3, 2022.
Meena, S. R., Nava, L., Bhuyan, K., Puliero, S., Soares, L. P., Dias, H. C., Floris, M., and Catani, F.: HR-GLDD: a globally distributed dataset using generalized deep learning (DL) for rapid landslide mapping on high-resolution (HR) satellite imagery, Earth Syst. Sci. Data, 15, 3283–3298, https://doi.org/10.5194/essd-15-3283-2023, 2023.
Mondini, A. C., Santangelo, M., Rocchetti, M., Rossetto, E., Manconi, A., and Monserrat, O.: Sentinel-1 SAR amplitude imagery for rapid landslide detection, Remote Sens., 11, 760, https://doi.org/10.3390/rs11070760, 2019.
Mondini, A. C., Guzzetti, F., Chang, K.-T., Monserrat, O., Martha, T. R., and Manconi, A.: Landslide failures detection and mapping using synthetic aperture radar: past, present and future, Earth-Sci. Rev., 216, 103574, https://doi.org/10.1016/j.earscirev.2021.103574, 2021.
Nava, L., Bhuyan, K., Meena, S. R., Monserrat, O., and Catani, F.: Rapid mapping of landslides on SAR data by Attention U-Net, Remote Sens., 14, 1449, https://doi.org/10.3390/rs14061449, 2022.
Notti, D., Cignetti, M., Godone, D., and Giordan, D.: Semi-automatic mapping of shallow landslides using free Sentinel-2 images and Google Earth Engine, Nat. Hazards Earth Syst. Sci., 23, 2625–2648, https://doi.org/10.5194/nhess-23-2625-2023, 2023.
Novellino, A., Pennington, C., Leeming, K., Taylor, S., Alvarez, I. G., McAllister, E., Arnhardt, C., and Winson, A.: Mapping landslides from space: a review, Landslides, 21, 1041–1052, https://doi.org/10.1007/s10346-024-02215-x, 2024.
Paszke, A., Gross, S., Massa, F., Lerer, A., Bradbury, J., Chanan, G., Killeen, T., Lin, Z., Gimelshein, N., Antiga, L., Desmaison, A., Köpf, A., Yang, E., DeVito, Z., Raison, M., Tejani, A., Chilamkurthy, S., Steiner, B., Fang, L., Bai, J., and Chintala, S.: PyTorch: an imperative style, high-performance deep learning library, in: Advances in Neural Information Processing Systems, 32, 8026–8037, arXiv [preprint], https://doi.org/10.48550/arXiv.1912.01703, 2019.
Pizziolo, M., Generali, M., and Scaroni, M.: In Appennino un numero di frane mai riscontrato prima, Ecoscienza, ARPAE Emilia-Romagna, anno XIV, 5, 31–33, https://ambiente.regione.emilia-romagna.it/it/geologia/divulgazione/pubblicazioni/articoli-su-riviste-specialistiche/p31_rer-frane.pdf (last access: 24 August 2026), 2023.
Pizziolo, M., Berti, M., Scaroni, M., Generali, M., Critelli, V., Mulas, M., Tondo, M., Lelli, F., Fabbiani, C., Ronchetti, F., Ciccarese, G., Dal Seno, N., Ioriatti, E., Rani, R., Zuccarini, A., Simonelli, T., and Corsini, A.: RER2023: the landslide inventory dataset of the May 2023 Emilia-Romagna event – Version 1, Zenodo [data set], https://doi.org/10.5281/zenodo.13742643, 2024.
Prakash, N. and Manconi, A.: Rapid mapping of landslides triggered by the Storm Alex, October 2020, in: 2021 IEEE International Geoscience and Remote Sensing Symposium IGARSS, Brussels, Belgium, 1808–1811, https://doi.org/10.1109/IGARSS47720.2021.9553321, 2021.
Prakash, N., Manconi, A., and Loew, S.: Mapping landslides on EO data: performance of deep learning models vs. traditional machine learning models, Remote Sens., 12, 346, https://doi.org/10.3390/rs12030346, 2020.
Prakash, N., Manconi, A., and Loew, S.: A new strategy to map landslides with a generalized convolutional neural network, Sci. Rep., 11, 9722, https://doi.org/10.1038/s41598-021-89015-8, 2021.
Prechelt, L.: Early stopping – but when?, in: Neural Networks: Tricks of the Trade, edited by: Orr, G. B. and Müller, K.-R., Springer, Berlin, Heidelberg, 55–69, https://doi.org/10.1007/3-540-49430-8_3, 1998.
Rezatofighi, H., Tsoi, N., Gwak, J., Sadeghian, A., Reid, I., and Savarese, S.: Generalized intersection over union: a metric and a loss for bounding box regression, 2019 IEEE/CVF Conference on Computer Vision and Pattern Recognition (CVPR), 658–666, https://doi.org/10.1109/CVPR.2019.00075, 2019.
Robinson, T. R., Rosser, N. J., Densmore, A. L., Williams, J. G., Kincey, M. E., Benjamin, J., and Bell, H. J. A.: Rapid post-earthquake modelling of coseismic landslide intensity and distribution for emergency response decision support, Nat. Hazards Earth Syst. Sci., 17, 1521–1540, https://doi.org/10.5194/nhess-17-1521-2017, 2017.
Ronneberger, O., Fischer, P., and Brox, T.: U-Net: convolutional networks for biomedical image segmentation, in: Medical Image Computing and Computer-Assisted Intervention – MICCAI 2015, Lecture Notes in Computer Science, 9351, 234–241, https://doi.org/10.1007/978-3-319-24574-4_28, 2015.
Sameen, M. I. and Pradhan, B.: Landslide detection using residual networks and the fusion of spectral and topographic information, IEEE Access, 7, 114363–114373, https://doi.org/10.1109/access.2019.2935761, 2019.
Scaioni, M., Longoni, L., Melillo, V., and Papini, M.: Remote sensing for landslide investigations: an overview of recent achievements and perspectives, Remote Sens., 6, 9600–9652, https://doi.org/10.3390/rs6109600, 2014.
Tang, X., Tu, Z., Wang, Y., Liu, M., Li, D., and Fan, X.: Automatic detection of coseismic landslides using a new transformer method, Remote Sens., 14, 2884, https://doi.org/10.3390/rs14122884, 2022.
Tharwat, A.: Classification assessment methods, Appl. Comput. Inform., 17, 168–192, https://doi.org/10.1016/j.aci.2018.08.003, 2020.
Tofani, V., Segoni, S., Agostini, A., Catani, F., and Casagli, N.: Technical Note: Use of remote sensing for landslide studies in Europe, Nat. Hazards Earth Syst. Sci., 13, 299–309, https://doi.org/10.5194/nhess-13-299-2013, 2013.
Tucker, C. J.: Red and photographic infrared linear combinations for monitoring vegetation, Remote Sens. Environ., 8, 127–150, https://doi.org/10.1016/0034-4257(79)90013-0, 1979.
Wasowski, J. and Bovenga, F.: Investigating landslides and unstable slopes with satellite Multi Temporal Interferometry: current issues and future perspectives, Eng. Geol., 174, 103–138, https://doi.org/10.1016/j.enggeo.2014.03.003, 2014.
Wolf, T., Debut, L., Sanh, V., Chaumond, J., Delangue, C., Moi, A., Cistac, P., Rault, T., Louf, R., Funtowicz, M., Davison, J., Shleifer, S., von Platen, P., Ma, C., Jernite, Y., Plu, J., Xu, C., Le Scao, T., Gugger, S., Drame, M., Lhoest, Q., and Rush, A. M.: Transformers: state-of-the-art natural language processing, in: Proceedings of the 2020 Conference on Empirical Methods in Natural Language Processing: System Demonstrations, 38–45, arXiv [preprint], https://doi.org/10.48550/arXiv.1910.03771, 2020.
Wu, L., Liu, R., Ju, N., Zhang, A., Gou, J., He, G., and Lei, Y.: Landslide mapping based on a hybrid CNN-transformer network and deep transfer learning using remote sensing images with topographic and spectral features, Int. J. Appl. Earth Obs. Geoinf., 126, 103612, https://doi.org/10.1016/j.jag.2023.103612, 2024.
Xie, E., Wang, W., Yu, Z., Anandkumar, A., Alvarez, J. M., and Luo, P.: SegFormer: simple and efficient design for semantic segmentation with transformers, in: Advances in Neural Information Processing Systems, 34, 12077–12090, arXiv [preprint], https://doi.org/10.48550/arXiv.2105.15203, 2021.
Xu, Y., Ouyang, C., Xu, Q., Wang, D., Zhao, B., and Luo, Y.: CAS Landslide Dataset: a large-scale and multisensor dataset for deep learning-based landslide detection, Sci. Data, 11, 12, https://doi.org/10.1038/s41597-023-02847-z, 2024.
Yang, W., Wang, Y., Sun, S., Wang, Y., and Ma, C.: Using Sentinel-2 time series to detect slope movement before the Jinsha River landslide, Landslides, 16, 1313–1324, https://doi.org/10.1007/s10346-019-01178-8, 2019.
Ye, C., Li, Y., Cui, P., Liang, L., Pirasteh, S., Marcato, J., Goncalves, W. N., and Li, J.: Landslide detection of hyperspectral remote sensing data based on deep learning with constraints, IEEE J. Sel. Top. Appl. Earth Obs. Remote Sens., 12, 5047–5060, https://doi.org/10.1109/JSTARS.2019.2951725, 2019.
Zhang, Z., Liu, Q., and Wang, Y.: Road extraction by deep residual U-Net, IEEE Geosci. Remote Sens. Lett., 15, 749–753, https://doi.org/10.1109/LGRS.2018.2802944, 2018.
Zoph, B. and Le, Q. V.: Neural architecture search with reinforcement learning, in: International Conference on Learning Representations (ICLR), arXiv [preprint], https://doi.org/10.48550/arXiv.1611.01578, 2017.