
the Creative Commons Attribution 4.0 License.
the Creative Commons Attribution 4.0 License.
 | 21 Aug 2026
Impact of extreme rainfall on triggering conditions and susceptibility for shallow landslides: a case study in the Alpes-Maritimes region (France)
Lucie Armand
Guillaume Chambon
Olivier Cerdan
Yannick Thiery
Nathalie Marçot
Louis Ferradou
Nicolas Saby
Séverine Bernardie
Prediction of shallow landslides at the regional scale generally relies on statistical analyses of landslide inventories. Rainfall-duration thresholds and susceptibility maps are among the most common approaches to anticipate future landslide occurrences. However, the outputs and reliability of these approaches can be strongly affected by the representativeness of the landslides included in the inventory. This study specifically investigates the impact of landslides triggered by an extreme rainfall event on the determination of rainfall-duration thresholds and susceptibility maps. We consider the case of Storm Alex, a millennial return period rainfall event, which hit the Alpes-Maritimes region (France) on 2 October 2020. The analysis is based on an inventory of 5383 shallow landslides, including 1656 landslides triggered by Storm Alex. Cumulative rainfall and rainfall duration associated with each landslide were computed following the process of the CTRL-T algorithm. Landslides sharing identical cumulative rainfall and rainfall durations were aggregated into a single point to avoid over-representing rainfall events that triggered many spatially clustered landslides. Then, a 5 % quantile regression was used to compute statistical rainfall-duration thresholds with and without the inclusion of Storm Alex landslides. A Random Forest approach was used to produce susceptibility maps under the same two configurations, which were subsequently compared. Results show that: (a) Including Storm Alex landslides increased the rainfall–duration thresholds by a factor of 1.1 to 1.5, depending on the assumed landslide occurrence time; (b) the exceptional rainfall intensity triggered landslides in areas having an initial lower susceptibility; and (c) including these events in susceptibility modelling alters the spatial distribution of susceptibility values. This study provides a quantitative analysis of the impact of landslides triggered by extreme rainfall events on statistical prediction models.
- Article
(24625 KB) - Full-text XML
- BibTeX
- EndNote


Mountainous areas are highly prone to mass wasting processes, among which shallow landslides, also called soil slip (Cruden and Varnes, 1996), are frequently observed. In this study, a shallow landslide is defined by a sudden and relatively rapid movement of the superficial material overlying the bedrock, typically involving a 1–2 m thick soil layer. These phenomena can cause significant damage to infrastructures and, in some cases, endanger human lives. They also play a role in the natural evolution of slopes, by reshaping the landscapes and participating in sediment transfer (Clapuyt et al., 2019). Thus, improving knowledge on landslide triggering conditions is essential for a reliable risk assessment, land use planning strategies and the establishment of effective early warning systems.
Rainfall plays a major role in triggering shallow landslides (Iverson, 2000), since intense or prolonged precipitation events can rapidly increase soil moisture and pore water pressure, decreasing slope stability (Montrasio and Valentino, 2008; Tsai, 2008). The first attempts at linking rainfall to landslide occurrence were based on simple empirical thresholds, such as those introduced by Caine (1980) and later by Terlien (1998). Based on these pioneer studies, various empirical, statistical and probabilistic approaches were developed to better identify the rainfall conditions favourable to landslides. Among these different approaches, cumulative/duration thresholds (ED thresholds), which combine the cumulative precipitation and the duration of rainfall events associated with landslides, have taken an important place (Segoni et al., 2018). They provide a simple and robust tool, used in several regions of the world, to design early warning systems (Segoni et al., 2018; Gonzalez et al., 2024).
Susceptibility maps are another key tool in the analysis of landslide processes. Susceptibility represents the likelihood of landslide occurrence at any given location, regardless of the temporal probability (Fell et al., 2008; Corominas et al., 2014). Susceptibility maps aim to identify areas prone to shallow landslides based on terrain characteristics. They are based on the combination of various predisposing factors, the most common of which include geomorphological features (e.g. slope, aspect, curvature, landform), geological features (e.g. lithology, distance to faults), or soil properties (e.g. soil thickness, texture) (Reichenbach et al., 2018). The construction of susceptibility maps can be based on deterministic methods (i.e. simulating slope stability using physical parameters) (Gökceoglu and Aksoy, 1996; Armaş et al., 2014; Pradhan and Kim, 2016), or on statistical and machine learning approaches (Reichenbach et al., 2018). Among these, Random Forest (RF) has become increasingly popular in recent years, due to its capabilities to handle multiple and possibly correlated factors (Trigila et al., 2015; Chen et al., 2017; Park and Kim, 2019), and is now a relatively standard method for establishing susceptibility maps (Catani et al., 2013; Reichenbach et al., 2018; Taalab et al., 2018; Sun et al., 2020; Zhou et al., 2021).
These tools, rainfall thresholds and susceptibility maps, are usually based on inventories of past landslides. The assumption here is that knowledge of past events is valuable to guide the prediction of future instabilities. This requires representative inventories including landslides triggered by different rainfall conditions, ranging from moderate to extreme rainfall events. However, extreme rainfall typically triggers a large number of landslides. Rainfall intensity strongly affects soil infiltration patterns and hydrological response (Iverson, 2000; Ran et al., 2018), which can modify the triggering mechanisms of landslides compared to more moderate rainfall events. Recent studies have shown that, during years characterized by extreme rainfall, certain morphological factors, such as slope, local relief, and topography, become more determinant in controlling landslide occurrence (Jones et al., 2021). Similarly, Achu et al. (2024) highlighted that landslides triggered during extreme rainfall events can influence the spatial structure of susceptibility models, thereby modifying the distribution of susceptibility classes. This indicates that landslides triggered by extreme rainfall do not necessarily follow the same spatial patterns as more common events, which highlights the importance of examining their impact on predictive models. However, this issue is currently poorly documented in the literature.
A few studies focus on the effect of extreme rainfall on slope stability (Shou and Lin, 2020), on forecasting landslides triggered by such rainfall (Lee et al., 2008; Lombardo et al., 2014), or on how extreme rainfall may alter slope susceptibility in the long term (Jones et al., 2021; Achu et al., 2024). In this study, we are interested in examining the specificities of landslides triggered by extreme rainfall events in terms of predisposing factors, and in quantifying the influence of these extreme events on the robustness of susceptibility maps and ED rainfall thresholds. The general hypothesis behind this question is that landslides triggered by an extreme rainfall event exhibit specific triggering conditions and predisposing patterns that can alter the generalization capacity of predictive models. Storm Alex, which occurred on 2 October 2020 in the Alpes-Maritimes region (France) and is estimated to have had a millennial return period, is used as a representative case study for an extreme rainfall event. The analysis of ED rainfall thresholds makes it possible to assess how the inclusion of Storm Alex landslides in the inventory modifies the statistical triggering conditions. Susceptibility maps allow us to quantify the impact of landslides triggered by an extreme rainfall event on the spatial distribution of areas prone to landslides. Analysing these effects can help to better understand the limits of data-driven models and could help to understand how to calibrate tools used for anticipating landslides in meteorological contexts prone to extreme rainfall events.
The article begins with an overview of the study area and the description of the Storm Alex extreme rainfall event (Sect. 2). It is followed by a detailed presentation of the datasets used, including meteorological information, predisposing factors and the landslide inventory (Sect. 3). The methodological framework is then described, focusing on the computation of rainfall-duration thresholds using a Quantile Regression and the development of susceptibility maps based on Random Forest algorithm (Sect. 4). The subsequent section presents and compares the results obtained with and without inclusion for Storm Alex-induced landslides for both the thresholds and susceptibility maps (Sect. 5). Finally, the discussion highlights the main insights derived from the analysis (Sect. 6), before the conclusion summarizes the key contributions, limitations, and future research (Sect. 7).
2.1 Study area
The Alpes-Maritimes region is located in the southeastern part of France, bordering the Mediterranean Sea (Fig. 1a). Covering an area of 1299 km2, this region has a population of 1.1 million inhabitants according to the French National Institute of Statistics and Economic Studies (INSEE), of which 94 % are concentrated in the 66 municipalities surrounding the Mediterranean coast. The region presents a contrasting geomorphological context, with the northern part dominated by high mountainous relief and deep valleys shaped by glaciers, while the southern part exhibits gentler terrain and pronounced urbanization along the coast. The elevation varies from sea level to 3143 m.
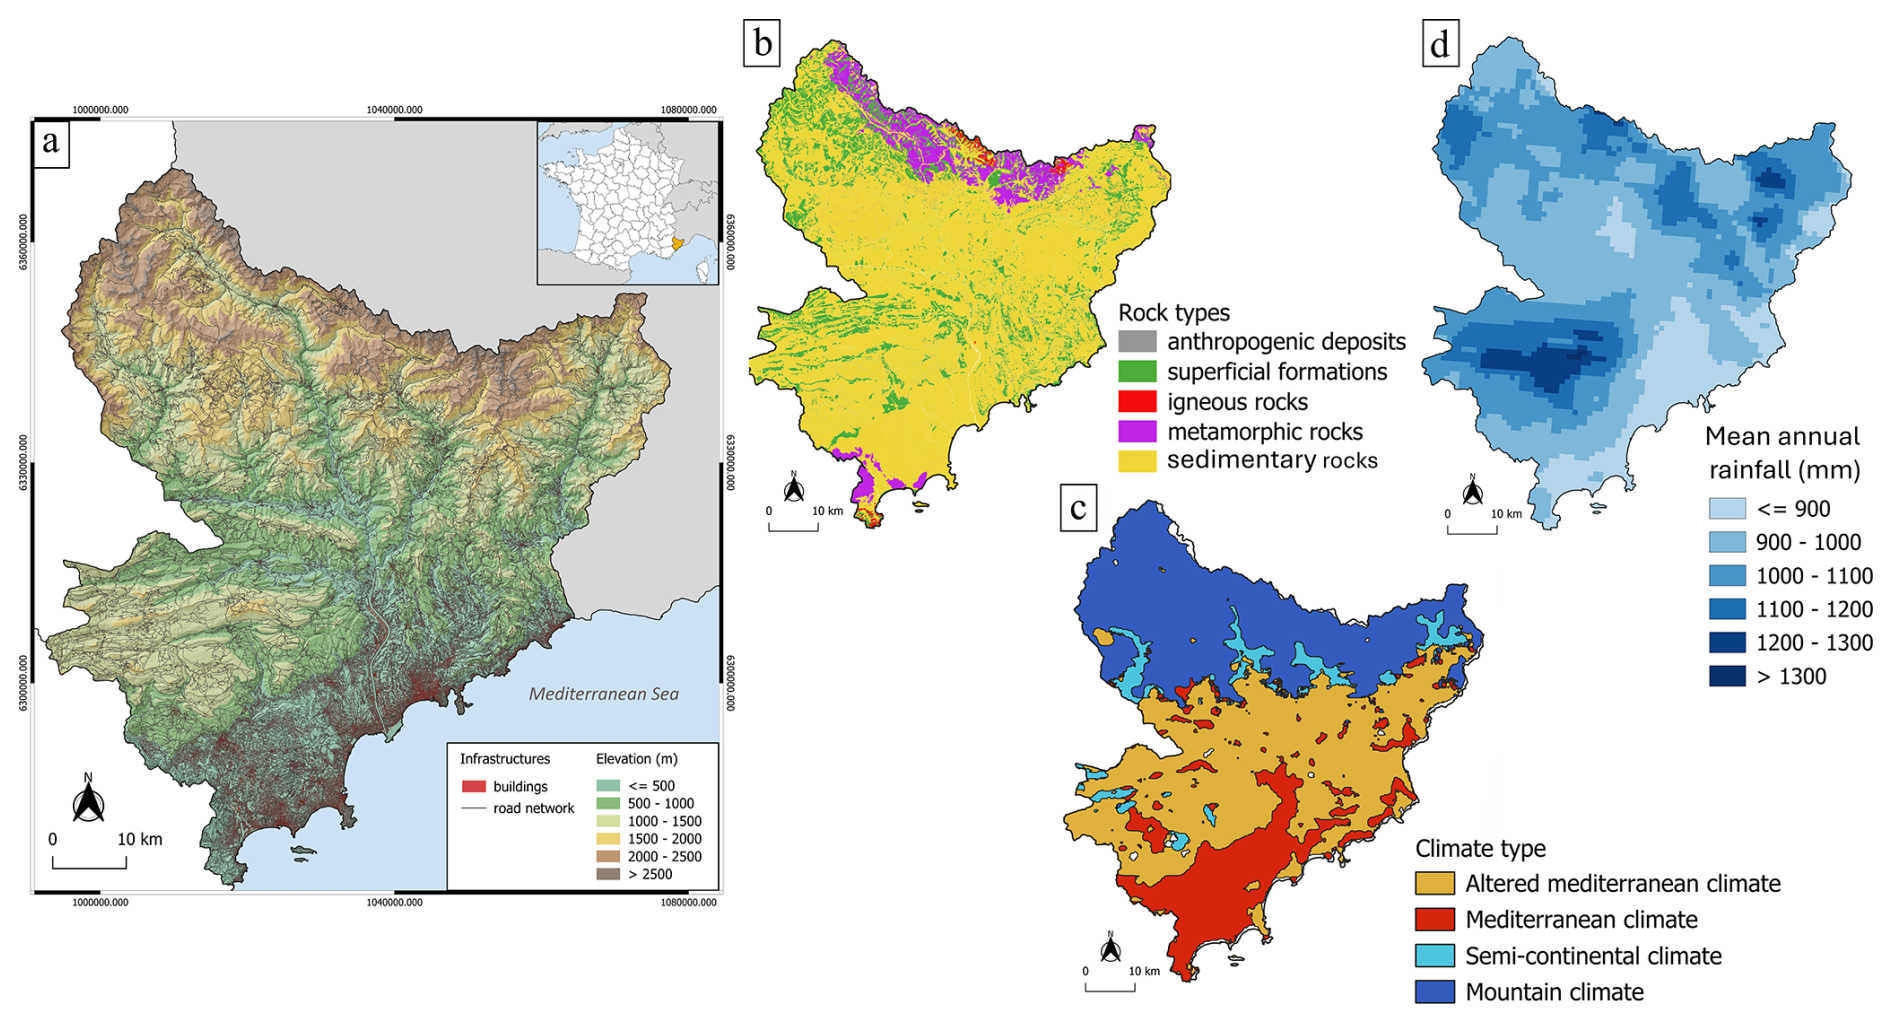
Figure 1(a) Overview of the study area. (b) Main rock types. (c) Climatic classification according to Joly et al. (2010). (d) Spatial distribution of the mean annual rainfall over the period 1997–2019 (COMEPHORE data).
The harmonized geological map of the Alpes-Maritimes (Gonzalès, 2008) indicates that the territory exhibits a highly diverse geology, with a majority (77 %) of sedimentary rocks (Fig. 1b). The latter include marly and clayey formations (14 % of the territory), which weather into clay-rich soils that are highly sensitive to water saturation and alteration. In addition, recent unconsolidated deposits such as moraines (3 % of the territory), alluvial deposits (5 % of the territory) and scree or debris cone deposits (20 % of the territory), constitute materials prone to instabilities that can further increase the susceptibility to landslides.
The study area presents four main types of climates (Joly et al., 2010), including Mediterranean climate, altered Mediterranean climate, semi-continental climate, and mountain climate (Fig. 1c). This climatic heterogeneity implies differences in precipitation regimes, as shown in Fig. 1d, which represents the mean annual rainfall over the period 1997–2019. Mountainous areas typically receive more precipitation (from 1000 to more than 1300 mm yr−1) than Mediterranean areas (<900 mm yr−1). However, the latter are characterized by a pronounced seasonal regime with a cold season marked by a higher amount of rainfall (Lionello et al., 2006), and a dry season favourable to intense and localized rainstorms that can generate landslides as well as other geomorphological processes (torrential floods, debris flows, rockfalls,etc.) (Rebora et al., 2013; Liébault et al., 2024).
2.2 Storm Alex
On 2 October 2020, a large part of the Alpes-Maritimes region was affected by Storm Alex, an extreme rainfall event with a millennial return period (Carrega and Michelot, 2021). This record-breaking rainfall was caused by a combination of meteorological conditions favourable to stationary thunderstorms, enhanced by the mountainous terrain and a significant influx of moisture from the Mediterranean area (Chochon et al., 2022). The valleys of Tinée, Vésubie and Roya were particularly impacted by the storm (Fig. 2a). For example, the municipality of Tournefort in the Tinée valley recorded 600 mm in 24 h (Fig. 2b). The rainfall began on 2 October at 07:00 a.m. and lasted until the night of the same day. This exceptional rainfall event deeply altered the landscape and triggered violent floods as well as numerous mass movements, including shallow landslides, debris flows, and bank erosion. The storm was responsible for 17 fatalities, and hundreds of people were evacuated. The event caused significant damage to infrastructure, with an estimated cost exceeding EUR 1 billion (Arbizzi et al., 2021).
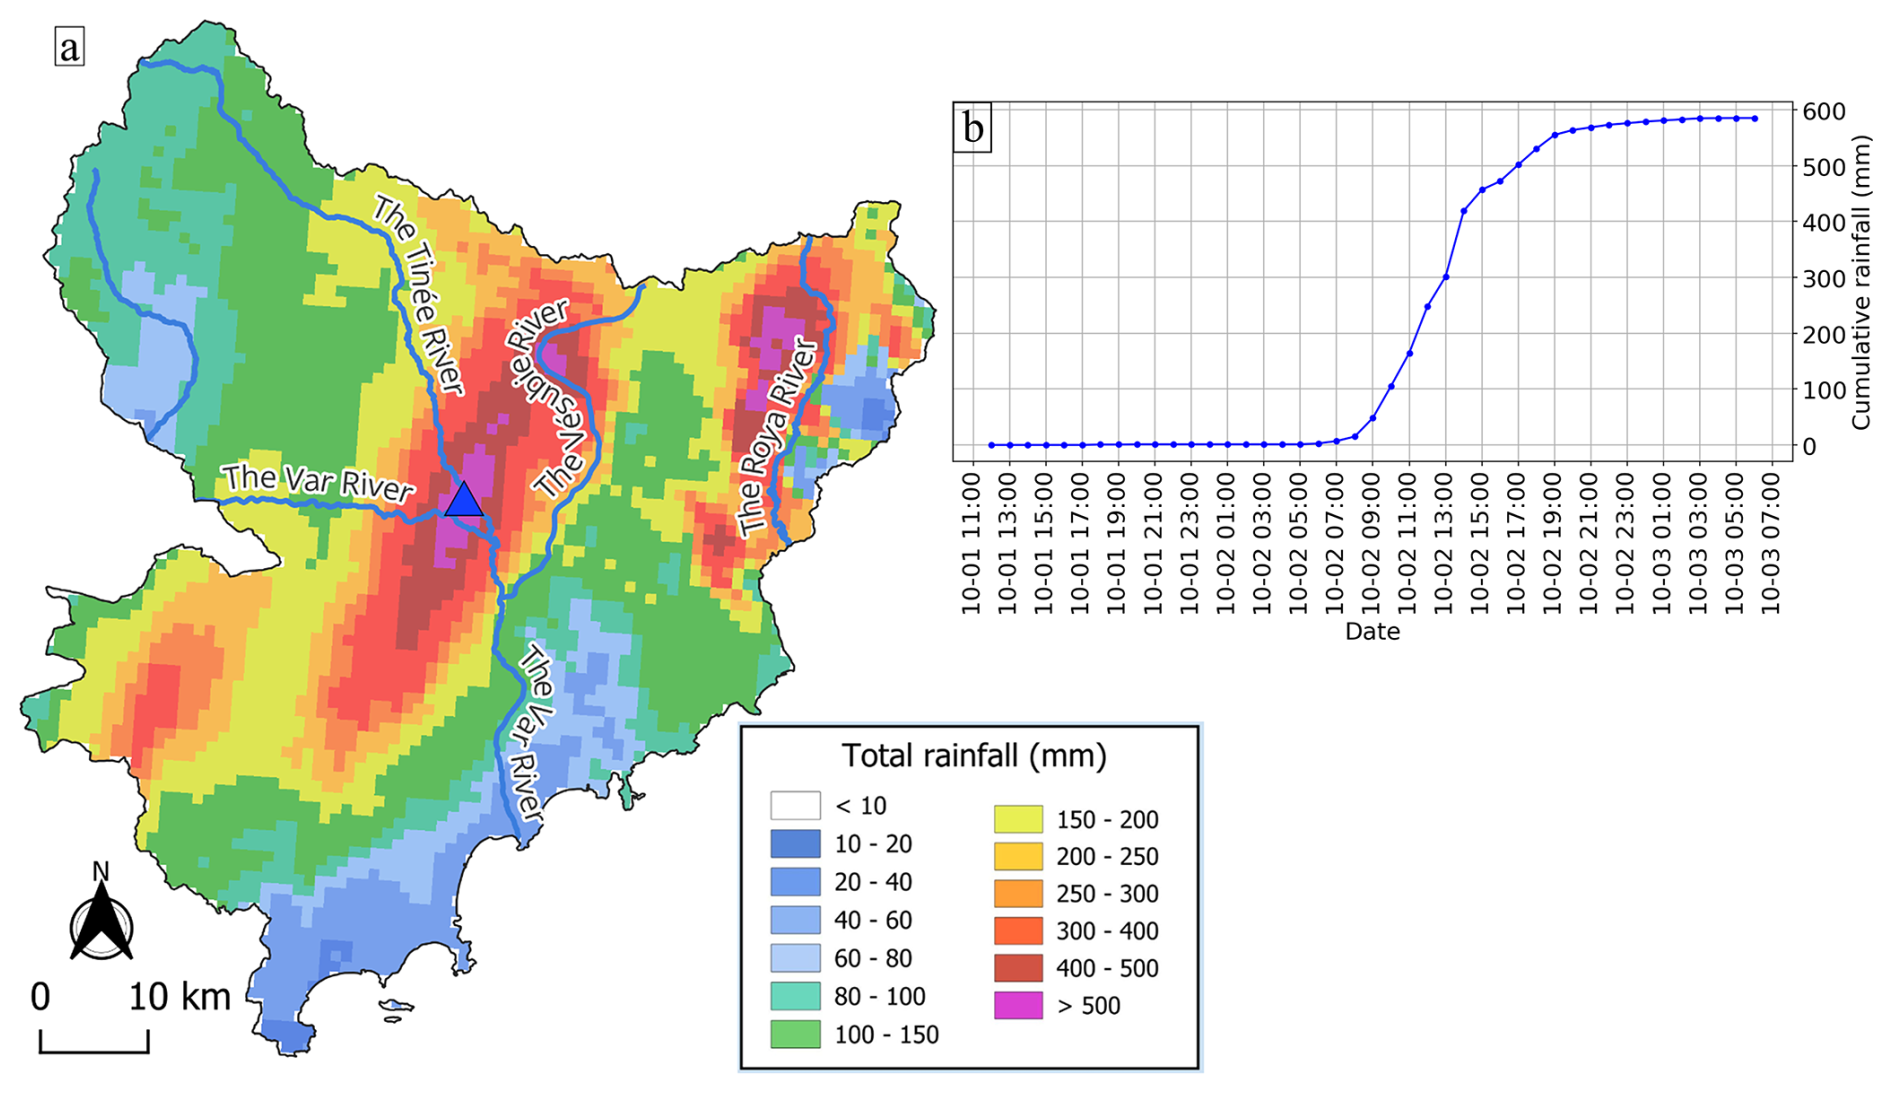
Figure 2Spatio-temporal description of Storm Alex. (a) Map of recorded rainfall accumulation during Storm Alex, from 1 October 2020, at 12:00 p.m. to 3 October 2020, at 06:00 a.m. (COMEPHORE data). The blue triangle represents the location of Tournefort municipality. (b) Accumulated rainfall over Tournefort municipality.
3.1 Meteorological data
Two meteorological datasets have been exploited for the computation of ED rainfall thresholds. Precipitation data derived from the COMEPHORE dataset are used to characterize rainfall events. COMEPHORE is a meteorological product provided by Météo-France, covering the metropolitan French territory (Tabary et al., 2012). It consists of hourly accumulated precipitation on a spatial grid of 1 × 1 km, resulting from the fusion of radar measurements and in situ observations from a rain gauge network. The data are available from 1 January 1997 at 06:00 a.m. to the present day.
The second used dataset, SIM (SAFRAN-ISBA-MODCOU), is a hydrometeorological reanalysis. It results from the combination of a meteorological model (SAFRAN), a land surface model (ISBA), and a hydrogeological model (MODCOU) (Habets et al., 2008). The dataset, also distributed by Météo-France, provides 25 climatic and hydrological variables at a daily time step and on a regular grid of 8 × 8 km. In this study, we used the temperature and potential and real evapotranspiration. Data are available from 2 August 1958 to the present day.
3.2 Predisposing factors
Eleven predisposing factors were analysed, including geological, topographical, and soil properties, all in raster format (see Fig. A1):
-
Lithology is obtained from the harmonized geological map of the Alpes-Maritimes region at 1:50 000 scale (Gonzalès, 2008). The 274 initial classes were grouped into 28 classes (Fig. A1a) based on prior knowledge about susceptibility of lithologies to landslides.
-
Land cover data come from the CORINE Land Cover Level 2 (2006 edition), a satellite-derived European product comprising 13 classes, with a spatial resolution of 25 m (Fig. A1b). The 2006 Corine Land Cover dataset was chosen as it best represents the mid-point of the study period covered by the landslide inventory (see Sect. 3.3), ensuring temporal consistency between land cover information and observed landslide occurrences.
-
A 25 m digital elevation model (DEM) from the 2023 edition of the BD ALTI® dataset (https://www.data.gouv.fr/datasets/bd-alti-r-1/, last access: 30 May 2024) was used to derive slope (Fig. A1c), Topographic Positional Index (TPI) (Fig. A1d), and aspect (Fig. A1e) using GDAL tools and a 3×3 pixel window in QGIS software.
-
Landform (Iwahashi and Pike) (Iwahashi and Pike, 2007) was derived from the DEM using the SAGA Terrain Surface Classification tool in QGIS, with 8 classes, a four-neighbour Laplacian filter, and a 10 pixels window (Fig. A1f).
-
Landform (Weiss) (Weiss, 2001) was derived from the DEM using the TPI Based Landform Classification tool in QGIS, and a bandwidth equal to 400 m, resulting in 10 classes (Fig. A1g). Note that, although the Weiss landform classification is derived from TPI values, the two metrics are complementary. TPI indicates the relative elevation of a given pixel, compared to neighboring pixels, thus capturing fine-scale variations. The Weiss landform integrates TPI over a larger scale, defined by the bandwidth parameter, to produce a categorical classification of larger-scale morphological patterns.
-
The general curvature (Fig. A1h) was also calculated from the DEM using the SAGA toolbox, applying the 9 parameters second-order polynomial method (Zevenbergen and Thorne, 1987).
-
Three rasters of soil texture, namely the percentages of clay (Fig. A1i), sand (Fig. A1j), and silt (Fig. A1k) in the upper 30 cm of soil, were used. These three products are available at national scale with a 90 m spatial resolution. They are obtained from a Random Forest algorithm calibrated with French soil samples from the 0–30 cm topsoil layer and using a set of environmental covariates such as terrain, climate, vegetation, geology, land use and satellite indices (Suleymanov et al., 2024).
The eleven rasters of predisposing factors were harmonized onto a common 25 m resolution grid using QGIS resampling tool, with the DEM as the reference.
3.3 Landslide inventory
3.3.1 General description
The landslide inventory used in this study builds upon previous mapping efforts (Lucas, 2023; Thiery, 2026). The initial inventory comprises 5383 rainfall-induced shallow landslides distributed across the study area. Riverbank landslides and landslides with a kilometric spatial accuracy were excluded because their occurrence is primarily governed by erosion rather than rainfall itself, and because their location is insufficiently precise for subsequent analysis, respectively. The inventory retained for the analysis therefore consists of 4692 landslides (Fig. 3a). This inventory covers a period of nearly 230 years, ranging from 1796 to 2024 (Fig. 3b). The monthly distribution reveals a seasonal trend in landslide occurrence, with the highest number of events recorded during the cold season (from October to January). This trend closely matches the mean monthly rainfall (Fig. 3c).
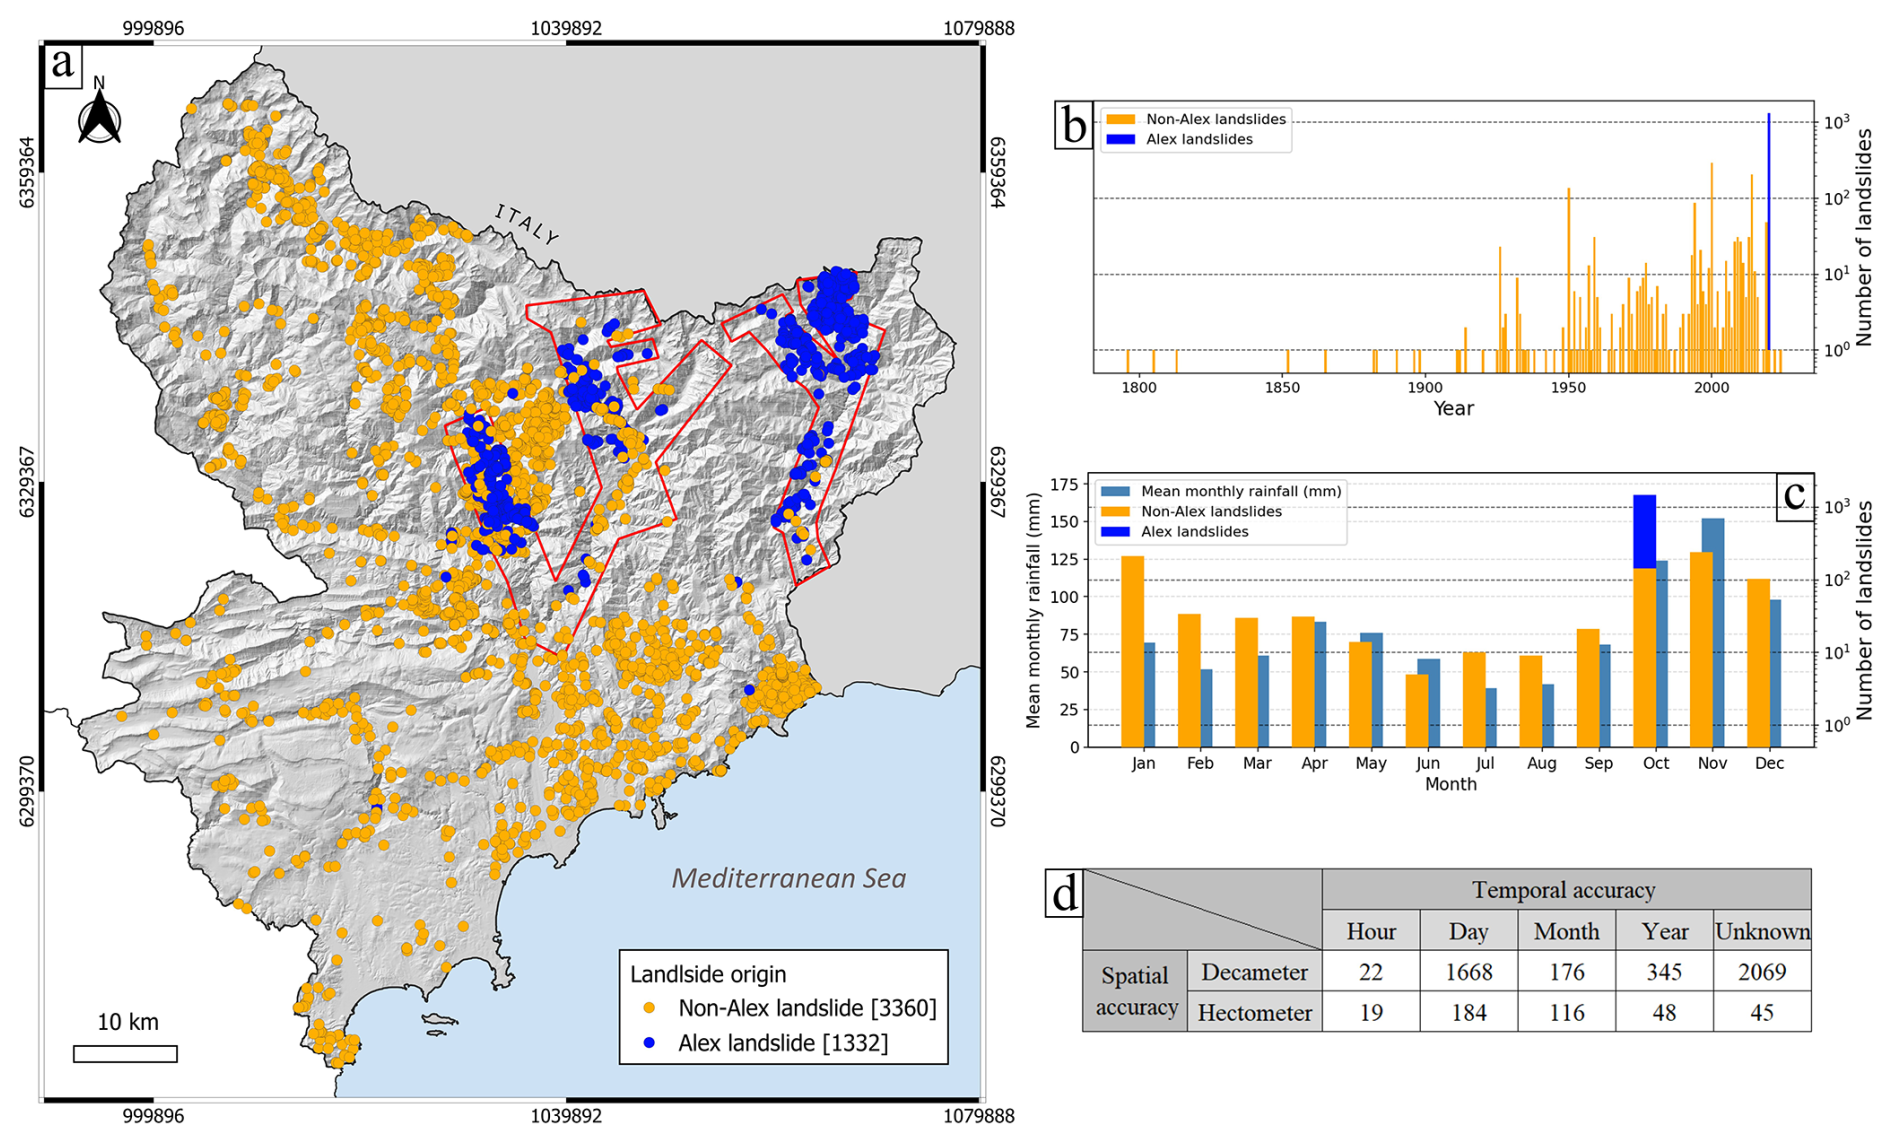
Figure 3Spatio-temporal characterization of the total landslide inventory across the study area. (a) Spatial distribution of Alex (blue), and non-Alex (orange) landslides. Red outlines indicate the area covered by the post-Alex ortho-express. (b) Annual distribution of the landslides. (c) Monthly distribution of the landslides (based on 2185 landslides) and mean monthly cumulative rainfall over the study area. (d) Spatial and temporal accuracy of the landslides.
In the inventory, 28 % of the landslides were taken from pre-existing databases, including those of the ONF-RTM service (Bisquert et al., 2025), of the French Geological Survey (https://www.georisques.gouv.fr/donnees/bases-de-donnees/base-de-donnees-mouvements-de-terrain, last access: 20 July 2024), of the CEREMA, of the municipality of Menton, of the Departmental Council of Alpes-Maritimes, and of the Regional Observatory for Major Risks (ORRM). In addition, a large number of landslides were added through diachronic analysis of orthophotographs controlled by field recognitions (71 %), and using oral testimonies (1 %). To ensure data quality and reliability, the inventory was rigorously checked to remove duplicates from different sources, non-superficial landslides, and anthropogenic landslides.
Landslides in the database were initially represented either as polygons (78 %) or points (22 %). Among the polygons, 62 % include an accurate delineation of the ablation zone (Lucas, 2023). To create a homogeneous database, all polygons were converted into points, using either the centroid of the entire polygon or, when available, the centroid of the ablation zone. The location of each landslide was verified using textual information from the database when available, further improving the spatial accuracy of the dataset (Fig. 3d). A landslide is described as decametric when its location is estimated with meter-scale accuracy, and hectometric when the accuracy is on the order of 100 m. The temporal accuracy of the landslides is also indicated in Fig. 3d. All the landslides with unknown temporal accuracy correspond to those reported from orthophotographs.
The shallow landslides of the inventory are categorized into three distinct types, based on textual information and orthophotographs. Cut-slope landslides (14.7 %) develop where the basal part of a slope has been artificially excavated, resulting in destabilization. This type of landslide is predominantly located along the road network. Midslope landslides (45.6 %) occur in the middle of slopes, in areas unaffected by artificial excavations or riverbank erosion. Lastly, flow-like landslides (38.9 %) are characterized by long-distance propagation. The remaining landslides (0.8 %) have an unknown type due to lack of textual information and poor spatial accuracy.
Among the 4692 landslides of the inventory, 1332 were directly associated with Storm Alex (Thiery, 2026). These landslides are mostly concentrated in the Vésubie, Tinée, and Roya valleys, due to two main causes: first, the strongest impact of the storm was located in these valleys (Fig. 2); and second, 97 % of Alex-induced landslides were identified through an orthophotograph acquired shortly after the storm, which was available only for these three valleys (post-Alex ortho-express; see Fig. 3a for delineation). Nearly all Storm Alex-induced landslides are dated to 2 or 3 October 2020 in the inventory, with only four landslides dated to 4, 7, and 8 October. To ensure that the complete rainfall associated with Storm Alex was taken into account, landslides initially dated to 2 October were reassigned to 3 October. In contrast, 68 % of non-Alex landslides were identified through orthophotograph comparison. Note that some non-Alex landslides detected using 2023 orthophotographs but outside of the ortho-express coverage could also have been triggered by the storm. However, due to the lack of accurate dating, these landslides have not been associated with Storm Alex.
3.3.2 Subsets used for rainfall thresholds, susceptibility and predisposing factor analysis
Three different subsets were extracted from the global inventory to carry out the different analyses. The subset used for the ED rainfall threshold analysis includes 1743 landslides with hourly to daily temporal accuracy, ensuring reliable comparison with the meteorological data, and decametric to hectometric spatial accuracy, suitable for matching with the 1 × 1 km resolution of the rainfall data grid. Only landslides dated after 1 January 1997 were considered, as meteorological data are only available after this date. In this subset, 1332 landslides are associated with Storm Alex (Fig. 4a).
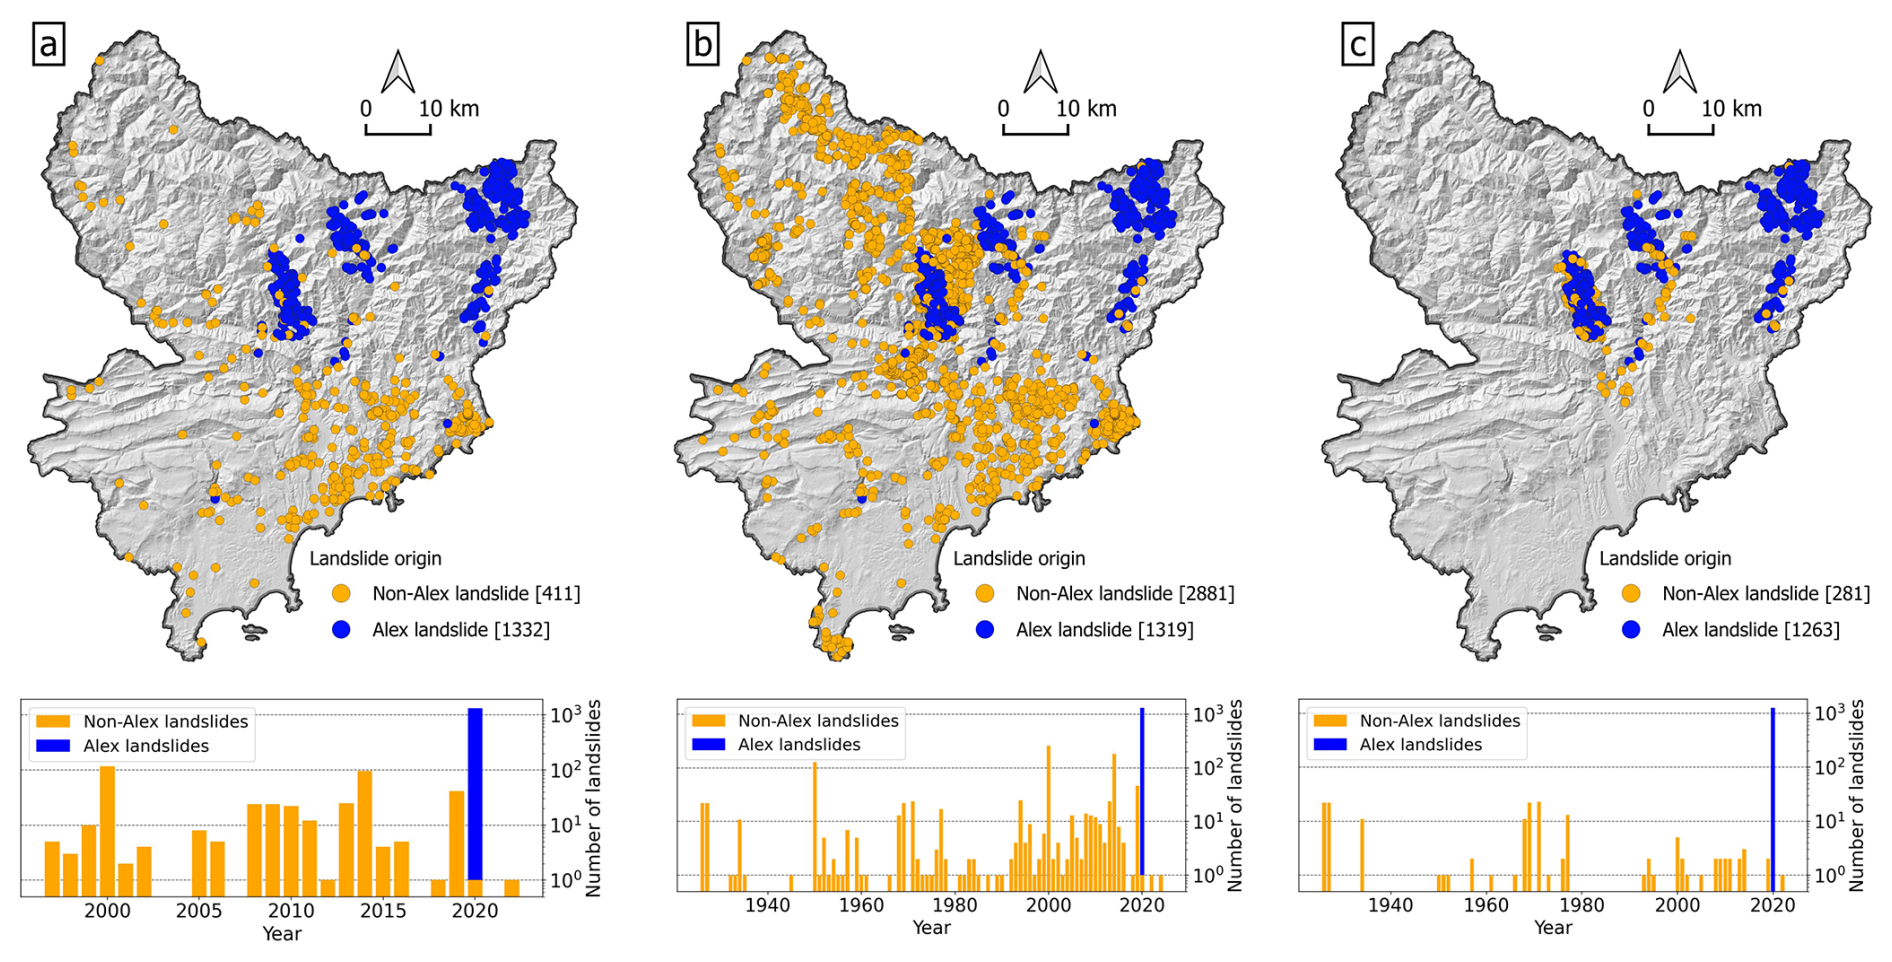
Figure 4Spatial and temporal distributions of landslide subsets used in the analyses. (a) Landslides used for ED rainfall threshold analysis; (b) landslides used for susceptibility analysis; (c) landslides used for comparing the distributions of predisposing factors. Blue points represent Alex landslides and orange points represent non-Alex landslides. The annual distribution corresponding to each subset is shown below the respective maps.
For the analysis of susceptibility, only landslides with decametric spatial accuracy were retained. For comparing the distributions of predisposing factors between Alex and non-Alex landslides, the selection was further restricted to landslides located within the area covered by the post-Alex ortho-express to avoid any bias. For both subsets, a small number of landslides (66 and 11, respectively) occurred on slopes less than 10°. These landslides were excluded, as their location was considered likely erroneous. The final subsets consist of 4200 landslides for the susceptibility assessment (of which 1319 were induced by Storm Alex) and 1544 landslides for the distribution analysis (of which 1263 were induced by Storm Alex) (Fig. 4b–c).
For clarity, Storm Alex-induced landslides are hereafter denoted Alex landslides, whereas non–Storm Alex-induced landslides are denoted non-Alex landslides. In every subset, datasets including Alex landslides are designated as WSAL (With Storm Alex Landslides), and those excluding Alex landslides are designated as WoSAL (Without Storm Alex Landslides).
As explained in the introduction, the main objective of this study is to compare rainfall thresholds and susceptibility maps constructed with and without the landslides triggered by Storm Alex. Cumulative/duration (ED) thresholds are computed based on COMEPHORE rainfall data. Landslide susceptibility is assessed using a Random Forest (RF) algorithm with the eleven predisposing factors described in Sect. 3.2.
4.1 ED rainfall thresholds
4.1.1 Determination of ED triggering conditions for landslides
The triggering conditions, namely cumulative rainfall (E) and rainfall duration (D), were determined for each landslide following the methodology implemented in the CTRL-T algorithm (Melillo et al., 2015, 2018). First, for each grid point of the COMEPHORE rainfall dataset, precipitation time series were segmented into rainfall events and sub-events, defined as periods of continuous rainfall separated by minimum dry intervals. During the warm season, the minimum dry interval was set to 48 h for rainfall events and 6 h for sub-events. During the cold season, these durations were multiplied by a factor R, defined as the ratio between warm-season and cold-season actual evapotranspiration. Following Barthélemy et al. (2024), the start (sws) and end (ews) of the warm season were estimated from the SIM climatic dataset and used to define the seasonal parameters applied to the COMEPHORE precipitation series. Across the study area, sws varies from February to June, whereas ews ranges from August to September depending on local climatic conditions. Accordingly, the local R factor ranges from 1 to 3.
Secondly, the time of occurrence of each landslide in the inventory is compared to rainfall events and sub-events of all COMEPHORE grid points located within a 1000 m radius around the landslide location. For daily-dated landslides, the hour of occurrence is arbitrarily fixed at 12:00 p.m. The MRC (Multiple Rainfall Conditions) dataset is constructed by aggregating, for each landslide, all the possible combinations of rainfall duration and cumulative rainfall in the 1000 m radius (including both rainfall events and sub-events). Next, each (E, D) pair of the MRC dataset is weighted according to the values of E and D, and to the distance between the grid point and the landslide. The algorithm selects, for each landslide, the (E, D) pair with the highest weight to create the MPRC (Most Probable Rainfall Conditions) dataset.
In this study, only the MPRC conditions provided by the CTRL-T algorithm were used, with one (E, D) pair retained for each landslide. Because intense rainfall events, particularly Storm Alex, triggered numerous landslides that occurred very close to each other in space and time, several landslides were associated with identical (E, D) pairs. To avoid over-representation of these duplicated rainfall conditions in the threshold estimation, landslides linked to the same grid point and occurring on the same date were grouped together. This aggregating procedure reduced the imbalance induced by highly concentrated events such as Storm Alex, resulting in a statistically more robust dataset.
The CTRL-T algorithm was not used to derive rainfall thresholds directly, although this algorithm was originally designed for this purpose. Instead, rainfall thresholds were estimated by applying quantile regression to the aggregated MPRC dataset. This choice is motivated by limitations of the frequentist framework implemented in CTRL-T, which assumes that the residuals of the least-squares fit follow a Gaussian distribution. This assumption was not satisfied in our dataset. Residuals computed without including Alex displayed an approximately Gaussian distribution (Fig. A2a), whereas the inclusion of Alex resulted in a clearly bimodal residual distribution (Fig. A2b). Consequently, the frequentist framework implemented in CTRL-T could not be reliably applied to our dataset.
4.1.2 Computation of ED rainfall threshold using Quantile Regression
Quantile Regression (QR) is widely used for estimating regional rainfall thresholds. This method does not assume normally distributed residuals, which is advantageous when inventories include events triggered under highly heterogeneous rainfall regimes. In this study, QR was implemented on aggregated MPRC datasets using QuantileRegressor from the sklearn.linear_model module in Python.
In practice, quantile regression minimizes the so-called pinball loss function, which assigns different penalties to overestimation and underestimation depending on the selected quantile. For low quantiles, larger penalties are applied to negative residuals, allowing the fitted curve to represent a lower boundary of the rainfall conditions associated with landslide initiation. In this study, the 5 % quantile was considered, a value commonly used in operational landslide early warning systems to define conservative rainfall thresholds (Marra, 2019; Peres and Cancelliere, 2021). To assess the uncertainty associated with the estimated thresholds, a bootstrap resampling procedure with replacement was performed using 200 repetitions. The resulting rainfall threshold relationship is then expressed as:
with E the cumulative rainfall (in mm) of the rainfall event, D its duration (in h), α a scaling parameter and γ the shape parameter. The parameters Δα and Δγ represent the uncertainties on α and γ, respectively.
4.2 Susceptibility assessment
Assessing landslide susceptibility requires accounting for complex interactions between topographical and geomorphological factors. In this study, a Random Forest (RF) method (Breiman, 2001) was selected for its robustness and its ability to capture nonlinear relationships between diverse variables (called features), while maintaining high predictive accuracy (Chen et al., 2017; Ng et al., 2021; Trigila et al., 2015). RF is generally less prone to overfitting than other machine learning algorithms (Breiman, 2001). Overfitting happens when a model is too closely adapted to the training data, and performs poorly on new data. RF also allows the assessment of features importance, which in our case can provide useful insight into the main factors controlling landslide occurrence. The suitability of RF for landslide susceptibility mapping is demonstrated by its widespread use in previous studies (Catani et al., 2013; Taalab et al., 2018; Sun et al., 2020; Li et al., 2022; Nocentini et al., 2024).
4.2.1 Random Forest algorithm
RF is a supervised learning algorithm, based on the bagging (Bootstrap Aggregating) principle: multiple independent decision trees are created and their predictions are combined to indicate a final result. Each tree is built by randomly selecting subsets of features (i.e., the predisposing factors in our case) and observations (i.e. landslides and non-landslides). At each division point (node) of a tree, the algorithm chooses the best split among these subsets to separate the data. This double random selection increases the diversity of trees and reduces overfitting.
Here, the output of each tree is the occurrence or not of a landslide. For a classification problem, the final prediction corresponds to the majority class predicted by all the trees. In this study, the proportion of trees that predicted the positive class (i.e. landslide occurrence) is considered as a susceptibility score. It is important to realize that this score does not represent an absolute probability of landslide occurrence. It should rather be regarded as a relative index of similarity between the predisposing factors at a given pixel on the map and those observed for landslides in the inventory.
4.2.2 Non-landslide sampling
In the context of supervised landslide susceptibility mapping, the selection of non-landslide samples is a crucial step that can strongly influence model performance and final results (Fu et al., 2025). In particular, it controls the statistical contrast between landslide and non-landslide conditions used to train the RF model. Sampling strategies that preferentially select non-landslide locations in clearly stable areas may increase class separability and produce more contrasted susceptibility patterns. In contrast, sampling designs that rely on a broader or less constrained selection of non-landslide locations may include areas close to past landslide locations.
A commonly adopted approach in landslide susceptibility studies is to generate non-landslide points outside a buffer zone around known landslides (Gu et al., 2023, 2024). Building on this principle, and aiming to capture the geomorphological variability of the study area without imposing deterministic assumptions on terrain stability, we adopted a random sampling approach within a spatially constrained domain. This domain was designed to ensure comparable reporting conditions and reduce potential bias. Specifically, it was defined as a 1 km buffer around major roads, while excluding areas located within a 150 m radius of recorded landslides (Fig. A3). This design reduces potential reporting bias, as landslides occurring near infrastructures are more likely to be documented.
Within this constrained domain, non-landslide points were generated using random sampling. To account for variability in non-landslide selection, 50 distinct non-landslide datasets were generated for each scenario (i.e., with and without Alex landslides), keeping landslide points fixed while randomly generating non-landslide points within the valid domain. A balanced 1:1 ratio between landslide and non-landslide points was maintained to avoid class imbalance.
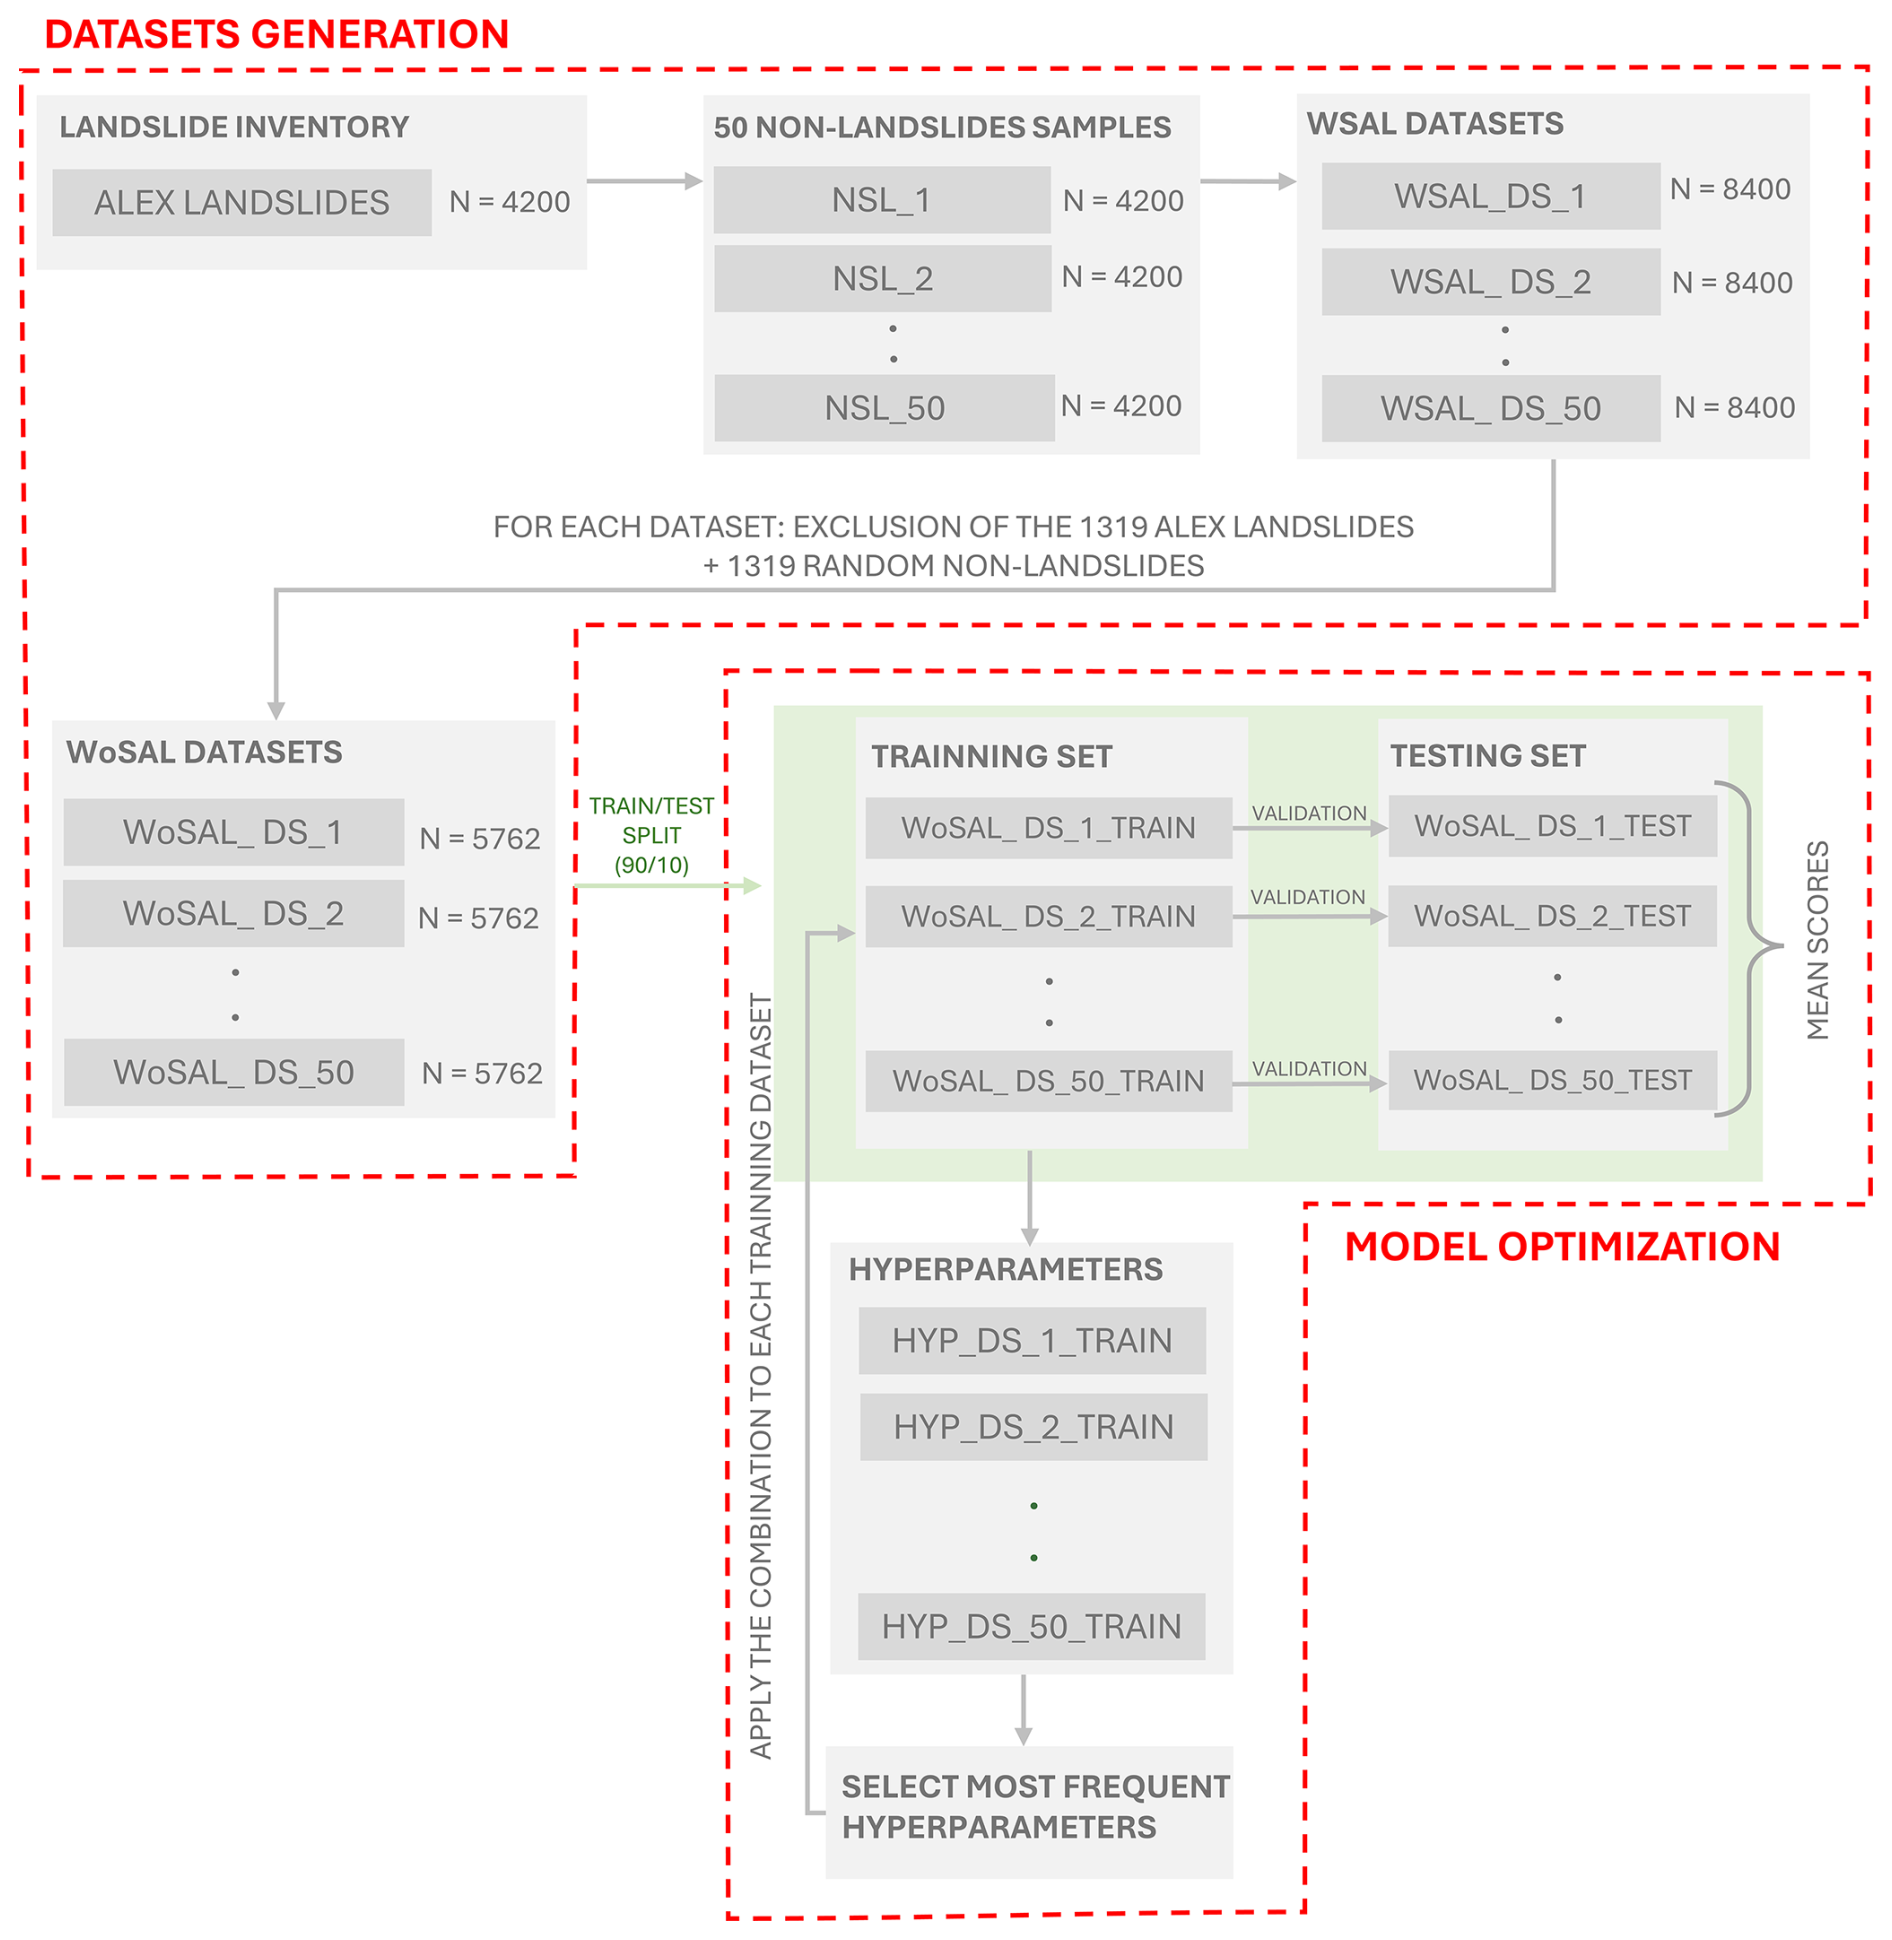
Non-landslide points were first generated for the WSAL dataset (i.e. including Alex landslides). Each dataset therefore includes 4200 landslide points and 4200 non-landslide points. To generate the corresponding WoSAL datasets (i.e. excluding Alex landslides), we started from the WSAL datasets. In each dataset, the 1319 Alex landslides were removed, and an equal number of non-landslide points was randomly excluded. This approach avoids regenerating non-landslide points, which could otherwise introduce spatial inconsistencies, and ensures maximum comparability between WSAL and WoSAL datasets. The full procedure is summarized in Fig. 5.
4.2.3 Random Forest optimization
Categorical features (lithology, landcover, and both landforms) were encoded using a One Hot Encoder. Hyperparameter optimization was performed on the WoSAL datasets using exhaustive GridSearch with five-fold cross-validation (GridSearchCV) on 90 % of each of the 50 datasets. These 90 % training sets were constructed so that landslide points remained identical across all datasets, and each set maintained a balanced 1:1 ratio of landslide to non-landslide points.
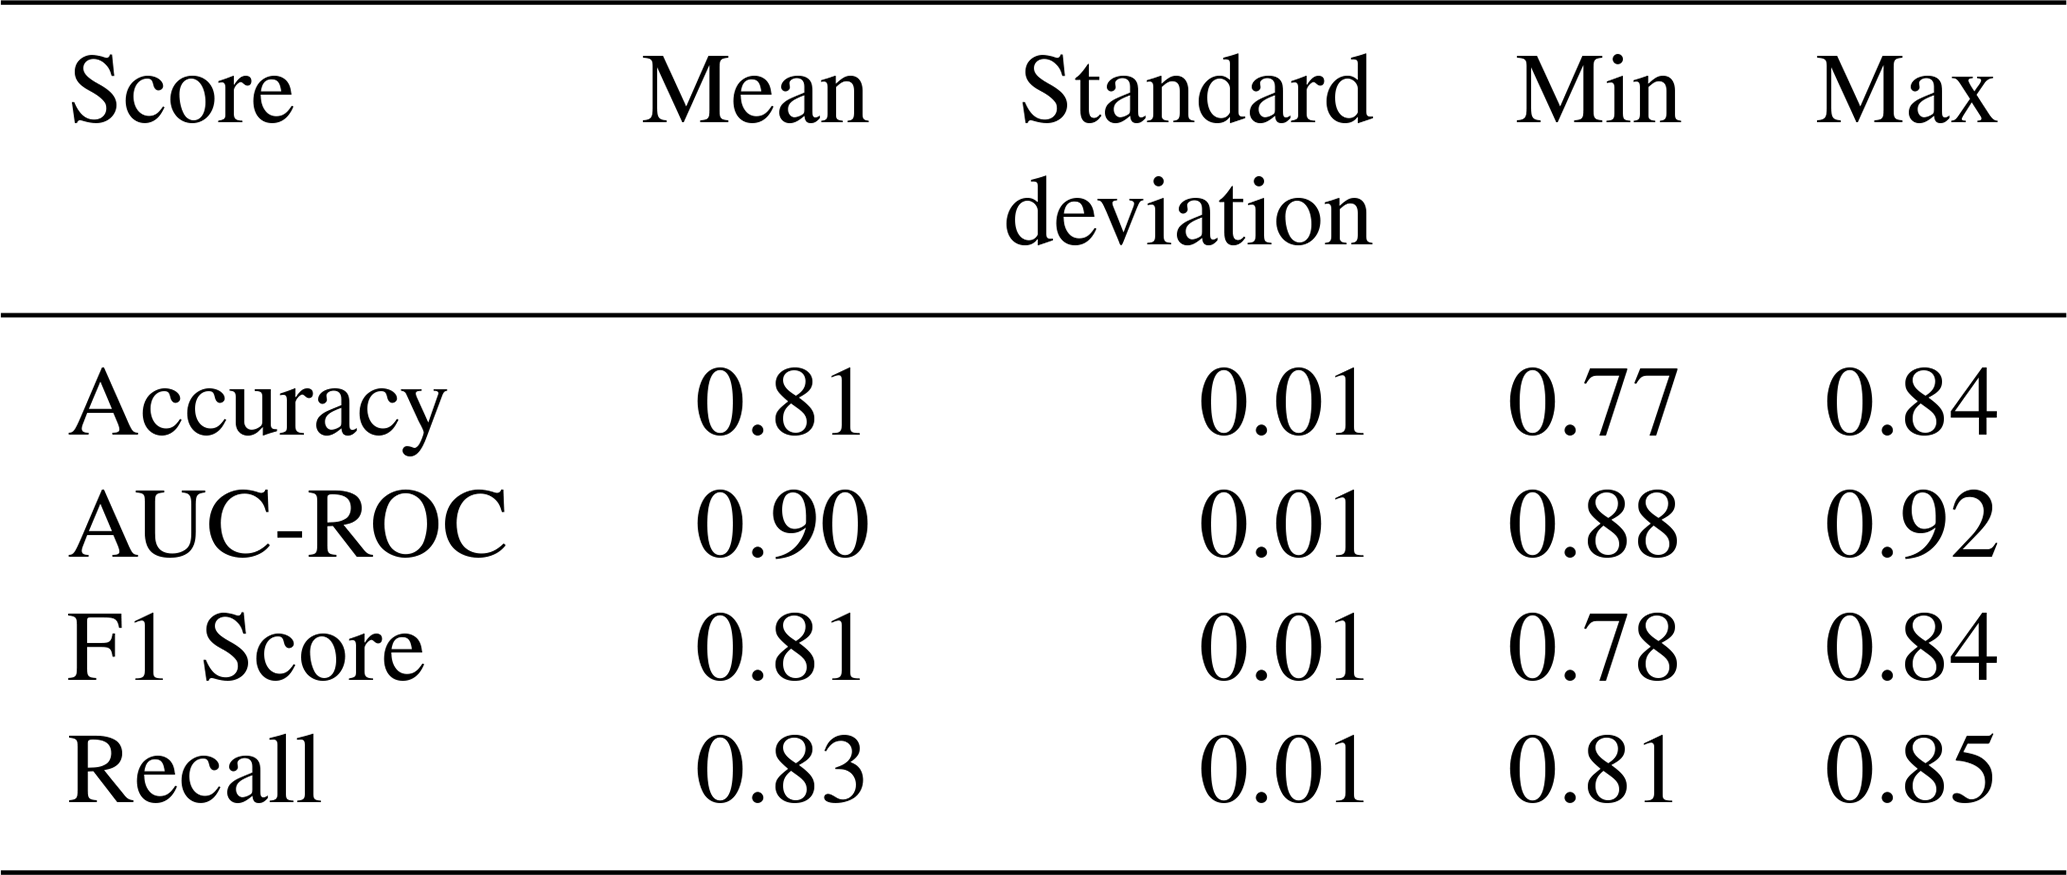
The GridSearchCV procedure explores a predefined grid of hyperparameters, summarized in Table 1, and retains the combination with the highest average accuracy score over the five folds. For each of the 50 datasets, an independent GridSearchCV was conducted, leading to 50 distinct optimal combinations. The most frequently selected combination was then applied to each training dataset to fit the model, which was subsequently validated on the corresponding 10 % validation sets. The final selected combination, which was selected 27 times, is indicated in Table 1. The workflow of model optimization is presented on Fig. 5. The mean performance scores over the 50 datasets, including accuracy, area under the ROC curve (AUC-ROC), F1 score, and recall, with their corresponding standard deviations, minimum and maximum values are presented in Table 2. Overall, these scores indicate that the model performs well across all datasets.
Table 1Hyperparameter tested during GridSearchCV. Final selected values are in bold.

Table 2Mean performance metrics of the model across the 50 datasets, including accuracy, AUC-ROC, F1 score, and recall, along with their standard deviations, minimum and maximum values.
4.2.4 Mean susceptibility maps
Once the optimal combination of hyperparameters is identified and validated, a Random Forest was retrained on each complete dataset, in order to fully exploit all available information. This step was carried out on the 50 datasets for each scenario. For every trained model, a susceptibility map was generated. The susceptibility values assigned to each pixel correspond to the proportion of trees predicting a landslide occurrence. To integrate the variability related to the random selection of non-landslides points, the final map for each scenario is calculated as the average of the 50 individual maps. We checked that 50 non-landslides scenarios are sufficient to obtain a converged standard deviation among the individual maps. The spatial resolution of the final susceptibility maps is 25 m, i.e., the same as the rasters of predisposing factors.
4.2.5 Permutation importances
Permutation importance is used to assess the relative influence of each feature on the predictions of the RF model. The principle consists in measuring the performance decrease when the values of a given feature are randomly shuffled. In practice, the accuracy of the model is first calculated on a test set (Altmann et al., 2010). The values of a given feature are then shuffled in the test set and the accuracy is recalculated. This process is repeated for all the features, once at a time. A larger decrease in accuracy indicates that the feature is more important for predictions. In this study, the use of One Hot encoding generated many binary variables from the same categorical feature, making it difficult to interpret the importance of individual features. To address this issue, a grouped permutation importance was applied, where all variables derived from the same original feature are permuted simultaneously. For the importance analysis, each dataset was split into 80 % training and 20 % test sets. This procedure was performed for all 50 datasets in both the WSAL and WoSAL datasets. For each split, the permutation importance of each feature group was calculated over 20 repetitions, and the reported importance values correspond to the averages across these 20 repetitions and the 50 datasets.
5.1 ED thresholds
The ED rainfall thresholds derived from the aggregated MPRCs (Most Probable Rainfall Conditions) are presented in Fig. 6. Both thresholds are based on a 5 % quantile regression: the black threshold is based on the WSAL dataset (i.e. including Alex landslides), while the orange threshold is based on the WoSAL dataset (i.e. excluding Alex landslides). The associated uncertainties, estimated through the bootstrapping approach, are shown in light grey and orange for the WSAL and WoSAL thresholds, respectively.
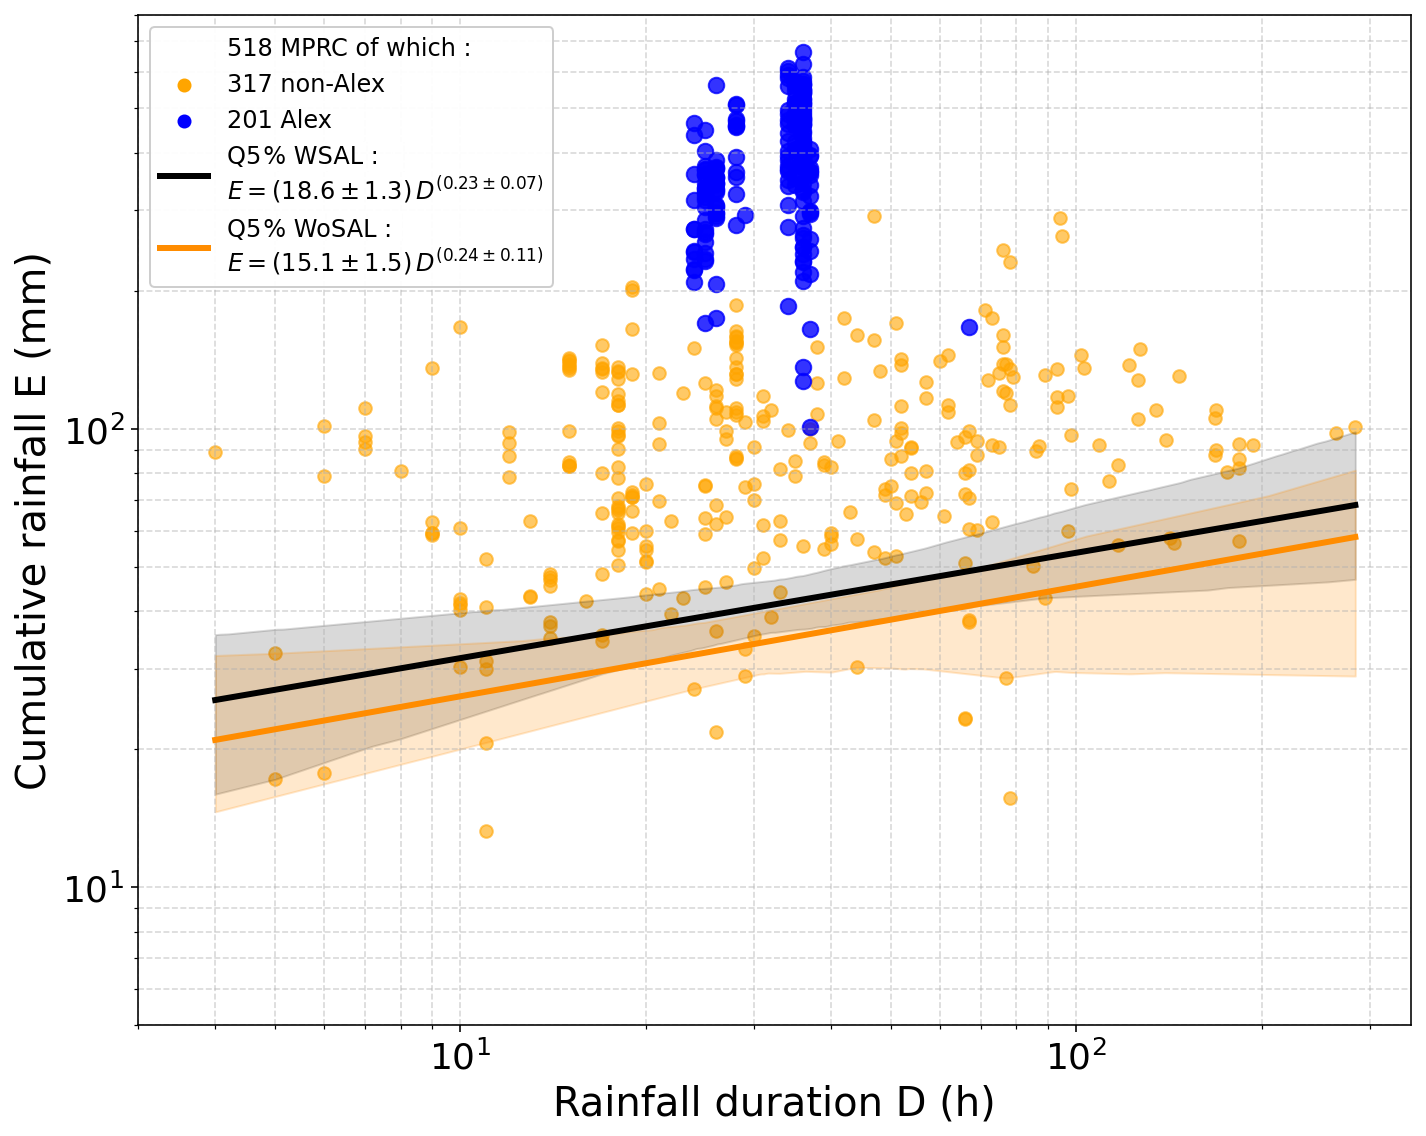
Figure 6ED thresholds calculated from aggregated MPRC conditions (Most Probable Rainfall Conditions). The x-axis represents the duration (h) of the rainfall from the beginning of the rainfall event until the occurrence of the landslide, and the y-axis represents the corresponding amount of rainfall (mm), both in log-log scales. Blue points are associated with Alex landslides while orange points represent non-Alex landslides. The threshold computed from the WSAL and WoSAL datasets are represented in black and orange, respectively. The light grey and orange shaded areas indicate the associated uncertainties.
Each point on the plot represents a unique rainfall condition (E, D) associated with one or more landslides. During the process of MPRCs estimation, all of the 1332 Alex landslides initially present in Fig. 4a could be associated with a rainfall event, except for two that occurred on 7 and 8 October (hence several days after the storm), for which no rainfall was recorded. Among the 411 non-Alex landslides initially present in the subset, only 365 were used for the threshold computation. The 46 excluded landslides were omitted either because they occurred more than 48 h after the end of the reconstructed rainfall event or because the cumulative rainfall was less than 10 mm. These exclusion criteria are directly implemented in the CTRL-T algorithm. The following step consisting in aggregating reconstructed MPRCs of landslides sharing identical rainfall characteristics and occurrence date results in a final set of 518 MPRCs, of which 317 are associated to non-Alex landslides and 201 to Alex landslides.
Non-Alex landslides are widely distributed, with rainfall durations ranging from 4 to 284 h and cumulative rainfall ranging from 13.3 to 289 mm. However, most of the points are concentrated between durations of 10 to 100 h and cumulative rainfall of 30 to 150 mm. In contrast, the majority of Alex landslides are associated with shorter rainfall durations, ranging from 24 to 37 h, but with substantially higher cumulative rainfall, from 101 to 663 mm, reflecting the brief and intense character of Storm Alex. One Alex landslide is outside of this window, with duration of 67 h and rainfall amount of 166 mm. This landslide occurred on 4 October after a minor secondary rainfall period still associated with Storm Alex.
When examining Alex landslides in more detail, two distinct vertical groups appear in the plot: a first group characterized by durations between 24 and 29 h, and a second group with durations between 34 and 39 h. This separation does not reflect a temporal variability in landslide occurrence, since all of these landslides are dated from 3 October, but rather results from the spatial pattern of the Storm Alex. Shorter durations correspond to peripheral areas of the storm, where rainfall intensity and persistence were lower, whereas longer durations occurred mainly in areas affected by the core of the storm, where precipitation was more sustained and intense.
The WSAL threshold is approximately 1.2 times higher than the WoSAL threshold. However, both power-law relationships exhibit close exponents, and largely overlapping uncertainty ranges, indicating that the inclusion of the Alex-induced landslides only marginally modifies the regional ED threshold. A total of 28 landslides fall below the WSAL threshold, all of them corresponding to non-Alex landslides and representing 5.4 % of the landslides used to compute this threshold. In contrast, 16 landslides fall below the WoSAL threshold, corresponding to 5 % of the landslides used for its computation.
Recall that the default hour of occurrence of landslides is set at 12:00 in the CTRL-T algorithm. This simplification may affect the estimation of the rainfall conditions associated with each event, particularly for short-duration or high-intensity rainfall, where the timing of the triggering rainfall relative to the landslide occurrence can significantly affect the calculated event duration and cumulative rainfall. To assess the influence of this arbitrary timing, sensitivity tests were performed by changing the assumed landslide occurrence time (00:00, 06:00, 12:00, 18:00, and 23:00) (Fig. A4). This resulted in noticeable changes in the obtained thresholds. However, in all cases, the threshold including the Alex landslides remained higher than the threshold computed without them, by a factor of 1.1 to 1.5.
5.2 Predisposing factors
5.2.1 Permutation importances
Feature importances in the RF model are presented in Fig. 7. For the WoSAL datasets (Fig. 7a), the most influential features are slope and clay content (0–30 cm), followed by landform classification according to Iwahashi and Pike, and lithology. These four factors are largely dominant, while other features such as aspect, silt content (0–30 cm), and land cover have intermediate importance. The three lowest-ranked features (landform Weiss, TPI, curvature) form a distinct group clearly separated from the others.
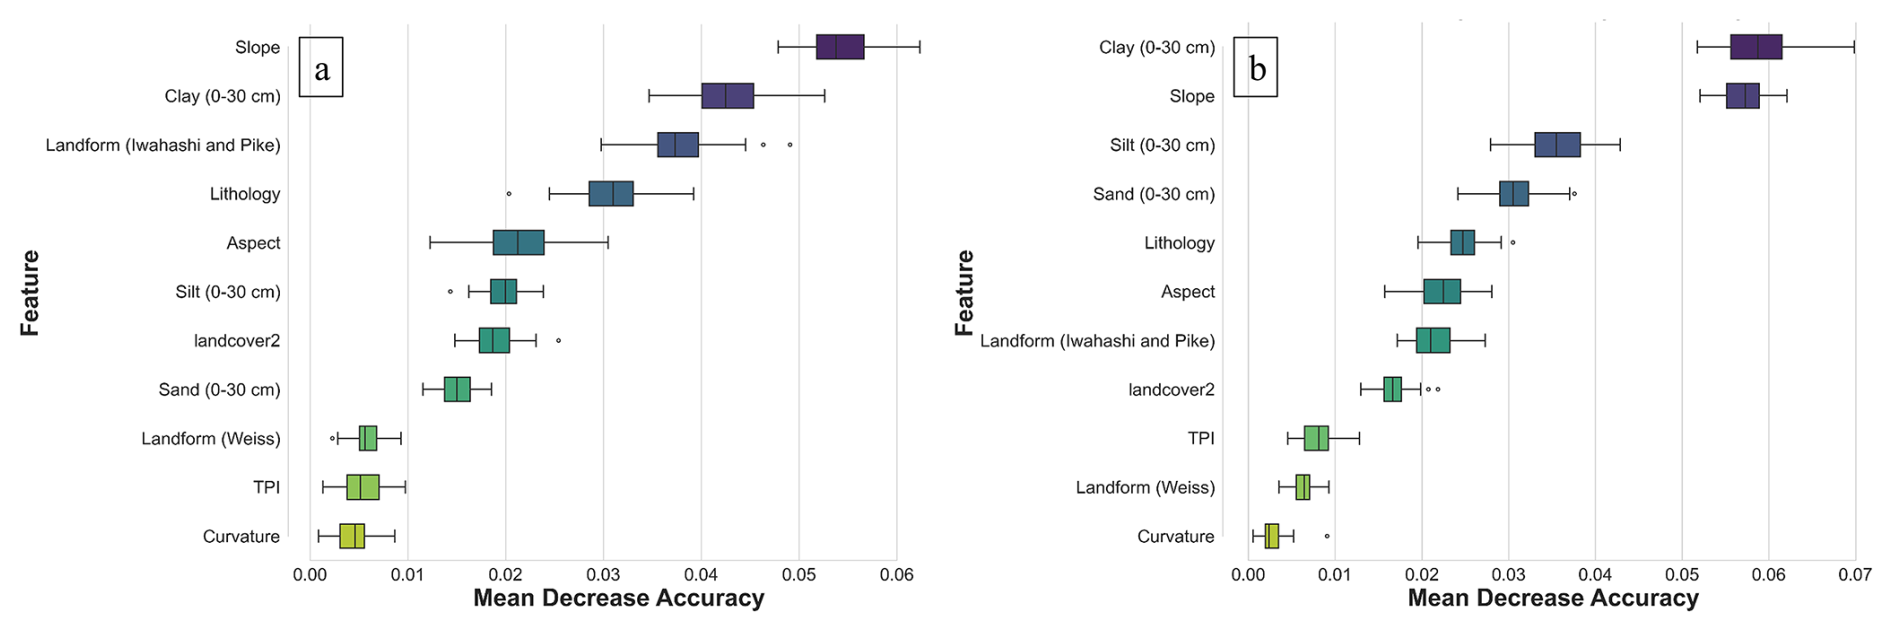
Figure 7Permutation importances obtained for the predisposing factors (a) with the WoSAL datasets (b) with the WSAL datasets.
In contrast, for the WSAL datasets (Fig. 7b), clay content (0–30 cm) becomes the most influential feature, followed very closely by slope. Silt and sand content over 0–30 cm gain in importance compared to the WoSAL case and are placed just behind. Lithology still makes a significant contribution. The importance of landform according to Iwahashi and Pike markedly decreases, falling to the seventh place. Similarly to the WoSAL dataset, landform (Weiss), TPI and curvature remain the least influential features.
5.2.2 Comparative analysis of slope, clay content and lithology
As shown in Fig. 7, slope, clay content and lithology are among the most influential factors indicated by the RF for landslide initiation in our study area (Reichenbach et al., 2018; Xu et al., 2012). The distributions of these three factors for Alex and non-Alex landslides are compared in Fig. 8, using landslides that occurred in the post-Alex ortho-express zone (Fig. 4c).
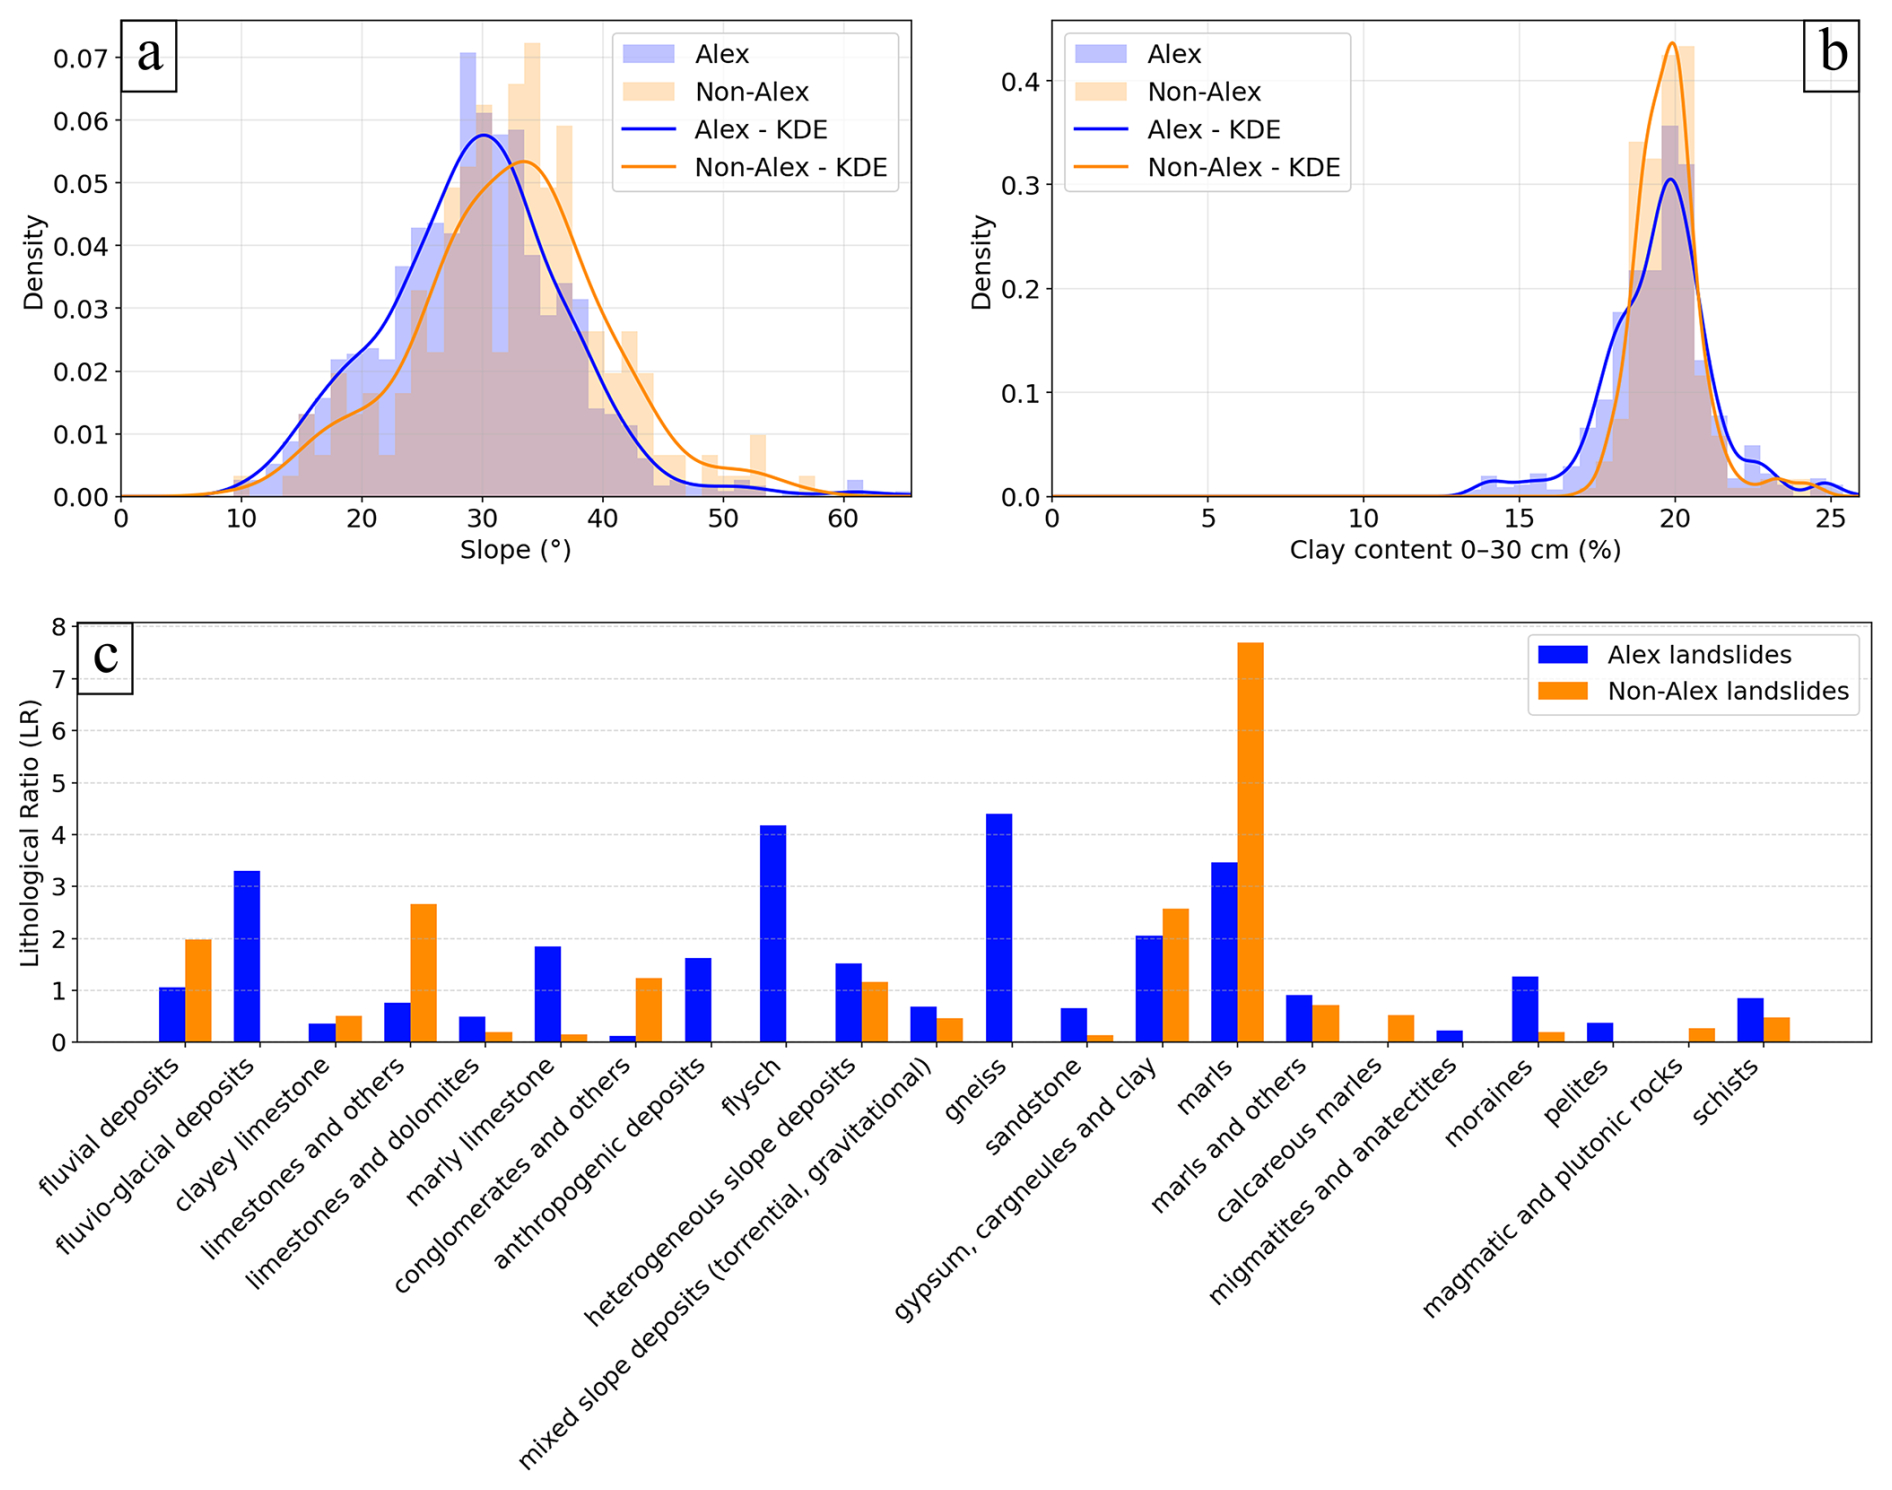
Figure 8Distribution of (a) slope angles (°) and (b) clay content (%) represented by density-normalized histograms and kernel density estimation (KDE) curves for Alex landslides (blue) and non-Alex landslides (orange). (c) Comparison of lithological ratios (LR) between Alex and non-Alex landslides. LR indicates how frequently landslides occurred in each lithological class relative to the surface coverage of that class within the post-Alex ortho-express area. Blue bars correspond to Alex landslides, whereas orange bars represent non-Alex landslides.
The distributions of slope angle for Alex and non-Alex landslides show a unimodal shape, with most landslides occurring between 20 and 40° (Fig. 8a). The distribution of Alex landslides appears slightly shifted towards lower values, with an average slope of 30°. In contrast, non-Alex landslides show a slightly higher average slope of 32°. Approximately 52 % of Alex landslides occurred on slopes below 30°, compared to 44 % for non-Alex landslides. Both distributions show a marked decrease for slope angles higher than 45°, even more pronounced for Alex landslides.
Figure 8b shows the distribution of clay content (%) in the upper 0–30 cm of the soil for Alex and non-Alex landslides. Both distributions are centered around 20 %. However, non-Alex landslides exhibit a higher peak at this value. In contrast, Alex landslides more frequently affect areas with lower clay content, with approximately 10 % of Alex landslides occurring in soils with clay content below 18 %, compared to only about 2 % for non-Alex landslides. This indicates that a significant proportion of Alex landslides were triggered in less clay-rich terrains.
Figure 8c presents the lithological ratios (LR) calculated for both Alex and non-Alex landslides. For each lithological class, this ratio corresponds to the proportion of landslides in that class, normalized by the surface proportion of the class within the post-Alex ortho-express zone. For non-Alex landslides, the marls lithology stands out with a much higher ratio (LR = 7.7) than other classes. Five lithologies exhibit moderate LR ratios, ranging from 2.7 to 1.2: limestone and others, gypsum, cargneules and clay, fluvial deposits, conglomerates and others, and heterogeneous slope deposits. The eleven other lithologies show low ratios (LR < 1). In contrast, Alex landslides exhibit a different lithological distribution. Four lithologies are predominant: gneiss, flysch, marls, and fluvio-glacial deposits (LR between 3.3 and 4.4). The lithologies gypsum, cargneules and clay, marly limestone, anthropogenic deposits, heterogeneous slope deposits, moraines, and fluvial deposits show intermediate LR ratios, ranging from 2.0 to 1.1. Finally, the eleven remaining lithologies have LR ratios below 1, including limestone and others which shows a higher LR ratio for non-Alex landslides.
The above analysis highlights clear disparities between Alex landslides, triggered by a millennial return period rainfall event, and non-Alex landslides, caused by less intense precipitation events. The results indicate that Alex landslides occurred on slightly gentler slopes than non-Alex landslides. In terms of soil texture, Alex landslides more frequently affected areas with lower clay content. Also, while some lithologies show similar low involvement in both groups, most lithological classes responded differently to Storm Alex. In particular, some lithological classes were mobilized exclusively during Storm Alex, including fluvio-glacial deposits, anthropogenic deposits, flysch, and gneiss. Conversely, magmatic and plutonic rocks, and calcareous marls exclusively appear for non-Alex landslides. Overall, this lithological analysis suggests that lithologies may respond differently depending on the intensity of the triggering rainfall events.
5.2.3 Landslide susceptibility maps
Figure 9a and b show the mean susceptibility maps calculated from the WoSAL and WSAL datasets, respectively. The susceptibility values are discretized into six classes to facilitate comparison. Both maps exhibit strong spatial variability. Lower values (≤0.1) are typically found in the plains, while higher values occur predominantly in areas of pronounced relief located in the northern part of the area. The highest susceptibility values (>0.9) are found in the municipality of Menton on both maps, as shown in the zoomed areas in Fig. 9c and d. This observation reflects the large number of landslides recorded in this municipality (see also Fig. 11c).
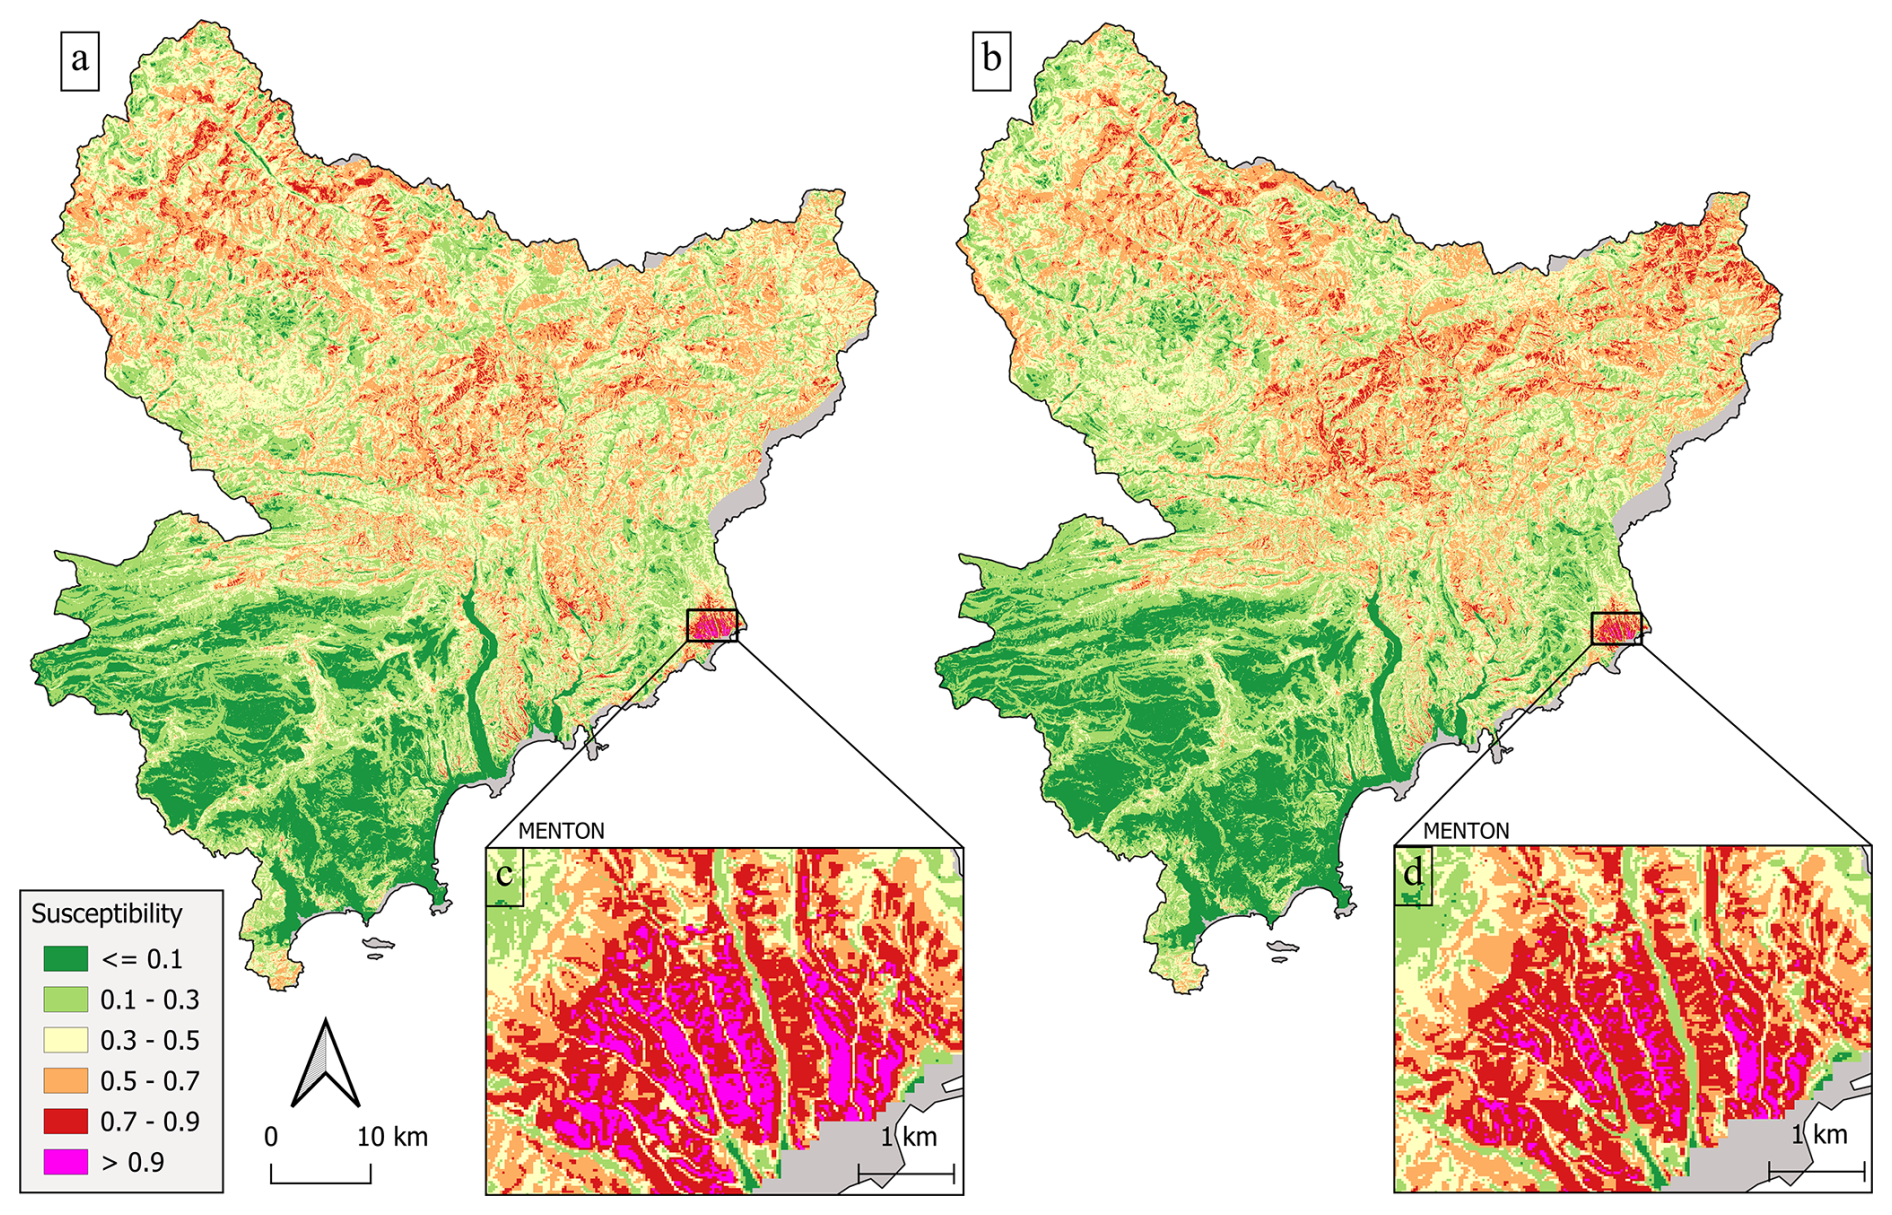
Figure 9Susceptibility maps computed from (a) the WoSAL dataset, and (b) the WSAL dataset. Insets (c) and (d) show close-ups on the municipality of Menton.
The statistical distribution of susceptibility values for both maps is presented on Fig. 10. Overall, both distributions show similar shapes. In both cases, a prominent peak appears near 0, indicating a high number of pixels with very low susceptibility values. Overall, pixels with susceptibility below 0.2 account for 27 % and 31 % of the total in the WoSAL and WSAL maps, respectively. A secondary peak in the distribution appears around 0.4, slightly more pronounced in the WoSAL distribution. Overall, 62 % and 57 % of pixels fall within the 0.2–0.6 range for the WoSAL and WSAL maps, respectively. For values above 0.6, the two maps differ only marginally, with 11 % and 12 % of pixels exceeding this threshold in the WoSAL and WSAL maps, respectively. Above 0.4, both distributions show a marked decline. Susceptibility values above 0.8 are extremely rare: less than 0.3 % of pixels exceed this value in both maps.
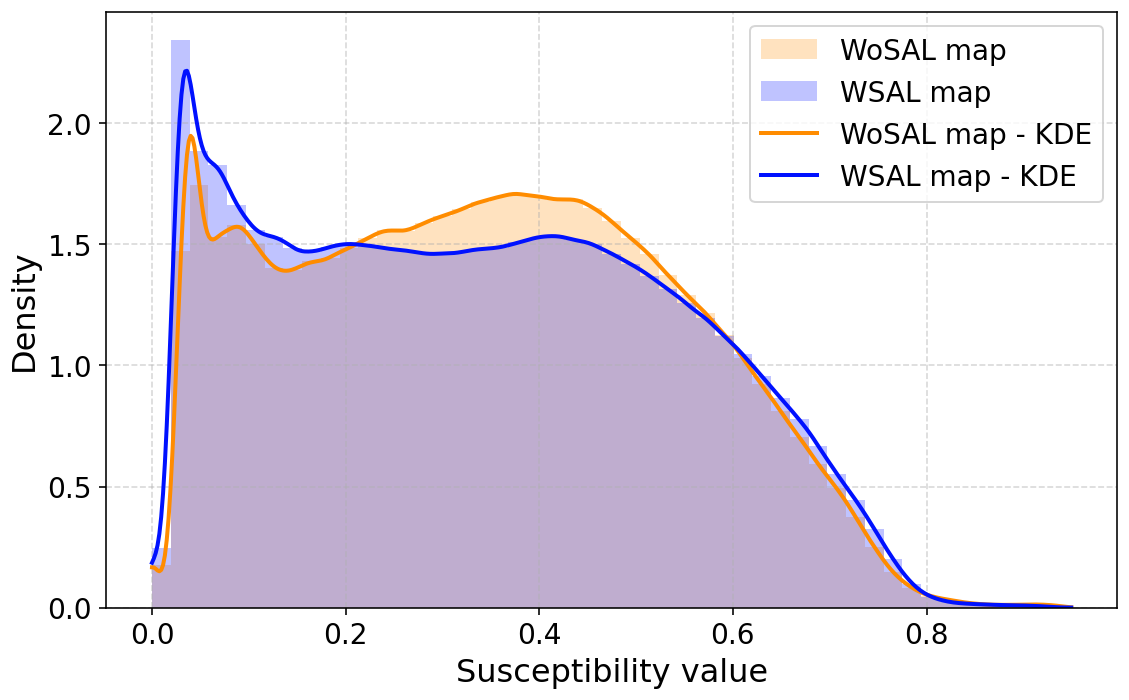
Figure 10Kernel density estimation (KDE) of the distributions of susceptibility values for all pixels in the WSAL (blue) and WoSAL (orange) maps.
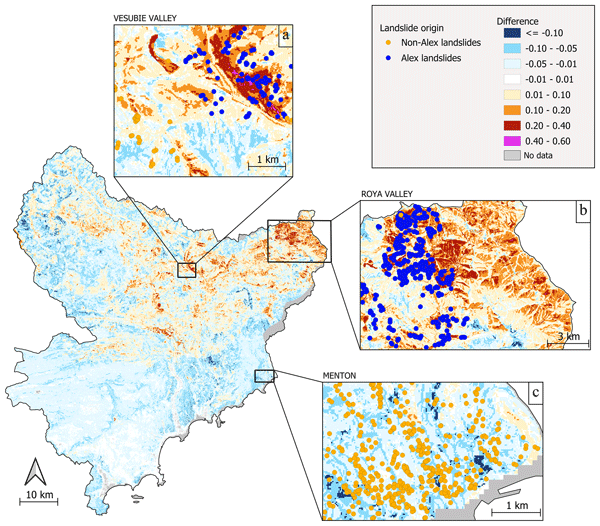
To better illustrate the impact of Alex landslides, a difference map is generated by subtracting the WoSAL map from the WSAL map (Fig. 11). Overall, the differences range from −0.2 to 0.6. About 72 % of the territory presents a negative difference, while 28 % show an increase in susceptibility. Large difference values are rare, as 94 % of the territory shows a difference between −0.1 and 0.1, and about 16 % presents no significant difference (between −0.01 and 0.01). Susceptibility increases are mainly located near the locations of the Alex landslides, as shown in the Vesubie Valley in Fig. 11a. However, susceptibility increases are also observed in areas where no Alex landslides were recorded, as visible in the eastern part of the Roya valley in Fig. 11b. The municipality of Menton exhibits a small decrease in susceptibility (Fig. 11c) but the values remain nevertheless very high in the area (see zoom in Fig. 9c and d). This decrease reflects the fact that, proportionally, the majority of Alex landslides occurred in other locations.
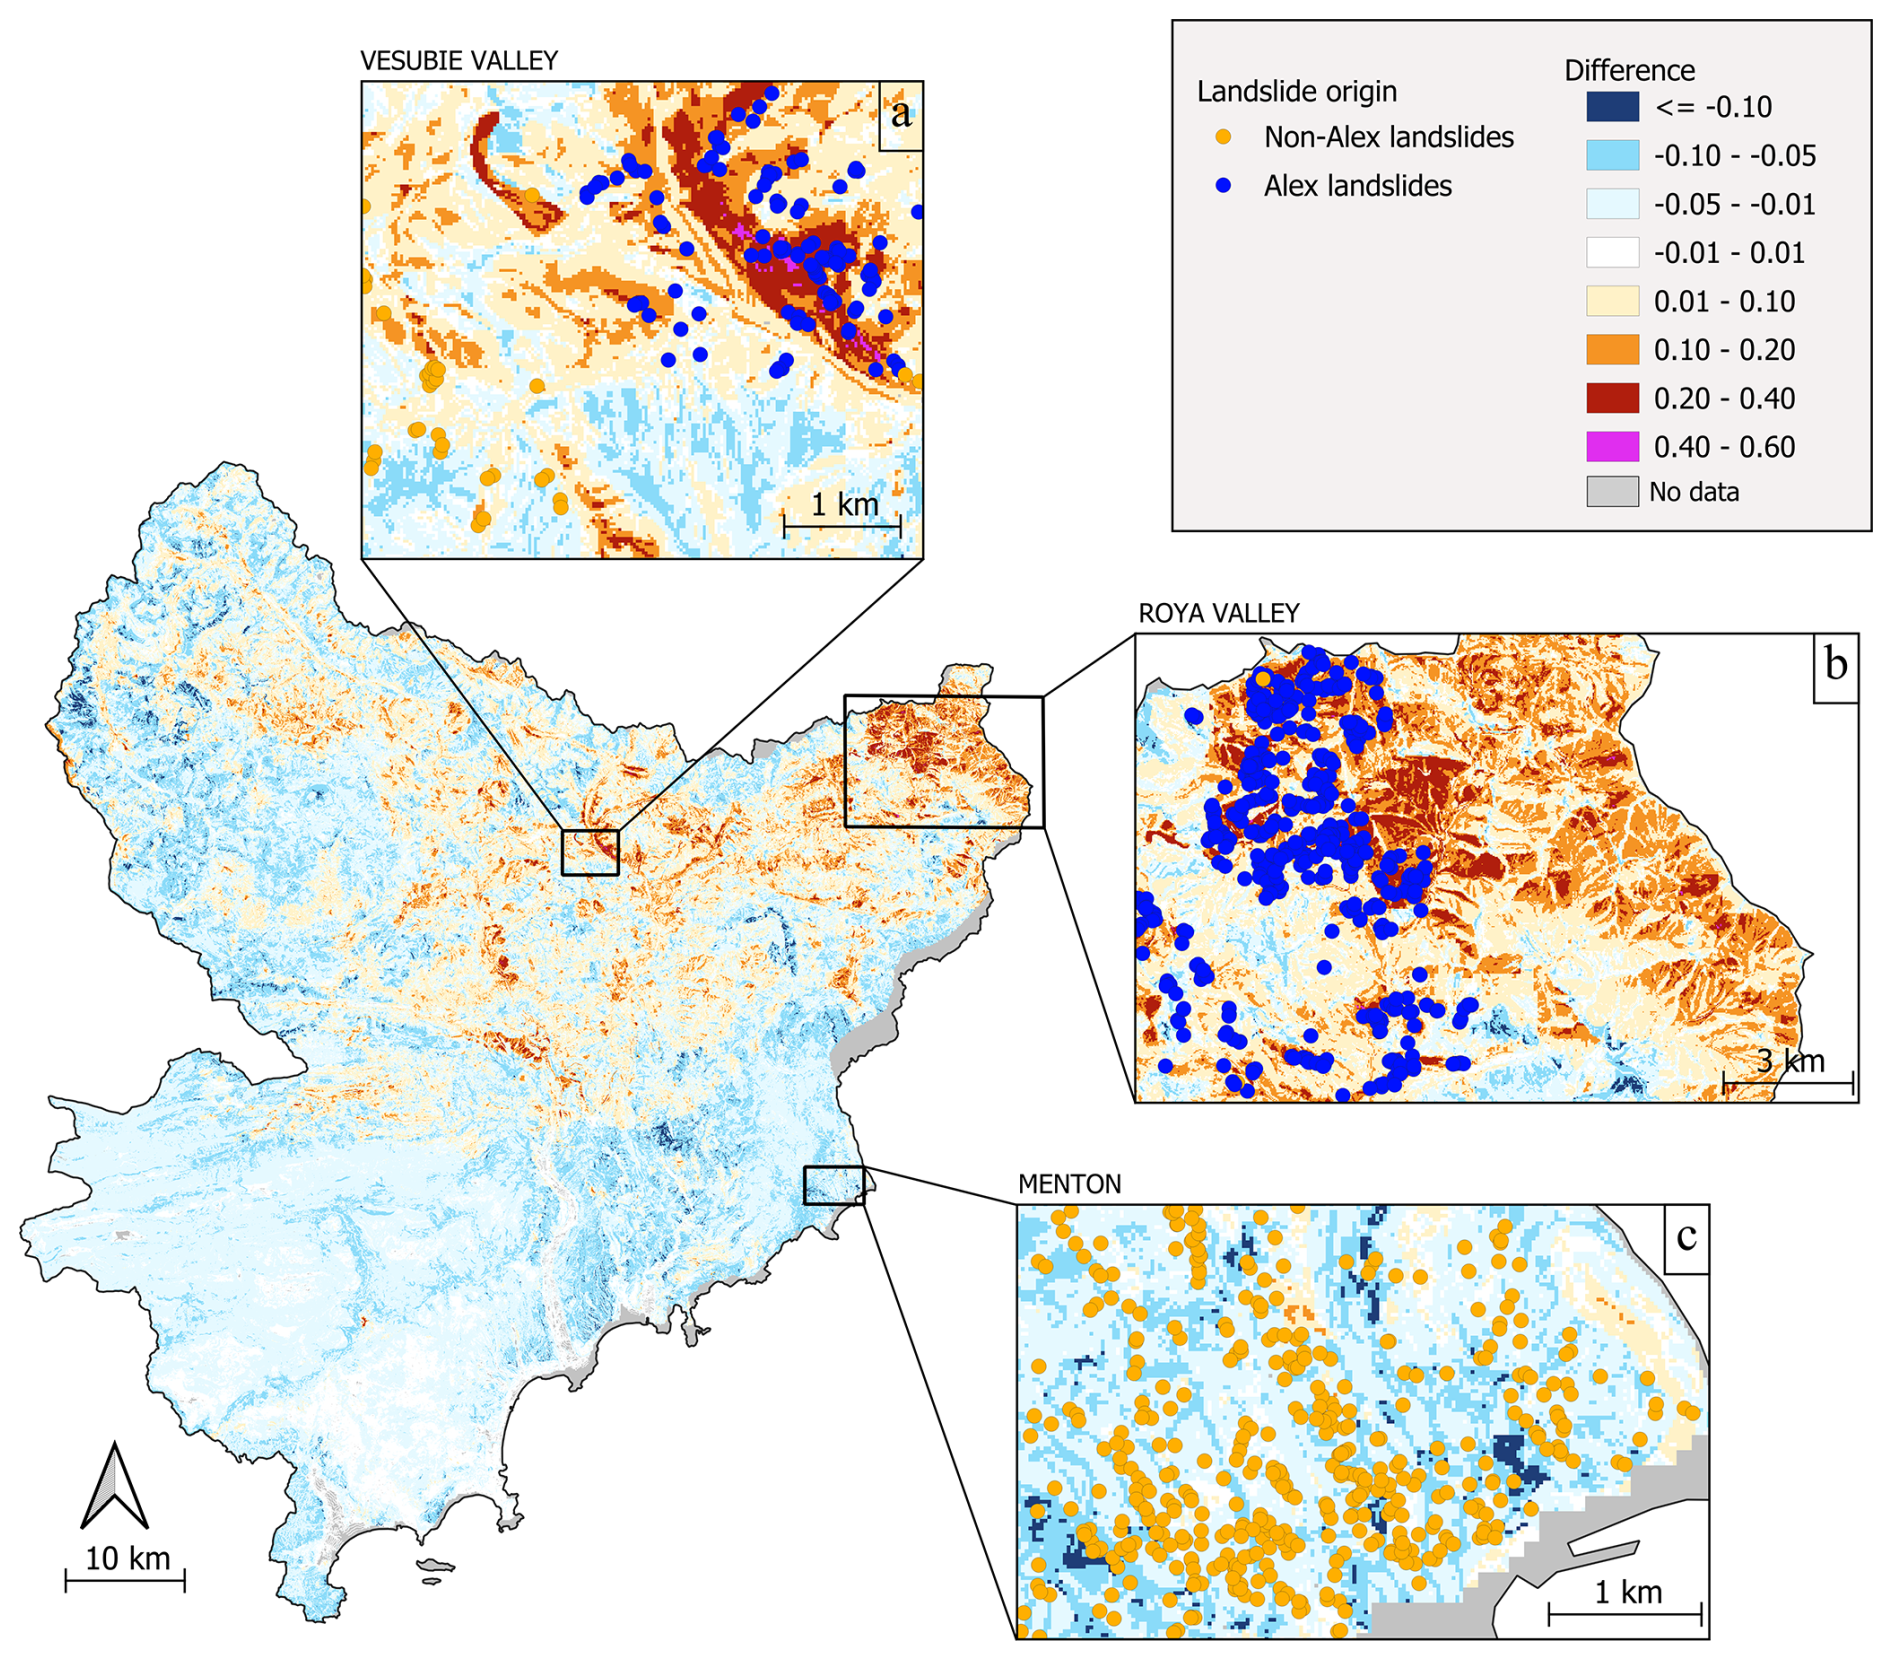
Figure 11Difference of the two susceptibility maps (WSAL – WoSAL). Positive values (red areas) correspond to an increase in susceptibility after integrating Alex landslides, while negative values (blue areas) indicate a decrease in susceptibility. Blue points correspond to locations of Alex landslides while orange points represent non-Alex landslides. Three insets show close-up views of (a) the Vésubie Valley, (b) the northern part of the Roya Valley, and (c) the municipality of Menton.
5.2.4 Susceptibility values for Alex and non-Alex landslides
Figure 12 shows the distributions of susceptibility values at the locations of Alex and non-Alex landslides. For both distributions, susceptibility values were extracted from the WoSAL map (computed without Alex landslides). The two curves display pronounced differences. Non-Alex landslides present a distribution centered on high values, with a mean susceptibility of 0.76, and values ranging from 0.37 to 0.95. Conversely, Alex landslides show a wider distribution with a plateau between 0.5 and 0.7, a mean of 0.54, and values spanning from 0.05 to 0.81. Overall, Alex landslides tended to occur in areas with lower susceptibility values than non-Alex landslides. This result suggests that the predisposing configurations learned by the RF model from landslides associated with non-extreme rainfall does not entirely capture the predisposing patterns associated with extreme events. It is also observed that no Alex landslide occurred for susceptibility values above 0.8. This surprising result actually reflects the fact that there are no areas with susceptibility greater than 0.8 in the area affected by Storm Alex (not shown).
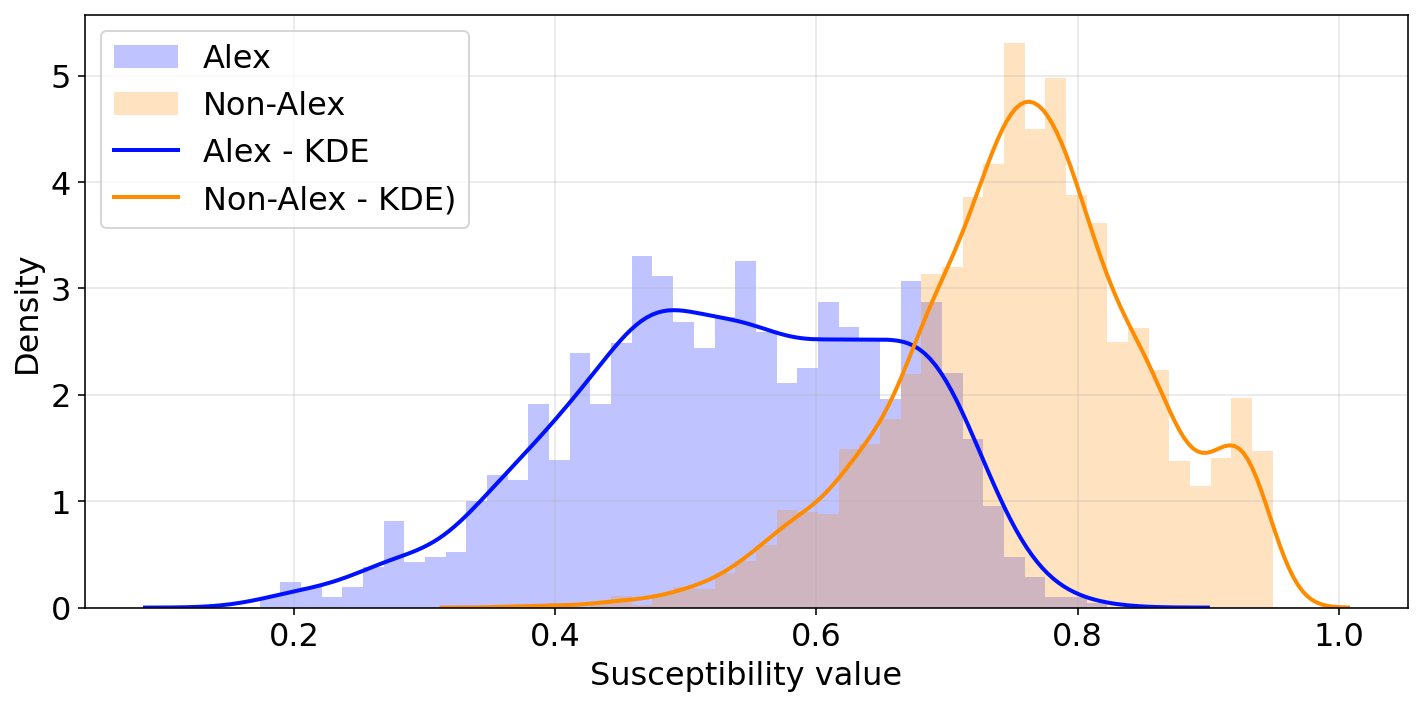
Figure 12Kernel density estimates (KDE) distributions of susceptibility values at the locations of Alex (blue) and non-Alex (orange) landslides on the WoSAL map.
Using an inventory of 4692 shallow landslides in the Alpes-Maritimes region, including 1332 events triggered by the millennial Storm Alex (October 2020), this study shows that the inclusion of landslides triggered by extreme rainfall events alters both rainfall–duration (ED) thresholds and susceptibility patterns. ED thresholds computed with Storm Alex landslides are increased by a factor of approximately 1.2 compared to thresholds derived from more common events. Susceptibility maps based on RF modelling reveals that Storm Alex landslides occurred under different predisposing conditions, and in areas characterized by a lower pre-event susceptibility. Incorporating Alex landslides modifies the spatial distribution of susceptibility, locally increasing values in areas sharing similar predisposing conditions, while slightly decreasing susceptibility elsewhere.
6.1 Quality of landslide inventory
Among the landslides classified as having a decametric spatial accuracy, 97 % of the Alex landslides were identified by orthophotography comparison and field surveys, providing high confidence in their mapped location. In contrast, only 68 % of the non-Alex landslides were mapped using the same approach. The remaining landslides originate from pre-existing databases, where locations may have been compiled using different procedures, leading to variable positional reliability despite their decametric classification. To reduce this difference in spatial reliability between Alex and non-Alex landslides, the locations of landslides from pre-existing databases were checked and adjusted whenever possible using the available textual information. Nevertheless, due to incomplete information, it is possible that some non-Alex landslides with a decametric spatial accuracy (Fig. 3) may in fact have an erroneous location. However, this concerns a very small number of landslides and would not affect the results of the ED thresholds and susceptibility analyses.
Moreover, for random forest (RF) modelling, landslides originally mapped as polygons were simplified as single points for the RF modelling. This approach ensures a homogeneous treatment of the inventory, although it may introduce some uncertainties in the values of predisposing factors (e.g., slope) attributed to each landslide.
It should also be noted that Alex landslides exhibit a strong spatial clustering, mainly concentrated within the Vésubie, Tinée and Roya valleys. This clustering primarily reflects the actual spatial extent of the storm impacts, as these valleys correspond to the areas that experienced the most intense rainfall during Storm Alex (Fig. 2). Most Alex-induced landslides were identified through orthophotography comparison using the post-Alex orthophoto, which specifically covered these heavily affected sectors (Fig. 3). Although it is possible that a limited number of Alex-induced landslides located outside the orthophoto extent have not been identified, such cases are expected to remain minor given the localized nature of the storm and the concentration of the most extreme rainfall within the surveyed valleys. Consequently, the strong spatial clustering of Alex landslides is considered to reflect the actual spatial distribution of landslide occurrence during the event, rather than being an artefact of the mapping procedure. To further limit the influence of this clustering, the analysis of the distributions of predisposing factors (Fig. 8) was restricted to the spatial extent covered by the post-Alex orthophoto for both Alex and non-Alex landslides. Despite this spatial restriction, clear differences between Alex and non-Alex landslides were still observed, suggesting that the identified contrasts are not only related to the spatial concentration of the Alex inventory, but reflect actual differences in the geomorphological conditions under which landslides were triggered during the storm.
In addition, temporal accuracy is a key aspect for the ED threshold analysis. Only landslides with reliable dating (daily or hourly resolution) were retained for this analysis, representing about 40 % of the total inventory (Fig. 3d). However, most of the remaining uncertainty concerns the exact time of occurrence within the day, as many landslides are only dated at daily resolution. This timing uncertainty can influence the assigned rainfall duration and cumulative rainfall associated with each landslide. However, sensitivity tests were performed by assigning landslide occurrence times to 00:00, 06:00, 12:00, 18:00, and 23:00. In all cases, the WSAL threshold remains higher than the WoSAL threshold, by a factor 1.1 to 1.5. This confirms that the WSAL threshold being higher than the WoSAL threshold is robust to temporal uncertainty.
6.2 Impact of Storm Alex landslides on rainfall triggering thresholds
Although numerous recent studies have addressed statistical ED thresholds for shallow landslides (Gariano et al., 2015; Melillo et al., 2016; Salee et al., 2022), the influence of including storm-induced landslides and the implications for operational threshold design have received little attention. The higher WSAL threshold relative to the WoSAL threshold reflects the exceptional intensity of Storm Alex, which produced extreme rainfall accumulations and numerous landslides over a short period. Accounting for these landslides shifts the rainfall–duration relationship toward higher rainfall values, thereby increasing the estimated threshold. As a result, the WSAL threshold is approximately 1.1 to 1.5 times higher than the WoSAL threshold, depending on the assumed timing of landslide occurrence. As a result, a larger number of landslides fall below the WSAL threshold (28 landslides, compared with 16 for the WoSAL trheshold; Fig. 6), indicating a reduced sensitivity to more common triggering conditions. However, the magnitude of this effect remains moderate.
In contrast, all the points corresponding to Storm Alex significantly exceed both thresholds. In practice, this means that a threshold calibrated with non-extreme events is effective at predicting the occurrence of landslides in a context of extreme rainfall. However, for operational use, it should also be kept in mind that this threshold could also lead to a high rate of false alarms during extreme rainfall. Several studies have demonstrated that when rainfall intensity exceeds soil hydraulic conductivity, runoff moderates the effect of rainfall on slope stability, such that the critical stability threshold is reached less quickly (Suradi et al., 2016; Ran et al., 2018; Zhang et al., 2022). In other words, slope instability may not always directly driven by rainfall intensity, particularly during exceptional events such as Storm Alex. This could argue for including additional parameters in the definition of thresholds for extreme events such as e.g. the return period of the rainfall event, or the effective rainfall (the rainfall infiltrated in the soil).
Finally, recall that to account for repeated occurrences of identical rainfall conditions, the (E, D) pairs were aggregated, so that each unique rainfall condition contributes only once to the threshold estimation. To assess the sensitivity of these results to this aggregation procedure, threshold calculations were also performed without aggregation of identical (E, D) conditions (Fig. A5). In this case, individual landslides are considered as independent observations, which increases the influence of events associated with multiple instabilities, particularly Storm Alex. Consequently, the difference between the WSAL and WoSAL thresholds is more pronounced than under the aggregation approach (Fig. 6), with the WSAL threshold being approximately 1.8 times higher than the WoSAL threshold. The aggregation procedure adopted in this study was preferred as it avoids over-representation of individual rainfall events in the threshold estimation.
6.3 Interpretation of susceptibility scores
In this study, the susceptibility scores correspond to the proportion of trees predicting a landslide occurrence for a given pixel. Random Forest (RF) is a supervised machine learning algorithm whose predictions are strongly governed by the statistical distribution of conditioning factors in the training data. Consequently, susceptibility scores should not be interpreted as absolute probabilities of failure, but rather as a relative index of similarity between the environmental conditions of the pixels on the map and those assigned to landslides in the training set. In general, however, identifying areas sharing similar conditions with past landslides is the fundamental principle underlying susceptibility mapping. The high performance scores in Table 2 demonstrate that the RF has a strong generalization capability, i.e. that it can accurately predict landslides that were not included in its training datasets. This is also illustrated by the spatial distribution of the susceptibility, where high values (>0.5) occur not only in areas where landslides have been recorded, but also in potentially susceptible zones without any known landslides, as shown in the Roya Valley (Fig. 9). The fact that a majority of the Alex landslides are well captured in the WoSAL susceptibility map (60 % of Alex landslides having a susceptibility higher than 0.5) also demonstrate the robustness and reliability of the model. These results support the interpretation of RF outputs as reliable susceptibility scores.
6.4 Changes in susceptibility maps due to Storm Alex landslides
Comparing the WSAL and WoSAL susceptibility maps reveals that the inclusion of Alex landslides modifies susceptibility patterns, with differences of susceptibility values ranging from −0.2 to 0.6. Approximately 72 % of the territory show a decrease in susceptibility values and 28 % an increase. Such changes demonstrate that the inclusion of Alex landslides has a tangible impact on the resulting susceptibility patterns, with potential consequences for operational management.
The areas where susceptibility increases after integrating Alex landslides are primarily located where these landslides occurred, or in areas with similar predisposing conditions that were not directly affected by the storm. Moreover, the analysis of distributions of slope angles, lithologies and clay content (Fig. 8) reveals significant differences between Alex and non-Alex landslides. During Storm Alex, landslides tended to occur on slightly gentler slopes and more frequently affected areas with lower clay content (<18 %), while some lithological units were more affected than by non-Alex landslides. This indicates that landslides triggered by Storm Alex developed under different geomorphological and lithological conditions. In addition, Fig. 12 shows that on average, Alex landslides occurred in areas with lower susceptibility values (0.54) compared to non-Alex landslides (0.76), using the WoSAL susceptibility map as reference. These results suggest that the exceptional rainfall intensity associated with Storm Alex lowered the predisposition threshold required to trigger landslides, causing events in areas considered as less susceptible, thereby occurring under different geomorphological conditions.
The analysis of feature importance highlights that soil texture parameters such as clay, sand and silt content are among the most influential predictors, particularly when including Alex landslides. The increased importance of these features after integrating the Alex landslides suggests that soil texture plays a more prominent role under extreme conditions, probably due to their influence on water infiltration and retention as well as on the mechanical properties of soil. This further supports the idea that exceptional triggering conditions can amplify the influence of certain predisposing factors.
These observations explain the differences between the two susceptibility maps. By incorporating numerous landslides triggered during Storm Alex, the RF model learned new combinations of variables associated with landslides. Therefore, the inclusion of Alex landslides weakened the statistical signal of the pre-existing predisposing patterns. Consequently, the observed differences between the two maps are not only the consequence of adding new landslides observations, but also reflect how the model internally redefines what constitutes a susceptible environment, once exposed to landslides generated under extreme, atypical conditions.
Overall, these results are consistent with the fact that landslide initiation results from a combination of predisposing factors (such as geology, topography, land use, etc.) and triggering variables, mainly related to rainfall (Corominas et al., 2014; Ran et al., 2018; Lombardo et al., 2020; Moreno et al., 2024; Steger et al., 2024). A promising prospect to produce more reliable and accurate predictive models, could be to jointly consider predisposing and triggering conditions, thereby enabling the model to recognize potentially unstable configurations even under unusual conditions.
Beyond the specific case of the Alpes-Maritimes region, our results also suggest broader implications regarding the role of extreme rainfall in landslide triggering. The observed activation of areas with lower pre-event susceptibility supports the hypothesis that extreme hydrometeorological forcing can partially override the usual controls exerted by soil and terrain properties on slope stability. Similar effects may occur in other regions exposed to short-duration, high-intensity rainfall events, such as in mediterranean and tropical environments.
Achu et al. (2024) investigated the impact of landslides triggered during extreme rainfall events on the performance of machine learning models and susceptibility maps using a Deep Neural Network approach in the southern Western Ghats (Kerala, India), a humid tropical region affected by recurrent high-intensity monsoon rainfall. Their results showed that a model trained without landslides associated with extreme events remained capable of identifying landslides triggered during such events. Nevertheless, incorporating these landslides into the susceptibility modelling increased the spatial extent of low and extreme susceptibility classes (+120 % and +32 % relative increase, respectively), while the moderate and high susceptibility classes decreased (−15 % and −42 % relative increase, respectively). The area associated with the very low susceptibility class does not present a significant change.
Our results partially agree with those of Achu et al. (2024). Similar to their observations, the inclusion of landslides triggered during Storm Alex leads to an increase in the area associated with low susceptibility values (<0.2), increasing from 27 % in WoSAL to 31 % in WSAL (+15 % of relative increase), and a decrease in the area associated with intermediate susceptibility values (0.2–0.6), decreasing from 62 % to 57 % (−8 % of relative decrease) (Fig. 10). However, in our study, the proportion of the study area associated with high susceptibility values (>0.6) slightly increases from 11 % to 12 % (+9 % of relative increase). Overall, the magnitude of these variations remains less pronounced than that reported by Achu et al. (2024). These differences may partly result from the use of different susceptibility thresholds to compare spatial susceptibility distributions. In Achu et al. (2024), susceptibility maps are divided into five classes, although the specific classification thresholds are not detailed. In contrast, our reported percentages are based on a simplified three-class partitioning of the continuous susceptibility values using fixed thresholds (0.2 and 0.6). These thresholds were selected to highlight the ranges where differences between the two maps are most pronounced in Fig. 10. In addition, contextual factors are likely to play a role. Indeed, the influence of extreme rainfall events on susceptibility patterns likely depends on both the regional geomorphological context and the rarity of the extreme rainfall event. While Achu et al. (2024) indicate that their extreme rainfall events were associated with return periods exceeding 100 years, Storm Alex was characterized by a millennial return period. Nevertheless, both studies show that incorporating landslides triggered by extreme rainfall events modifies susceptibility patterns.
This study examines how extreme rainfall events affect the development of rainfall–duration (ED) thresholds and susceptibility maps for shallow landslides. The analysis relies on an inventory of 4692 shallow landslides, of which 1332 were directly triggered by Storm Alex (2 October 2020), a rainfall event with an estimated millennial return period. Rainfall thresholds and susceptibility maps obtained with and without the inclusion of Storm Alex landslides are compared in order to assess the impact of this extreme event. To derive rainfall thresholds, cumulative rainfall and rainfall duration associated with each landslide were defined following the methodology of the CTRL-T algorithm. Landslides sharing identical rainfall duration and cumulative rainfall were aggregated into a single triggering condition to avoid overrepresentation of rainfall events that have triggered multiple landslides. Quantile Regression (QR) was applied to define 5 % ED thresholds. A Random Forest (RF) method was used to generate susceptibility maps. Particular attention was paid to the impact of non-landslide points on the outputs.
The results reveal several key findings. First, the inclusion of landslides associated with Storm Alex leads to a moderate increase in the ED threshold, ranging from a factor of 1.1 to 1.5 depending on the assumed occurrence time of landslides, compared to that established using only non–Storm Alex-induced landslides. This increase reflects the extreme nature of the storm and highlights the sensitivity of statistical approaches to the presence of extreme events. Incorporating such events into the statistical threshold calculations therefore reduces their sensitivity to more common rainfall events and could increase the rate of missed alerts. However, the threshold established without considering Alex landslides successfully captures the landslides triggered during the storm.
Second, the comparative analysis of the distributions of predisposing factors (slope, clay and lithology) between Alex and non-Alex landslides, together with the susceptibility maps produced using the RF method, indicate that landslides triggered by Storm Alex occurred under predisposing conditions that differ from those associated with more common events. On average, the storm-induced landslides developed on slightly gentler slopes, more frequently impacted terrains with lower clay contents (<18 %), affected specific lithologies, and occurred in areas with lower susceptibility values. Such differences suggest that the exceptional rainfall intensity associated with Storm Alex lowered the stability threshold of slopes. Accordingly, the inclusion of these events in the RF training dataset altered the statistical relationships between predisposing factors and landslide occurrence, resulting in a susceptibility increase in localized areas as well as in an overall susceptibility decrease elsewhere. This demonstrates that extreme events do not simply add more data points to the inventory, but that they reshape susceptibility patterns, and have serious implications for the robustness of statistical models and operational risk management.
These findings have implications that extend beyond our local case study, contributing to the broader understanding of the limits and applicability of data-driven landslide prediction models when extreme events are considered. More specifically, this work highlights that (i) landslide inventories containing landslides triggered during rare rainfall events require particular attention during model development and interpretation because they may not be representative of the conditions associated with more common rainfall events, (ii) landslide predictive tools based on statistical and machine-learning approaches behave differently under exceptional forcing conditions and (iii) models developed using more common rainfall events cannot always be directly extrapolated to extreme events. In the context of climate change, where the frequency and intensity of extreme rainfall events are expected to increase, we believe that these conclusions can help to design more effective predictive tools.
From a methodological perspective, several prospects emerge from this study. Approaches explicitly considering rainfall event return periods, for instance by adapting model calibration or by using separate modelling frameworks according to rainfall return periods, could improve model robustness under extreme rainfall conditions. Additionally, our results point out the importance of jointly considering predisposing (e.g., slope, lithology, land use) and triggering factors (e.g., rainfall intensity and duration) in landslide susceptibility assessment. Statistical models integrating both predisposing factors and triggering variables would presumably better capture the full range of conditions under which landslides occur, thereby improving hazard assessment and risk management strategies. Incorporating additional parameters, such as antecedent soil moisture, snowmelt indicators, or effective rainfall rather than event-based rainfall metrics, could further enhance the predictive capability of these models. Finally, performing analyses by landslide type (e.g., flow-like landslides, mid-slope landslides and cut-slope landslides) could also be relevant, as different processes are controlled by distinct conditioning and triggering mechanisms; however, such stratification inevitably reduces the number of available landslides for model calibration and validation, potentially limiting statistical robustness and requiring larger or longer-term inventories.
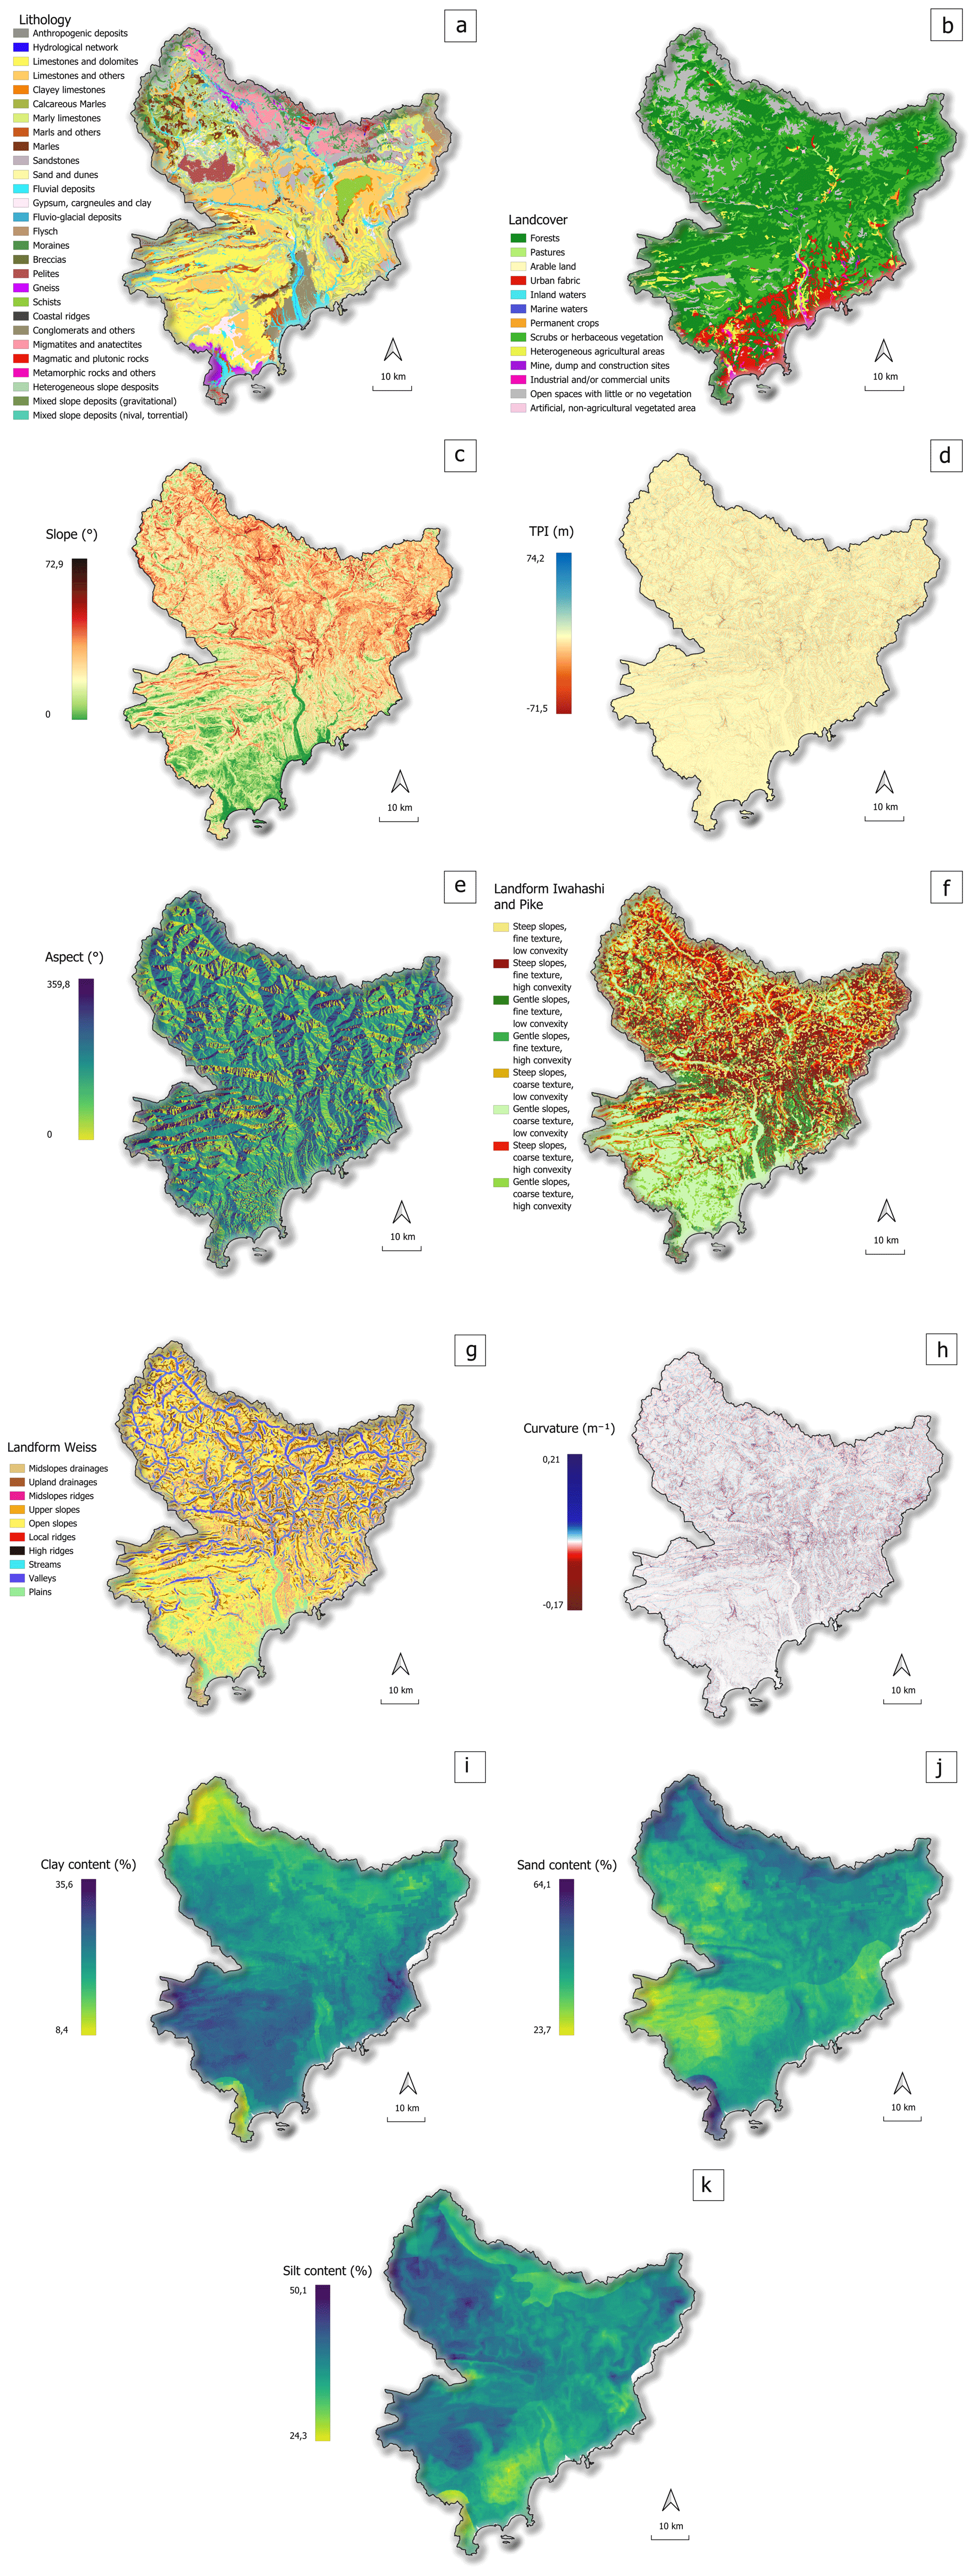
Figure A1Rasters of landslide predisposing factors considered in the RF model: (a) Lithology; (b) Corine Landcover; (c) Landform of Iwashi and Pike; (d) Landform of Weiss; (e) Slope angle; (f) Topographic Position Index (TPI); (g) Aspect; (h) Curvature; (i) Clay content over 0–30 cm depth; (j) Sand content over 0–30 cm depth; (k) Silt content over 0–30 cm depth.
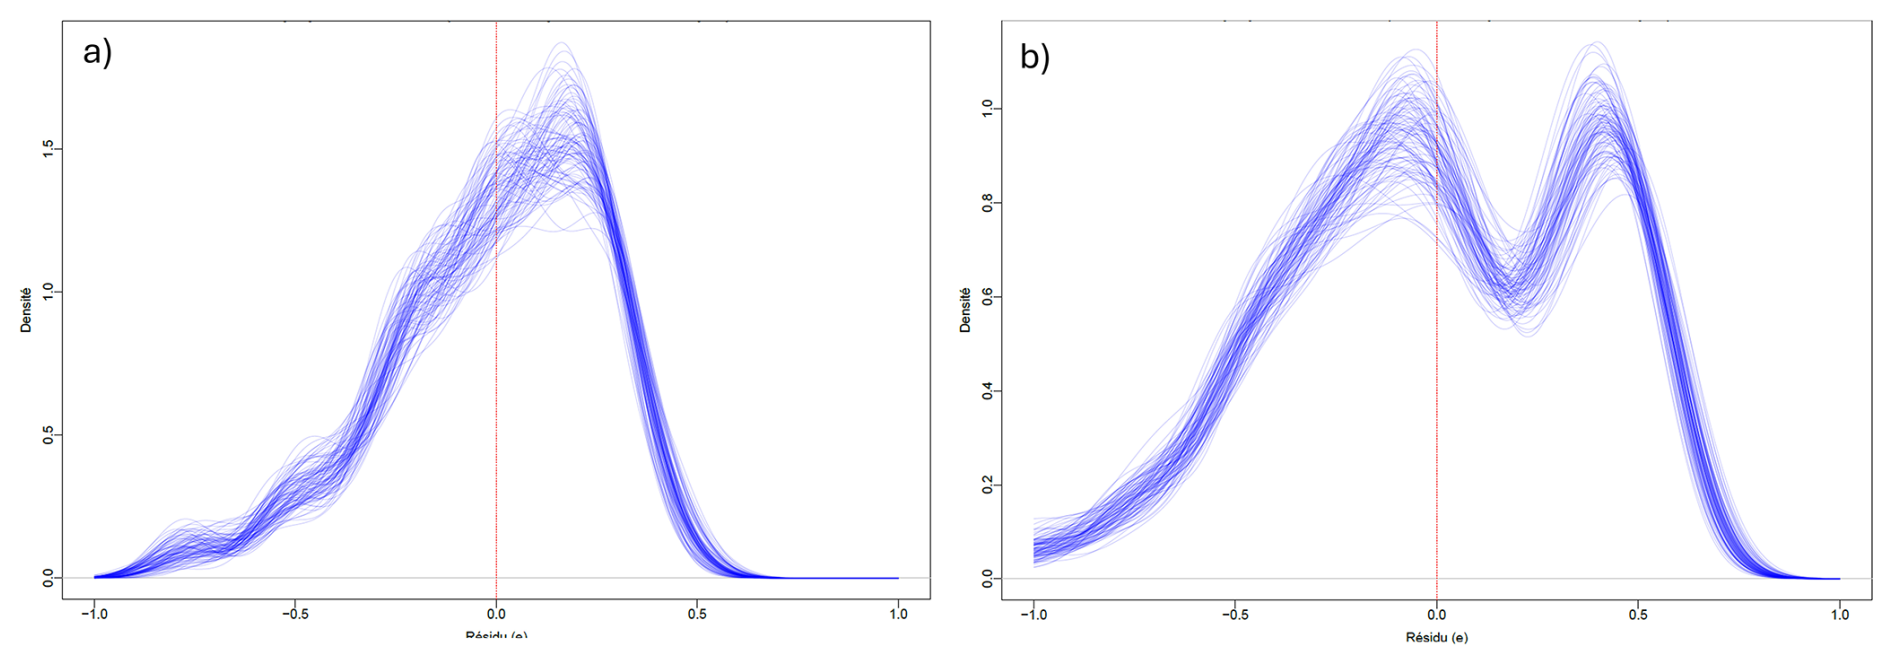
Figure A2Kernel density estimation of the residuals obtained from a least-squares fit on aggregated MPRC datasets using (a) the WoSAL and (b) theWSAL datasets over a bootstrapping procedure with 100 repetitions.
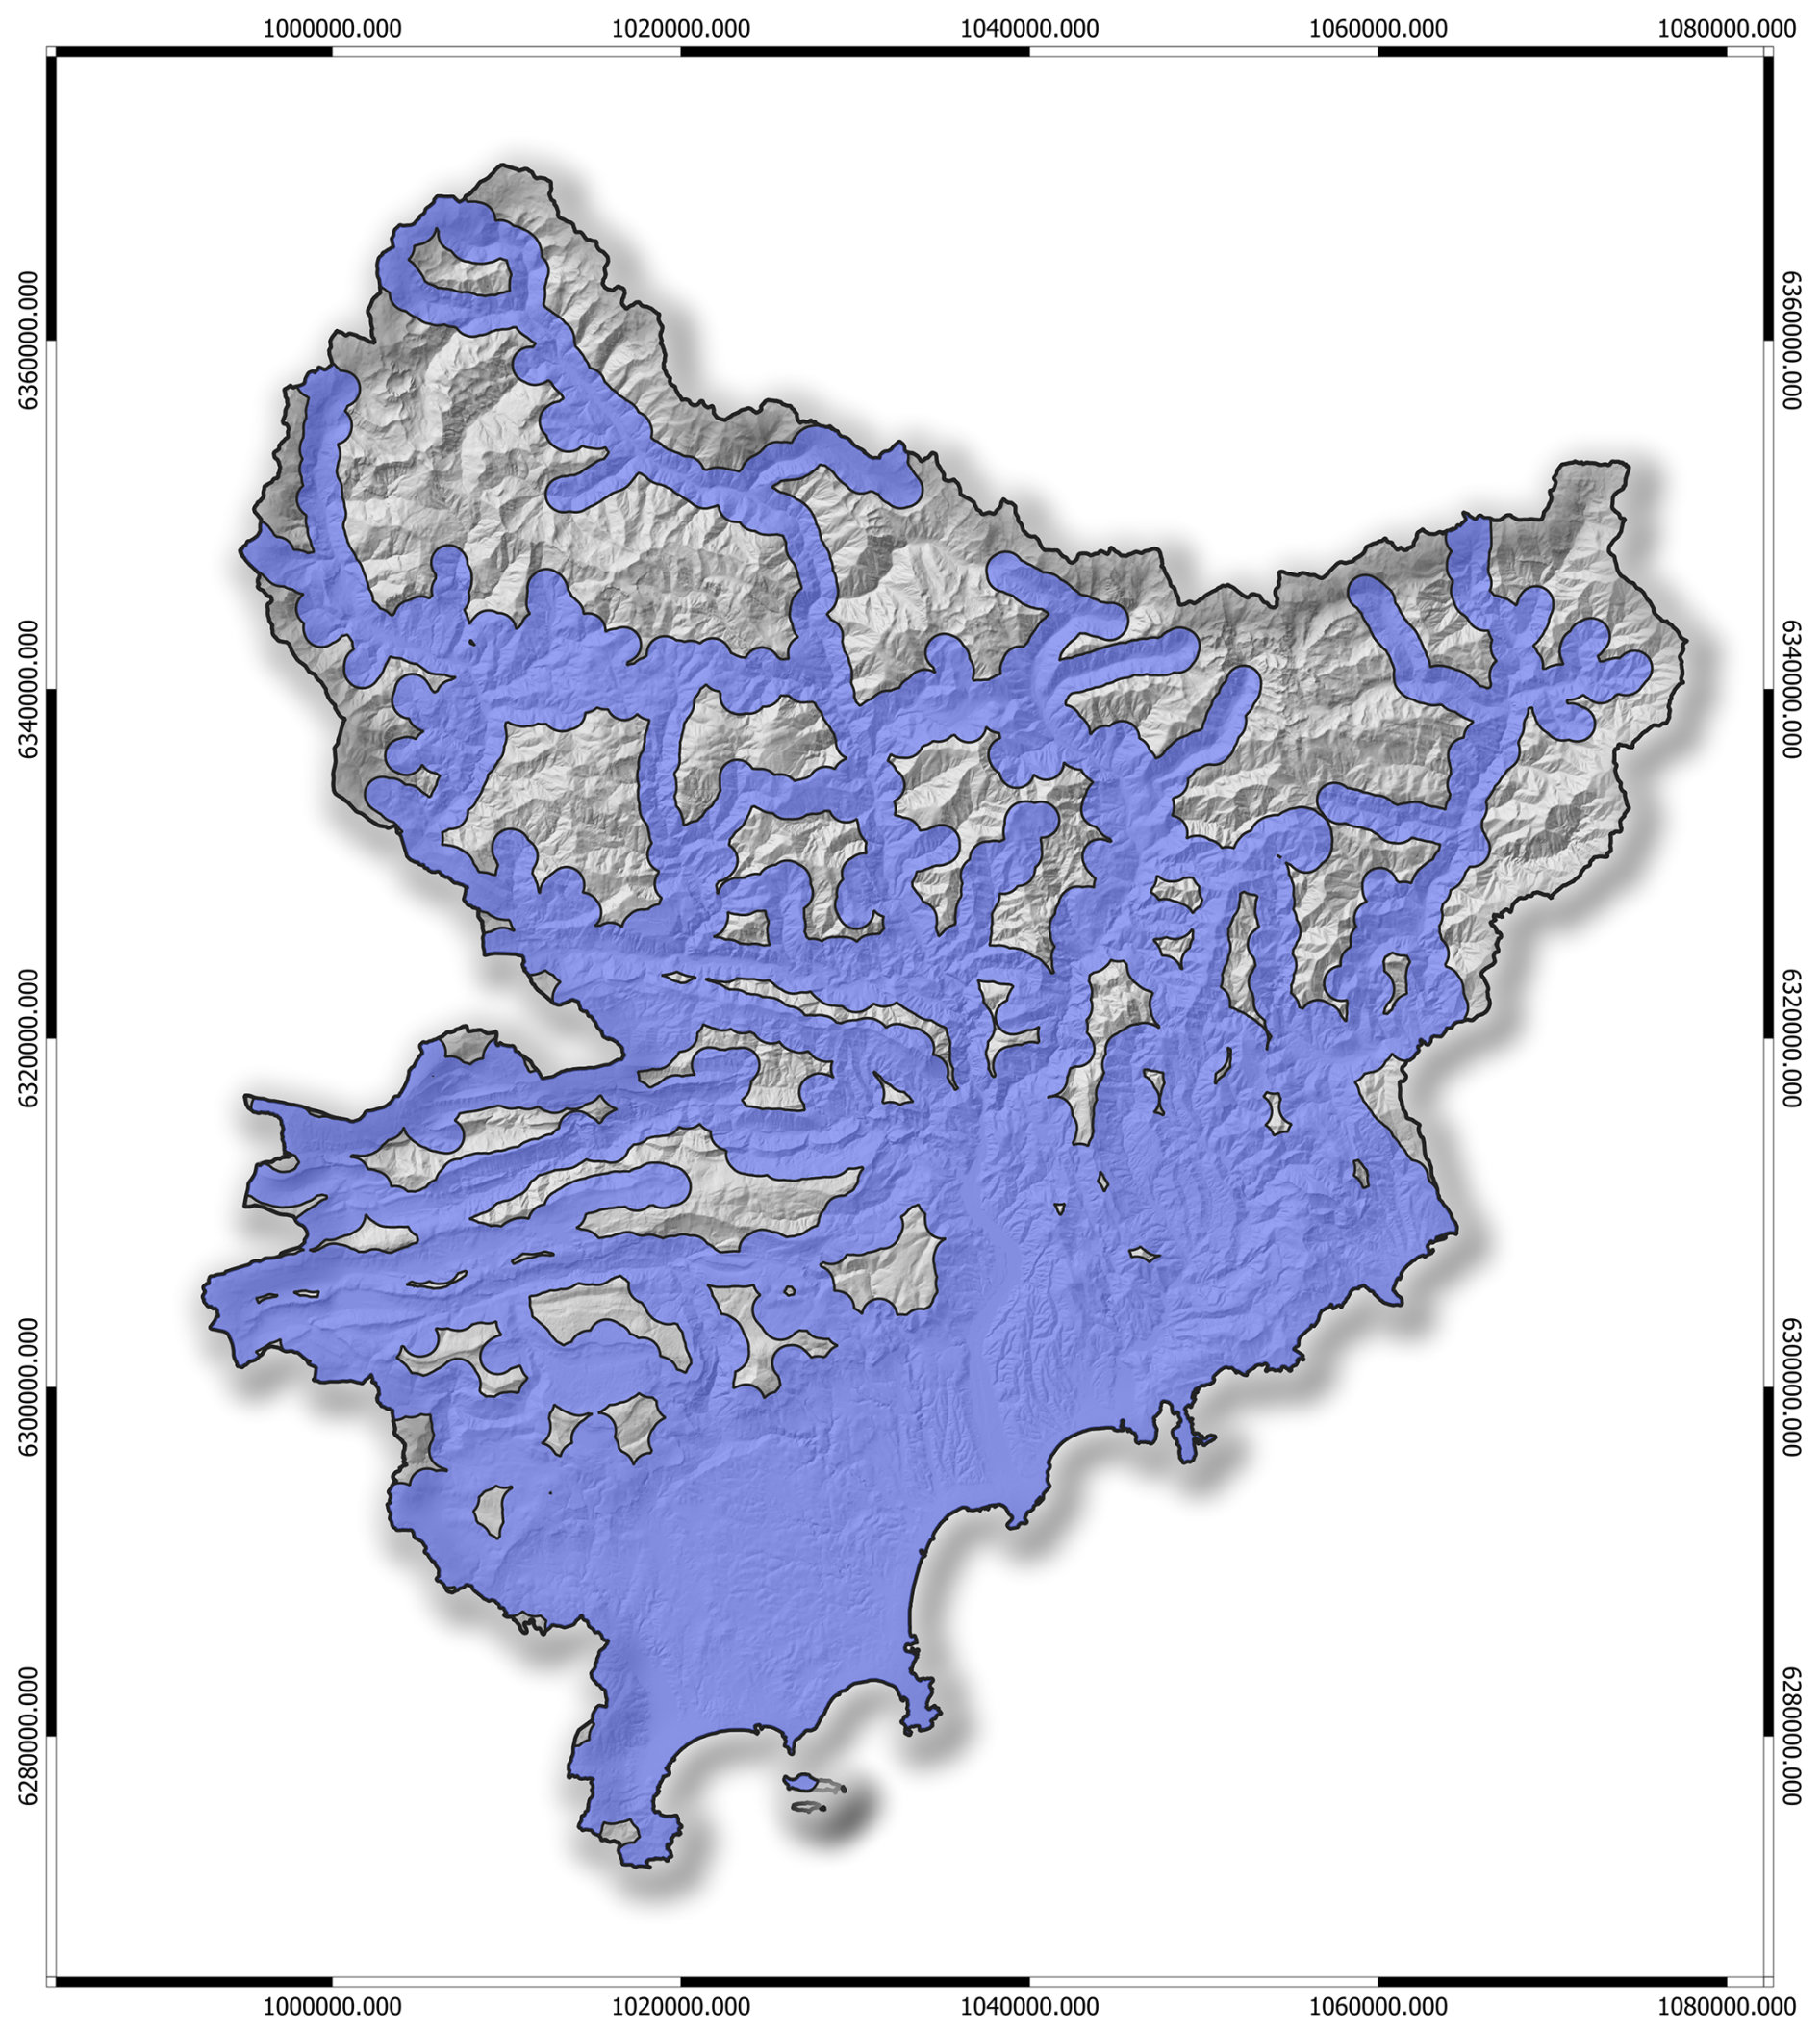
Figure A3Definition of the valid area (shown in light blue) used for generating non-landslide samples in the RF model, corresponding to a 1 km buffer around major roads, and excluding zones within 150 m of recorded landslides.
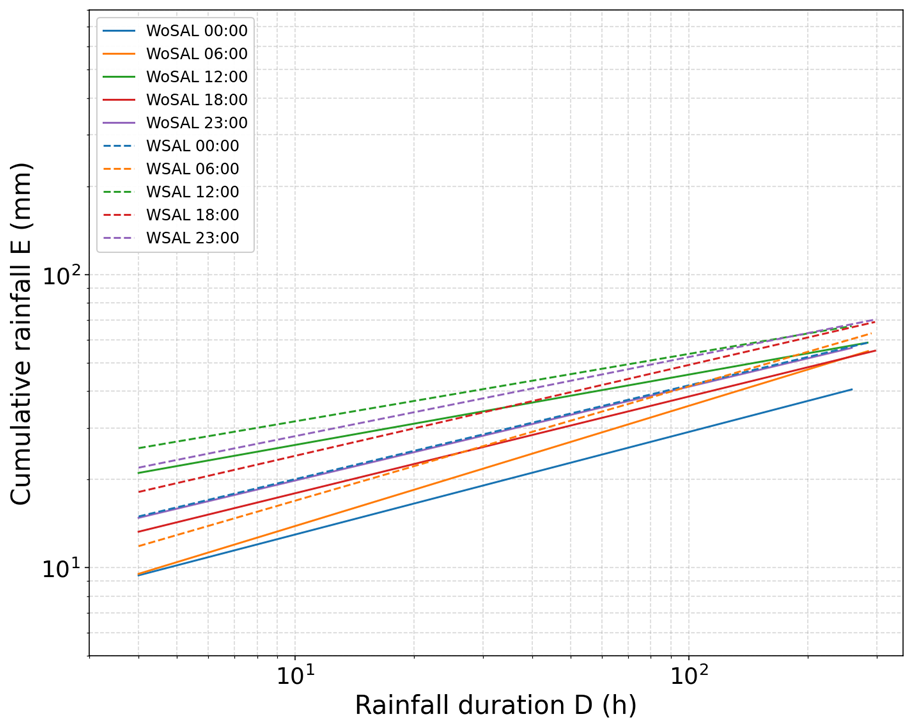
Figure A4ED thresholds calculated with a 5 % quantile regression, depending on the assumed hour of occurrence of landslides (00:00, 06:00, 12:00, 18:00, and 23:00). Solid lines correspond to WoSAL thresholds, while dashed lines indicate WSAL thresholds.
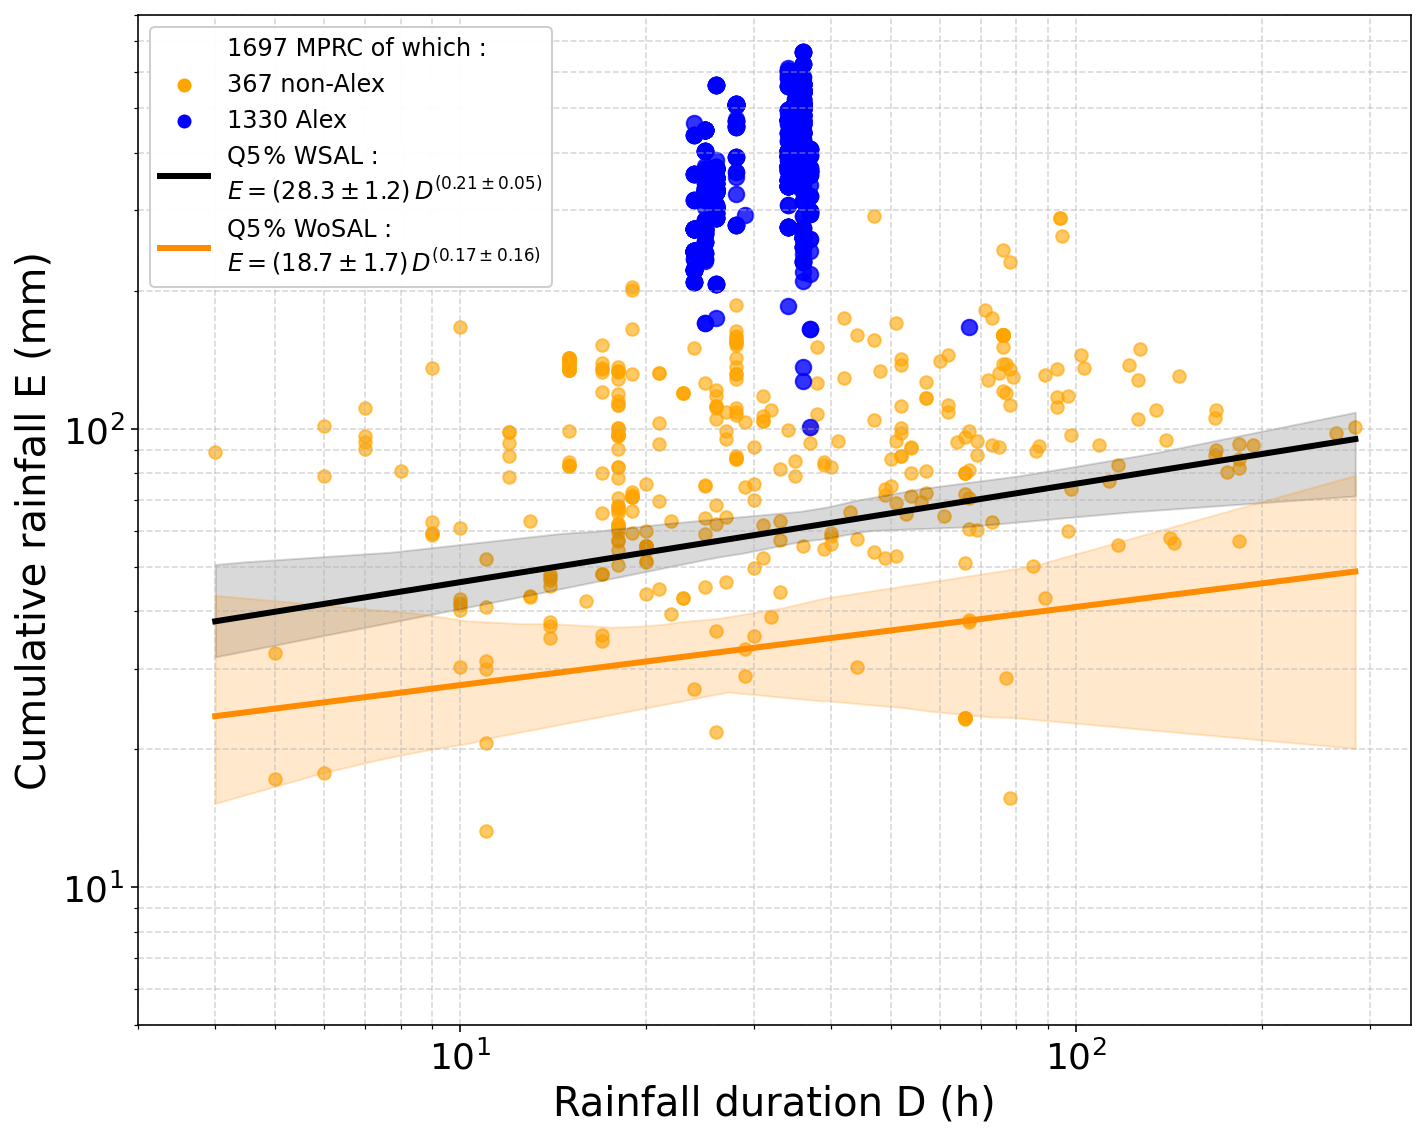
Figure A5ED thresholds calculated under MPRC conditions (Most Probable Rainfall Conditions) without aggregating identical (E, D) conditions. The x-axis represents the duration (h) of the rainfall from the beginning of the rainfall event until the occurrence of the landslide, and the y-axis represents the corresponding amount of rainfall (mm), both in log-log scales. Blue points are associated with Alex landslides while orange points represent non-Alex landslides. The threshold computed from the WSAL and WoSAL datasets are represented in black and orange, respectively. The light grey and orange shaded areas indicate the associated uncertainties.
COMEPHORE meteorological data are available on the following portal: https://www.data.gouv.fr/ (last access: 13 July 2024). Landslide data will be made available upon request.
Conceptualization, Methodology, Writing : LA, GC, SB, OC, YT, NS. Resources: YT, NS, NM, LF. Supervision: GC, SB, OC
The contact author has declared that none of the authors has any competing interests.
Publisher's note: Copernicus Publications remains neutral with regard to jurisdictional claims made in the text, published maps, institutional affiliations, or any other geographical representation in this paper. The authors bear the ultimate responsibility for providing appropriate place names. Views expressed in the text are those of the authors and do not necessarily reflect the views of the publisher.
We thank Jérémy Rohmer (BRGM) for his valuable advice on statistical methods, particularly regarding the Random Forest algorithm.
This research has been supported by the Agence Nationale de la Recherche (ANR VIGIMONT project (grant no. ANR-22-CE04-0021) and France 2030 IRIMONT project (grant no. ANR-22-EXIR-0003)).
This paper was edited by Roberto Greco and reviewed by two anonymous referees.
Achu, A. L., Thomas, J., Aju, C. D., Vijith, H., and Gopinath, G.: Redefining landslide susceptibility under extreme rainfall events using deep learning, Geomorphology, 448, 109033, https://doi.org/10.1016/j.geomorph.2023.109033, 2024.
Altmann, A., Toloşi, L., Sander, O., and Lengauer, T.: Permutation importance: a corrected feature importance measure, Bioinformatics, 26, 1340–1347, https://doi.org/10.1093/bioinformatics/btq134, 2010.
Arbizzi, S., Cinotti, B., Desbouis, J.-F., Moreau, L., Sauzey, P., and Vilmus, F.: Retour d'expérience des intempéries des 2 et 3 octobre 2020 dans les Alpes-Maritimes, https://www.igedd.developpement-durable.gouv.fr/IMG/pdf/013618-01_rapport-publie_cle57ddc8.pdf (last access: 27 July 2026), 2021.
Armaş, I., Vartolomei, F., Stroia, F., and Braşoveanu, L.: Landslide susceptibility deterministic approach using geographic information systems: application to Breaza town, Romania, Nat. Hazards, 70, 995–1017, https://doi.org/10.1007/s11069-013-0857-x, 2014.
Barthélemy, S., Bernardie, S., and Grandjean, G.: Assessing rainfall threshold for shallow landslides triggering: a case study in the Alpes Maritimes region, France, Nat. Hazards, https://doi.org/10.1007/s11069-024-06941-2, 2024.
Bisquert, A., Mainieri, R., Carladous, S., Robert, Y., Giacona, F., Verry, P., and Eckert, N.: La base de données événementielles RTM pour la connaissance des risques naturels en montagne : L'exemple du département de l'Isère (France), rga, 113–4, https://doi.org/10.4000/137kf, 2025.
Breiman, L.: Random Forest, Mach. Learn., 45, 5–32, https://doi.org/10.1023/A:1010933404324, 2001.
Caine, N.: The Rainfall Intensity – Duration Control of Shallow Landslides and Debris Flows, Geogr. Ann. A, 62, 23–27, https://doi.org/10.1080/04353676.1980.11879996, 1980.
Carrega, P. and Michelot, N.: Une catastrophe hors norme d'origine météorologique le 2 octobre 2020 dans les montagnes des Alpes-Maritimes, Physio-Geo, 1–70, https://doi.org/10.4000/physio-geo.12370, 2021.
Catani, F., Lagomarsino, D., Segoni, S., and Tofani, V.: Landslide susceptibility estimation by random forests technique: sensitivity and scaling issues, Nat. Hazards Earth Syst. Sci., 13, 2815–2831, https://doi.org/10.5194/nhess-13-2815-2013, 2013.
Chen, W., Xie, X., Wang, J., Pradhan, B., Hong, H., Bui, D. T., Duan, Z., and Ma, J.: A comparative study of logistic model tree, random forest, and classification and regression tree models for spatial prediction of landslide susceptibility, CATENA, 151, 147–160, https://doi.org/10.1016/j.catena.2016.11.032, 2017.
Chochon, R., Martin, N., Lebourg, T., and Vidal, M.: Analysis of Extreme Precipitation During the Mediterranean Event Associated with the Alex Storm in The Alpes-Maritimes: Atmospheric Mechanisms and Resulting Rainfall, in: Advances in Hydroinformatics, edited by: Gourbesville, P. and Caignaert, G., Springer Nature Singapore, Singapore, 397–418, https://doi.org/10.1007/978-981-19-1600-7_26, 2022.
Clapuyt, F., Vanacker, V., Christl, M., Van Oost, K., and Schlunegger, F.: Spatio-temporal dynamics of sediment transfer systems in landslide-prone Alpine catchments , Solid Earth, 10, 1489–1503, https://doi.org/10.5194/se-10-1489-2019, 2019.
Corominas, J., van Westen, C., Frattini, P., Cascini, L., Malet, J.-P., Fotopoulou, S., Catani, F., Van Den Eeckhaut, M., Mavrouli, O., Agliardi, F., Pitilakis, K., Winter, M. G., Pastor, M., Ferlisi, S., Tofani, V., Hervás, J., and Smith, J. T.: Recommendations for the quantitative analysis of landslide risk, B. Eng. Geol. Environ., 73, 209–263, https://doi.org/10.1007/s10064-013-0538-8, 2014.
Cruden, D. M. and Varnes, D. J.: Landslide Types and Processe, Special Report – National Research Council, Transportation Research Board, 247, 36–57, 1996.
Fell, R., Corominas, J., Bonnard, C., Cascini, L., Leroi, E., and Savage, W. Z.: Guidelines for landslide susceptibility, hazard and risk zoning for land use planning, Eng. Geol., 102, 85–98, https://doi.org/10.1016/j.enggeo.2008.03.022, 2008.
Fu, Y., Fan, Z., Li, X., Wang, P., Sun, X., Ren, Y., and Cao, W.: The Influence of Non-Landslide Sample Selection Methods on Landslide Susceptibility Prediction, Land, 14, 722, https://doi.org/10.3390/land14040722, 2025.
Gariano, S. L., Brunetti, M. T., Iovine, G., Melillo, M., Peruccacci, S., Terranova, O., Vennari, C., and Guzzetti, F.: Calibration and validation of rainfall thresholds for shallow landslide forecasting in Sicily, southern Italy, Geomorphology, 228, 653–665, https://doi.org/10.1016/j.geomorph.2014.10.019, 2015.
Gökceoglu, C. and Aksoy, H.: Landslide susceptibility mapping of the slopes in the residual soils of the Mengen region (Turkey) by deterministic stability analyses and image processing techniques, Eng. Geol., 44, 147–161, https://doi.org/10.1016/S0013-7952(97)81260-4, 1996.
Gonzalès, G.: Carte géologique harmonisée du département des Alpes-Maritimes – Notice géologique, BRGM, Rapport BRGM/RP-56161-FR, 393 pp., http://ficheinfoterre.brgm.fr/document/RP-56161-FR (last access: 17 August 2026), 2008.
Gonzalez, F. C. G., Cavacanti, M. D. C. R., Nahas Ribeiro, W., Mendonça, M. B. D., and Haddad, A. N.: A systematic review on rainfall thresholds for landslides occurrence, Heliyon, 10, e23247, https://doi.org/10.1016/j.heliyon.2023.e23247, 2024.
Gu, T., Li, J., Wang, M., Duan, P., Zhang, Y., and Cheng, L.: Study on landslide susceptibility mapping with different factor screening methods and random forest models, PLoS One, 18, e0292897, https://doi.org/10.1371/journal.pone.0292897, 2023.
Gu, T., Duan, P., Wang, M., Li, J., and Zhang, Y.: Effects of non-landslide sampling strategies on machine learning models in landslide susceptibility mapping, Sci. Rep., 14, 7201, https://doi.org/10.1038/s41598-024-57964-5, 2024.
Habets, F., Boone, A., Champeaux, J. L., Etchevers, P., Franchistéguy, L., Leblois, E., Ledoux, E., Le Moigne, P., Martin, E., Morel, S., Noilhan, J., Quintana Seguí, P., Rousset‐Regimbeau, F., and Viennot, P.: The SAFRAN‐ISBA‐MODCOU hydrometeorological model applied over France, J. Geophys. Res., 113, 2007JD008548, https://doi.org/10.1029/2007JD008548, 2008.
Iverson, R. M.: Landslide triggering by rain infiltration, Water Resour. Res., 36, 1897–1910, https://doi.org/10.1029/2000WR900090, 2000.
Iwahashi, J. and Pike, R. J.: Automated classifications of topography from DEMs by an unsupervised nested-means algorithm and a three-part geometric signature, Geomorphology, 86, 409–440, https://doi.org/10.1016/j.geomorph.2006.09.012, 2007.
Joly, D., Brossard, T., Cardot, H., Cavailhes, J., Hilal, M., and Wavresky, P.: Les types de climats en France, une construction spatiale, cybergeo, https://doi.org/10.4000/cybergeo.23155, 2010.
Jones, J. N., Boulton, S. J., Bennett, G. L., Stokes, M., and Whitworth, M. R. Z.: Temporal Variations in Landslide Distributions Following Extreme Events: Implications for Landslide Susceptibility Modeling, J. Geophys. Res.-Earth, 126, e2021JF006067, https://doi.org/10.1029/2021JF006067, 2021.
Lee, C.-T., Huang, C.-C., Lee, J.-F., Pan, K.-L., Lin, M.-L., and Dong, J.-J.: Statistical approach to storm event-induced landslides susceptibility, Nat. Hazards Earth Syst. Sci., 8, 941–960, https://doi.org/10.5194/nhess-8-941-2008, 2008.
Li, B., Liu, K., Wang, M., He, Q., Jiang, Z., Zhu, W., and Qiao, N.: Global Dynamic Rainfall-Induced Landslide Susceptibility Mapping Using Machine Learning, Remote Sens., 14, 5795, https://doi.org/10.3390/rs14225795, 2022.
Liébault, F., Melun, G., Piton, G., Chapuis, M., Passy, P., and Tacon, S.: Channel change during catastrophic flood: Example of Storm Alex in the Vésubie and Roya valleys, Geomorphology, 446, 109008, https://doi.org/10.1016/j.geomorph.2023.109008, 2024.
Lionello, P., Malanotte-Rizzoli, P., Boscolo, R., Alpert, P., Artale, V., Li, L. Z. X., May, W., Luterbacher, J. R., Trigo, R. M., Tsimplis, M., Ulbrich, U., and Xoplaki, E.: The Mediterranean climate: An overview of the main characteristics and issues, Developments in Earth and Environmental Sciences, 4, 1–26, https://doi.org/10.1016/S1571-9197(06)80003-0, 2006.
Lombardo, L., Cama, M., Maerker, M., and Rotigliano, E.: A test of transferability for landslides susceptibility models under extreme climatic events: application to the Messina 2009 disaster, Nat. Hazards, 74, 1951–1989, https://doi.org/10.1007/s11069-014-1285-2, 2014.
Lombardo, L., Opitz, T., Ardizzone, F., Guzzetti, F., and Huser, R.: Space-time landslide predictive modelling, Earth-Sci. Rev., 209, 103318, https://doi.org/10.1016/j.earscirev.2020.103318, 2020.
Lucas, T.: Proposition d'une carte de susceptibilité glissement de terrain sur le département des Alpes-Maritimes (06) dans le cadre de la réalisation d'un système de vigilance, Master GEE-GERINAT internship report, Aix-Marseille Université and BRGM, 8 pp., 2023.
Marra, F.: Rainfall thresholds for landslide occurrence: systematic underestimation using coarse temporal resolution data, Nat. Hazards, 95, 883–890, https://doi.org/10.1007/s11069-018-3508-4, 2019.
Melillo, M., Brunetti, M. T., Peruccacci, S., Gariano, S. L., and Guzzetti, F.: An algorithm for the objective reconstruction of rainfall events responsible for landslides, Landslides, 12, 311–320, https://doi.org/10.1007/s10346-014-0471-3, 2015.
Melillo, M., Brunetti, M. T., Peruccacci, S., Gariano, S. L., and Guzzetti, F.: Rainfall thresholds for the possible landslide occurrence in Sicily (Southern Italy) based on the automatic reconstruction of rainfall events, Landslides, 13, 165–172, https://doi.org/10.1007/s10346-015-0630-1, 2016.
Melillo, M., Brunetti, M. T., Peruccacci, S., Gariano, S. L., Roccati, A., and Guzzetti, F.: A tool for the automatic calculation of rainfall thresholds for landslide occurrence, Environ. Modell. Softw., 105, 230–243, https://doi.org/10.1016/j.envsoft.2018.03.024, 2018.
Montrasio, L. and Valentino, R.: A model for triggering mechanisms of shallow landslides, Nat. Hazards Earth Syst. Sci., 8, 1149–1159, https://doi.org/10.5194/nhess-8-1149-2008, 2008.
Moreno, M., Lombardo, L., Crespi, A., Zellner, P. J., Mair, V., Pittore, M., van Westen, C., and Steger, S.: Space-time data-driven modeling of precipitation-induced shallow landslides in South Tyrol, Italy, Sci. Total Environ., 912, 169166, https://doi.org/10.1016/j.scitotenv.2023.169166, 2024.
Ng, C. W. W., Yang, B., Liu, Z. Q., Kwan, J. S. H., and Chen, L.: Spatiotemporal modelling of rainfall-induced landslides using machine learning, Landslides, 18, 2499–2514, https://doi.org/10.1007/s10346-021-01662-0, 2021.
Nocentini, N., Rosi, A., Piciullo, L., Liu, Z., Segoni, S., and Fanti, R.: Regional-scale spatiotemporal landslide probability assessment through machine learning and potential applications for operational warning systems: a case study in Kvam (Norway), Landslides, 21, 2369–2387, https://doi.org/10.1007/s10346-024-02287-9, 2024.
Park, S. and Kim, J.: Landslide Susceptibility Mapping Based on Random Forest and Boosted Regression Tree Models, and a Comparison of Their Performance, Appl. Sci., 9, 942, https://doi.org/10.3390/app9050942, 2019.
Peres, D. J. and Cancelliere, A.: Comparing methods for determining landslide early warning thresholds: potential use of non-triggering rainfall for locations with scarce landslide data availability, Landslides, 18, 3135–3147, https://doi.org/10.1007/s10346-021-01704-7, 2021.
Pradhan, A. M. S. and Kim, Y. T.: Evaluation of a combined spatial multi-criteria evaluation model and deterministic model for landslide susceptibility mapping, CATENA, 140, 125–139, https://doi.org/10.1016/j.catena.2016.01.022, 2016.
Ran, Q., Hong, Y., Li, W., and Gao, J.: A modelling study of rainfall-induced shallow landslide mechanisms under different rainfall characteristics, J. Hydrol., 563, 790–801, https://doi.org/10.1016/j.jhydrol.2018.06.040, 2018.
Rebora, N., Molini, L., Casella, E., Comellas, A., Fiori, E., Pignone, F., Siccardi, F., Silvestro, F., Tanelli, S., and Parodi, A.: Extreme Rainfall in the Mediterranean: What Can We Learn from Observations?, J. Hydrometeorol., 14, 906–922, https://doi.org/10.1175/JHM-D-12-083.1, 2013.
Reichenbach, P., Rossi, M., Malamud, B. D., Mihir, M., and Guzzetti, F.: A review of statistically-based landslide susceptibility models, Earth-Sci. Rev., 180, 60–91, https://doi.org/10.1016/j.earscirev.2018.03.001, 2018.
Salee, R., Chinkulkijniwat, A., Yubonchit, S., Horpibulsuk, S., Wangfaoklang, C., and Soisompong, S.: New threshold for landslide warning in the southern part of Thailand integrates cumulative rainfall with event rainfall depth-duration, Nat. Hazards, 113, 125–141, https://doi.org/10.1007/s11069-022-05292-0, 2022.
Segoni, S., Piciullo, L., and Gariano, S. L.: A review of the recent literature on rainfall thresholds for landslide occurrence, Landslides, 15, 1483–1501, https://doi.org/10.1007/s10346-018-0966-4, 2018.
Shou, K.-J. and Lin, J.-F.: Evaluation of the extreme rainfall predictions and their impact on landslide susceptibility in a sub-catchment scale, Eng. Geol., 265, 105434, https://doi.org/10.1016/j.enggeo.2019.105434, 2020.
Steger, S., Moreno, M., Crespi, A., Luigi Gariano, S., Teresa Brunetti, M., Melillo, M., Peruccacci, S., Marra, F., De Vugt, L., Zieher, T., Rutzinger, M., Mair, V., and Pittore, M.: Adopting the margin of stability for space–time landslide prediction – A data-driven approach for generating spatial dynamic thresholds, Geosci. Front., 15, 101822, https://doi.org/10.1016/j.gsf.2024.101822, 2024.
Suleymanov, A., Richer-de-Forges, A. C., Saby, N. P. A., Arrouays, D., Martin, M. P., and Bispo, A.: National-scale digital soil mapping performances are related to covariates and sampling density: Lessons from France, Geoderma Regional, 37, e00801, https://doi.org/10.1016/j.geodrs.2024.e00801, 2024.
Sun, D., Wen, H., Wang, D., and Xu, J.: A random forest model of landslide susceptibility mapping based on hyperparameter optimization using Bayes algorithm, Geomorphology, 362, 107201, https://doi.org/10.1016/j.geomorph.2020.107201, 2020.
Suradi, M., Fourie, A. B., and Saynor, M. J.: An experimental and numerical study of a landslide triggered by an extreme rainfall event in northern Australia, Landslides, 13, 1125–1138, https://doi.org/10.1007/s10346-015-0606-1, 2016.
Taalab, K., Cheng, T., and Zhang, Y.: Mapping landslide susceptibility and types using Random Forest, Big Earth Data, 2, 159–178, https://doi.org/10.1080/20964471.2018.1472392, 2018.
Tabary, P., Dupuy, P., L'Henaff, G., Gueguen, C., Moulin, L., Laurentin, O., Merlier, C., and Soubeyroux, J.-M.: A 10-year (1997–2006) reanalysis of Quantitative Precipitation Estimation over France: methodology and first results, Iahs-Aish P, Symposium (Exeter 18 April 2011), https://iahs.info/uploads/dms/15900.047-255-260-351-73-IAHS_Tabary_et_a.pdf (last access: 17 August 2026), 2012.
Terlien, M. T. J.: The determination of statistical and deterministic hydrological landslide-triggering thresholds, Environ. Geol., 35, 124–130, https://doi.org/10.1007/s002540050299, 1998.
Thiery, Y.: Glissements de terrain: des catalogues d’événements et observations géomorphologiques à la modélisation spatiale de la susceptibilité et de l’aléa, Habilitation à diriger des recherches, Université de Caen Normandie, 2026, tel-05621963, https://hal.science/tel-05621963, last access: 17 August 2026.
Trigila, A., Iadanza, C., Esposito, C., and Scarascia-Mugnozza, G.: Comparison of Logistic Regression and Random Forests techniques for shallow landslide susceptibility assessment in Giampilieri (NE Sicily, Italy), Geomorphology, 249, 119–136, https://doi.org/10.1016/j.geomorph.2015.06.001, 2015.
Tsai, T.-L.: The influence of rainstorm pattern on shallow landslide, Environ. Geol., 53, 1563–1569, https://doi.org/10.1007/s00254-007-0767-x, 2008.
Weiss, A.: Topographic position and landforms analysis, Poster presentation, ESRI User Conference, 9–13 July 2001, San Diego, CA, USA, https://www.jennessent.com/arcview/TPI_Weiss_poster.htm (last access: 17 August 2026), 2001.
Xu, C., Xu, X., Dai, F., and Saraf, A. K.: Comparison of different models for susceptibility mapping of earthquake triggered landslides related with the 2008 Wenchuan earthquake in China, Computers & Geosciences, 46, 317–329, https://doi.org/10.1016/j.cageo.2012.01.002, 2012.
Zevenbergen, L. W. and Thorne, C. R.: Quantitative analysis of land surface topography, Earth Surf. Proc. Land., 12, 47–56, https://doi.org/10.1002/esp.3290120107, 1987.
Zhang, S., Li, L., Zhao, D., Ni, B., Qiang, Y., and Zheng, Z.: Stability and time-delay effect of rainfall-induced landslide considering air entrapment, Geoscience Letters, 9, 8, https://doi.org/10.1186/s40562-022-00216-z, 2022.
Zhou, X., Wen, H., Zhang, Y., Xu, J., and Zhang, W.: Landslide susceptibility mapping using hybrid random forest with GeoDetector and RFE for factor optimization, Geosci. Front., 12, 101211, https://doi.org/10.1016/j.gsf.2021.101211, 2021.