
the Creative Commons Attribution 4.0 License.
the Creative Commons Attribution 4.0 License.
 | 18 Aug 2026

Projecting changes in rainfall-induced landslide susceptibility across inhabited areas of China under climate change
Jinqi Wang
Hao Fang
Kai Liu
Yi Yue
Ming Wang
Bohao Li
Xiaoyi Miao
Landslides pose a significant threat to human lives and property. Evaluating dynamic changes in landslide susceptibility under climate change can provide decision-making support for future landslide risk reduction and mitigation. Using multiple landslide event inventories (2008–2023) and a random forest algorithm, this study developed an annual-scale landslide susceptibility model to assess spatiotemporal patterns of landslide susceptibility across inhabited areas of China under different simulated scenarios. The results showed that the model achieved excellent performance (AUC = 0.96), with annual precipitation being the most influential factor (16 % contribution). Compared to the baseline (1950–2014), landslide susceptibility within inhabited areas of China is projected to increase under future climate conditions. By the late 21st century (2076–2100), national mean annual precipitation is expected to rise by 59–111 mm, corresponding to an expansion of 4.9 × 10⁴–1.2 × 10⁵ km2 in areas with median to very high susceptibility within inhabited areas across SSP scenarios. Spatially, increased susceptibility is expected mainly in the border region between the South China bedrock hills region (SC) and the Southwest karst mountain region (SW), the inhabited parts of the eastern permafrost region of the Qinghai–Tibet Plateau (Tibet), and the Northwest Loess Plateau region (Loess) near the Taihang Mountains, with SSP5-8.5 further amplifying susceptibility toward the end of the century. These findings underscore the necessity of proactive landslide risk management in these identified hotspots to mitigate escalating landslide threats.
- Article
(8503 KB) - Full-text XML
-
Supplement
(2584 KB) - BibTeX
- EndNote


Rainfall-induced landslides rank among the world's most destructive geohazard processes (Gutiérrez et al., 2015), having claimed over 48 000 documented lives globally between 2004 and 2016 (Emberson et al., 2020, 2021; Froude and Petley, 2018). China faces particularly severe impacts, with landslide-related fatalities averaging 600 annual deaths since 2000 – accounting for nearly 25 % of the country's natural disaster mortality (Lin et al., 2022; Lin and Wang, 2018). Climate change is expected to exacerbate this threat through increased frequency and intensity of extreme precipitation events (Gariano et al., 2017; Kirschbaum et al., 2020), potentially elevating regional landslide susceptibility and associated risks. A comprehensive understanding of future susceptibility patterns is therefore critical for developing effective, climate-resilient landslide mitigation strategies.
Landslide occurrence results from the interplay between static predisposing factors and dynamic triggering conditions. Recent advances in susceptibility modelling have increasingly incorporated time-dependent variables to better capture spatiotemporal patterns of landslide susceptibility and occurrence (Nocentini et al., 2024). Currently, landslide susceptibility mapping (LSM) methodologies fall into four main categories: physical models, expert-driven models, statistical models, and machine learning models (Chang et al., 2019; Li et al., 2019). Among these, machine learning algorithms have demonstrated particular effectiveness in landslide susceptibility modelling due to their capability to capture both linear and nonlinear relationships between causative factors and landslide occurrence (Merghadi et al., 2020). Commonly employed machine learning approaches include random forest (RF), support vector machines (SVM), Extreme gradient boosting (XGBoost), convolutional neural networks (CNN), logistic regression (LR), k-nearest neighbours (KNN), and long short-term memory networks (LSTM) (Avand et al., 2019; Hakim et al., 2022; Huang et al., 2023; Jin et al., 2022; Zhang et al., 2023). RF algorithm has gained particular attention in this field due to its distinctive advantages. First, its parallel computing architecture enables efficient processing of large datasets, while the ensemble approach of multiple decision trees significantly enhances both training efficiency and prediction accuracy. Second, RF incorporates a built-in feature importance evaluation module that assesses variable significance through permutation-based comparison with prediction outcomes (Zhao et al., 2018). Extensive studies have confirmed RF's superior performance in landslide susceptibility assessments (Chen et al., 2017; Dou et al., 2019; Hong et al., 2019; Reichenbach et al., 2018).
In recent years, LSM has increasingly been combined with climate-change scenarios. The aim is to assess how the spatial distribution of rainfall-triggered landslide susceptibility may change across future climate scenarios and time periods. Existing work can be broadly grouped into three types. First, physically coupled approaches combine outputs from global climate models (GCMs) or regional climate models (RCMs) with physically based slope-stability models to examine climate-change impacts on landslides (Hürlimann et al., 2022; Peres and Cancelliere, 2018). Typical models and applications include the Fast Shallow Landslide Assessment Model (FSLAM) (Hürlimann et al., 2022), the Transient Rainfall Infiltration and Grid-Based Regional Slope-Stability model (TRIGRS) (Alvioli et al., 2018), and associated landslide warning models (Ciabatta et al., 2016). Second, threshold methods extract rainfall indicators related to triggering from climate scenarios (e.g. daily rainfall and antecedent cumulative rainfall), and then apply historical or scenario-based thresholds to quantify threshold exceedance (e.g. exceedance frequency or counts); these results are used to update landslide susceptibility (Lin et al., 2022; Wang et al., 2021). Third, downscaled climate variables or rainfall-derived indicators are fed into machine-learning frameworks to produce time-slice susceptibility maps (Park and Lee, 2021; Viet Du et al., 2023). Machine learning captures both linear and non-linear relationships and handles high-dimensional data with complex interactions. It also facilitates the integration of multi-source remote-sensing data and large-area samples, making it particularly suitable for regional-to-national scale susceptibility studies.
Despite continued methodological advances, several key limitations remain in landslide susceptibility studies that incorporate climate-change scenarios. On the one hand, the incompleteness and spatial-temporal biases of landslide inventories – due to limited event reporting and archival standards – can undermine the representativeness of training samples and inject substantial uncertainty into model predictions (Lin et al., 2021). This issue may be more pronounced at the national scale (Du et al., 2020). On the other hand, the future climate projections from CMIP6 feature relatively low spatial resolution, and inter-model differences persist among different simulation outputs (Dobler et al., 2024; John et al., 2022). This can further increase the uncertainty of future landslide susceptibility predictions (Reichenbach et al., 2018).
To mitigate these uncertainties, this study developed an annual landslide susceptibility model based on 2008–2023 landslide-related records from the Ministry of Natural Resources of China. Considering the spatial representativeness of the inventory, the modelling, validation and prediction were restricted to inhabited areas of China. The model employs an RF algorithm with feature engineering, combined with statistically downscaled climate projections from NASA Earth Exchange Global Daily Downscaled Projections (NEX-GDDP-CMIP6), to quantify future changes in rainfall-induced landslide susceptibility under different climate change scenarios. The results can provide critical insights for climate-adaptive land management and landslide risk-reduction strategies in vulnerable inhabited regions.
2.1 Landslide inventory
This study uses the national geohazard records of China for 2008–2023, provided by the Ministry of Natural Resources of the People's Republic of China, as the basic dataset for landslide susceptibility modelling and future trend analysis. The dataset was compiled annually and covers the whole of China each year, rather than only small areas affected by individual events. Therefore, the study area of each annual inventory is the whole of China. It includes the occurrence time and spatial location of landslides, debris flows, and collapses, which were collectively analysed as rainfall-induced landslide-related records in this study. The dataset includes both post-event records of occurred landslide-related geohazards and geohazard potential sites. The records of occurred hazards form a post-event inventory of landslide-related geohazards, compiled through post-event field investigation and verification by professional geological survey teams organized by local governments, together with multiple sources of information such as remote-sensing interpretation and UAV surveys, and then reported level by level. The dataset is mainly used for hazard verification, loss assessment, hazard identification, risk management, and geohazard prevention and control. Therefore, the recorded landslide-related records are mainly distributed in areas where slope failures may pose risks to people, infrastructure, or assets. The investigation and compilation procedures followed the industry technical specification, “Specification of Geological Hazard Risk Survey and Assessment (1 : 50 000)” (Ministry of Natural Resources of the People’s Republic of China, 2023). The minimum identifiable landslide area in the inventory is approximately 10 m2. Because the dataset was compiled annually within a unified national reporting framework, the standards for investigation, identification, recording, and compilation were generally consistent across years. However, because these operational records are mainly compiled for hazard verification, loss assessment, risk management, and geohazard prevention, their spatial representativeness is more defensible in areas with human presence. Therefore, the modelling domain of this study was restricted to inhabited areas of China, rather than the entire national territory. As a nationwide operational geohazard dataset, it may still be affected by differences in regional accessibility, reporting practices, and investigation intensity, which may lead to some underreporting in remote areas or for small-scale events. Figure 1 presents the spatial distribution of landslide-related records in the dataset. More detailed information is provided in Fig. S1 in the Supplement.
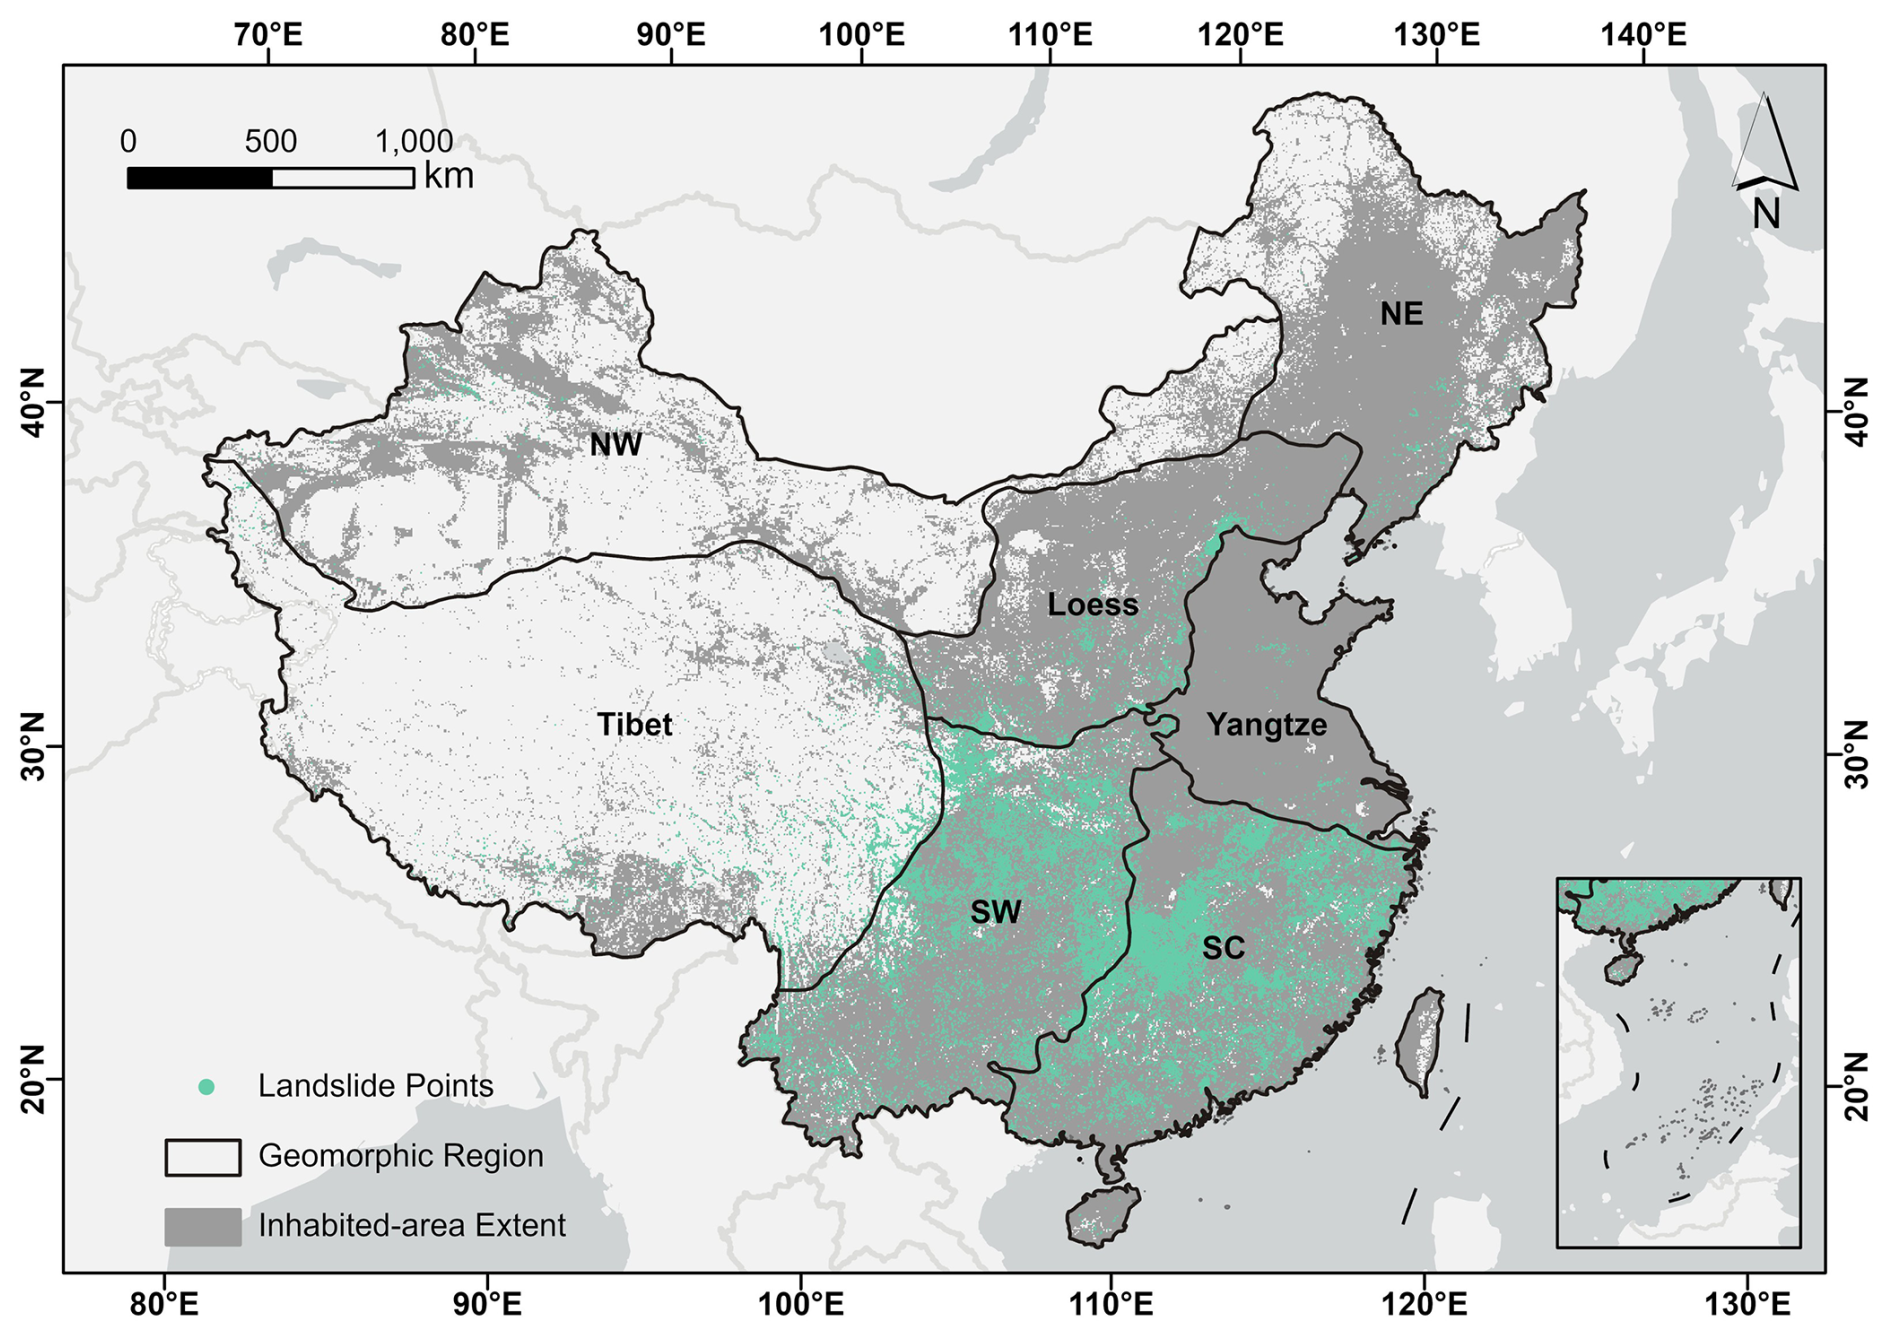
Figure 1Spatial distribution of rainfall-induced landslide-related records, inhabited-area extent, and major geomorphic regions in China. The grey background denotes the inhabited-area extent, which was used to define the study area. Geomorphic region boundaries were obtained from https://geocloud.cgs.gov.cn/ (last access: 14 August 2026). NE: Northeastern wetland ecology region; Yangtze: Huang-Huaihai-Yangtze River Delta plain region; SC: South China bedrock hills region; Loess: Northwest Loess Plateau region; SW: Southwest karst mountain region; NW: Northwest arid desert region; Tibet: permafrost region of the Qinghai-Tibet Plateau. Geological environmental region boundaries by © China Geological Survey (CGS). All rights reserved.
2.2 Landslide influencing factors
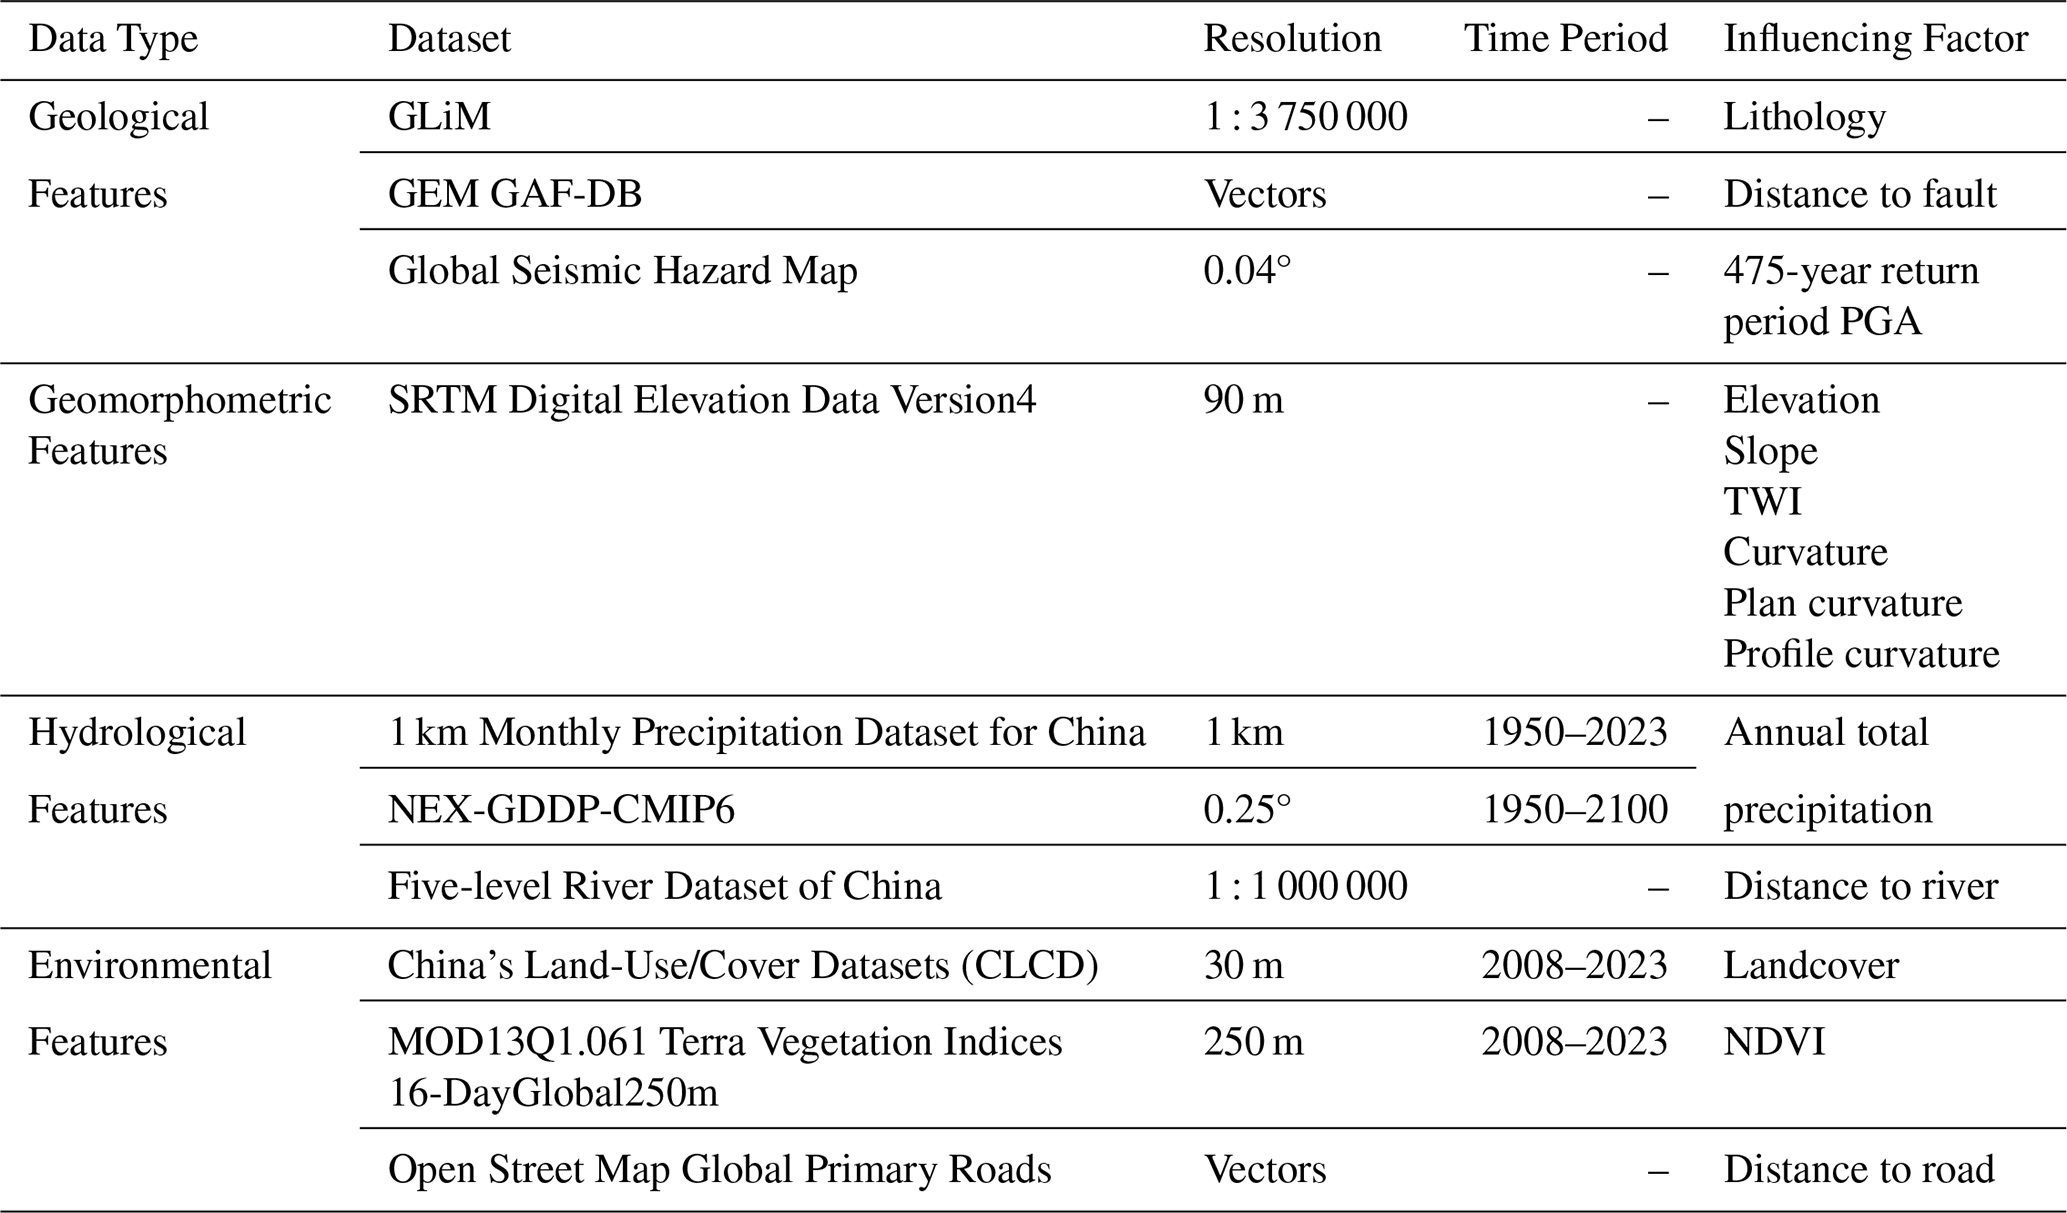
In this study, 14 factors that may influence landslide susceptibility were selected (Table 1), with their spatial distributions provided in Fig. S2. All variables were resampled to a resolution of 1 km × 1 km. For continuous variables such as elevation and distance to river, we used bilinear interpolation, while for discrete variables including lithology and land use type, we employed mode sampling. Specifically, taking land cover as an example, the original land-cover data had a spatial resolution of 30 m. For each 1 km grid cell, all 30 m land-cover pixels within the cell were counted by category, and the category with the highest frequency was assigned as the representative land-cover type of that 1 km cell. This approach avoids generating artificial class values and ensures that the resampled categorical variables retain their physical meaning.
Table 1Datasets and their corresponding landslide influencing factors. “–” indicates no time-series information.
2.2.1 Geological factors
Fault structures and lithological characteristics may affect slope stability by weakening the structural integrity of rock masses. Under the combined influence of earthquakes and heavy rainfall, geologically vulnerable areas are more likely to experience slope failure. This research combines three geological elements. First, the distance to fault was calculated. This calculation used the Euclidean Distance tool in ArcGIS Pro. The data were sourced from the Global Active Faults Database (GAF-DB), which contains spatial information for 13 500 faults (Styron and Pagani, 2020). The database is available at https://github.com/GEMScienceTools/gem-global-active-faults (last access: 14 August 2026). Second, lithology was represented using the Global Lithological Map (GLiM), compiled by the International Union of Geological Sciences (IUGS). The GLiM geodatabase was obtained from https://www.geo.uni-hamburg.de/en/geologie/forschung/aquatische-geochemie/glim.html (last access: 14 August 2026). This dataset has a scale of 1 : 3 750 000. It describes the engineering geological properties of surface rock layers (Hartmann and Moosdorf, 2012). Third, the 475-year return period peak ground acceleration (PGA) was adopted to characterize the long-term influence of seismic activity on slope stability. This indicator is not intended to represent earthquake-triggered landslides, but rather to describe long-term geological structural changes induced by seismic activity. Such changes may persist over time and increase the susceptibility of slopes to failure under intense or prolonged rainfall. Within this framework, earthquakes are regarded as influencing factors that modify geological structures, rather than as direct triggering mechanisms of landslides. Therefore, the PGA return period is incorporated as a long-term seismic background factor in rainfall-induced landslide susceptibility modelling (Leshchinsky et al., 2021). The 475-year RP PGA spatial distribution data came from Johnson et al. (2023). This dataset can be accessed and downloaded from https://hazard.openquake.org/gem (last access: 14 August 2026).
2.2.2 Geomorphometric factors
Geomorphometric factors are the main factors controlling the spatial distribution of surface runoff and soil moisture movement. They are also important predisposing factors for rainfall-induced slope failures. This study selects five geomorphological factors: elevation, slope, curvature, plan curvature, and profile curvature. The elevation data are sourced from the fourth edition of the Shuttle Radar Topography Mission (SRTM V4) digital elevation database provided by NASA (Jarvis et al., 2008), and the other four topographic factors were calculated based on ArcGIS Pro. The SRTM V4 dataset is available at https://srtm.csi.cgiar.org (last access: 14 August 2026).
2.2.3 Hydrological factors
We selected three hydrological factors for this study: annual total precipitation, distance to river, and the topographic wetness index (TWI). Precipitation data were obtained from the “China 1 km Resolution Monthly Precipitation Dataset (1901–2023)” provided by the Qinghai-Tibet Plateau Science Data Centre (Ding and Peng, 2020; Peng et al., 2017, 2018, 2019). This dataset was obtained from https://doi.org/10.5281/zenodo.3114194 (Peng, 2019). In this study, TWI was calculated based on SRTM V4 using the hydrological analysis tools in ArcGIS Pro. The river system affects slope stability through two primary mechanisms. First, riverbank erosion can compromise slope structural integrity. Second, the distance to river factor indirectly modulates slope instability by influencing surface runoff energy and erosion intensity. We employed the five-level river dataset of China at a 1 : 1 000 000 scale, which is available from https://open.geovisearth.com (last access: 14 August 2026). We then generated the distance-to-river map using the Euclidean Distance tool in ArcGIS Pro.
2.2.4 Environmental factors
Land cover and Normalized Difference Vegetation Index (NDVI) influence the occurrence of landslides by affecting surface runoff and infiltration. For example, areas with extensive vegetation cover have more permeable surfaces, while areas with urban land have large impermeable surfaces and lower infiltration rates. Land cover data is sourced from China's Land-Use/Cover Datasets (Yang and Huang, 2023), which is available at https://doi.org/10.5281/zenodo.15853565 (Yang and Huang, 2025). The NDVI was calculated by averaging all available MOD13Q1 V6.1 NDVI images from 2008 to 2023 in Google Earth Engine, which are available at https://doi.org/10.5067/MODIS/MOD13Q1.061 (Didan, 2021). Human activities may indirectly affect landslides by altering topography and land cover. For instance, road construction often involves cutting through slopes, weakening slope stability, and damaging soil and rock structures, which increases landslide susceptibility. In this study, road network data for China was obtained from OpenStreetMap (https://www.openstreetmap.org, last access: 14 August 2026). The distance to road was then calculated using the Euclidean Distance tool in ArcGIS Pro.
2.2.5 Simulation data
High-resolution climate projections from the NEX-GDDP-CMIP6 dataset (0.25° spatial resolution) were used to drive the simulation of future landslide susceptibility within the inhabited-area modelling domain of China (Thrasher et al., 2022). This dataset was obtained from https://registry.opendata.aws/nex-gddp-cmip6 (last access: 14 August 2026). This study comprehensively selects three typical shared socioeconomic pathway (SSP) scenarios: SSP1-2.6 (sustainable development path), SSP2-4.5 (middle-of-the-road path), and SSP5-8.5 (high carbon emission path). These scenarios cover simulation output data from 31 General Circulation Models (GCMs). The study compares the spatial and temporal variation characteristics of mean annual precipitation during the historical baseline period (1950–2014) and future periods: near-term future (2026–2050), mid-term future (2051–2075), and long-term future (2076–2100). It should be noted that this study focuses on national-scale, long-term variations in annual landslide susceptibility, rather than on the detailed representation of individual landslide-related records or localized extreme rainfall triggering mechanisms. Within this spatial–temporal framework, the primary objective is to identify the relative spatial patterns and long-term evolution of landslide susceptibility under different climate change scenarios. Previous studies have shown that, at large spatial scales and over long-term periods, CMIP6 climate model outputs can be used to characterize overall trends in climate-change-related landslide processes (Duan et al., 2025; Lin et al., 2022). Building on this framework, this study adopts NEX-GDDP-CMIP6 data, which preserve long-term climate change signals while providing higher spatial resolution; therefore, data at this resolution are suitable for landslide susceptibility assessment under climate change.
3.1 Framework for this work
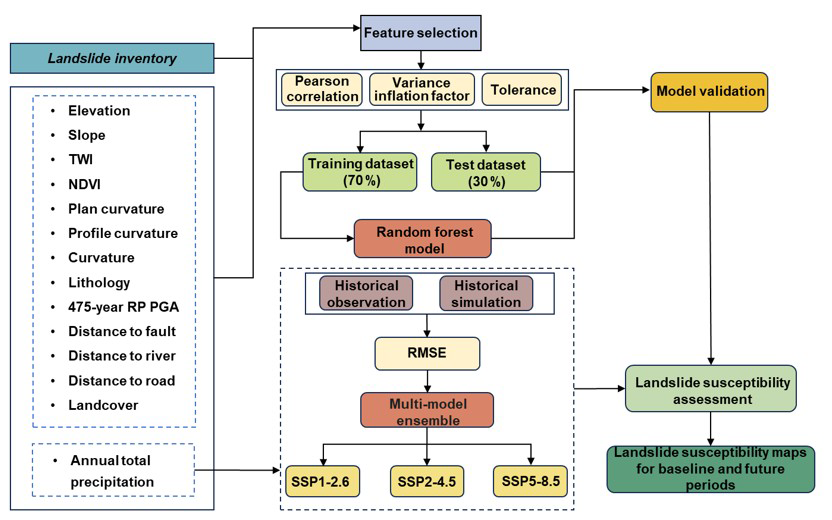
The assessment of rainfall-triggered landslide susceptibility within inhabited areas of China under climate change is structured into six key steps (Fig. 2): (1) extracting landslide-related records from the inventory and generating negative samples by random sampling within the inhabited-area modelling domain and outside buffer zones around recorded locations; (2) applying feature selection techniques to identify the conditioning factors from landslide conditioning variables; (3) constructing a feature matrix by extracting static and dynamic conditioning factors at each sample point, and dividing the dataset into training (70 %) and testing (30 %) sets; (4) training and optimizing an annual landslide susceptibility model using the RF algorithm; (5) LSM for both historical and future periods by applying downscaled climate projections under different climate change scenarios; (6) analysing the spatiotemporal changes in landslide susceptibility within inhabited areas of China under various climate change scenarios.
3.2 Extraction of positive samples and generation of negative samples
All officially documented landslide-related records were spatialized in ArcGIS Pro, resulting in 93 935 point-based records, all of which were retained as positive samples. This is because the inventory represents post-event operational geohazard records collected through on-site investigation and reporting procedures. The inhabited-area mask was used to define the modelling and prediction domain and to constrain the generation of negative samples. Each recorded location was treated as one point-based positive sample for model training. A 3 km buffer was then established around each recorded location. It should be noted that the pixels within these buffers were not converted into additional positive samples. Instead, the buffers were used only as exclusion zones to prevent negative samples from being selected too close to recorded locations, where the absence of documented landslide-related records may be uncertain. Negative samples were randomly generated within the inhabited-area modelling domain and outside all buffers around the recorded locations. The number of negative samples was set to twice the number of positive samples. Therefore, the 1 : 2 ratio refers to the number of point-based training samples, rather than to the total number of pixels within the buffers. The larger number of negative samples was used to better capture the environmental heterogeneity of stable areas while maintaining a manageable and relatively balanced training dataset. Because true absence locations are generally not directly available in landslide susceptibility modelling, the selection of negative samples can substantially affect model performance and prediction reliability (Zhu et al., 2019; Guo et al., 2024). To ensure the representativeness of negative samples, they were generated only within areas with human presence. Human presence was defined using the WorldPop R2025A population dataset. The population data were converted into a binary inhabited-area mask, in which grid cells with human presence were assigned a value of 1 and grid cells without human presence were assigned a value of 0. This binary mask was used only to constrain the inhabited-area modelling domain and negative sample generation (Bondarenko et al., 2025). Population data are publicly available at https://hub.worldpop.org/ (last access: 14 August 2026). To maintain temporal consistency, each negative sample was randomly assigned a year between 2008 and 2023 according to the temporal distribution of the positive samples.
3.3 Feature selection
Feature selection is an essential preprocessing step for high-dimensional data analysis, visualization, and modelling. In this study, two methods were employed for feature selection to enhance computational efficiency while preserving the accuracy of the model: Pearson correlation coefficient and tolerance (TOL) and variance inflation factor (VIF).
3.3.1 Pearson correlation coefficient
To quantify the linear relationship between features, the Pearson correlation coefficient was computed. A correlation was considered strong and statistically significant if the absolute value of the correlation coefficient () exceeded 0.7 and the associated p-value was less than 0.05. When such highly correlated features were identified, we addressed potential multicollinearity by removing one of the redundant features. This approach provides a quantitative means of identifying and mitigating multicollinearity among input features (Li et al., 2022).
Here, r is the Pearson correlation coefficient; n is the sample size; X and Y are the variables; and are the sample means of X and Y, respectively; σx and σy are the sample standard deviations.
3.3.2 Tolerance and variance inflation factor
A strong linear relationship between two influencing factors may reduce a model's predictive accuracy. To diagnose potential multicollinearity, TOL and VIF are widely used. Multicollinearity is indicated when TOL < 0.1 and VIF > 10. In such cases, variables exhibiting high collinearity should be removed (He et al., 2021; O'Brien, 2007; Roy and Saha, 2019). The specific formulas are as follows.
Here, represents the coefficient of determination obtained by regressing the ith independent variable on the remaining m−1 independent variables.
3.4 Generation of a feature matrix
Relevant features were extracted for each sample point. Dynamic variables were obtained by constructing a time-series three-dimensional matrix (time × location × variable) in Python. Static variables, such as elevation and slope, were extracted using the Extract Multi Values to Points tool in ArcGIS Pro. All extracted variables were then integrated into a single feature matrix for model training.
3.5 RF algorithm
RF is an ensemble learning algorithm that improves predictive performance by building and aggregating multiple decision trees (Breiman, 2001). The algorithm employs bootstrap aggregation, whereby each tree is trained on a randomly drawn bootstrap sample from the original dataset, and at each node, a random subset of features is selected for splitting. This randomization process promotes model diversity and robustness, enhancing accuracy and reducing sensitivity to noise and outliers (Stumpf and Kerle, 2011). By averaging the results of multiple trees, RF effectively reduces variance and the risk of overfitting, making it more robust than individual decision trees. In addition, RF can efficiently handle high-dimensional datasets and categorical variables with minimal preprocessing or encoding. Importantly, RF provides feature importance measures, which facilitate the identification of key variables influencing model predictions (Bureau et al., 2003). These strengths make RF particularly suitable for tasks such as landslide susceptibility mapping, where high accuracy, robustness, and interpretability are essential.
3.6 Model training and performance evaluation
Accurate evaluation of the RF model is essential for predicting future changes in landslide susceptibility. In this study, we employed several widely used evaluation metrics, including accuracy, precision, recall, F1-score, the receiver operating characteristic (ROC) curve, and the area under the curve (AUC). These metrics are derived from the confusion matrix (Hossin and Sulaiman, 2015), with values closer to 1 indicating better model performance. Specifically, the ROC curve visualizes the trade-off between the false positive rate (FPR) on the x-axis and the true positive rate (TPR) on the y-axis.
For model development and validation, we randomly split the dataset into training (70 %) and testing (30 %) subsets. RF model was trained on the training subset, and all performance metrics were evaluated on the independent testing subset to avoid overfitting. Model hyperparameters were optimized and set to n_estimators = 886, max_depth = 20, max_features = “sqrt”, and min_samples_split = 6, using the Gini index as the splitting criterion.
Here, TP (true positive) and TN (true negative) represent the number of positive and negative samples that are correctly classified, respectively. FP (false positive) refers to the number of negative samples that are incorrectly classified as positive samples, while FN (false negative) refers to the number of positive samples that are incorrectly classified as negative samples.
3.7 Assessment of future landslide susceptibility
We selected 31 GCMs from the NEX-GDDP-CMIP6 dataset. Each of these models includes the SSP1-2.6, SSP2-4.5, and SSP5-8.5 scenarios. Then, we evaluated the performance of these models against historical observations using the root mean square error (RMSE) to identify those suitable for China (Table S1). Subsequently, based on the selected models, we constructed a multimodel ensemble of annual precipitation, which was used to establish the historical baseline and to project future landslide susceptibility under different climate scenarios (SSP1-2.6, SSP2-4.5, and SSP5-8.5) and future periods, including the near-term future (2026–2050), mid-term future (2051–2075), and long-term future (2076–2100). To further account for uncertainty in rainfall-induced landslide susceptibility inhabited areas of China, we applied a 95 % confidence interval derived from the T-distribution. The landslide susceptibility classes were defined based on the mean susceptibility map of the historical baseline period. Specifically, annual landslide susceptibility maps from 1950 to 2014 were first averaged pixel by pixel to generate the baseline mean susceptibility map. The Jenks natural breaks method was then applied to this baseline map to classify landslide susceptibility into five levels: very low, low, median, high, and very high. The corresponding thresholds were 0–0.0086, 0.0086–0.2582, 0.2582–0.4617, 0.4617–0.6769, and 0.6769–1.0, respectively. To ensure comparability across different periods and climate scenarios, the classification thresholds derived from the baseline period were consistently applied to all subsequent susceptibility assessments. Finally, we assessed the impact of climate change on landslide susceptibility by analysing the changes in susceptibility relative to the baseline period across the different future periods and climate change scenarios.
4.1 Selection of conditioning factors
First, Pearson correlation coefficients were used to select the most suitable landslide influencing factors from 12 continuous variables. The correlation coefficients among these 12 factors are shown in the correlation matrix (Fig. 3a). A strong positive correlation was observed between plan curvature and curvature (r = 0.85, p < 0.05); therefore, curvature was removed to avoid multicollinearity. To further verify whether the remaining 11 continuous variables and 2 categorical variables were suitable for landslide susceptibility modelling, multicollinearity tests were conducted (Fig. 3b–c). All factors had TOL values greater than 0.1 and VIF values less than 10, indicating no multicollinearity among the 13 influencing factors. The final selected factors included annual total precipitation, TWI, elevation, 475-year RP PGA, NDVI, plan curvature, profile curvature, slope, distance to road, distance to fault, distance to river, landcover, and lithology.
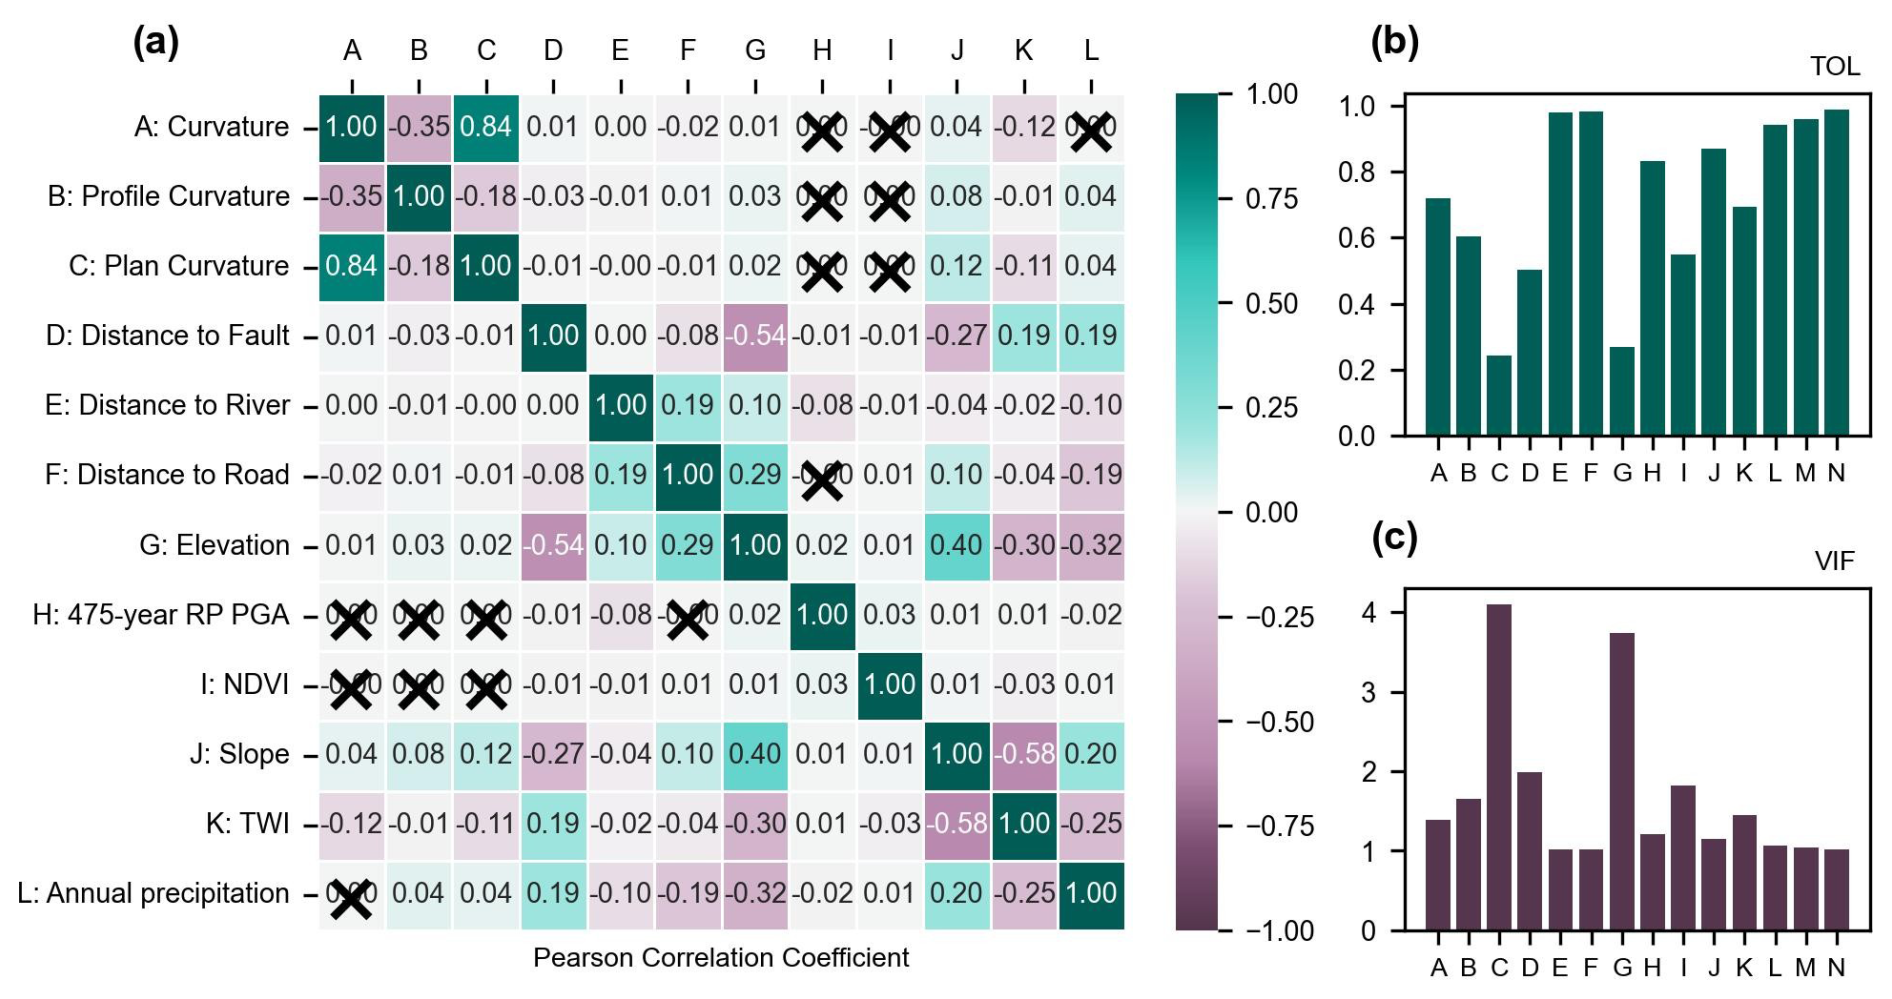
Figure 3The results of feature selection in this study: (a) Pearson correlation coefficients between landslide influencing factors (“×” indicates no significant linear relationship [p value > 0.05]). (b) TOL and VIF for different landslide influencing factors. M: Lithology, N: Landcover.
4.2 Model evaluation
Model performance evaluation is a crucial component in the analysis of future rainfall-induced landslide susceptibility. In this study, 30 % of the sample data were utilized as a test set to assess the performance of the RF model. As illustrated in Fig. 4, model performance was visually analysed through the ROC curve and the confusion matrix. The RF model demonstrated good predictive performance, with an AUC value as high as 0.96. In the test set, the model achieved an accuracy of 0.89, a precision of 0.87, a recall of 0.80, and an F1 score of 0.83, validating its robust predictive performance. Additionally, through the analysis of Gini coefficients in the RF model, we explored the interpretability of the model. The results revealed that annual total precipitation was the key factor influencing model predictions, with a contribution rate as high as 16 %, significantly higher than other factors. Slope contributed 12 % and elevation contributed 10 % to the model (Fig. S3).
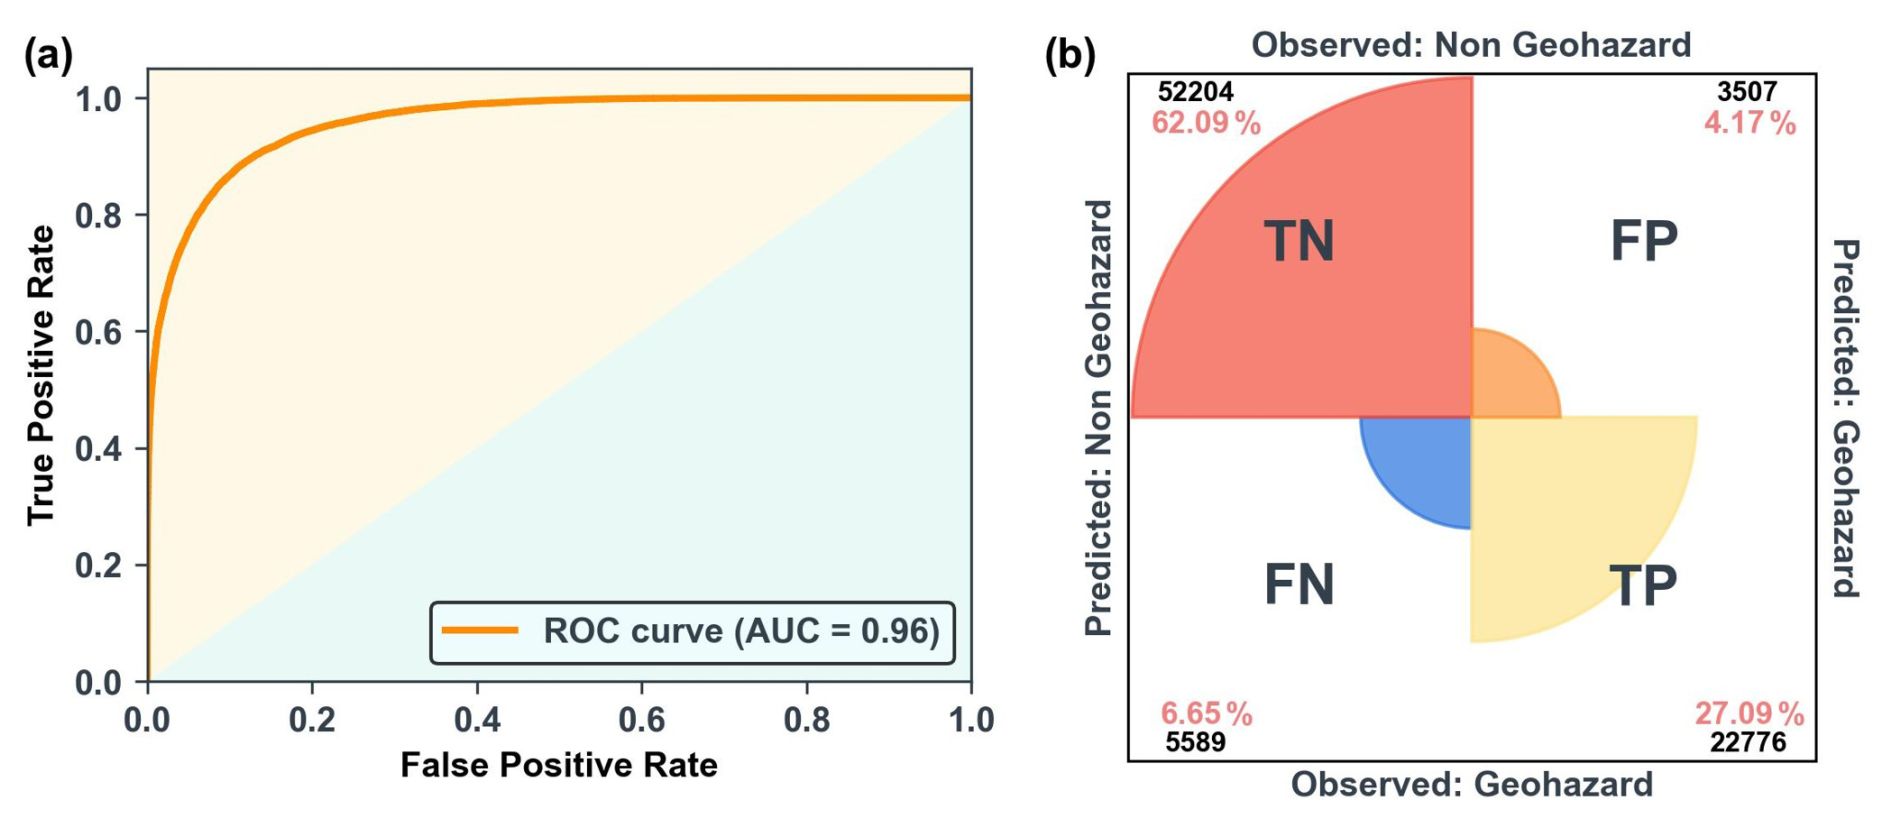
Figure 4Performance evaluation of the RF model. (a) The ROC curve demonstrates the model's classification capability, with an AUC of 0.96. (b) The confusion matrix provides a detailed breakdown of the prediction results, including the numbers of correctly and incorrectly classified samples in each category.
4.3 Influence of key factors on landslide susceptibility
We analysed the relationship between landslide susceptibility and key influencing factors within inhabited areas of China during the historical baseline period (1950–2014). The top six continuous variables identified by RF importance ranking were categorized, and the area proportions of each category within different landslide susceptibility classes were calculated (Fig. 5). The results show that mean annual precipitation, slope, and NDVI are strongly positively correlated with landslide susceptibility. In areas with mean annual precipitation greater than 800 mm, the proportions of very high, high, and median susceptibility zones are 82.64 %, 86.56 %, and 75.33 %, respectively (Fig. 5a). Landslide susceptibility also increases markedly with slope. In areas with slopes steeper than 20°, the proportions of very high, high, and median susceptibility zones reach 51.43 %, 34.38 %, and 20.57 %, respectively (Fig. 5b). Similarly, in regions where NDVI exceeds 0.5, these proportions are 84.46 %, 79.80 %, and 66.57 %, respectively (Fig. 5f). These findings indicate that high landslide susceptibility is closely associated with humid environments, steep terrain, and relatively high NDVI values. Elevation exhibits a nonlinear relationship with landslide susceptibility, with higher susceptibility concentrated in low-elevation regions. Specifically, 65.53 %, 64.27 %, and 55.08 % of the very high, high, and median susceptibility zones are distributed below 1000 m (Fig. 5c). Landslide susceptibility is generally higher within 0–50 km of faults, decreases at intermediate distances, and shows a secondary increase at 200–500 km (Fig. 5e). The relationship between 475-year RP PGA and landslide susceptibility is nonlinear (Fig. 5d). In general, areas with very high and high susceptibility are more concentrated in the lowest PGA class, while their proportions decrease in the intermediate classes and increase slightly again in the highest PGA class. This suggests that seismic background conditions may not act as a direct trigger of rainfall-induced landslides, but may indirectly increase slope sensitivity to subsequent rainfall by damaging geologic structures and reducing slope stability.
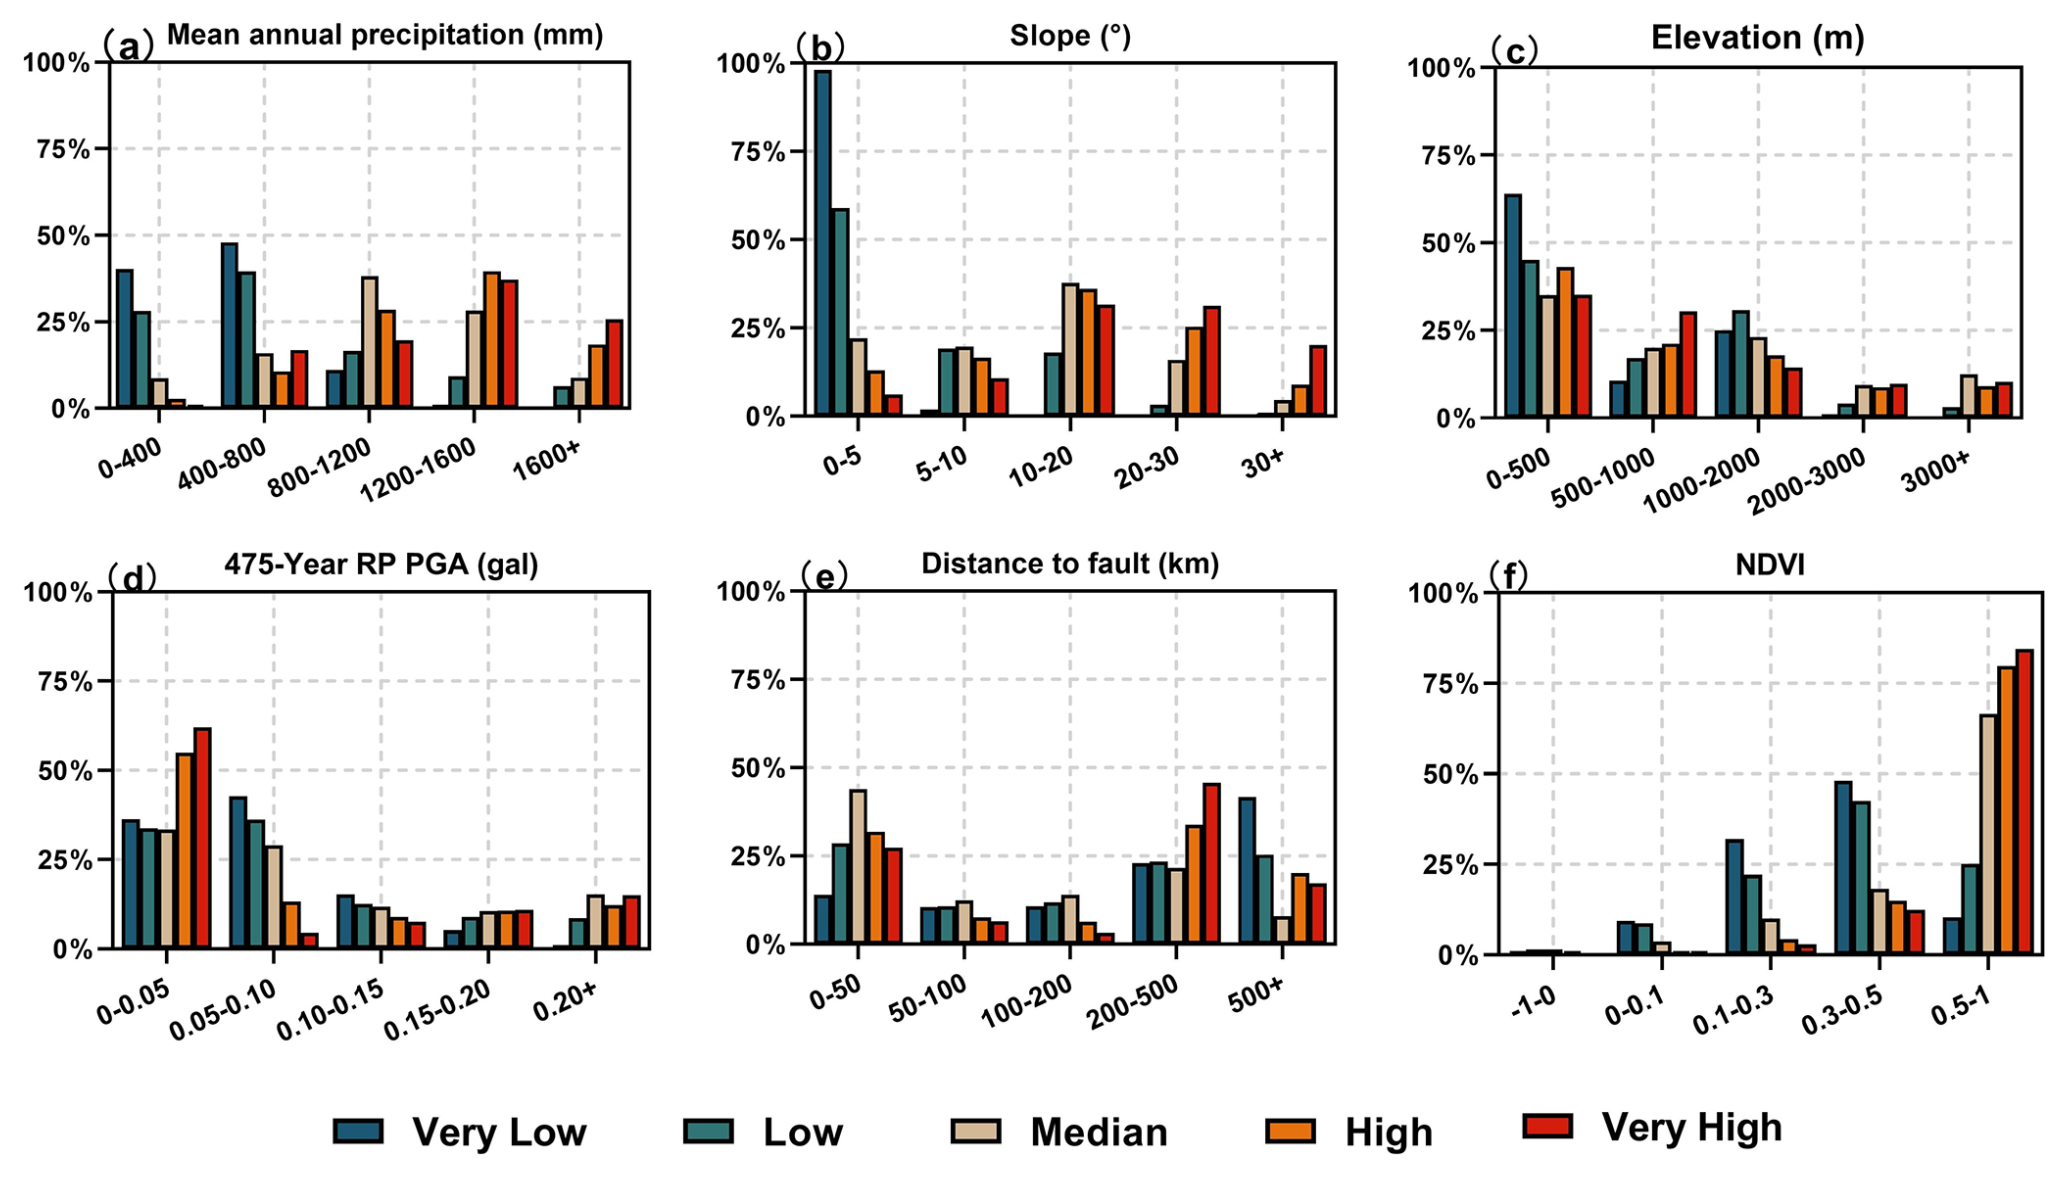
Figure 5Area proportions of landslide susceptibility classes across different categories of the top six continuous variables within inhabited areas of China during the historical baseline period (1950–2014): (a) mean annual precipitation, (b) slope, (c) elevation, (d) 475-year RP PGA, (e) distance to fault, and (f) NDVI. Colours indicate susceptibility levels from very low to very high.
We further analysed the effects of multi-factor combinations on the spatial distribution of landslide susceptibility within inhabited areas of China during the historical baseline period (1950–2014). Using the top three variables ranked by feature importance derived from the RF model (mean annual precipitation, slope, and elevation), we calculated the area proportion of regions with median to very high landslide susceptibility under different combinations, and visualized the results as heatmaps (Fig. 6). In the precipitation–slope combinations (Fig. 6a), the proportion of median to very high susceptibility areas generally increases with increasing slope, and this tendency becomes more pronounced under relatively high precipitation conditions. The highest value (96.33 %) is observed in areas with slopes greater than 30° and mean annual precipitation of 800–1200 mm. In the precipitation–elevation combinations (Fig. 6b), high susceptibility is mainly concentrated in areas with relatively high precipitation, the effect of elevation is nonlinear; the maximum proportion (93.71 %) is observed in areas above 3000 m with precipitation of 800–1200 mm. The elevation–slope combinations (Fig. 6c) further indicates that highly susceptible areas tend to occur where steep slopes coincide with relatively low and high elevations. In particular, the 0–500 and 2000–3000 m elevation ranges exhibit higher landslide susceptibility under steep-slope conditions.
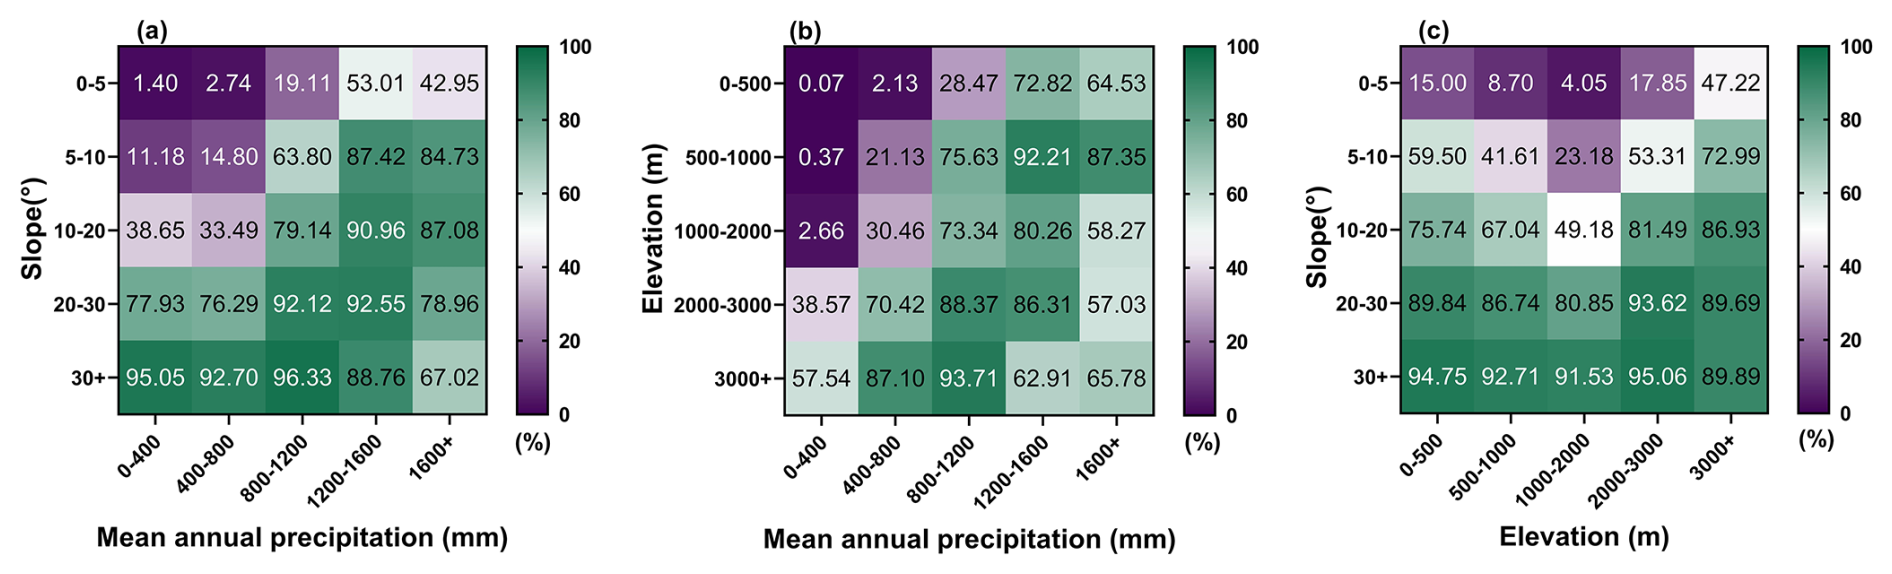
Figure 6Area proportions (%) of median to very high landslide susceptibility within inhabited areas of China during the historical baseline period (1950–2014), based on combinations of key continuous variables: (a) mean annual precipitation and slope, (b) mean annual precipitation and elevation, and (c) elevation and slope. Each cell represents the proportion of areas with median to very high susceptibility (classes 3–5) within the total area corresponding to that specific combination of factor ranges.
4.4 Future precipitation changes
Figure 7 shows projected changes in mean annual precipitation across China and its geological environmental zones under three climate scenarios and future periods, relative to the baseline. Overall, multimodel ensemble simulations show that future mean annual precipitation across China exhibits an increasing trend. The relative increases and associated uncertainties are greater under the SSP5-8.5 than under the SSP1-2.6 and SSP2-4.5. Compared to the near-term (2026–2050) and mid-term future (2051–2075), the long-term future (2076–2100) generally shows larger increases. According to projections from the NEX-GDDP-CMIP6 multimodel ensemble, mean annual precipitation in China is expected to increase by 59, 63, and 111 mm under the SSP1-2.6, SSP2-4.5, and SSP5-8.5, respectively, during the long-term future from 2076 to 2100. These correspond to increases of 10.46 %, 11.18 %, and 19.14 % relative to the baseline.
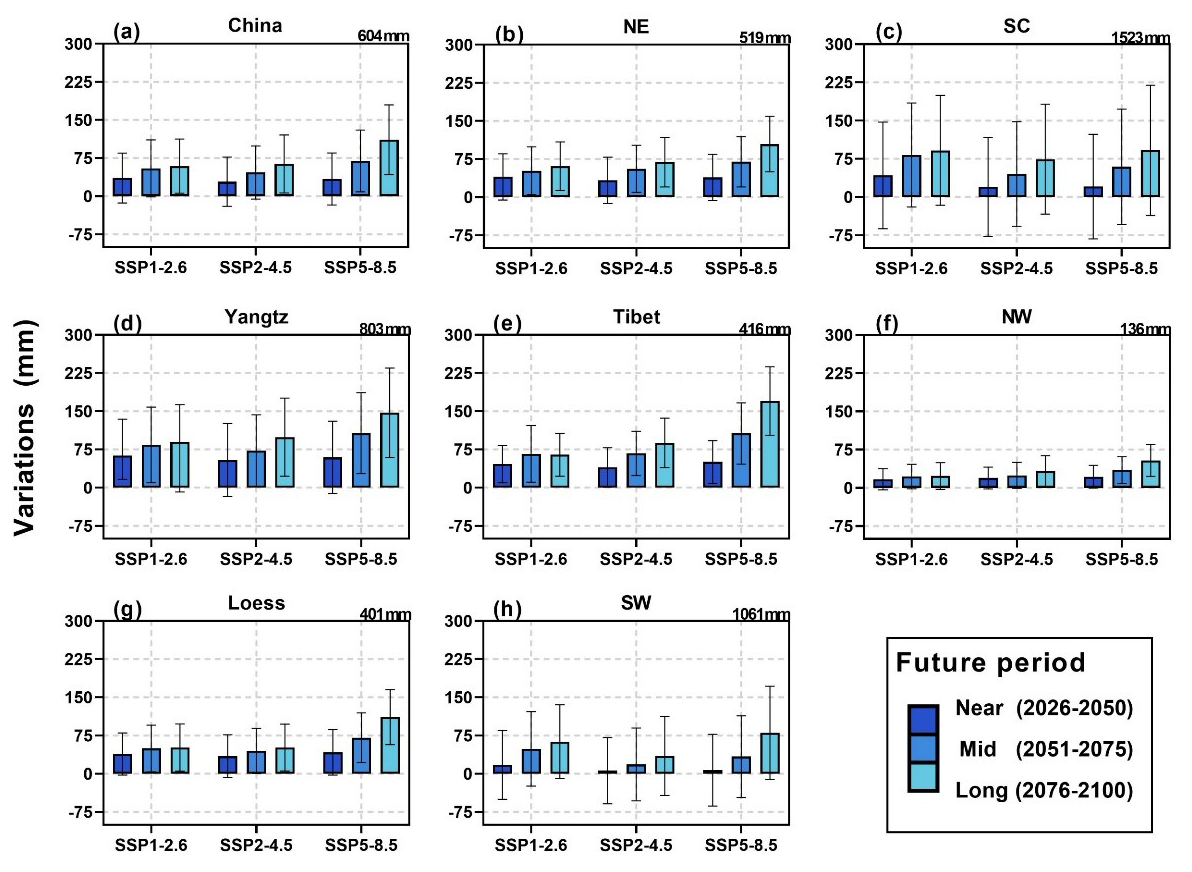
Figure 7Changes in multimodel mean annual precipitation under different future scenarios and time periods relative to the baseline (1950–2014). Bars represent the mean change derived from the multimodel ensemble, while error bars indicate the 95 % confidence interval, reflecting the uncertainty in projected mean annual precipitation. The value in the upper right corner of each panel represents the mean annual precipitation during the baseline period.
Projected changes in mean annual precipitation exhibit substantial spatial heterogeneity across different geological environmental zones. In the NW, where the baseline mean annual precipitation is only 136 mm, the relative increase in future mean annual precipitation remains low. During the long-term future under the SSP5-8.5, the increase is 59 mm. In geological environmental zones where baseline mean annual precipitation ranges from 400 to 900 mm, the relative increases in mean annual precipitation are generally higher, particularly in the Tibet and Yangtze. For instance, during the long-term future, under the SSP5-8.5, the largest increases are projected in these regions, reaching 170 and 147 mm, respectively. In the Southern region including SC and SW, where baseline mean annual precipitation exceeds 1000 mm, the absolute increase is relatively smaller compared to areas with baseline mean annual precipitation between 400 and 1000 mm. In the geological environment division, the associated uncertainties are the highest.
4.5 Future landslide susceptibility
Figure 8a illustrates the spatial distribution of landslide susceptibility within inhabited areas of China during the baseline period (1950–2014). The results show that approximately 61.34 % of the inhabited-area modelling domain exhibited low to very low susceptibility, primarily located in northern Tibet, southern NW, the northwestern Loess, and central NE. Regions with median to very high susceptibility accounted for 38.66 % of the total simulated area, mainly distributed across SC, SW, eastern Tibet, and the Loess–Taihang Mountain area. Notably, in the SC, approximately 70.42 % of the area was exposed to median to very high landslide susceptibility. Figure 9 illustrates the increase in the area of median to very high landslide susceptibility zones within inhabited areas of China compared to the baseline period across future scenarios and periods. Overall, the spatial extent of median to very high susceptibility zones is projected to expand under all future scenarios and periods. The expansion is more pronounced under SSP5-8.5 compared to SSP1-2.6 and SSP2-4.5. In addition, long-term future shows a more significant increase in susceptibility area than near-term and mid-term future. In the baseline period, the proportion of median to very high susceptibility areas within the inhabited-area modelling domain is 38.66 %. During the long-term future under the SSP5-8.5, it increases to 40.98 %, corresponding to a spatial expansion of approximately 1.2 × 10⁵ km2.
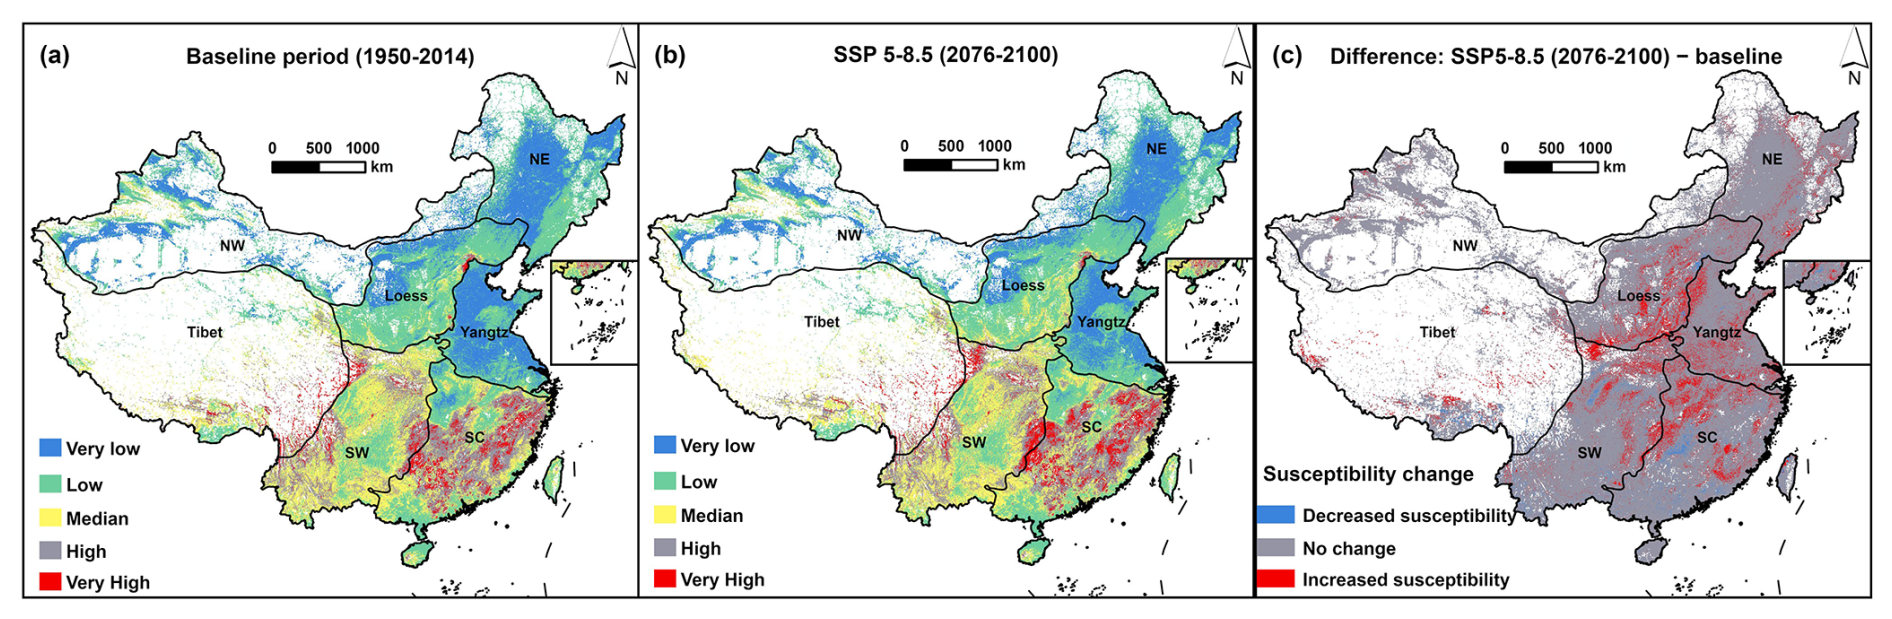
Figure 8Spatial pattern of landslide susceptibility within inhabited areas of China during (a) the baseline period (1950–2014), and (b) the long-term future (2076–2100) under the SSP5-8.5, and (c) the spatial change in susceptibility between the two periods. In panel (c), increased susceptibility indicates that the susceptibility class under SSP5-8.5 is higher than that during the baseline period, no change indicates that the susceptibility class remains unchanged, and decreased susceptibility indicates that the susceptibility class becomes lower.
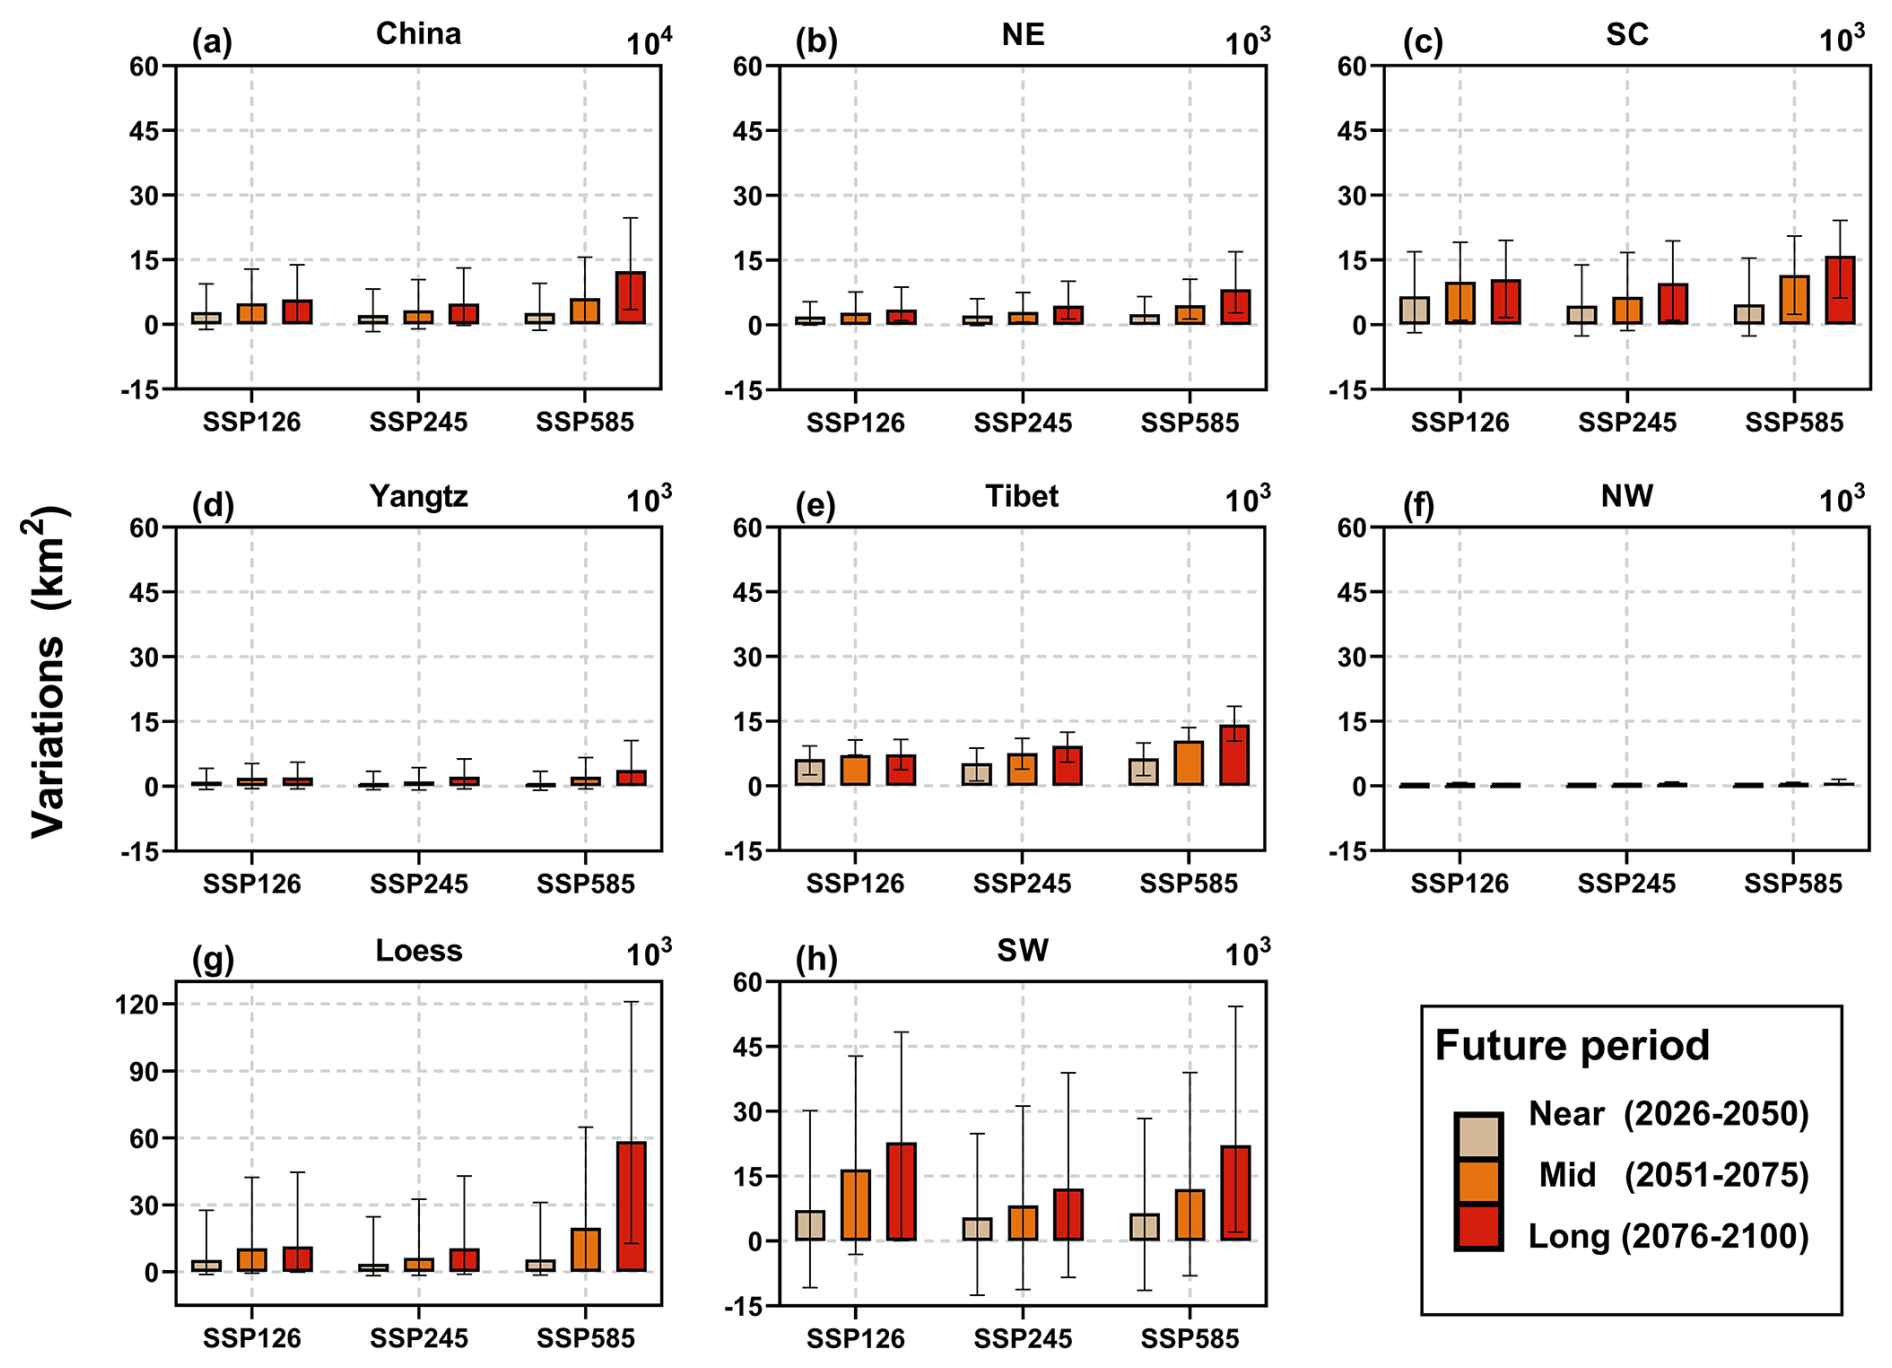
Figure 9Changes in the area of regions with median to very high landslide susceptibility within inhabited areas of China under different future periods and SSPs, relative to the baseline period. Bars represent the multimodel ensemble mean changes, and error bars indicate the 95 % confidence interval of the ensemble mean.
At the regional scale, all geological environmental regions within inhabited areas show an increasing trend in the extent of median to very high landslide susceptibility areas. The Loess and the SW exhibit the most significant expansion (Figs. 8, 9, and S4). In the baseline period, the proportion of areas with median to very high susceptibility in these regions is 10.07 % and 79.81 %, respectively. During the long-term future under the SSP5-8.5, these proportions increase to 17.38 % and 81.85 %, corresponding to area increases of 5.9 × 10⁴ and 2.2 × 10⁴ km2. These expansions mainly occur in northern SW, and around the Taihang Mountains in the Loess (Figs. 8 and S4). During the long-term future under the SSP5-8.5, other regions such as SC, Tibet and NE also show increases. According to the multimodel ensemble averages, the areas of median to very high susceptibility in these regions increase by approximately 1.6 × 10⁴, 1.4 × 10⁴, and 8.3 × 10³ km2, respectively, compared to the baseline. The expansions are mainly located in northern SC, eastern Tibet and southern NE. The NW and Yangtze show relatively small increases in median to very high susceptibility areas based on the ensemble mean (Fig. 8).
4.6 Revealing the relationship between landslide-related records and conditioning factors
To further investigate the relationship between landslide-related records and conditioning factors, this study selected the top nine conditioning factors based on feature importance rankings from a random forest model for a graded statistical analysis (Fig. 10). For continuous variables, the natural break method was applied for classification, and landslide frequencies were calculated for each interval. Here, the total samples consisted of landslide-related records and negative samples generated at twice the number of positive samples. The results showed a clear positive relationship between annual total precipitation and landslide frequency (Fig. 10a). Landslide frequency generally increased with annual precipitation and exceeded 50 % when annual precipitation was greater than 1147 mm. Landslide frequency increased markedly with slope and exceeded 60 % when the slope was greater than 25° (Fig. 10b). In terms of elevation, the landslide frequency exhibited an M-shaped pattern with increasing altitude. The frequency was lowest in the −217–112 m elevation range, at only 16 %, whereas it reached a peak in the 2338–3514 m elevation band, with the highest value of 59 % (Fig. 10c). For the 475-year return period PGA, rainfall-induced landslides were mainly concentrated in the low-value intervals, while the frequency showed a secondary increase in some high-value intervals. This may suggest that seismic background conditions indirectly influence rainfall-induced landslides by weakening slope stability (Fig. 10d). Landslide-related records were more numerous near fault lines, especially within 0–40 km. However, landslide frequency did not decrease monotonically with fault distance and reached relatively high values in some intermediate-distance intervals (Fig. 10e). NDVI, which reflects vegetation coverage, showed an increasing trend in landslide frequency as NDVI values increased. When NDVI exceeded 0.56, landslide frequency was generally greater than 45 % (Fig. 10f). Profile curvature showed a pattern of higher landslide frequency at both ends and lower frequency in the middle: the frequency was lowest in the near-zero interval (−0.02–0.01), at only 15 %, but increased markedly toward both negative and positive extreme ranges, reaching as high as 70 %. This suggests that nearly planar slopes are relatively stable, whereas strongly concave or convex slopes are more susceptible to rainfall-induced instability (Fig. 10g). TWI showed a negative correlation with landslide frequency: as TWI increased, the frequency decreased continuously from 60 % in the low-value interval of 14.2–15.9 to 1.5 % in the high-value interval of 25.8 and above. This indicates that landslide-related records are more likely to occur in areas with lower TWI (Fig. 10h). Among all lithological types, siliciclastic sedimentary rocks (ss) contained the largest number of landslide-related records, with 26 298 cases (Fig. 10i).
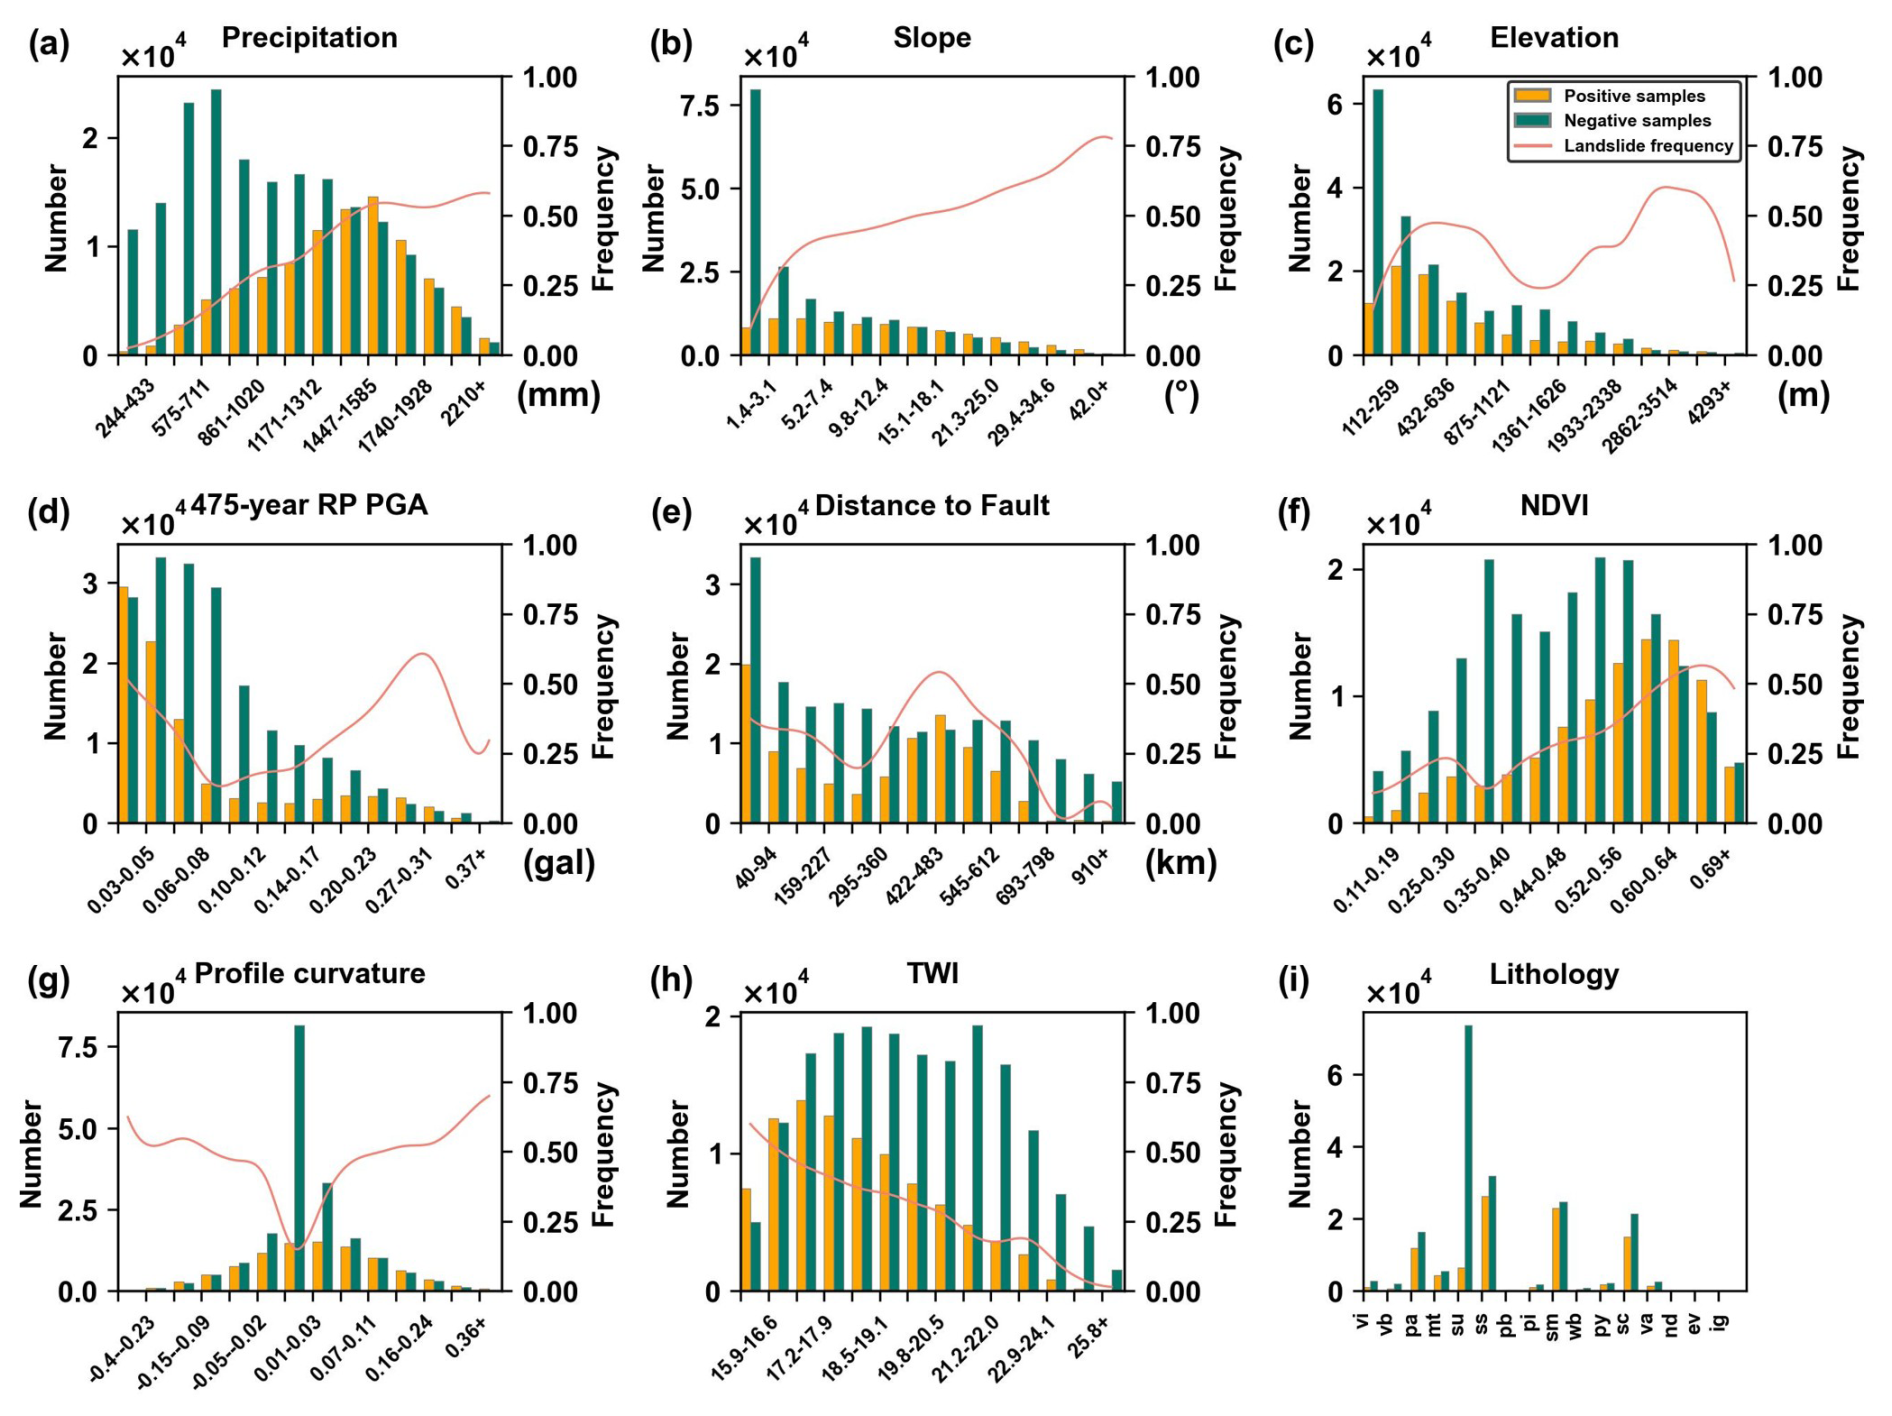
Figure 10Relationship between positive and negative samples and conditioning factors. (a) Precipitation: Annual total precipitation, (b) Slope, (c) Elevation, (d) 475-year return period PGA, (e) Distance to Fault, (f) NDVI, (g) Profile curvature, (h) TWI, and (i) Lithology. The red line represents the landslide frequency, calculated as the proportion of positive samples among all samples within each classified interval.
This study investigated the future trends of rainfall-induced landslide susceptibility within inhabited areas of China under various climate change scenarios using SSP1-2.6, SSP2-4.5, and SSP5-8.5 from the NEX-GDDP-CMIP6 climate dataset. An RF model, trained with a relatively complete landslide inventory, was employed for this analysis. In the landslide susceptibility modelling, we focused on rainfall-triggered landslide-related records. During model construction, landslides, collapses, and debris flows were grouped into a single “landslide-related category” category, which is a common practice in landslide inventory compilation. To assess the influence of this merging, we compared the susceptibility maps derived from the grouped-category model with those from a landslide-only model. The two maps showed a relatively high degree of consistency (Pearson's r = 0.924; MSE = 0.187), indicating that the merging had a relatively small impact on the overall spatial pattern of susceptibility within the inhabited-area modelling domain, although minor numerical differences remained (Fig. S5). In addition, we compared susceptibility maps produced using two different non-landslide sampling strategies: random sampling across the whole study area and sampling restricted to areas with human presence. The results revealed substantial differences between the two approaches. When non-landslide samples were randomly generated across the whole of China, susceptibility tended to be overestimated in densely recorded regions, such as SC and SW, while being underestimated in sparsely recorded regions, such as NW and Tibet (Fig. S6). This was also reflected in the feature-importance results, where whole-area random sampling led to lower importance of geomorphological and lithological factors (Fig. S3). This is likely because the landslide inventory used in this study was compiled by integrating post-event investigations and annual geological hazard potential-site surveys, and these records are relatively more concentrated in areas with human settlements and activities. Under such conditions, randomly generating non-landslide samples across the entire study area may incorrectly treat poorly surveyed or uninhabited regions as true negatives, thereby amplifying the effect of spatial inventory incompleteness and increasing the uncertainty and spatial bias in susceptibility mapping results (Reichenbach et al., 2018). Therefore, for inventories such as the one used in this study, in which records are more concentrated in areas with human presence, negative samples may be better generated within inhabited areas to reduce spatial sampling bias.
In landslide susceptibility modelling, this study incorporated annual total precipitation as one of the precipitation-related predictors. It should be noted that monthly precipitation may better represent antecedent rainfall and soil saturation. However, in the context of this study, annual total precipitation can be regarded as a representation of the regional long-term hydroclimatic background: it reflects overall precipitation regimes and their interannual variability and may influence the spatial patterns of landslide susceptibility within inhabited areas through its effects on hydro-environmental conditions, including soil moisture, vegetation cover, and slope stability (Reichenbach et al., 2018; Lin et al., 2021). In addition, the landslide inventory released for this study includes only the year of occurrence; the month and day of occurrence are not available. This limits the ability to establish a temporally consistent linkage with monthly or daily antecedent precipitation indices. The use of annual total precipitation helps maintain temporal comparability between the precipitation indicator and the landslide timing resolution and serves as a proxy for long-term wetness conditions. Previous studies at national or regional scales have also commonly adopted annual-scale precipitation variables (e.g., annual total precipitation or multi-year mean annual precipitation) as climatic background factors to provide a broad-scale constraint in landslide susceptibility modelling (Reichenbach et al., 2018; Lin et al., 2021). The feature importance results of this study indicated that annual total precipitation had the highest contribution, which further highlighted the importance of this variable within the inhabited-area modelling domain (Fig. S3). In addition to precipitation, geomorphological factors also showed high importance, with slope, elevation, profile curvature, and TWI ranking second, third, seventh, and eighth, respectively. This suggests that terrain morphology and terrain-controlled hydrological processes play important roles in the spatial association between landslide-related records and conditioning factors. Landslide-related records were more likely to be associated with relatively steep slopes and in low-elevation settings under different environmental backgrounds. In such areas, unfavorable terrain conditions and runoff accumulation may promote slope failure. In addition, the relatively high importance of the 475-year return period PGA suggests that seismic background conditions may act as an indirect conditioning factor for rainfall-induced landslides. Past strong ground motion may weaken geological structures and reduce slope stability. NDVI also showed relatively high importance, which may reflect humid hilly and mountainous environments where increased soil moisture, elevated pore-water pressure, and runoff convergence can further enhance landslide triggering probability (Li and Duan, 2024). Lithology is also an important conditioning factor because differences in material strength, weathering resistance, and hydrological properties among lithological units can affect slope stability and landslide susceptibility.
Based on these inputs and the RF framework, our projections indicate an overall increase in China's landslide susceptibility within inhabited areas of China in the future compared to the baseline. This increase is particularly notable under the SSP5-8.5 scenario during the long-term future. These results are consistent with previous research. For example, Du et al. (2025) predicted increased rainfall-induced landslide susceptibility in southern Jiangxi Province using generalised additive models (GAMs). Similarly, Guo et al. (2023) projected an increase in shallow landslide susceptibility in Wanzhou County based on the fast shallow landslide assessment model (FSLAM). Lin et al. (2022) also found a potential increase in future landslide susceptibility and frequency across China using a generalized additive mixed effects model (GAMM). These studies collectively support our finding of a growing trend in future landslide susceptibility. Furthermore, we analysed regional variations within the inhabited-area modelling domain by dividing China into seven distinct areas. Our analysis revealed specific regional changes in landslide susceptibility. In particular, the border region between SC and SW, eastern Tibet, and the Loess–Taihang Mountain area were identified as key regions where landslide susceptibility is likely to intensify, especially under SSP5-8.5.
The quality of landslide inventories is a key source of uncertainty in large-area susceptibility mapping. It is generally assessed along three dimensions: positional accuracy, thematic accuracy, and completeness. Regarding positional accuracy, previous studies have shown that, once the landslide extent is correctly delineated, using either the scarp or a random location within the mapped extent as the locational reference does not significantly affect the overall susceptibility results (Margottini et al., 2013; Petschko et al., 2014). However, since the scarp is more readily identifiable, adopting it as a consistent locational reference can reduce positional uncertainty and thereby improve the spatial accuracy and reliability of susceptibility mapping. Therefore, the landslide points in our study were based on the scarp as the locational reference. Thematic accuracy refers to the correctness of attributes assigned to individual records, such as geohazard type, material involved, and estimated depth. Completeness refers to how close the landslide distribution represented in the inventory is to the ground truth. Two forms of incompleteness are particularly relevant to this study. First, small landslides, due to their limited spatial extent and ephemeral morphological expression, are often difficult to capture in national-scale inventories, leading to systematic omissions or under-reporting. To examine this issue, modelling and mapping were performed within the inhabited-area modelling domain after randomly removing 50 % and 100 % of the small-landslide samples, respectively (Fig. S7). Relative to the results based on the complete inventory, the exclusion of small-landslide records had a pronounced effect on susceptibility: susceptibility decreased markedly in SC, whereas it increased markedly in Tibet and SW. When only 50 % of small landslides were removed, the overall susceptibility pattern remained highly consistent with that from the complete inventory. Second, spatial completeness may vary among regions. In SC and SW – where landslides are frequent and research attention is high – inventory records are relatively adequate. By contrast, in NW, NE, and Tibet, constrained by terrain conditions, data accessibility, and limited monitoring capacity, landslide samples are relatively scarce (Fig. S8) (Liu et al., 2013; Liu and Miao, 2018). To examine this issue, we randomly removed 50 % and 75 % of the samples in NW, NE, and Tibet and then performed modelling and mapping (Fig. S9). Relative to the complete-inventory results, these sample-poor regions exhibited an overall decrease in susceptibility as more samples were removed, whereas regions with sufficient samples showed almost no change. Based on the above experiments, we suggest that future national-scale landslide inventories should adopt the scarp as a consistent locational reference, improve the thematic quality of individual record attributes, and continuously supplement records in under-sampled regions, thereby improving inventory quality and enhancing the robustness and reliability of susceptibility-mapping results.
Currently, CMIP6 GCMs are widely used to explore the impact of climate change on landslides. This study integrated the latest NEX-GDDP-CMIP6 GCM dataset, encompassing SSP1-2.6, SSP2-4.5, and SSP5-8.5. These three scenarios were selected to provide a representative range of future socioeconomic and radiative forcing conditions, thereby spanning a broad range of plausible future precipitation changes. This design enabled us to examine how rainfall-induced landslide susceptibility may evolve under contrasting but plausible climate pathways and to characterize the range of possible national-scale outcomes. This dataset offers globally downscaled scenarios from CMIP6 simulations at a 0.25° × 0.25° resolution. It employs bias correction and spatial disaggregation techniques, incorporating ground observations and raw GCM data for downscaling (Thrasher et al., 2022), thereby enhancing resolution while preserving long-term climate trends (Thrasher et al., 2012). This higher-resolution future climate dataset enabled a more precise assessment of rainfall-induced landslide susceptibility under climate change. First, we selected climate models suitable for the China region by comparing historical observed and simulated precipitation using RMSE. Following this selection, we employed a multimodel ensemble method to project future landslide susceptibility within the inhabited-area modelling domain. To quantify the associated uncertainty, we used a 95 % confidence interval based on the t-distribution. These steps helped reduce uncertainty in future landslide susceptibility projections. Furthermore, this study used future climate data to analyse landslide susceptibility under low, medium, and high socioeconomic development scenarios. This framework can be combined with future population and economic conditions to assess the potential impact and risks of future landslides on human society (Emberson et al., 2020; Gariano and Guzzetti, 2016). Consequently, the findings of this research provide a robust data foundation for further investigation into the potential socioeconomic risks and impacts associated with future landslides. In addition, we acknowledge that projection uncertainty generally increases toward later periods (e.g., 2051–2075 and especially 2076–2100). Our results are interpreted as scenario-dependent envelopes of plausible long-term change rather than deterministic predictions for specific years.
This study systematically assesses the spatial distribution and future trends of rainfall-induced landslide susceptibility within inhabited areas of China and its geological environmental regions under climate change at a national scale. By integrating a nationwide operational landslide-related record set and employing high-resolution precipitation data from NEX-GDDP-CMIP6, this study helps reduce uncertainties associated with historical landslide records and future rainfall projections. The proposed framework helps improve the accuracy and reliability of large-area landslide susceptibility assessment within inhabited areas. The results provide scientific support for landslide risk management and climate-change adaptation strategies in inhabited areas.
The main limitations of this study are as follows:
-
Although the RF model achieved strong predictive performance, future landslide susceptibility projections remain subject to several sources of uncertainty. Different GCMs may produce different precipitation projections, which directly affect the simulated changes in rainfall-induced landslide susceptibility. This uncertainty was partly addressed by using a multimodel ensemble and reporting the 95 % confidence interval of the ensemble mean. Additional uncertainties may arise from the landslide inventory, sampling strategy, RF model training process, and susceptibility classification thresholds. In particular, inventory incompleteness and spatial reporting bias have been recognized as important sources of uncertainty in landslide susceptibility prediction modelling (Huang et al., 2024). The random training–testing split used in this study provides a general assessment of model predictive performance. In future work, spatially structured validation methods, such as spatial block or region-based cross-validation, could be further explored to provide additional insights into model transferability and the spatial robustness of landslide susceptibility projections (Pohjankukka et al., 2017; Roberts et al., 2017). Therefore, the projected susceptibility changes should be interpreted as scenario-based tendencies rather than deterministic predictions.
-
This research developed an annual-scale future landslide susceptibility model for inhabited areas of China. However, short-duration intense rainfall is a recognized critical trigger for rainfall-induced landslides, and analysing the seasonal variability of precipitation could provide further insights into future landslide susceptibility changes (Lin et al., 2021). Future advancements in global navigation satellite systems (GNSS) and aerospace remote sensing (RS) technologies, which enable the acquisition of more precise spatiotemporal information on landslide-related records and enhance the dynamic representation of landslide influencing factors, hold the potential to improve modelling reliability. Consequently, future work could explore monthly landslide susceptibility changes within inhabited areas of China and its geological environmental regions under climate change, building upon improved landslide inventories and incorporating data from these advanced technologies.
-
The resolution constraints of the future climate model data introduce a limitation in predicting landslide susceptibility across various future periods and scenarios. This may limit the ability to accurately capture localized precipitation patterns. As a result, this could lead to either underestimation or overestimation of local landslide susceptibility, thereby increasing uncertainty in susceptibility projections.
-
As a large-area analysis within China's inhabited-area modelling domain, the modelling was conducted using influencing factors at a 1 km resolution, which may not fully capture local heterogeneity and could increase prediction uncertainty.
This study combined the latest NEX-GDDP-CMIP6 climate projections with a RF model to assess future changes in landslide susceptibility within inhabited areas of China and its geological environmental regions under different climate scenarios. The model demonstrated good performance, with an overall accuracy of 0.89, precision of 0.87, recall of 0.80, F1-score of 0.83, and an AUC of 0.96. These results indicate that the model effectively captures spatial patterns of landslide susceptibility within the inhabited-area modelling domain. Among all variables, annual total precipitation contributed the most to the model's output, with a relative importance of 16 %. Under the selected scenarios, China's mean annual precipitation is projected to increase by 59 to 111 mm by the end of the 21st century. Compared to the baseline period, this change is expected to result in an increase of 4.9 × 10⁴ to 1.2 × 10⁵ km2 in the area classified as having median to very high landslide susceptibility within the inhabited-area modelling domain. These increases are more pronounced in the long-term future and under SSP5-8.5. Spatially, several regions are projected to become more vulnerable. Notably, the border region between SC and SW, eastern Tibet, and the Loess–Taihang Mountain area are projected to be the main hotspots of intensified landslide susceptibility, with the most pronounced expansion of median to very high susceptibility zones occurring in these areas. These regions should be prioritized in future landslide susceptibility assessments and climate change adaptation strategies within inhabited areas.
The landslide inventory data were obtained from the Ministry of Natural Resources of the People's Republic of China (https://www.mnr.gov.cn/, last access: 14 August 2026). The NEX-GDDP-CMIP6 climate projection data used in this study are publicly available from the NASA Center for Climate Simulation at https://www.nccs.nasa.gov/data-collections/nex-gddp-cmip6/ (last access: 14 August 2026). The Global Active Faults Database (GAF-DB) is available at https://github.com/GEMScienceTools/gem-global-active-faults (last access: 14 August 2026, Styron and Pagani, 2020). The Global Lithological Map (GLiM) is available at https://www.dropbox.com/scl/fi/5v00i8op7a9brmn4qeg8b/LiMW_GIS-2015.gdb.zip (login required). The 475-year return-period peak ground acceleration data are available at https://hazard.openquake.org/gem. The SRTM V4 digital elevation data are available at https://srtm.csi.cgiar.org. The China 1 km Resolution Monthly Precipitation Dataset (1901–2023) is available at https://doi.org/10.5281/zenodo.3114194 (Peng, 2019). The five-level river network dataset of China is available at https://open.geovisearth.com. China's Land-Use/Cover Datasets are available at https://doi.org/10.5281/zenodo.15853565 (Yang and Huang, 2025). The MOD13Q1 NDVI data are available at https://doi.org/10.5067/MODIS/MOD13Q1.061 (Didan, 2021). The road network data are available at https://www.openstreetmap.org.
The supplement related to this article is available online at https://doi.org/10.5194/nhess-26-3881-2026-supplement.
J.W. designed the research, conducted the formal analysis, and wrote the original draft. H.F. provided the data and related resources. K.L. contributed to methodology, visualization, review, and funding acquisition. Y.Y. contributed to editing the manuscript. M.W. supervised the research. B.L. was responsible for software development and validation. X.M. contributed to validation.
The contact author has declared that none of the authors has any competing interests.
Publisher's note: Copernicus Publications remains neutral with regard to jurisdictional claims made in the text, published maps, institutional affiliations, or any other geographical representation in this paper. The authors bear the ultimate responsibility for providing appropriate place names. Views expressed in the text are those of the authors and do not necessarily reflect the views of the publisher.
This article is part of the special issue “The influence of landslide inventory quality on susceptibility and hazard map reliability”. It is a result the EGU General Assembly 2024, session NH3.10 “Exploring the Interplay: Quality of Landslide Inventories and reliability of Susceptibility and Hazard mapping”, Vienna, Austria, 19 April 2024.
We are grateful to Topical Editor Michele Santangelo and the four reviewers for their careful evaluation of our manuscript and for their constructive comments and insightful suggestions. Their feedback greatly improved the scientific quality, methodological clarity, and overall presentation of this work. We also thank the editors for the opportunity to contribute to this NHESS Special Issue.
This work was supported by the General Program of National Natural Science Foundation of China (grant number 42377467) and the Fundamental Research Funds for the Central Universities (grant number 2243300007).
This paper was edited by Michele Santangelo and reviewed by Francisco Dourado and three anonymous referees.
Alvioli, M., Melillo, M., Guzzetti, F., Rossi, M., Palazzi, E., Von Hardenberg, J., Brunetti, M. T., and Peruccacci, S.: Implications of climate change on landslide hazard in Central Italy, Sci. Total Environ., 630, 1528–1543, https://doi.org/10.1016/j.scitotenv.2018.02.315, 2018
Avand, M., Janizadeh, S., Naghibi, S. A., Pourghasemi, H. R., Khosrobeigi Bozchaloei, S., and Blaschke, T.: A Comparative Assessment of Random Forest and k-Nearest Neighbor Classifiers for Gully Erosion Susceptibility Mapping, Water, 11, 2076, https://doi.org/10.3390/w11102076, 2019.
Bondarenko, M., Priyatikanto, R., Tejedor-Garavito, N., Zhang, W., McKeen, T., Cunningham, A., Woods, T., Hilton, J., Cihan, D., Nosatiuk, B., Brinkhoff, T., Tatem, A., and Sorichetta, A.: The spatial distribution of population in 2015–2030 at a resolution of 30 arc (approximately 1 km at the Equator), R2025A version v1, WorldPop, School of Geography and Environmental Science, University of Southampton, https://doi.org/10.5258/SOTON/WP00845, 2025.
Breiman, L.: Random Forests, Mach. Learn., 45, 5–32, https://doi.org/10.1023/A:1010933404324, 2001.
Bureau, A., Dupuis, J., Hayward, B., Falls, K., and Van Eerdewegh, P.: Mapping complex traits using Random Forests, BMC Genet, 4, S64, https://doi.org/10.1186/1471-2156-4-S1-S64, 2003.
Chang, K.-T., Merghadi, A., Yunus, A. P., Pham, B. T., and Dou, J.: Evaluating scale effects of topographic variables in landslide susceptibility models using GIS-based machine learning techniques, Sci. Rep., 9, 12296, https://doi.org/10.1038/s41598-019-48773-2, 2019.
Chen, W., Xie, X., Wang, J., Pradhan, B., Hong, H., Bui, D. T., Duan, Z., and Ma, J.: A comparative study of logistic model tree, random forest, and classification and regression tree models for spatial prediction of landslide susceptibility, CATENA, 151, 147–160, https://doi.org/10.1016/j.catena.2016.11.032, 2017.
Ciabatta, L., Camici, S., Brocca, L., Ponziani, F., Stelluti, M., Berni, N., and Moramarco, T.: Assessing the impact of climate-change scenarios on landslide occurrence in Umbria Region, Italy, J. Hydrol., 541, 285–295, https://doi.org/10.1016/j.jhydrol.2016.02.007, 2016.
Didan, K.: MODIS/Terra Vegetation Indices 16-Day L3 Global 250m SIN Grid V061, NASA Land Processes Distributed Active Archive Centre [data set], https://doi.org/10.5067/MODIS/MOD13Q1.061, 2021.
Ding, Y. and Peng, S.: Spatiotemporal Trends and Attribution of Drought across China from 1901–2100, Sustainability, 12, 477, https://doi.org/10.3390/su12020477, 2020.
Dobler, A., Benestad, R. E., Lussana, C., and Landgren, O.: CMIP6 models project a shrinking precipitation area, npj Clim. Atmos. Sci., 7, 239, https://doi.org/10.1038/s41612-024-00794-z, 2024.
Dou, J., Yunus, A. P., Tien Bui, D., Merghadi, A., Sahana, M., Zhu, Z., Chen, C.-W., Khosravi, K., Yang, Y., and Pham, B. T.: Assessment of advanced random forest and decision tree algorithms for modelling rainfall-induced landslide susceptibility in the Izu-Oshima Volcanic Island, Japan, Sci. Total Environ., 662, 332–346, https://doi.org/10.1016/j.scitotenv.2019.01.221, 2019.
Du, B., Wang, Y., Fang, Z., Liu, G., and Tian, Z.: Spatiotemporal modelling and projection framework of rainfall-induced landslide risk under climate change, J. Environ. Manage., 373, 123474, https://doi.org/10.1016/j.jenvman.2024.123474, 2025.
Du, J., Glade, T., Woldai, T., Chai, B., and Zeng, B.: Landslide susceptibility assessment based on an incomplete landslide inventory in the Jilong Valley, Tibet, Chinese Himalayas, Eng. Geol., 270, 105572, https://doi.org/10.1016/j.enggeo.2020.105572, 2020.
Duan, Y., Ding, M., He, Y., Zheng, H., Delgado-Téllez, R., Sokratov, S., Dourado, F., and Fuchs, S.: Global projections of future landslide susceptibility under climate change, Geosci. Front., 16, 102074, https://doi.org/10.1016/j.gsf.2025.102074, 2025.
Emberson, R., Kirschbaum, D., and Stanley, T.: New global characterisation of landslide exposure, Nat. Hazards Earth Syst. Sci., 20, 3413–3424, https://doi.org/10.5194/nhess-20-3413-2020, 2020.
Emberson, R., Kirschbaum, D., and Stanley, T.: Global connections between El Nino and landslide impacts, Nat. Commun., 12, 2262, https://doi.org/10.1038/s41467-021-22398-4, 2021.
Froude, M. J. and Petley, D. N.: Global fatal landslide occurrence from 2004 to 2016, Nat. Hazards Earth Syst. Sci., 18, 2161–2181, https://doi.org/10.5194/nhess-18-2161-2018, 2018.
Gariano, S. L. and Guzzetti, F.: Landslides in a changing climate, Earth-Sci. Rev., 162, 227–252, https://doi.org/10.1016/j.earscirev.2016.08.011, 2016.
Gariano, S. L., Rianna, G., Petrucci, O., and Guzzetti, F.: Assessing future changes in the occurrence of rainfall-induced landslides at a regional scale, Sci. Total Environ., 596–597, 417–426, https://doi.org/10.1016/j.scitotenv.2017.03.103, 2017.
Guo, Z., Ferrer, J. V., Hürlimann, M., Medina, V., Puig-Polo, C., Yin, K., and Huang, D.: Shallow landslide susceptibility assessment under future climate and land cover changes: A case study from southwest China, Geosci. Front., 14, 101542, https://doi.org/10.1016/j.gsf.2023.101542, 2023.
Guo, Z., Tian, B., Zhu, Y., He, J., and Zhang, T.: How do the landslide and non-landslide sampling strategies impact landslide susceptibility assessment? – A catchment-scale case study from China, Journal of Rock Mechanics and Geotechnical Engineering, 16, 877–894, https://doi.org/10.1016/j.jrmge.2023.07.026, 2024.
Gutiérrez, F., Linares, R., Roqué, C., Zarroca, M., Carbonel, D., Rosell, J., and Gutiérrez, M.: Large landslides associated with a diapiric fold in Canelles Reservoir (Spanish Pyrenees): Detailed geological–geomorphological mapping, trenching and electrical resistivity imaging, Geomorphology, 241, 224–242, https://doi.org/10.1016/j.geomorph.2015.04.016, 2015.
Hakim, W. L., Rezaie, F., Nur, A. S., Panahi, M., Khosravi, K., Lee, C.-W., and Lee, S.: Convolutional neural network (CNN) with metaheuristic optimization algorithms for landslide susceptibility mapping in Icheon, South Korea, J. Environ. Manage., 305, 114367, https://doi.org/10.1016/j.jenvman.2021.114367, 2022.
Hartmann, J. and Moosdorf, N.: The new global lithological map database GLiM: A representation of rock properties at the Earth surface, Geochem. Geophy. Geosy., 13, https://doi.org/10.1029/2012GC004370, 2012.
He, Q., Wang, M., and Liu, K.: Rapidly assessing earthquake-induced landslide susceptibility on a global scale using random forest, Geomorphology, 391, 107889, https://doi.org/10.1016/j.geomorph.2021.107889, 2021.
Hong, H., Miao, Y., Liu, J., and Zhu, A.-X.: Exploring the effects of the design and quantity of absence data on the performance of random forest-based landslide susceptibility mapping, CATENA, 176, 45–64, https://doi.org/10.1016/j.catena.2018.12.035, 2019.
Hossin, M. and Sulaiman, M. N.: A Review on Evaluation Metrics for Data Classification Evaluations, International Journal of Data Mining & Knowledge Management Process, 5, 1–11, https://doi.org/10.5121/ijdkp.2015.5201, 2015.
Huang, F., Mao, D., Jiang, S.-H., Zhou, C., Fan, X., Zeng, Z., Catani, F., Yu, C., Chang, Z., Huang, J., Jiang, B., and Li, Y.: Uncertainties in landslide susceptibility prediction modelling: A review on the incompleteness of landslide inventory and its influence rules, Geosci. Front., 15, 101886, https://doi.org/10.1016/j.gsf.2024.101886, 2024.
Huang, W., Ding, M., Li, Z., Yu, J., Ge, D., Liu, Q., and Yang, J.: Landslide susceptibility mapping and dynamic response along the Sichuan-Tibet transportation corridor using deep learning algorithms, CATENA, 222, 106866, https://doi.org/10.1016/j.catena.2022.106866, 2023.
Hürlimann, M., Guo, Z., Puig-Polo, C., and Medina, V.: Impacts of future climate and land cover changes on landslide susceptibility: regional scale modelling in the Val d'Aran region (Pyrenees, Spain), Landslides, 19, 99–118, https://doi.org/10.1007/s10346-021-01775-6, 2022.
Jarvis, A., Reuter, H. I., Nelson, A., and Guevara, E.: Hole-filled SRTM for the globe Version 4, CGIAR-CSI SRTM 90m Database, https://srtm.csi.cgiar.org/ (last access: 14 August 2026), 2008.
Jin, J., Chen, G., Meng, X., Zhang, Y., Shi, W., Li, Y., Yang, Y., and Jiang, W.: Prediction of river damming susceptibility by landslides based on a logistic regression model and InSAR techniques: A case study of the Bailong River Basin, China, Eng. Geol., 299, 106562, https://doi.org/10.1016/j.enggeo.2022.106562, 2022.
John, A., Douville, H., Ribes, A., and Yiou, P.: Quantifying CMIP6 model uncertainties in extreme precipitation projections, Weather and Climate Extremes, 36, 100435, https://doi.org/10.1016/j.wace.2022.100435, 2022.
Johnson, K., Villani, M., Bayliss, K., Brooks, C., Chandrasekhar, S., Chartier, T., Chen, Y.-S., Garcia-Pelaez, J., Gee, R., Styron, R., Rood, A., Simionato, M., and Pagani, M.: Global Seismic Hazard Map, Zenodo [data set], https://doi.org/10.5281/zenodo.8409647, 2023.
Kirschbaum, D., Kapnick, S. B., Stanley, T., and Pascale, S.: Changes in Extreme Precipitation and Landslides Over High Mountain Asia, Geophys. Res. Lett., 47, e2019GL085347, https://doi.org/10.1029/2019GL085347, 2020.
Leshchinsky, B., Lehmann, P., and Or, D.: Enhanced Rainfall‐Induced Shallow Landslide Activity Following Seismic Disturbance – From Triggering to Healing, J. Geophys. Res.-Earth, 126, e2020JF005669, https://doi.org/10.1029/2020JF005669, 2021.
Li, B., Liu, K., Wang, M., He, Q., Jiang, Z., Zhu, W., and Qiao, N.: Global Dynamic Rainfall-Induced Landslide Susceptibility Mapping Using Machine Learning, Remote Sens., 14, 5795, https://doi.org/10.3390/rs14225795, 2022.
Li, C., Fu, Z., Wang, Y., Tang, H., Yan, J., Gong, W., Yao, W., and Criss, R. E.: Susceptibility of reservoir-induced landslides and strategies for increasing the slope stability in the Three Gorges Reservoir Area: Zigui Basin as an example, Eng. Geol., 261, 105279, https://doi.org/10.1016/j.enggeo.2019.105279, 2019.
Li, Y. and Duan, W.: Decoding vegetation's role in landslide susceptibility mapping: An integrated review of techniques and future directions, Biogeotechnics, 2, 100056, https://doi.org/10.1016/j.bgtech.2023.100056, 2024.
Lin, Q. and Wang, Y.: Spatial and temporal analysis of a fatal landslide inventory in China from 1950 to 2016, Landslides, 15, 2357–2372, https://doi.org/10.1007/s10346-018-1037-6, 2018.
Lin, Q., Lima, P., Steger, S., Glade, T., Jiang, T., Zhang, J., Liu, T., and Wang, Y.: National-scale data-driven rainfall induced landslide susceptibility mapping for China by accounting for incomplete landslide data, Geosci. Front., 12, 101248, https://doi.org/10.1016/j.gsf.2021.101248, 2021.
Lin, Q., Steger, S., Pittore, M., Zhang, J., Wang, L., Jiang, T., and Wang, Y.: Evaluation of potential changes in landslide susceptibility and landslide occurrence frequency in China under climate change, Sci. Total Environ., 850, 158049, https://doi.org/10.1016/j.scitotenv.2022.158049, 2022.
Liu, C., Li, W., Wu, H., Lu, P., Sang, K., Sun, W., Chen, W., Hong, Y., and Li, R.: Susceptibility evaluation and mapping of China's landslides based on multi-source data, Nat. Hazards, 69, 1477–1495, https://doi.org/10.1007/s11069-013-0759-y, 2013.
Liu, X. and Miao, C.: Large-scale assessment of landslide hazard, vulnerability and risk in China, Geomatics, Natural Hazards and Risk, 9, 1037–1052, https://doi.org/10.1080/19475705.2018.1502690, 2018.
Margottini, C., Canuti, P., and Sassa, K. (Eds.): Landslide Science and Practice: Volume 1: Landslide Inventory and Susceptibility and Hazard Zoning, Springer Berlin Heidelberg, Berlin, Heidelberg, https://doi.org/10.1007/978-3-642-31325-7, 2013.
Merghadi, A., Yunus, A. P., Dou, J., Whiteley, J., ThaiPham, B., Bui, D. T., Avtar, R., and Abderrahmane, B.: Machine learning methods for landslide susceptibility studies: A comparative overview of algorithm performance, Earth-Sci. Rev., 207, 103225, https://doi.org/10.1016/j.earscirev.2020.103225, 2020.
Ministry of Natural Resources of the People's Republic of China: Specification of Geological Hazard Risk Survey and Assessment (1 : 50 000), DZ/T 0438-2023, https://std.cgs.gov.cn/content/7262410361846894592 (last access: 25 March 2026), 2023.
Nocentini, N., Rosi, A., Piciullo, L., Liu, Z., Segoni, S., and Fanti, R.: Regional-scale spatiotemporal landslide probability assessment through machine learning and potential applications for operational warning systems: a case study in Kvam (Norway), Landslides, 21, 2369–2387, https://doi.org/10.1007/s10346-024-02287-9, 2024.
O'Brien, R. M.: A Caution Regarding Rules of Thumb for Variance Inflation Factors, Qual. Quant., 41, 673–690, https://doi.org/10.1007/s11135-006-9018-6, 2007.
Park, S.-J. and Lee, D.: Predicting susceptibility to landslides under climate change impacts in metropolitan areas of South Korea using machine learning, Geomatics, Natural Hazards and Risk, 12, 2462–2476, https://doi.org/10.1080/19475705.2021.1963328, 2021.
Peng, S.: High-spatial-resolution monthly precipitation dataset over China during 1901–2017, in: Earth System Science Data (Version V 1.0, Vol. 11, Issue 4, pp. 1931–1946), Zenodo [data set], https://doi.org/10.5281/zenodo.3114194, 2019.
Peng, S., Ding, Y., Wen, Z., Chen, Y., Cao, Y., and Ren, J.: Spatiotemporal change and trend analysis of potential evapotranspiration over the Loess Plateau of China during 2011–2100, Agr. Forest Meteorol., 233, 183–194, https://doi.org/10.1016/j.agrformet.2016.11.129, 2017.
Peng, S., Gang, C., Cao, Y., and Chen, Y.: Assessment of climate change trends over the Loess Plateau in China from 1901 to 2100, Int. J. Climatol., 38, 2250–2264, https://doi.org/10.1002/joc.5331, 2018.
Peng, S., Ding, Y., Liu, W., and Li, Z.: 1 km monthly temperature and precipitation dataset for China from 1901 to 2017, Earth Syst. Sci. Data, 11, 1931–1946, https://doi.org/10.5194/essd-11-1931-2019, 2019.
Peres, D. J. and Cancelliere, A.: Modelling impacts of climate change on return period of landslide triggering, J. Hydrol., 567, 420–434, https://doi.org/10.1016/j.jhydrol.2018.10.036, 2018.
Petschko, H., Brenning, A., Bell, R., Goetz, J., and Glade, T.: Assessing the quality of landslide susceptibility maps – case study Lower Austria, Nat. Hazards Earth Syst. Sci., 14, 95–118, https://doi.org/10.5194/nhess-14-95-2014, 2014.
Pohjankukka, J., Pahikkala, T., Nevalainen, P., and Heikkonen, J.: Estimating the prediction performance of spatial models via spatial k-fold cross validation, Int. J. Geogr. Inf. Sci., 31, 2001–2019, https://doi.org/10.1080/13658816.2017.1346255, 2017.
Reichenbach, P., Rossi, M., Malamud, B. D., Mihir, M., and Guzzetti, F.: A review of statistically-based landslide susceptibility models, Earth-Sci. Rev., 180, 60–91, https://doi.org/10.1016/j.earscirev.2018.03.001, 2018.
Roberts, D. R., Bahn, V., Ciuti, S., Boyce, M. S., Elith, J., Guillera-Arroita, G., Hauenstein, S., Lahoz-Monfort, J. J., Schröder, B., Thuiller, W., Warton, D. I., Wintle, B. A., Hartig, F., and Dormann, C. F.: Cross-validation strategies for data with temporal, spatial, hierarchical, or phylogenetic structure, Ecography, 40, 913–929, https://doi.org/10.1111/ecog.02881, 2017.
Roy, J. and Saha, S.: Landslide susceptibility mapping using knowledge driven statistical models in Darjeeling District, West Bengal, India, Geoenvironmental Disasters, 6, 11, https://doi.org/10.1186/s40677-019-0126-8, 2019.
Stumpf, A. and Kerle, N.: Object-oriented mapping of landslides using Random Forests, Remote Sens. Environ., 115, 2564–2577, https://doi.org/10.1016/j.rse.2011.05.013, 2011.
Styron, R. and Pagani, M.: The GEM Global Active Faults Database, Earthq. Spectra, 36, 160–180, https://doi.org/10.1177/8755293020944182, 2020.
Thrasher, B., Maurer, E. P., McKellar, C., and Duffy, P. B.: Technical Note: Bias correcting climate model simulated daily temperature extremes with quantile mapping, Hydrol. Earth Syst. Sci., 16, 3309–3314, https://doi.org/10.5194/hess-16-3309-2012, 2012.
Thrasher, B., Wang, W., Michaelis, A., Melton, F., Lee, T., and Nemani, R.: NASA Global Daily Downscaled Projections, CMIP6, Sci. Data, 9, 262, https://doi.org/10.1038/s41597-022-01393-4, 2022.
Viet Du, Q. V., Nguyen, H. D., Pham, V. T., Nguyen, C. H., Nguyen, Q.-H., Bui, Q.-T., Doan, T. T., Tran, A. T., and Petrisor, A.-I.: Deep learning to assess the effects of land use/land cover and climate change on landslide susceptibility in the Tra Khuc river basin of Vietnam, Geocarto Int., 38, 2172218, https://doi.org/10.1080/10106049.2023.2172218, 2023.
Wang, N., Lombardo, L., Gariano, S. L., Cheng, W., Liu, C., Xiong, J., and Wang, R.: Using satellite rainfall products to assess the triggering conditions for hydro-morphological processes in different geomorphological settings in China, Int. J. Appl. Earth Obs., 102, 102350, https://doi.org/10.1016/j.jag.2021.102350, 2021.
Yang, J. and Huang, X.: The 30 m annual land cover datasets and its dynamics in China from 1985 to 2022 (1.0.2), Zenodo [data set], https://doi.org/10.5281/zenodo.8176941, 2023.
Yang, J. and Huang, X.: The 30 m annual land cover datasets and its dynamics in China from 1985 to 2024, in: Earth System Science Data (Version 1.0.4, Vol. 13, Issue 1, pp. 3907–3925), Zenodo [data set], https://doi.org/10.5281/zenodo.15853565, 2025.
Zhang, J., Ma, X., Zhang, J., Sun, D., Zhou, X., Mi, C., and Wen, H.: Insights into geospatial heterogeneity of landslide susceptibility based on the SHAP-XGBoost model, J. Environ. Manage., 332, 117357, https://doi.org/10.1016/j.jenvman.2023.117357, 2023.
Zhao, G., Pang, B., Xu, Z., Yue, J., and Tu, T.: Mapping flood susceptibility in mountainous areas on a national scale in China, Sci. Total Environ., 615, 1133–1142, https://doi.org/10.1016/j.scitotenv.2017.10.037, 2018.
Zhu, A.-X., Miao, Y., Liu, J., Bai, S., Zeng, C., Ma, T., and Hong, H.: A similarity-based approach to sampling absence data for landslide susceptibility mapping using data-driven methods, CATENA, 183, 104188, https://doi.org/10.1016/j.catena.2019.104188, 2019.