
the Creative Commons Attribution 4.0 License.
the Creative Commons Attribution 4.0 License.
 | 17 Aug 2026
Regional modeling of the impacts of tidal flooding in the context of average sea level rise in low-lying areas of Brazil's semi-arid coast
Thiago Cavalcante Lins Silva
Marco Túlio Mendonça Diniz
Paulo Victor do Nascimento Araújo
José Yure Gomes dos Santos
Bruno Ferreira
Jucielho Pedro da Silva
This study assessed the risks and impacts of rising average sea levels on Brazil's semi-arid coastline in a low-lying coastal area with limited response potential, using freely available data and based on the central hypothesis that, even in conservative scenarios, there will be risks with significant impacts. The methodology integrated DEM calibration, geodetic validation of tide gauge data, flood modeling, and overlay with real estate grids to quantify damage. The results showed relative stability of astronomical tides, with projected extremes of up to 2.975 and 3.454 m, respectively, for a 20 year return period. Meteorological tides showed low values (≈ 0.11 m), although with episodic variability. The modeling indicated that up to 14 % of the total area (about 730 km2) could be affected in extreme scenarios, with progressive flooding of solar salt pans and low-lying urban areas. Cities such as Areia Branca, Macau, and Porto do Mangue are at the highest risk, with a 60 %–80 % probability of flooded days in severe scenarios. Economic losses were estimated at approximately BRL 36 million in residences (≈ USD 6.7 million) and BRL 158 million in land (≈ USD 29 million), with Areia Branca being the most impacted municipality. Towns such as Barra, Cristóvão, and Baixa Grande also experienced significant risks and damage. The findings reinforce the usefulness of open data for regional risk analysis, even recognizing limitations in spatial resolution and vertical uncertainties. The methodology proved promising, replicable, and useful for supporting adaptive policies in regions with low institutional technical capacity.
- Article
(20249 KB) - Full-text XML
- BibTeX
- EndNote


Climate change is increasingly becoming a global emergency, with coastal areas serving as a confluence of highly energetic processes, making them focal areas for impact studies and adaptive planning (Rouse et al., 2016; Powell et al., 2018; Hinkel et al., 2018; Becker et al., 2023; Cabana et al., 2023). The consequences of climate change have several dimensions, such as changes in terrestrial thermal patterns, changes and fluctuations in rainfall distribution, systematic imbalance in the trophic regime of coastal ecosystems, intensification of socio-spatial inequalities, recurrence and increased intensity of extreme events, and rising average sea levels, which are the main global manifestations predicted by climate change (Arnell et al., 2019; González-Trujillo et al., 2023).
The mean sea level rise (MSLR), one of the most direct and significant consequences of the predicted changes, primarily threatens low-lying coastal environments through flooding and subsequent erosion (Le Cozannet et al., 2014; IPCC, 2022; Scardino et al., 2022). Furthermore, recent projections indicate that even conservative scenarios could result in significant losses of territory in areas that are already vulnerable from both an environmental and social perspective (Almaliki et al., 2023; López-Dóriga and Jiménez, 2020). Such impacts compromise not only environmental integrity but also the socioeconomic security of coastal cities and populations (Araújo et al., 2021).
Developed coastal countries have increasingly implemented robust real-time monitoring and modeling systems, while many naturally vulnerable regions, especially in the Global South, remain unengaged in risk assessments, mainly due to data scarcity and limited institutional and financial capacity (Nagy et al., 2019; Moser et al., 2019; Cabana et al., 2023).
Small and medium-sized coastal cities in semi-arid areas often lack the financial and technical resources to implement local climate adaptation strategies (Boehnke et al., 2019; Fila et al., 2023; Olczak and Hanzl, 2025). In Brazil, the northern coast of the state of Rio Grande do Norte is an example of this vulnerability. The region is composed of economically fragile municipalities located in low-lying coastal areas (Aguiar et al., 2019), where tidal dynamics cause recurrent flooding (Araújo et al., 2021; Aguiar et al., 2019; Rabelo et al., 2023), a highly dangerous combination. The worsening of climate processes and the consequent rise in sea level may make the intrusion of marine processes a chronic problem, increasing socio-environmental stress and stress on poor urban infrastructure.
In this scenario, modeling for a regional context emerges as an interesting, viable, and low-cost approach to assess current and future exposures, provided that the data used are properly validated, geodetically consistent, and considering vertical errors when associated with global Digital Elevation Models (DEMs) (Muench et al., 2022). without careful validation, there may be an overestimation of flood-prone areas (Vernimmen and Hooijer, 2023). Although these products have natural limitations in terms of spatial resolution, their wide availability and scalability make them useful tools in areas with technical and financial constraints (Ekeu-wei and Blackburn, 2018).
The central scientific question of this study is the construction of regional MSLR projection scenarios for the Brazilian Semi-Arid Coast (BSC), using open or low-cost aggregated data and mechanisms already implemented by the Brazilian Government to project scenarios from various sources, with the aim of identifying potentially impacted areas along the coastline. The starting point is the hypothesis that, even under the most conservative scenarios, there will be impacts on homes and land in various municipalities, creating endemic risk zones with high financial damage to major cities and other regions.
The study strategically sought to provide initial, yet applicable, input for regional and municipal flood management by fulfilling the following objectives: (I) mapping areas susceptible to tidal flooding under the current regime; (II) analyzing the frequency of flooding using historical data series; (III) analyzing multiple MSLR projections and their frequencies; (IV) assessing risk areas throughout the study area; (V) analyzing the impacts of risk areas, adopting as the study area the mouths of the Piranhas-Açu and Apodi-Mossoró rivers on the Brazilian Semi-Arid Coast.
Considering the high costs and low availability of detailed geospatial surveys, the proposed framework aimed to provide a holistic and integrated study with open data, designed using probabilistic logic based on abduction, which allowed for the preliminary identification of climate risks in the area, systematically updating previous projective studies (e.g.: Araújo et al., 2021; Aguiar et al., 2019; de Silva et al., 2024). In addition, it established a general understanding and a starting point for the future development of high-resolution modeling for regional scenarios.
This study builds on the existing literature by proposing an integrated methodological framework specifically tailored to coastal regions with limited data availability in the Global South. Based on the use of open data and probabilistic logic, it combines the multi-criteria calibration of freely available DEMs with local geodetic validation, the systematic application of the bathtub technique under multiple sea-level rise scenarios, and the incorporation of real estate grids as proxies for economic exposure. This structured and replicable approach allows not only for improved physical risk assessment but also for the spatial quantification of potential financial impacts, representing a practical and scalable contribution to coastal risk analysis in regions with limited technical and institutional capacity.
The study area is located in the Costa Branca region, on the northern coast of the state of Rio Grande do Norte, a region characterized by a semi-arid hydrological framework, with salinized plains and low slopes (Diniz and Oliveira, 2016). Rainfall is concentrated in a few months of the year, mainly at the end of summer and beginning of autumn, alternating between years with rainfall above 800 mm and prolonged droughts (Medeiros et al., 2022; Kelly and Lucio, 2014).
The spatial area covers approximately 10 600 km2, stretching along approximately 142 km of coastline, encompassing the estuaries of the Piranhas-Açu and Apodi-Mossoró rivers. The area partially includes the boundaries of the municipalities of Grossos, Tibau, Areia Branca, Porto do Mangue, and Macau (Fig. 1), as well as villages near the coast. The municipalities in question have economic limitations and some are highly economically vulnerable, as verified by Macedo et al. (2025).
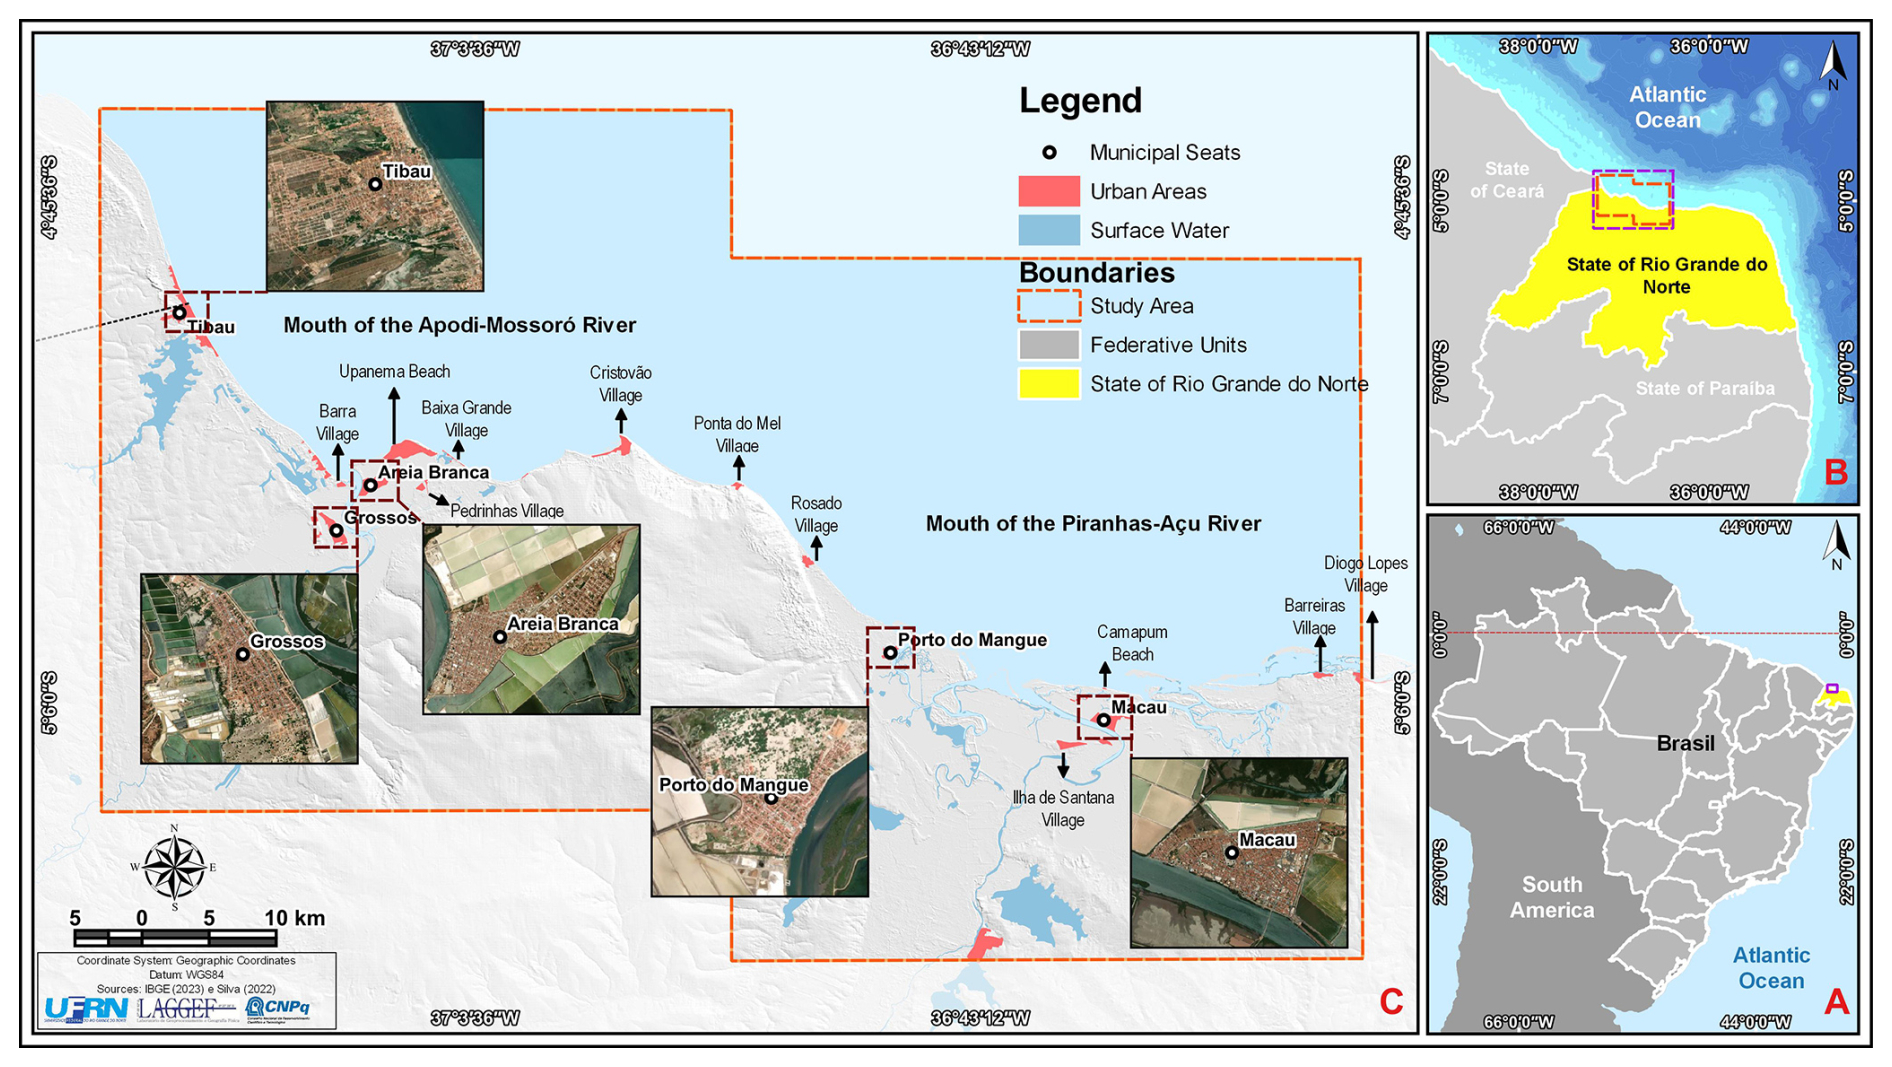
Figure 1Study Area, with emphasis on the main urban centres in the area under analysis, the proximity to waterways is notable. Map created using data from the IBGE (2023) and a base map from Bing Maps (© Microsoft).
The area has a semi-diurnal mesotidal regime, with an average amplitude of around 2.66 m, reaching up to 2.85 m during periods of more intense tides, such as in spring (Vital, 2009). The astronomical aspect is the controlling vector of the region's hydraulic dynamics, directly influencing coastal morphodynamics and depositing several sandbanks. In addition, the sector is influenced by waves from the northeast and east, with heights varying between 10 and 80 cm and average periods between 4 and 8 s (Vital et al., 2011; Barbosa et al., 2018).
The predominant land use is characterized by the production of sea salt in several evaporation ponds, which is the main economic activity in the region (Diniz et al., 2015). The production process takes advantage of the flat environment of the hypersaline plains, high rates of potential evapotranspiration, and semi-arid hydroclimatic regime to produce sea salt (Diniz and Vasconcelos, 2017), making it the largest salt producer in Brazil.
The area is located in a low-lying coastal region (da Silva et al., 2025), which is naturally vulnerable to flooding (Soares et al., 2021), a recurring phenomenon that has been documented in several publications (Aguiar et al., 2019; Araújo et al., 2021; Rabelo et al., 2023; Silva et al., 2024). Low-lying coasts represent only about 2 % of the world's coastlines (Nicholls et al., 2007), which makes the study area highly rare and exceptional. Due to their exceptional nature, these areas are frequently studied in international studies that seek to analyze the risks associated with this condition (Nicholls et al., 2007; Marfai and King, 2007; Dwrakisha et al., 2009; Nicholls and Cazenave, 2010; Darsan et al., 2013; Boori et al., 2012; Busman et al., 2016; Stephens et al., 2021; Su et al., 2024), which makes the present study feasible and appropriate.
This study used the concept of risk as its central matrix, understood as the function between hazard and vulnerability (Kron, 2005; Wisner et al., 2012) (Eq. 1), articulating physical, environmental, and social dimensions of the analyzed territory. Risk in this perspective is understood as a socio-environmental construct, influenced by both natural factors and social and territorial inequalities (Blaikie et al., 1994; Smith, 2001; Turner et al., 2003). The study area in this condition is understood as a region exposed to climate hazards due to its condition of human occupation (McGranahan et al., 2007; Vousdoukas et al., 2018). The operationalization of the concepts guided the methodological discussions.
In this study, risk was defined as the spatial combination of flood hazard and vulnerability, as shown in Eq. (1). Hazard was defined based on an extreme hydrodynamic scenario, including the projected MSLR, extreme astronomical tide, extreme meteorological tide, and the vertical uncertainty of the DEM (RMSE), incorporated as a conservative margin in the delineation of potentially flood-prone areas. Vulnerability was estimated based on land use and land cover classification, with relative susceptibility levels assigned to different classes, representing the physical response of land use to flooding.
Although not explicitly included as a multiplicative term in Eq. (1), exposure was considered in the spatial stage of the analysis through the intersection between the potentially flood-prone areas and the urban property grid, allowing for the identification of assets located in hazard zones.
The methodology employed was designed in five main stages: (A) data collection; (B) data processing and validation; (C) data analysis and modeling; (D) tidal flood risk mapping; and (E) final analysis, including a discussion of the tidal flood risk map and identification of impacts (Fig. 2). The stages and their sequence were designed with a view to achieving the objectives and resolving scientific issues.
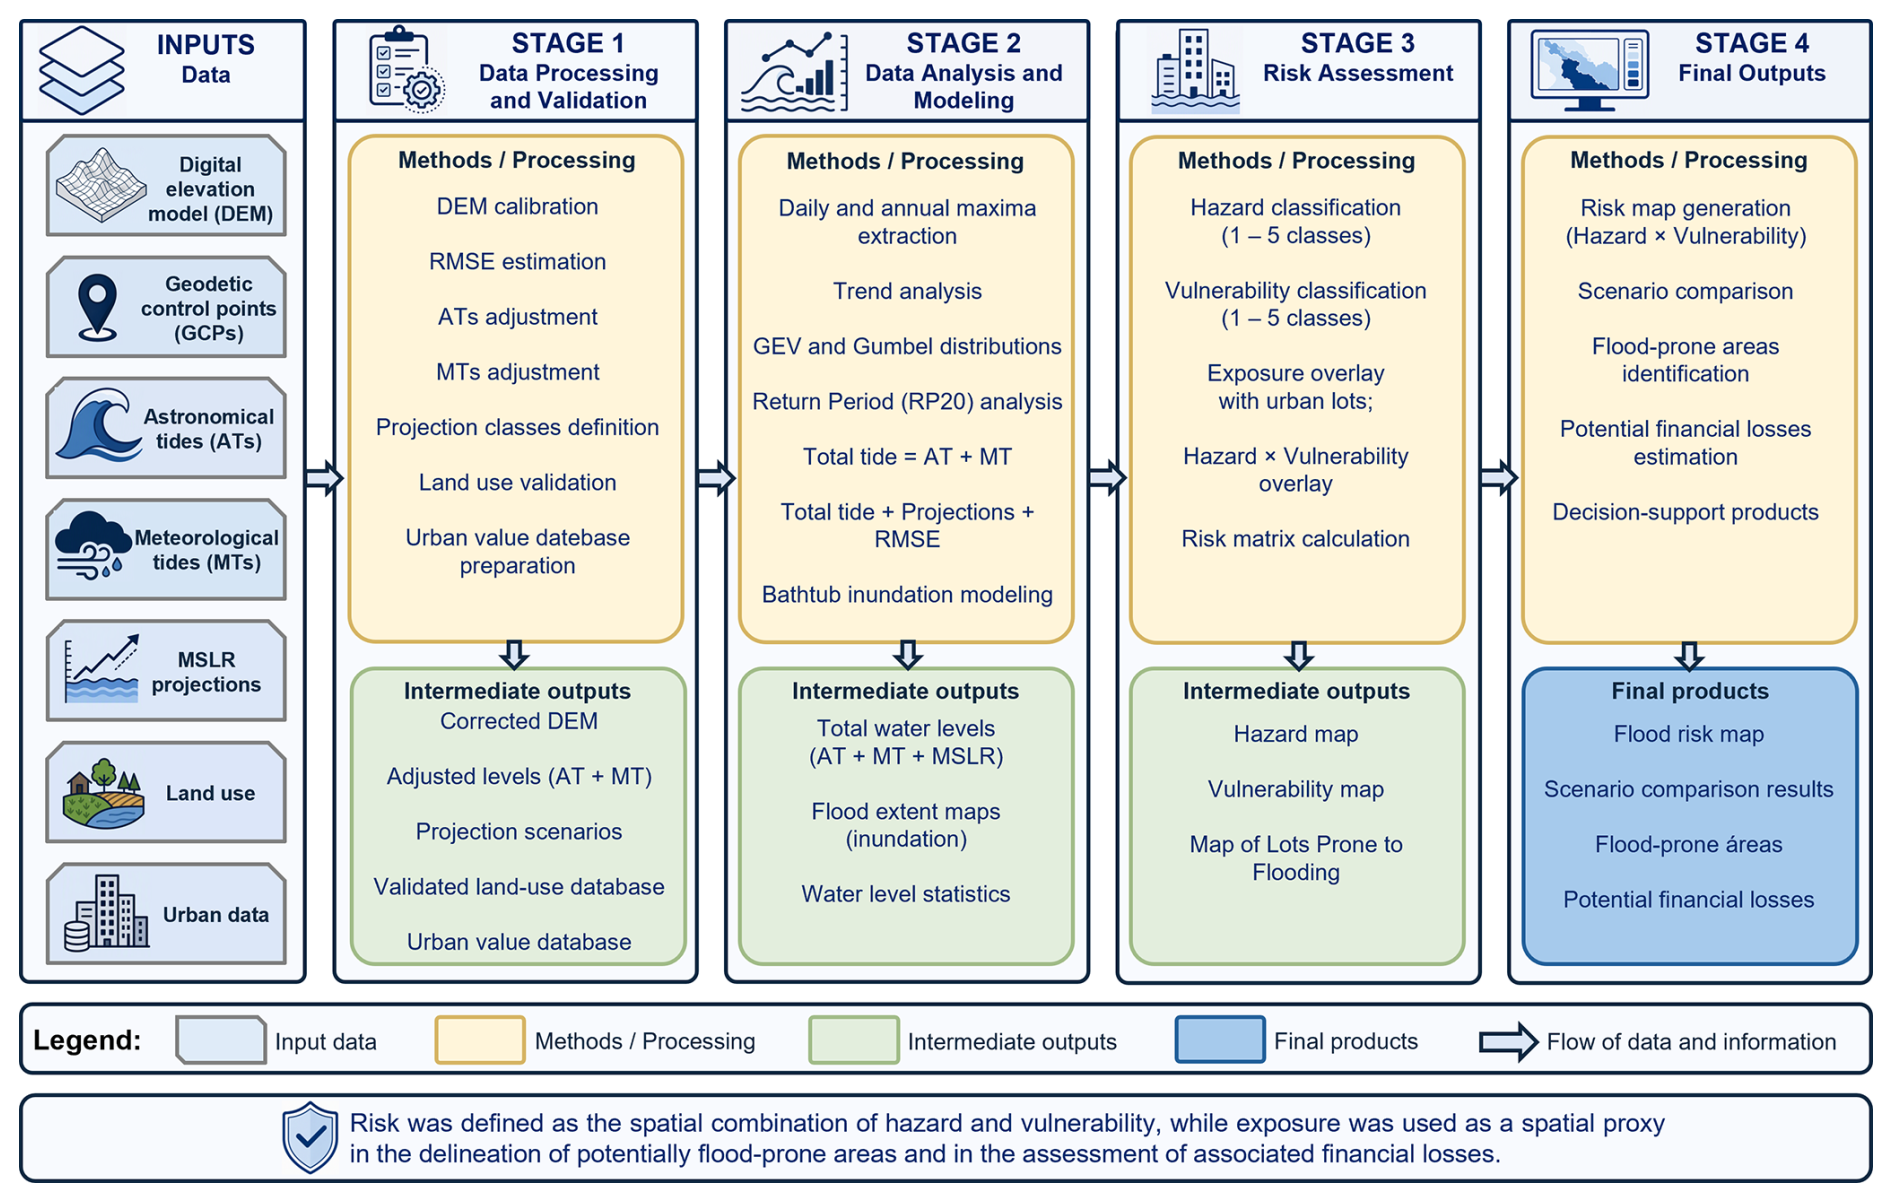
Figure 2Flowchart of the methodological structure and the relationships among input data, processing steps, intermediate results, and final outputs. The arrows indicate the flow of data and information.
3.1 Data collection (A)
Data collection began with a systematic literature review on climate change MSLR, and coastal risk modeling, aiming to establish the theoretical and methodological framework of the study. Subsequently, the datasets required for the construction of the risk model were compiled, including altimetric, oceanographic, climatic, environmental, and urban information.
The dataset comprises: freely available digital elevation models; geodetic control points; historical data of astronomical and meteorological tides; MSLR projections at global, intermediate, and local scales; land use and land cover data; and urban cadastral information. Table 1 summarizes the main characteristics, sources, and applications of each dataset. The main spatial data can be visualized in the Fig. 3.
Table 1Datasets used in the study and their main methodological characteristics. Data source list: 1 – European Space Agency (ESA, 2021); 2 – Brazilian Geodetic Database (IBGE, 2025); 3 – REDEGEO (2020); 4 – Soares and Amaro (2011); 5 – Field Sampling GNSS RTK (CHCNAV I90); 6 – Brazilian Navy Directorate of Hydrography and Navigation (DHN, 2025); 7 – Yang et al. (2025); 8 – Sistema de Modelagem Costeira (SMC-Brasil, 2025); 9 – Sixth Assessment Report (AR6) of the Intergovernmental Panel on Climate Change (IPCC, 2022); 10 – Copernicus Climate Change Service (C3S, 2025); 11 – Silva et al. (2025); 12 – Permanent Tide Gauge Network for Geodesy (RMPG – IBGE, 2021); 13 – MapBiomas (2025); 14 – Souza et al. (2020); 15 – Geoprocessing and Physical Geography Laboratory at the Federal University of Rio Grande do Norte (GPGL, 2025).
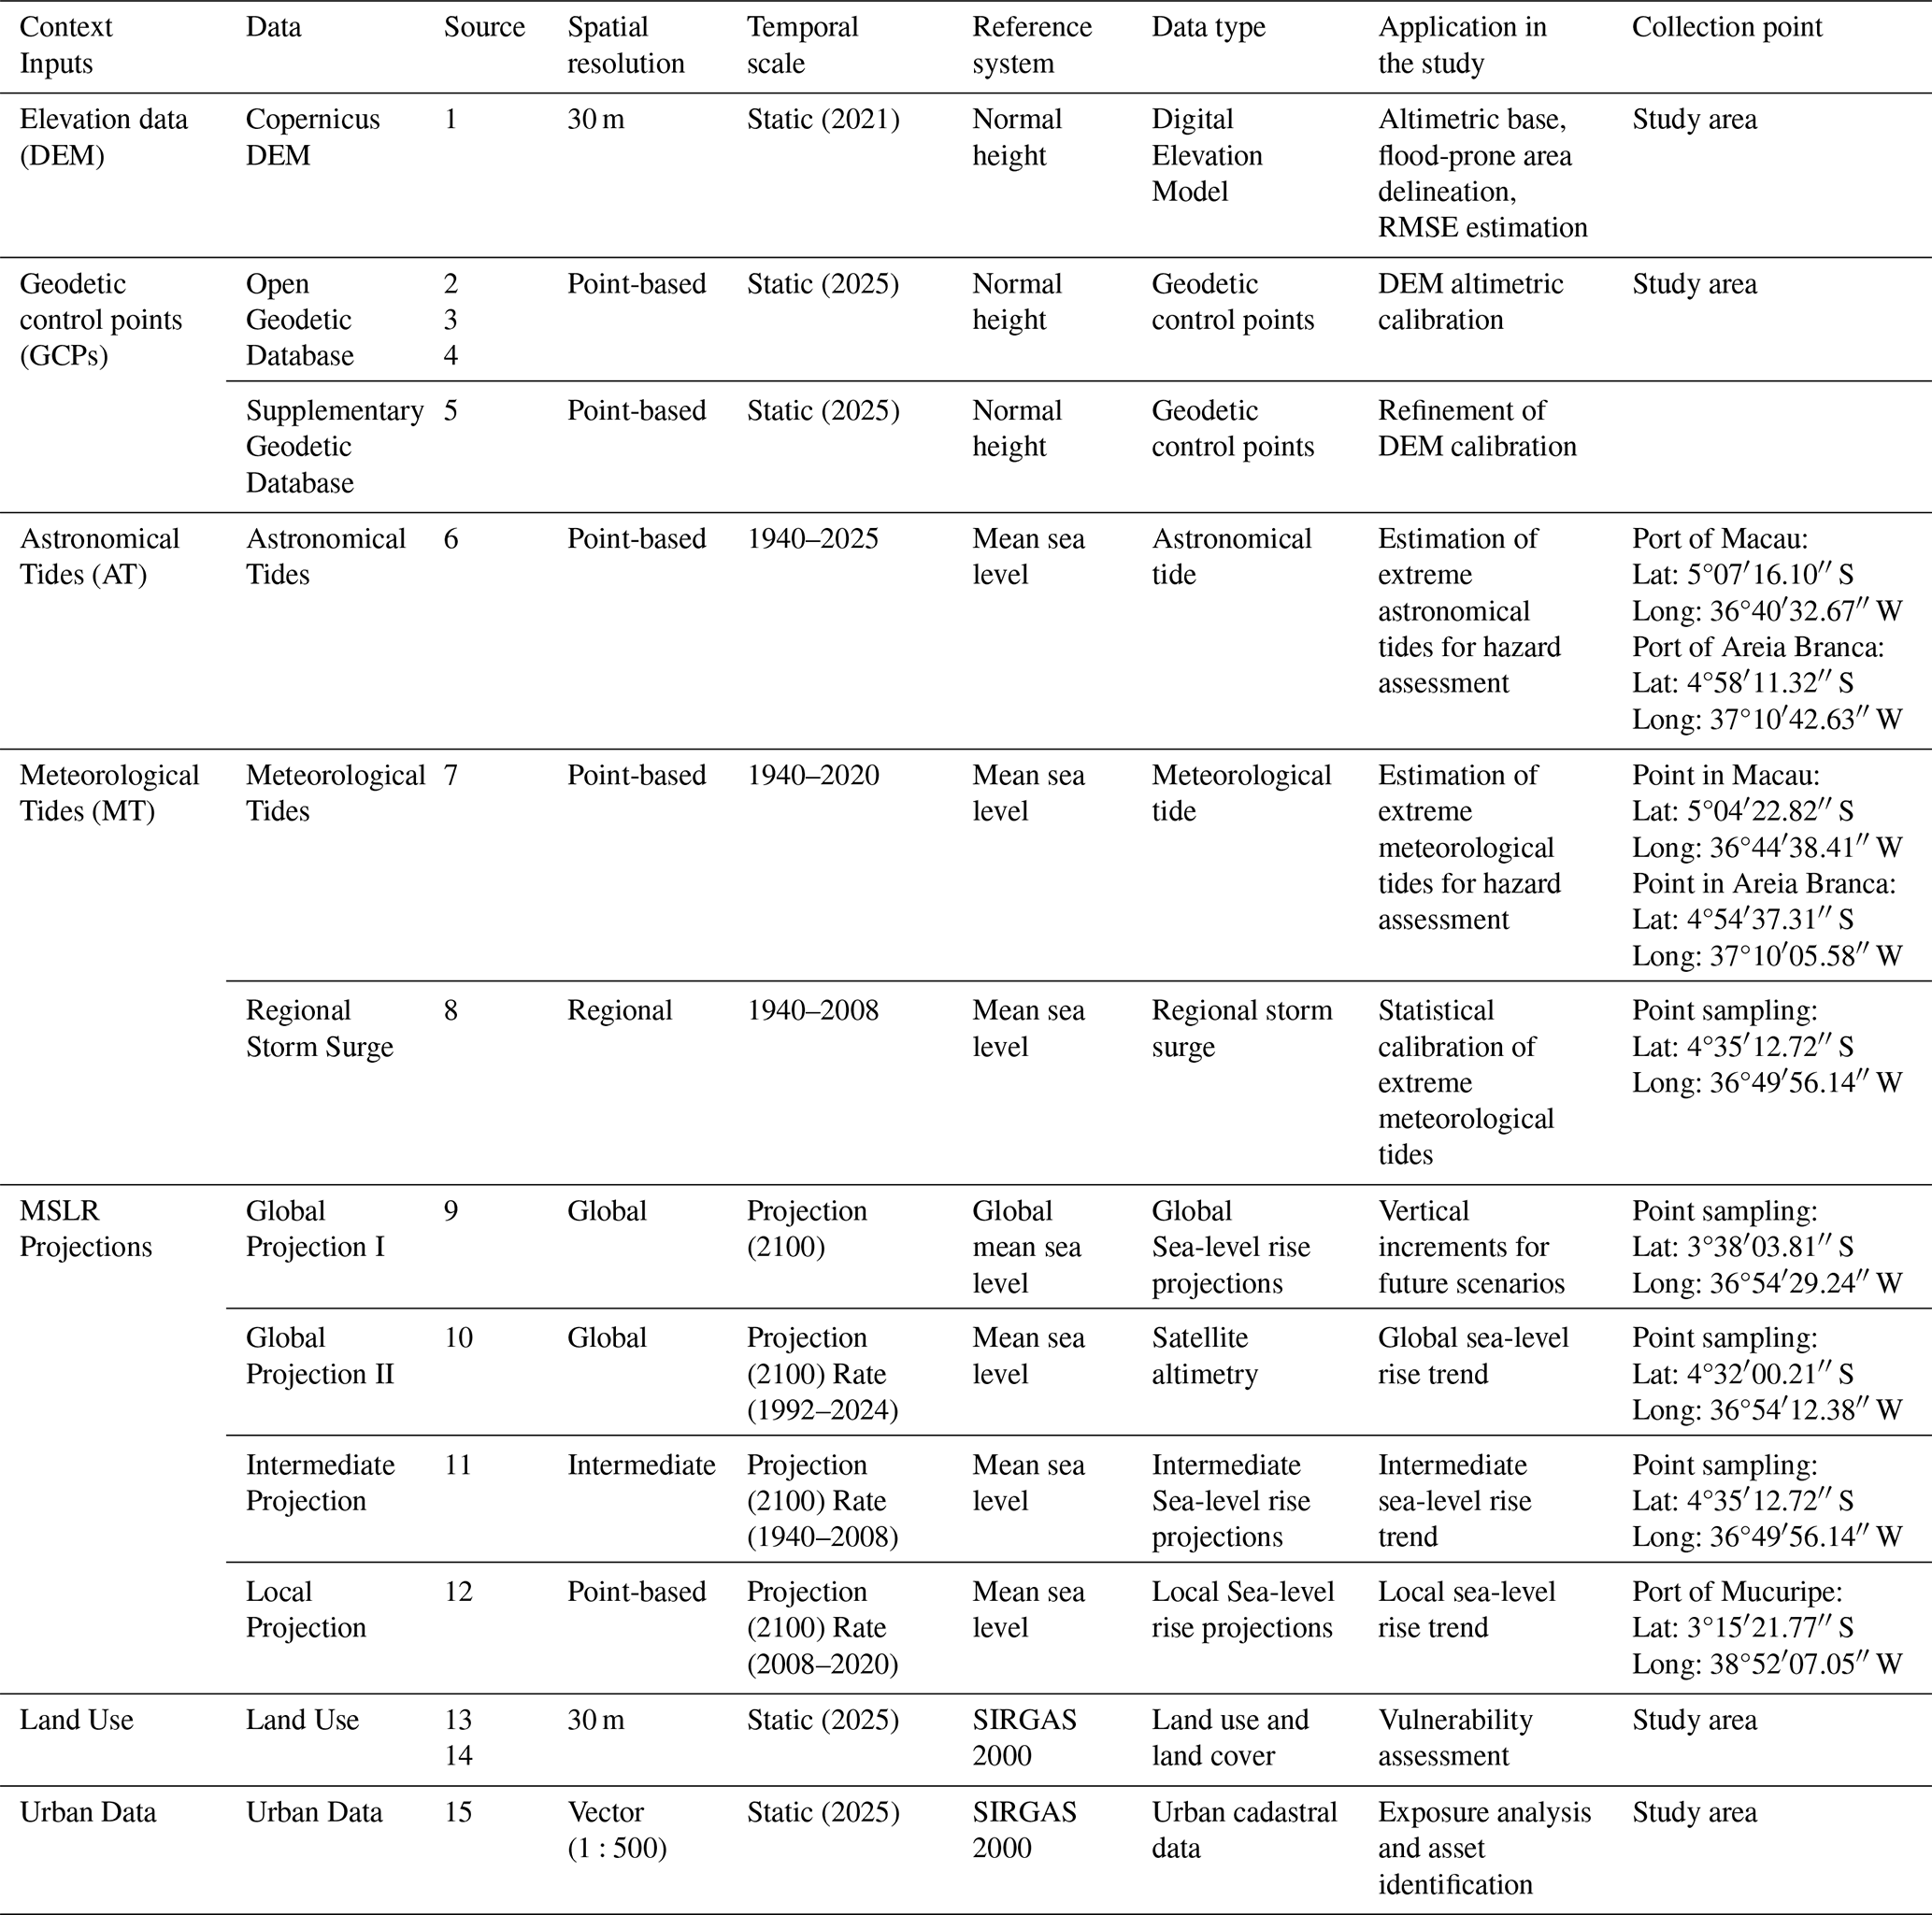
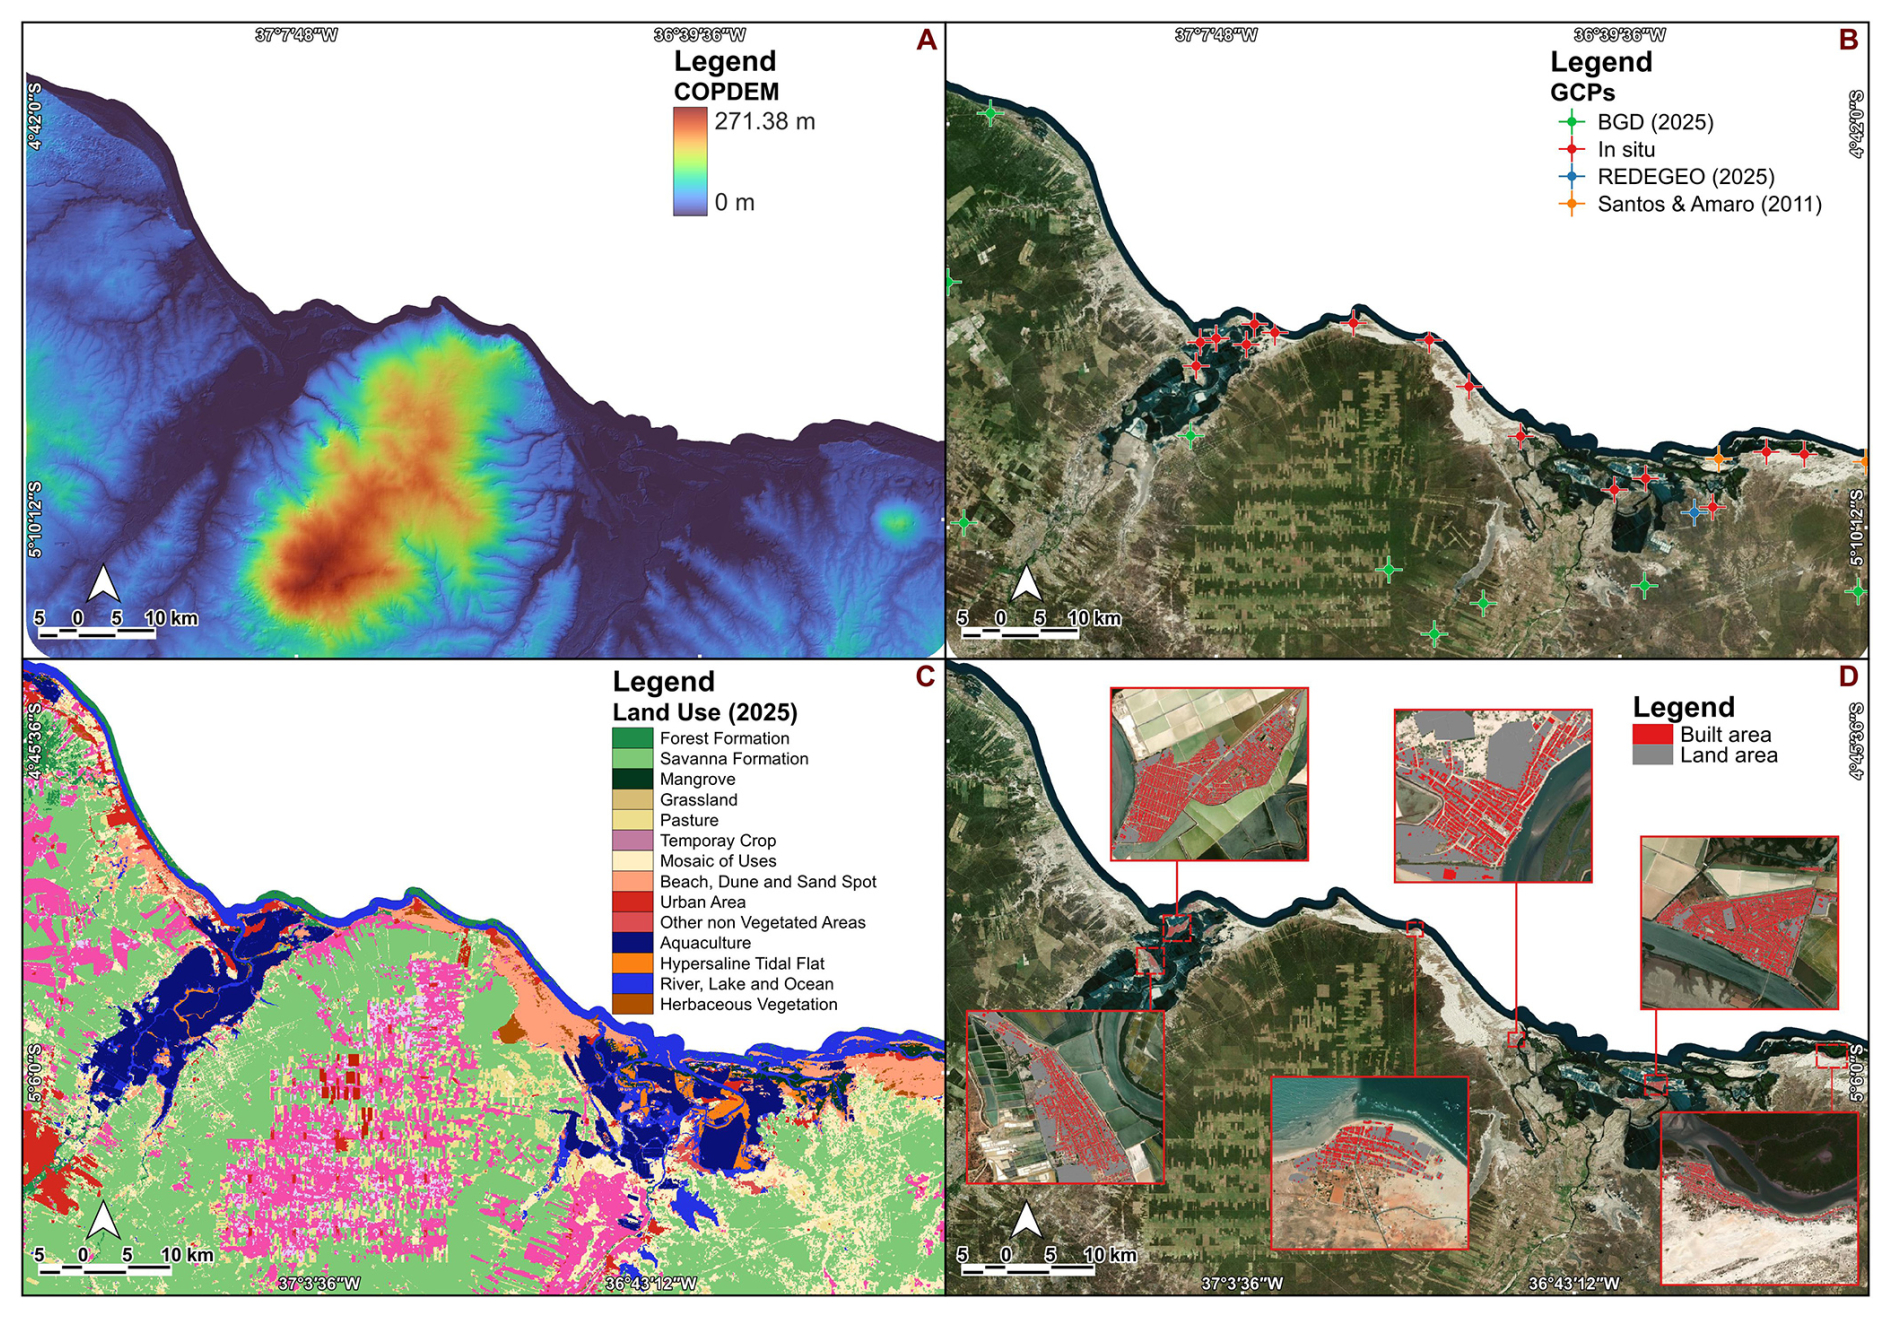
Figure 3List of spatial data. (A) Digital elevation model used; (B) Geodetic control points used; (C) Original land use and land cover data used; (D) Urban cadastral data used, with some areas shown at different scales in certain urban areas.
It is worth noting that this study incorporated projections of average sea-level rise at different spatial scales: global (AR6/IPCC and C3S trends), intermediate (SMC-Brasil trends), and local (RMPG trends). These projections were applied as vertical increments in the definition of flood levels, enabling a comparison of the scenarios projected for 2100 and an assessment of the hazards associated with different probabilistic scenarios, considering the degree of uncertainty in the projections.
3.2 Data processing and validation (B)
During data processing, COPDEM was calibrated by comparing elevation values with GCPs, yielding the mean error, the RMSE, and a linear regression-based fit equation, similar to the method used by Araújo et al. (2019). The application of the calibration equation (Eq. 2) improved the DEM's accuracy, reducing the mean error by 4 % and resulting in an RMSE of 0.612 m, considered satisfactory for a global DEM. The error distribution by elevation classes showed consistent behavior, with a standard deviation (SD) of 0.363 m and better performance below 20 m in elevation, where the maximum RMSE reached 0.30 m.
In the calibration equation, 0.2041 represents the linear coefficient associated with the fixed adjustment, DEM corresponds to the original elevation from the Digital Elevation Model, and 0.9939 represents the slope coefficient responsible for the correction factor applied to the DEM value.
Subsequently, the reduction level (RL) was adjusted to the Brazilian Geodetic System (BGS) to ensure consistency between the astronomical tide data and the geodetic reference system adopted in the study, since tide gauge measurements follow reference planes specific to the DHN. This adjustment was performed using validated reference points, geodetically linked to SIRGAS2000 and positioned near the tide gauges.
In Macau, the reference derived by Araújo et al. (2021) was used, based on GNSS surveys of the RN-2 (DHN) near the Port of Macau. In Areia Branca, the IBGE Level Reference (code LR 2404X) was adopted, linked to RN-3 (DHN) near the Port of Areia Branca and previously used by Aguiar et al. (2019). These references allowed for the calculation of RL elevations relative to the geodetic plane, as illustrated in Fig. 4, to Macau (Eq. 3) and Areia Branca (Eq. 4).
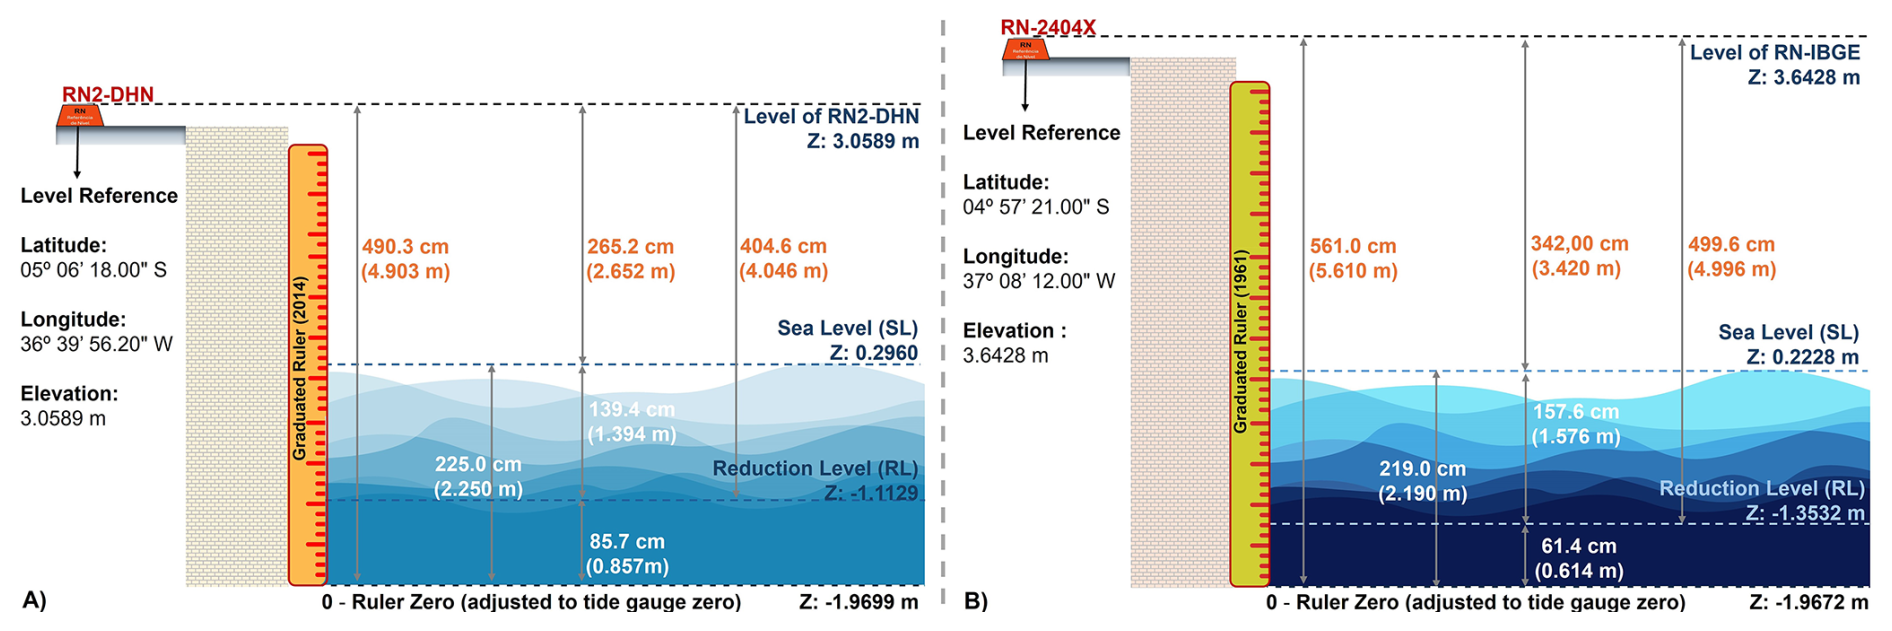
Figure 4Schematic representation of the tide gauge stations with the validated elevations and reference coordinates. (A) Ruler associated with the Port of Macau; (B) Ruler for the Port of Areia Branca. It can be seen that despite the unevenness, the reduction levels are close. Prepared by the authors using data from DHN (2025).
These reduction factors were essential for correcting the maximum values of the astronomical tides, allowing the tidal elevations to be adjusted to the geodetic reference plane adopted in the study.
Equations (3) and (4) convert the validated level-reference elevations to the reduction level (RL). Here, Hm(RL) and Hab(RL) represent the RL elevations for Macau and Areia Branca, H(LRm) and H(LRab) are the respective geodetic reference elevations, and 4.046 and 4.996 m are the vertical offsets applied to obtain the RL.
Land use and land cover data from MapBiomas (2025) were cross validated to correct classification errors in the study area, particularly confusion between urban areas, water bodies, and salt flats. A 1 km×1 km inspection grid was applied, resulting in the correction of more than 80 000 incorrectly classified pixels.
Urban data were processed to estimate land value per square meter through the systematic collection of real estate listings using web scraping techniques. More than 1000 listings from the 2023–2025 period were compiled, following approaches similar to those proposed by Jach (2021), Bricongne et al. (2022), and Harten et al. (2020). In remote communities without market references, values were estimated through spatial interpolation with nearby areas, allowing for the construction of real estate benchmarks used in the analysis.
3.3 Data analysis and modeling (C)
The tide analysis employed statistical methods applied to time series to characterize astronomical and meteorological influences and identify extreme patterns for flood level definition. Total tide was considered as the sum of astronomical (AT) and meteorological tides (MT), which were analyzed independently to allow more realistic projections. Hourly AT and MT series were processed to extract daily and annual maxima, followed by the application of descriptive statistics, the Mann–Kendall trend test (Mann, 1945; Kendall, 1975), and the Morlet wavelet transform (Morlet et al., 1982), enabling the detection of monotonic trends and cyclical variability.
Extreme value analysis was performed using the Generalized Extreme Value distribution to estimate non-exceedance probabilities and the Gumbel distribution to obtain water levels associated with different return periods. The 20 year return period (RP20) was adopted as a reference for integration with MSLR scenarios, incorporating natural variability into future projections.
MSLR modeling followed two complementary principles: event frequency, based on the recurrence of average annual floods, and total flooding, based on the maximum potential event, both addressing uncertainties in flood occurrence.
The study area was divided into two modeling domains, Macau and Areia Branca, based on the availability of tide gauges and the interpretation of the predominance of marine processes proposed by Silva et al. (2025). The division into sectors considered the change in hydraulic transport dynamics west of the village of Ponta do Mel, in Areia Branca, using this point as the boundary between the domains.
Flood modeling was performed using the “bathtub” approach (passive model), which simulates the expansion of the water surface over the DEM in a GIS environment. This method was selected due to the regional scale of the analysis, the lack of high-resolution bathymetric data, and its applicability in contexts with limited data. In this study, it was applied as a screening tool to identify areas potentially prone to flooding and not as a substitute for physics-based hydrodynamic modeling. Its limitations, particularly the omission of hydrodynamic processes and the potential overestimation of flood extent, are acknowledged, as is the lack of simulation of hydraulic flow, connectivity between flood-prone areas, and energy dissipation (Yunus et al., 2016; Anderson et al., 2018; Gesch, 2018; Williams and Lück-Vogel, 2020; Lima et al., 2021; Shen et al., 2022; Juhász et al., 2023; Croteau et al., 2023; Sanders et al., 2024; Huang and Merwade, 2022; Kasmalkar et al., 2024; Pasquier et al., 2026).
Despite these limitations, the method remains a rapid and low-cost approach suitable for regional-scale screening, particularly in tidal coastal settings.
Frequency modeling followed a procedure analogous to Kaden's (2022) flooding sector schematization, compartmentalizing the DEM into elevation levels and estimating flood frequency (Eq. 5) using the following variables: daily total tide maximums (AT+MT), MSLR projections, and the RMSE. These components were applied to the calibrate DEM by adding the water column to the terrain, thereby enabling the estimation of flood recurrence for each elevation band.
The total flooding scenarios were developed based on the work of Araújo et al. (2021) and Aguiar et al. (2019), using a multivariate weighting (Eq. 6) with the following variables: DEM, model RMSE, MSLR projections, and extreme values of AT and MT (RP20). Adding these values to the calibrated DEM allows for an integrated assessment of coastal dynamics and a preliminary identification of flood-related impacts.
In Eqs. (5) and (6), AT and MT represent, respectively, the daily maximum in Eq. (5) and the values projected for the 20 year return period (RP20) in Eq. (6). RMSE represents the root mean square error of the model's elevation values. The variable projection corresponds to MSLR projections, considering different scenarios: local, using RMPG values; intermediate, using the SMC-Brasil Trend; global, using the SLA Trend (C3S); and global, IPCC rate, using the SSP1-1.9, SSP1-2.6, SSP2-4.5, SSP3-7.0, and SSP5-8.5 scenarios. Each level was delineated on the DEM by sectorizing its zones.
3.4 Tidal flood risk mapping (V)
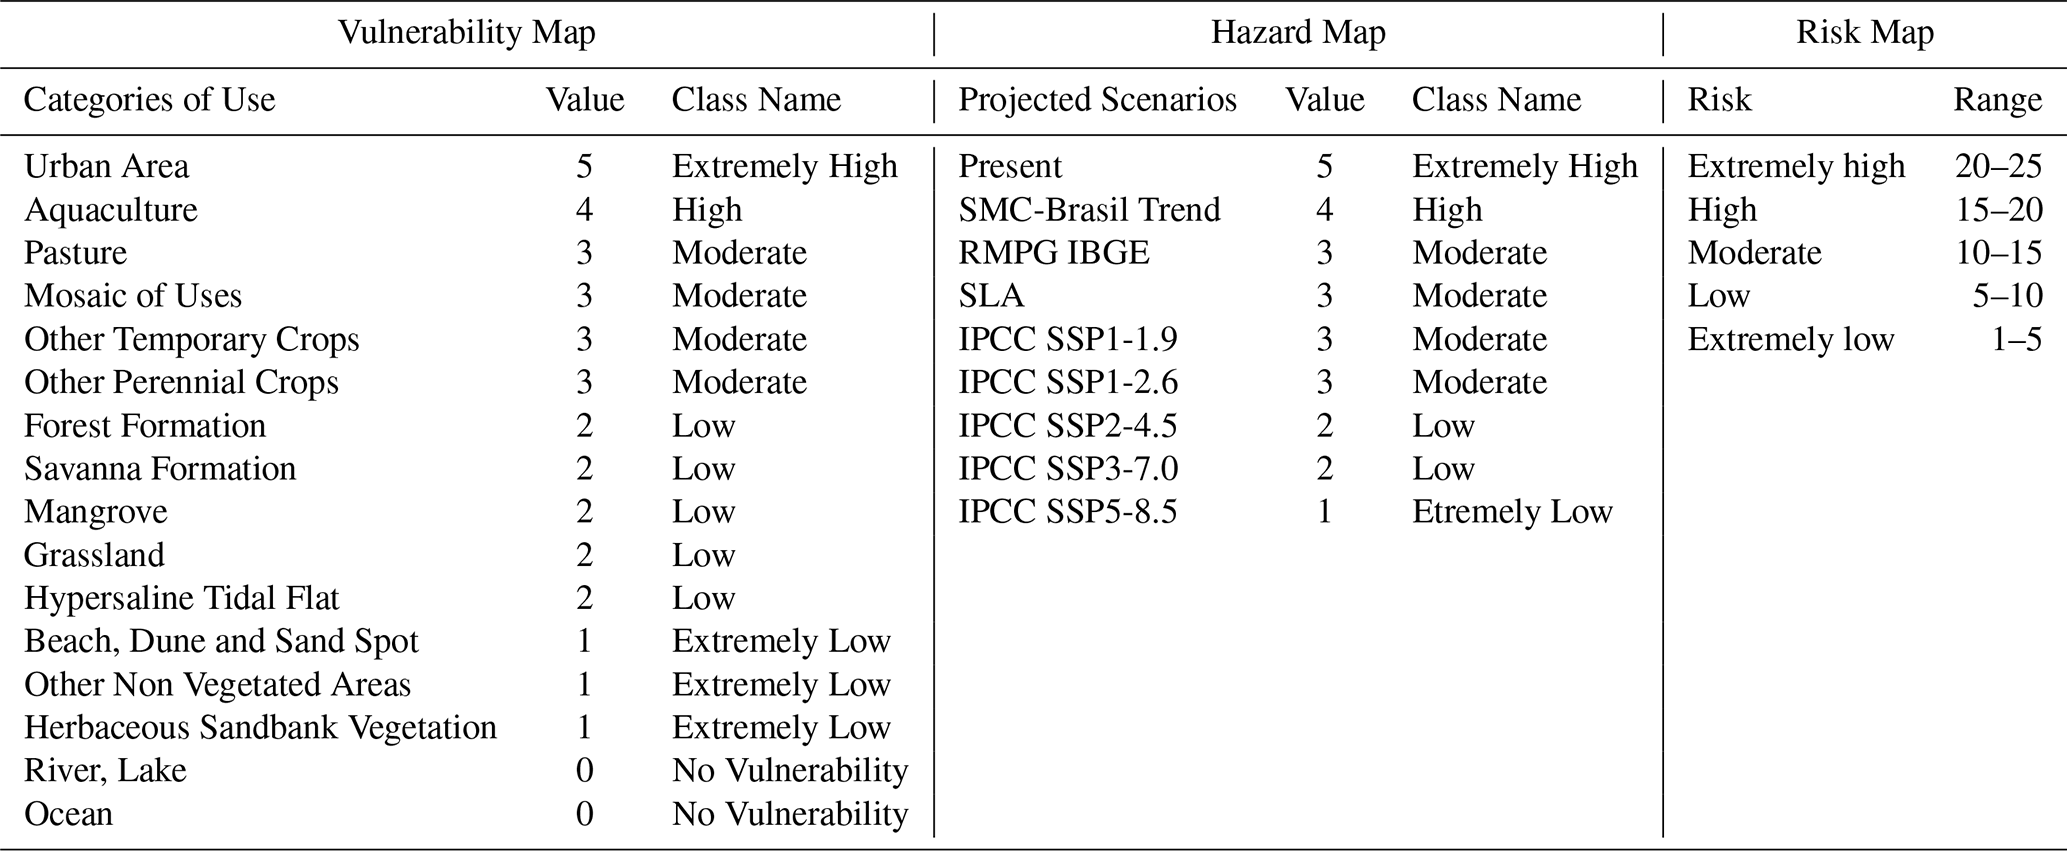
The risk map was constructed based on a probabilistic quantitative risk approach, defined by the relationship between hazard (destructive potential) and physical vulnerability (degree of environmental loss). The hazard was classified based on total flood modeling (Eq. 6) in the different projected scenarios, segmented into five classes (1–5), from extremely low to extremely high (Table 2). Physical vulnerability was defined based on validated land use, grouped into six vulnerability units (0–5), ranging from “no vulnerability” to “extremely high”.
The risk calculation procedures were performed in a GIS environment using raster algebra. The raster layers classified for vulnerability and hazard were assigned values according to Table 2. The weighted combination of these variables resulted in a tidal flood risk map, organized into five classes (1–25). Based on this, the practical implications associated with the defined risk thresholds were discussed.
Finally, the data were visualized by spatially overlaying the risk map with the region's exposed real estate grid. This process made it possible to identify properties located in high-risk areas, quantify the potential financial impacts, and calculate the estimated losses per square meter, based on the compiled market values of properties in each sector analyzed.
Table 2Set of classes and assigned values of vulnerability, hazard and risk.
The presentation of the results was organized to reflect the methodological logic and meet the study's objectives, ensuring a sequential and coherent reading of the findings. Initially, statistical analyses of historical tide series are shown, focusing on trends and extreme patterns. Next, the projected MSLR scenarios are presented, both in terms of frequency and total flooding. Finally, the flood risk map and its resulting impacts are discussed, allowing for a spatial reading of the associated risks and their implications.
4.1 Statistical analysis of tide gauge data
Statistical analysis of data from Macau and Areia Branca provided a clear and robust understanding and characterization of some of the coastal processes in the region, as revealed by statistical data and interpretations, distinguishing between astronomical and non-astronomical processes in the context of the two estuaries.
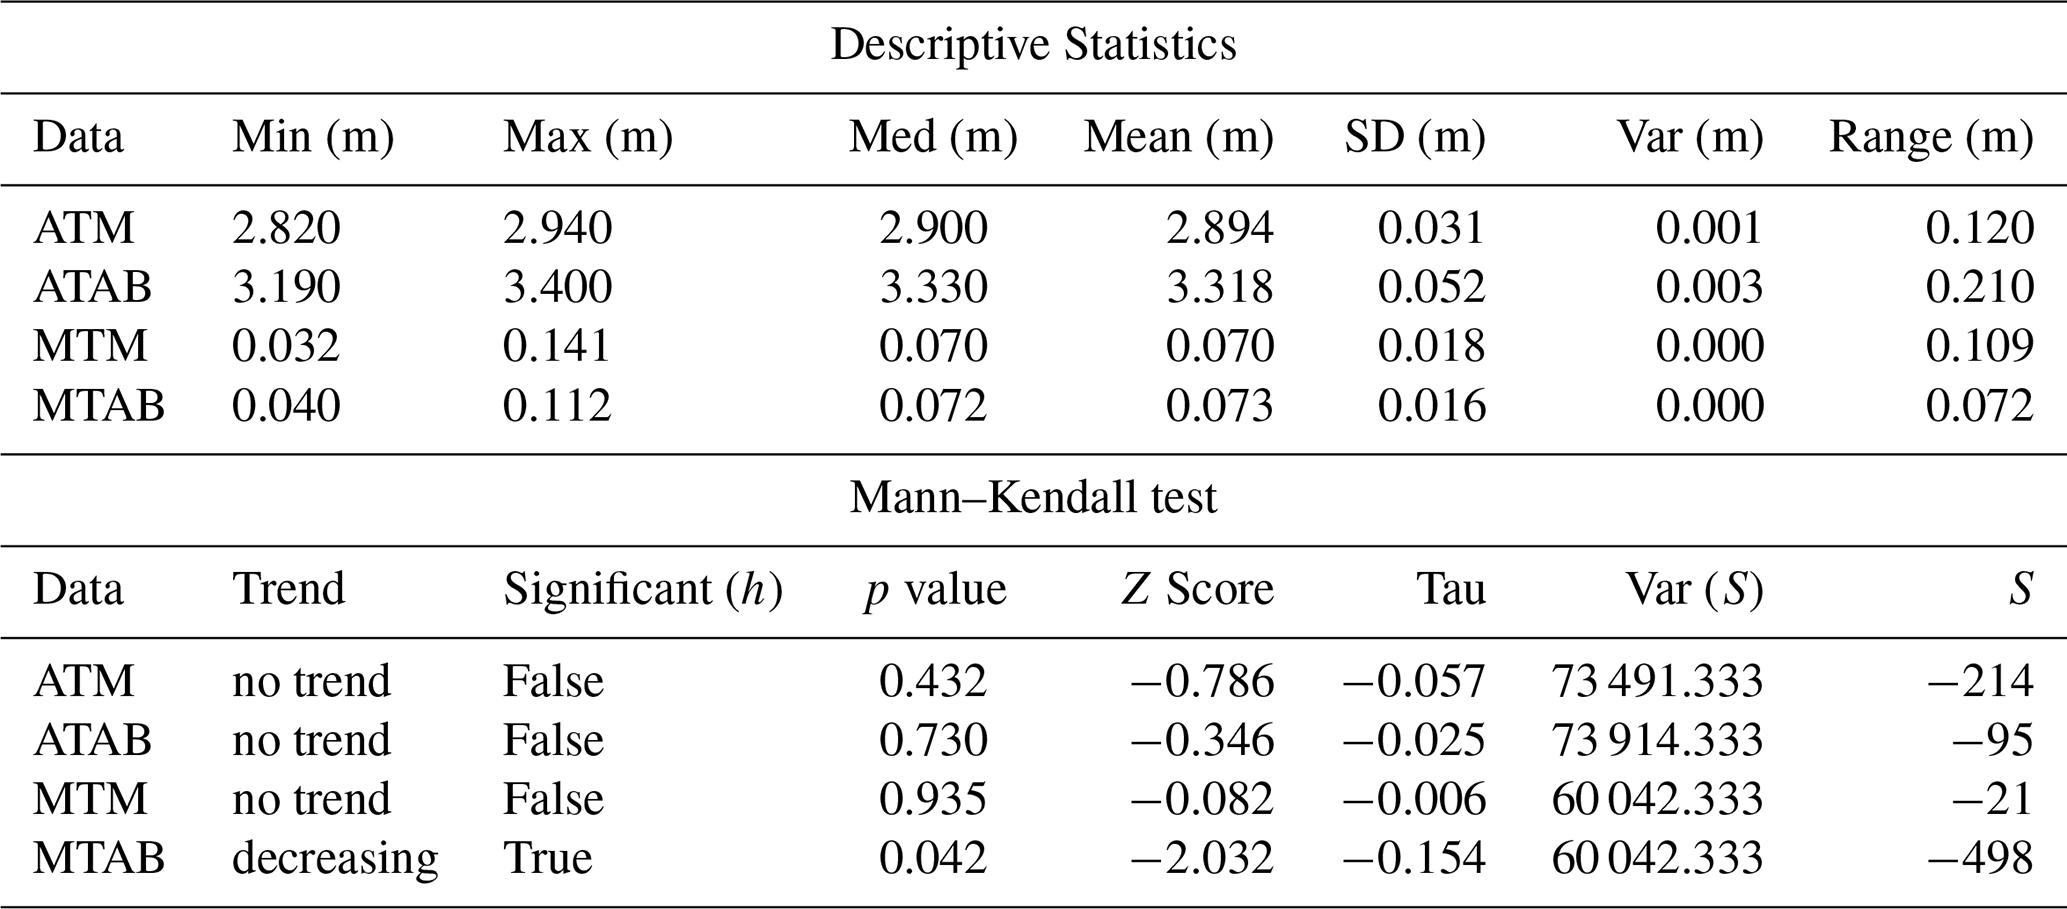
The ATs of Macau (ATM) varied between 2.82 and 2.94 m (Table 3), with an average of 2.90 m and low dispersion (SD = 0.031), indicating stability over time, with more sporadic maximums. In Areia Branca (ATAB), the values ranged from 3.19–3.40 m, with an average of 3.33 m, reflecting greater astronomical amplitude in the western sector, including more recurrent maximums. For MT, the maximum values were 0.14 m in Macau (MTM) and 0.11 m in Areia Branca (MTAB), confirming the low magnitude typical of this forcing in the Brazilian semiarid region, in addition to its episodic and irregular behavior, characteristic of this process in the tropics.
The Mann–Kendall test revealed no significant trends in almost all series, indicating a pattern of stability, except for MTAB (p=0.042; ), which showed a statistically significant downward trend. This result may indicate a gradual reduction in local meteorological influence, possibly associated with large-scale atmospheric modulation and/or limitations in data reconstruction, an important aspect to be discussed in methodological terms.
Table 3Descriptive statistics and Mann–Kendall test results for astronomical and meteorological tide series in Macau and Areia Branca.
Inspection of the complete time series between 1940 and 2025 shows relative stability in AT and greater dispersion in MT, especially in Macau (Fig. 5). The histograms confirm the concentration of values around the calculated means, while the non-exceedance probability (NEP) curves indicate percentages up to 95 % below the mean, reinforcing that extreme events are rare but of high magnitude when compared to the maximum values obtained.
The expected maximums for the 20 year return period (RP20) were reasonably above the maximums of the time series. For ATM, a maximum tide of 2975 m is expected, while for ATAB, values of 3454 m are expected. The expected values are close to those obtained in similar studies in the same area, such as those conducted by Araújo et al. (2021) and Aguiar et al. (2019).
The non-astronomical effects presented quotations associated with RP20 of 0.110 m for Macau (MTM) and 0.109 m for Areia Branca (MTAB). These values are close to the 10 cm threshold already reported by Frota et al. (2016), Rodríguez et al. (2016), and Melo Filho (2017) in studies on meteorological tides in Brazil and nearby regions. This convergence reinforces the methodological consistency of this work, highlighting results that are in line with the literature and supported by previous empirical bases.
The Morlet wavelet transform applied to the series of annual maximum quotas (Fig. 6) revealed contrasting patterns between Macau and Areia Branca. In the ATs, it showed persistent energy on decadal scales (≈ 10–20 years), with low interannuality. In Areia Branca, the energy is predominantly short interannual (≈ 3–6 years) and less pronounced in the long periodicity bands. In a joint analysis of the data, the ATM is more susceptible to decadal oscillations that can potentiate extreme events when combined with atmospheric forcings.
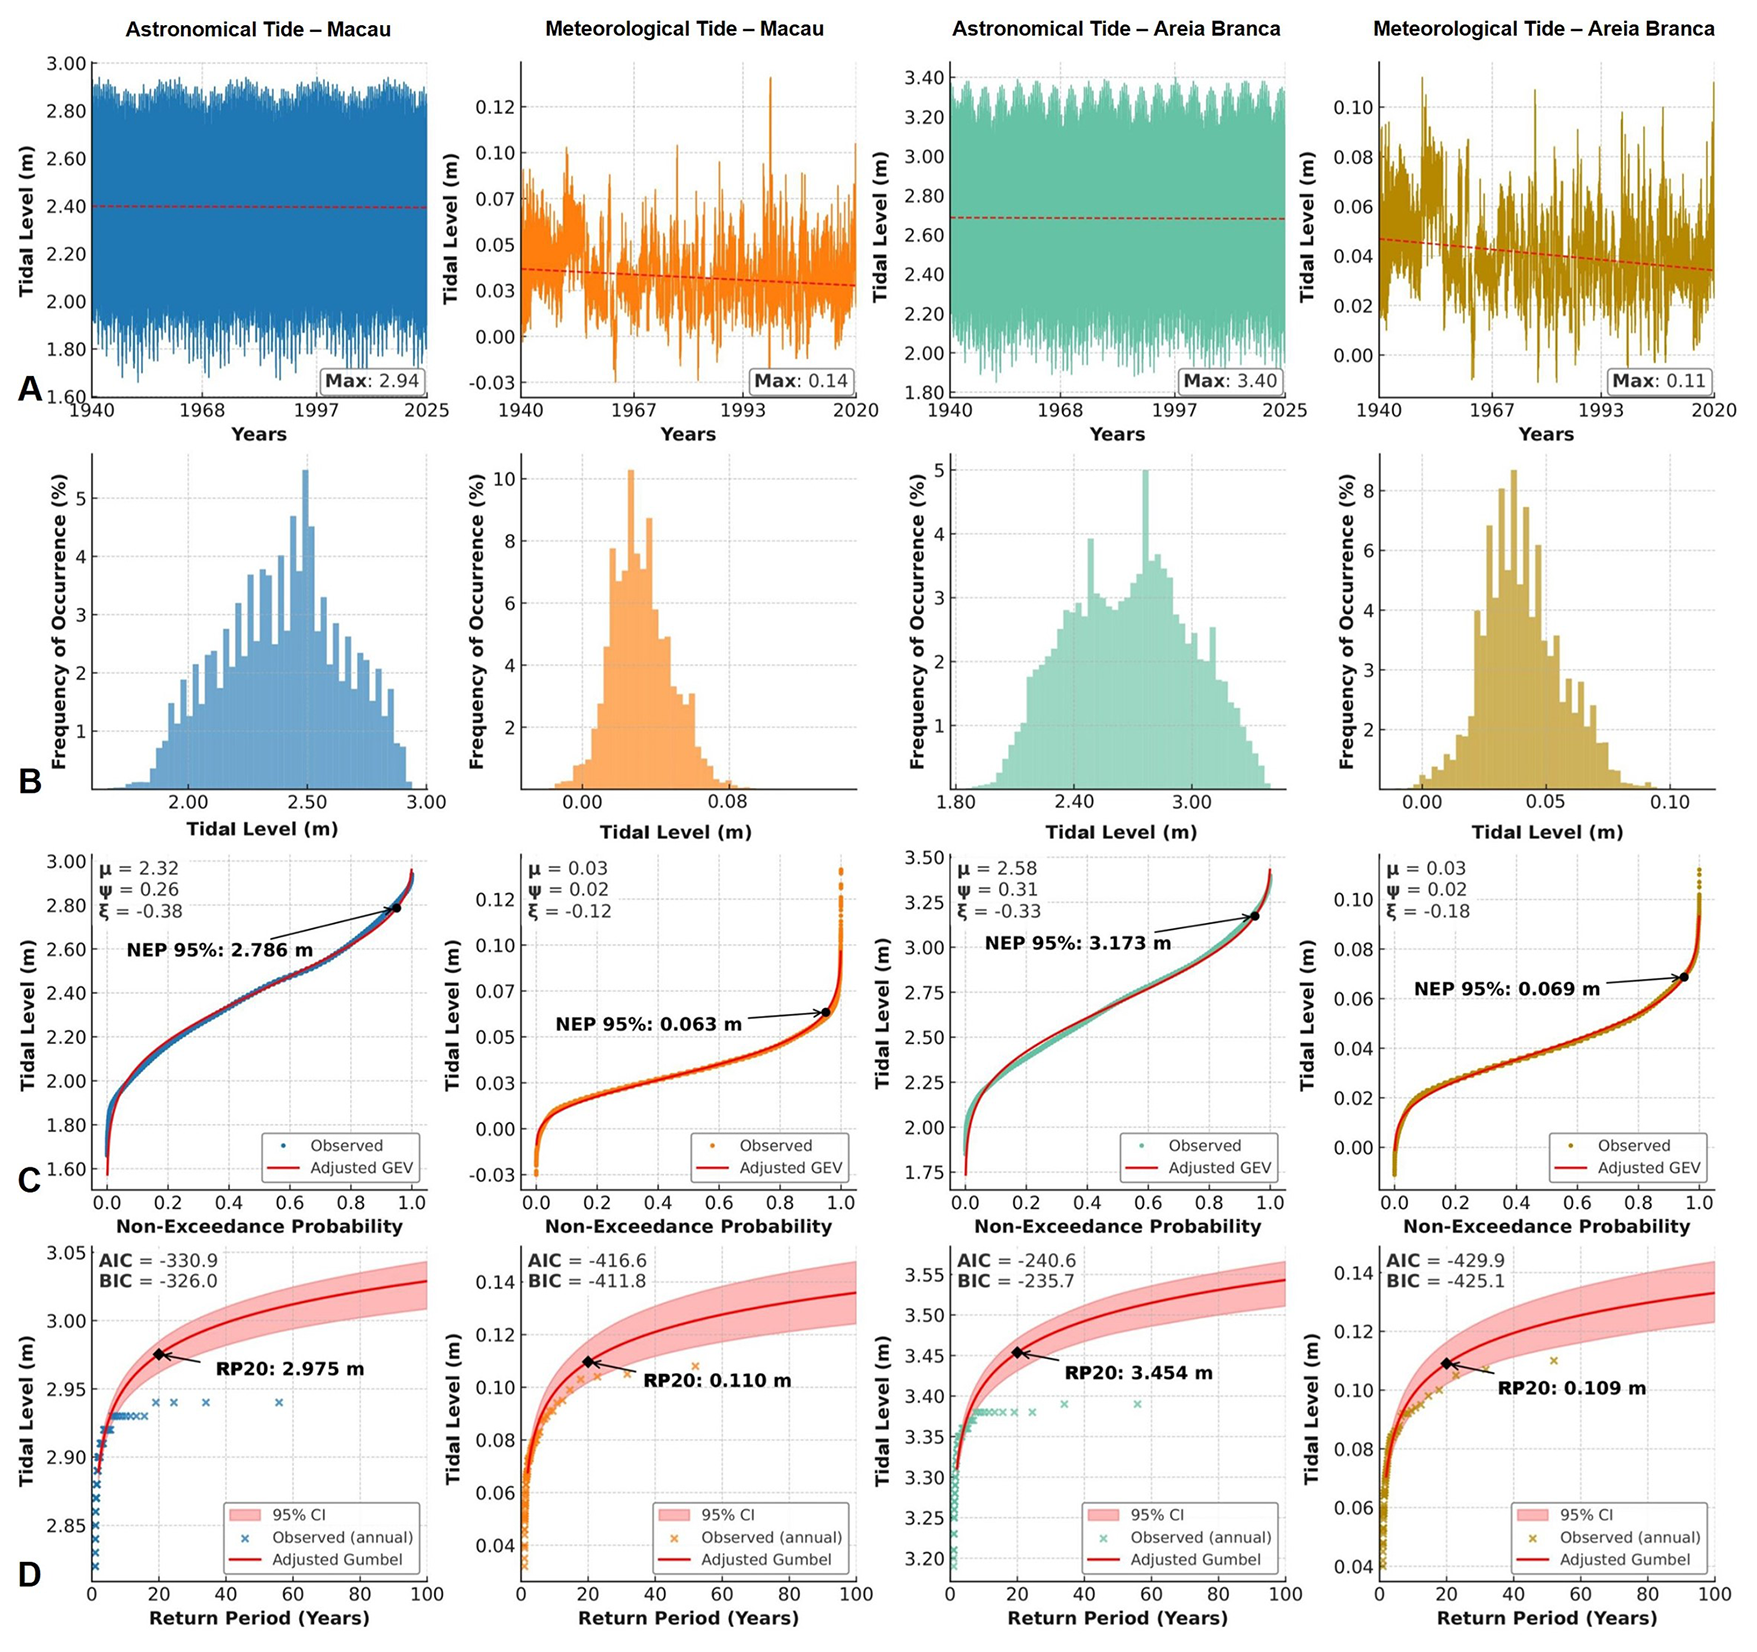
Figure 5Time series (A), frequency distributions (B), non-exceedance probability curves (C), and return period estimates (D) of maximum astronomical and meteorological tides at Macau and Areia Branca. Each column in the graphs represents a location and the type of tide analysed.
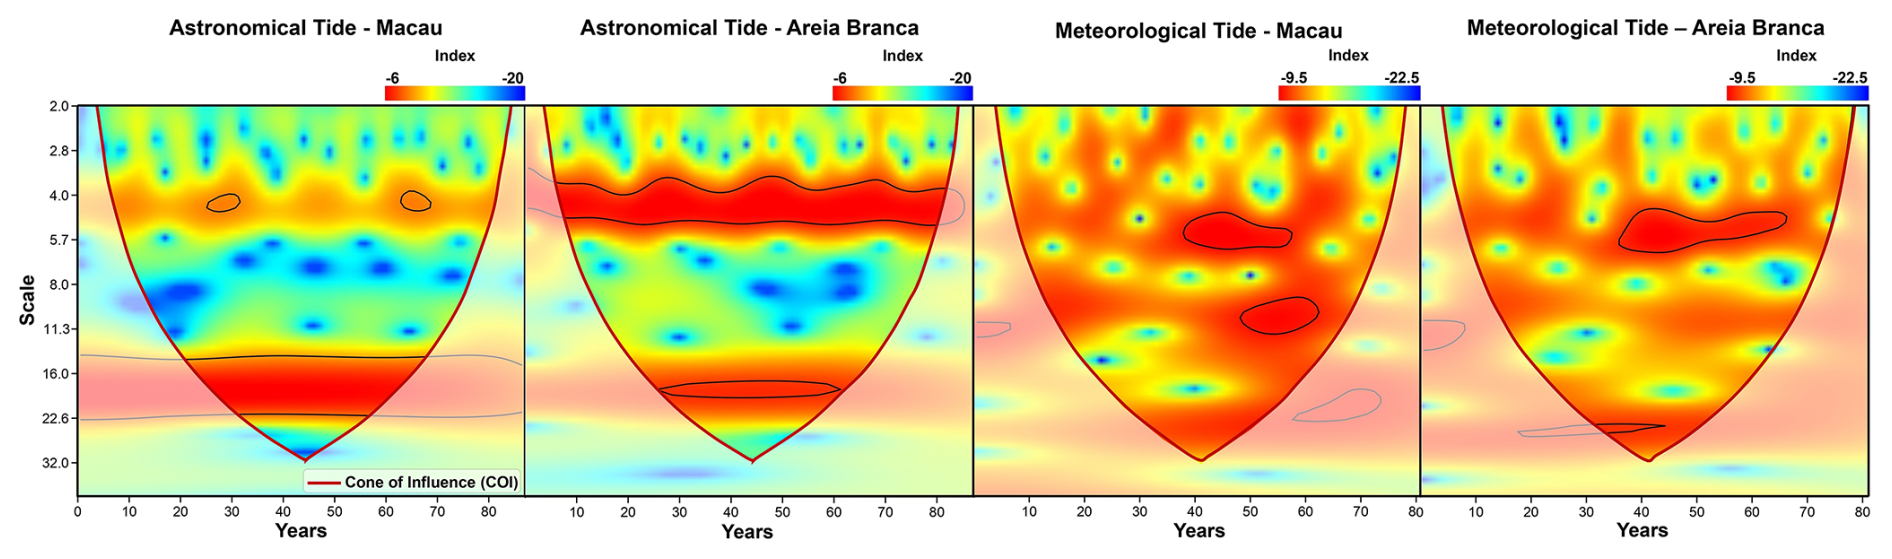
Figure 6Continuous spectral analysis (Morlet wavelet) applied to maximum tide series. The Cone of Influence (COI) is indicated by the red line limiting the reliable region of the analysis. The black line indicates the significance level p=0.05. The vertical axis (Scale) shows the temporal decomposition: short cycles (2–4 years, high frequency) are concentrated at the top, while long oscillations (16–32 years, low frequency) are located at the bottom.
In a general analysis, ATs showed persistent energy in interannual and decadal bands, confirming their forced and predictable nature. Macau has a higher occurrence of energetic extremes in interdecadal cycles, while Areia Branca has more energetic interannual cycles.
In MTs, the signals are more irregular, without a clear cyclicality. In Macau, the energy is episodic with irregular annual peaks (≈ 4–6 years), with irregular occurrences in ≈ 8–10 years, but without robustness. In Areia Branca, there is greater persistence in concerted annual cycles of ≈ 4–8 years and significant recurrence close to ≈ 20 years, suggesting modulation by regional-scale climate variability. However, it is important to note that the smoothing nature of the data tends to underrepresent actual meteorological peaks, smoothing out energy extremes, as stated by the creators of the base data (Yang et al., 2025).
The combination of AT and MT in years of higher interannual/interdecadal energy can combine energies and generate a mixed effect, intensifying potential extremes. Even though events combining meteorological and astronomical maxima are quite peculiar.
The AT quotas validated in the BGS, marked by the reduction level quotas (Macau: −1.1129 m; Areia Branca: −1.3532 m), allowed the RP20 quotas of 1862 m for Macau and 2101 m for Areia Branca to be obtained. The values found are slightly similar to the maximum elevations obtained from the Global Ocean Tides (GOT) and Global Ocean Surge (GOS) data from SMC-Brazil, found by Silva et al. (2025), which estimates a maximum regime close to 2 m for medial portions of the area.
Obtaining quotas is essential for weighing up the proposed coastal process packages.
4.2 MSLR scenario modeling
The different MSLR scenarios presented virtually similar patterns, varying essentially in the intensity of flooding, which changes significantly across the multiple scenarios (Fig. 7), increasing the potential for stacking of projected daily levels in low-lying areas, progressively increasing the probability of hazards in the time frame.
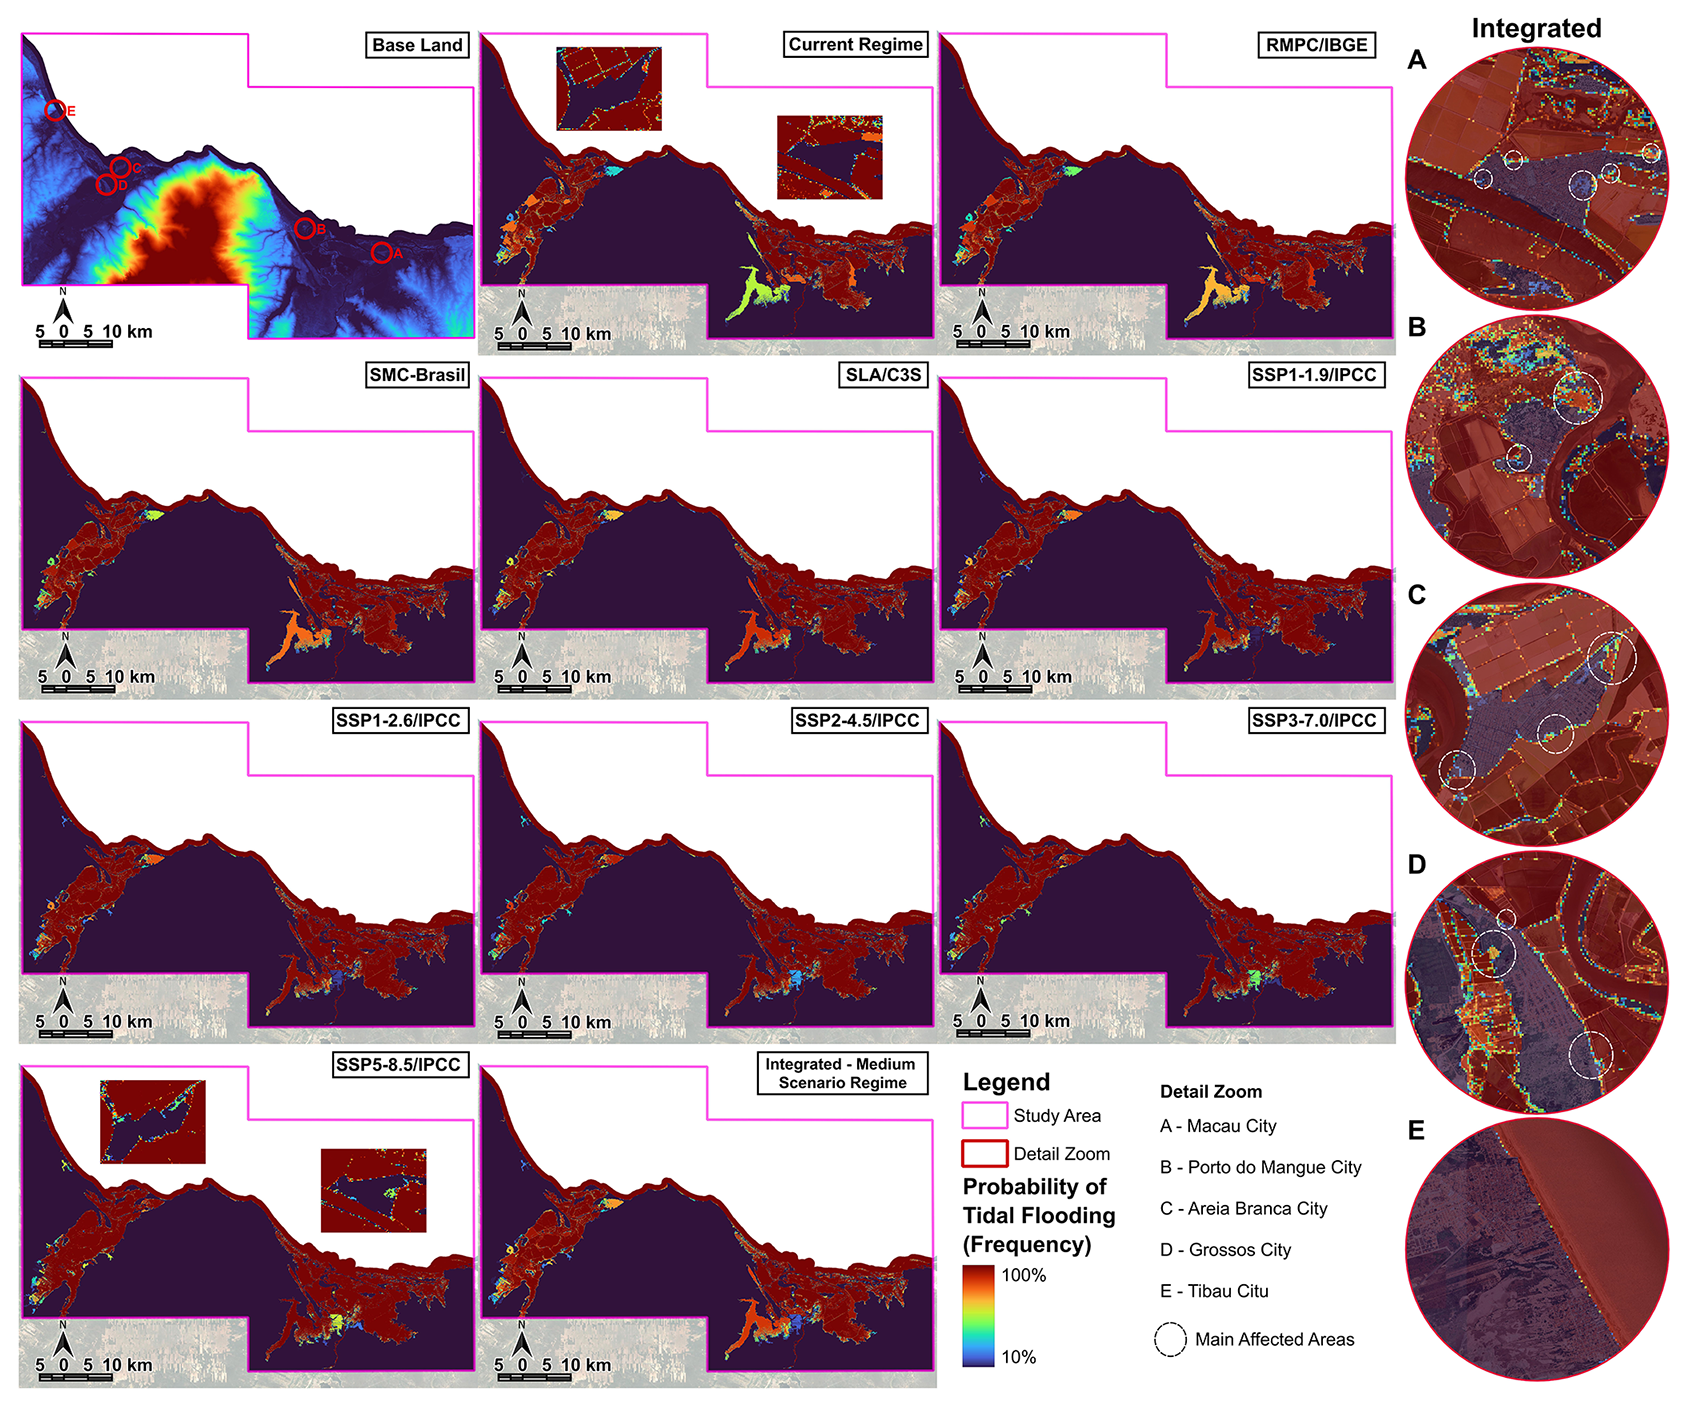
Figure 7Probability scenarios for flood hazard events obtained through frequency modeling. Each plot represents a modeled scenario, with the natural terrain quadrant representing the baseline scenario used for modeling. The side portion shows a zoom-in view of only the main urban agglomerations in the study area. Map uses the base map data from Bing Maps (© Microsoft).
In the projected frequency scenarios, the salt flats and their operational structures were considerably affected, with up to 100 % of days flooded in almost all projections, a fact already expected due to the nature of the activity. However, based on SSP1-1.9, the dikes that surround the ponds (Fig. 8) overlap with a 100 % probability of continuous flooding, which represents a critical point, since these dikes control the internal water levels of the salt flats and estuaries. The imbalance of these systems can cause occasional flooding due to hydraulic decompression or even flash floods, processes not represented by the model but recurring in the region, as reported in local news (Mossoró Hoje, 2024).
Urban areas, in turn, showed a low probability of flooding under the current regime, restricted to a few localized features in the center of Macau and Areia Branca, but quite sporadic. However, in progressively more severe scenarios such as SSP5-8.5, these sectors will experience probabilities of 60 %–70 % of flooded days by 2100 in occupied areas, respectively.
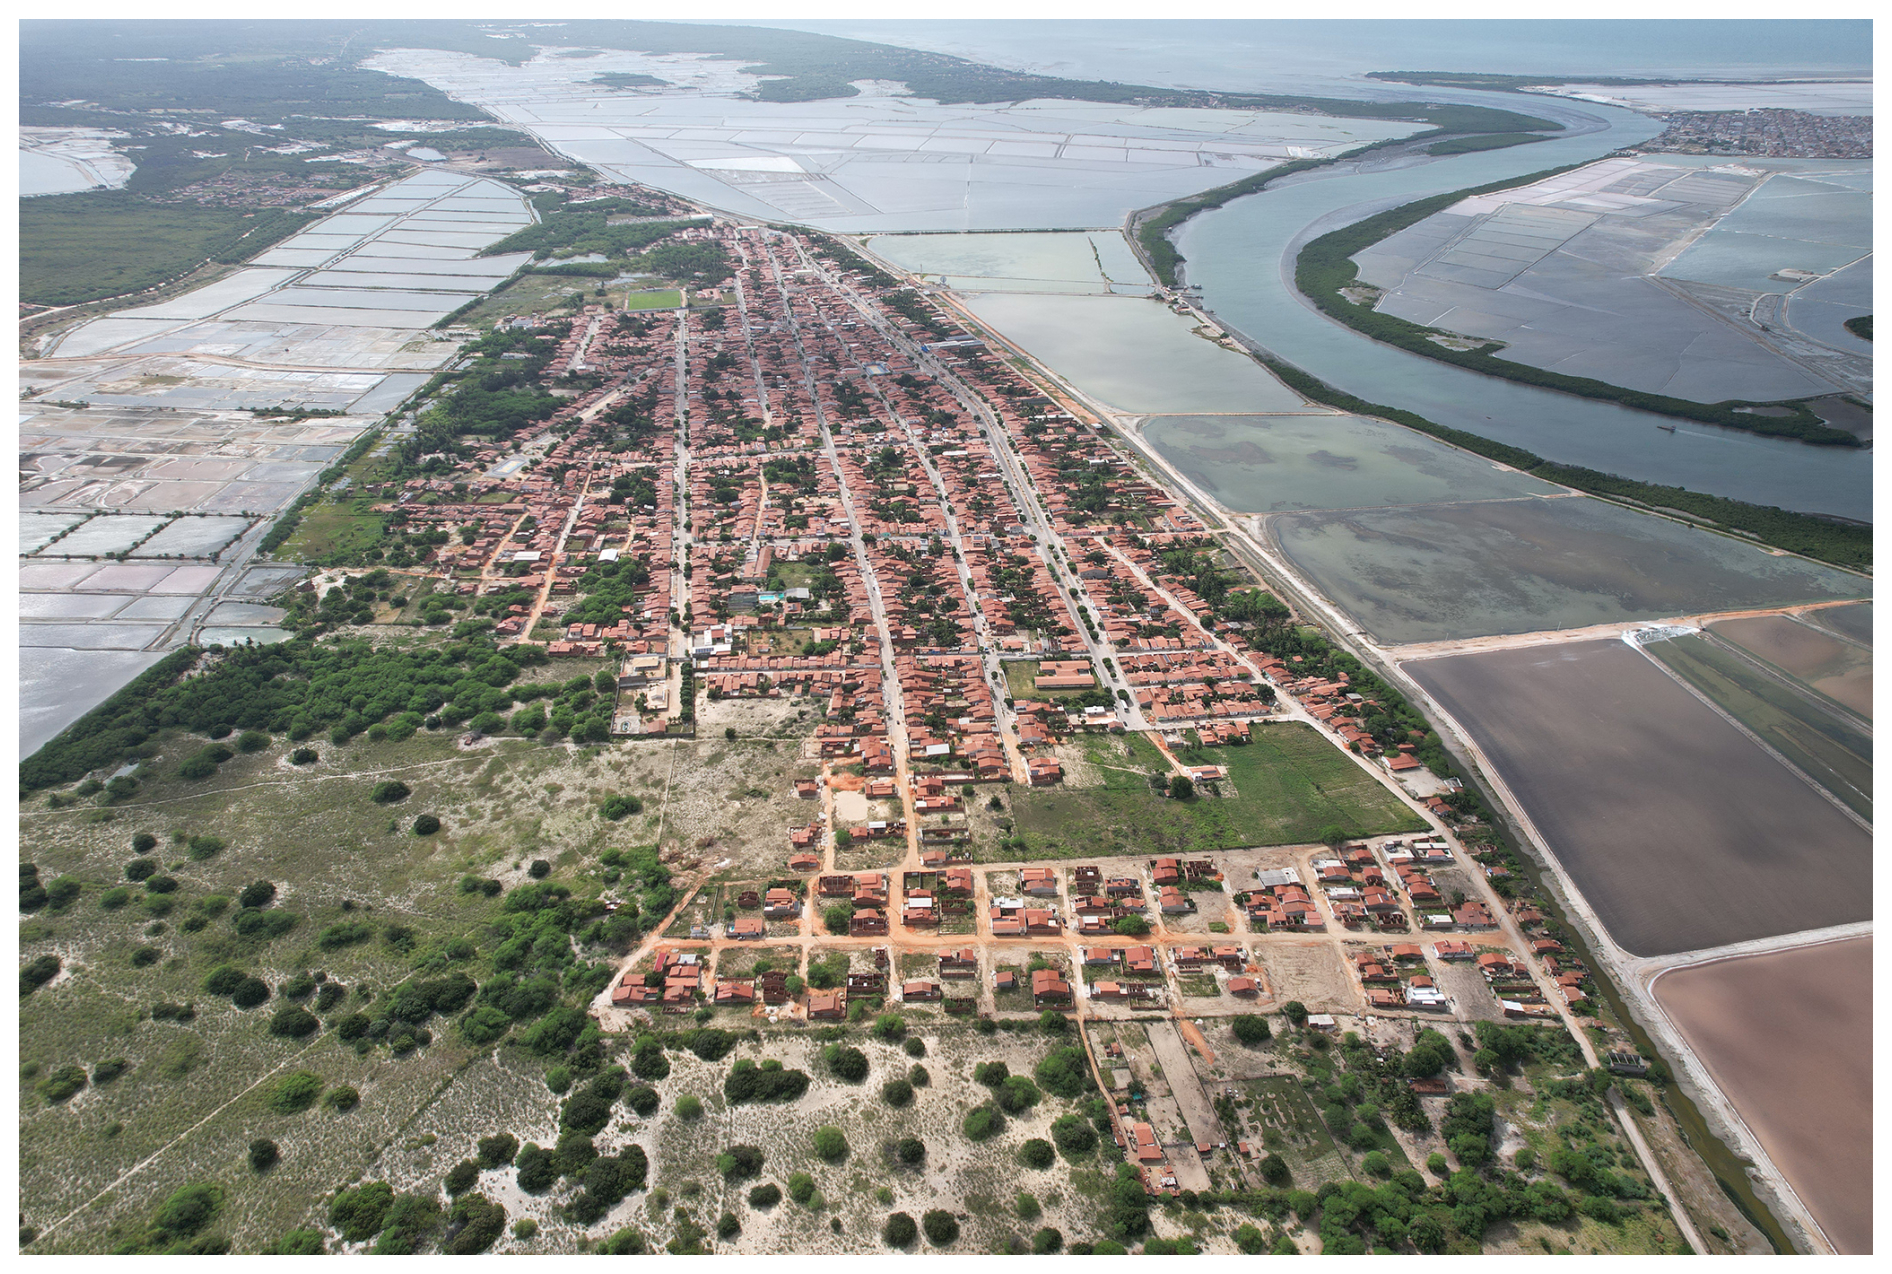
Figure 8Aerial image of downtown Grossos, showing the dikes that control the levels of salt flats on the outskirts of the urban area. Photograph by the study authors.
The integrated analysis, based on the average of all scenarios, shows that critical flooding points are concentrated in the main urban areas of Areia Branca, Macau, and Porto do Mangue, which have a probability of flooding ranging from 60 %–80 % of days in at least three occupied sectors. This condition is particularly relevant, as it suggests that maximum daily levels would already be sufficient to impact urban areas in at least six simulated scenarios. In contrast, cities such as Tibau and Grossos showed resilience even in pessimistic scenarios, with very low daily flooding, indicating that their hazard to marine intrusion remains limited.
In the context of a maximum event, total flooding was estimated based on sea level projection values linked to the geodetic plane for 2100 (Table 4). In a comparison between the river mouths, different behaviors were observed: in the Piranhas-Açu River, there is lateralization of the water surface in all scenarios (Fig. 9), while in the Apodi-Mossoró River, the advance is internalized, revealing distinct flooding patterns conditioned by topography and river dynamics. Considering the total area, an overlap of 14 % of the analysis area (about 730 km2) was obtained, which could reach 16 % (849 km2) in the most pessimistic scenario.
Table 4Projected flood levels linked to the geodetic reference plane. ATrp20 corresponds to the astronomical tide projected for a 20 year return period, while ATrp20 (BGS) represents the same level adjusted and validated on the geodetic plane. NAErp20 refers to the meteorological tide projected for the same return period. The RMSE expresses the average error of the digital elevation model used as a basis, and FL corresponds to the final flood elevation resulting from the combination of these parameters.
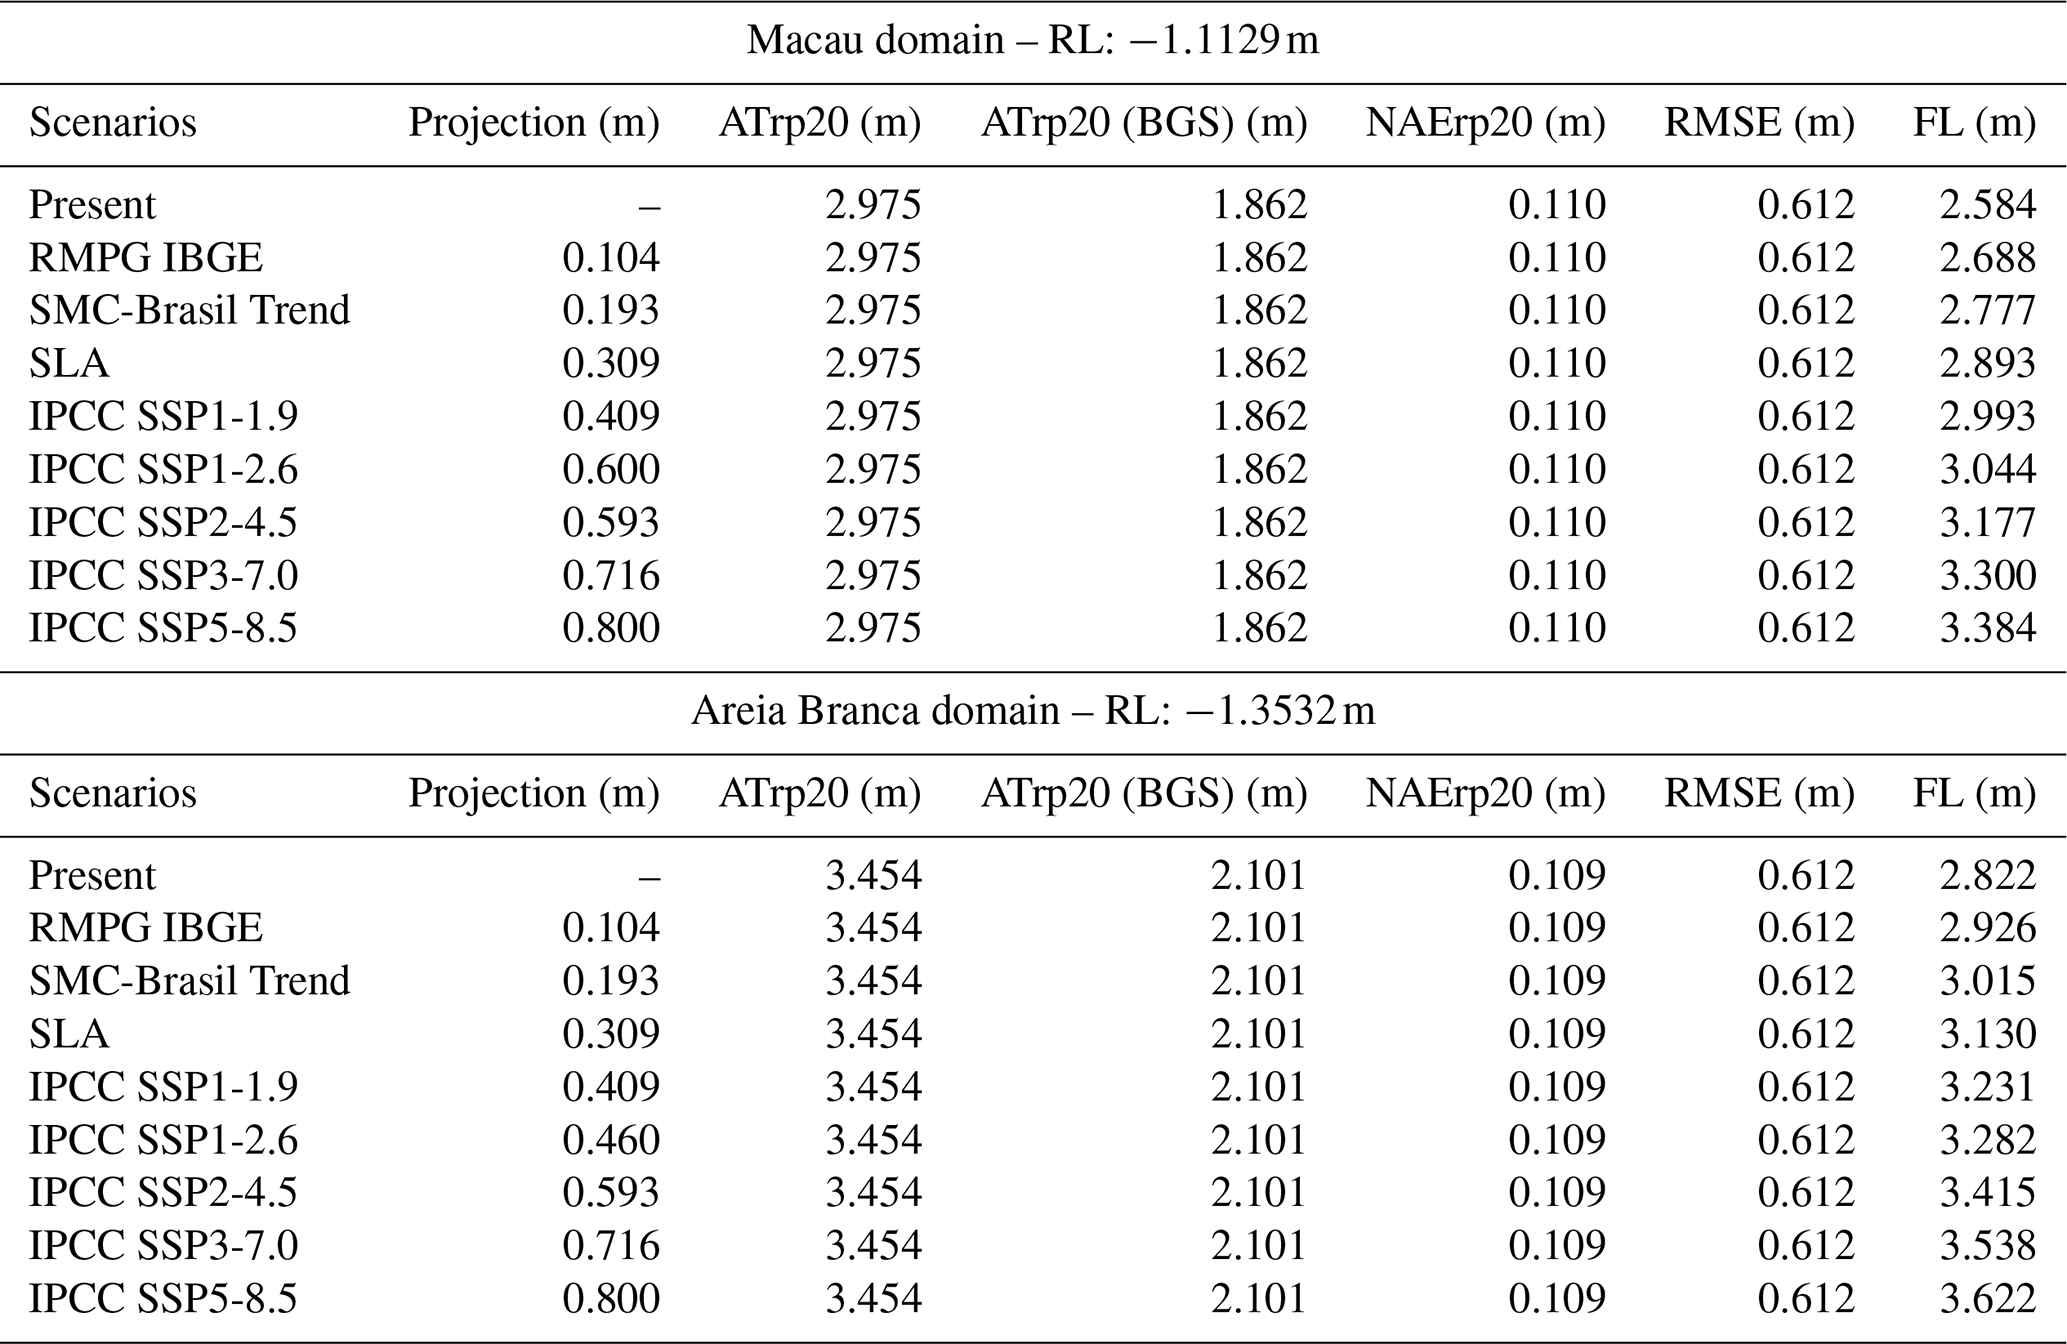
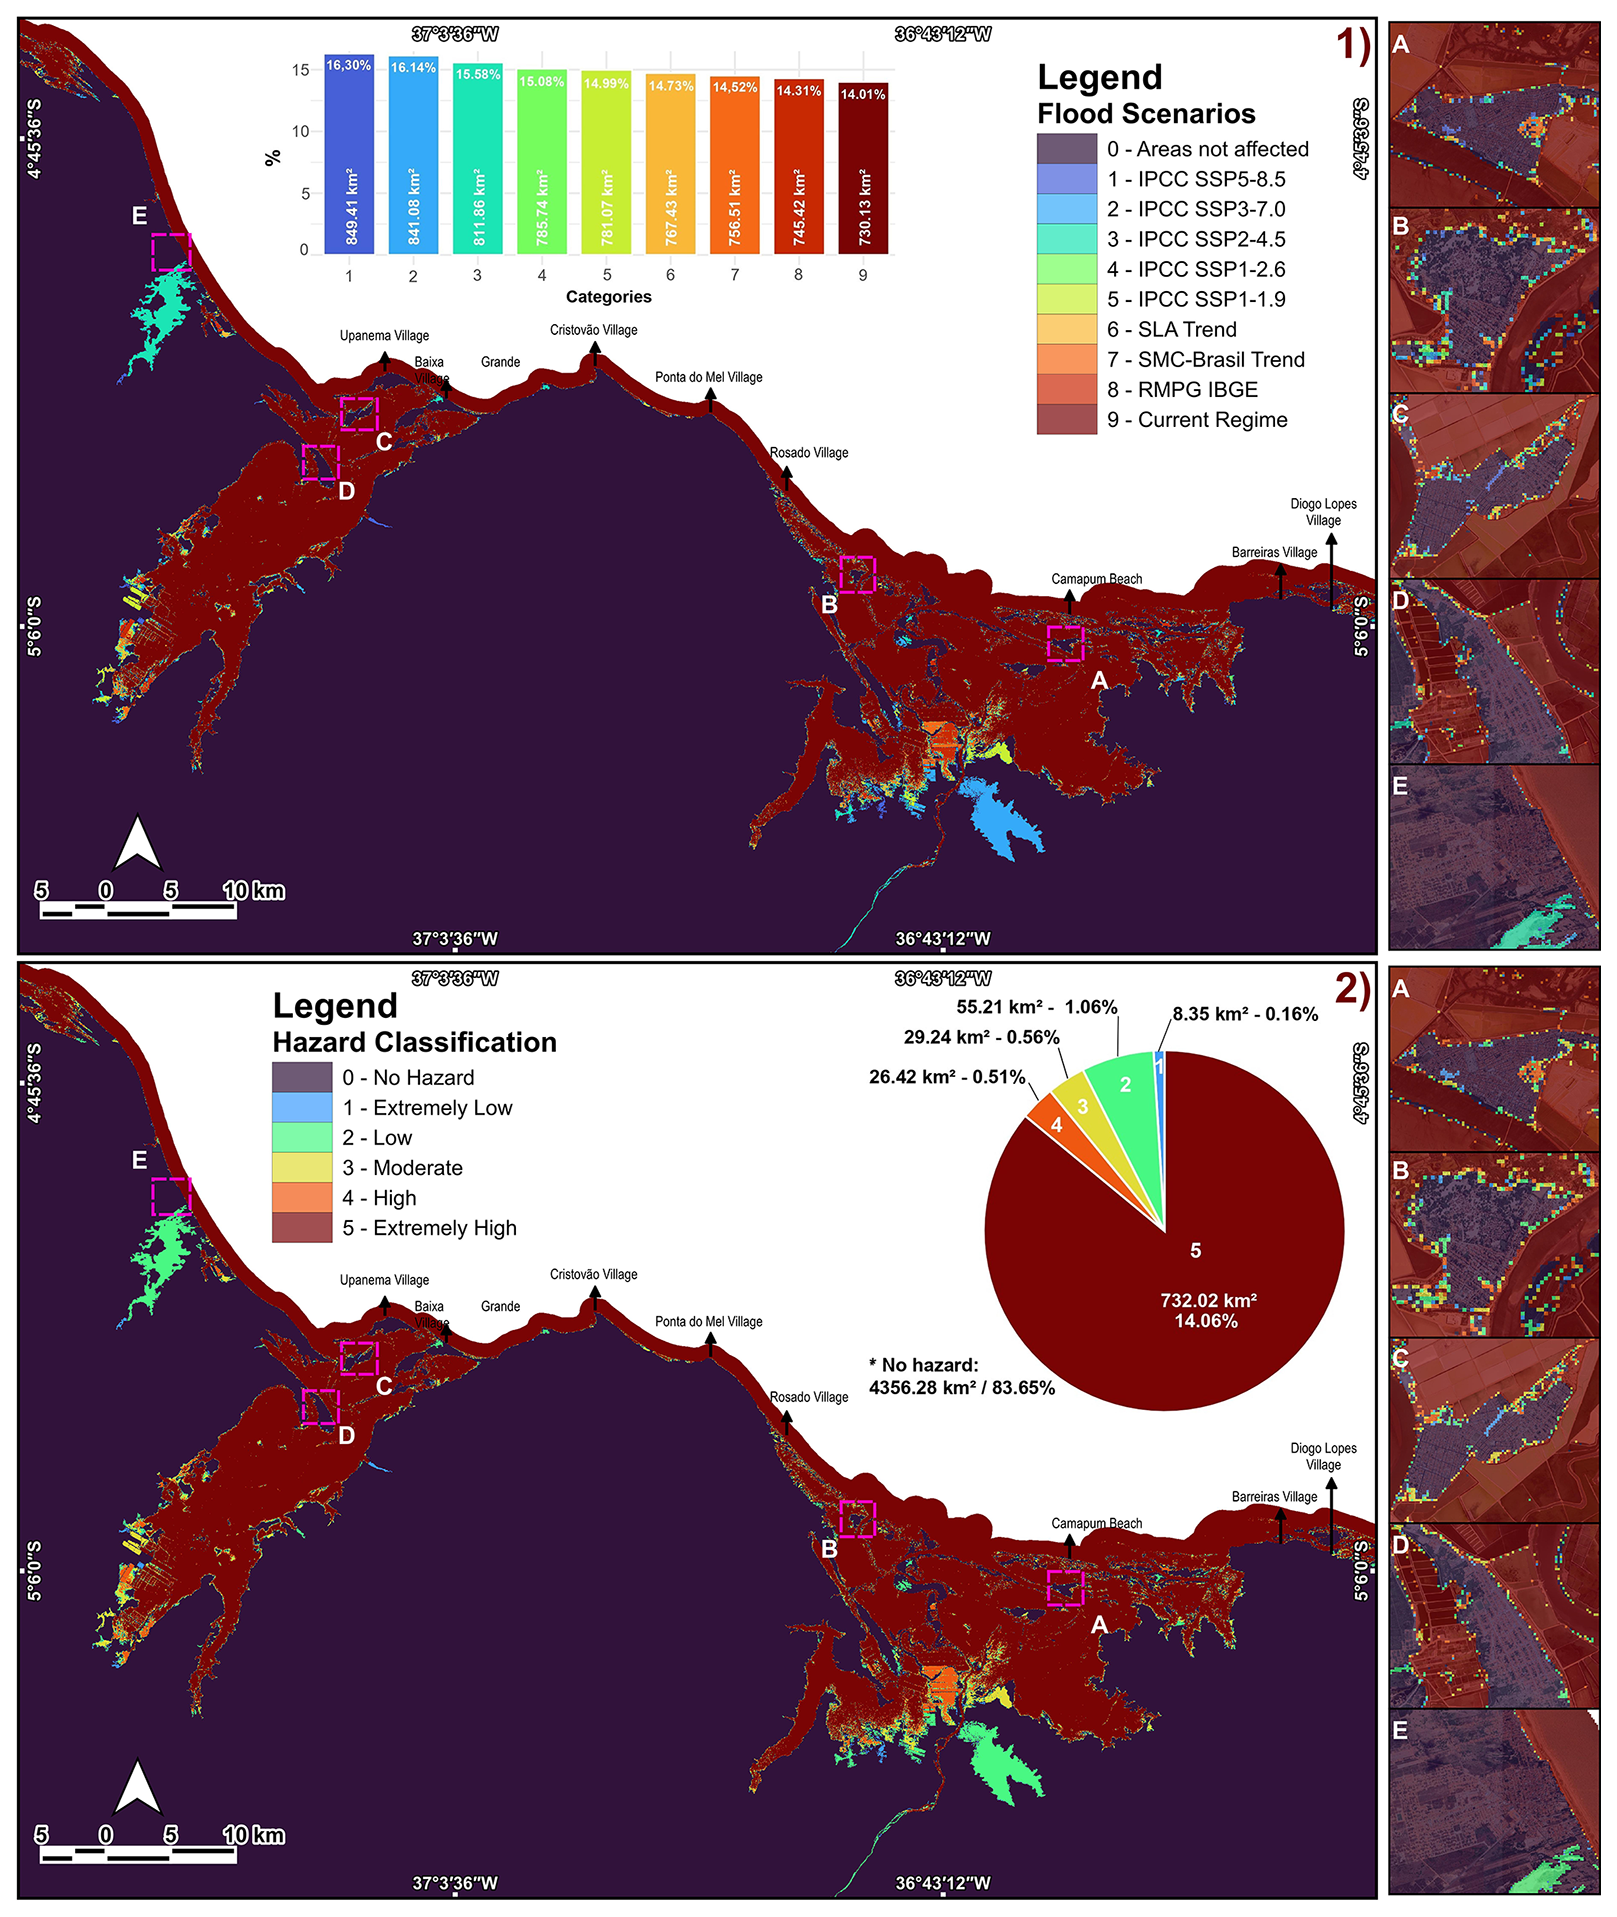
Figure 9Classification of MSLR scenarios in the study area (1) and classification of tidal flooding hazards (2) by sector. The far-right column shows the scale zones in the cities of the study area. The graphs on the maps indicate the percentages of the total area occupied. Map uses the base map data from Bing Maps (© Microsoft).
On a detailed scale, Fig. 10 shows the direct overlap on urban areas already under the current regime, especially in Areia Branca and Porto do Mangue. Recent occupations were observed in subdivisions and official roads located in areas of recurrent flooding, confirmed by field checks. Although other cities have proven relatively resistant in the initial scenarios, SMC-Brasil trends indicate progressive intensification, with significant damage in Macau and isolated occurrences in Grossos, becoming even more critical in the most extreme IPCC scenario (2022).
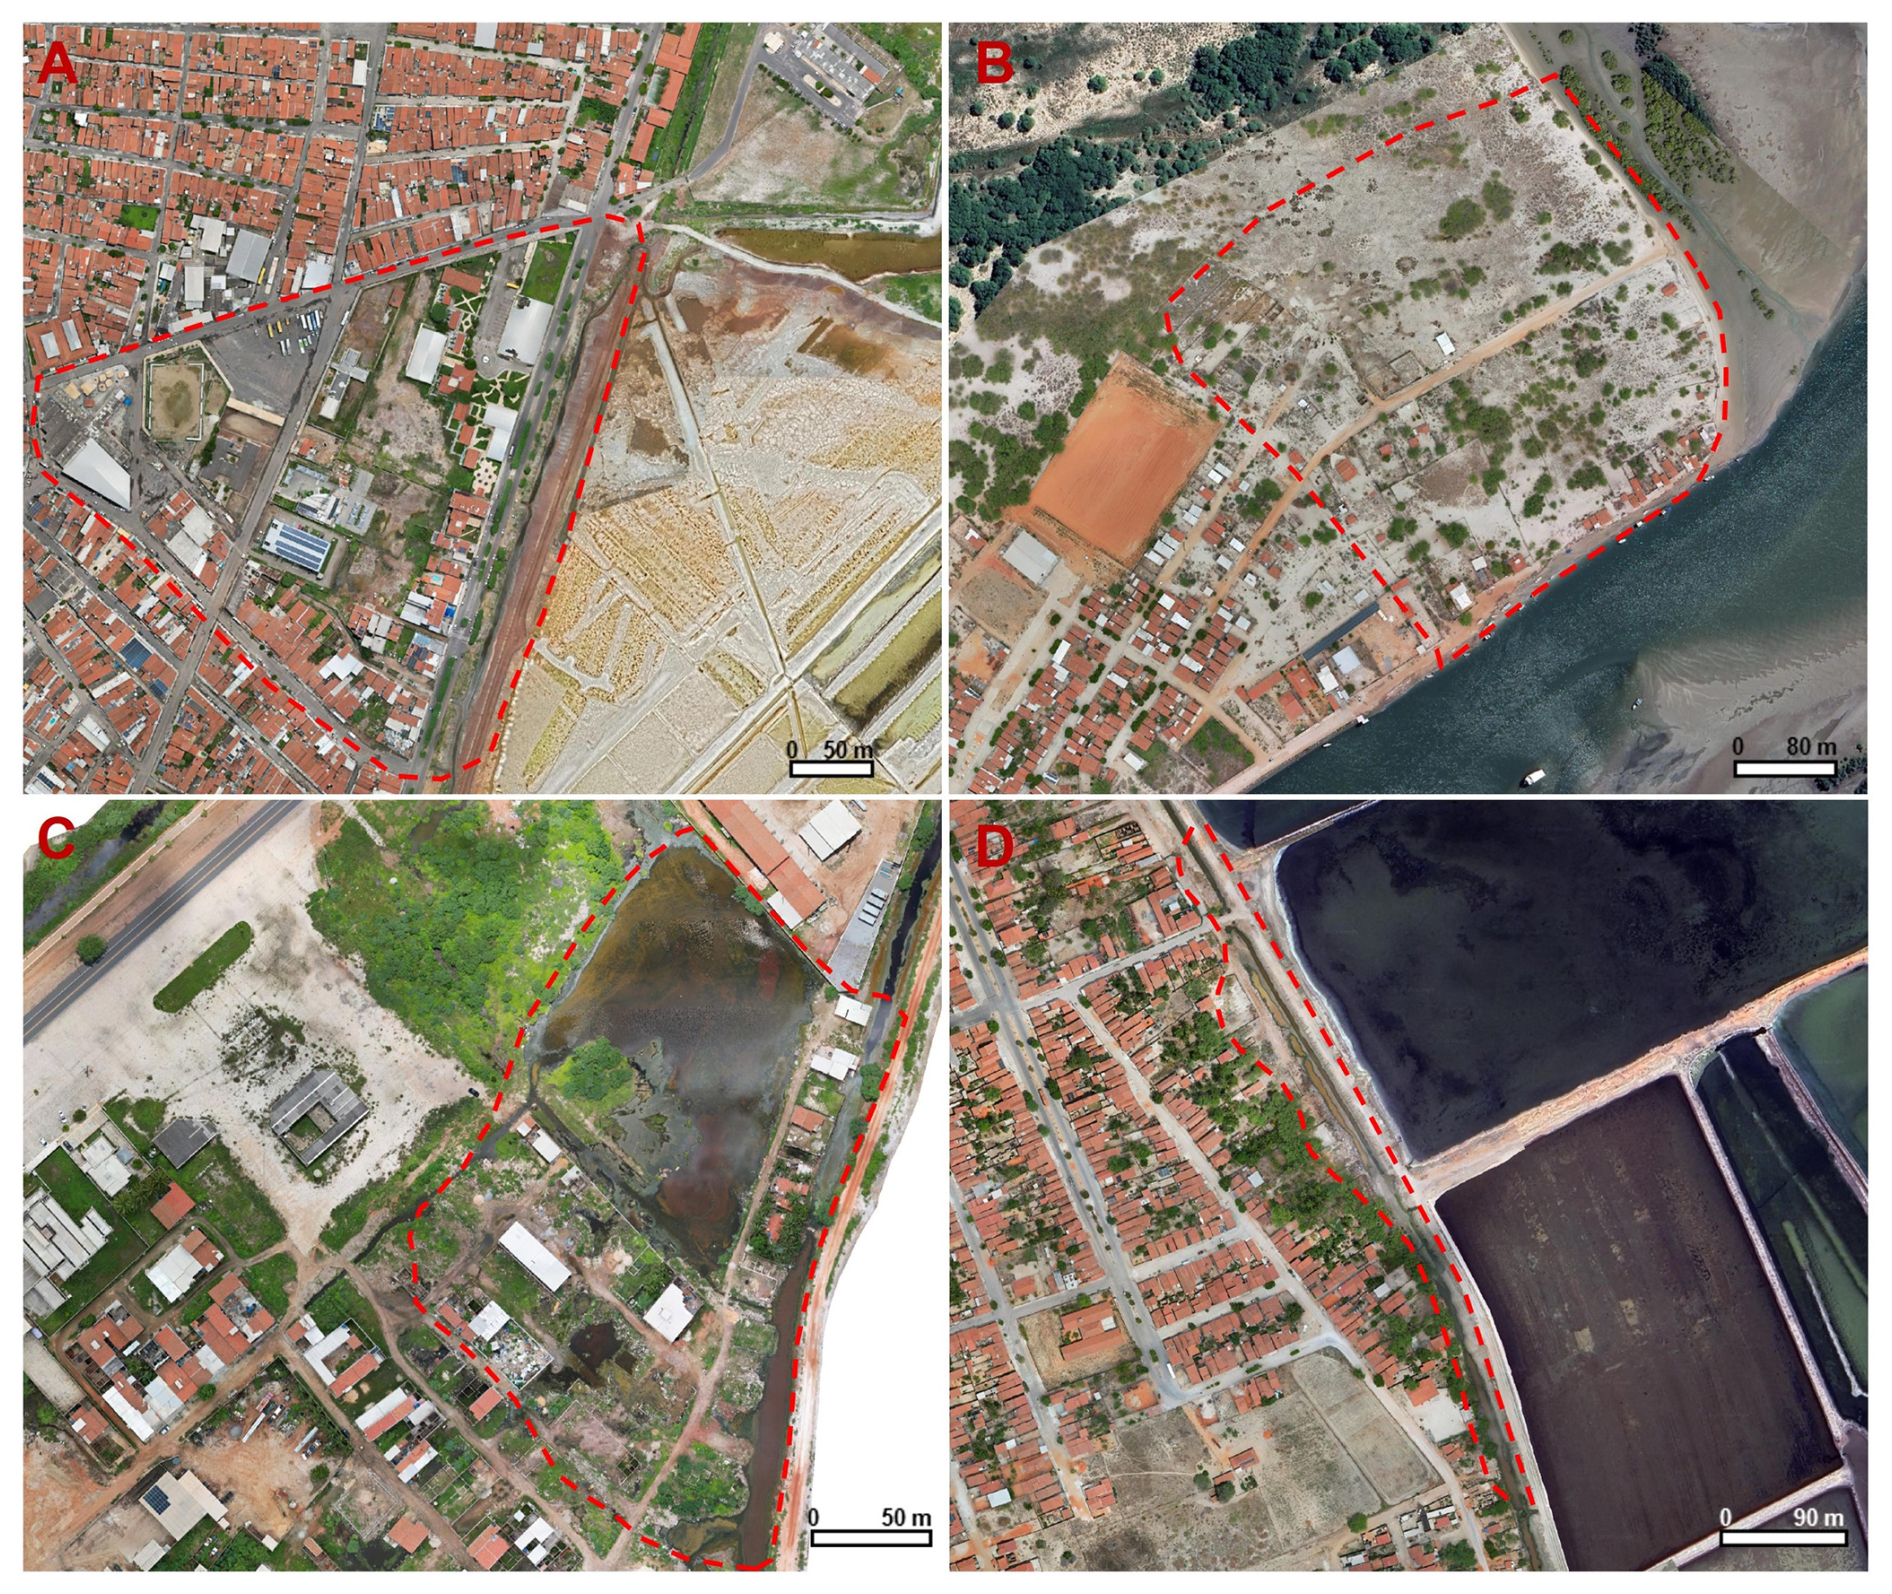
Figure 10Photographic records of the main areas indicated by the model as extremely high risk. It is noteworthy to observe the lowering of the mapped areas, especially Areia Branca, where flooding was verified in the field. (A) section of the urban area of Macau with the most susceptible area; (B) section of the urban area of Porto do Mangue with a low-lying portion prone to flooding; (C) urban area of Areia Branca with flooding boundaries; and (D) urban area of Grossos with channels prone to overflowing. Photographs by the authors (2025).
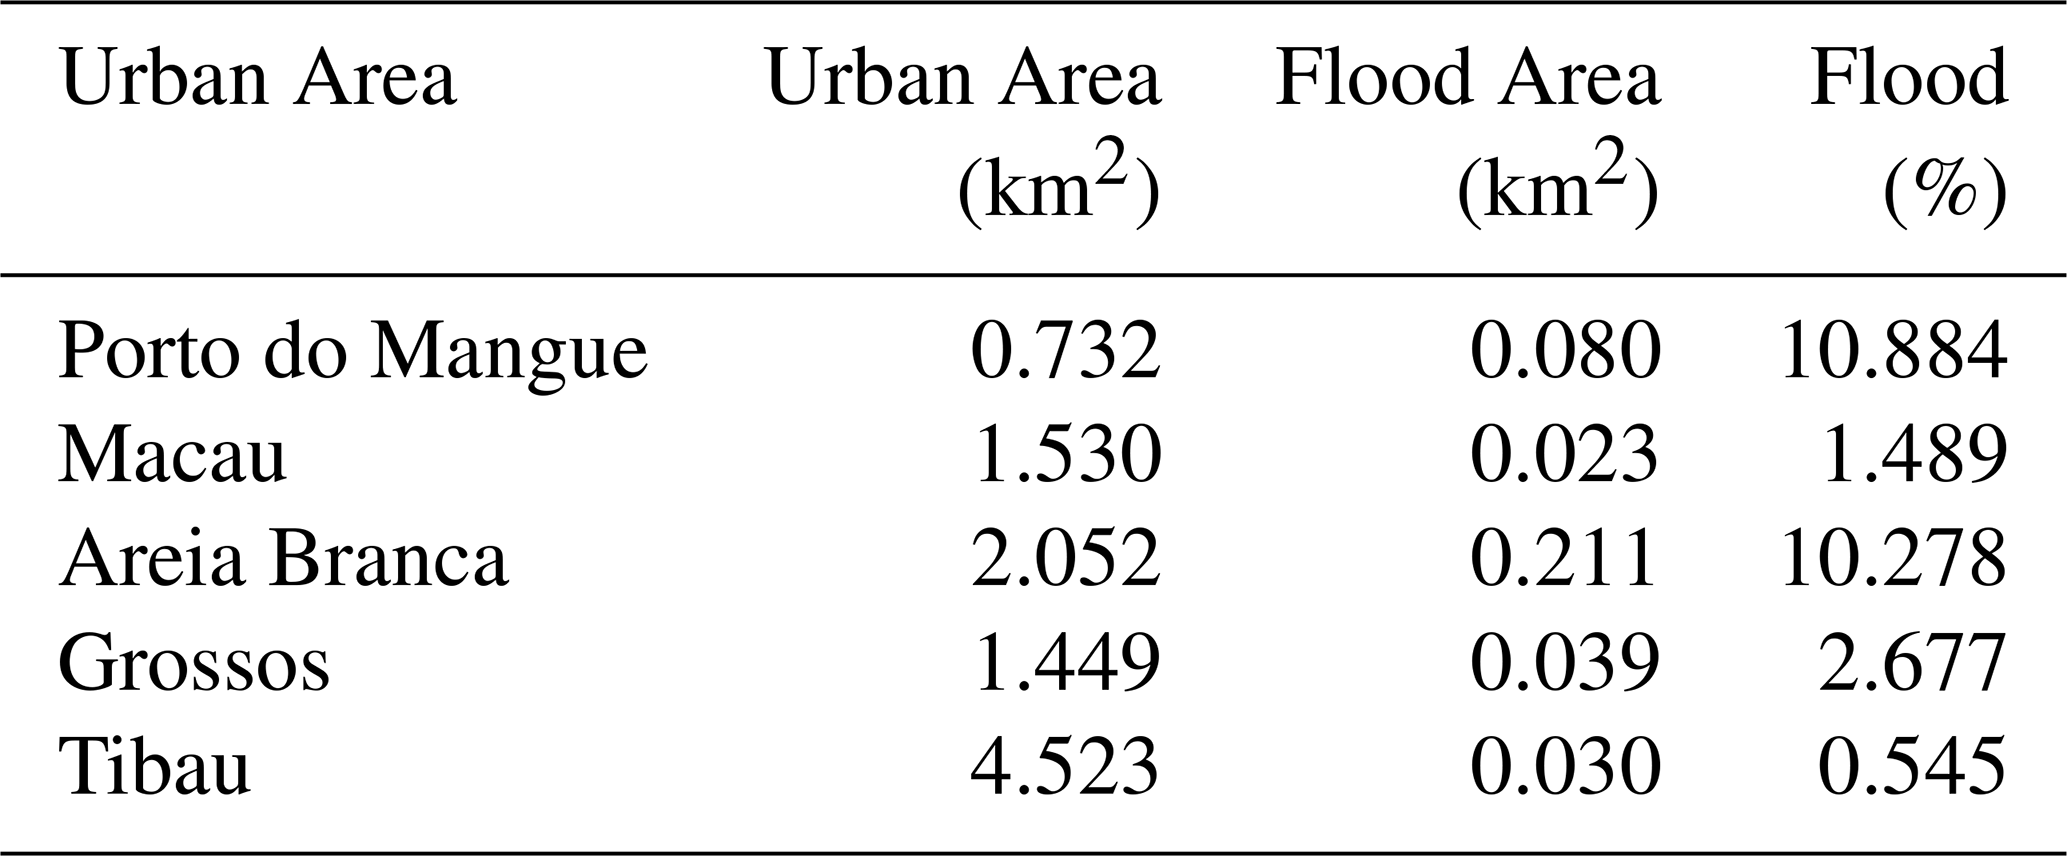
In the segmentation by hazard classes, 731 km2 were identified as being at extremely high risk, corresponding to 14 % of the study area. The urban areas of Areia Branca and Porto do Mangue stood out as the most affected, with about 10 % of the urban grid compromised, with the city of Areia Branca being the most impacted with 0.21 km2 (Table 5). Macau and Grossos presented specific areas of extreme hazard, affecting only specific infrastructure sectors. Tibau was the only less vulnerable city, with less than 1 % overlap, reinforcing its lower exposure to climate risk. Locations such as Upanema beach and Povoado Cristovão (Areia Branca), Povoado Rosado (Porto do Mangue), and Ilha de Santana village (Macau) also presented critical areas, but less than the urban centers listed.
Table 5Percentage of major urban areas at extreme risk of tidal flooding.
The patterns identified corroborate previous findings, such as in Grossos, where the results confirm less intense projections, but spatially similar to those of Silva et al. (2024). In Macau, the overlap was lower than that observed by Araújo et al. (2021), but occurred in the same low-lying urban areas. In Areia Branca, the affected areas coincided exactly with those evidenced by Aguiar et al. (2019). In Tibau, low exposure confirmed the resilience delimited by Rabelo et al. (2023) when analyzing conservation areas near the municipality. These parallels reinforce the consistency of the results and the validity of the mapping in identifying endemic areas of hazard.
4.3 Risk of tidal flooding
The validated land use showed the predominance of savanna formations, which correspond to Caatinga environments, occupying a total area of 47 % (Fig. 11) in relation to the study area. Next, pasture areas (13 %) and mosaics of diverse uses (14 %) stand out, comprising the second and third groups. Among specific uses, salt pans, the main activity in the region, deserve mention, representing 7 % of the area, as do urban areas, which total 2 %.
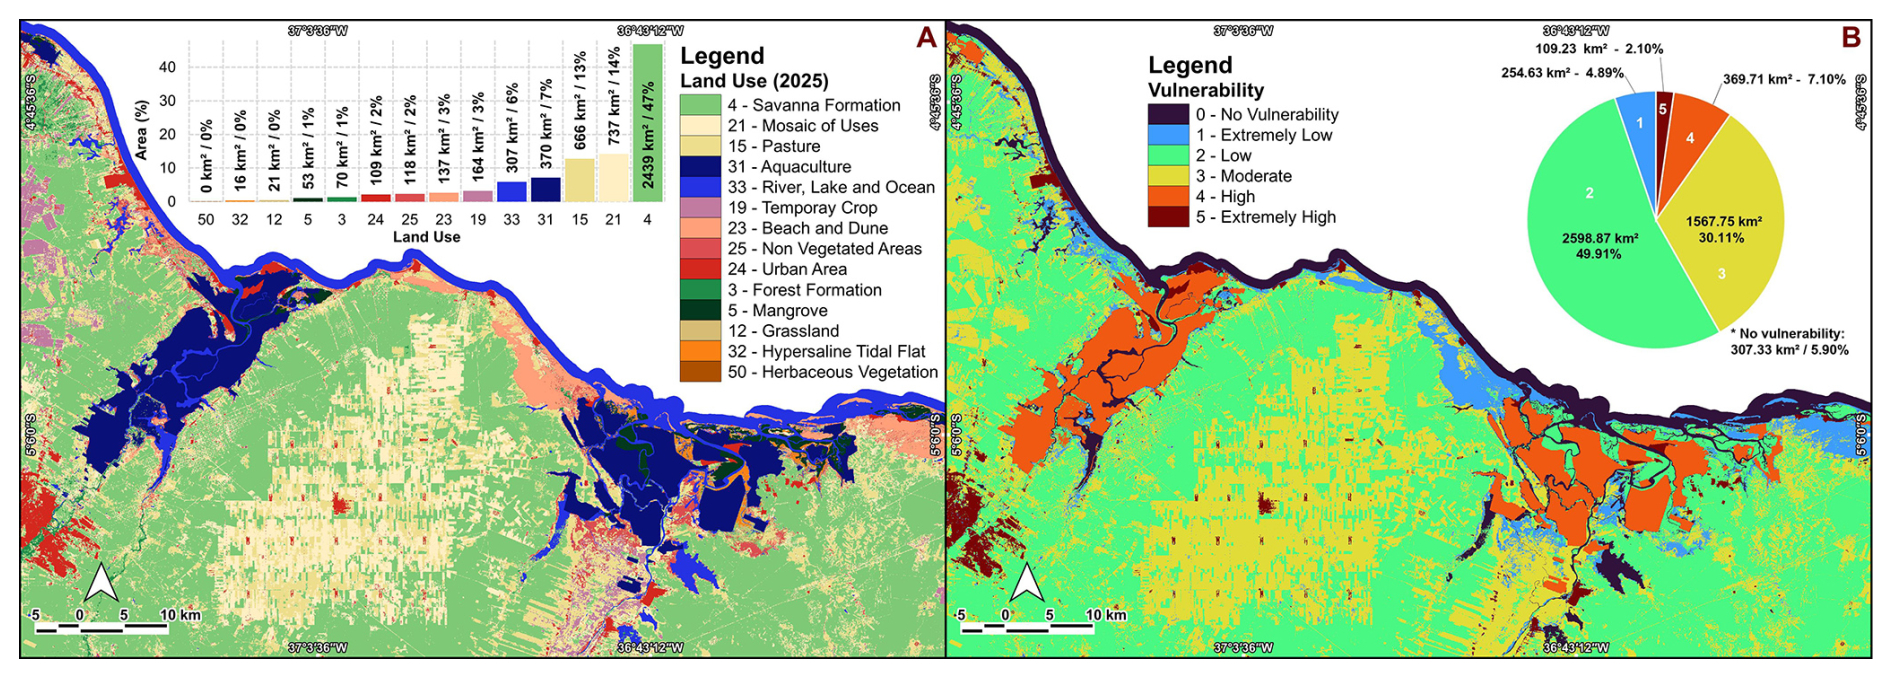
Figure 11Land use in the study area (A) and vulnerability classification (B). The graphs at the top show the percentages of the areas occupied by each class in ascending order. Map using data from Mabpiomas (2025).
With regard to vulnerability, the sectorization indicated 478.94 km2 classified as high and extremely high vulnerability, equivalent to 9.20 % of the area. In contrast, most of the territory (60.70 %) was classified as low to no vulnerability, revealing a strong spatial contrast between high-risk zones and more stable areas.
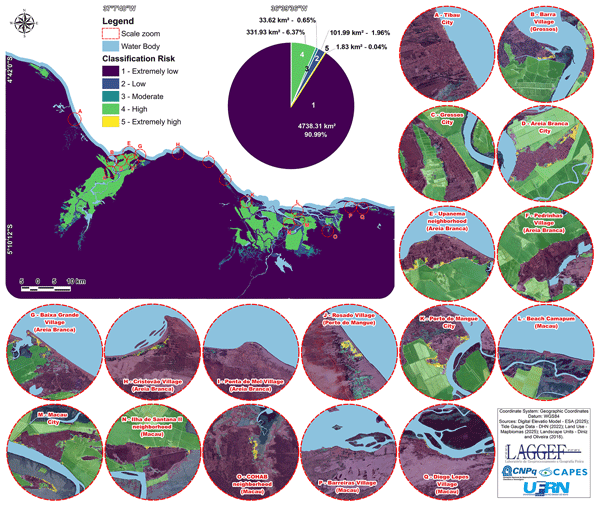
The combination of the results of the hazard and vulnerability mapping resulted in the final tidal flood risk map. The spatialized risk classes showed largely predictable patterns, considering the previous analyses. The high risk class stands out, corresponding to 6.37 % of the total area, while the extremely high risk category, although small (0.04 % overall), was concentrated in critical areas, especially in urban sectors of the cities of Porto do Mangue, Macau, Areia Branca, and Grossos, in addition to communities such as Ponta do Mel, Rosado, Diogo Lopes, and Upanema, with considerable percentages, especially the villages of Baixa Grande in Areia Branca, Ilha de Santana in Macau, and Barra in Grossos, which had percentages of affected urban areas close to 20 % (Table 6).
Table 6Risk percentages defined in cities and towns. The sections denoted by italics indicate the urban centers of cities.
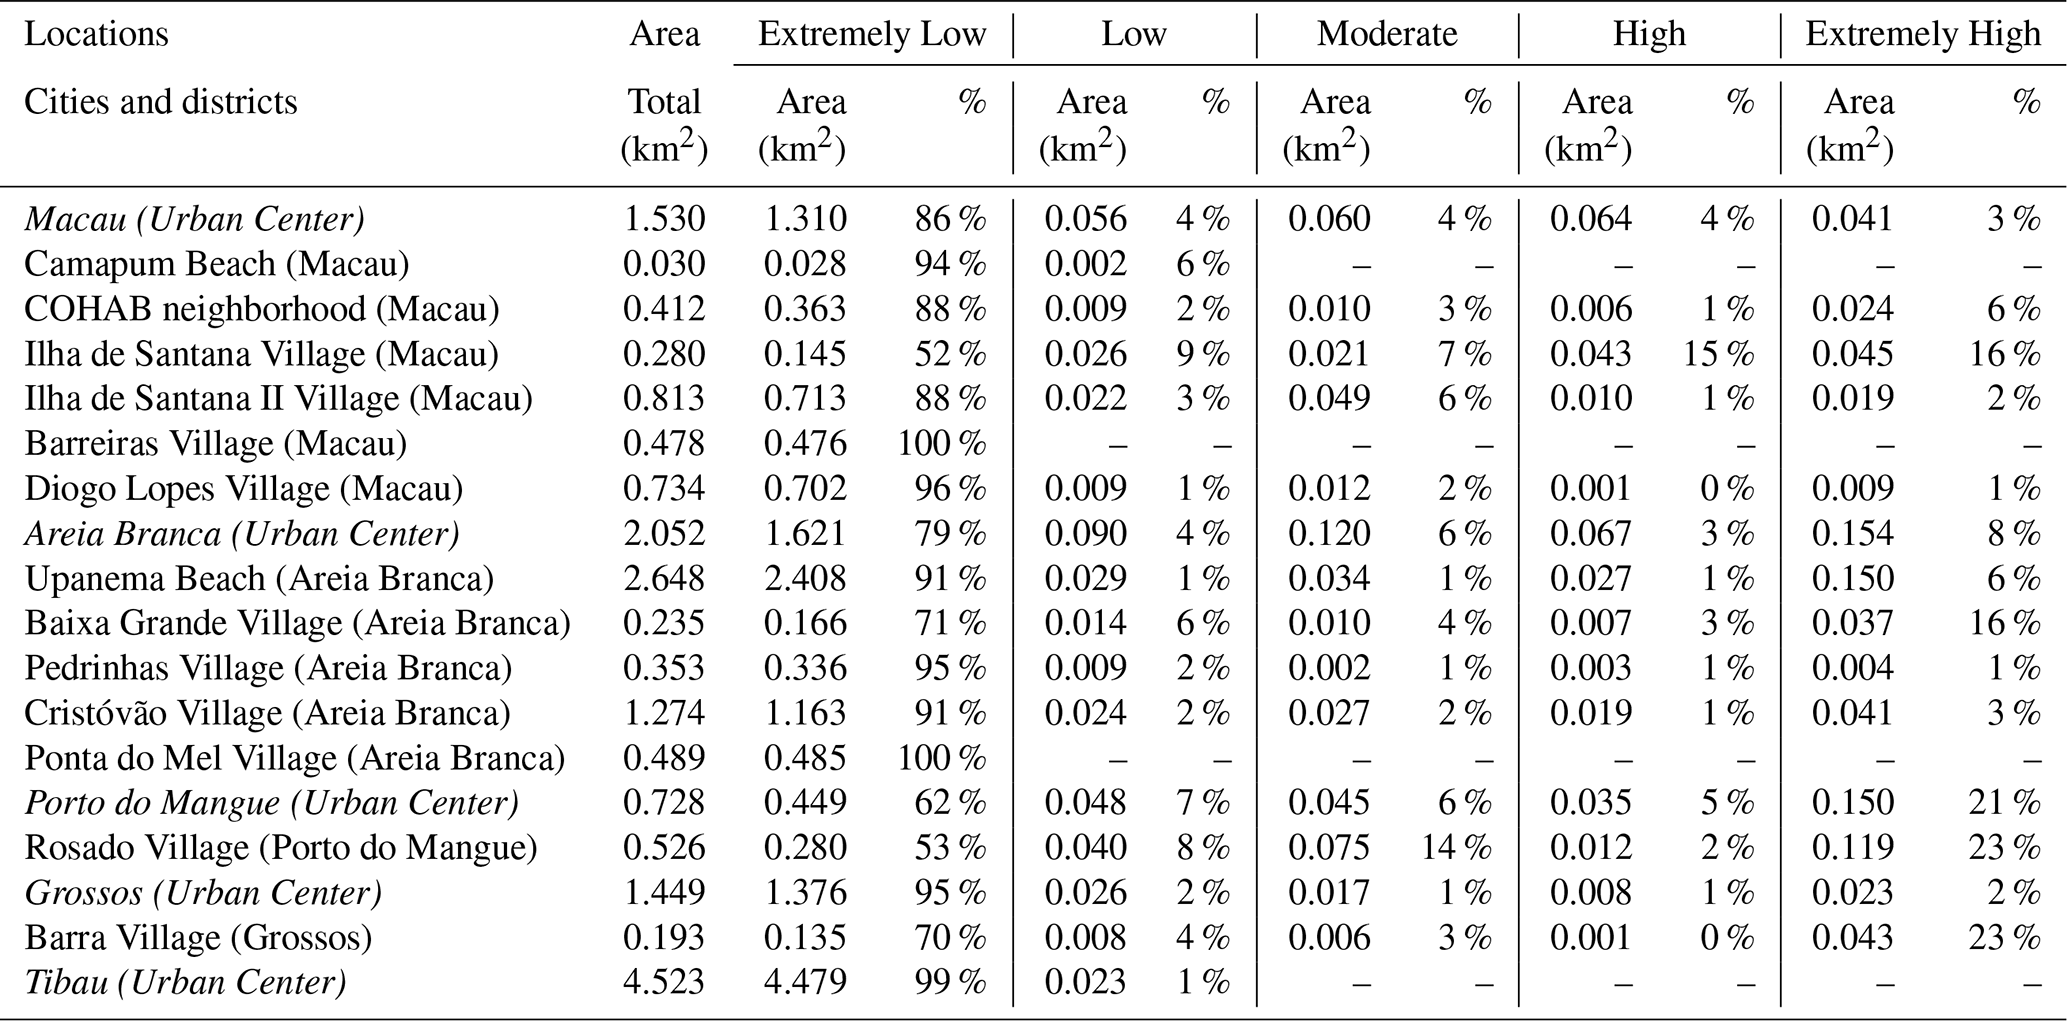
The spatial distribution of risk areas can be seen in Fig. 12, the areas of very high flooding closely resemble the findings of Boori et al. (2012) in Areia Branca. In addition, occurrences were identified in most of the villages, extending beyond urban limits and highlighting the vulnerability of coastal communities in the region. This pattern broadens the interpretation of the data beyond urban centers, reinforcing the diffuse nature of the risk associated with tidal flooding. These communities are mostly traditional fishing communities that play an important social and economic role in the region.
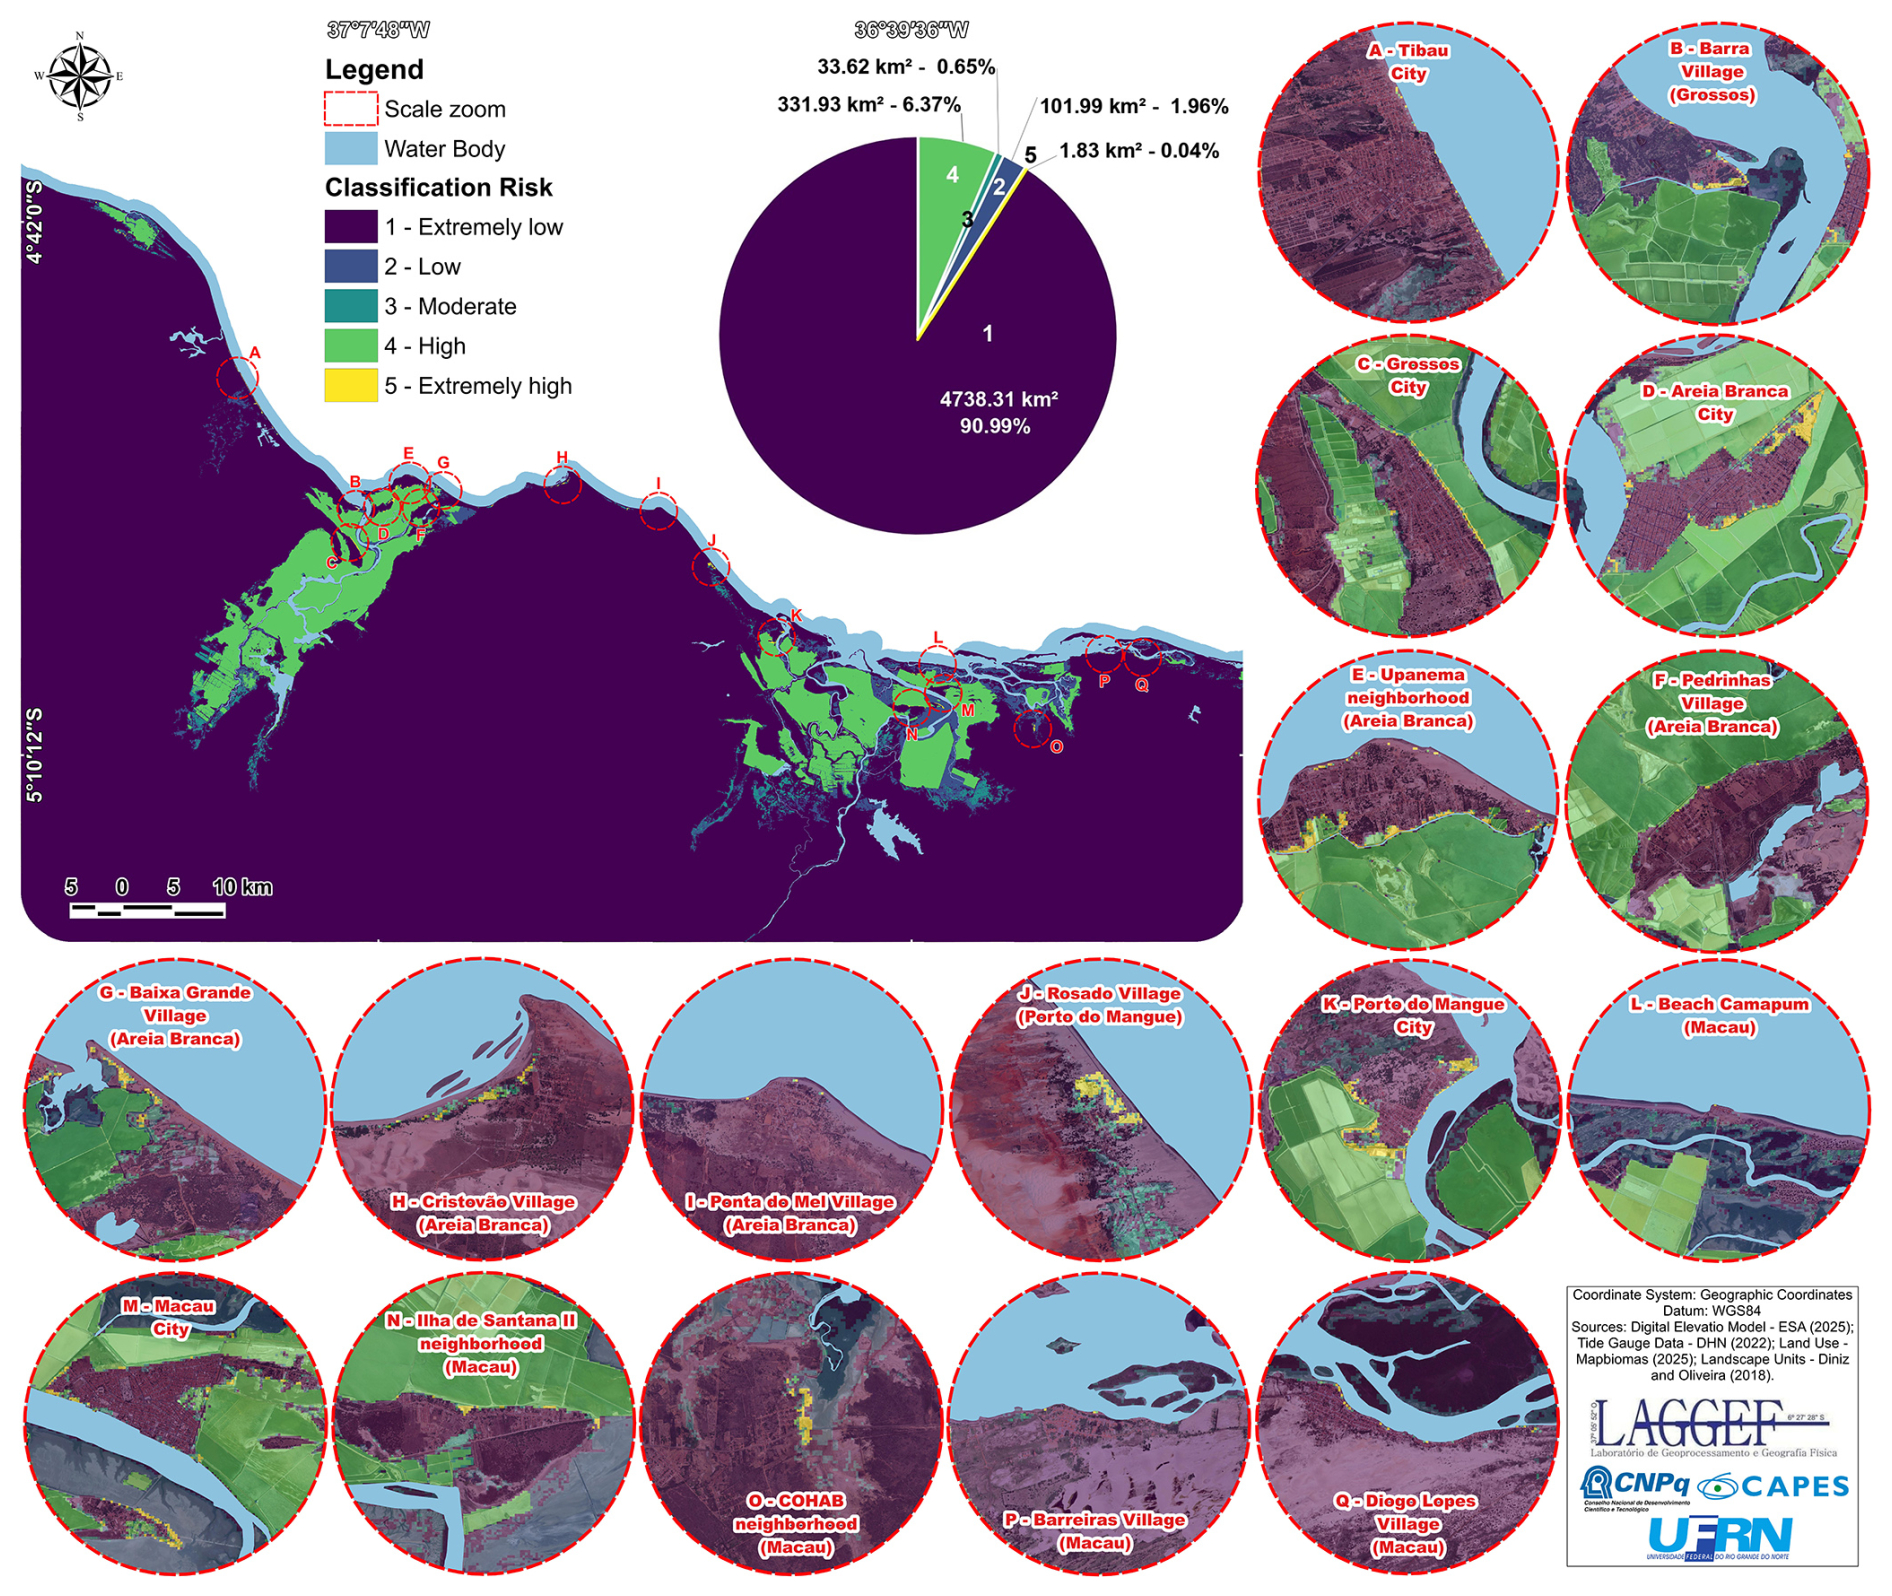
Figure 12Spatialization of quantified risks for the study area and surrounding area, on a general scale and in detail, for cities and villages. Map uses the base map data from Bing Maps (© Microsoft).
The results obtained allow for overlap with urban real estate data, aiming to observe what these extremely high-risk zones section and where they are located, given that although the locations are delimited, they do not always coincide with effectively occupied areas, including vacant land and public infrastructure.
By superimposing the risk map generated with municipal real estate databases, it was possible to identify residential areas and land that could potentially be affected, enabling estimates of potential financial and area damage (Fig. 13). Several areas can be seen overlapping the risk zone, but few have a high density of residences. In particular, the cities of Areia Branca, Porto do Mangue, and Macau had significant concentrations of residences that could be affected, as did the villages of Barra, Cristóvão, the COHAB neighborhood, and the village of Baixa Grande, with significant overlaps.
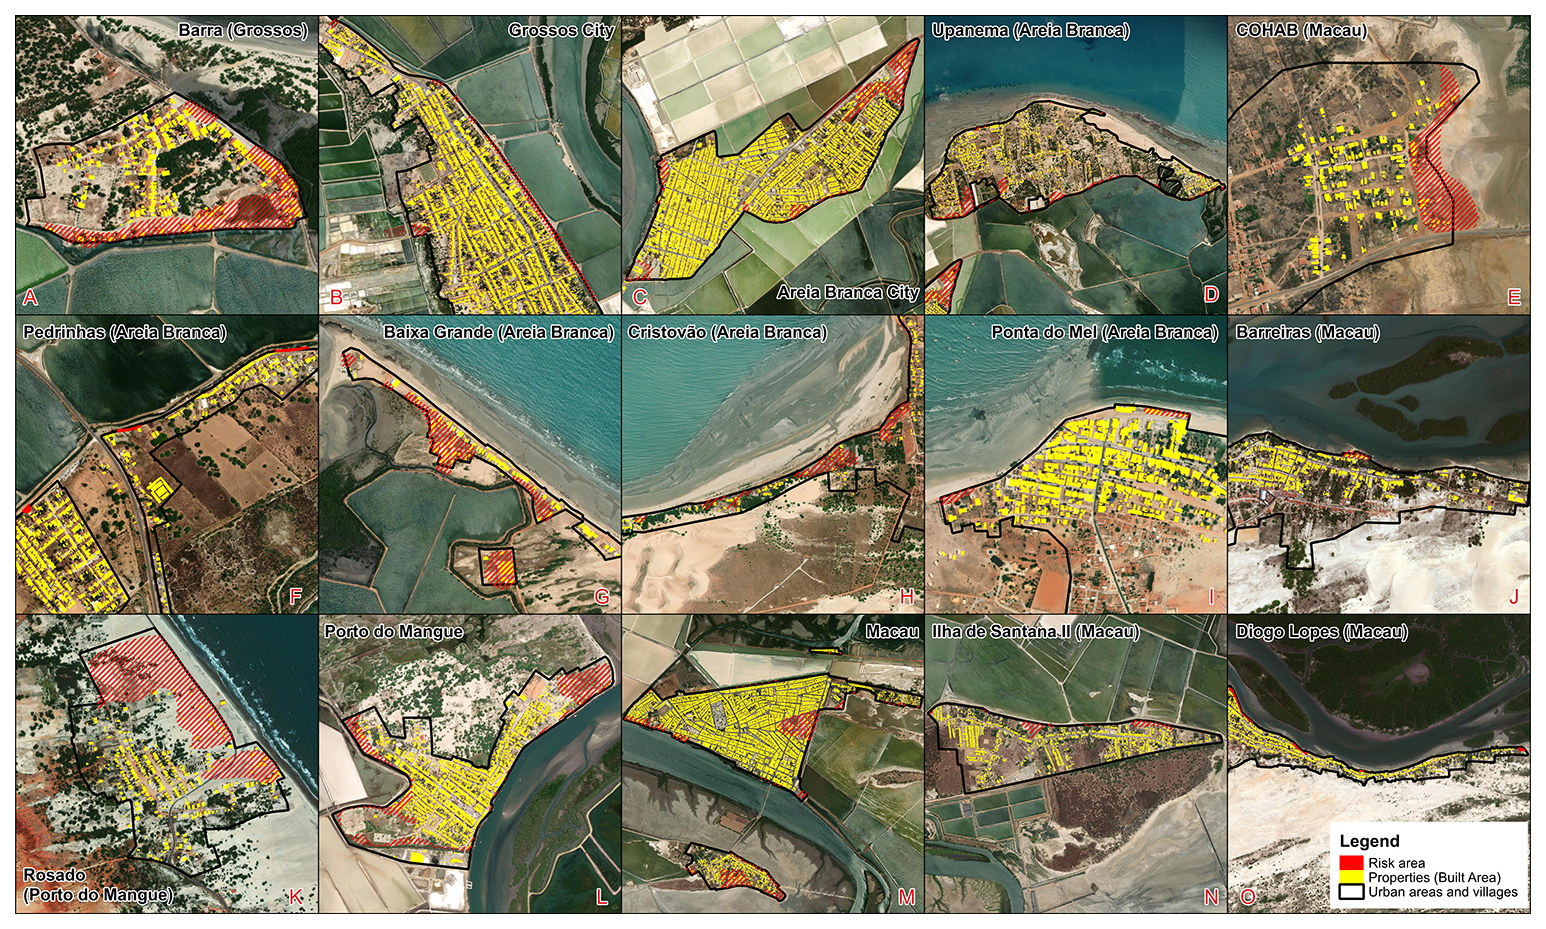
Figure 13Spatial distribution of risk areas and their relationship with residences in urban areas and villages. Map uses the base map data from Bing Maps (© Microsoft).
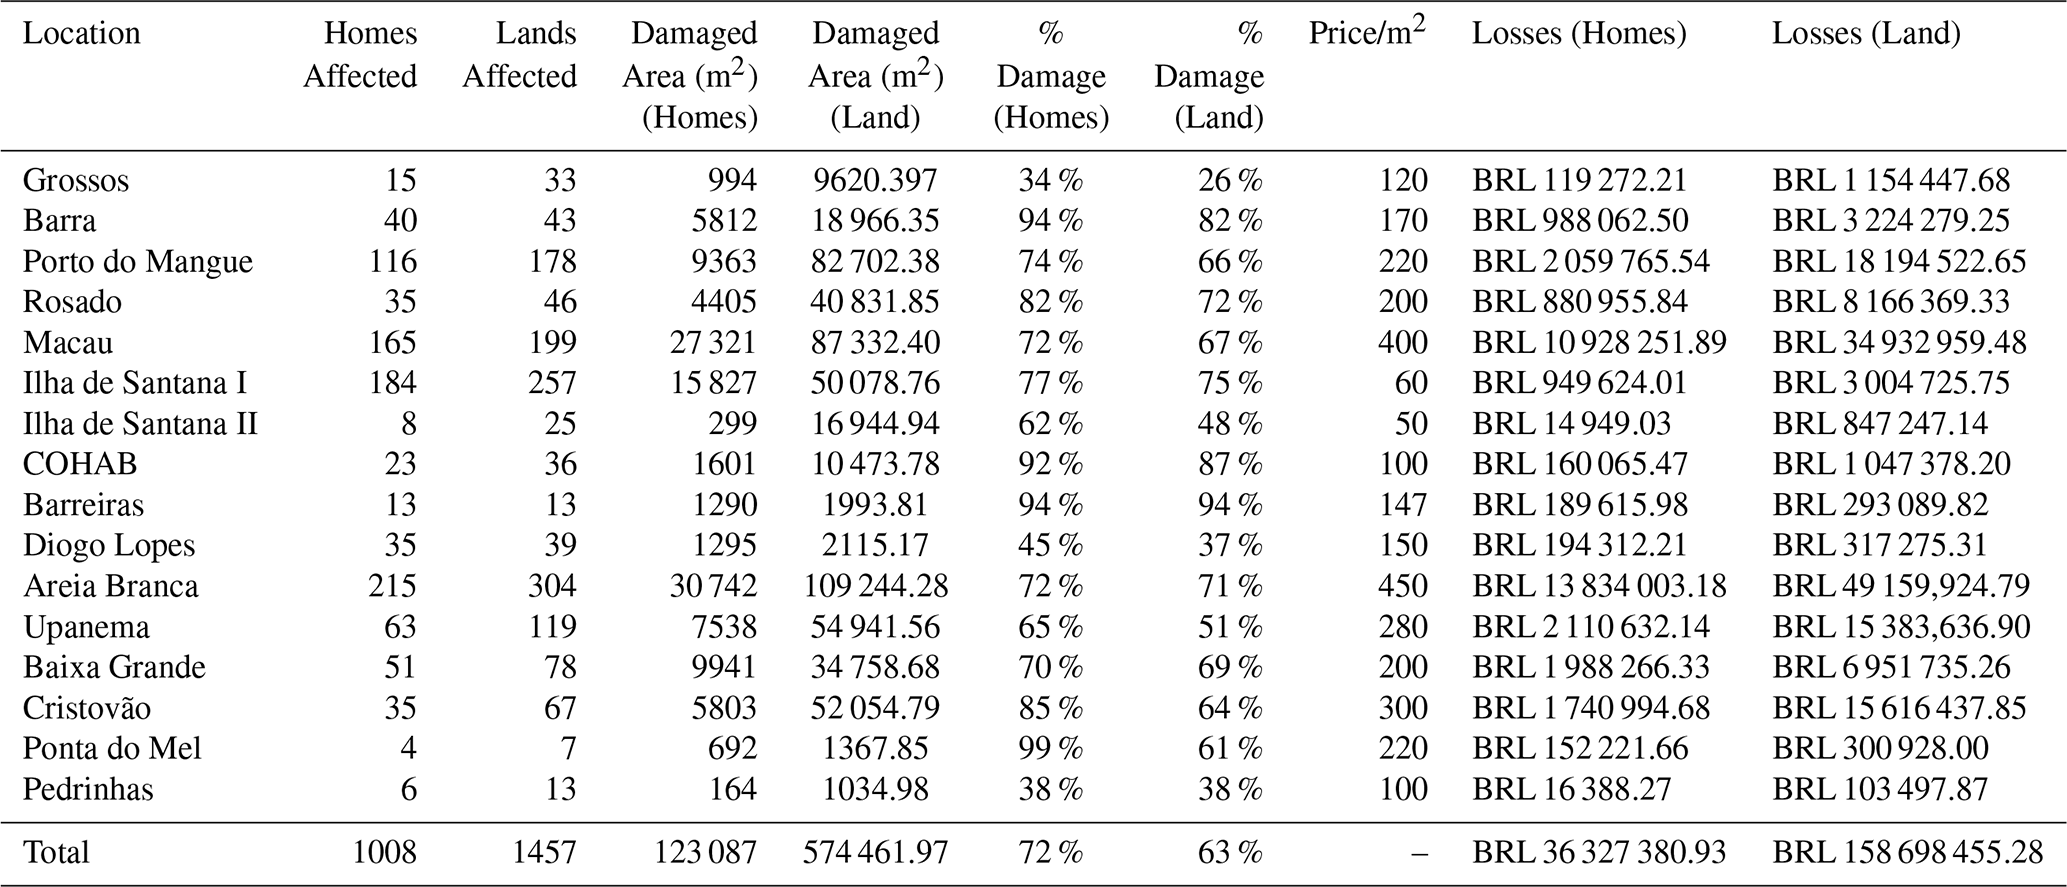
The potential flooding represents the loss of approximately 123 000 m2 of built area out of a total of 574 000 m2 (Table 6), which in practice means flooding with the potential for significant material losses, understood as concrete damage to built or unbuilt property. In terms of structural damage to homes, the quantification of damage was estimated at around BRL 36 million (Table 7), equivalent to USD 6 million, with general damage to land of approximately BRL 158 million, USD 29 million, representing a worrying threshold for small municipalities with low response capacity. The main highlight is Areia Branca, which concentrated the highest projected losses, with BRL 13 million in financial damage to built-up areas, as a result of its higher urban density in exposed areas.
The modeling carried out, in general, with the projection of future scenarios and the identification of financial damages, demonstrates the urgency of adaptive and mitigating measures, since even with impacts localized at the regional level, the outbreak of a potentially destructive event can seriously compromise the environmental and socioeconomic stability of coastal municipalities, directly affecting the quality of life of the population. The scale of the estimated damage makes it clear that addressing coastal climate risk requires prior planning and institutional mobilization, under penalty of irreversible losses.
Table 7Quantification of Affected Areas, Percentage of Damage, and Economic Losses (Homes and Land) by Location. For the villages of Rosado, Barra, Ponta do Mel, Pedrinhas, and the COHAB neighborhood, estimates were made by interpolation because they had few or no data samples.
The analyses showed that tidal flooding risks are mainly concentrated in the urban areas of Areia Branca, Macau, and Porto do Mangue, with field validations of sections that are already susceptible under the current regime. The integrated damage estimate pointed to significant structural losses, reaching approximately BRL 36 million in buildings and BRL 158 million in land. In addition, a potential flooding event would directly compromise the salt production activity strategically concentrated in the rural area and main economic base of these municipalities, which would potentially amplify the impacts. Areia Branca stands out as the municipality most affected in terms of built-up areas. These figures confirm the hypothesis that, even in conservative scenarios, the financial and social impacts tend to be significant and spatially concentrated.
The combination of low topography and recurring maximum astronomical levels reinforced critical flooding patterns. In severe scenarios, there was an increase in the frequency of flooded days in already occupied areas, as well as an increase in maximum levels, which increased urban exposure. Interannual and decadal processes add variability, and the coincidence of astronomical and meteorological extremes, although rare, can potentiate critical events. This reading reinforces the notion that coastal risks in the Semi-Arid Coast are not limited to the trend of sea level rise, but result from a combination of multiple hydrodynamic factors.
The results obtained corroborate previous mappings in the region: in Areia Branca, areas coinciding with those of Aguiar et al. (2019) were identified; in Macau, patterns similar to those of Araújo et al. (2021) were found, albeit with different magnitudes; in Tibau, low exposure was comparable to that of Rabelo et al. (2023); and in Grossos, less intense but spatially consistent projections confirm the findings of Silva et al. (2024). This bibliographic convergence indicates the spatial robustness of the method and strengthens its regional applicability. The difference here lies in integrating physical risk with localized economic losses, offering a useful comparative framework for decision-making, using tools and techniques with very low aggregate costs.
The recurrence of flooding in the region reinforces the natural susceptibility of the cities studied, many of which are located in low-lying areas on estuarine islands. These naturally flood-prone areas have already suffered significant impacts in the past, as in the case of Macau, whose current urban center is the result of relocation after its old center was submerged, swallowed by the tides in the 19th century (Araújo, 2020; IBGE, 2025). This history shows that floods are not unprecedented phenomena, but rather recurring events, and that their effects will be exacerbated by projected MSLR scenarios. In the short term, strict control of saltpan dikes tends to mitigate more frequent flooding, but remains limited in the face of extreme events, which, according to projections, will tend to become more recurrent, posing new challenges for urban adaptation and territorial management.
From a conceptual point of view, the findings reinforce probabilistic approaches to coastal risk that weigh frequency and maximum events within a validated geodetic framework. Risk maps and their readings are tools for territorial screening and strategic mobilization, supporting priority measures such as coastal protection and management, land use guidelines in low-lying areas, and urban contingency plans. Although limited by 30 m resolution and vertical uncertainties, the products are methodologically consistent and practical, fulfilling their role as a starting point for public policy.
It should be noted, however, that the results should be interpreted as a reference for regional hydrodynamic trends, not as exact representations of reality, even though some results have successfully represented actual processes. Interpretations should be considered with caution, especially due to the limitations imposed by the 30-meter spatial resolution of the DEM, the inherent simplification of the model used, which does not consider lateral processes and tidal damping, and the interpolation of real estate data in settlements with an incipient market, facts that naturally impose considerable margins of error. Nevertheless, by demonstrating that open data allows for consistent and auditable analyses, with real-world validations in the field, the study advances the central hypothesis that it is possible to project regional MSLR scenarios and identify endemic risk areas with strong applied value.
Looking ahead, it is recommended that new models be constructed for the area at the local level, using DEMs with greater accuracy and resolution to capture microtopography, complete real estate databases, and periodic field campaigns to refine hotspots. It would also be very valuable to adopt a methodology that incorporates the combined effect, covering not only coastal flooding (by tides) but also its interaction with river flooding events from the two main rivers in the study area.
Explicit trends for advancing research in the region should move toward integrating more sophisticated dynamic modeling with updated socioeconomic data, allowing for a better understanding of the interaction between hydrodynamic processes and social vulnerabilities. Overall, the advances made in this study point to an alarming scenario: all the municipalities analyzed are vulnerable to climate change and at high or extremely high risk of flooding, which contrasts with their low financial capacity to address the risks associated with MSLR, reinforcing the urgency of climate adaptation plans to protect coastal communities and their critical infrastructure.
The cities in the region were historically built on slightly higher ground, serving as a real front line against imminent flooding. However, part of their urban areas and land remains in extremely high-risk zones, as do the solar salt flats, the main local economic activity. This is one of the lowest-lying coasts on the planet, where salt pan dikes could play a strategic role in containing flooding events in the near future. However, this planning needs to be refined through coordination between public authorities and the salt industry in order to ensure greater territorial and economic resilience.
In summary, the main findings indicate a concentration of coastal risk in low-lying urban areas and salt flats, with occasional validation in the field, and significant potential economic losses across the region, particularly in Areia Branca. The probabilistic approach adopted, anchored in the geodetic plane and free data, provides a comparable and actionable regional framework for adaptive planning, even recognizing the vertical uncertainty and hydrodynamic simplification of the model.
Thus, the data and insights obtained by the study suggest that adaptation policies focused on land use planning and response plans in already susceptible sectors can reduce future losses and, to a certain extent, facilitate climate change mitigation.
The methodology has proven to be effective and easy to replicate, allowing for dynamic risk and loss assessment at low cost, provided that there is skilled labor available for the operation. It is especially useful in regions where climate change mitigation strategies are lacking, offering quick and consistent support for mobilizing coastal adaptation policies.
Regarding the prospects for this work, it is important to mention that, in order to make progress, it is crucial to conduct new studies to develop robust models; invest in real-time tide gauge data collection systems and systematic geodetic validations in the field, keeping in mind the logic of iteration: models generate hypotheses; the field confirms/adjusts them, and new rounds refine the risk on a fine scale. These processes contribute to the generation of increasingly accurate data, which is extremely useful for mitigating and adapting to the impacts of climate change.
All data used in this study are publicly available and can be accessed free of charge from the repositories and sources cited in the References.
TCLS and MTMD designed the study. TCLS, JPdS, and PVdNA acquired the geodetic data. TCLS processed the data. MTMD and PVdNA performed the final data verification. BF and JYGdS made the final adjustments to the study. All authors reviewed this article.
The contact author has declared that none of the authors has any competing interests.
Publisher's note: Copernicus Publications remains neutral with regard to jurisdictional claims made in the text, published maps, institutional affiliations, or any other geographical representation in this paper. The authors bear the ultimate responsibility for providing appropriate place names. Views expressed in the text are those of the authors and do not necessarily reflect the views of the publisher.
The authors would like to thank the Coordenação de Aperfeiçoamento de Pessoal de Nível Superior – Brasil (CAPES) and the National Council for Scientific and Technological Development (CNPq) for its financial support. The authors would also like to thank the Graduate Program in Geography at the Federal University of Rio Grande do Norte (UFRN) for its organizational support, which provided essential academic and institutional support for the completion of this study.
This research has been supported by the Conselho Nacional de Desenvolvimento Científico e Tecnológico (grant-no.: 406539/2022-7) and the Coordenação de Aperfeiçoamento de Pessoal de Nível Superior (grant-no.: 001).
This paper was edited by Liang Gao and reviewed by two anonymous referees.
Aguiar, L. S., Amaro, V. E., Araújo, P. V. N., and Santos, A. L. S.: Low cost geotechnology applied to flood risk assessment in coastal urban areas in climate change scenarios, Anuário Inst. Geociênc., 42, 267–290, https://doi.org/10.11137/2019_1_267_290, 2019.
Almaliki, A. H., Zerouali, B., Santos, C. A. G., Almaliki, A. A., Silva, R. M. d., Ghoneim, S. S. M., and Ali, E.: Assessing coastal vulnerability and land use to sea level rise in Jeddah province, Kingdom of Saudi Arabia, Heliyon, 9, e18508, https://doi.org/10.1016/j.heliyon.2023.e18508, 2023.
Anderson, T. R., Fletcher, C. H., Barbee, M. M., Romine, B. M., Lemmo, S., and Delevaux, J. M. S.: Modeling multiple sea level rise stresses reveals up to twice the land at risk compared to strictly passive flooding methods, Sci. Rep., 8, 1, https://doi.org/10.1038/s41598-018-32658-x, 2018.
Araújo, P. V. N.: Geotecnologias de alta precisão no mapeamento de georisco a inundações frente às mudanças climáticas, PhD thesis, Universidade Federal do Rio Grande do Norte, Natal, 157 pp., https://repositorio.ufrn.br/jspui/handle/123456789/29012 (last access: 10 August 2026). 2020.
Araújo, P. V. N., Amaro, V. E., Alcoforado, A. V. C., and Santos, A. L. S.: Vertical accuracy and calibration of digital elevation models (DEMs) for the Piranhas-Assu River Basin, Rio Grande do Norte, Anuário Inst. Geociênc., 41, 351–364, https://doi.org/10.11137/2018_1_351_364, 2019.
Araújo, P. V. N., Amaro, V. E., Aguiar, L. S., Lima, C. C., and Lopes, A. B.: Tidal flood area mapping in the face of climate change scenarios: case study in a tropical estuary in the Brazilian semi-arid region, Nat. Hazards Earth Syst. Sci., 21, 3353–3366, https://doi.org/10.5194/nhess-21-3353-2021, 2021.
Arnell, N. W., Lowe, J. A., Bernie, D., Nicholls, R. J., Brown, S., Challinor, A. J., and Osborn, T. J.: The global and regional impacts of climate change under representative concentration pathway forcings and shared socioeconomic pathway scenarios, Environ. Res. Lett., 14, 084046, https://doi.org/10.1088/1748-9326/ab35a6, 2019.
Barbosa, M. A., Boski, T., Bezerra, F. H. R., Lima-Filho, F. P., Gomes, M. P., Pereira, L., and Maia, R. P.: Late Quaternary infilling of the Assu River embayment and related sea level changes in NE Brazil, Mar. Geol., 405, 23–37, https://doi.org/10.1016/j.margeo.2018.07.014, 2018.
Becker, M., Karpytchev, M., and Hu, A.: Increased exposure of coastal cities to sea-level rise due to internal climate variability, Nat. Clim. Change, https://doi.org/10.1038/s41558-023-01603-w, 2023.
Blaikie, P., Cannon, T., Davis, I., and Wisner, B.: At risk: natural hazards, people's vulnerability and disasters, Routledge, London, ISBN: 9780415252164, 1994.
Boehnke, R. F., Hoppe, T., Brezet, H., and Blok, K.: Good practices in local climate mitigation action by small and medium-sized cities; exploring meaning, implementation and linkage to actual lowering of carbon emissions in thirteen municipalities in The Netherlands, J. Clean. Prod., 207, 630–644, https://doi.org/10.1016/j.jclepro.2018.09.264, 2019.
Boori, M. S., Amaro, V. E., and Targino, A.: Coastal risk assessment and adaptation of the impact of sea-level rise, climate change and hazards: a RS and GIS based approach in Apodi-Mossoró estuary, Northeast Brazil, Int. J. Geomatics Geosci., 2, 815–832, https://www.academia.edu/download/48334525/Coastal_risk_assessment_and_adaptation_o20160826-2730-1d66a7o.pdf (last access: 15 September 2025), 2012.
Bricongne, J.-C., Meunier, B., and Pouget, S.: Web-scraping housing prices in real-time: the Covid-19 crisis in the UK, J. Hous. Econ., 59, 101906, https://doi.org/10.1016/j.jhe.2022.101906, 2022.
Busman, D. V., Amaro, V. E., and Souza-Filho, P. W. M.: Análise estatística multivariada de métodos de vulnerabilidade física em zonas costeiras tropicais, Rev. Bras. Geomorfol., 17, 499–516, https://doi.org/10.20502/rbg.v17i3.912, 2016.
Cabana, D., Rölfer, L., Evadzi, P., and Celliers, L.: Enabling climate change adaptation in coastal systems: a systematic literature review, Earth's Future, 11, https://doi.org/10.1029/2023ef003713, 2023.
Copernicus Climate Change Service (C3S): Global Ocean Gridded L 4 Sea Surface Heights And Derived Variables Reprocessed Copernicus Climate Service, SEALEVEL_GLO_PHY_CLIMATE_L4_MY_008_057, Copernicus Climate Change Service (C3S) [data set], https://doi.org/10.48670/moi-00145, 2025.
Croteau, R., Pacheco, A., and Ferreira, Ó.: Flood vulnerability under sea level rise for a coastal community located in a backbarrier environment, Portugal, J. Coast. Conserv., 27, 4, https://doi.org/10.1007/s11852-023-00955-x, 2023.
Darsan, J., Asmath, H., and Jehu, A.: Flood-risk mapping for storm surge and tsunami at Cocos Bay (Manzanilla), Trinidad, J. Coast. Conserv., 17, 679–689, https://doi.org/10.1007/s11852-013-0276-x, 2013.
da Silva, F. E. B., Chagas, M. D. d., Diniz, M. T. M., and Pereira, P.: Coastal geoheritage and sustainability: a study in the low coast of Costa Branca, Rio Grande do Norte, Brazil, Sustainability, 17, 6709, https://doi.org/10.3390/su17156709, 2025.
DHN (Directorate of Hydrography and Navigation): Tidal Predictions, Brazilian Navy, https://www.marinha.mil.br/dhn/node/29 (last access: 10 August 2026), 2025.
Diniz, M. T. M., Vasconcelos, F. P., and Martins, M. B.: Technological innovation in Brazilian sea salt production and the resulting socio-territorial changes: an analysis from the perspective of Schumpeter's theory of entrepreneurship, Soc. Nat., 27, 421–437, https://doi.org/10.1590/1982-451320150305, 2015.
Diniz, M. T. M. and Vasconcelos, F. P.: Natural conditions for the sea salt production in Brazil, Mercator (Fortaleza), 16, https://doi.org/10.4215/rm2017.e1613b, 2017.
Diniz, M. T. M. and Oliveira, G. P. de: Proposal for meso-scale compartmentalization of the Northeastern Brazilian coast, Rev. Bras. Geomorfol., 17, https://doi.org/10.20502/rbg.v17i3.844, 2016.
Dwrakisha, G. S., Vinaya, S. A., Natesan, U., Asano, T., Kakinuma, T., Venkataramana, K., Pai, B. J., and Babita, M. K.: Coastal vulnerability assessment of the future sea level rise in Udupi coastal zone of Karnataka state, west coast of India, Ocean Coast. Manage., 52, 467–478, https://doi.org/10.1016/j.ocecoaman.2009.07.007, 2009.
Ekeu-wei, I. T. and Blackburn, G. A.: Applications of open-access remotely sensed data for flood modelling and mapping in developing regions, Hydrology, 5, 39, https://doi.org/10.3390/hydrology5030039, 2018.
European Space Agency (ESA): Copernicus DEM GLO-30: global digital elevation model at 30-meter resolution, Copernicus Open Access Hub, https://scihub.copernicus.eu/ (last access: 15 September 2025), 2021.
Fila, D., Fünfgeld, H., and Dahlmann, H.: Climate change adaptation with limited resources: adaptive capacity and action in small- and medium-sized municipalities, Environ. Dev. Sustain., https://doi.org/10.1007/s10668-023-02999-3, 2023.
Frota, F. F., Truccolo, E. C., and Schettini, C. A. F.: Tidal and sub-tidal sea level variability at the northern shelf of the Brazilian Northeast region, An. Acad. Bras. Ciênc., 88, 1371–1386, https://doi.org/10.1590/0001-3765201620150162, 2016.
Gesch, D. B.: Best practices for elevation-based assessments of sea-level rise and coastal flooding exposure, Front. Earth Sci., 6, https://doi.org/10.3389/feart.2018.00230, 2018.
GPGL (Geoprocessing and Physical Geography Laboratory, Federal University of Rio Grande do Norte (UFRN)): Urban cadastral vector dataset derived from UAV orthomosaics for the northern coast of Rio Grande do Norte, Brazil (scale 1:500), institutional technical archive, unpublished dataset, 2025.
González-Trujillo, J. D., Román-Cuesta, R. M., Muñiz-Castillo, A. I., Amaral, C. H., and Araújo, M. B.: Multiple dimensions of extreme climate events and their impacts on biodiversity, Clim. Change, 176, 155, https://doi.org/10.1007/s10584-023-03622-0, 2023.
Harten, J. G., Kim, A. M., and Brazier, J. C.: Real and fake data in Shanghai's informal rental housing market: ground-truthing data scraped from the internet, Urban Stud., https://doi.org/10.1177/0042098020918196, 2020.
Hinkel, J., Aerts, J. C. J. H., Brown, S., Jiménez, J. A., Lincke, D., Nicholls, R. J., Scussolini, P., Sanchez-Arcilla, A., Vafeidis, A., and Addo, K. A.: The ability of societies to adapt to twenty-first-century sea-level rise, Nat. Clim. Change, 8, 570–578, https://doi.org/10.1038/s41558-018-0176-z, 2018.
Huang, T. and Merwade, V.: Uncertainty analysis and quantification in flood insurance rate maps using Bayesian model averaging and hierarchical BMA, J. Hydrol. Eng., 28, https://doi.org/10.1061/jhyeff.heeng-5851, 2022.
IBGE: Monitoramento da variação do nível médio do mar nas estações da Rede Maregráfica Permanente para Geodésia: 2001–2020, Coordenação de Geodésia, Rio de Janeiro, https://biblioteca.ibge.gov.br/visualizacao/livros/liv101890.pdf (last access: 15 September 2025), 2021.
IBGE (Brazilian Institute of Geography and Statistics): Brazil Municipal Boundary Mesh 2023 (shapefile), Directorate of Geosciences, Rio de Janeiro, Brazil, https://geoftp.ibge.gov.br/organizacao_do_territorio/malhas_territoriais/malhas_municipais/municipio_2023/Brasil/ (last access: 10 August 2026), 2023.
IBGE: História de Macau – Rio Grande do Norte (RN), https://cidades.ibge.gov.br/brasil/rn/macau/historico (last access: 1 April 2008), 2025.
IBGE – Banco de Dados Geodésicos (BDG): http://www.bdg.ibge.gov.br/appbdg/ (last access: 15 September 2025), 2025.
IPCC: Climate change 2022: impacts, adaptation and vulnerability, Contribution of Working Group II to the Sixth Assessment Report of the Intergovernmental Panel on Climate Change, edited by: Pörtner, H.-O., Roberts, D. C., Tignor, M., Poloczanska, E. S., Mintenbeck, K., Alegría, A., Craig, M., Langsdorf, S., Löschke, S., Möller, V., Okem, A., and Rama, B., Cambridge Univ. Press, https://doi.org/10.1017/9781009325844, 2022.
Jach, T.: Web scraping methods used in predicting real estate prices, Comm. Com. Inf. Sc., 375–387, https://doi.org/10.1007/978-3-030-88113-9_30, 2021.
Juhász, L., Xu, J., and Parkinson, R. W.: Beyond the tide: a comprehensive guide to sea-level-rise inundation mapping using FOSS4G, Geomatics, 3, 522–540, https://doi.org/10.3390/geomatics3040028, 2023.
Kaden, U. S.: Floodplain-Inundation-Calculator plugin for QGIS 3, version 0.1, GitHub repository, https://doi.org/10.5281/zenodo.6375580, 2022.
Kasmalkar, I., Wagenaar, D., Bill-Weilandt, A., Choong, J., Manimaran, S., Lim, T. N., Rabonza, M., Lallemant, D.: Flow-tub model: a modified bathtub flood model with hydraulic connectivity and path-based attenuation, MethodsX, 12, 102524, https://doi.org/10.1016/j.mex.2023.102524, 2024.
Kelly, B. and Lucio, P. S.: Characterization of risk/exposure to climate extremes for the Brazilian Northeast – case study: Rio Grande do Norte, Theor. Appl. Climatol., 122, 59–67, https://doi.org/10.1007/s00704-014-1275-z, 2014.
Kendall, M. G.: Rank correlation methods, 4th edn., Charles Griffin, London, ISBN: 978-0-85264-199-6, 1975.
Kron, W.: Flood risk = hazard ⋅ values ⋅ vulnerability, Water Int., 30, 58–68, https://doi.org/10.1080/02508060508691837, 2005.
Le Cozannet, G., Garcin, M., Yates, M., Idier, D., and Meyssignac, B.: Approaches to evaluate the recent impacts of sea-level rise on shoreline changes, Earth-Sci. Rev., 138, 47–60, https://doi.org/10.1016/j.earscirev.2014.08.005, 2014.
Lima, L. T., Fernández-Fernández, S., Weiss, C. V. C., Bitencourt, V., and Bernardes, C.: Free and open-source software for geographic information system on coastal management: a study case of sea-level rise in southern Brazil, Reg. Stud. Mar. Sci., 48, 102025, https://doi.org/10.1016/j.rsma.2021.102025, 2021.
López-Dóriga, U. and Jiménez, J. A.: Impact of relative sea-level rise on low-lying coastal areas of Catalonia, NW Mediterranean, Spain, Water, 12, 3252, https://doi.org/10.3390/w12113252, 2020.
Macedo, Y. M., Felipe, Marinho, A. O., and Victor, P. V. N.: Socio-environmental vulnerability in coastal areas: a case study in the municipality of Macau-RN, Brazil, Rev. Geociênc. Nordeste, 11, 708–721, https://doi.org/10.21680/2447-3359.2025v11n1id38277, 2025.
Mann, H. B.: Nonparametric tests against trend, Econometrica, 13, 245–259, https://doi.org/10.2307/1907187, 1945.
MapBiomas: Coleção 9 da série anual de mapas de cobertura e uso da terra do Brasil, https://brasil.mapbiomas.org/colecoes-mapbiomas/ (last access: 31 July 2025), 2025.
Marfai, M. A. and King, L.: Potential vulnerability implications of coastal inundation due to sea level rise for the coastal zone of Semarang city, Indonesia, Environ. Geol., 54, 1235–1245, https://doi.org/10.1007/s00254-007-0906-4, 2007.
McGranahan, G., Balk, D., and Anderson, B.: The rising tide: assessing the risks of climate change and human settlements in low elevation coastal zones, Environ. Urban., 19, 17–37, https://doi.org/10.1177/0956247807076960, 2007.
Medeiros, F. J., Gomes, R. dos S., Coutinho, M. D. L., and Lima, K. C.: Meteorological droughts and water resources: historical and future perspectives for Rio Grande do Norte state, Northeast Brazil, Int. J. Climatol., https://doi.org/10.1002/joc.7624, 2022.
Melo Filho, E.: Meteorological tide at the Brazilian coast, Full Professor thesis, Federal University of Rio Grande, https://sistemas.furg.br/sistemas/sab/arquivos/conteudo_digital/000008808.pdf (last access: 15 September 2025), 2017.
Morlet, J., Arens, G., Fourgeau, E., and Giard, D.: Wave propagation and sampling theory – Part I: complex signal and scattering in multilayered media, Geophysics, 47, 203–221, https://doi.org/10.1190/1.1441328, 1982.
Moser, S. C., Ekstrom, J. A., Kim, J., and Heitsch, S.: Adaptation finance archetypes: local governments' persistent challenges of funding adaptation to climate change and ways to overcome them, Ecol. Soc., 24, 28, https://doi.org/10.5751/ES-10980-240228, 2019.
Mossoró Hoje: Dique de salina se rompe e alaga casas na cidade de Grossos (RN), http://mossorohoje.com.br/noticias/49703-dique-de-salina-se-rompe-e-alaga-casas-na-cidade-de-grossos-rn (last access: 29 April 2026), 2024.
Muench, R., Cherrington, E., Griffin, R., and Mamane, B.: Assessment of open access global elevation model errors impact on flood extents in southern Niger, Front. Environ. Sci., 10, https://doi.org/10.3389/fenvs.2022.880840, 2022.
Nagy, G. J., Gutiérrez, O., Brugnoli, E., Verocai, J. E., Gómez-Erache, M., Villamizar, A., Olivares, I., Azeiteiro, U. M., Leal Filho, W., and Amaro, N.: Climate vulnerability, impacts and adaptation in Central and South America coastal areas, Reg. Stud. Mar. Sci., 29, 100683, https://doi.org/10.1016/j.rsma.2019.100683, 2019.
Nicholls, R. J., Wong, P. P., Burkett, V. R., Codignotto, J., Hay, J., McLean, R., Ragoonaden, S., and Woodroffe, C. D.: Coastal systems and low-lying areas, in: Climate Change 2007: Impacts, Adaptation and Vulnerability, Contribution of Working Group II to the Fourth Assessment Report of the IPCC, edited by: Parry, M. L., Canziani, O. F., Palutikof, J. P., van der Linden, P. J., and Hanson, C. E., Cambridge Univ. Press, Cambridge, 315–356, https://www.ipcc.ch/site/assets/uploads/2018/02/ar4-wg2-chapter6-1.pdf (last access: 15 September 2025), 2007.
Nicholls, R. J. and Cazenave, A.: Sea-level rise and its impact on coastal zones, Science, 328, 1517–1520, https://doi.org/10.1126/science.1185782, 2010.
Olczak, B. and Hanzl, M.: Adaptation to climate change – a challenge for small towns, in: The urban book series, Springer, Cham, 497–520, https://doi.org/10.1007/978-3-031-77752-3_25, 2025.
Pasquier, U., Nicholls, R. J., Lincke, D., Hinkel, J., Toimil, A., Heslop, J., de Sá Cotrim, C., Coelho, C., Hallin, C., Sancho, F., and Silva, Paulo A.: Beyond the bathtub: assessment of broad-scale coastal inundation modeling with flood attenuation, Coastal Research Library, 455–461, https://doi.org/10.1007/978-3-032-15477-4_69, 2026.
Powell, E. J., Tyrrell, M. C., Milliken, A., Tirpak, J. M., and Staudinger, M. D.: A review of coastal management approaches to support the integration of ecological and human community planning for climate change, J. Coast. Conserv., 23, 1–18, https://doi.org/10.1007/s11852-018-0632-y, 2018.
Rabelo, T. O., Diniz, M. T. M., de Araújo, I. G. D., de Oliveira Terto, M. L., Queiroz, L. S., Araújo, P. V. d. N., and Pereira, P.: Risk of degradation and coastal flooding hazard on geoheritage in protected areas of the semi-arid coast of Brazil, Water, 15, 2564, https://doi.org/10.3390/w15142564, 2023.
REDEGEO – App para Rede Geodésica Digital: http://labsim.unipampa.edu.br/redegeo (last access: 15 September 2025), 2020.
Rodríguez, M. G., Nicolodi, J. L., Gutiérrez, O. Q., Cánovas Losada, V., and Espejo Hermosa, A. E.: Brazilian coastal processes: wind, wave climate and sea level, in: Brazilian Beach Systems, edited by: Short, A. D. and Klein, A. H. da F., Coastal Research Library, vol. 17, Springer, Cham, 37–66, https://doi.org/10.1007/978-3-319-30394-9_2, 2016.
Rouse, H., Bell, R., Lundquist, C., Blackett, P., Hicks, D., and King, D.-N.: Coastal adaptation to climate change in Aotearoa-New Zealand, N. Z. J. Mar. Freshw. Res., 51, 183–222, https://doi.org/10.1080/00288330.2016.1185736, 2016.
Sanders, B. F., Wing, O. E. J., and Bates, P. D.: Flooding is not like filling a bath, Earth's Future, 12, e2024EF005164, https://doi.org/10.1029/2024EF005164, 2024.
Scardino, G., Anzidei, M., Petio, P., Serpelloni, E., De Santis, V., Rizzo, A., Liso, S. I., Zingaro, M., Capolongo, D., Vecchio, A., Refice, A., and Scicchitano, G.: The impact of future sea-level rise on low-lying subsiding coasts: a case study of Tavoliere delle Puglie (southern Italy), Remote Sens.-Basel, 14, 4936, https://doi.org/10.3390/rs14194936, 2022.
Shen, Y., Tahvildari, N., Morsy, M. M., Huxley, C., Chen, T. D., and Goodall, J. L.: Dynamic modeling of inland flooding and storm surge on coastal cities under climate change scenarios: transportation infrastructure impacts in Norfolk, Virginia USA as a case study, Geosciences, 12, 224, https://doi.org/10.3390/geosciences12060224, 2022.
Smith, K.: Environmental hazards: assessing risk and reducing disaster, 3rd edn., Routledge, London, ISBN: 0415224632, 2001.
Silva, J. P., Araújo, P. V. N., Diniz, M. T. M., and Santos, J. Y.: Projection and assessment of the physical impacts resulting from sea-level rise by the year 2100 in the urban area of Grossos, Rev. Geociênc. Nordeste, 10, 206–214, https://doi.org/10.21680/2447-3359.2024v10n2id37699, 2024.
Silva, T. C. L., Diniz, M. T. M., Araújo, P. V. N., and Ferreira, B.: Marine hydraulic process modelling using SMC-Brasil on the semi-arid Brazilian coast, Geosciences, 15, 344, https://doi.org/10.3390/geosciences15090344, 2025.
SMC-Brasil – Sistema de Modelagem Costeira: coastal modeling system and data for the Brazilian coast, Environmental Hydraulics Institute (Universidad de Cantabria)/Ministério do Meio Ambiente (Brazil), http://smcbrasil.ihcantabria.com/downloads/ (last access: 15 September 2025), 2025.
Soares, M. and Amaro, V. E.: Geodetic network for coastal monitoring of setentrional littoral of Rio Grande do Norte state, Bol. Ciênc. Geod., 17, 571–585, https://doi.org/10.1590/S1982-21702011000400005, 2011.
Soares, M. O., Campos, C. C., Carneiro, P. B. M., Barroso, H. S., Marins, R. V., Teixeira, C. E. P., Menezes, M. O. B., Pinheiro, L. S., Viana, M. B., Feitosa, C. V., Sánchez-Botero, J. I., Bezerra, L. E. A., Rocha-Barreira, C. A., Matthews-Cascon, H., Matos, F.O., Gorayeb, A., Cavalcante, M. S., Moro, M. F., Rossi, S., Belmonte, G., Melo, V. M. M., Rosado, A. S., Ramires, G., Tavares, T. C. L., and Garcia, T. M.: Challenges and perspectives for the Brazilian semi-arid coast under global environmental changes, Perspect. Ecol. Conserv., 19, 267–278, https://doi.org/10.1016/j.pecon.2021.06.001, 2021.
Souza, C. M., Shimbo, J. Z., Rosa, M. R., Parente, L. L., Alencar, A., Rudorff, B. F. T., Hasenack, H., Matsumoto, M., Ferreira, L. G., Souza-Filho, P. W. M., de Oliveira, S. W., Rocha, W. F., Fonseca, A. V., Marques, C. B., Diniz, C. G., Costa, D., Monteiro, D., Rosa, E. R., Vélez-Martin, E., and Weber, E. J.: Reconstructing three decades of land use and land cover changes in Brazilian biomes with Landsat archive and Earth Engine, Remote Sens.-Basel, 12, 2735, https://doi.org/10.3390/rs12172735, 2020.
Stephens, S. A., Paulik, R., Reeve, G., Wadhwa, S., Popovich, B., Shand, T., and Haughey, R.: Future changes in built environment risk to coastal flooding, permanent inundation and coastal erosion hazards, J. Mar. Sci. Eng., 9, 1011, https://doi.org/10.3390/jmse9091011, 2021.
Su, W.-R., Chen, Y.-H., Fu, H.-S., Chang, T.-Y., and Chen, W.-B.: Assessing the inundation risk of cultural heritages along the southwestern coast of Taiwan: present and future, Reg. Environ. Change, 24, 2, https://doi.org/10.1007/s10113-024-02204-9, 2024.
Terres de Lima, L., Fernández-Fernández, S., Gonçalves, J. F., Magalhães Filho, L., and Bernardes, C.: Development of tools for coastal management in Google Earth Engine: uncertainty bathtub model and Bruun rule, Remote Sens.-Basel, 13, 1424, https://doi.org/10.3390/rs13081424, 2021.
Turner, B. L., Matson, P. A., McCarthy, J. J., Corell, R. W., Christensen, L., Eckley, N., Kasperson, R. E., Luers, A., Lovejoy, T., and Martello, M. L.: A framework for vulnerability analysis in sustainability science, P. Natl. Acad. Sci. USA, 100, 8074–8079, https://doi.org/10.1073/pnas.1231335100, 2003.
Vernimmen, R. and Hooijer, A.: New LiDAR-based elevation model shows greatest increase in global coastal exposure to flooding to be caused by early-stage sea-level rise, Earth's Future, 11, https://doi.org/10.1029/2022EF002880, 2023.
Vital, H.: The mesotidal barriers of Rio Grande do Norte, in: Geology and Geomorphology of Holocene Coastal Barriers of Brazil, edited by: Muehe, D., Springer, 107, 227–260, https://doi.org/10.1007/978-3-540-44771-9_9, 2009.
Vital, H., Rocha, G. R., and Plácido, J. S.: Morphodynamics of Arrombado tidal inlet, Macau-RN (NE Brazil), Proc. Coast. Sediments, 2011, 327–338, https://doi.org/10.1142/9789814355537_0025, 2011.
Vousdoukas, M. I., Mentaschi, L., Voukouvalas, E., Verlaan, M., Jevrejeva, S., Jackson, L. P., and Feyen, L.: Global probabilistic projections of extreme sea levels show intensification of coastal flood hazard, Nat. Commun., 9, 2360, https://doi.org/10.1038/s41467-018-04692-w, 2018.
Williams, L. L. and Lück-Vogel, M.: Comparative assessment of the GIS-based bathtub model and an enhanced bathtub model for coastal inundation, J. Coast. Conserv., 24, 2, https://doi.org/10.1007/s11852-020-00735-x, 2020.
Wisner, B., Gaillard, J. C., and Kelman, I. (Eds.): Handbook of hazards and disaster risk reduction, Routledge, https://doi.org/10.4324/9780203844236, 2012.
Yang, L., Jin, T., and Jiang, W.: ASM-SS: the first quasi-global high-spatial-resolution coastal storm surge dataset reconstructed from tide gauge records, Earth Syst. Sci. Data, 17, 2793–2807, https://doi.org/10.5194/essd-17-2793-2025, 2025.
Yunus, A., Avtar, R., Kraines, S., Yamamuro, M., Lindberg, F., and Grimmond, C.: Uncertainties in tidally adjusted estimates of sea-level rise flooding (bathtub model) for Greater London, Remote Sens.-Basel, 8, 366, https://doi.org/10.3390/rs8050366, 2016.