
the Creative Commons Attribution 4.0 License.
the Creative Commons Attribution 4.0 License.
 | 12 Aug 2026
Can aerosols improve urban flood forecasting? A case study of 2015 Chennai extreme event
Oscar Paul
N. Nithila Devi
Rakesh Teja Konduru
Soumendra Nath Kuiry
Kundan Lal Shrestha
Chandan Sarangi
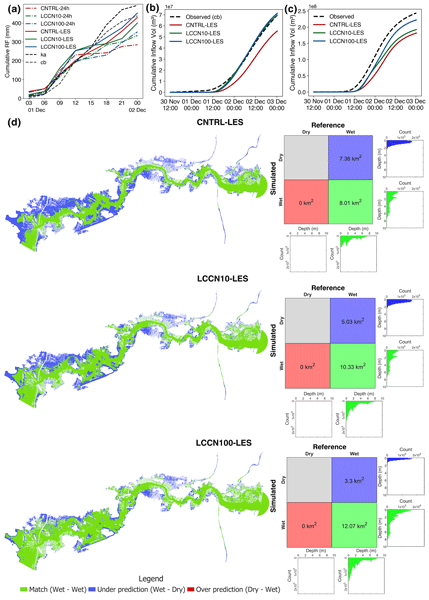
In December 2015, Chennai, a coastal megacity in India, faced an extreme precipitation-flooding event (EPF) that triggered a devastating 1-in-100-year flood. Several previous attempts failed to accurately simulate the spatiotemporal variability of this EPF at the urban basin scale. Even though incorporating aerosols into operational weather models can improve the accuracy of EPF simulations, it is often ignored due to its computational cost. To address this, we conducted ensemble experiments to highlight the significance of aerosol-cloud interactions in simulating this EPF. In that regard, we use a computationally intensive, high-resolution WRF model configured in large-eddy simulation (LES) mode to represent the interactions in the complex urban microphysics. The results indicate that explicit aerosol representation significantly influenced the microphysics-dynamics interaction during the 2015 EPF and produced rainfall patterns in closer agreement with satellite and rain gauge observations, with basin-scale improvement of ∼ 22 %. Further, employing simulated rainfall in a coupled hydrologic-hydraulic modeling framework increased inundation accuracy by ∼ 50 %. Thus, this study suggests that explicit aerosol representation can improve the space-time simulation of rainfall and flooding for the EPF in Chennai and potentially for similar coastal megacities.
- Article
(6136 KB) - Full-text XML
-
Supplement
(1750 KB) - BibTeX
- EndNote


Observations from recent decades reveal a distinct increase in the frequency and magnitude of extreme precipitation events over India (Goswami et al., 2006; Mishra and Shah, 2018; Pattanaik and Rajeevan, 2010; Roxy et al., 2017). This has increased concerns about severe urban flooding, which often results in significant loss of life and property. Hence, accurate numerical simulation and forecasting of extreme precipitation-flooding (EPF) events are essential for urban flood management using the EPF forecasting frameworks, which couple atmospheric, hydrological, and hydraulic models (Ghosh et al., 2019). Nevertheless, considering the complex nonlinear interactions between regional meteorology, cloud microphysics and dynamics, and urban-scale land-atmosphere interactions at different spatio-temporal scales within the atmospheric models makes it challenging. High-resolution cloud-resolving atmospheric models are demonstrating improved accuracy in simulations of heavy precipitation at regional scale (Hazra et al., 2017; Konduru et al., 2023; Barros et al., 2018; Sarangi et al., 2017, 2018a). However, accurately capturing the spatiotemporal variability in extreme precipitation over urban basins remains a challenge, so does EPF forecasting. Specifically, the biases in simulated spatiotemporal rainfall patterns over the urban basins propagate into the flood forecasting system and impact the accuracy of runoff streamflow, and flood inundation predictions over megacities (Gomez et al., 2019). This significantly impacts the community's flood preparedness, as the flood hazard and damage assessment depend on the simulated flood depth and inundation extent.
Often, extreme precipitation events occur during monsoon season in India. Based on long-term observational and simulation experiments, recent studies have revealed the strong influence of aerosols on extreme rainfall characteristics over India through aerosol-cloud-rain processes (Rai et al., 2023). Delayed collision-coalescence in warm clouds elevates condensate to mixed-phase levels, resulting in the formation of larger hydrometeors. This results in delayed but intensified precipitation over the region (Sarangi et al., 2017, 2018a, b). However, it is uncertain whether such aerosol-cloud-rain processes play a significant role in rainfall simulation at spatial scales of urban basins (i.e., 5–15 km2). This uncertainty arises partly from the sensitivity of cloud microphysical processes to internal model variability (IMV), with initialization at the onset of convective intensification being critical for accurately capturing extreme event intensity (Tewari et al., 2022). Hence, incorporating urban aerosols into operational numerical weather prediction at the urban basin scale is largely ignored as coupled microphysics-meteorology forecasting is computationally exhaustive and time-consuming.
An EPF event (1 December 2015) occurred over Chennai, a coastal megacity in India, which is considered as a 1-in-100-year return period flood. The event had reported maximum daily rainfall of ∼ 500 mm over the basin. Hence, it is one of the most catastrophic urban flooding events in over a century, causing an estimated 500 fatalities and a USD 3 billion loss (Nithila Devi et al., 2019). Many modeling studies have simulated this event, but these studies have high biases in the simulated spatiotemporal variability of the storm and resulting rainfall over the basin. While some studies highlighted the influence of synoptic-scale convective systems linked to El Niño and Rossby wave shifts (Chakraborty, 2016), some attributed the warming trend of sea-surface temperature in the Bay of Bengal (Boyaj et al., 2018; Panda and Rath, 2022; van Oldenborgh et al., 2016). Others indicated that the local drivers like orography (Phadtare, 2018), improving boundaries (Rath and Panda, 2019; Srinivas et al., 2018), cloud microphysics (Reshmi Mohan et al., 2018) processes and use of realistic urban land use (Konduru et al., 2023; Panda and Rath, 2022) can improve the spatiotemporal pattern of rainfall of this event. However, despite these insights, the lack of aerosol-cloud processes in the aforementioned studies can be one of the reasons for the underestimation of the magnitude of extreme precipitation in the urban basin. Additionally, previous studies have highlighted how errors in short-range rainfall forecasts affected the accuracy of 2015 flood inundation predictions for Chennai city in the Adyar basin (Nithila Devi and Kuiry, 2023). These concerns underscore the importance of having accurate spatial and temporal rainfall simulations for better accuracy in urban flood forecasting.
Overall, despite the growing use of computationally intensive high-resolution WRF and LES simulations to improve flood management, accurate spatiotemporal rainfall forecasting at complex urban scales remains challenging. Therefore, this study aims to test a focused hypothesis: Do aerosol concentrations improve the rainfall and urban flood forecasting of the Chennai 2015 EPF? To evaluate this hypothesis, we employed a one-way coupled atmospheric-hydrologic-hydraulic modeling framework for the 2015 EPF event in Chennai. We conducted a series of aerosol sensitivity experiments to quantify their effect on simulated rainfall under IMV and how these aerosol-induced changes propagate into flood prediction, as detailed in Sect. 2.
2.1 Atmospheric simulations using WRF model and sensitivity experiments
Weather Research and Forecasting (WRF) (Skamarock et al., 2008) is configured to perform a high-resolution simulation with five interactive nested domains (27, 9, 3, 1, and 0.2 km) and 72 vertical levels (Fig. 1a and b). The initial and boundary conditions for these simulations are obtained from the Indian Monsoon Data Assimilation and Analysis (IMDAA) data (Rani et al., 2021), available at a 12 km resolution every 6 h. The Grell-Freitas “scale-aware” cumulus scheme (Grell and Freitas, 2014) is applied in the 27 and 9 km domains, while the inner three domains explicitly resolve convection at 3, 1, and 0.2 km. The Mellor-Yamada Nakanishi and Niino (MYNN) level 2.5 closure scheme (Nakanishi and Niino, 2009) is implemented for the planetary boundary layer (PBL) processes in the outer four domains. However, the innermost domain of 0.2 km is configured in the large-eddy simulation (LES) mode, without any PBL parameterization scheme. In this LES configuration, subgrid-scale turbulent motions are represented using the 1.5-order turbulent kinetic energy (TKE) closure, while sixth-order monotonic horizontal diffusion is applied to suppress grid-scale numerical noise. Additional model physics includes the RRTMG scheme for both longwave and shortwave radiative transfer (Mlawer et al., 1997) and MM5 similarity theory for estimating surface heat and moisture fluxes.
An updated two-moment Thompson aerosol-aware microphysics scheme (Thompson and Eidhammer, 2014) is employed to incorporate the influence of aerosols via cloud condensation nuclei (CCN) and ice-nucleating (proxy for IN) aerosols into the model. Land surface processes across all domains are represented using Noah-LSM (Chen and Dudhia, 2001) coupled with a single-layer urban canopy model (Kusaka et al., 2001; Kusaka and Kimura, 2004). The CCN concentrations are estimated from the aerosol mixing ratios obtained from Modern-Era Retrospective analysis for Research and Applications (MERRA-2) (Buchard et al., 2017) reanalysis data at a relatively fine resolution of 0.5° × 0.625 °. The MERRA-2 reanalysis data of mixing ratios for sea salts and dust, along with other hydrophilic and hydrophobic aerosol components, were converted into number concentrations (Lu et al., 2022) and subsequently into CCN emission (Thompson and Eidhammer, 2014). In our analysis, we considered 15 years (2003–2017) of climatological mean CCN concentrations, which provided CCN emissions to the WRF model. To generate spatial heterogeneity in CCN emissions over Chennai, we integrated MERRA2-derived CCN with a spatial pattern obtained from mean 1-km Aerosol Optical Depth data from the Multi-Angle Implementation of Atmospheric Correction (MAIAC) algorithm (Lyapustin et al., 2018). This data, averaged for November-December months of 2014–2016, undergoes Radial Basis Function interpolation (Zou et al., 2013) using the SciPy package (Virtanen et al., 2020). This approach ensures realistic spatial heterogeneity in the magnitude of CCN emissions.
We performed three aerosol sensitivity experiments, with sequentially reducing CCN emission and concentrations (Table S1 in the Supplement). The baseline case (CNTRL) was followed by low-CCN case (LCCN10) with reduction factor of 10 and a very-low-CCN (LCCN100) case at one-hundredth with all other model configurations held constant. The motivation for these aerosol sensitivity experiments is that the climatological CCN values used in the CNTRL scenario (Fig. 1d) might not ideally represent conditions prior to the EPF event in Chennai. In multiple studies, the period from 29 November to 3 December 2015, is identified as the precipitation period for the 2015 event (Konduru et al., 2023; Narasimhan et al., 2016). Thus, by 29 November, the influence of the “below-cloud scavenging” (BCS) mechanism must have resulted in relatively cleaner conditions (compared to the climatology mean). Based on the Laakso et al. (2003) scavenging parameterization, continuous rainfall of 2–4 mm h−1 over 24 h is estimated to reduce accumulation-mode aerosol concentrations by factors of ∼ 26–180, corresponding to 96 %–99 % removal via wet scavenging. Furthermore, several raingauge stations recorded extreme rainfall exceeding 30–40 mm h−1 on 1 December 2015, indicating even higher scavenging efficiency. Thus, the LCCN sensitivity experiments were designed to simulate cleaner, more representative pre-event atmospheric conditions.
To assess the robustness of the aerosol-sensitivity results and to account for IMV within WRF, an ensemble approach was employed at 1-km resolution (d4). Rainfall was simulated for the period 30 November 00:00 UTC to 2 December 00:00 UTC, with three ensemble members generated for each aerosol scenario using different lead times of 27, 24, and 21 h, resulting in nine simulations in total. This ensemble framework (CNTRL-Ens, LCCN10-Ens, LCCN100-Ens) enables a more reliable evaluation of how aerosol loading affects rainfall over the urban basin during the EPF event.
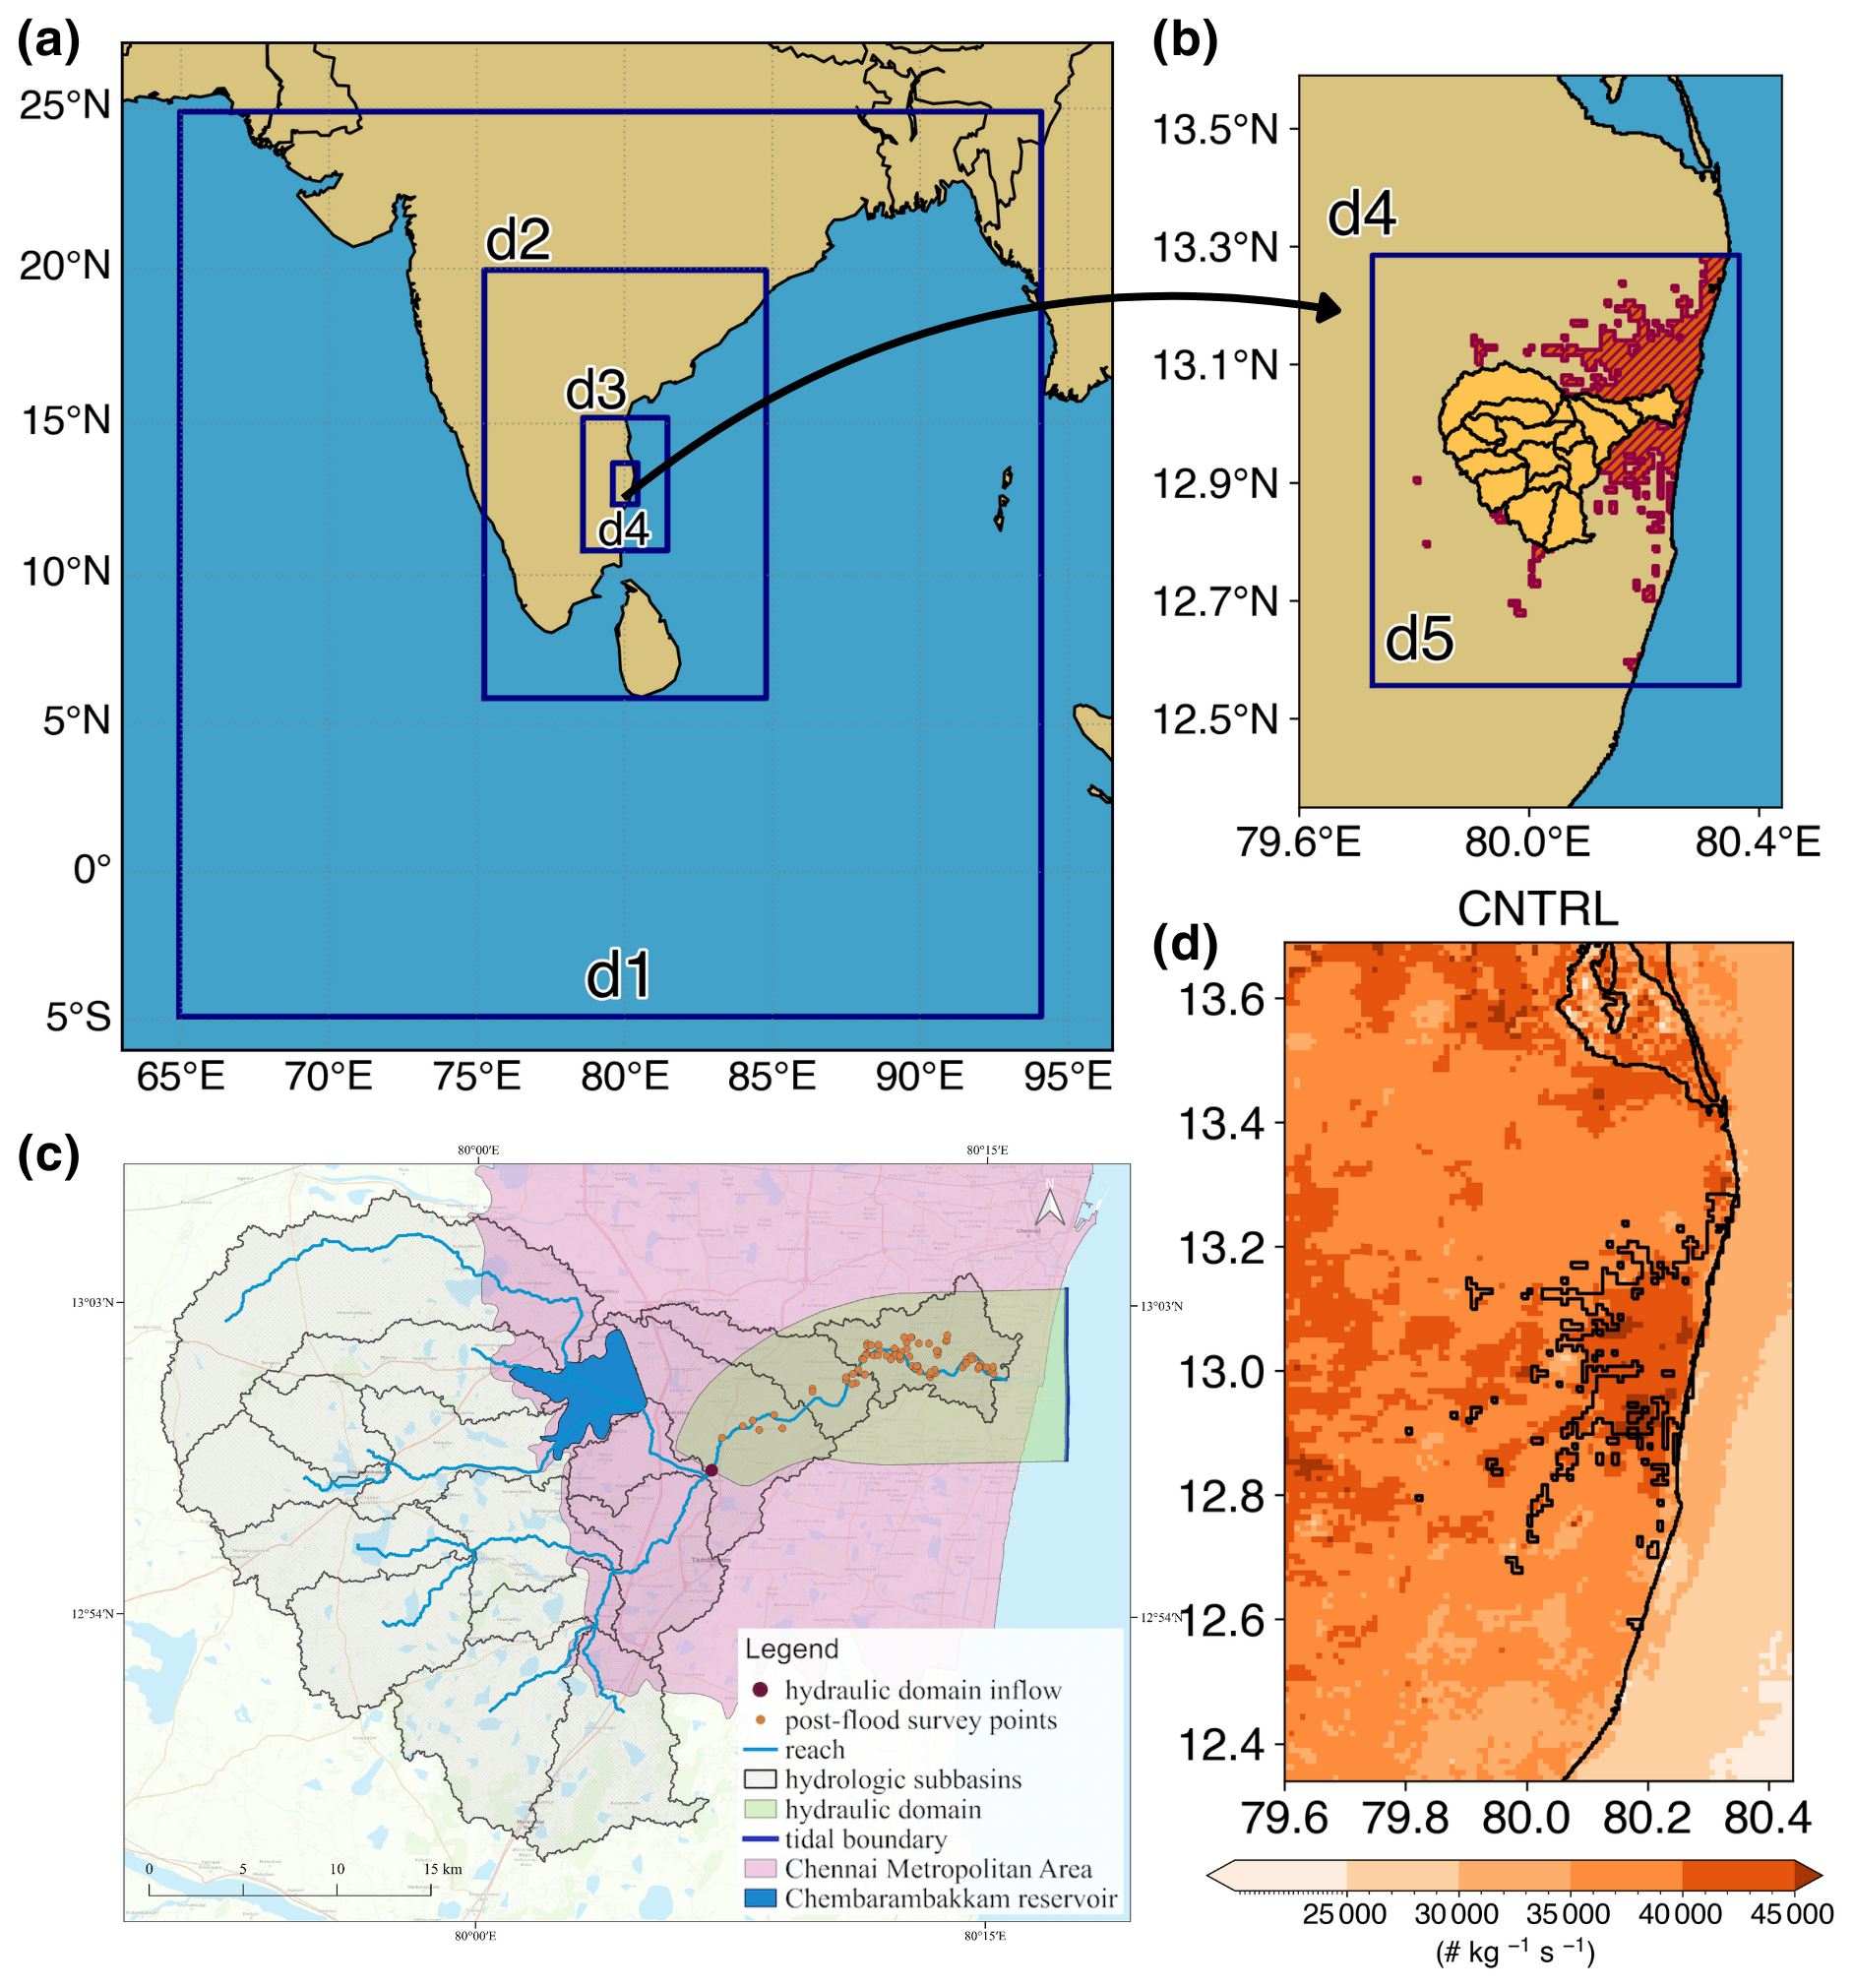
Figure 1WRF simulation domains, emission distribution, and HEC-HMS, HEC-RAS domain for Flood Analysis. (a) The nested parent domains used in WRF simulations. (b) The inner domains (d4 and d5) with urban land use and Adyar basin. (c) The delineated basin and stream network in HEC-HMS, as well as the hydraulic domain and boundary conditions for HEC-RAS. It also shows the locations where the post-flood survey was conducted to obtain the maximum inundation depths for the 2015 floods. (d) CCN surface emissions with urban land use for CNTRL in d4.
2.2 One-way Coupled Atmospheric-Hydrologic-Hydraulic Modeling Framework
Chennai city is located in the Adyar basin (Fig. 1c), through which the Adyar River flows and discharges into the Bay of Bengal. The hydrological model, HEC-HMS, is set up for the Adyar basin to simulate inflow for different scenarios into the Chembarambakkam reservoir that is located upstream of the city, and also the upstream boundary condition (marked as “hydraulic domain inflow” in Fig. 1c) for the hydraulic model, HEC-RAS. The Curve Number (CN) and kinematic wave routing methods are used to estimate the effective runoff from precipitation and to route the riverine flow in the basin. The CN method utilizes soil and land use/land cover data from the National Bureau of Soil Sciences, Pune, India, and Landsat 8, respectively. The two-dimensional HEC-RAS model routes the inflow hydrographs from the HEC-HMS model through the Adyar River and obtains the flood inundation extents in the city limits. To represent the complex urban terrain of Chennai, the 2 m × 2 m high-resolution LIDAR DEM data for Chennai city is used for hydraulic modeling. For a better representation of flooding in the urban area of Chennai, the building footprints are obtained from the Open Street Map (https://www.openstreetmap.org, last access: 15 January 2026) and according to the Building Block (Brown et al., 2007; Hunter et al., 2008; Schubert and Sanders, 2012) method, the values of DEM pixels corresponding to the footprints are increased by 5 m to maintain no-flow condition through the buildings. More details of the hydrological-hydraulic model set-up and its calibration for the 2015 EPF can be found in earlier studies (Nithila Devi et al., 2019). For the hydrological and hydraulic analyses, which are highly sensitive to rainfall magnitude, a single ensemble member was selected based on its spatio-temporal performance. LES simulations (d5) for rainfall were then conducted for all aerosol scenarios (CNTRL-LES, LCCN10-LES, LCCN100-LES) and were one-way coupled to the hydrologic-hydraulic setup (i.e., HEC-HMS and HEC-RAS). The detailed description of all simulations is provided in Table S1.
3.1 Evaluation of Ensemble mean Rainfall Simulations
Figures 2a–d present the spatiotemporal distribution of ensemble-mean accumulated precipitation for the sensitivity experiments, and its corresponding evaluation against IMERG satellite observations. IMERG revealed that this heavy rainfall was mostly centered over the southern half of the Adyar basin, extending to regions further south (Fig. 2a). The Adyar basin experienced significant rainfall on 1 December, with in situ rain gauge data recorded precipitation of 494 mm at Kattupakkam (ka) and 427 mm at Chembarambakkam (cb), respectively (Fig. 2).
In the CNTRL-Ens case, the maximum accumulated precipitation over the basin is approximately 270 mm, with a significant fraction falling outside the basin boundary in the north near 13.5° N (Fig. 2b). In comparison, LCCN10-Ens simulation demonstrates improvement in spatial distribution, with an increased Adyar basin-maximum of ∼ 295 mm (Fig. 2c). LCCN100-Ens exhibits further enhancement of the ensemble-mean rainfall, producing a maximum precipitation of ∼ 370 mm within the basin (Fig. 2d). The latitudinal rainfall distribution (Fig. 2e) captures this gradual improvement, with the peak rainfall region strengthening over the south of Adyar basin as we move from CNTRL-Ens to LCCN10-Ens to LCCN100-Ens, and the northern peak weakens correspondingly. Figure 2f presents the basin-averaged accumulated precipitation from IMERG along with the ensemble-mean values and associated ensemble spread for all the sensitivity experiments. IMERG indicates a basin-mean accumulation of 334 mm. The ensemble-mean basin-averaged precipitation is 242 mm for CNTRL-Ens, 260 mm for LCCN10-Ens, and 297 mm for LCCN100-Ens. The maximum basin-averaged totals within the ensemble members are 289, 352, and 370 mm for CNTRL-Ens, LCCN10-Ens, and LCCN100-Ens, respectively, demonstrating a systematic enhancement in the representation of rainfall over the Adyar basin across the three scenarios.
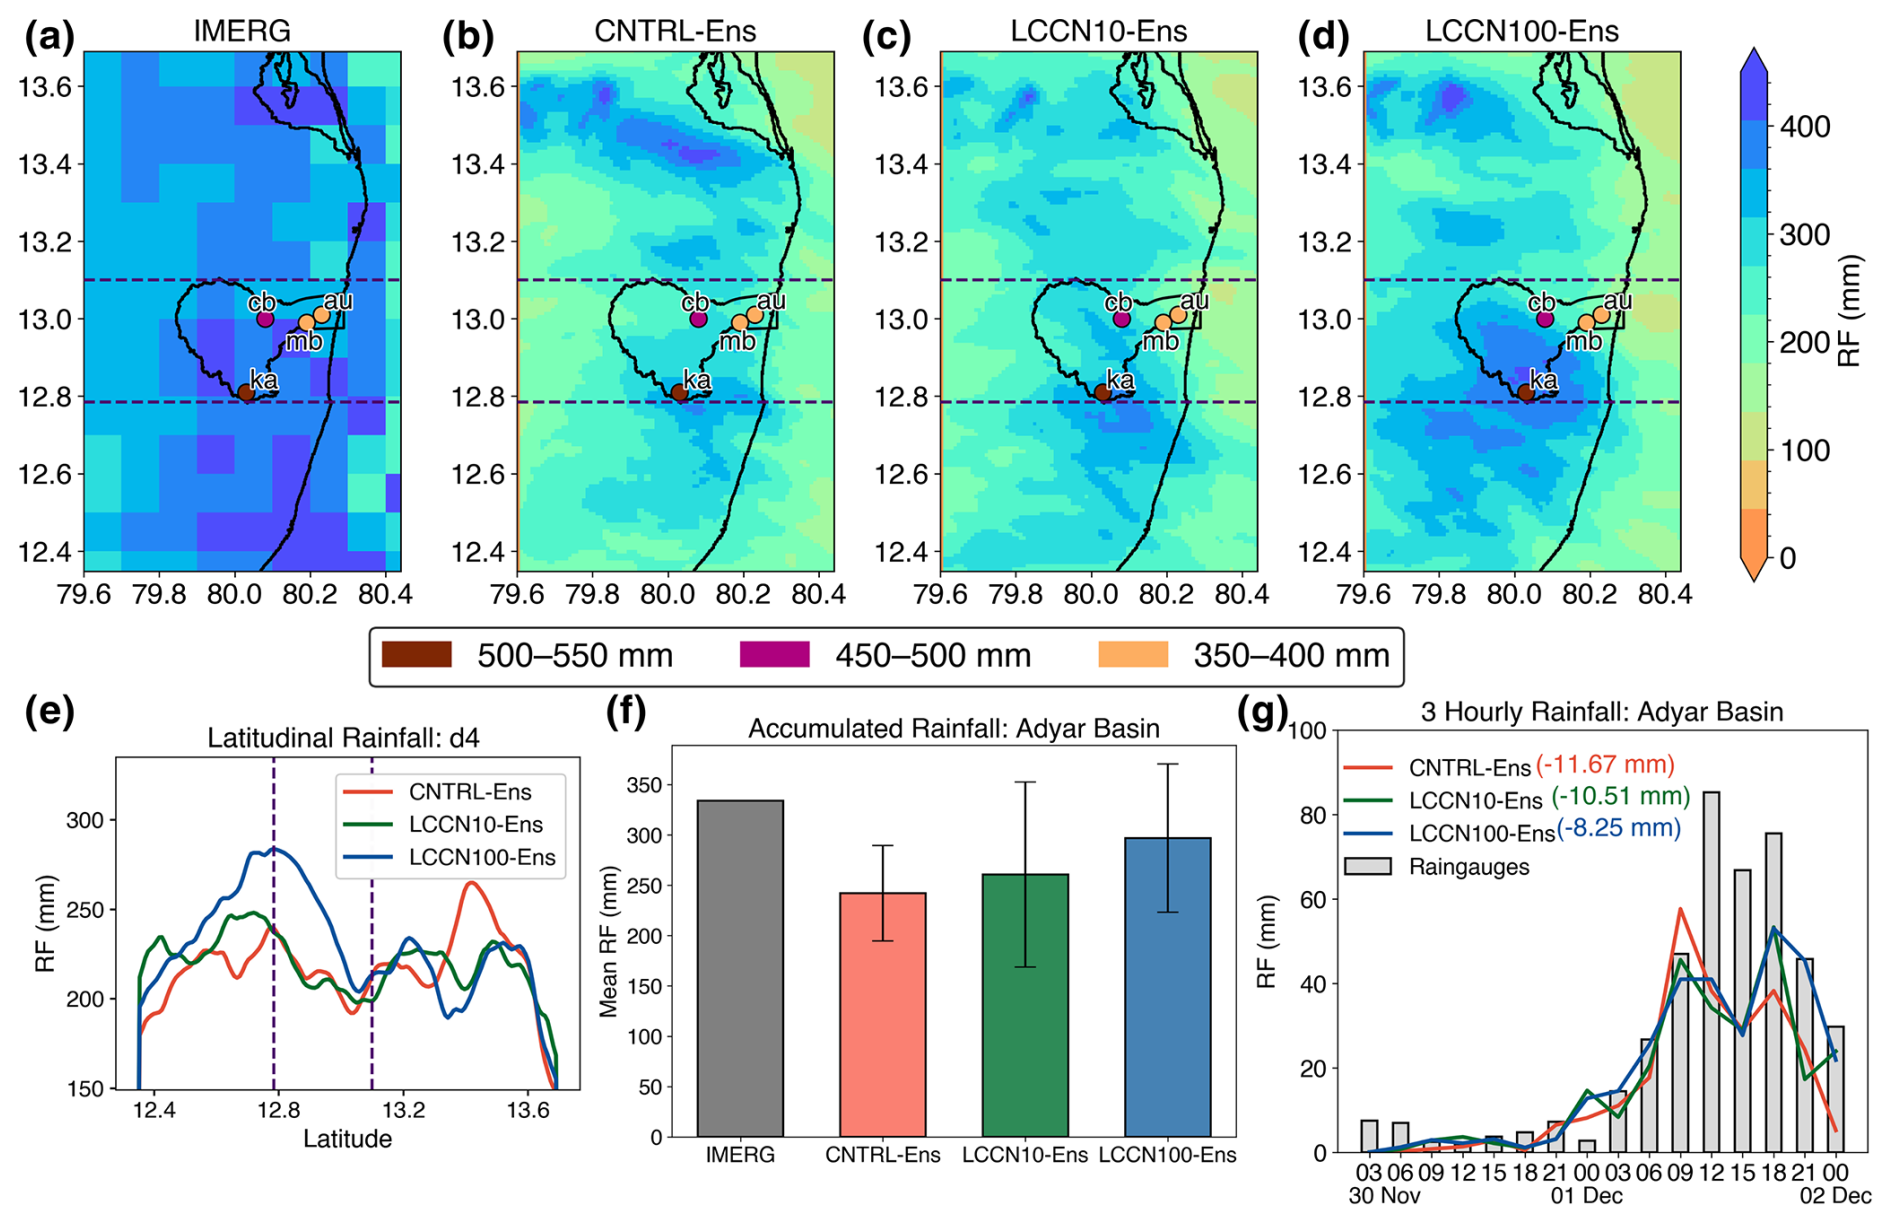
Figure 2Spatio-temporal distribution of rainfall across sensitivity experiments (dotted lines indicate basin extent). Panels show: (a) IMERG-derived accumulated rainfall, (b)–(d) Accumulated rainfall from CNTRL-Ens, LCCN10-Ens, and LCCN100-Ens, respectively, with rain gauge locations and observed totals at Kattupakkam (ka), Chembarambakkam (cb), Meenambakkam (mb), and Anna University (au) within the basin. (e) Latitudinal distribution of accumulated rainfall. (f) Basin-averaged accumulated rainfall from IMERG and sensitivity experiments (error bars showcasing variation in ensemble members) (g) 3-hourly temporal rainfall patterns with mean biases at Adyar basin. An average of four rain gauges have been used for temporal comparison.
At the same time, the temporal variability of precipitation within the Adyar basin is also validated using in situ rain gauges (Fig. 2g). Rainfall records averaged across four gauge stations (ka, cb, mb, and au; locations shown in Fig. 2) indicate that the most intense rainfall phase in the basin occurred between 09:00 and 21:00 UTC. The ensemble-mean temporal profiles from all sensitivity experiments show a distinct bimodal distribution during this period, consistent with the IMERG observations within the basin (Fig. 3a). LCCN100-Ens exhibits the lowest temporal bias (−8.25 mm), followed by LCCN10-Ens (−10.51 mm) and CNTRL-Ens (−11.67 mm) (Fig. 2f). Although all simulations show a bimodal structure, the enhanced performance of LCCN10-Ens and LCCN100-Ens arises from their improved representation of the temporal peaks, particularly the second peak during the period of intense rainfall. The first peak at 09:00 UTC is comparable across simulations, with 3-hourly rainfall values of ∼ 57 mm (CNTRL-Ens), ∼ 46 mm (LCCN10-Ens), and ∼ 42 mm (LCCN100-Ens). However, a clear distinction appears at the second peak around 18:00 UTC, where LCCN10-Ens and LCCN100-Ens (∼ 53 mm) outperform CNTRL-Ens (∼ 38 mm). This advantage persists and increases during later hours, resulting in accumulated ensemble-mean rainfall differences of ∼ 18 mm for LCCN10-Ens and ∼ 55 mm for LCCN100-Ens relative to CNTRL-Ens. Figures S1 and S2 show that these rainfall differences are consistent across all ensemble members. To better understand the spatiotemporal rainfall improvement in LCCN100-Ens over the Adyar Basin, we analyze the aerosol-induced changes in simulated storm morphology and cloud microphysical characteristics relative to CNTRL-Ens during the entire rainfall spell on 1 December (Fig. 3).
IMERG surface rainfall observations on a latitudinal-temporal axes highlights a northward propagation of the storm during this event, with peak precipitation over the Adyar basin at 06:00 and 15:00 UTC on 1 December (Fig. 3a). Both CNTRL-Ens (Fig. 3b) and LCCN100-Ens (Fig. 3c) successfully capture this northward shift. However, LCCN100-Ens better represents the rainfall magnitudes in and around the basin with peak rainfall observed during 09:00–12:00 and 18:00–21:00 UTC, contributing to relatively improved simulation of the observed bimodal temporal pattern in IMERG. In contrast, CNTRL-Ens simulates rainfall more to the north of the basin, with maxima near 13.5° N at 12:00 and 21:00 UTC, consistent with the accumulated pattern shown in Fig. 2b and e.
Comparison of altitude-averaged (surface-500 hPa) cloud water content (CWC) over the basin is consistently higher in CNTRL-Ens than in LCCN100-Ens throughout the event (Fig. 3d and f). During 00:00–06:00 UTC on 1 December, CNTRL-Ens simulates CWC values of ∼ 0.12–0.15 g kg−1, nearly twice that in LCCN100-Ens (∼ 0.06–0.09 g kg−1). This contrast continues as the storm enters the basin during 06:00–09:00 UTC and continues through the later stages of the event (18:00–21:00 UTC). The enhanced CWC in CNTRL-Ens relative to LCCN100-Ens is accompanied by comparatively lower rainwater content (RWC), which remains around 0.3 g kg−1 with localized higher values in the basin at 06:00 and 15:00 UTC (Fig. 3e). In contrast, LCCN100-Ens exhibits values exceeding 0.4 g kg−1 gradually propagating into the southern part of the basin by 09:00 UTC. A similar evolution was observed in later hours, with higher RWC south of the basin at 15:00 UTC and subsequent expansion into the basin between 15:00–18:00 UTC (Fig. 3g).
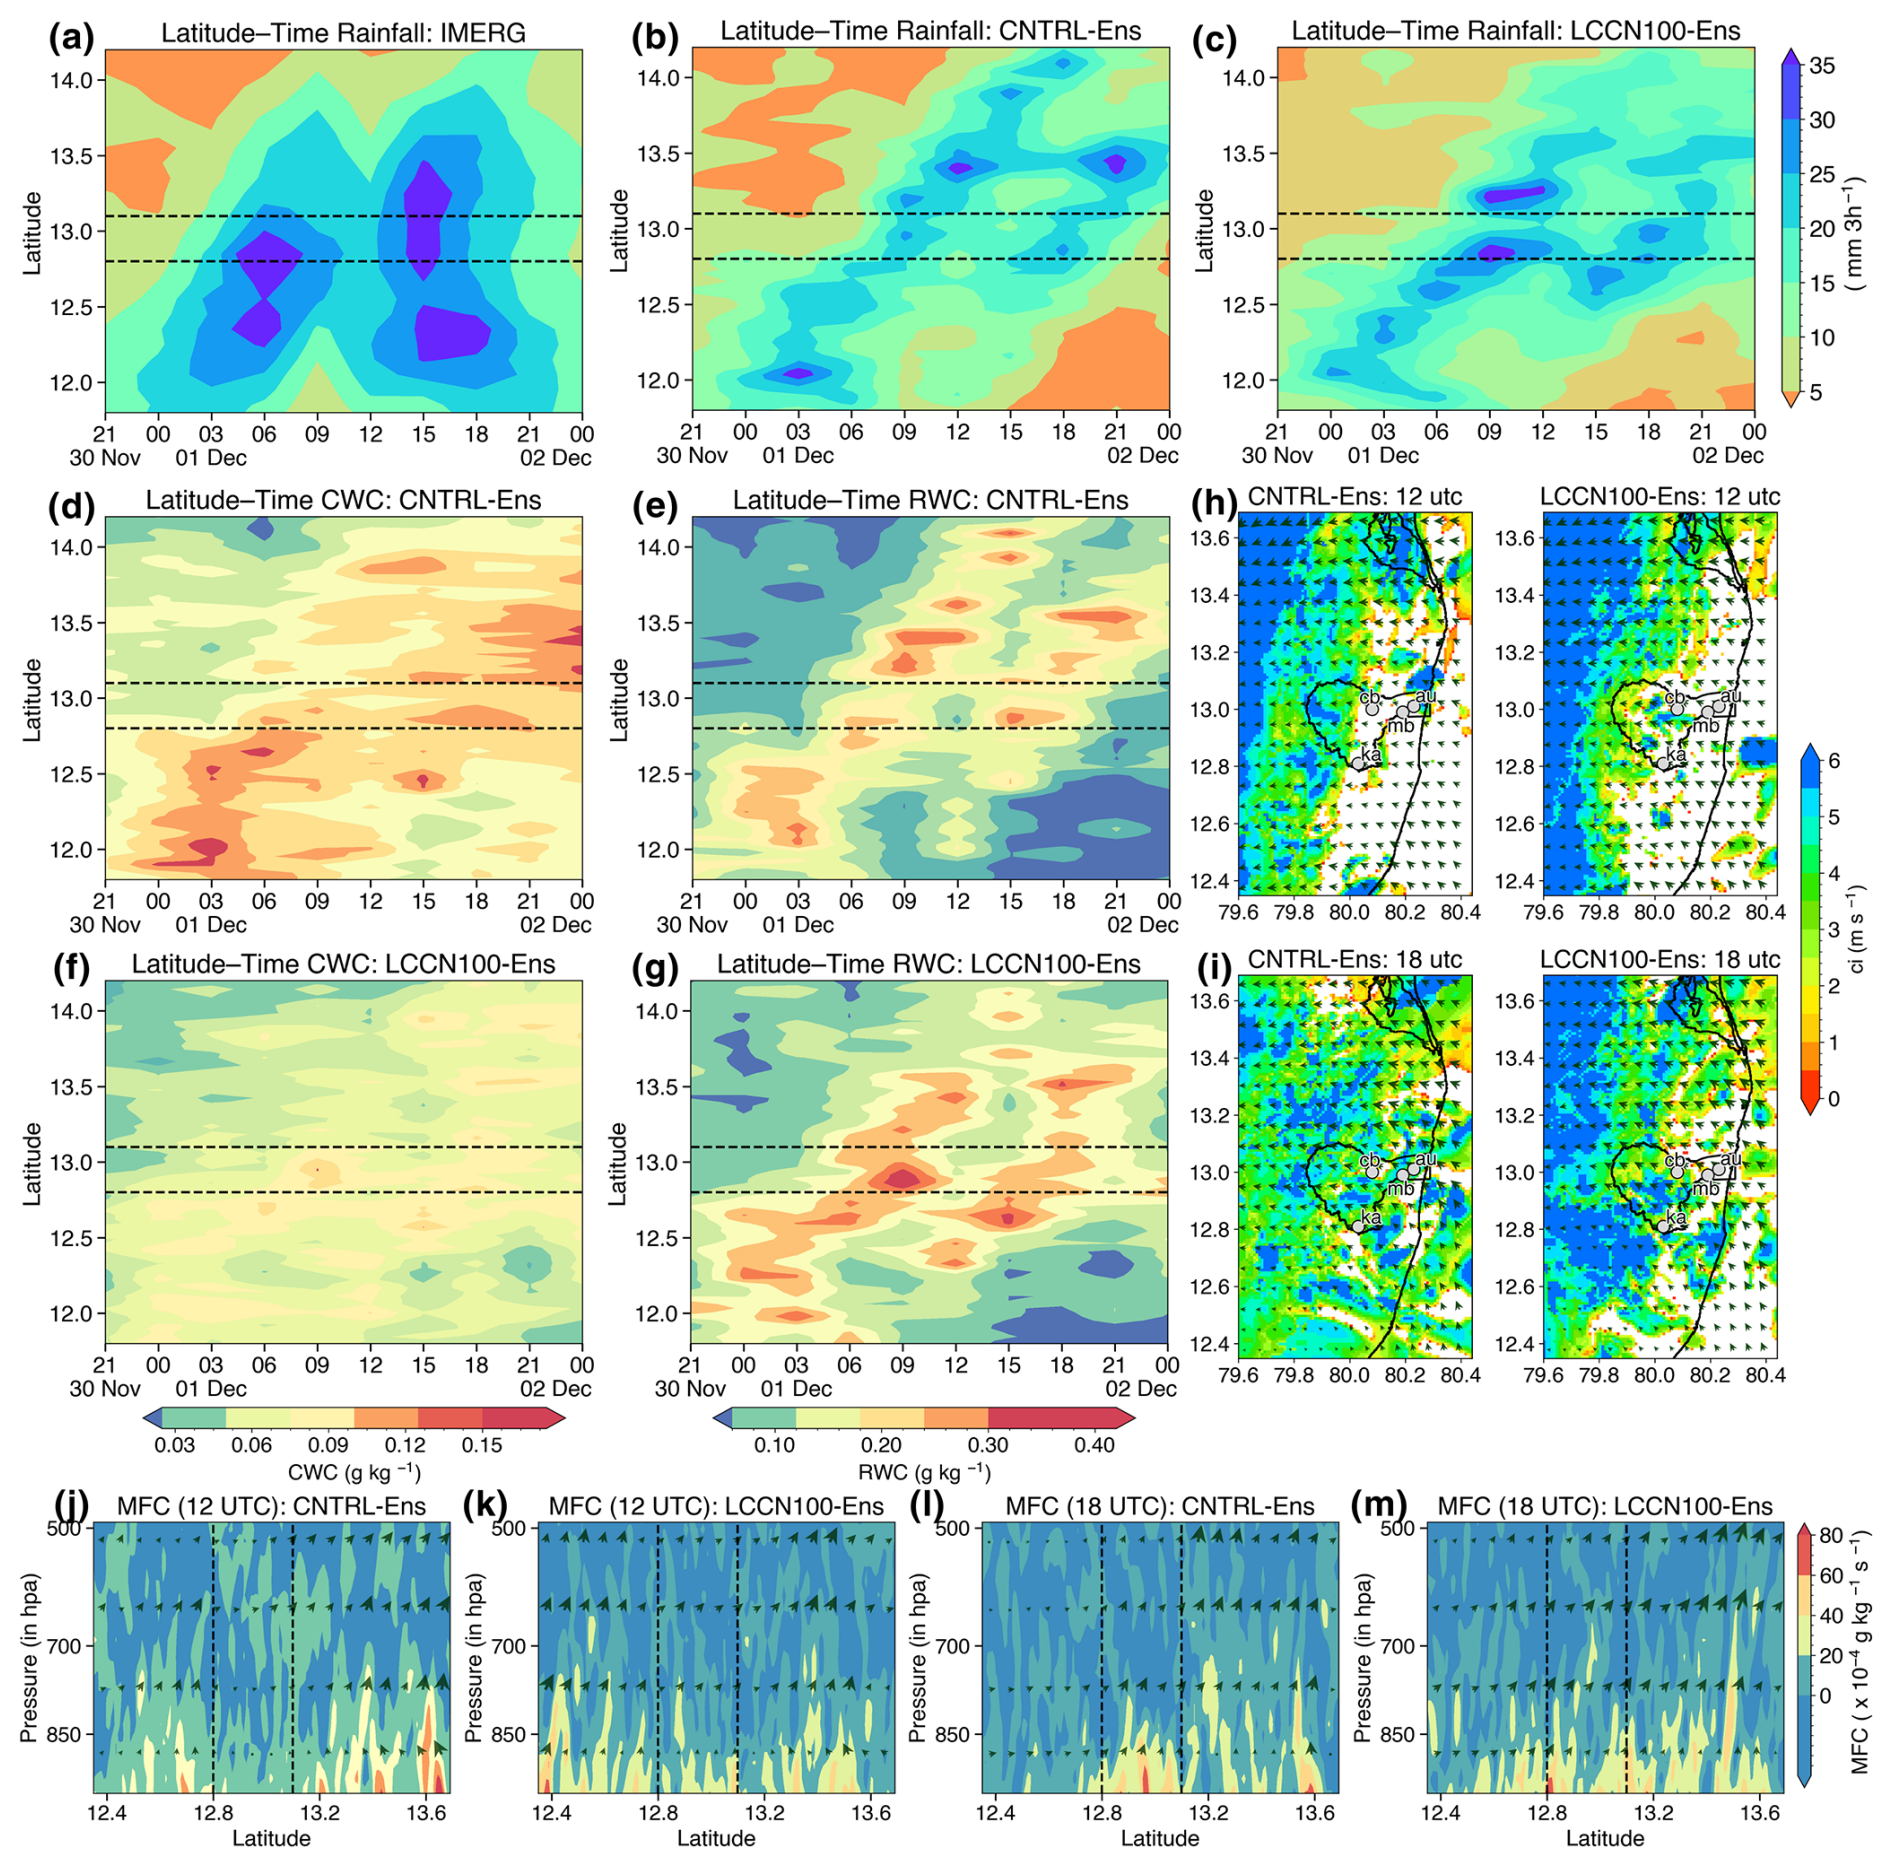
Figure 3Aerosol-Induced Convection in the Region (dotted lines indicate basin extent). The top row indicates latitude-temporal precipitation for (a) IMERG (b) CNTRL-Ens and (c) LCCN100-Ens from 30 November 21:00 UTC–2 December 00:00 UTC. The two middle rows (left and middle columns) show altitude-averaged latitude-time variations of (d, f) cloud water (CWC) and (e, g) rainwater content (RWC) for CNTRL-Ens (d–e) and LCCN100-Ens (f–g) during the same period. The right column displays the spatial distribution of cold pool intensity for CNTRL-Ens and LCCN100-Ens at (h) 12:00 and (i) 18:00 UTC. In the bottom row, panels present longitude-averaged latitude-altitude profiles of moisture flux convergence and winds at the 12:00 UTC (j–k) and 18:00 UTC (l–m) on 1 December for CNTRL-Ens (j, l) and LCCN100-Ens (k, m).
As expected, lower CCN concentrations in LCCN100-Ens simulates larger droplets and enhance collision-coalescence (Sarangi et al., 2018b). This accelerates raindrop growth and supports the early RWC enhancement observed during 06:00–09:00 UTC as the storm approaches the southern basin boundary. In contrast, CNTRL-Ens exhibits a larger CWC to RWC ratio under higher aerosol loading, favoring northward propagation of convection during the same period. In LCCN100-Ens, the southward enhancement of RWC during 06:00–09:00 UTC intensifies cold pool activity around the basin, strengthening cold pool-driven updrafts and moisture content (Fig. S3). These processes collectively maintain peak rainfall within and near the basin through 12:00 UTC without any northward movement.
The intensified rainfall at 12:00 UTC further amplifies cold pool strength and moisture-updraft interactions around the basin. At 12:00 UTC, the spatial distribution of cold pool intensity (colored shading indicates cold pool regions; Fig. 3h) shows a domain-wide band of strong cold pool signatures between 79.6–79.8° E in LCCN100-Ens, whereas CNTRL-Ens concentrates stronger cold pools farther north. Consequently, LCCN100-Ens produces greater moisture-flux convergence in and around the basin at 12:00 UTC (Fig. 3k), while CNTRL-Ens exhibits higher convergence primarily north of the basin (Fig. 3j). This setting facilitates RWC and surface rainfall south of the basin at 15:00 UTC in LCCN100-Ens, followed by northward progression into the basin by 18:00 UTC as cold pool strength remains elevated (Fig. 3i). Moisture convergence correspondingly intensifies around the basin at 18:00 UTC (Fig. 3m), in contrast to the more scattered and weaker signals in CNTRL-Ens (Fig. 3l). These processes collectively explain the stronger rainfall during 18:00–21:00 UTC in LCCN100-Ens. Overall, the reduced CCN concentrations in LCCN100-Ens enhances microphysics-dynamics interaction in the region, improving the basin's rainfall representation.
3.2 Evaluation of Rainfall simulations in simulating flood discharges, depths, and extents
Hydrological and hydraulic simulations are carried out to determine whether the improved spatio-temporal rainfall distribution from the aerosol-sensitivity experiments are reflected into corresponding changes in reservoir inflow and flood simulations. Since the Adyar basin is ungauged, hydrological simulation errors are evaluated by comparing simulated inflows into the Chembarambakkam (cb) reservoir (Fig. 1c) and the Chennai city (marked as “hydraulic domain inflow” in Fig. 1c) with observed inflows during the 2015 EPF (details in Nithila and Kuiry, 2025). Among the WRF ensemble simulations, the 24-h lead-time member (CNTRL-24h, LCCN100-24h, LCCN10-24h) is selected based on the best spatio-temporal performance in 1-km runs (Figs. S1–S2; Table S2). Aerosol-sensitivity LES simulations are then conducted using the same model configuration. These simulations improve both the basin-wide cumulative rainfall on 1 December and the temporal evolution of rainfall for LCCN10-LES and LCCN100-LES relative to the corresponding 1-km simulations (LCCN10-24h and LCCN100-24h), with LCCN100-LES showing the closest alignment with rain gauge observations (Fig. 4a).
The improved rainfall representation influences the cumulative inflow volume into the cb reservoir (Fig. 4b) and Chennai city (Fig. 4c). For the cb reservoir, cumulative inflow errors decreased to 0.18 % and 2.40 % in the LCCN10-LES and LCCN100-LES, respectively, while errors for Chennai city reduced to 20.95 % and 8.74 %. These improvements are substantial compared with errors of 20.5 % and 25.38 % obtained in the CNTRL-LES. The timing of peak inflows is also more accurately captured in the LCCN experiments during the EPF event (Fig. S4). Such improvements in inflow prediction had an influence in the downstream flooding during the event. The inundation simulated based on IMERG rainfall is closer to that from the rain gauge data (Nithila Devi et al., 2020) and is considered as the reference for evaluating the inundation extents from CNTRL-LES, LCCN10-LES and LCCN10-LES rainfall inputs till 2 December 00:00 UTC. Although we were unable to secure satellite-derived inundation extents, the hydraulic simulation was validated using post-flood survey depths collected closer to the Adyar River. Therefore, it can be used as a reference for accuracy assessment (Nithila Devi et al., 2020). Figure 4d showcases the confusion matrix of the area and depth distribution for the experiments. It categorizes the simulated results as correctly simulated (wet in both observed and simulated), underpredicted (wet in observed but dry in simulated), and overpredicted (dry in observed but wet in simulated) relative to the reference in the corresponding computational cells. LCCN10-LES and LCCN100-LES exhibit flood extents of 10.33 and 12.07 km2 respectively demonstrating the closest alignment with the reference maximum inundation area of 15.37 km2. These represent ∼ 29 % and ∼ 51 % improvements over the CNTRL-LES's 8.01 km2 simulated flood extent. We have quantified the accuracy of predicted flood inundation extent using fitness index scores (Kuiry et al., 2010). It reported values of 0.52 for CNTRL-LES, 0.67 for LCCN10-LES, and 0.78 for LCCN100-LES. These results emphasize the enhanced accuracy of LCCN experiments in simulating flood inundation depth and extent.
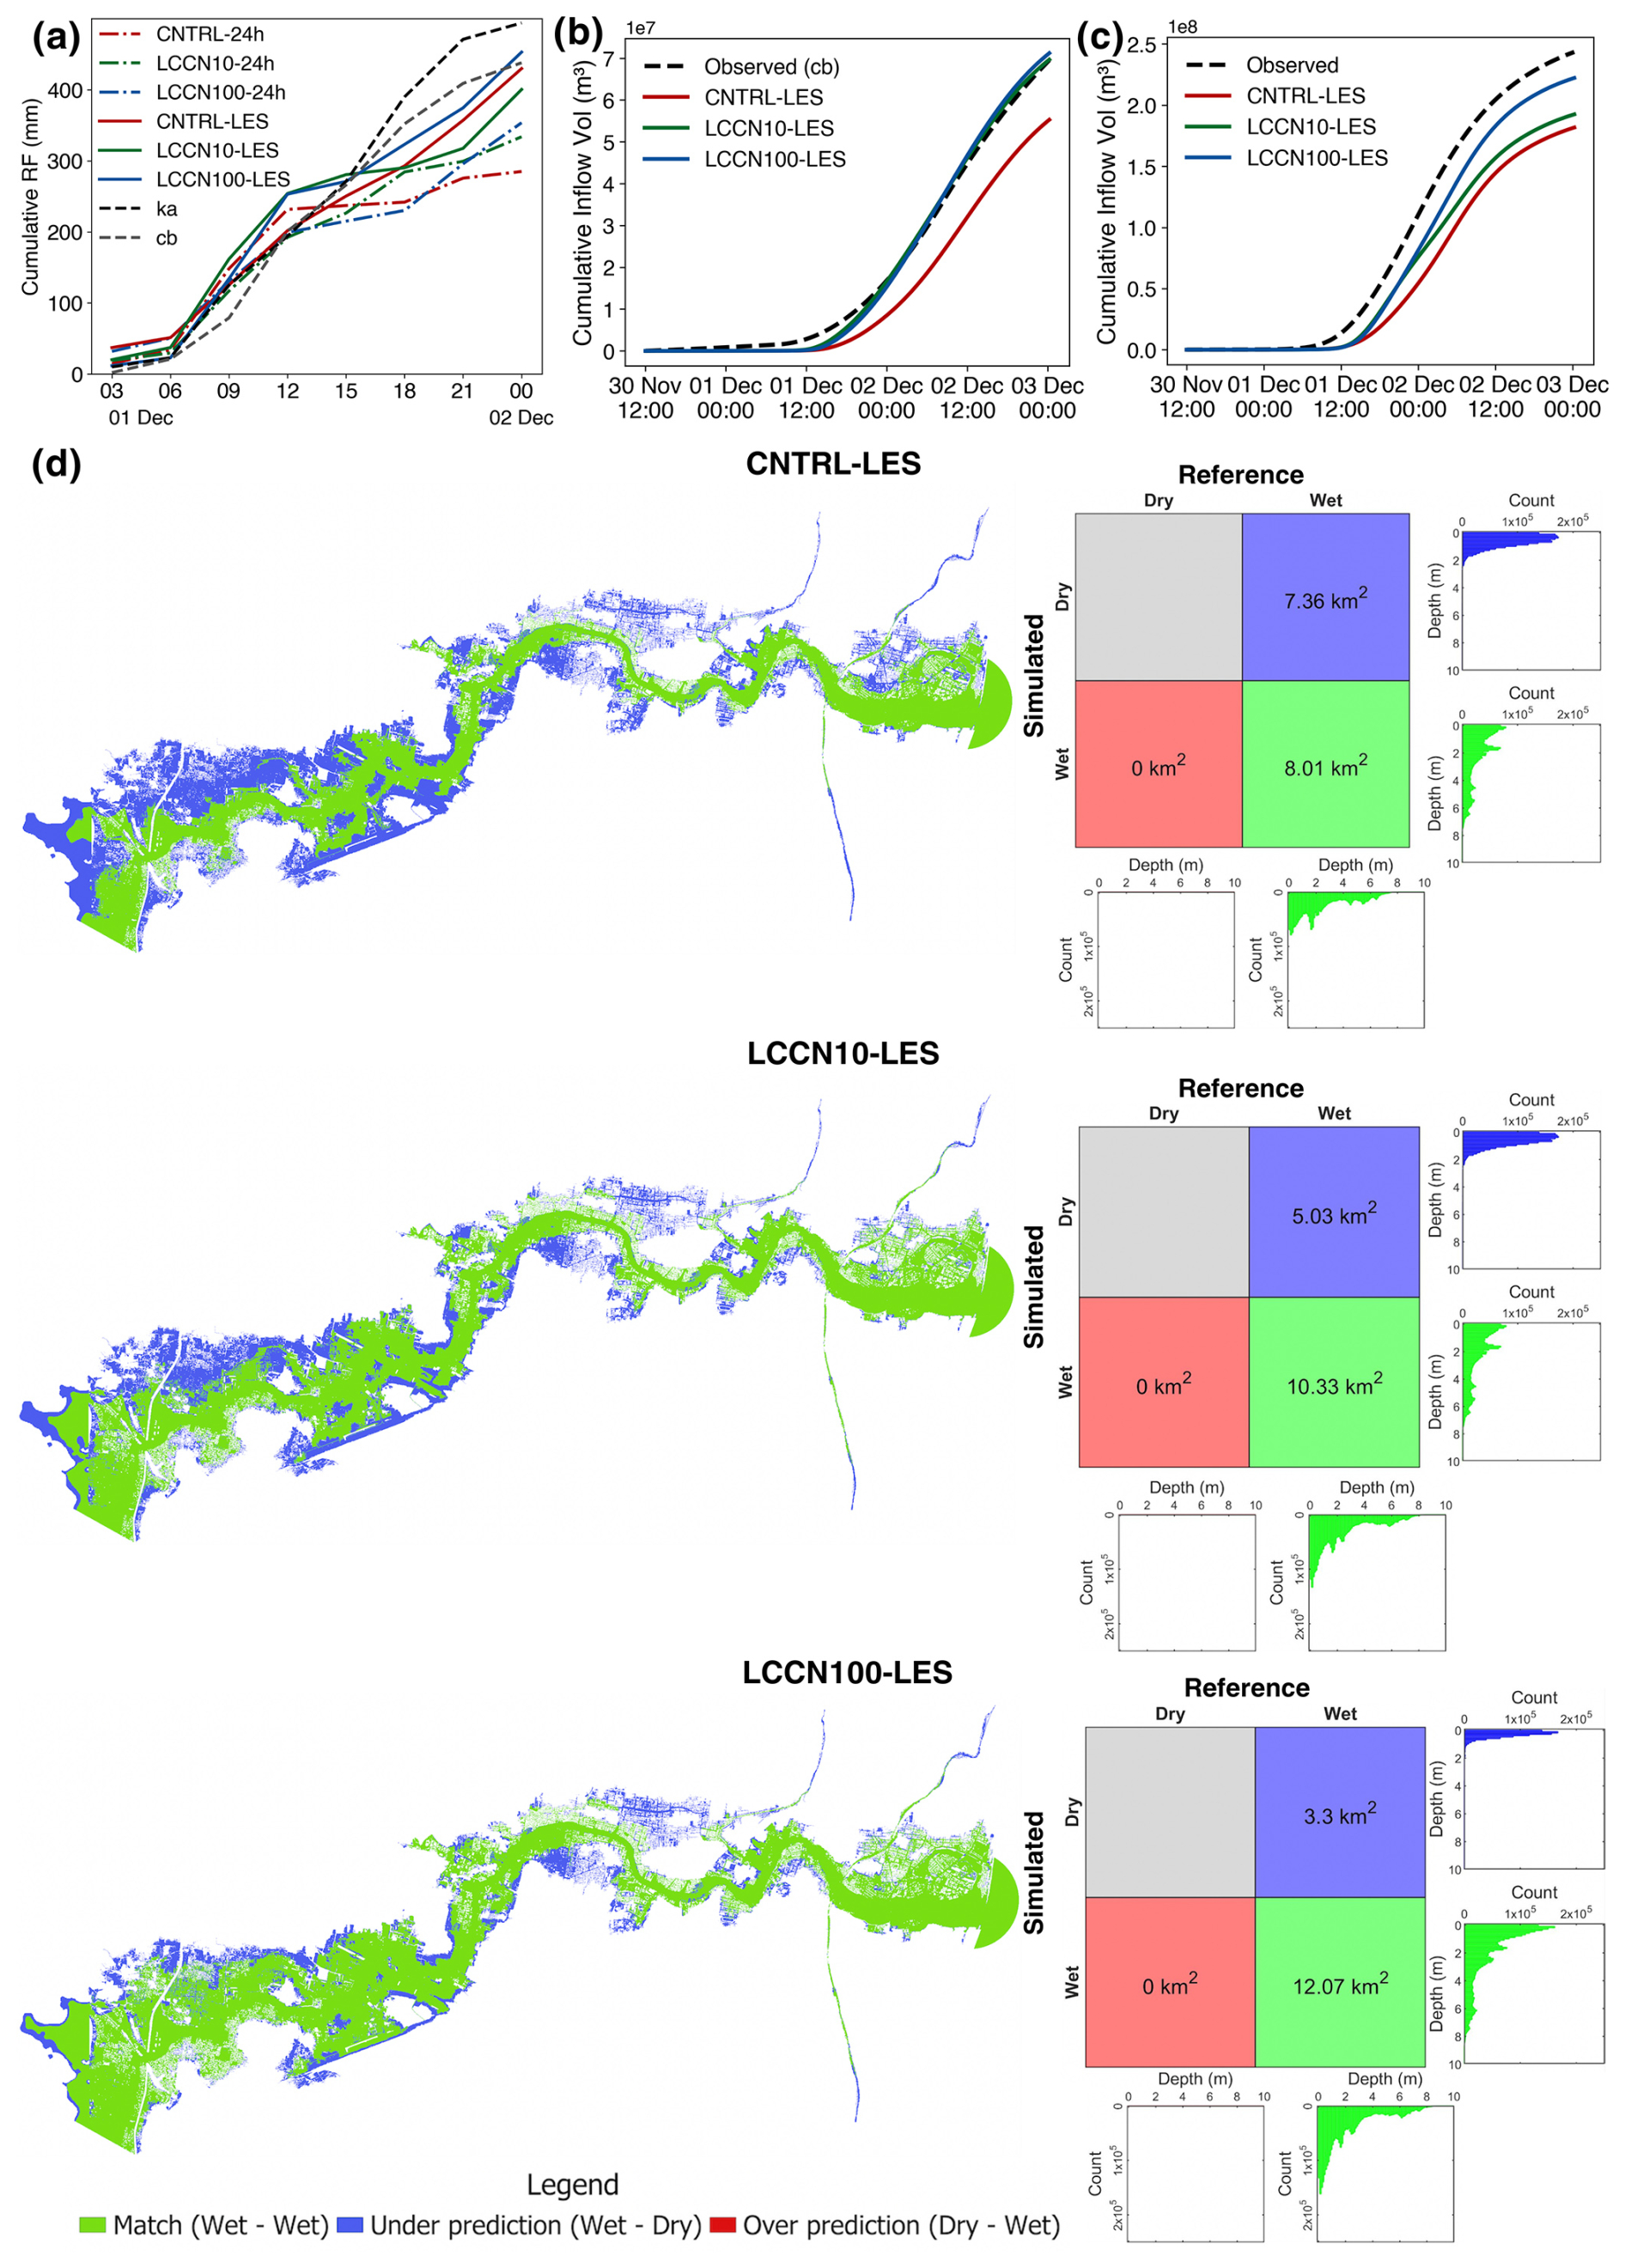
Figure 4Composite analysis of LES simulations, inflows and inundation depths for all the aerosol-sensitivity experiments. (a) Cumulative rainfall over the Adyar Basin from the LES runs compared with the best ensemble member. The cumulative inflow volume from IMERG and simulated inflows (b) into cb reservoir and (c) into Chennai city. (d) The inundation depth for these simulations alongside a confusion matrix depicting the pixel count and depth distribution with the reference values from IMERG data till 2 December 00:00 UTC.
Ensemble experiments with varying CCN emissions and concentrations were conducted for the 2015 EPF event. The results illustrate that inclusion of realistic aerosol conditions (less aerosols due to scavenging effect of ongoing rainy conditions) improved the microphysics-dynamics interaction and improved the basin-scale rainfall patterns as simulation biases were reduced against IMERG and rain gauge observations. Lower CCN concentrations favored warm-rain processes and increased the amount of precipitation. The subsequent evaporation of falling raindrops enhanced evaporative cooling, thereby strengthening cold pool activity near the basin (Mallinson and Lasher-Trapp, 2019). These persistent cold pools intensified low-level moisture convergence through thermodynamic forcing, establishing favorable conditions for secondary convection (Schlemmer and Hohenegger, 2014; Schlemmer and Hohenegger, 2016), thereby simulating the bimodal rainfall peaks observed in the basin. In contrast, the simulations with climatological CCN produced an excessive amount of cloud water relative to rain droplets, causing a premature northward shift of convection and reduced basin-accumulated rainfall. LES experiments further supported these findings that, under low-CCN conditions, cumulative rainfall magnitude and timing showed better agreement with rain gauge observations within the basin, inflow biases were reduced, and inundation extent estimates were enhanced. To summarize, using the coupled atmospheric-hydrologic-hydraulic framework, the study shows that the CCN-induced ∼ 22 % improvement in simulated rainfall (14 %–28 % among ensemble members) led to up to a 51 % improvement in simulated flood inundation extent. This provides quantitative evidence for aerosol microphysical impacts on urban-scale flooding.
For urban flood mitigation in megacities like Chennai, maintaining adequate reservoir storage during monsoons is crucial. Releasing reservoir water is a high-stakes decision because retaining it secures the city's future drinking supply in case the rainfall ceases. Consequently, gates are kept closed until water reaches critical, dangerous levels, often resulting in forced emergency releases during the peak of an intense urban EPF event. For example, during the 2015 EPF event, around one-third of the peak inflow resulted from Chembarambakkam reservoir releases (Nithila Devi et al., 2019; Nithila Devi and Kuiry, 2024). As such, timely regulation of the initial reservoir storage ahead of the rainfall event could have reduced reservoir outflows by 30 % while delaying the flood peak (Panchanthan et al., 2020). Accurate rainfall forecasting at an urban basin scale is important for making timely decisions regarding reservoir storage or release. Thus, our results illustrate that using a coupled atmospheric-CCN-hydrologic-hydraulic framework can have substantial improvement in the water resources management perspective of megacities.
While this investigation elucidates the pivotal influence of urban-scale CCN in EPF during the 2015 Chennai event, these findings pertain to a single case. This is mainly due to the formidable computational and time requirements of EPF modeling as high-resolution WRF simulations, comprehensive 9-member physics-aerosol ensembles, and computationally exhaustive LES simulations, requiring 100s of core-days per event including regional physics parameterization optima and nested domain configuration. Future studies should systematically examine the robustness of this modeling framework across climatologically diverse EPF archetypes (e.g., Mumbai 2005, Kochi 2018, etc.) to rigorously understand aerosols' role in urban flooding management.
The three-hourly aerosol mixing ratio data for the period 2003–2017 were obtained from the Global Modeling and Assimilation Office (GMAO) through the MERRA-2 dataset (inst3_3d_aer_Nv; https://doi.org/10.5067/LTVB4GPCOTK2, GMAO, 2015). Rainfall data were obtained from the IMERG satellite data (Huffman et al., 2023; https://doi.org/10.5067/GPM/IMERG/3B-HH/07). The accumulated rainfall data used in this study are publicly available on Zenodo https://doi.org/10.5281/zenodo.17897013 (Paul, 2026).
The supplement related to this article is available online at https://doi.org/10.5194/nhess-26-3749-2026-supplement.
CS conceived the study along with OP, SNK and KLS. OP and NND performed the simulations. OP analysed the atmospheric results whereas hydrologic-hydraulic results were analysed by NND. OP and NND prepared the first draft. All authors helped in finalizing the manuscript writing.
The contact author has declared that none of the authors has any competing interests.
Publisher's note: Copernicus Publications remains neutral with regard to jurisdictional claims made in the text, published maps, institutional affiliations, or any other geographical representation in this paper. The authors bear the ultimate responsibility for providing appropriate place names. Views expressed in the text are those of the authors and do not necessarily reflect the views of the publisher.
The authors gratefully acknowledge the Asia-Pacific Network for Global Change Research (APN) for supporting this study. The authors also acknowledge the NASA Goddard Earth Sciences Data and Information Services Center (GES DISC), the Global Modeling and Assimilation Office (GMAO), and the National Centre for Medium Range Weather Forecasting (NCMRWF) for the IMERG, MERRA-2, and IMDAA datasets, respectively. The authors thank the editor and the reviewers for their insightful comments and valuable suggestions, which improved the quality of this paper.
This research has been supported by the Asia-Pacific Network for Global Change Research (grant no. CRRP2022-08MY-Sarangi).
This paper was edited by Leonard K. Amekudzi and reviewed by Mirela-Adriana Anghelache and one anonymous referee.
Barros, A. P., Shrestha, P., Chavez, S., and Duan, Y.: Modeling aerosol-cloud-precipitation interactions in mountainous regions: Challenges in the representation of indirect microphysical effects with impacts at subregional scales, in: Rainfall-extremes, distribution and properties, IntechOpen, https://doi.org/10.5772/intechopen.80025, 2018.
Boyaj, A., Ashok, K., Ghosh, S., Devanand, A., and Dandu, G.: The Chennai extreme rainfall event in 2015: The Bay of Bengal connection, Clim. Dynam., 50, 2867–2879, https://doi.org/10.1007/s00382-017-3778-7, 2018.
Brown, J. D., Spencer, T., and Moeller, I.: Modeling storm surge flooding of an urban area with particular reference to modeling uncertainties: A case study of Canvey Island, United Kingdom, Water Resour. Res., 43, W06402, https://doi.org/10.1029/2005WR004597, 2007.
Buchard, V., Randles, C. A., da Silva, A. M., Darmenov, A., Colarco, P. R., Govindaraju, R., Ferrare, R., Hair, J., Beyersdorf, A. J., Ziemba, L. D., and Yu, H.: The MERRA-2 aerosol reanalysis, 1980 onward. Part II: Evaluation and case studies, J. Climate, 30, 6851–6872, https://doi.org/10.1175/JCLI-D-16-0613.1, 2017.
Chakraborty, A.: A synoptic-scale perspective of heavy rainfall over Chennai in November 2015, Curr. Sci., 111, 201–207, https://doi.org/10.18520/cs/v111/i1/201-207, 2016.
Chen, F. and Dudhia, J.: Coupling an advanced land surface–hydrology model with the Penn State–NCAR MM5 modeling system. Part I: Model implementation and sensitivity, Mon. Weather Rev., 129, 569–585, https://doi.org/10.1175/1520-0493(2001)129<0569:CAALSH>2.0.CO;2, 2001.
Global Modeling and Assimilation Office (GMAO): MERRA-2 inst3_3d_aer_Nv: 3d, 3-Hourly, Instantaneous, Model-Level, Assimilation, Aerosol Mixing Ratio V5.12.4, NASA GES DISC, Earth data [data set], https://doi.org/10.5067/LTVB4GPCOTK2, 2015.
Ghosh, S., Karmakar, S., Saha, A., Mohanty, M. P., Ali, S., Raju, S. K., Krishnakumar, V., Sebastian, M., Behera, M. R., Ashrit, R., Murty, P. L. N., Srinivas, K., Narasimhan, B., Usha, T., Murthy, M. V. R., Thiruvengadam, P., Indu, J., Thirumalaivasan, D., George, J. P., Gedam, S., Inamdar, A. B., Murty, B. S., Mujumdar, P. P., Mohapatra, M., Bhardwaj, A., Basu, S., and Nayak, S.: Development of India's first integrated expert urban flood forecasting system for Chennai, Curr. Sci., 117, 741–745, https://www.jstor.org/stable/27138336 (last access: 15 January 2026), 2019.
Gomez, M., Sharma, S., Reed, S., and Mejia, A.: Skill of ensemble flood inundation forecasts at short- to medium-range timescales, J. Hydrol., 568, 207–220, https://doi.org/10.1016/j.jhydrol.2018.10.063, 2019.
Goswami, B. N., Venugopal, V., Sengupta, D., Madhusoodanan, M. S., and Xavier, P. K.: Increasing trend of extreme rain events over India in a warming environment, Science, 314, 1442–1445, https://doi.org/10.1126/science.1132027, 2006.
Grell, G. A. and Freitas, S. R.: A scale and aerosol aware stochastic convective parameterization for weather and air quality modeling, Atmos. Chem. Phys., 14, 5233–5250, https://doi.org/10.5194/acp-14-5233-2014, 2014.
Hazra, A., Chaudhari, H. S., Ranalkar, M., and Chen, J. P.: Role of interactions between cloud microphysics, dynamics and aerosol in the heavy rainfall event of June 2013 over Uttarakhand, India, Q. J. Roy. Meteor. Soc., 143, 986–998, https://doi.org/10.1002/qj.2983, 2017.
Huffman, G. J., Stocker, E. F., Bolvin, D. T., Nelkin, E. J., and Tan, J.: GPM IMERG Final precipitation L3 half hourly 0.1° × 0.1° V07, Goddard Earth Sciences Data and Information Services Center (GES DISC), Greenbelt, MD, Earth data [data set], https://doi.org/10.5067/GPM/IMERG/3B-HH/07, 2023.
Hunter, N. M., Bates, P. D., Neelz, S., Pender, G., Villanueva, I., Wright, N. G., Liang, D., Falconer, R. A., Lin, B., Waller, S., Crossley, A. J., and Mason, D. C.: Benchmarking 2D hydraulic models for urban flooding, Proc. Inst. Civ. Eng. Water Manag., 161, 13–30, https://doi.org/10.1680/wama.2008.161.1.13, 2008.
Konduru, R. T., Mrudula, G., Singh, V., Srivastava, A. K., and Singh, A. K.: Unravelling the causes of 2015 winter monsoon extreme rainfall and floods over Chennai: Influence of atmospheric variability and urbanization on the hydrological cycle, Urban Clim., 47, 101395, https://doi.org/10.1016/j.uclim.2022.101395, 2023.
Kuiry, S. N., Sen, D., and Bates, P. D.: Coupled 1D–Quasi-2D flood inundation model with unstructured grids, J. Hydraul. Eng., 136, 493–506, https://doi.org/10.1061/(ASCE)HY.1943-7900.0000211, 2010.
Kusaka, H. and Kimura, F.: Coupling a Single-Layer Urban Canopy Model with a Simple Atmospheric Model: Impact on Urban Heat Island Simulation for an Idealized Case, J. Meteorol. Soc. Jpn., 82, 67–80, 2004.
Kusaka, H., Kondo, H., Kikegawa, Y., and Kimura, F.: A simple single-layer urban canopy model for atmospheric models: Comparison with multi-layer and slab models, Bound.-Lay. Meteorol., 101, 329–358, 2001.
Laakso, L., Grönholm, T., Rannik, Ü., Kosmale, M., Fiedler, V., Vehkamäki, H., and Kulmala, M.: Ultrafine particle scavenging coefficients calculated from 6 years field measurements, Atmos. Environ., 37, 3605–3613, https://doi.org/10.1016/S1352-2310(03)00326-1, 2003.
Lu, C.-H., Liu, Q., Wei, S.-W., Johnson, B. T., Dang, C., Stegmann, P. G., Grogan, D., Ge, G., Hu, M., and Lueken, M.: The Aerosol Module in the Community Radiative Transfer Model (v2.2 and v2.3): accounting for aerosol transmittance effects on the radiance observation operator, Geosci. Model Dev., 15, 1317–1329, https://doi.org/10.5194/gmd-15-1317-2022, 2022.
Lyapustin, A., Wang, Y., Korkin, S., and Huang, D.: MODIS Collection 6 MAIAC algorithm, Atmos. Meas. Tech., 11, 5741–5765, https://doi.org/10.5194/amt-11-5741-2018, 2018.
Mallinson, H. M. and Lasher-Trapp, S. G.: An investigation of hydrometeor latent cooling upon convective cold pool formation, sustainment, and properties, Mon. Weather Rev., 147, 3205–3222, https://doi.org/10.1175/MWR-D-18-0382.1, 2019.
Mishra, V. and Shah, H. L.: Hydroclimatological perspective of the Kerala flood of 2018, J. Geol. Soc. India, 92, 645–650, https://doi.org/10.1007/s12594-018-1079-3, 2018.
Mlawer, E. J., Taubman, S. J., Brown, P. D., Iacono, M. J., and Clough, S. A.: Radiative transfer for inhomogeneous atmospheres: RRTM, a validated correlated-k model for the longwave, J. Geophys. Res.-Atmos., 102, 16663–16682, https://doi.org/10.1029/97JD00237, 1997.
Nakanishi, M. and Niino, H.: Development of an improved turbulence closure model for the atmospheric boundary layer, J. Meteorol. Soc. Jpn., 87, 895–912, https://doi.org/10.2151/jmsj.87.895, 2009.
Narasimhan, B., Bhallamudi, S. M., Mondal, A., Ghosh, S., and Mujumdar, P. P.: Chennai Floods 2015: A Rapid Assessment, Interdisciplinary Centre for Water Research (ICWaR), Indian Institute of Science, Bangalore, India, https://www.cag.org.in/sites/default/files/database/chennai-floods-rapid-assessment-report_1.pdf (last access: 1 September 2025), 2016.
Nithila Devi, N. and Kuiry, S. N.: An urbanization-hydrologic-hydraulic modelling framework for short and long- term flood management strategies, PhD thesis, Indian Institute of Technology Madras, 2023.
Nithila Devi, N. and Kuiry, S. N.: Evaluation of predictive skill of short-term raw ensemble forecasts for mapping of extreme floods, in: Springer Proc., 163–173, https://doi.org/10.1007/978-981-97-6009-1_17, 2024.
Nithila Devi, N. and Kuiry, S. N.: Urbanization-informed, uncertainty-based calibration approach for simulating the impact of urbanization on flooding in a data-limited region, J. Water Clim. Change, 16, 211–229, https://doi.org/10.2166/wcc.2025.604, 2025.
Nithila Devi, N., Sridharan, B., and Kuiry, S. N.: Impact of urban sprawl on future flooding in Chennai city, India, J. Hydrol., 574, 486–496, https://doi.org/10.1016/j.jhydrol.2019.04.041, 2019.
Nithila Devi, N., Sridharan, B., Bindhu, V. M., Narasimhan, B., Bhallamudi, S. M., Bhatt, C. M., Usha, T., Vasan, D. T., and Kuiry, S. N.: Investigation of Role of Retention Storage in Tanks (Small Water Bodies) on Future Urban Flooding: A Case Study of Chennai City, India, Water, 12, 2875, https://doi.org/10.3390/w12102875, 2020.
Panchanthan, A., La Rocca, M., and Lakshmanan, E.: Significance of reservoir operation during extreme rainfall event in flood mitigation and water demand management in a metropolitan city of India: a case study , EGU General Assembly 2020, Online, 4–8 May 2020, EGU2020-6409, https://doi.org/10.5194/egusphere-egu2020-6409, 2020
Panda, J. and Rath, S. S.: Observed and Simulated Characteristics of 2015 Chennai Heavy Rain Event: Impact of Land-Use Change, SST, and High-Resolution Global Analyses, Pure Appl. Geophys., 179, 3391–3409, https://doi.org/10.1007/s00024-022-03113-w, 2022.
Pattanaik, D. R. and Rajeevan, M.: Variability of extreme rainfall events over India during southwest monsoon season, Meteorol. Appl., 17, 88–104, https://doi.org/10.1002/met.164, 2010.
Paul, O.: Accumulated rainfall data for all sensitivity experiments, Zenodo [data set], https://doi.org/10.5281/zenodo.17897013, 2026.
Phadtare, J.: Role of Eastern Ghats orography and cold pool in an extreme rainfall event over Chennai on 1 December 2015, Mon. Weather Rev., 146, 943–965, https://doi.org/10.1175/MWR-D-16-0473.1, 2018.
Rai, P. K., Sarangi, C., Arun, N., Kuiry, S. N., and Leung, L. R.: The Dichotomy of Wet and Dry Trends Over India by Aerosol Indirect Effects in CMIP5 Models, Earth's Future, 11, https://doi.org/10.1029/2022EF003266, 2023.
Rani, S. I., Arulalan, T., George, J. P., Rajagopal, E. N., Renshaw, R., Maycock, A., Barker, D. M., and Rajeevan, M.: IMDAA: High Resolution Satellite-era Reanalysis for the Indian Monsoon Region, J. Climate, https://doi.org/10.1175/JCLI-D-20-0412.1, 2021.
Rath, S. S. and Panda, J.:A Study of Near-Surface Boundary Layer Characteristics During the 2015 Chennai Flood in the Context of Urban-Induced Land Use Changes, Pure Appl. Geophys., 176, 2607–2629, https://doi.org/10.1007/s00024-018-2069-5, 2019.
Reshmi Mohan, P., Srinivas, C. V., Yesubabu, V., Baskaran, R., and Venkatraman, B.: Simulation of a heavy rainfall event over Chennai in Southeast India using WRF: Sensitivity to microphysics parameterization, Atmos. Res., 210, 83–99, https://doi.org/10.1016/j.atmosres.2018.04.005, 2018.
Roxy, M. K., Ghosh, S., Pathak, A., Athulya, R., Mujumdar, M., Murtugudde, R., Terray, P., and Rajeevan, M.: A threefold rise in widespread extreme rain events over central India, Nat. Commun., 8, 708, https://doi.org/10.1038/s41467-017-00744-9, 2017.
Sarangi, C., Tripathi, S. N., Kanawade, V. P., Koren, I., and Pai, D. S.: Investigation of the aerosol–cloud–rainfall association over the Indian summer monsoon region, Atmos. Chem. Phys., 17, 5185–5204, https://doi.org/10.5194/acp-17-5185-2017, 2017.
Sarangi, C., Kanawade, V. P., Tripathi, S. N., Thomas, A., and Ganguly, D.: Aerosol-induced intensification of cooling effect of clouds during Indian summer monsoon, Nat. Commun., 9, 5095, https://doi.org/10.1038/s41467-018-06015-5, 2018a.
Sarangi, C., Tripathi, S. N., Qian, Y., Kumar, S., and Leung, L. R.: Aerosol and Urban Land Use Effect on Rainfall Around Cities in Indo-Gangetic Basin From Observations and Cloud Resolving Model Simulations, J. Geophys. Res.-Atmos., 123, 3645–3667, https://doi.org/10.1002/2017JD028004, 2018b.
Schlemmer, L. and Hohenegger, C.: The formation of wider and deeper clouds as a result of cold-pool dynamics, J. Atmos. Sci., 71, 2842–2858, https://doi.org/10.1175/JAS-D-13-0170.1, 2014.
Schlemmer, L. and Hohenegger, C.: Modifications of the atmospheric moisture field as a result of cold-pool dynamics, Q. J. Roy. Meteor. Soc., 142, 30–42, https://doi.org/10.1002/qj.2625, 2016.
Schubert, J. E. and Sanders, B. F.: Building treatments for urban flood inundation models and implications for predictive skill and modeling efficiency, Adv. Water Resour., 41, 49–64, https://doi.org/10.1016/j.advwatres.2012.02.012, 2012.
Skamarock, W. C., Klemp, J. B., Dudhia, J., Gill, D. O., Barker, D. M., Duda, M. G., Huang, X.-Y., Wang, W., and Powers, J. G.: A Description of the Advanced Research WRF Version 3, NCAR Tech. Note NCAR/TN-475+STR, https://www2.mmm.ucar.edu/wrf/users/docs/attic/arw_v3_bw.pdf (last access: 15 September 2025), 2008.
Srinivas, C. V., Yesubabu, V., Hari Prasad, D., Hari Prasad, K. B. R. R., Greeshma, M. M., Baskaran, R., and Venkatraman, B.: Simulation of an extreme heavy rainfall event over Chennai, India using WRF: Sensitivity to grid resolution and boundary layer physics, Atmos. Res., 210, 66–82, https://doi.org/10.1016/j.atmosres.2018.04.014, 2018.
Tewari, M., Chen, F., Dudhia, J., Ray, P., Miao, S., Nikolopoulos, E., and Treinish, L.: Understanding the sensitivity of WRF hindcast of Beijing extreme rainfall of 21 July 2012 to microphysics and model initial time, Atmos. Res., 271, 106085, https://doi.org/10.1016/j.atmosres.2022.106085, 2022.
Thompson, G. and Eidhammer, T.: A study of aerosol impacts on clouds and precipitation development in a large winter cyclone, J. Atmos. Sci., 71, 3636–3658, https://doi.org/10.1175/JAS-D-13-0305.1, 2014.
van Oldenborgh, G. J., Otto, F. E. L., Haustein, K., and AchutaRao, K.: The Heavy Precipitation Event of December 2015 in Chennai, India, B. Am. Meteorol. Soc., 97, S87–S91, https://doi.org/10.1175/BAMS-D-16-0129.1, 2016.
Virtanen, P., Gommers, R., Oliphant, T. E., Haberland, M., Reddy, T., Cournapeau, D., Burovski, E., Peterson, P., Weckesser, W., Bright, J., van der Walt, S. J., Brett, M., Wilson, J., Millman, K. J., Mayorov, N., Nelson, A. R. J., Jones, E., Kern, R., Larson, E., Carey, C. J., Polat, İ., Feng, Y., Moore, E. W., VanderPlas, J., Laxalde, D., Perktold, J., Cimrman, R., Henriksen, I., Quintero, E. A., Harris, C. R., Archibald, A. M., Ribeiro, A. H., Pedregosa, F., van Mulbregt, P., Vázquez-Baeza, Y., and SciPy 1.0 Contributors: SciPy 1.0: Fundamental algorithms for scientific computing in Python, Nat. Methods, 17, 261–272, https://doi.org/10.1038/s41592-019-0686-2, 2020.
Zou, Y. L., Hu, F. L., Zhou, C. C., Li, C. L., and Dunn, K. J.: Analysis of radial basis function interpolation approach, Appl. Geophys., 10, 397–410, https://doi.org/10.1007/s11770-013-0407-z, 2013.