
the Creative Commons Attribution 4.0 License.
the Creative Commons Attribution 4.0 License.
 | 28 Jul 2026

Dynamic and thermal analysis of dust storm processes based on vertical observation data
Yifei Wang
Yongqiang Liu
Mayibaier Maihamuti
Fan Yang
Chenglong Zhou
Xinghua Yang
Ali Mamtimin
The Taklimakan Desert (TD) is a major dust-source region in East Asia, yet the dynamic and thermal processes associated with dust-storm development remain insufficiently understood from vertically resolved observations. This study combined dual-gradient tower observations from Tazhong (TZ) and Xiaotang (XT), ERA5 reanalysis, and backward trajectories calculated with the Hybrid Single-Particle Lagrangian Integrated Trajectory (HYSPLIT) model to examine eight dust-storm events in spring and summer 2024. Three main pre-storm airflow pathways were identified: east-inflow transport through the northeastern Tarim Basin, mountain-crossing transport across the Tianshan–Pamir region, and south-to-north transport across the Tibetan Plateau and Kunlun Mountains. ERA5 anomaly diagnostics show that spring events maintained stronger mean sea-level pressure-gradient and 850 hPa geopotential-height-gradient anomalies throughout the pre-onset period, while 10 m wind-speed anomalies increased rapidly after approximately −12 h. In contrast, summer events showed stronger thermal signals before approximately −18 h, including enhanced surface–air temperature contrast, positive net shortwave radiation anomalies, and boundary-layer growth. Tower observations further indicate stronger summer warming and closer-to-onset wind-speed and wind-shear enhancement. Differences between TZ and XT suggest that local terrain modulates the near-surface response to regional dynamic and thermal forcing. These eight cases provide observational evidence that spring and summer dust-storm processes in the TD may differ in their dominant dynamic and thermal preconditioning.
- Article
(16570 KB) - Full-text XML
-
Supplement
(383 KB) - BibTeX
- EndNote


Dust storms are among the major natural hazards in arid and semi-arid regions of East Asia, where they are often accompanied by strong winds, air pollution, and reduced visibility, affecting transportation, agriculture, ecosystems, and public health (Achakulwisut et al., 2018; Bao and Fang, 2007; Manisalidis et al., 2020; Shao and Dong, 2006; Tong et al., 2023; Wen et al., 2024). Mineral dust can also influence atmospheric radiation, cloud processes, snow and ice albedo, and regional climate through long-range transport (Kok et al., 2023; Prospero, 1999).
The Taklimakan Desert (TD) is located in the arid Tarim Basin and is surrounded by the Tianshan, Pamir, and Kunlun Mountains. Because of its extensive mobile sand surfaces, scarce precipitation, and unique basin topography, the TD is one of the major dust-source regions in East Asia (Ge et al., 2014; Shao and Dong, 2006; Wang et al., 2015; Xu et al., 2020; Yang et al., 2016; Zhang et al., 2025).
The formation and development of dust storms are jointly controlled by atmospheric forcing and surface conditions. Among these controls, dynamic and thermal processes are particularly important because they determine whether surface particles can be lifted and whether the lifted dust can be transported vertically and horizontally (Bi et al., 2022; Su et al., 2024; Zhang et al., 2024). Dynamic forcing, represented by pressure-gradient-driven winds, cold fronts, cyclones, and low-level jets, provides the direct momentum for dust emission (Gillette and Passi, 1988; Shao and Dong, 2006; Xu et al., 2020). Thermal forcing, mainly associated with strong surface heating, boundary-layer growth, turbulent mixing, and land–atmosphere temperature contrasts, can enhance vertical exchange and promote dust uplift, especially over inland deserts with intense surface heating (Wang et al., 2025; Xiong et al., 2023). Surface factors such as particle-size distribution, soil moisture, vegetation cover, and aerodynamic roughness further regulate the threshold and intensity of dust emission (Iversen and White, 1982; Marticorena and Bergametti, 1995; Raupach, 1992; Shao and Dong, 2006). Therefore, dust-storm processes cannot be explained by a single factor alone, but should be examined through the coupled effects of dynamic forcing, thermal instability, transport pathways, and terrain-modified local surface conditions.
Previous studies have shown that dynamic forcing is a key driver of many spring dust storms in East Asia. Mongolian cyclones, cold fronts, cold high-pressure systems, and strong pressure gradients can generate strong near-surface winds and rapidly activate dust sources over Mongolia, northern China, and the Tarim Basin (Gao et al., 2024; Liu et al., 2004; Wang et al., 2009; Xu et al., 2020). Chen et al. (2023a) showed that severe dust events in northern China during March and April 2023 were closely related to cold fronts and Mongolian cyclones, with Mongolia and the Taklimakan Desert both contributing substantially to dust concentrations. Li et al. (2023) further demonstrated that dust radiative feedback can influence the intensity and movement of Mongolian cyclones and cold fronts, indicating that dust storms are not only a response to weather systems but may also interact with them. More recently, Mu and Fiedler (2025) quantitatively assessed the role of atmospheric depressions and Mongolian cyclones in spring dust activity over East Asia and found that Mongolian cyclones are a key driver of high-impact dust events. These studies highlight the importance of synoptic-scale dynamic forcing in East Asian dust-storm development. However, many of them focus on northern China and the Gobi source region, whereas the pre-storm dynamic evolution over the Taklimakan Desert, especially its connection with local tower-based observations, remains less well documented.
Compared with the relatively well-recognized role of dynamic forcing, the influence of thermal forcing is more complex and is particularly important for inland desert regions such as the TD. Strong solar heating over mobile sand surfaces can increase the surface–air temperature difference, deepen the atmospheric boundary layer, enhance turbulent mixing, and create favorable conditions for vertical dust uplift (Chen et al., 2023b; Xiong et al., 2023; Yuan et al., 2019; Zhang et al., 2025). Yuan et al. (2019) investigated the influence of dynamic and thermal forcing on the meridional transport of Taklimakan dust in spring and summer and emphasized that seasonal differences in dust transport are closely linked to changes in forcing mechanisms. Chen et al. (2023b) used WRF-Chem simulations to investigate the radiative effects of dust aerosols on weather conditions and dust transport over the TD. Their results suggested that dust–radiation interactions can modify temperature, wind fields, and vertical dust transport, indicating the potential importance of thermal feedbacks in dust-storm evolution. Zhang et al. (2025) further indicated that spring Taklimakan dust transported toward the Tibetan Plateau is controlled by circulation patterns, dynamic lifting, thermal anomalies, and terrain effects. These findings suggest that distinguishing between dynamic and thermal controls is useful for understanding seasonal differences in dust-storm development. Nevertheless, how these seasonal differences are reflected in near-surface wind, temperature, and vertical meteorological profiles still requires further observational evidence, particularly from direct comparisons between spring and summer events.
Transport pathways provide an important way to connect dynamic and thermal forcing with dust-storm evolution. They reflect not only where air masses and dust originate, but also how synoptic circulation, basin-scale airflow, and thermal lifting organize dust movement before and during dust storms. Kai and Huiwang (2007) identified major East Asian dust transport pathways toward eastern China, Korea, Japan, the western Pacific, and Central Asia. Bao et al. (2023) examined East Asian dust sources and transport ranges from 1980–2020 using ground observations and remote sensing data, and showed that southern Mongolia and the Taklimakan Desert are major source areas. For the TD, Aili et al. (2021) found that air masses during the dusty season at the northeastern desert margin mainly originated from the eastern and southern parts of the desert, indicating the importance of intra-basin transport. Aili et al. (2024) further used HYSPLIT trajectories to establish an early-warning framework for dusty weather in peri-desert regions of the TD. These studies demonstrate the value of trajectory analysis, but pathway classification alone cannot fully explain why different dust storms develop under different dynamic or thermal backgrounds.
Topography further modifies dust-storm occurrence, transport, and near-surface wind and temperature structures. The TD is enclosed by high mountains and connected to surrounding regions through limited basin openings, so airflow pathways are strongly constrained by terrain. The Tarim Basin and surrounding mountain systems can channel near-surface winds, favor dust accumulation within the basin, and promote vertical lifting under suitable dynamic and thermal conditions (Sun and Liu, 2006; Xing et al., 2024; Yuan et al., 2019; Zhang et al., 2025). Thus, topography is closely linked to both transport pathways and dynamic–thermal forcing rather than being only a static background condition. At the local scale, dune relief and underlying-surface differences can alter wind profiles, near-surface thermal structure, and sediment availability (Aili et al., 2023).
2.1 Study Area
The TD is located within the Tarim Basin in the southwestern part of the Xinjiang Uyghur Autonomous Region in China. It is the second-largest shifting sand desert in the world. Surrounded by mountain ranges such as the Tianshan and Kunlun Mountains, the region experiences a highly arid climate. Key characteristics of the desert include its remoteness from the ocean, sparse vegetation, diverse dune types with high mobility, extensive and thick shifting sand areas, and fine sand particles. This region is subject to frequent dust storms year-round and is one of the major dust-source regions in East Asia (Sun and Liu, 2006).
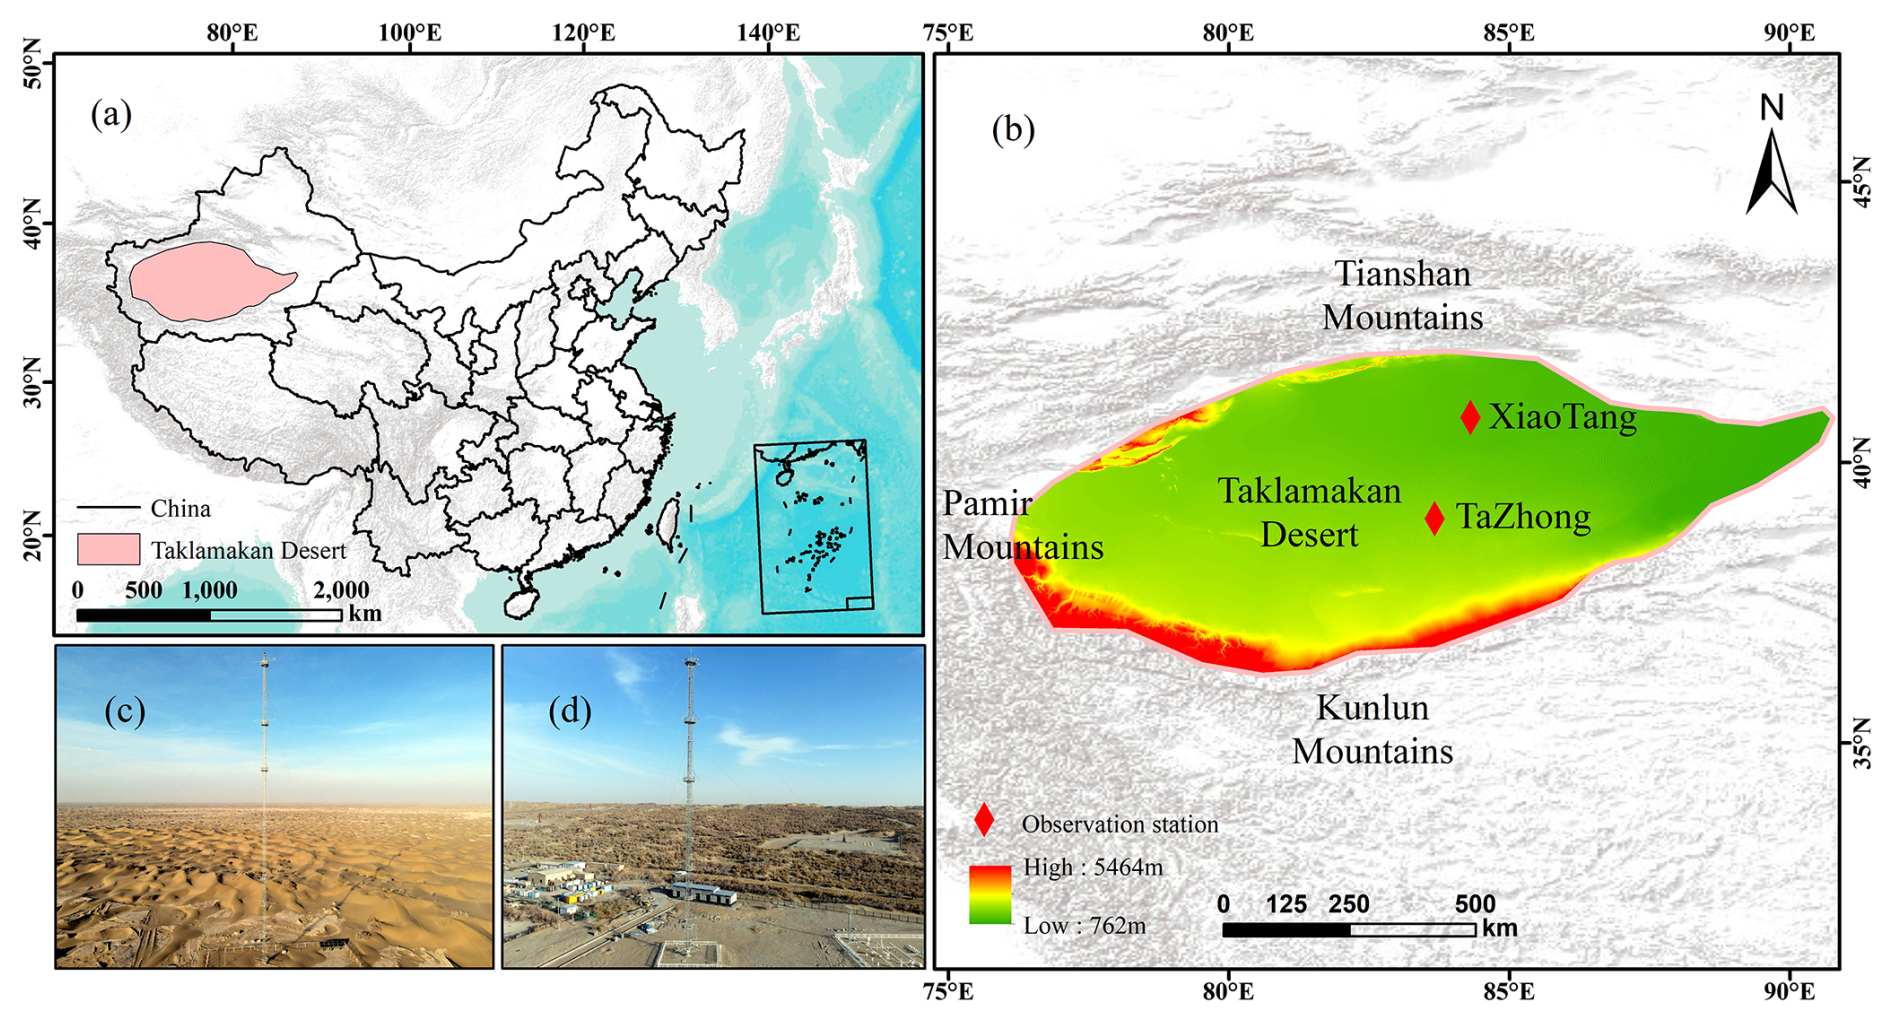
Figure 1Location and topography of the Taklimakan Desert, showing the Tazhong (TZ) and Xiaotang (XT) observation towers and site photographs. The base map was prepared using ArcGIS Online; attribution and copyright information follow the requirements of Esri and its data providers. Site photographs were taken by the authors.
2.2 Observational Data
The observational data were obtained from two stations: Xiaotang (XT), located on the northern edge of the TD, representing flat terrain, and Tazhong (TZ), situated in the desert interior, representing undulating terrain. The observation tower height is 80 m at TZ and 100 m at XT. Both stations are equipped with meteorological gradient observation systems and dust collection systems. The observation levels at TZ are 1, 2, 5, 8, 16, 24, 32, 47, 63, and 80 m, whereas those at XT are 1, 2, 5, 10, 24, 32, 47, 63, 80, and 100 m.
The meteorological gradient observation system records meteorological variables at each layer, including hourly and minute-based measurements of temperature, relative humidity, wind speed, wind direction, and atmospheric pressure. The dust collection system gathers dust samples during dust storms using BSNE dust collectors installed at each layer. In the present analysis, the meteorological gradient observations were mainly used to examine wind-speed, wind-shear, and temperature-profile responses during dust-storm development.
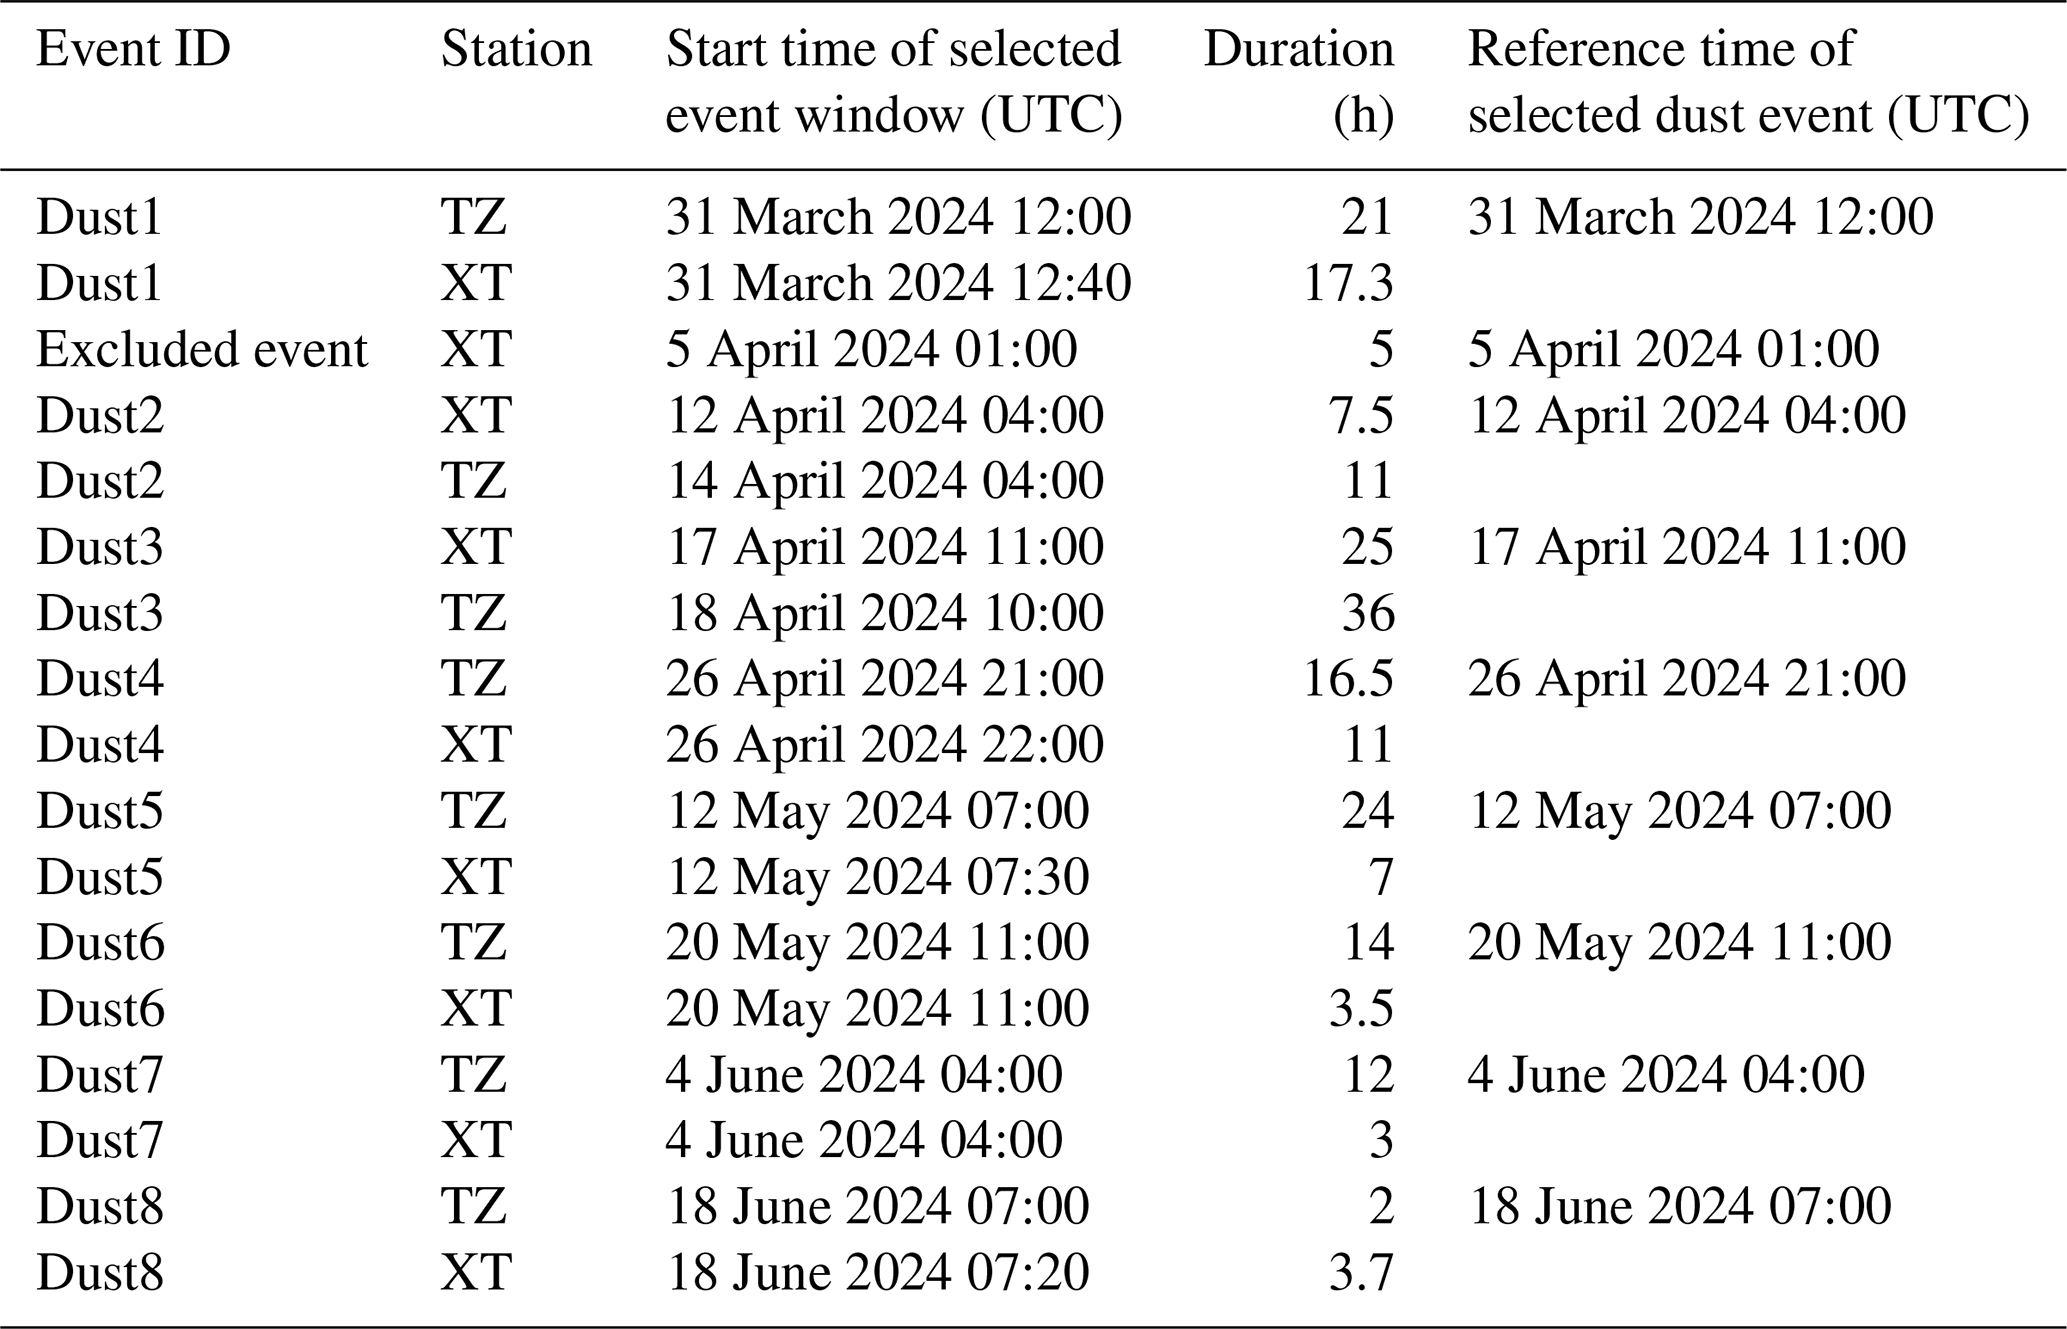
Nine dust-storm events were observed between 31 March and 18 June 2024, and the corresponding dust samples were collected from 3 April–10 July 2024 (Table 1). All times listed in Table 1 are in UTC, and duration values are rounded where necessary. The final column gives the event-level reference time used for the trajectory, ERA5, and composite analyses, rather than the exact onset time recorded at each station. When the station-recorded dust-storm onset was not exactly on the hour, the reference time was adjusted to the analysis hour. The complete station records in Beijing Time and the basis for selecting the event-level reference time are provided in Table S1 in the Supplement. During the second observation, data from TZ were missing, preventing a complete paired record; therefore, the remaining eight complete dust-storm events were used as the primary samples for this study.
Table 1Summary of observed dust-storm events and sample collection information.
To reduce the influence of seasonal variation and diurnal cycles on the station-based meteorological profiles, a background-removal procedure was applied to the observational data from both TZ and XT. For each dust-storm event, observation height, and variable, the background value was calculated separately for the two stations using records from 2023 and 2025. Specifically, for a given observation time in 2024, all available records at the same hour of the day within a ±15 d calendar window in 2023 and 2025 were averaged to represent the corresponding background state. The anomaly was then obtained by subtracting this station-specific background value from the observed value during the 2024 dust-storm process. This approach reduces the effects of normal seasonal progression and daily temperature or wind-speed cycles, allowing the analysis to focus on meteorological anomalies directly associated with dust-storm development.
2.3 ERA5 Reanalysis Data
To further investigate the meteorological conditions associated with dust-storm occurrence, this study used the ERA5 reanalysis dataset. ERA5, provided by the European Centre for Medium-Range Weather Forecasts (ECMWF), is the fifth generation of global atmospheric reanalysis data, with a spatial resolution of 0.25°×0.25° and a temporal resolution of 1 h.
In this study, ERA5 data were used in two ways. First, the original ERA5 fields were used to describe the synoptic-scale meteorological background before and during each dust-storm event. Mean sea-level pressure, 10 m wind vectors, 2 m air temperature, and 850 hPa geopotential height were selected to characterize pressure configuration, near-surface airflow, thermal background, and lower-tropospheric circulation around the Taklamakan Desert. These fields were displayed over the regional domain of 70–100° E and 30–50° N.
Second, selected ERA5-derived diagnostic indicators were used for anomaly analysis after background removal. The dynamic indicators included mean sea-level pressure-gradient magnitude, 850 hPa geopotential-height-gradient magnitude, and 10 m wind speed, which together represent synoptic-scale pressure forcing, lower-tropospheric circulation contrasts, and near-surface momentum directly related to dust emission. These indicators were averaged over the regional domain of 70–100° E and 30–50° N to represent the large-scale dynamic background around the TD and its surrounding mountains. The thermal indicators included 2 m air temperature, skin temperature, surface–air temperature difference, surface net shortwave radiation, and boundary-layer height, which were used to characterize surface heating, thermal contrast, radiative forcing, and vertical mixing before dust-storm occurrence. These indicators were averaged over the Taklamakan Desert core region, which was defined using a Taklamakan Desert polygon mask within 72–92° E and 35–43° N. Grid cells outside the desert mask were excluded from the thermal averaging.
For each dust-storm event and each lead time relative to the event-level reference time, the corresponding 2024 ERA5 value was extracted. The background value was calculated from ERA5 records during 2015–2025, excluding 2024, using the same hour of the day within a ±3 d calendar window. The anomaly was then obtained by subtracting this background value from the corresponding 2024 event value. Area-mean values were calculated using latitude-weighted averaging with cos(latitude) as the weight. This treatment reduced seasonal, diurnal, and grid-area effects, allowing the analysis to focus on dynamic and thermal departures during dust-storm development.
2.4 HYSPLIT Model
The study used the Hybrid Single-Particle Lagrangian Integrated Trajectory (HYSPLIT) model to analyze the transport pathways of each dust-storm event. This model uses grid data from the Global Data Assimilation System (GDAS) dataset to compute backward trajectories (Stein et al., 2015). The GDAS1 data have a horizontal resolution of 1°×1° and a temporal interval of 3 h. Model vertical velocity was used for the vertical motion calculation.
For each event, backward trajectories were initialized at the event-level reference time listed in Table 1. The trajectory endpoint was set at 39.43° N, 85.97° E, corresponding to the observation region used in this study. Three starting heights, 100, 500, and 1500 m above ground level (a.g.l.), were selected to represent airflow transport at different lower-tropospheric levels. Each trajectory was traced backward for 48 h. The trajectory ending times for Dust1–Dust4 were 12:00 UTC on 31 March, 04:00 UTC on 12 April, 11:00 UTC on 17 April, and 21:00 UTC on 26 April 2024, respectively. For Dust5–Dust8, the corresponding times were 07:00 UTC on 12 May, 11:00 UTC on 20 May, 04:00 UTC on 4 June, and 07:00 UTC on 18 June 2024, respectively.
The method assumes that the trajectory of a particle moving within the wind field is calculated by integrating its position changes over time and space, with its vector velocity determined by linear interpolation in both space and time. The first-guess position of the air mass is calculated using the following equation:
The corrected position is then calculated as:
In Eqs. (1) and (2), P represents the initial position, P1 is the first guessed position, Δt is the time interval, and V is the velocity of the air mass or particle. The simulation was conducted online using the HYSPLIT platform provided by NOAA.
The resulting trajectories were used to characterize the main pre-storm airflow histories reaching the observation region and to support the interpretation of airflow transport pathways together with ERA5 10 m wind fields.
3.1 Dust-Storm Trajectory Analysis
As shown in Fig. 2, the HYSPLIT backward trajectories indicate that the analyzed dust-storm events were associated with three main types of pre-storm airflow transport pathways. Dust1, Dust3, Dust4, Dust5, and Dust6 mainly showed east-inflow transport, with air masses entering the TD through the northeastern opening of the Tarim Basin. Dust2 was characterized by a south-to-north pathway related to airflow crossing the Tibetan Plateau and Kunlun Mountains. Dust7 and Dust8 were associated with northwestern transport, with air masses passing over southern Russia and eastern Uzbekistan before crossing the Tianshan Mountains toward the TD.
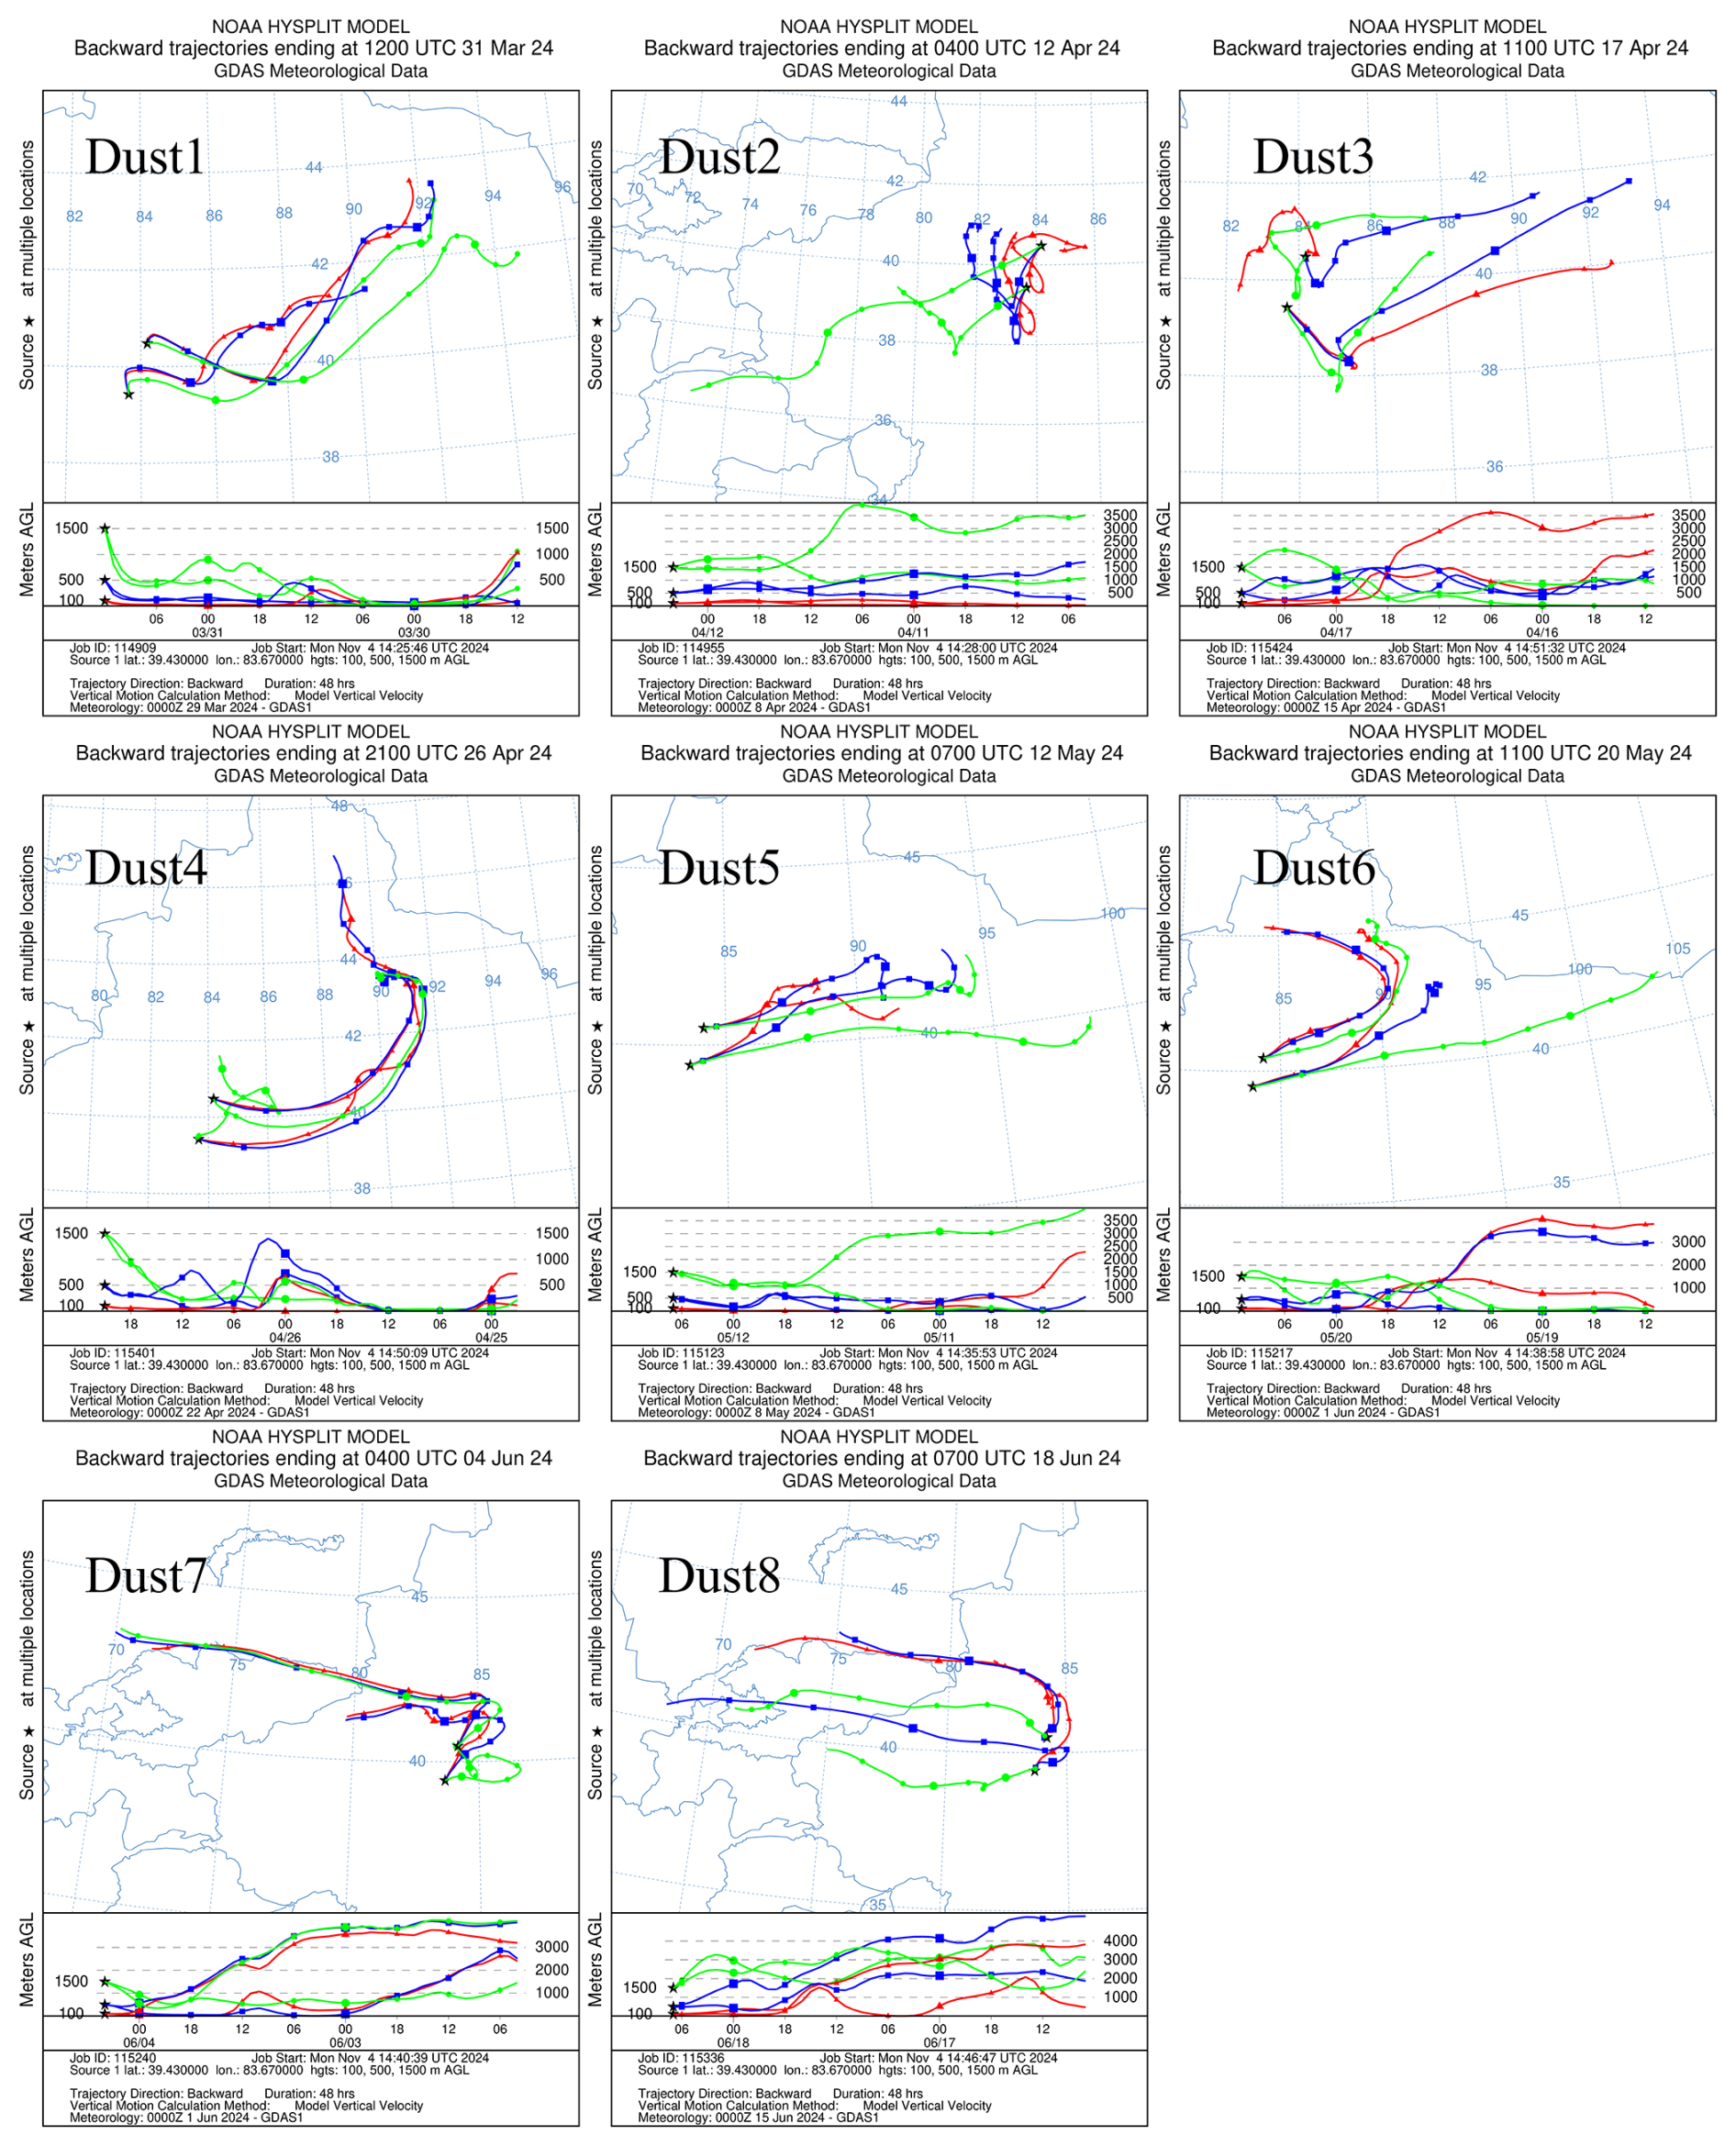
Figure 2Backward trajectories of the eight dust-storm events.
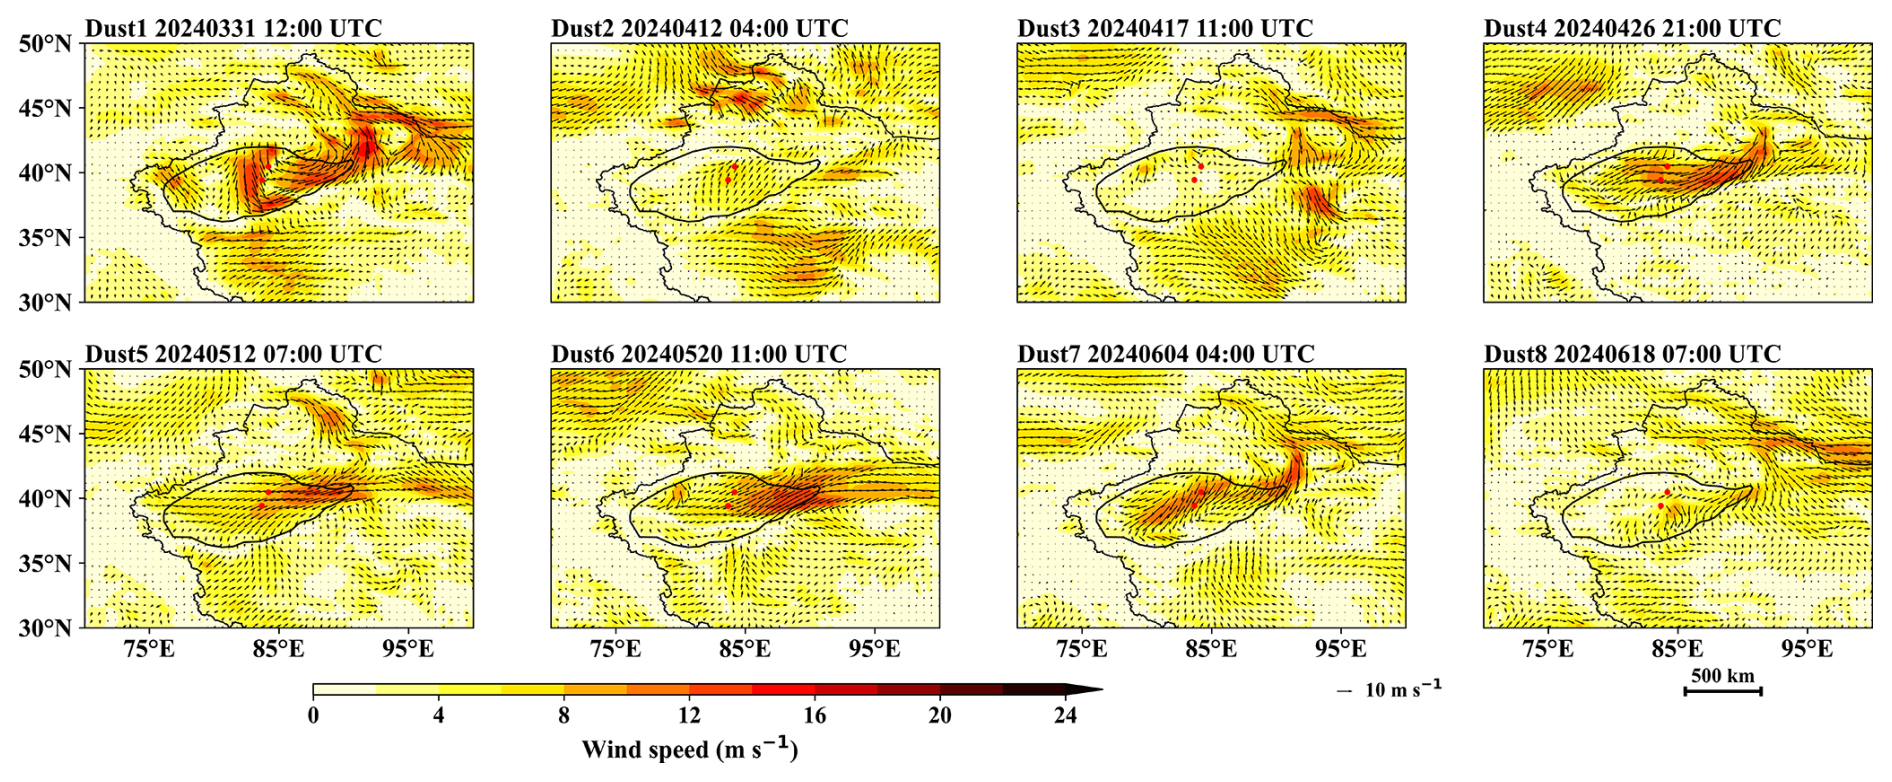
Figure 3ERA5 10 m wind-vector fields during the eight dust-storm events.
The ERA5 10 m wind fields provide regional support for the trajectory results (Fig. 3). For most east-inflow events, the near-surface wind field shows organized airflow entering the basin through the eastern or northeastern opening. For Dust7 and Dust8, part of the airflow shows a north-to-south component, consistent with mountain-crossing transport across the Tianshan Mountains. Dust2 differs from the other events, with southerly airflow from the Tibetan Plateau toward southern Xinjiang. These results suggest that the TD dust-storm events were influenced by multiple airflow pathways, among which east-inflow transport was the most frequent in the analyzed cases.
3.2 Dust-Storm Dynamic and Thermal Meteorological Background
Figure 4 shows the regional mean sea-level pressure, 850 hPa geopotential height, and 10 m wind vectors before the analyzed dust-storm events. In the spring cases, especially Dust1, Dust3, and Dust4, clearer pressure differences appear between northern Xinjiang, surrounding high-pressure regions, and the TD. These pressure and circulation patterns are consistent with the east-inflow and mountain-crossing pathways identified from the trajectory analysis. Dust2 shows a different circulation background, with more evident influence from the southern and southwestern margins of the basin, corresponding to its south-to-north transport pathway.
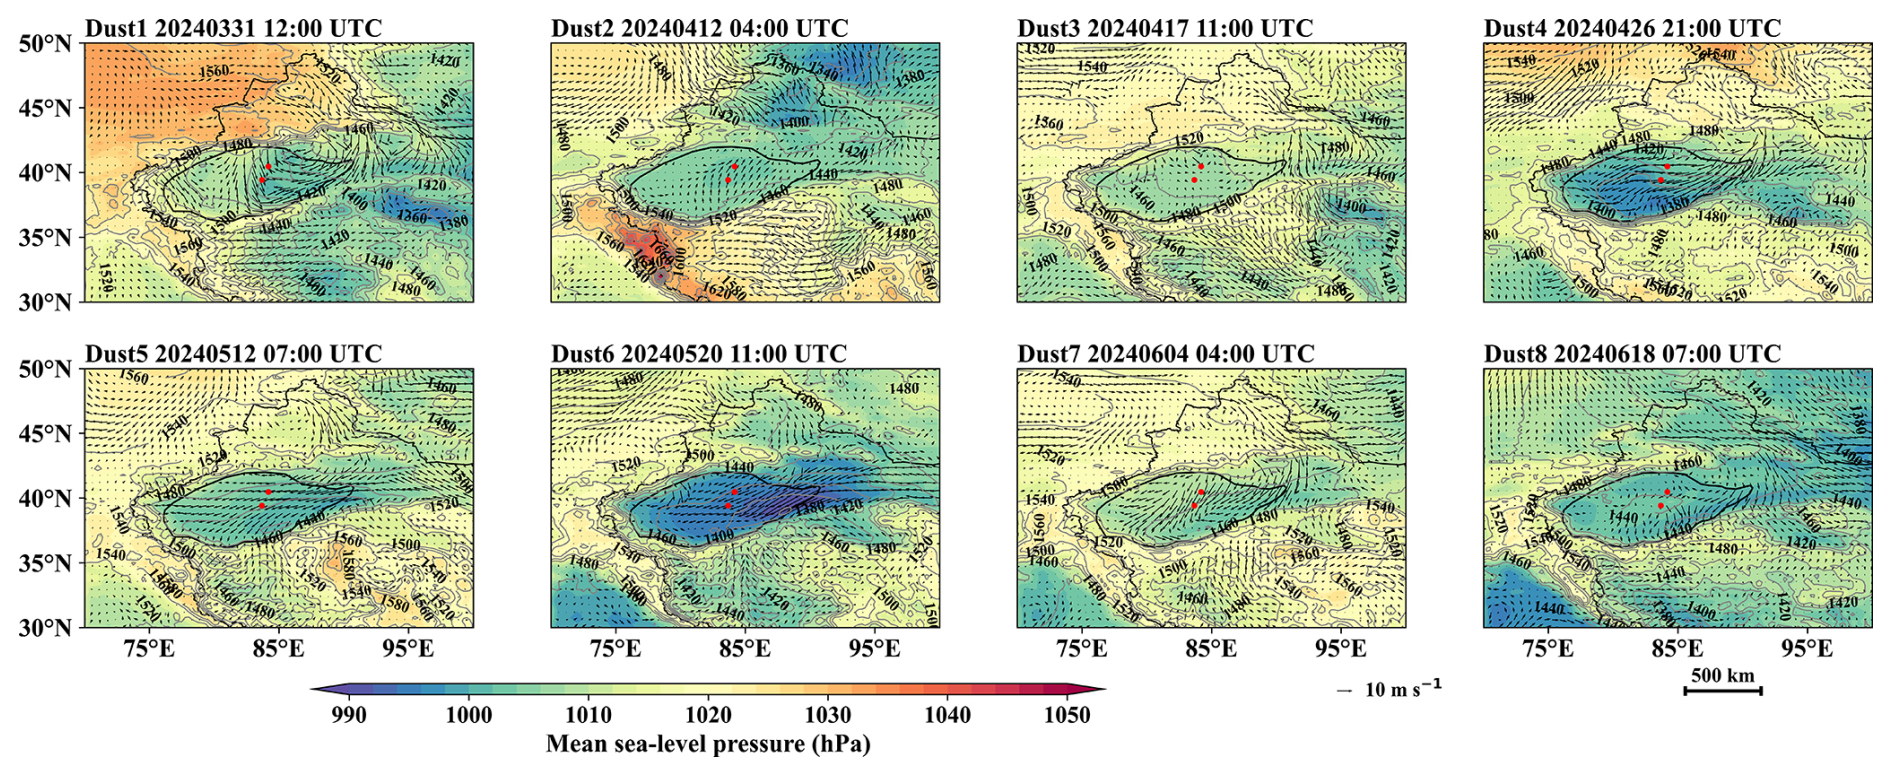
Figure 4Mean sea-level pressure, 10 m wind vectors, and 850 hPa geopotential height before the analyzed dust-storm events.
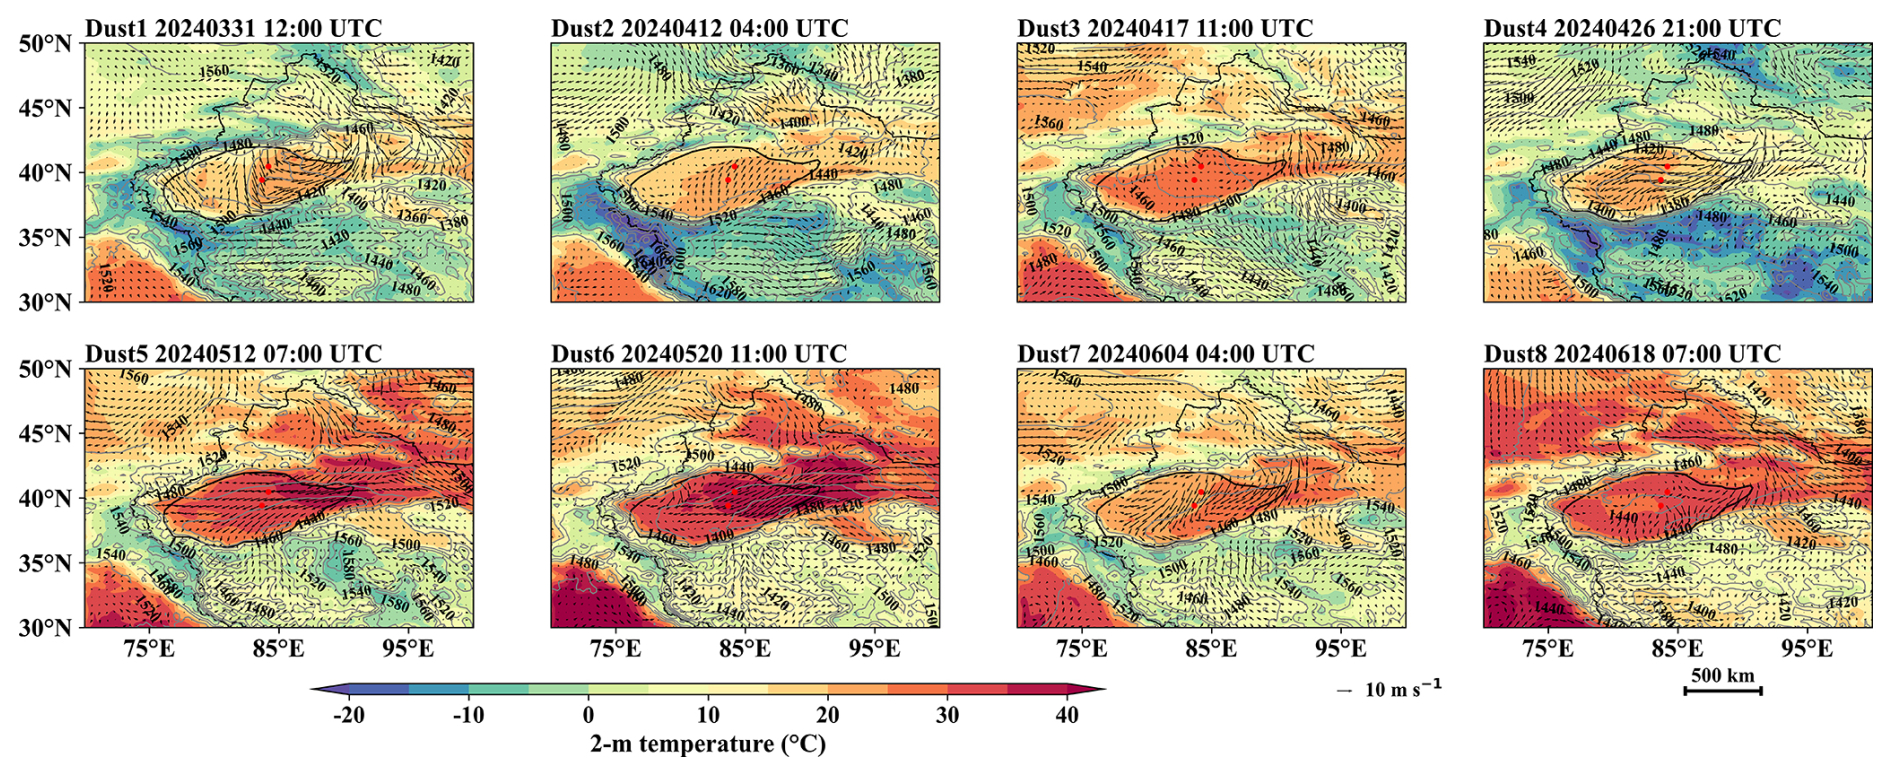
Figure 52 m air temperature, 10 m wind vectors, and 850 hPa geopotential height during the analyzed dust-storm events.
In the summer cases, especially Dust7 and Dust8, the pressure-gradient signal is weaker and the dominant wind direction is less clear from the pressure field alone. This indicates that dynamic forcing was less spatially organized than in the spring cases. At the same time, Fig. 5 shows that 2 m air temperature over the TD was higher and more spatially continuous in the May–June events. Stronger surface heating may have enhanced the surface–air temperature difference, promoted boundary-layer development, and provided favorable thermal conditions for dust mobilization.
These background fields indicate a seasonal contrast in the pre-storm environment. The March–April events were more closely associated with stronger pressure-gradient and lower-tropospheric circulation signals, whereas the May–June events showed a more evident thermal background. Therefore, the analyzed events were grouped into spring cases and summer cases for the following dynamic and thermal anomaly analysis.
3.3 Analysis of Dynamic and Thermodynamic Factors
Figures 6 and 7 show the temporal differences in sea-level pressure between the selected dust-event reference time and four lead times, namely 24, 12, 6, and 3 h before onset, for spring and summer events, respectively. For each grid cell, the difference was calculated as the sea-level pressure at the selected event reference time minus the sea-level pressure at the corresponding lead time. Therefore, positive values indicate that sea-level pressure increased from the lead time to the event reference time, whereas negative values indicate a pressure decrease over the same interval. These fields represent temporal changes relative to the selected event reference time, rather than absolute pressure anomalies.
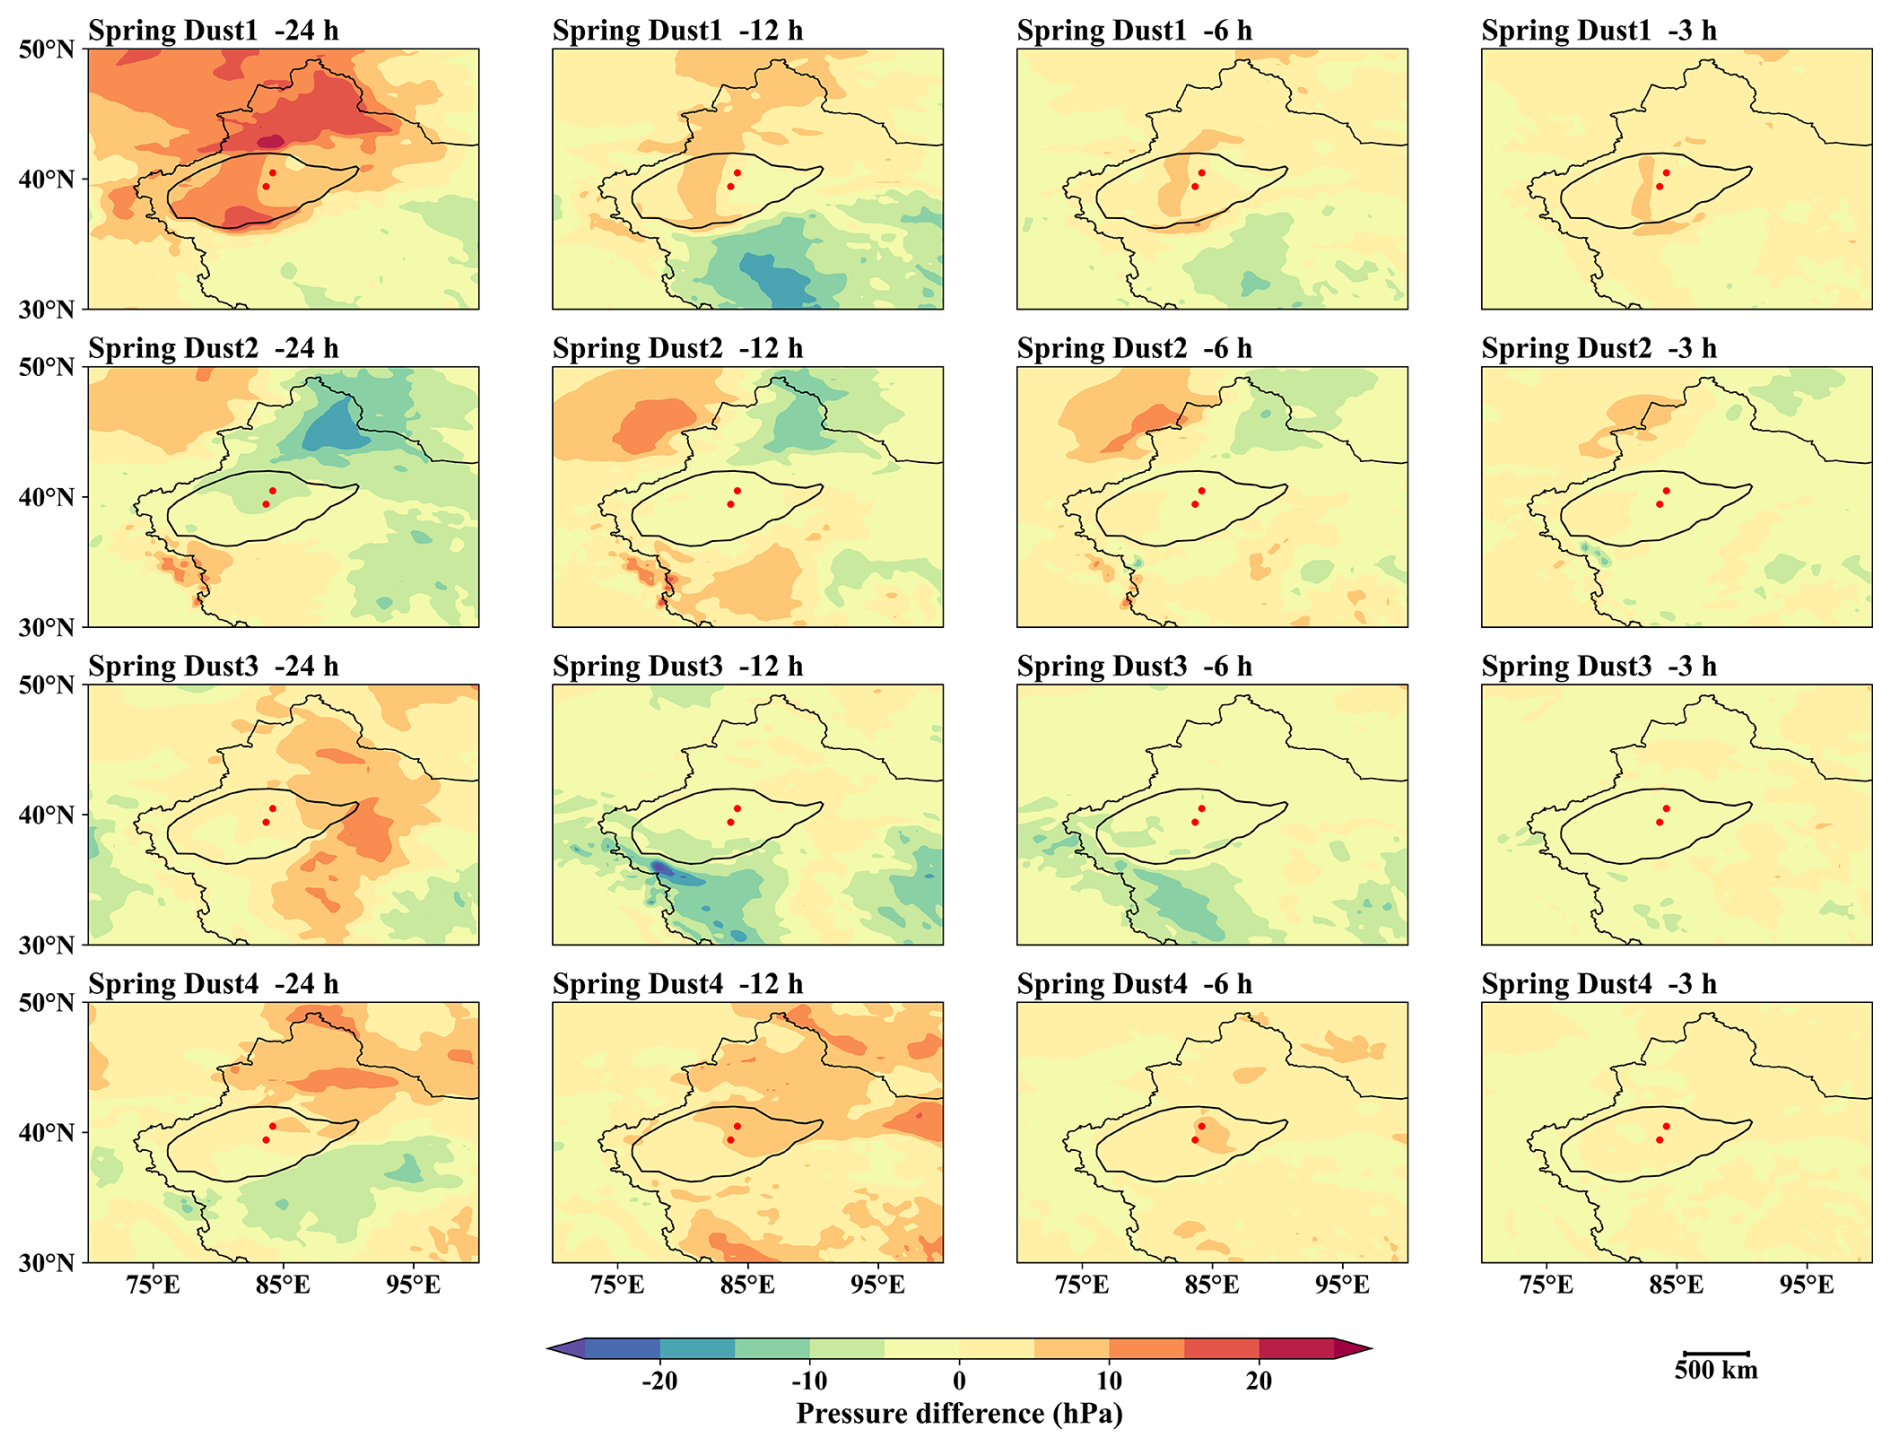
Figure 6Sea-level pressure differences before spring dust-storm onset.
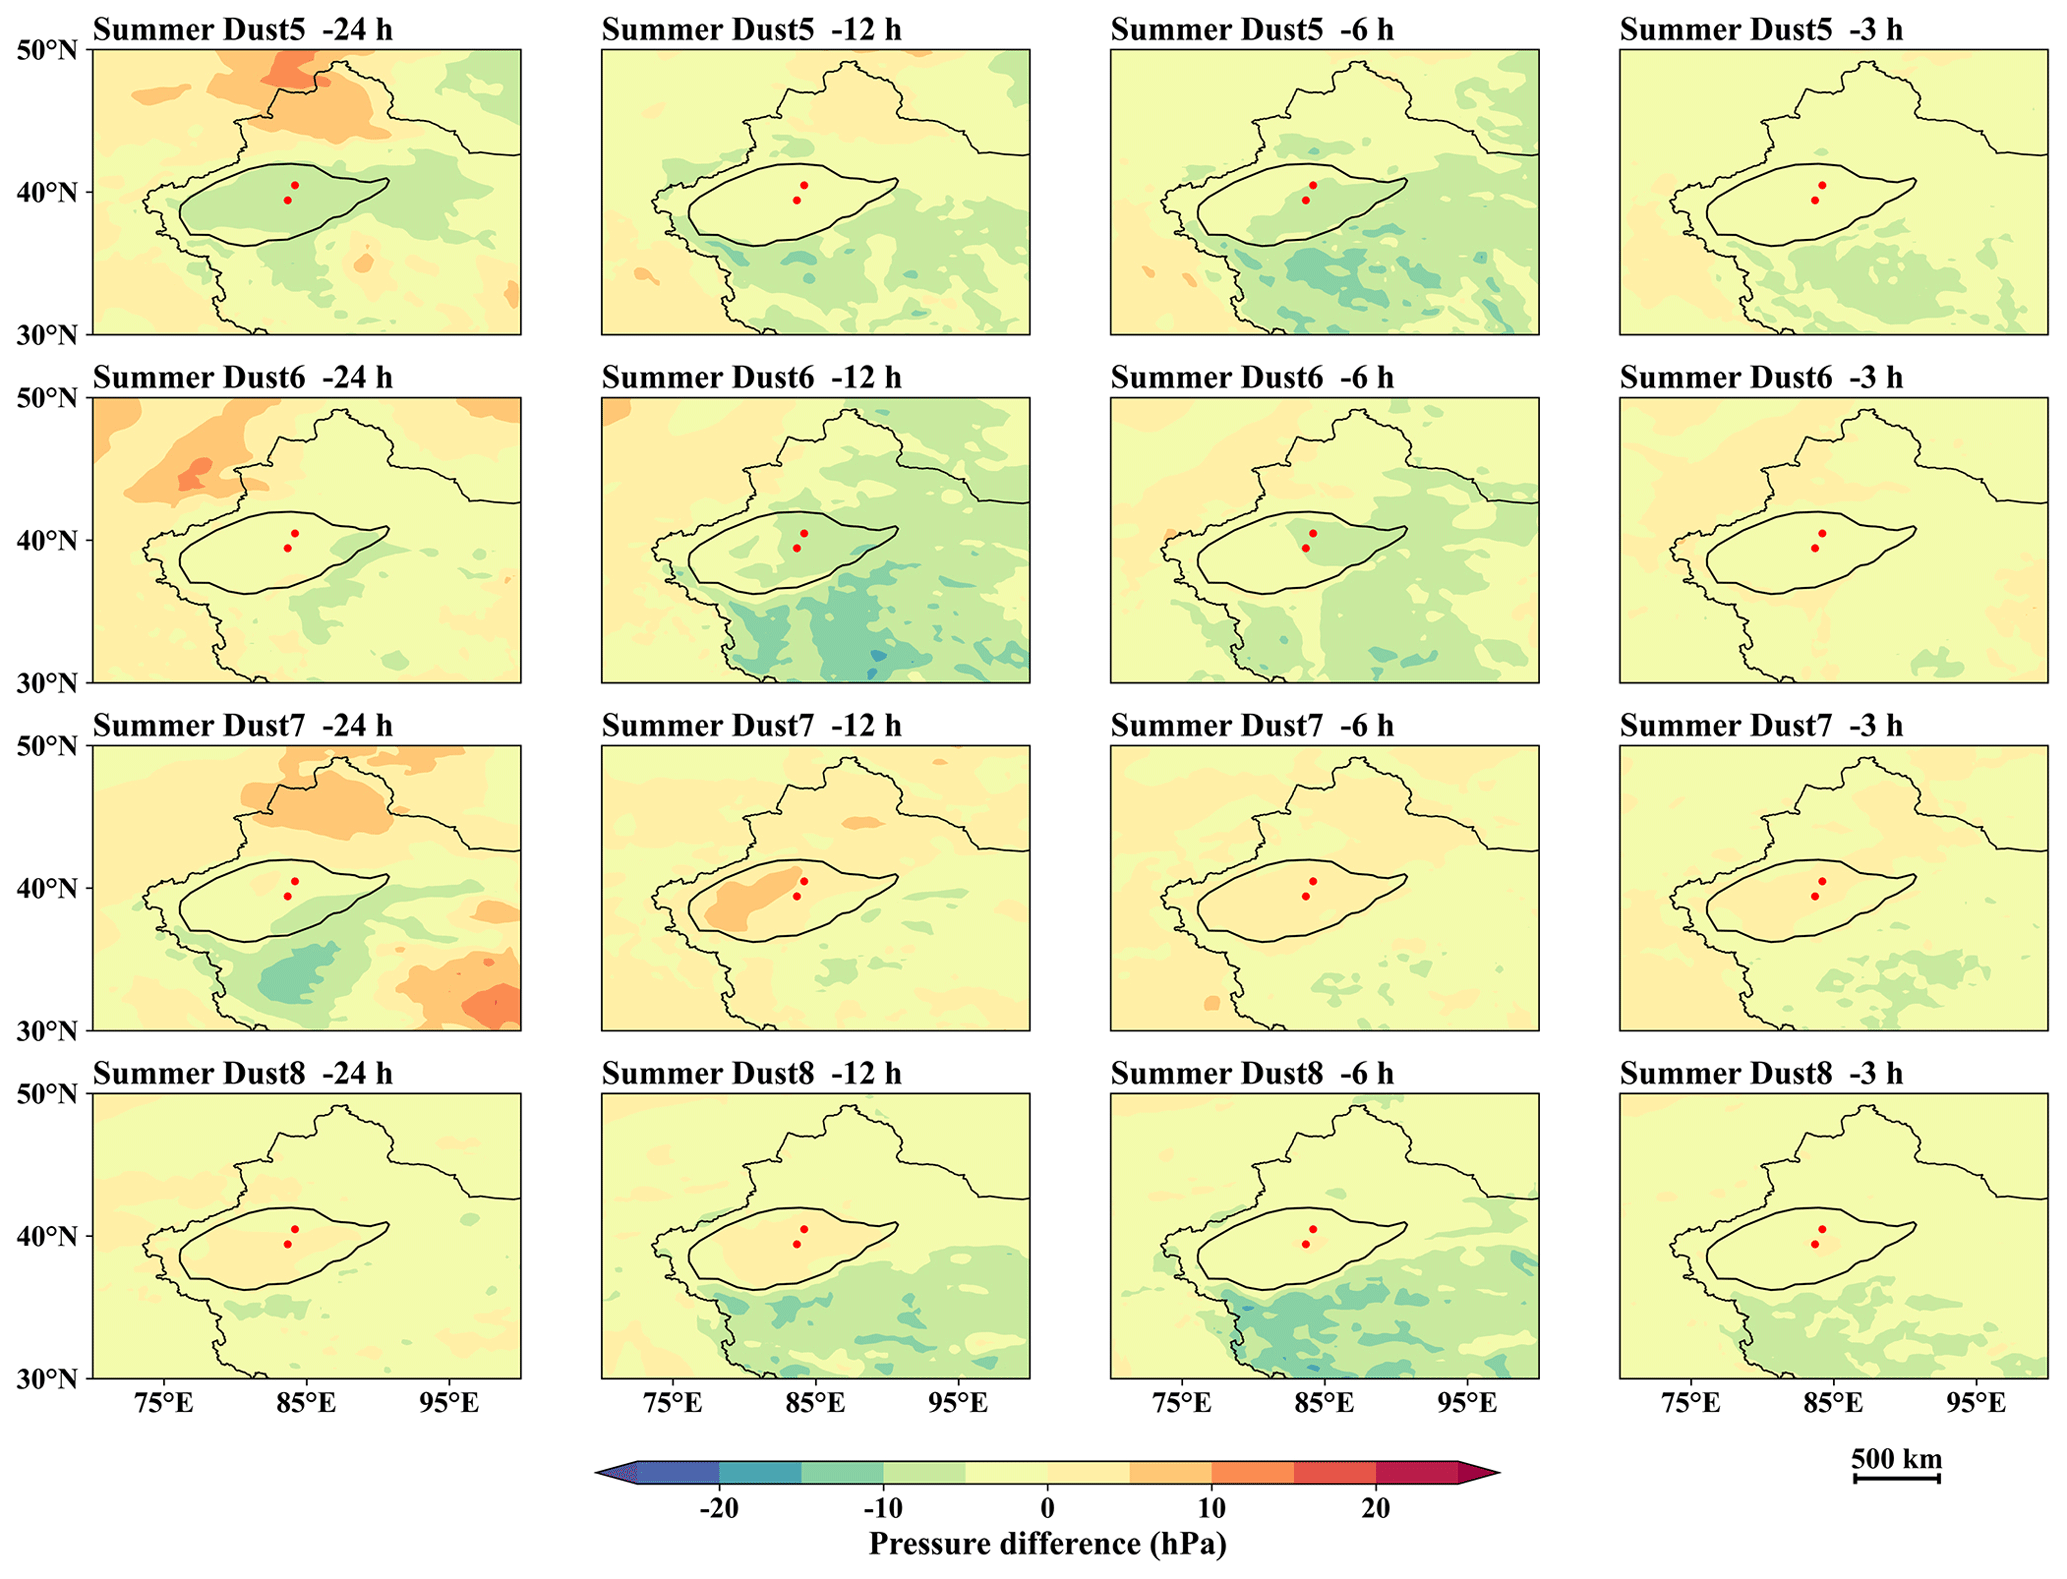
Figure 7Sea-level pressure differences before summer dust-storm onset.
In spring, the pressure-difference fields show stronger and more continuous spatial contrasts than in summer. For Dust1, Dust3, and Dust4, evident pressure changes appear around northern Xinjiang, the northern TD, or the eastern basin margin, indicating that the pressure-gradient system had already adjusted before onset. This agrees with the large-scale dynamic background described above, in which stronger pressure gradients and 850-hPa circulation differences favored airflows entering the TD through the eastern basin gap or crossing the Tianshan Mountains. Dust2 differs from the other spring cases, with more evident pressure changes along the southern and southwestern margins of the TD, corresponding to its south-to-north transport pathway across the plateau and mountain regions.
In summer, the pressure-difference fields are generally weaker and less spatially organized. Dust5 and Dust6 still show moderate pressure changes near the eastern or northeastern TD, consistent with their partial east-inflow characteristics. However, Dust7 and Dust8 show scattered and weak pressure-difference signals, suggesting that pressure-gradient forcing alone cannot explain their occurrence. This is consistent with the previous trajectory and background-field analysis, which indicated that summer dust storms were more likely affected by local thermal adjustment and boundary-layer development.
Figures 8 and 9 show the temporal changes in surface–air temperature difference between the selected dust-event reference time and the same four lead times before onset. The surface–air temperature difference was defined as skin temperature minus 2 m air temperature. For each grid cell, its temporal change was calculated as the value at the selected event reference time minus the value at each lead time. Positive values therefore indicate that the surface–air thermal contrast strengthened from the lead time to the event reference time, whereas negative values indicate that the contrast weakened over the same interval. These maps describe temporal changes in thermal contrast, rather than the absolute surface–air temperature difference at each time.
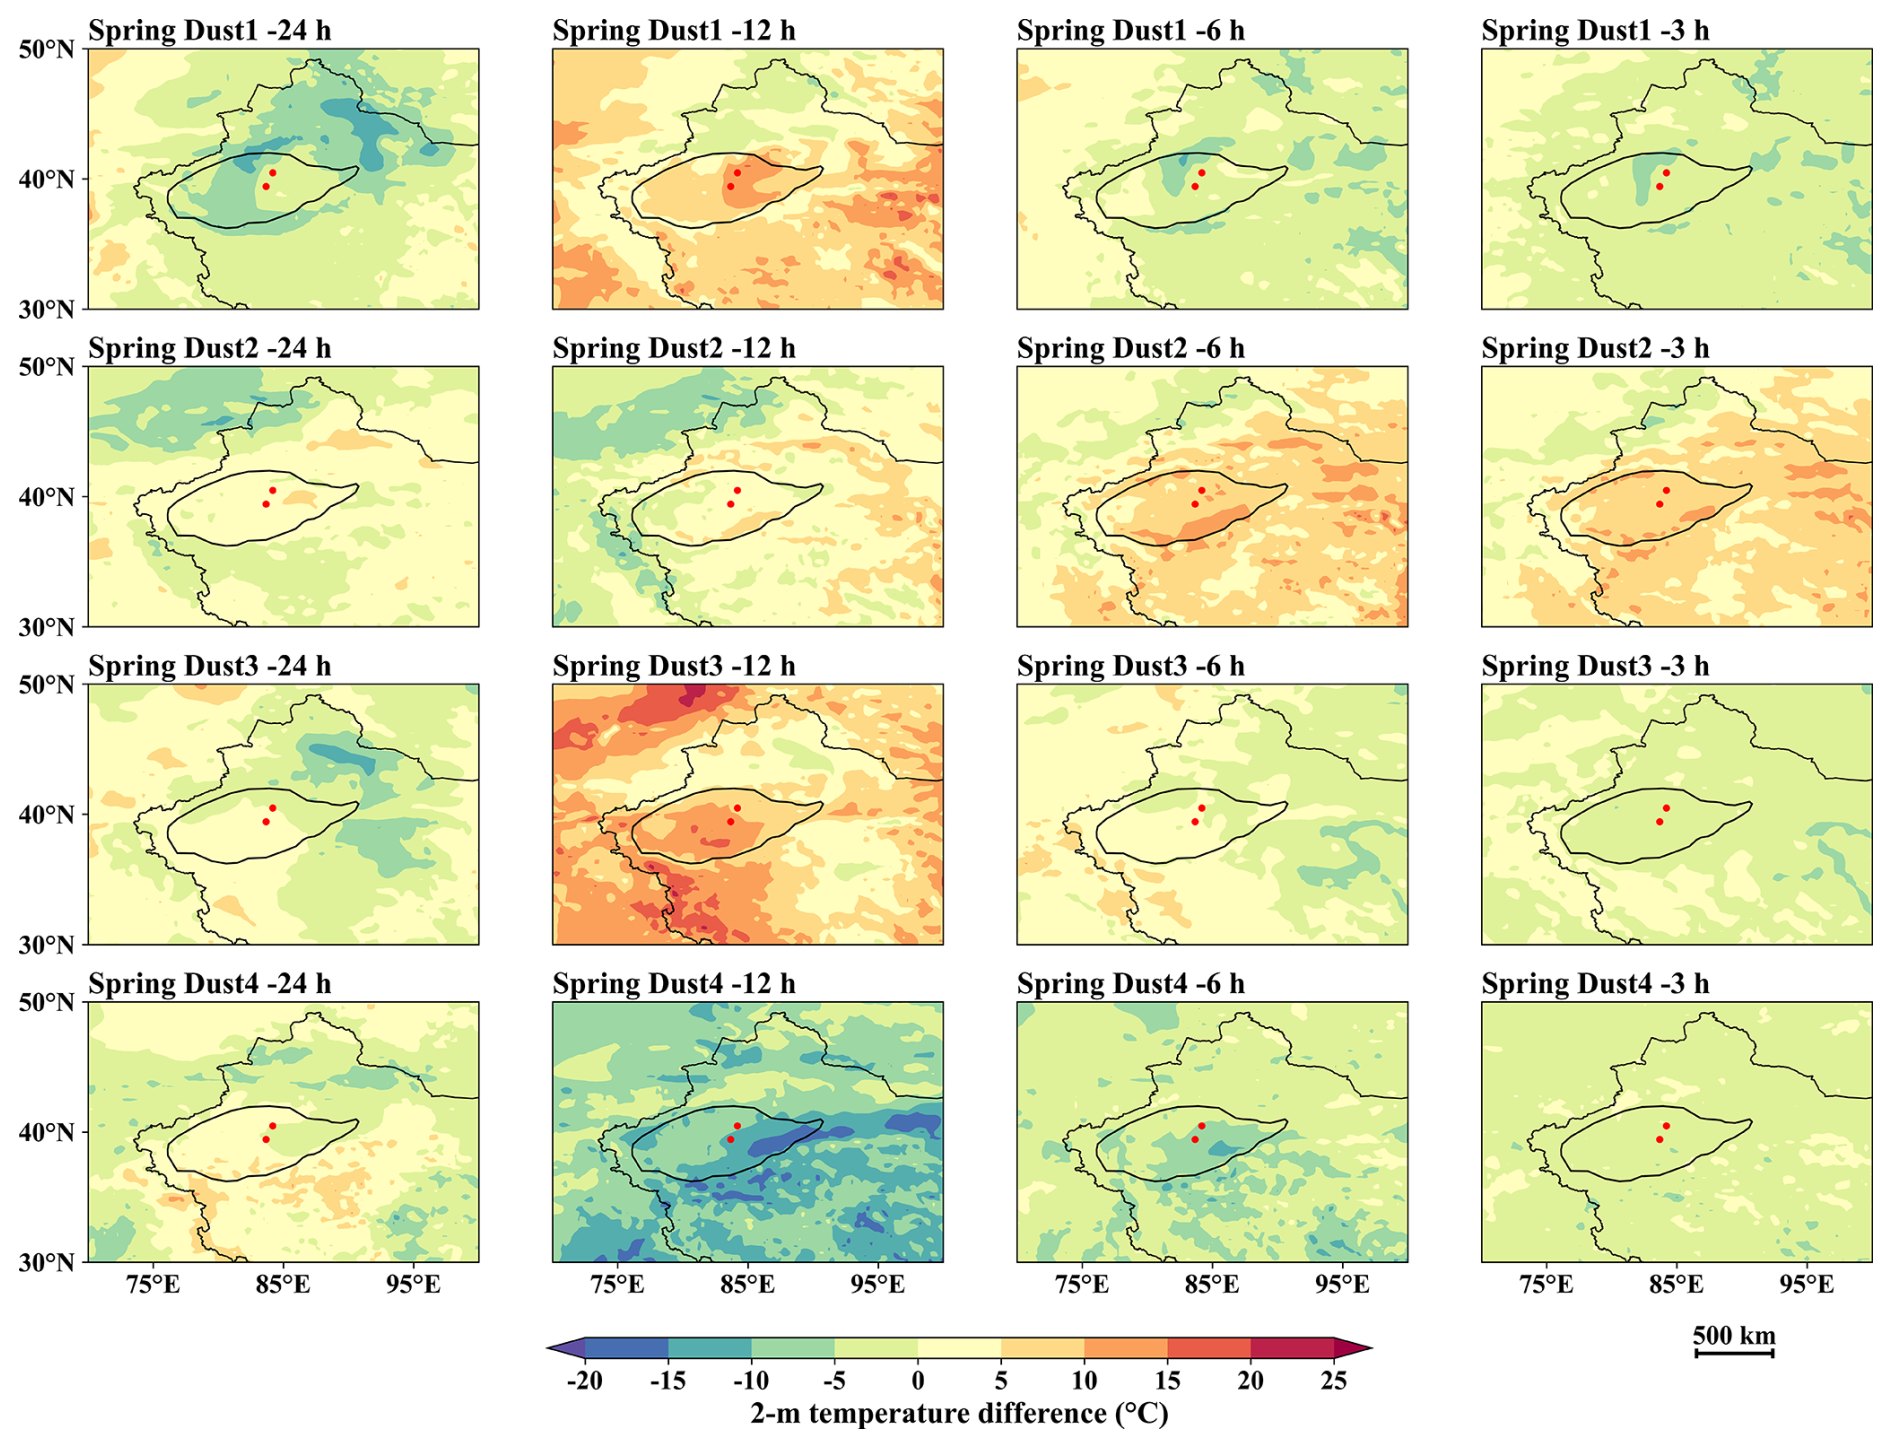
Figure 8Changes in surface–air temperature difference before spring dust-storm onset.
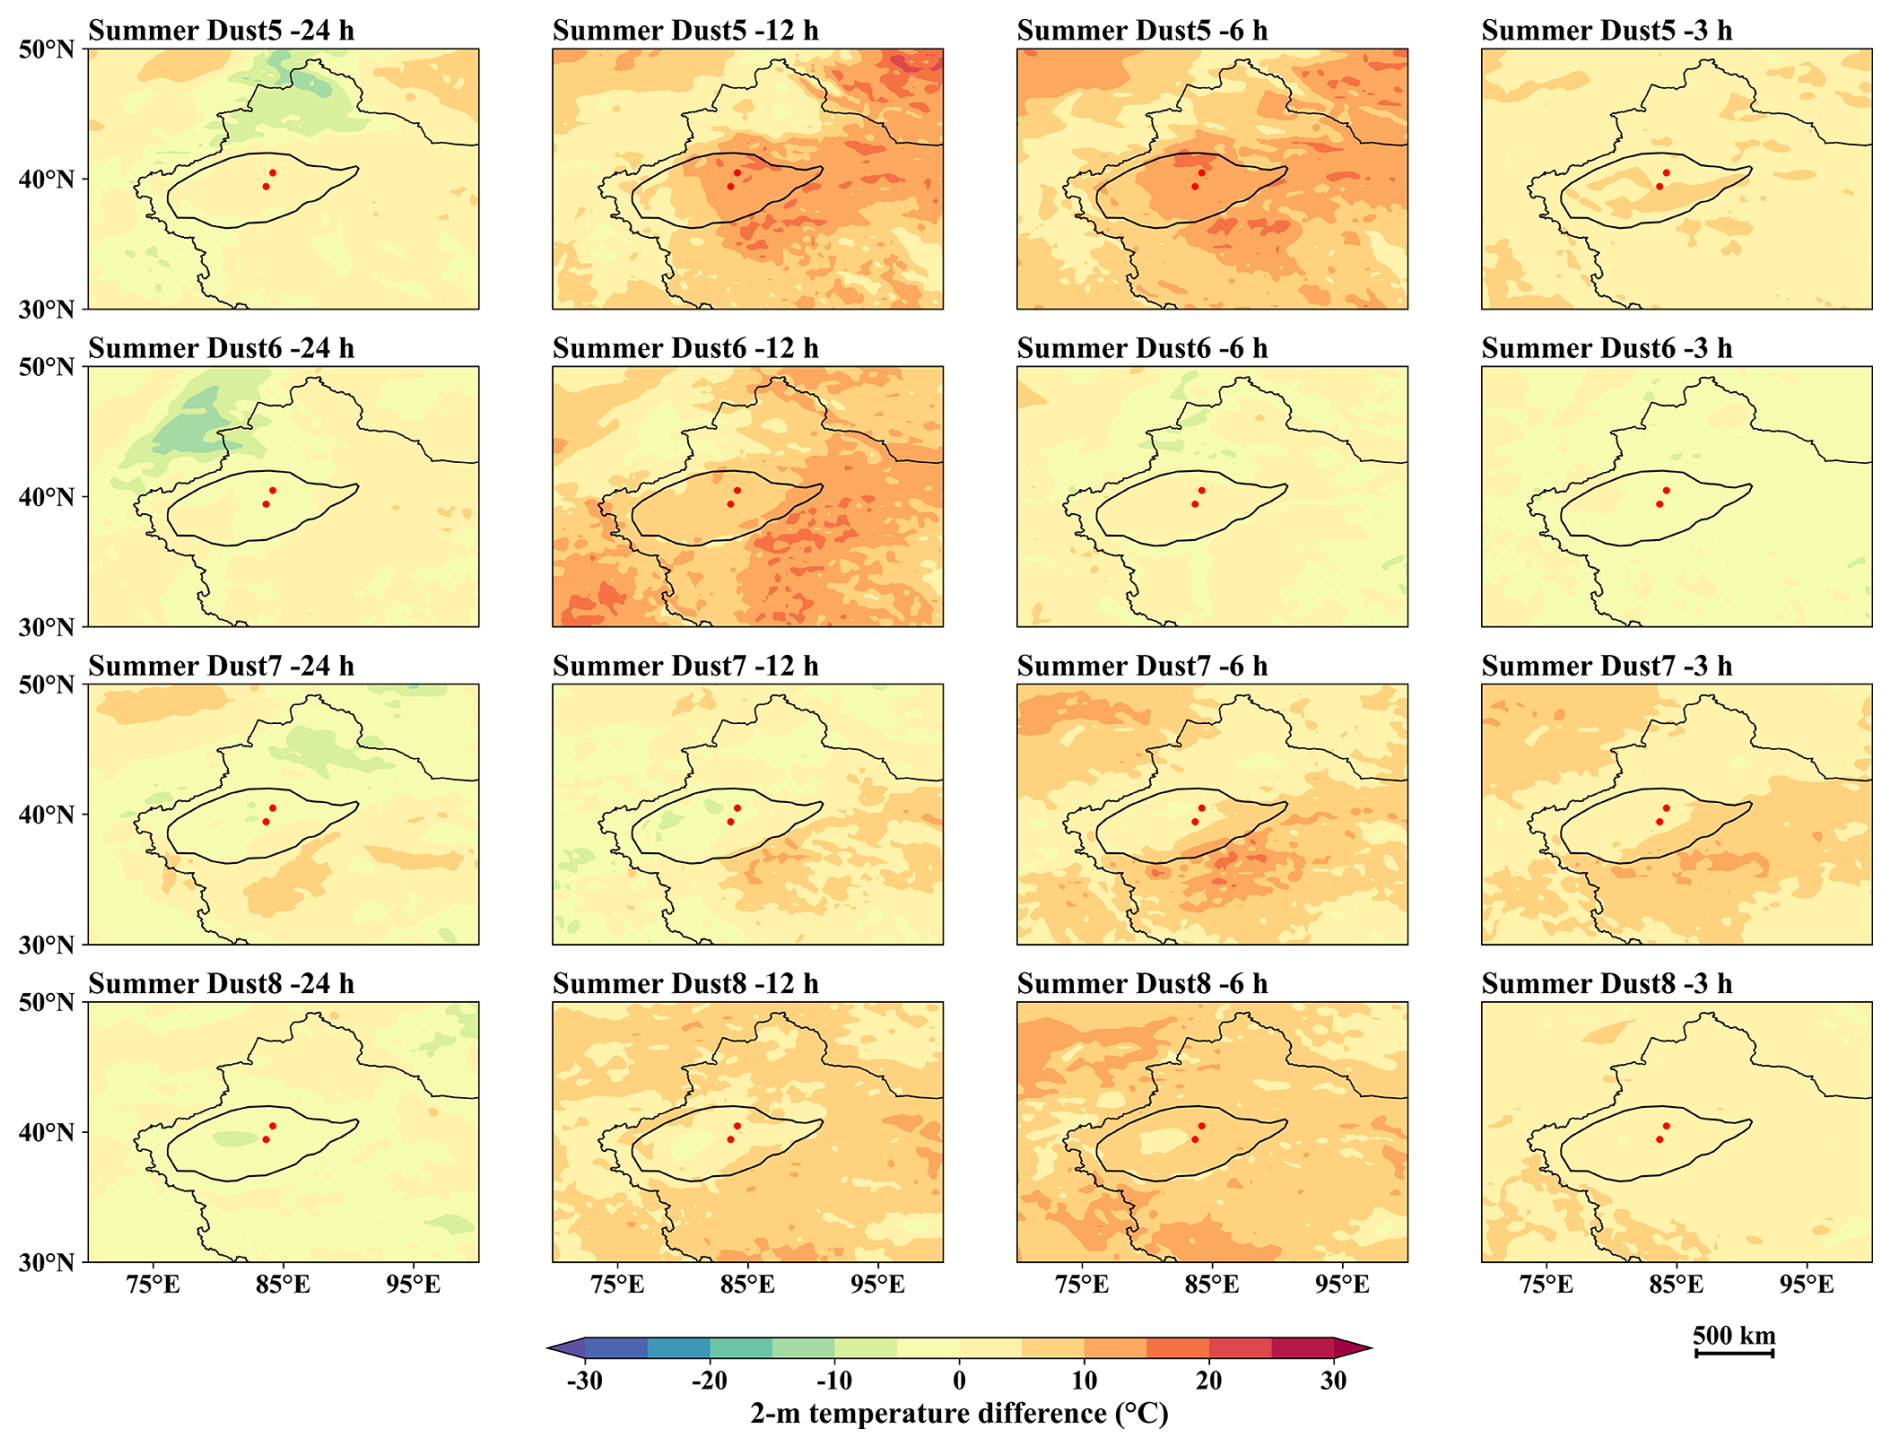
Figure 9Changes in surface–air temperature difference before summer dust-storm onset.
In spring, the changes in surface–air temperature difference are relatively irregular. Dust1 shows a localized increase in the thermal contrast at −12 h, but the signal weakens later. Dust2 presents a clearer increase near the southern TD, which may be related to its plateau-crossing pathway and local thermal instability. Dust3 and Dust4 show mixed positive and negative areas, indicating that the near-surface thermal structure was not consistently strengthened before all spring events. This suggests that thermal contrast may have contributed to individual spring cases, but it was not the common dominant pre-onset signal.
In summer, the increase in surface–air temperature difference is more evident. Dust5 and Dust6 show positive changes over the TD or its surrounding regions during −12 to −6 h, while Dust7 and Dust8 show broader positive areas closer to onset. These results indicate that, compared with spring, the summer cases experienced a stronger enhancement of surface–air thermal contrast before dust-storm occurrence. This pattern is consistent with the large-scale thermal background discussed above, in which stronger surface heating in May and June favored unstable stratification, turbulent mixing, and boundary-layer development.
Figure 10 further compares the composite evolution of dynamic and thermal anomalies from −24 to +3 h relative to dust-storm onset. The dynamic indicators are consistent with the spatial pressure-difference maps. The mean sea-level pressure-gradient anomaly and 850-hPa height-gradient anomaly remain higher in spring throughout the pre-onset period, indicating a persistent dynamic background. The 10-m wind-speed anomaly increases more sharply near onset, especially after about −12 h, suggesting that the earlier pressure-gradient adjustment was gradually transferred to near-surface wind enhancement.
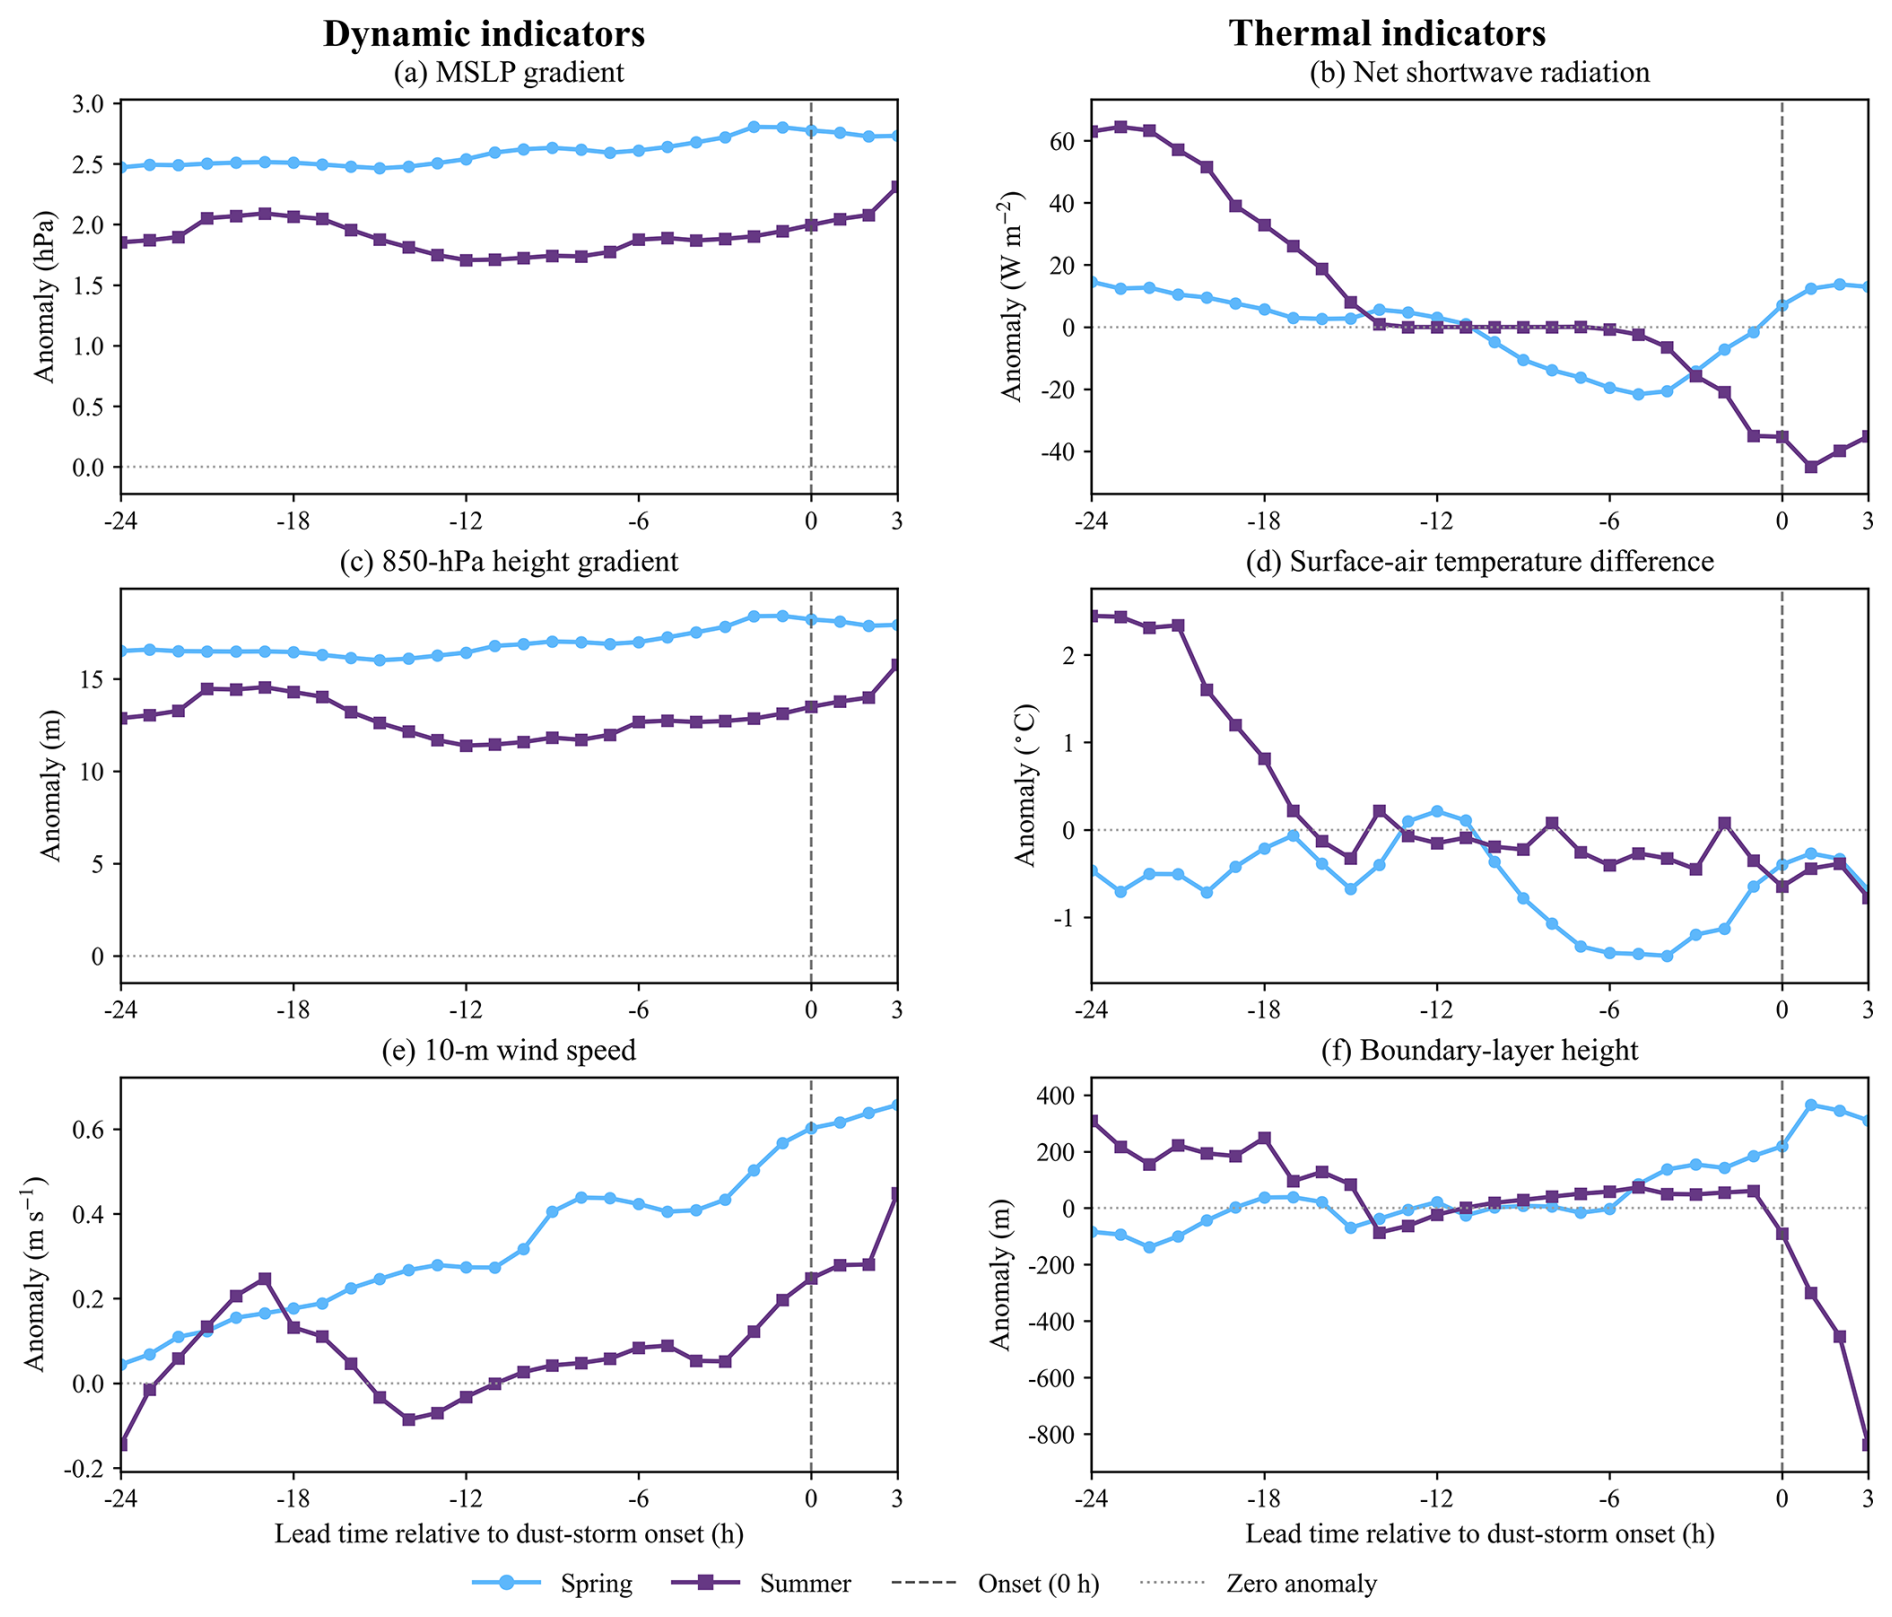
Figure 10Composite evolution of dynamic and thermal anomalies from −24 to +3 h relative to dust-storm onset.
The thermal curves support the spatial characteristics shown in the surface–air temperature-difference maps. In summer, the net shortwave-radiation anomaly is strongly positive during the early pre-onset stage, and the surface–air temperature-difference anomaly is also positive before about −18 h. Meanwhile, the boundary-layer-height anomaly reaches approximately 200–300 m, indicating that stronger radiation and surface heating promoted boundary-layer growth before summer dust storms. After about −12 h, the summer thermal anomalies weaken, while the near-surface wind anomaly begins to increase. This suggests that summer thermal forcing mainly provided early preconditioning, and the final onset still required near-surface wind enhancement.
Overall, the spring dust storms were more closely linked to persistent dynamic forcing, including pressure-gradient adjustment, 850-hPa circulation differences, and subsequent wind enhancement. These features correspond well to the east-inflow and mountain-crossing pathways. In contrast, the summer cases showed weaker pressure signals but stronger early thermal preconditioning, expressed as enhanced surface–air temperature contrast, positive radiation anomalies, and boundary-layer growth. Therefore, the seasonal difference reflects a shift from dynamic-dominated spring processes to thermally preconditioned summer processes, rather than a complete separation between dynamic and thermal mechanisms.
3.4 Tower-observed wind and temperature anomaly profiles
The tower observations further support the regional dynamic and thermal characteristics identified from the ERA5-based analysis. Figure 11 shows the composite evolution of 10 m wind-speed anomaly, 2–10 m wind-shear anomaly, 0.5–10 m air-temperature-difference anomaly, and 2 m air-temperature anomaly from −24 to +3 h relative to dust-storm onset. The 2 m air-temperature anomaly is generally positive before onset, indicating that near-surface warming had already developed during the pre-onset stage. However, this warming signal weakens as onset approaches, whereas the 10 m wind-speed and wind-shear anomalies increase rapidly near onset. This pattern suggests a transition from early thermal preconditioning to enhanced near-surface momentum and wind shear immediately before dust-storm occurrence.
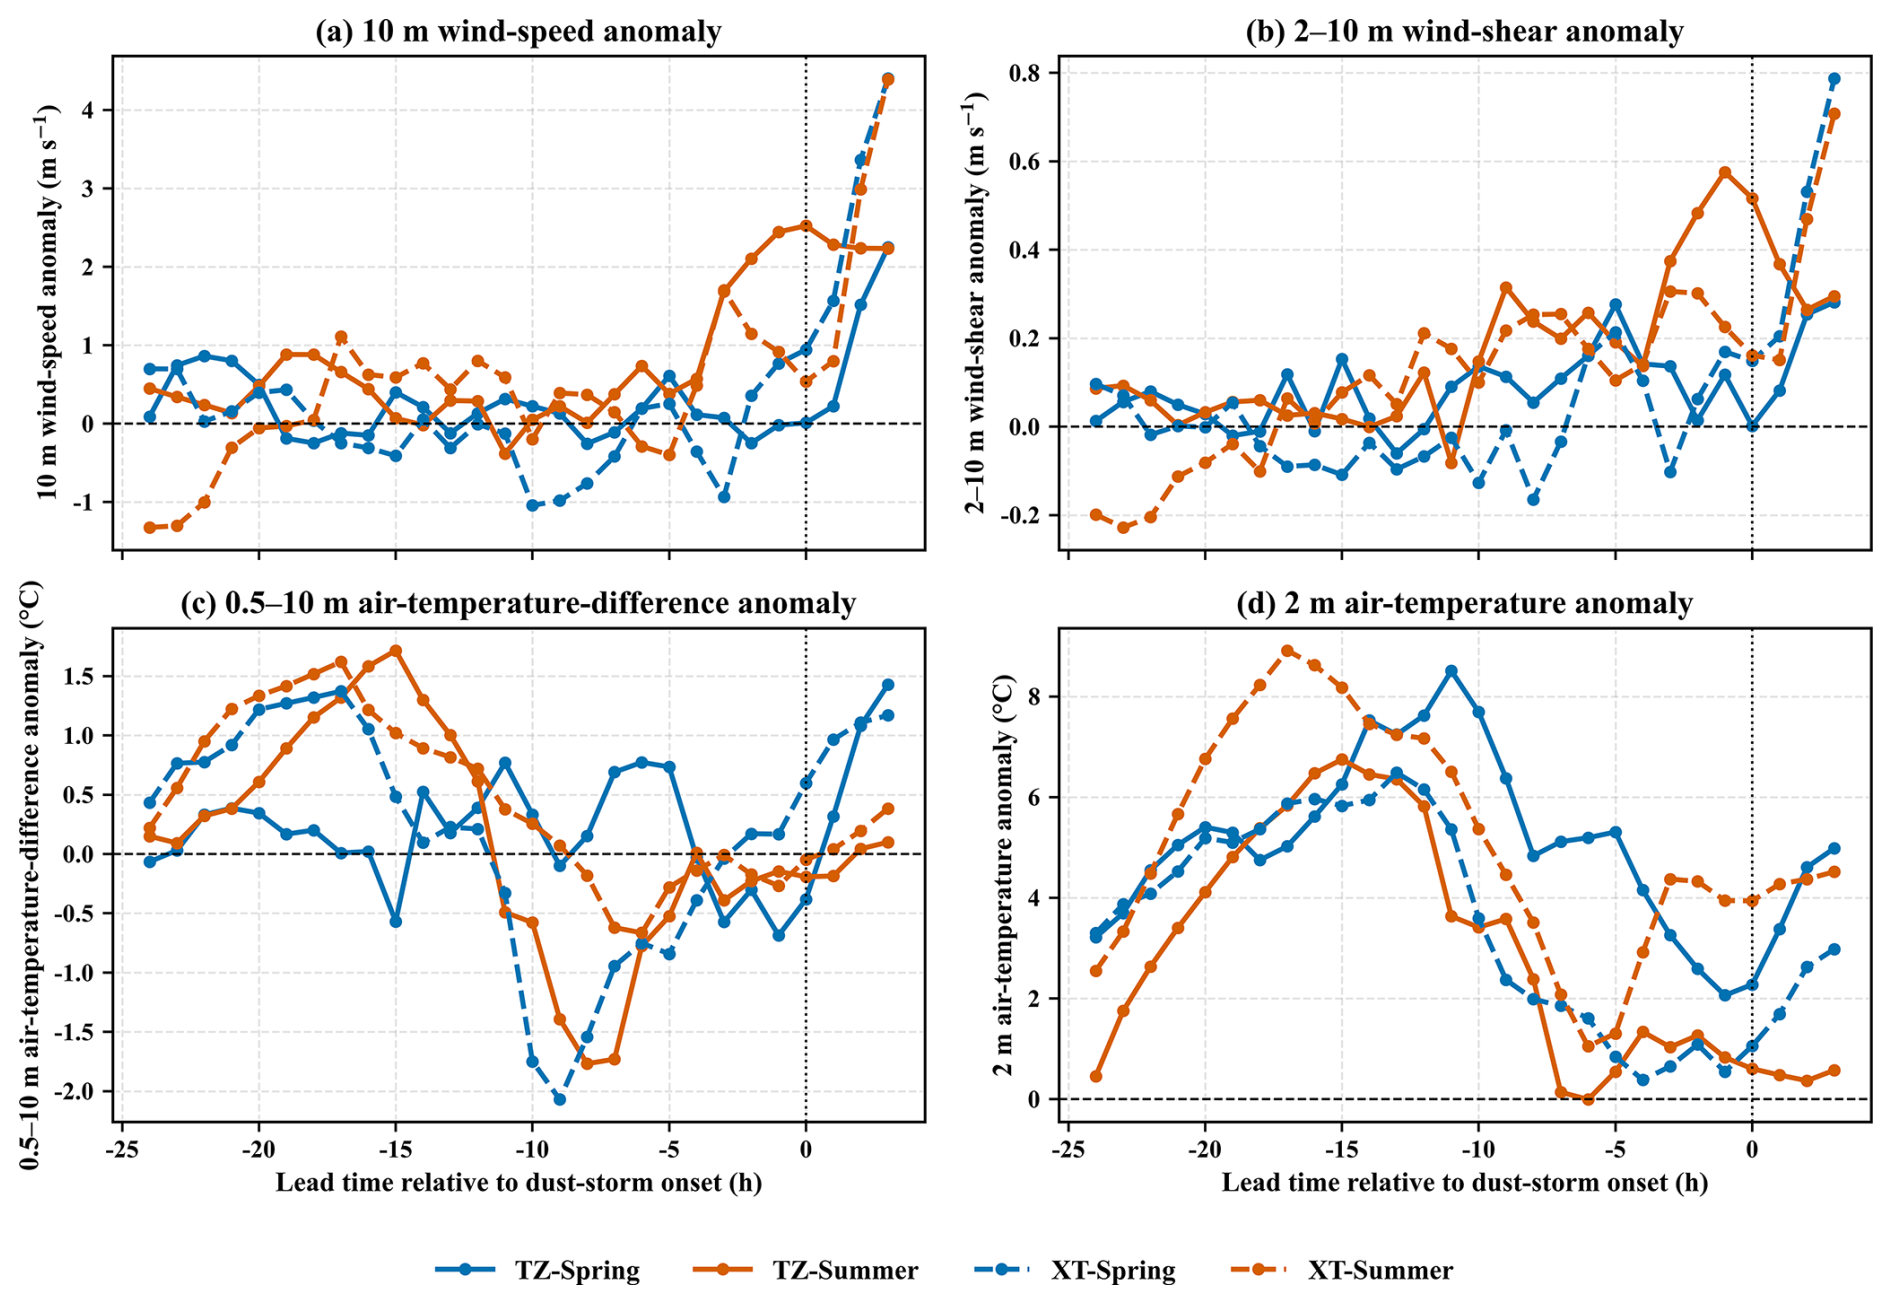
Figure 11Composite evolution of tower-observed wind-speed, wind-shear, air-temperature-difference, and 2 m air-temperature anomalies from −24 to +3 h relative to dust-storm onset.
Figure 12 shows the vertical profiles of wind-speed anomalies at TZ and XT. Wind-speed anomalies generally increase before and around dust-storm onset, but their vertical structures differ between the two stations. At XT, especially in summer, positive anomalies become more evident in the lower and middle layers, suggesting stronger near-surface momentum exchange over relatively flat terrain. At TZ, the profiles are more irregular, which may reflect the influence of undulating dune topography and local flow disturbance.
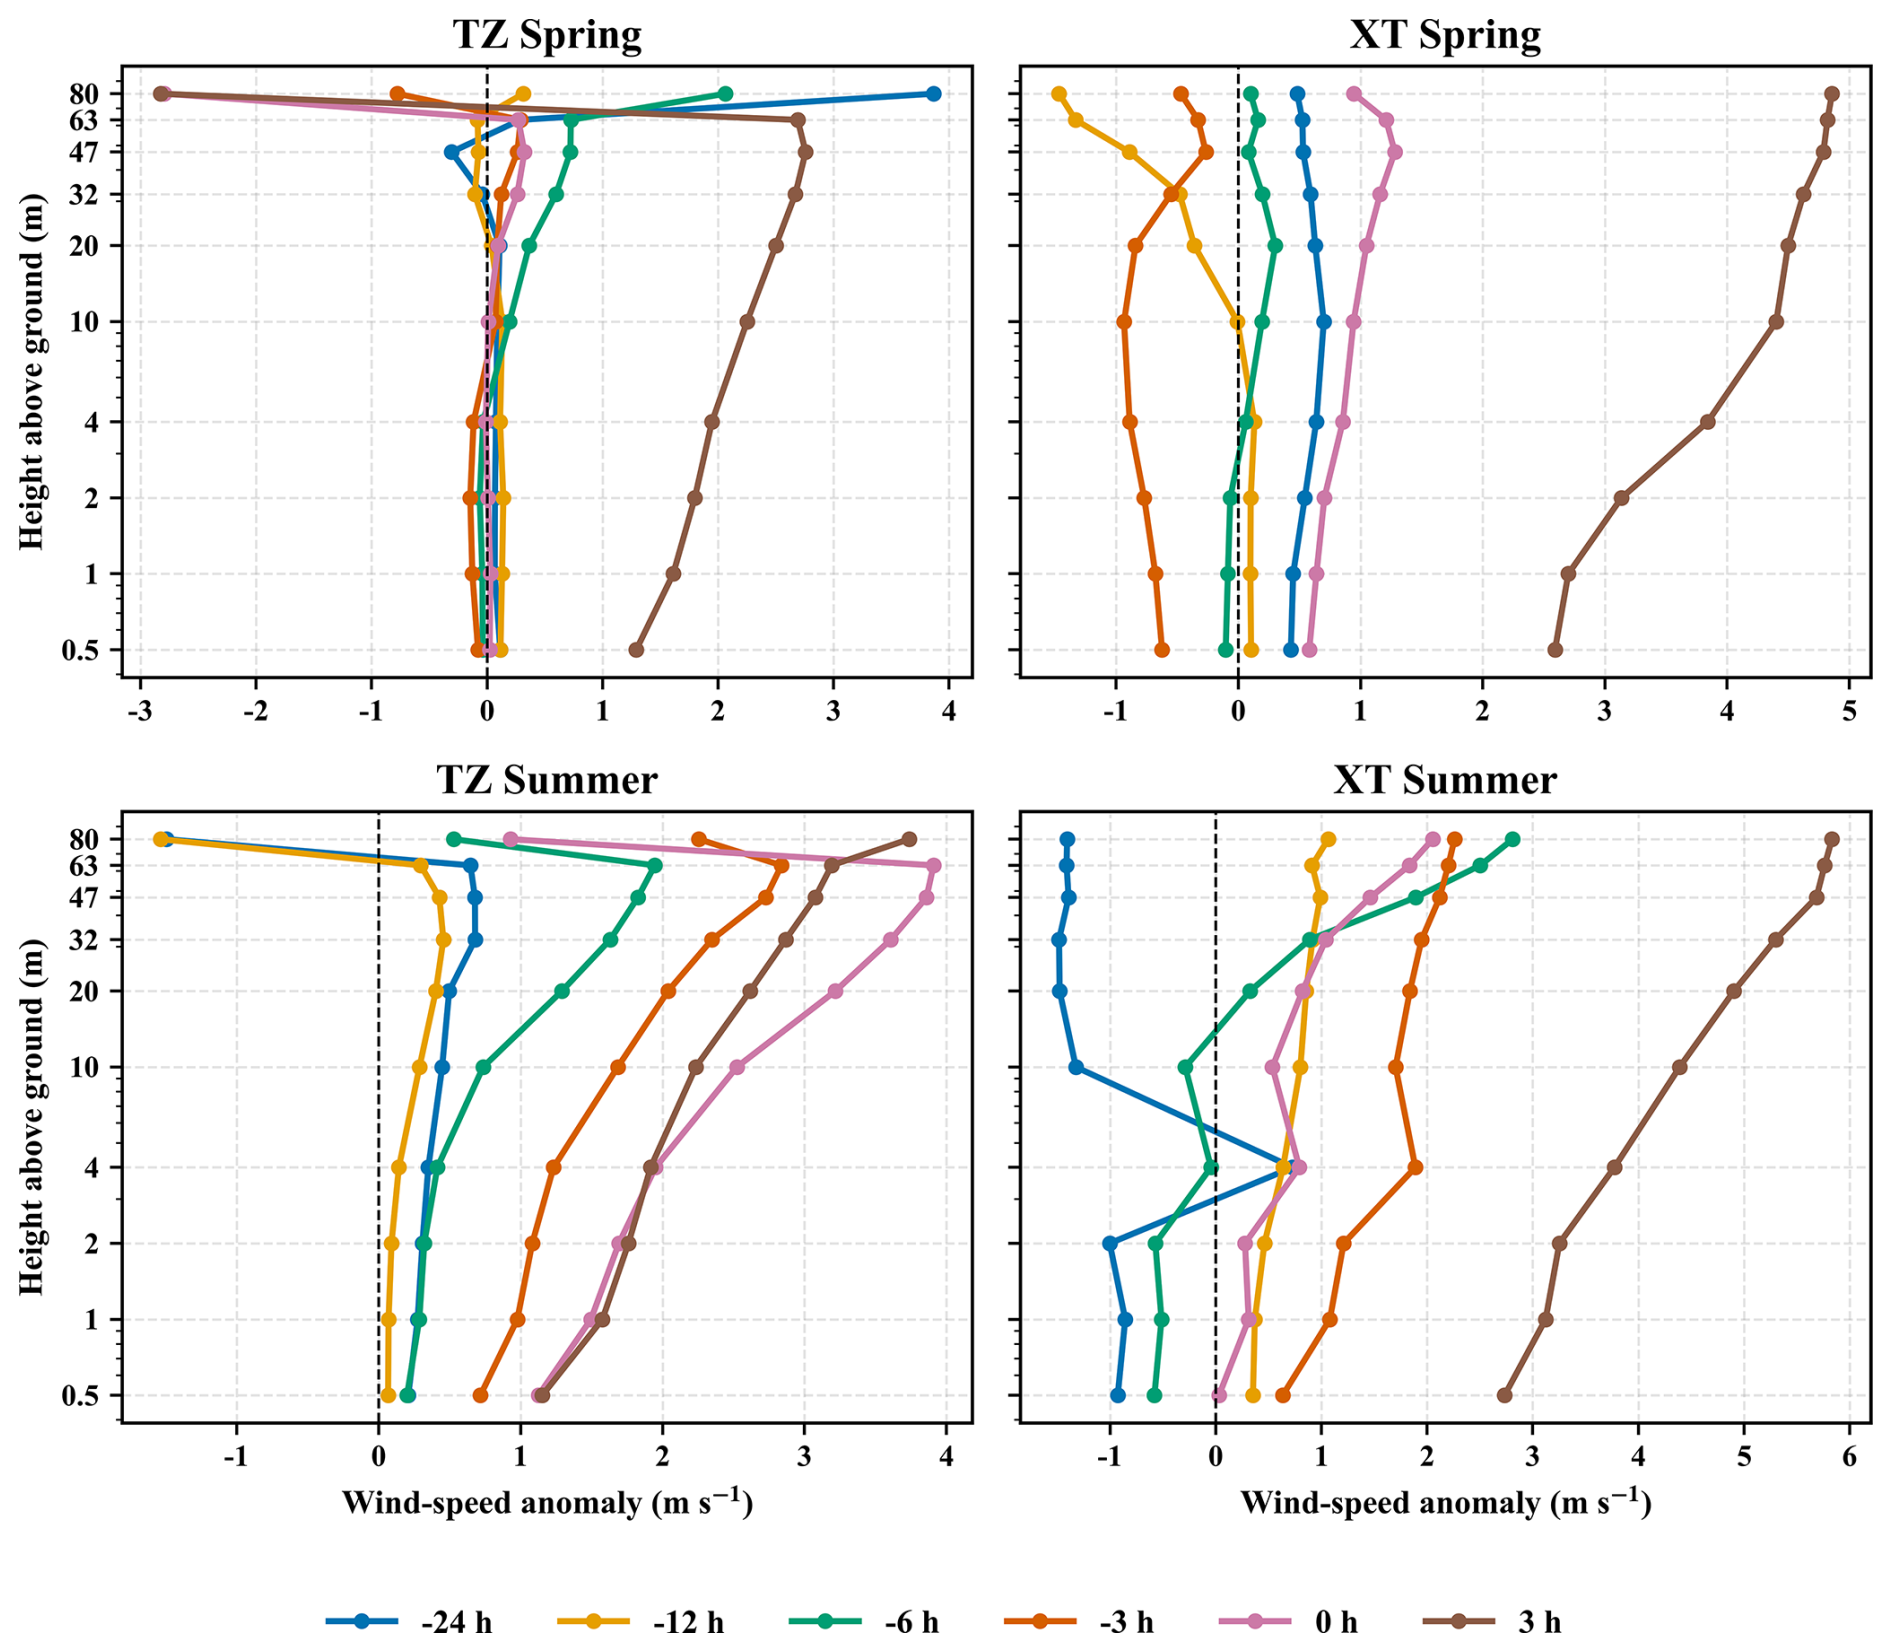
Figure 12Vertical profiles of wind-speed anomalies at TZ and XT during spring and summer dust-storm events.
Figure 13 presents the vertical profiles of air-temperature anomalies. In summer, both TZ and XT show stronger positive temperature anomalies than in spring, particularly at XT, where the warming signal is more vertically continuous. This is consistent with the stronger surface heating and boundary-layer development indicated by the ERA5 thermal diagnostics. In spring, the temperature profiles are more irregular, suggesting that thermal forcing was not a common pre-onset signal for all spring events.
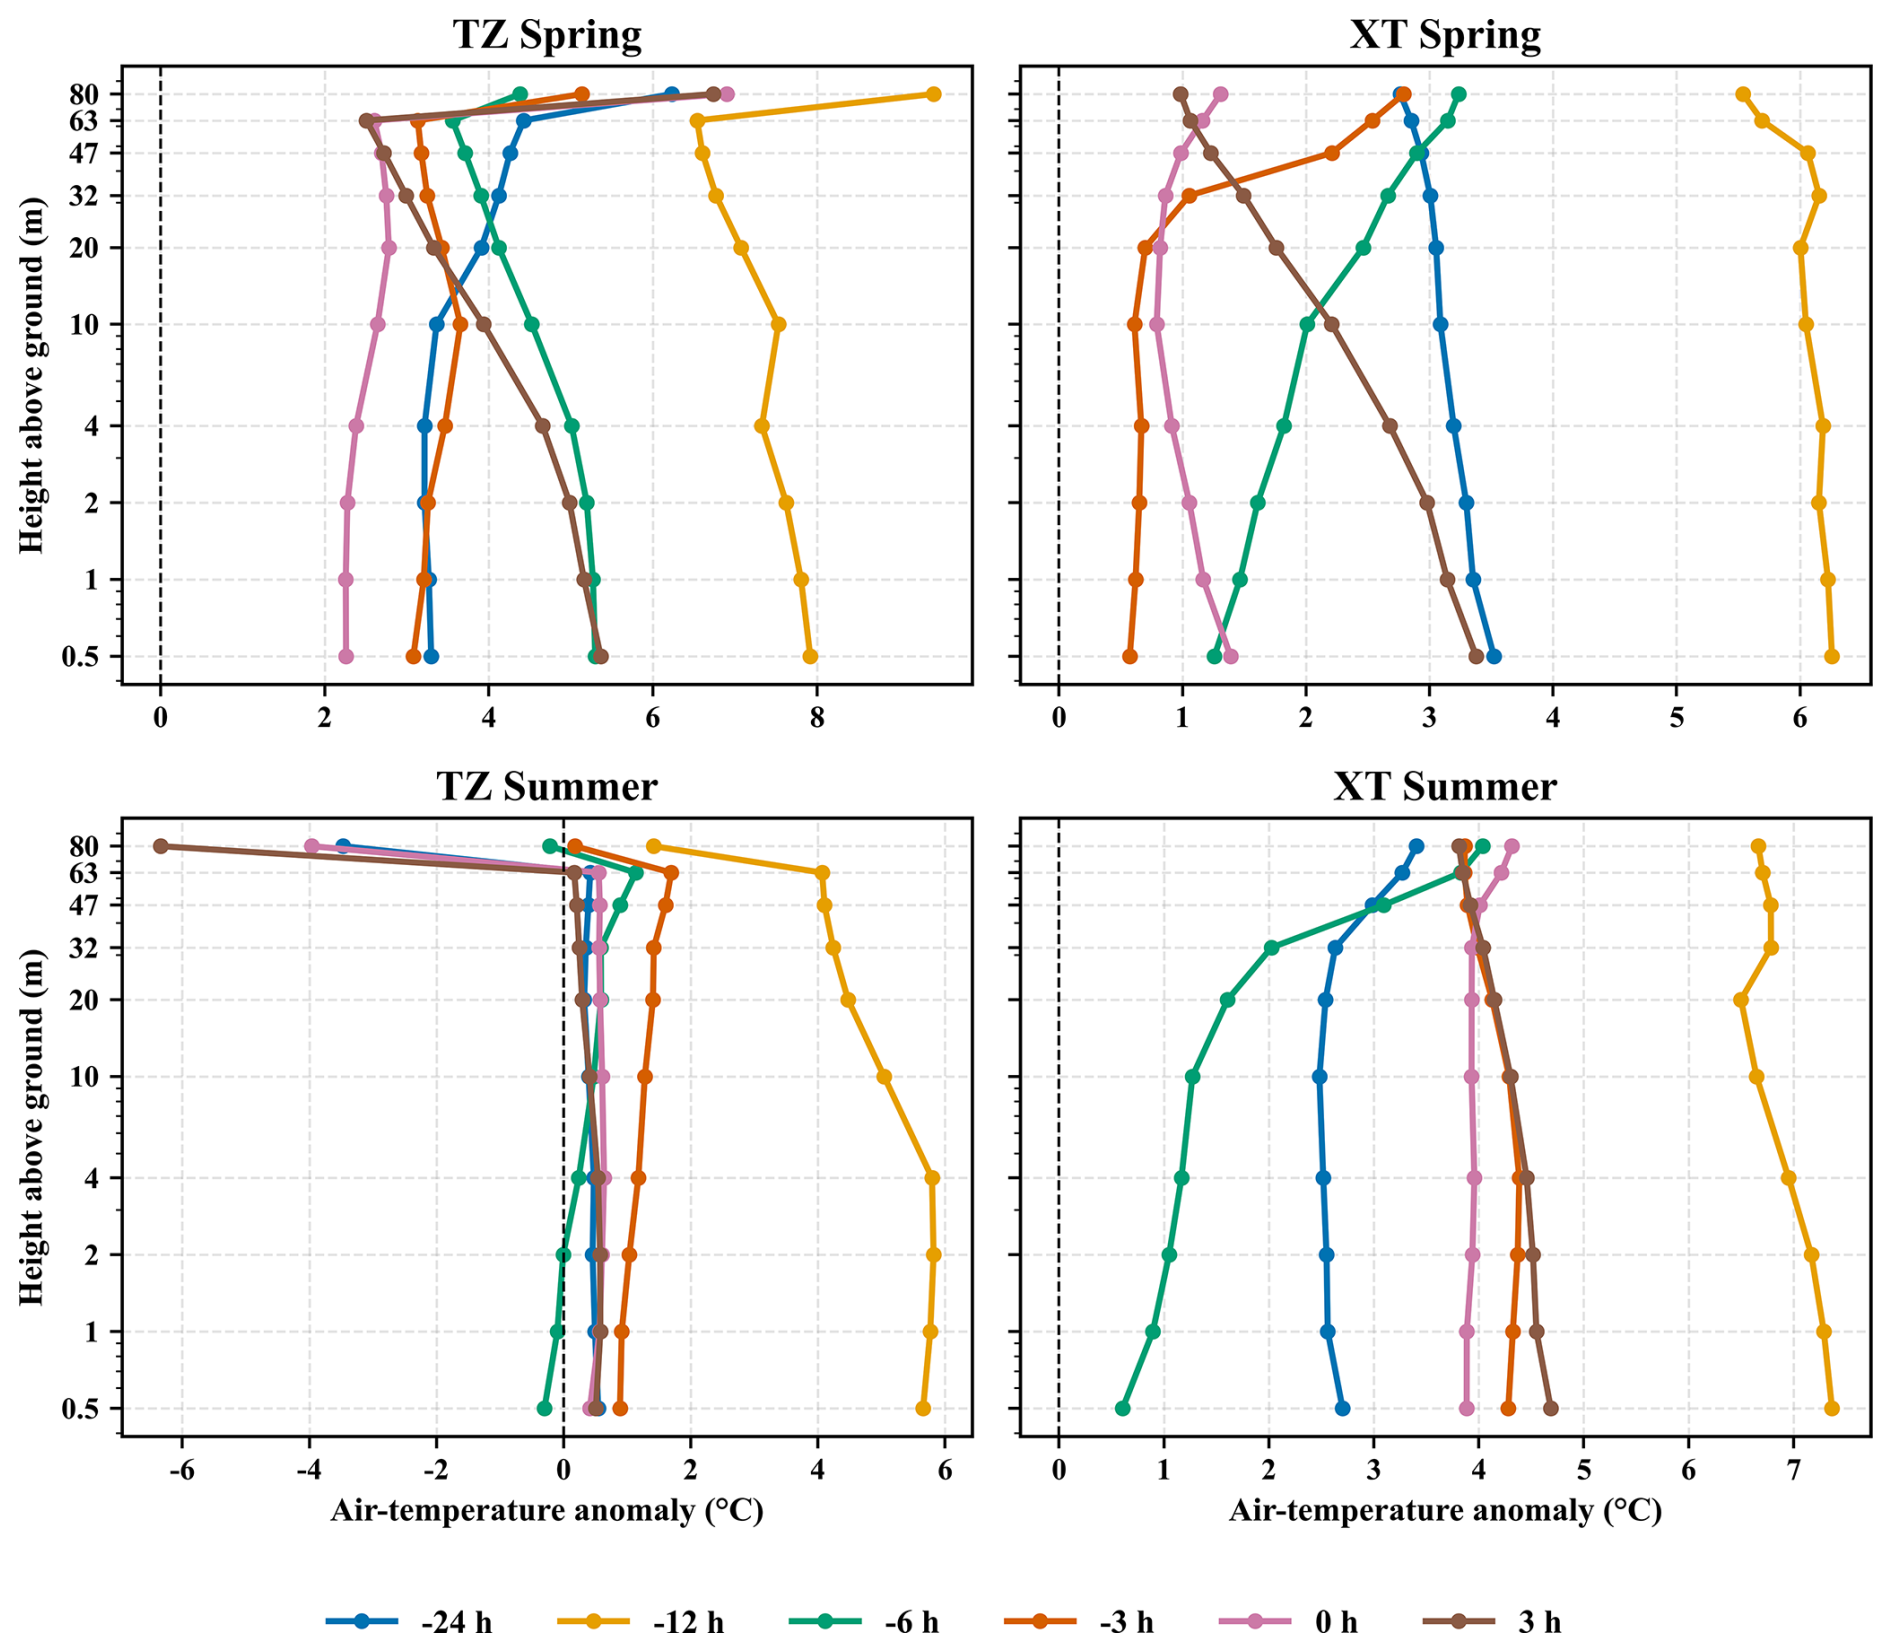
Figure 13Vertical profiles of air-temperature anomalies at TZ and XT during spring and summer dust-storm events.
Overall, the tower observations indicate that summer events were more clearly thermally preconditioned in the early stage, while wind-speed and wind-shear enhancement became more evident closer to onset. This station-scale pattern is consistent with the ERA5-based interpretation, but the contrast between TZ and XT also indicates that regional forcing was locally modified by surface and terrain conditions. Although both towers are located within the Taklamakan Desert, differences in dune morphology, surface roughness, and station exposure can influence near-surface wind acceleration, turbulent mixing, and temperature profiles. Therefore, the tower-observed anomalies should be interpreted as the combined response to regional dynamic–thermal forcing and local surface modulation.
The HYSPLIT pathway analysis, ERA5 diagnostics, and tower observations provide complementary evidence for interpreting dust-storm development over the Taklimakan Desert. HYSPLIT identifies the pre-storm airflow pathways reaching the observation sites, ERA5 explains the regional pressure, circulation, and thermal backgrounds behind these pathways, and the tower observations show how these regional conditions are expressed in near-surface wind, temperature, wind shear, and vertical profiles.
The pathway types are closely related to the ERA5 circulation patterns. East-inflow events are generally accompanied by clearer pressure differences between northern Xinjiang, surrounding high-pressure regions, and the Tarim Basin, together with organized 10 m winds entering the desert through the northeastern basin opening. Mountain-crossing events correspond more closely to lower-tropospheric circulation differences around the Tianshan–Pamir region, while the south-to-north pathway is related to pressure and wind configurations along the southern and southwestern margins of the desert. These results indicate that the transport pathways were not isolated trajectory features, but were linked to regional dynamic backgrounds and basin topographic constraints.
ERA5 further reveals a seasonal shift in the pre-onset conditions. Spring events show stronger and more persistent mean sea-level pressure-gradient and 850 hPa height-gradient anomalies, consistent with the more distinct dynamic pathways. Summer events show weaker pressure-gradient organization but stronger early thermal anomalies, including enhanced net shortwave radiation, surface–air temperature difference, and boundary-layer height. This suggests that spring dust storms were more closely related to regional dynamic forcing, whereas summer events were more strongly influenced by early thermal preconditioning.
The tower observations provide station-scale support for this interpretation. Summer events show more continuous vertical warming, while wind-speed and wind-shear anomalies strengthen closer to onset, indicating that thermal preconditioning alone is insufficient and that near-surface momentum enhancement remains necessary. The differences between TZ and XT further suggest that local terrain can modify the near-surface response to regional forcing. XT shows more regular vertical structures, whereas TZ exhibits more variable profiles, likely related to dune-induced flow disturbance and heterogeneous roughness.
Several uncertainties remain. The analysis is based on eight events from one field season, and the identified pathway and seasonal characteristics need to be tested using longer-term samples. In addition, the lack of direct turbulence, vertical velocity, and lidar observations limits the interpretation of vertical transport processes. Future studies should combine multi-year observations, turbulence measurements, lidar data, and high-resolution simulations to better distinguish the roles of synoptic forcing, thermal instability, and local terrain heterogeneity.
Based on eight complete dust-storm events observed in 2024, this study provides case-based evidence for seasonal differences in dynamic and thermal preconditioning over the Taklimakan Desert. The main conclusions are as follows.
The analyzed events exhibited three main types of pre-storm airflow transport pathways: east-inflow transport through the northeastern opening of the Tarim Basin, mountain-crossing transport across the Tianshan–Pamir region, and south-to-north transport related to airflows crossing the Tibetan Plateau and Kunlun Mountains.
ERA5 analysis shows that these pathways were closely linked to regional dynamic and thermal backgrounds. Spring events were associated with stronger pressure-gradient and 850 hPa height-gradient anomalies, corresponding to more distinct dynamically driven pathways. Summer events showed weaker pressure-gradient signals but stronger early thermal anomalies, indicating more evident thermal preconditioning before onset.
The dual-gradient tower observations provided direct near-surface evidence for the vertical expression of regional forcing. In the analyzed summer cases, temperature anomalies were stronger and more vertically coherent, whereas wind-speed and wind-shear anomalies intensified closer to onset. This vertical structure suggests a staged process, with early thermal preconditioning followed by stronger momentum enhancement near onset. The two stations showed different vertical responses. XT displayed more regular wind and temperature anomaly structures, whereas TZ showed more variable profiles, suggesting that local terrain heterogeneity may modulate the near-surface response to regional dynamic and thermal forcing.
Together, the results show that Taklimakan dust-storm development depends on regional transport pathways, dynamic and thermal background conditions, near-surface wind response, and local terrain effects.
The meteorological observational data used in this study are maintained and owned by the Institute of Desert Meteorology, China Meteorological Administration, located in Urumqi, Xinjiang, China, and are subject to institutional regulations and access restrictions. ERA5 reanalysis datasets were obtained from the European Centre for Medium-Range Weather Forecasts (ECMWF) through the Copernicus Climate Data Store (https://cds.climate.copernicus.eu, last access: 4 November 2024). The base map used in Fig. 1 was prepared using ArcGIS Online, and attribution and copyright information follow the requirements of Esri and its data providers. HYSPLIT trajectories were generated using the NOAA HYSPLIT online trajectory platform (https://www.ready.noaa.gov/HYSPLIT_traj.php, last access: 4 November 2024) with GDAS meteorological data. Researchers or interested parties who wish to obtain access to the observational datasets may submit a formal request to the Institute of Desert Meteorology, outlining the purpose and scope of their intended use. Approval of such requests will be at the discretion of the institute, in accordance with its data-sharing policies.
The supplement related to this article is available online at https://doi.org/10.5194/nhess-26-3523-2026-supplement.
YW: Conceptualization, writing – original draft, and formal analysis. WH: Methodology, supervision, and writing – review and editing. YL: Validation. MM: Investigation and data curation. FY: Experimental design and supervision. CZ, XY, and AM: Investigation and data curation.
The contact author has declared that none of the authors has any competing interests.
Publisher's note: Copernicus Publications remains neutral with regard to jurisdictional claims made in the text, published maps, institutional affiliations, or any other geographical representation in this paper. The authors bear the ultimate responsibility for providing appropriate place names. Views expressed in the text are those of the authors and do not necessarily reflect the views of the publisher.
We gratefully acknowledge the National Earth System Science Data Center (https://www.geodata.cn/, last access: 13 August 2024) and the Institute of Desert Meteorology (China Meteorological Administration, Urumqi) for providing essential datasets. We also extend our thanks to the College of Geography and Remote Sensing Science, Xinjiang University (Urumqi), for their technical support.
This research was funded by the Xinjiang Uygur Autonomous Region Natural Science Foundation for Outstanding Young Scientists (grant no. 2025D01E64), the Tianshan Talent Project of Xinjiang (grant no. 2023TSYCCX0075), the Key Project of the Innovation and Development Special Program of the China Meteorological Administration (grant no. CXFZ2026J007), the China Meteorological Administration Young Innovative Team Project (grant no. CMA2024QN13), and the S&T Development Fund of CAMS (grant no. 2021KJ034).
This paper was edited by Hailiang Du and reviewed by three anonymous referees.
Achakulwisut, P., Mickley, L. J., and Anenberg, S. C.: Drought-sensitivity of fine dust in the US Southwest: Implications for air quality and public health under future climate change, Environ. Res. Lett., 13, 054025, https://doi.org/10.1088/1748-9326/aabf20, 2018.
Aili, A., Xu, H., Kasim, T., and Abulikemu, A.: Origin and Transport Pathway of Dust Storm and Its Contribution to Particulate Air Pollution in Northeast Edge of Taklimakan Desert, China, Atmosphere, 12, 113, https://doi.org/10.3390/atmos12010113, 2021.
Aili, A., Xu, H., Xu, Q., and Liu, K.: Aeolian dust movement and deposition under local atmospheric circulation in a desert-oasis transition zone of the northeastern Taklimakan desert, Ecol. Indic., 157, 111289, https://doi.org/10.1016/j.ecolind.2023.111289, 2023.
Aili, A., Waheed, A., Zhao, X., and Xu, H.: Establishing an Early Warning System for Dust Storms in Peri-Desert Regions, Environments, 11, 61, https://doi.org/10.3390/environments11040061, 2024.
Bao, C. and Fang, C.: Water resources constraint force on urbanization in water deficient regions: A case study of the Hexi Corridor, arid area of NW China, Ecol. Econ., 62, 508–517, https://doi.org/10.1016/j.ecolecon.2006.07.013, 2007.
Bao, T., Xi, G., Hao, Y., Chang, I.-S., Wu, J., Xue, Z., Jin, E., Zhang, W., and Bao, Y.: The Transport Path and Vertical Structure of Dust Storms in East Asia and the Impacts on Cities in Northern China, Remote Sens.-Basel, 15, 3183, https://doi.org/10.3390/rs15123183, 2023.
Bi, J., Li, Z., Zuo, D., Yang, F., Li, B., Ma, J., Huang, Z., and He, Q.: Dust Aerosol Vertical Profiles in the Hinterland of Taklimakan Desert During Summer 2019, Front. Environ. Sci., 10, 851915, https://doi.org/10.3389/fenvs.2022.851915, 2022.
Chen, S., Zhao, D., Huang, J., He, J., Chen, Y., Chen, J., Bi, H., Lou, G., Du, S., Zhang, Y., and Yang, F.: Mongolia Contributed More than 42 % of the Dust Concentrations in Northern China in March and April 2023, Adv. Atmos. Sci., 40, 1549–1557, https://doi.org/10.1007/s00376-023-3062-1, 2023a.
Chen, Y., An, J., Qu, Y., Xie, F., and Ma, S.: Dust radiation effect on the weather and dust transport over the Taklimakan Desert, China, Atmos. Res., 284, 106600, https://doi.org/10.1016/j.atmosres.2022.106600, 2023b.
Gao, X., Ding, D., and Gao, H.: Dominant circulation pattern and moving path of the Mongolian Cyclone for the severe sand and dust storm in China, Atmos. Res., 301, 107272, https://doi.org/10.1016/j.atmosres.2024.107272, 2024.
Ge, J. M., Huang, J. P., Xu, C. P., Qi, Y. L., and Liu, H. Y.: Characteristics of Taklimakan dust emission and distribution: A satellite and reanalysis field perspective: Taklimakan dust Characteristics, J. Geophys. Res.-Atmos., 119, 11772–11783, https://doi.org/10.1002/2014JD022280, 2014.
Gillette, D. A. and Passi, R.: Modeling dust emission caused by wind erosion, J. Geophys. Res., 93, 14233–14242, https://doi.org/10.1029/JD093iD11p14233, 1988.
Iversen, J. D. and White, B. R.: Saltation threshold on Earth, Mars and Venus, Sedimentology, 29, 111–119, https://doi.org/10.1111/j.1365-3091.1982.tb01713.x, 1982.
Kai, Z. and Huiwang, G.: The characteristics of Asian-dust storms during 2000–2002: From the source to the sea, Atmos. Environ., 41, 9136–9145, https://doi.org/10.1016/j.atmosenv.2007.08.007, 2007.
Kok, J. F., Storelvmo, T., Karydis, V. A., Adebiyi, A. A., Mahowald, N. M., Evan, A. T., He, C., and Leung, D. M.: Mineral Dust Aerosol Impacts on Global Climate and Climate Change, Nat. Rev. Earth Environ., 4, 71–86, https://doi.org/10.1038/s43017-022-00379-5, 2023.
Li, J., Han, Y., Liu, W., Cao, L., and Lu, Z.: Contributions of gust under stationary weather conditions to the dust aerosol budget in northwestern China, Atmos. Res., 293, 106914, https://doi.org/10.1016/j.atmosres.2023.106914, 2023.
Liu, X., Yin, Z., Zhang, X., and Yang, X.: Analyses of the spring dust storm frequency of northern China in relation to antecedent and concurrent wind, precipitation, vegetation, and soil moisture conditions, J. Geophys. Res., 109, 2004JD004615, https://doi.org/10.1029/2004JD004615, 2004.
Manisalidis, I., Stavropoulou, E., Stavropoulos, A., and Bezirtzoglou, E.: Environmental and Health Impacts of Air Pollution: A Review, Front. Public Health, 8, 14, https://doi.org/10.3389/fpubh.2020.00014, 2020.
Marticorena, B. and Bergametti, G.: Modeling the atmospheric dust cycle: 1. Design of a soil-derived dust emission scheme, J. Geophys. Res., 100, 16415–16430, https://doi.org/10.1029/95JD00690, 1995.
Mu, F. and Fiedler, S.: How much do atmospheric depressions and Mongolian cyclones contribute to spring dust activities in East Asia?, npj Clim. Atmos. Sci., 8, 51, https://doi.org/10.1038/s41612-025-00929-w, 2025.
Prospero, J. M.: Long-range transport of mineral dust in the global atmosphere: Impact of African dust on the environment of the southeastern United States, P. Natl. Acad. Sci. USA, 96, 3396–3403, https://doi.org/10.1073/pnas.96.7.3396, 1999.
Raupach, M. R.: Drag and drag partition on rough surfaces, Bound.-Lay. Meteorol., 60, 375–395, https://doi.org/10.1007/BF00155203, 1992.
Shao, Y. and Dong, C. H.: A review on East Asian dust storm climate, modelling and monitoring, Global Planet. Change, 52, 1–22, https://doi.org/10.1016/j.gloplacha.2006.02.011, 2006.
Stein, A. F., Draxler, R. R., Rolph, G. D., Stunder, B. J. B., Cohen, M. D., and Ngan, F.: NOAA's HYSPLIT Atmospheric Transport and Dispersion Modeling System, B. Am. Meteorol. Soc., 96, 2059–2077, https://doi.org/10.1175/BAMS-D-14-00110.1, 2015.
Su, L., Lu, C., Yuan, J., Wang, X., He, Q., and Xia, H.: Measurement report: The promotion of low-level jet and thermal-effect on development of deep convective boundary layer at the southern edge of the Taklimakan Desert, EGUsphere [preprint], https://doi.org/10.5194/egusphere-2024-1010, 2024.
Sun, J. and Liu, T.: The Age of the Taklimakan Desert, Science, 312, 1621–1621, https://doi.org/10.1126/science.1124616, 2006.
Tong, D., Feng, I., Gill, T. E., Schepanski, K., and Wang, J.: How Many People Were Killed by Windblown Dust Events in the United States?, B. Am. Meteorol. Soc., 104, E1067–E1084, https://doi.org/10.1175/BAMS-D-22-0186.1, 2023.
Wang, B., Ji, H., Zhang, Z., Liang, J., Zhang, L., Li, M., Qiu, R., Luo, H., An, W., Tian, P., and Amonov, M. O.: Surface-Dependent Meteorological Responses to a Taklimakan Dust Event During Summer near the Northern Slope of the Tibetan Plateau, Remote Sens.-Basel, 17, 1561, https://doi.org/10.3390/rs17091561, 2025.
Wang, H., Jia, X., Li, K., and Li, Y.: Horizontal wind erosion flux and potential dust emission in arid and semiarid regions of China: A major source area for East Asia dust storms, CATENA, 133, 373–384, https://doi.org/10.1016/j.catena.2015.06.011, 2015.
Wang, X., Zhai, P., and Wang, C.: Variations in extratropical cyclone activity in northern East Asia, Adv. Atmos. Sci., 26, 471–479, https://doi.org/10.1007/s00376-009-0471-8, 2009.
Wen, H.-J., Wang, S.-L., Wu, C.-D., and Liang, M.-C.: Association of Asian dust storms and PM2.5 with clinical visits for respiratory diseases in children, Atmos. Environ., 333, 120631, https://doi.org/10.1016/j.atmosenv.2024.120631, 2024.
Xing, Y., Chen, Y., Yan, S., Cao, X., Zhou, Y., Zhang, X., Shi, T., Niu, X., Wu, D., Cui, J., Zhou, Y., Wang, X., and Pu, W.: Dust storms from the Taklamakan Desert significantly darken snow surface on surrounding mountains, Atmos. Chem. Phys., 24, 5199–5219, https://doi.org/10.5194/acp-24-5199-2024, 2024.
Xiong, Z., Xu, X., Yang, Y., and Luo, T.: Diurnal vertical distribution and transport of dust aerosol over and around Tibetan Plateau from lidar on International Space Station, Atmos. Res., 294, 106939, https://doi.org/10.1016/j.atmosres.2023.106939, 2023.
Xu, C., Guan, Q., Lin, J., Luo, H., Yang, L., Tan, Z., Wang, Q., Wang, N., and Tian, J.: Spatiotemporal variations and driving factors of dust storm events in northern China based on high-temporal-resolution analysis of meteorological data (1960–2007), Environ. Pollut., 260, 114084, https://doi.org/10.1016/j.envpol.2020.114084, 2020.
Yang, X., Shen, S., Yang, F., He, Q., Ali, M., Huo, W., and Liu, X.: Spatial and temporal variations of blowing dust events in the Taklimakan Desert, Theor. Appl. Climatol., 125, 669–677, https://doi.org/10.1007/s00704-015-1537-4, 2016.
Yuan, T., Chen, S., Huang, J., Wu, D., Lu, H., Zhang, G., Ma, X., Chen, Z., Luo, Y., and Ma, X.: Influence of Dynamic and Thermal Forcing on the Meridional Transport of Taklimakan Desert Dust in Spring and Summer, J. Climate, 32, 749–767, https://doi.org/10.1175/JCLI-D-18-0361.1, 2019.
Zhang, L., Zhang, H., Cai, X., Song, Y., Mamtimin, A., and He, Q.: Physical Mechanisms of Deep Convective Boundary Layer Leading to Dust Emission in the Taklimakan Desert, Geophys. Res. Lett., 51, e2024GL108521, https://doi.org/10.1029/2024gl108521, 2024.
Zhang, X., Wang, T., Wang, S., Jiao, Y., Tang, J., Li, J., Yang, F., Amonov, M. O., and Abdullaev, S. F.: Conducive circulation patterns and transport mechanisms for spring dust from Taklimakan Desert to the Tibetan Plateau, Environ. Int., 197, 109356, https://doi.org/10.1016/j.envint.2025.109356, 2025.
Dust storms threaten health, travel and farming, but the conditions that prepare them may change with season. We studied eight 2024 storms in the Taklimakan Desert using two towers, weather records and air-path tracking. Spring storms were mainly prepared by strong regional pressure differences, while summer storms showed stronger early ground heating, followed by rising winds just before they began. Local terrain altered these signals. The results may improve seasonal dust-storm warnings.
Dust storms threaten health, travel and farming, but the conditions that prepare them may change...